Article

The Influence of Stops on the Selected Route of the City ITS on the Energy Efficiency of the Public Bus

by
Miroslaw Smieszek
,
Vasyl Mateichyk
* and
Jakub Mosciszewski
Department of Technical Systems Engineering, Rzeszow University of Technology, al. Powstancow Warszawy 8, 35-959 Rzeszow, Poland
*
Author to whom correspondence should be addressed.
Energies 2024, 17(16), 4179; https://doi.org/10.3390/en17164179
Submission received: 3 June 2024 / Revised: 8 August 2024 / Accepted: 20 August 2024 / Published: 22 August 2024

Abstract

:
Public transport is an important part of sustainable economic development, sustainable cities, and communities. Reducing energy consumption in public transport can be achieved through better organisation of the transport system, changes in infrastructure, the use of new energy-efficient means of transport, and other ways to achieve intelligent mobility. The operation of a city bus involves frequent stops. These stops are due to the need to exchange passengers at bus stops and traffic conditions. Each stop and the subsequent acceleration process require additional energy consumption. In this paper, an analysis of bus operation within the Rzeszów ITS on a selected route is carried out to determine the energy consumption in these special modes. First, the number and duration of stops were determined based on data recorded during the bus operation using the tracker. Then, taking into account the idle fuel consumption and the energy consumption required to reach a set speed, the total energy consumption associated with the stops was determined. The results obtained on the selected route indicate a significant share of energy associated with stops at bus stops and outside bus stops in total fuel consumption. These shares are about 26.2% and about 42.5%, respectively. The opportunity to improve the energy efficiency of the city bus on the route due to the reduction of stops at bus stops by introducing on-demand stops as one of the elements of ITS has been evaluated. The number of stops related to traffic conditions can be reduced by further improving traffic management and measures to modify urban infrastructure.

1. Introduction

The energy consumption of public buses and, in the case of conventional vehicles, their fuel consumption depends on many factors. Research on the impact of these factors has been conducted by researchers from various countries. The literature contains information on the analysis of the impact of traffic conditions taking into account many factors, as well as selected isolated factors. Some of the works [1,2,3,4] take into account various driving profiles reflecting specific traffic conditions. Many studies were conducted in real operating conditions [5,6,7,8,9,10,11,12,13,14,15,16]. A number of works analyse the impact of selected factors on fuel consumption. Many authors dealt with driving technique and drivers’ skills [1,2,3,6,7,8,9,10]. The influence of the number of passengers on fuel consumption [6,13], the influence of the length of sections [17], and the accelerations and decelerations obtained [6,18] were also considered. Several studies also analysed the impact of road inclination on fuel consumption [5,6,19]. One paper dealt with the impact of engine oil viscosity on fuel consumption [20]. In [14], the significant impact of air conditioning, outside temperature, average speed, congestion index, and average acceleration on the energy consumption of an electric bus was demonstrated. In [15], a significant impact of external temperature on the energy consumption of an electric bus was demonstrated. The work [21] showed that the number of bus stops is one of the three most significant factors influencing the energy consumption of an electric bus. However, this work does not indicate the exact increase in energy consumption because it involves creating a predictive model and does not consider the exact impact.
The energy demand in urban traffic characterised by high variability of traffic parameters is much higher than in steady-state traffic [4,11]. The range and dynamics of changes in these parameters are largely dependent on external traffic conditions and the time of day. These changes include maximum speed, average speed, and number and duration of stops. Urban traffic is characterised by repeated phases of accelerated and decelerated motion. During the deceleration motion resulting from braking, the kinetic energy acquired from the propulsion engine is dissipated. In vehicles without a recuperation system, this energy is lost. The work of friction forces in the brakes is converted into heat dissipated into the atmosphere.
The stoppage of the bus and the associated need to dissipate kinetic energy are the results of two factors. The first is traffic conditions. In this case, the factor forcing the bus to stop can be traffic lights, pedestrian crossings and exits from a subordinated road. The second factor results from the need to stop at a bus stop. The number of stops at bus stops can be regulated to some extent by public transport authorities. Reducing the overall number of stops and thus increasing traffic flow should contribute to reducing energy demand.
There are several systems for organising public transport in Europe. These systems may require stopping at all bus stops or only when requested by passengers on the bus or at a bus stop. There is also an intermediate system, where only part of the bus stops are on-demand. These bus stops are most often characterised by low passenger exchange.
The aim of this paper is to determine the energy loss associated with the stopping process at bus stops and outside bus stops. The second group is associated with stops forced by external traffic conditions. The subject of impact of stops on fuel consumption is not widely researched and this paper aims to increase the knowledge of this subject.
The article consists of the following parts:
  • The first part provides an introduction;
  • The second part presents the energy balance of the bus;
  • In the third part, the examined case is described and a statistical analysis of the vehicle’s motion profile is made;
  • The fourth part presents the simulation of energy consumption;
  • The fifth part summarizes the paper.

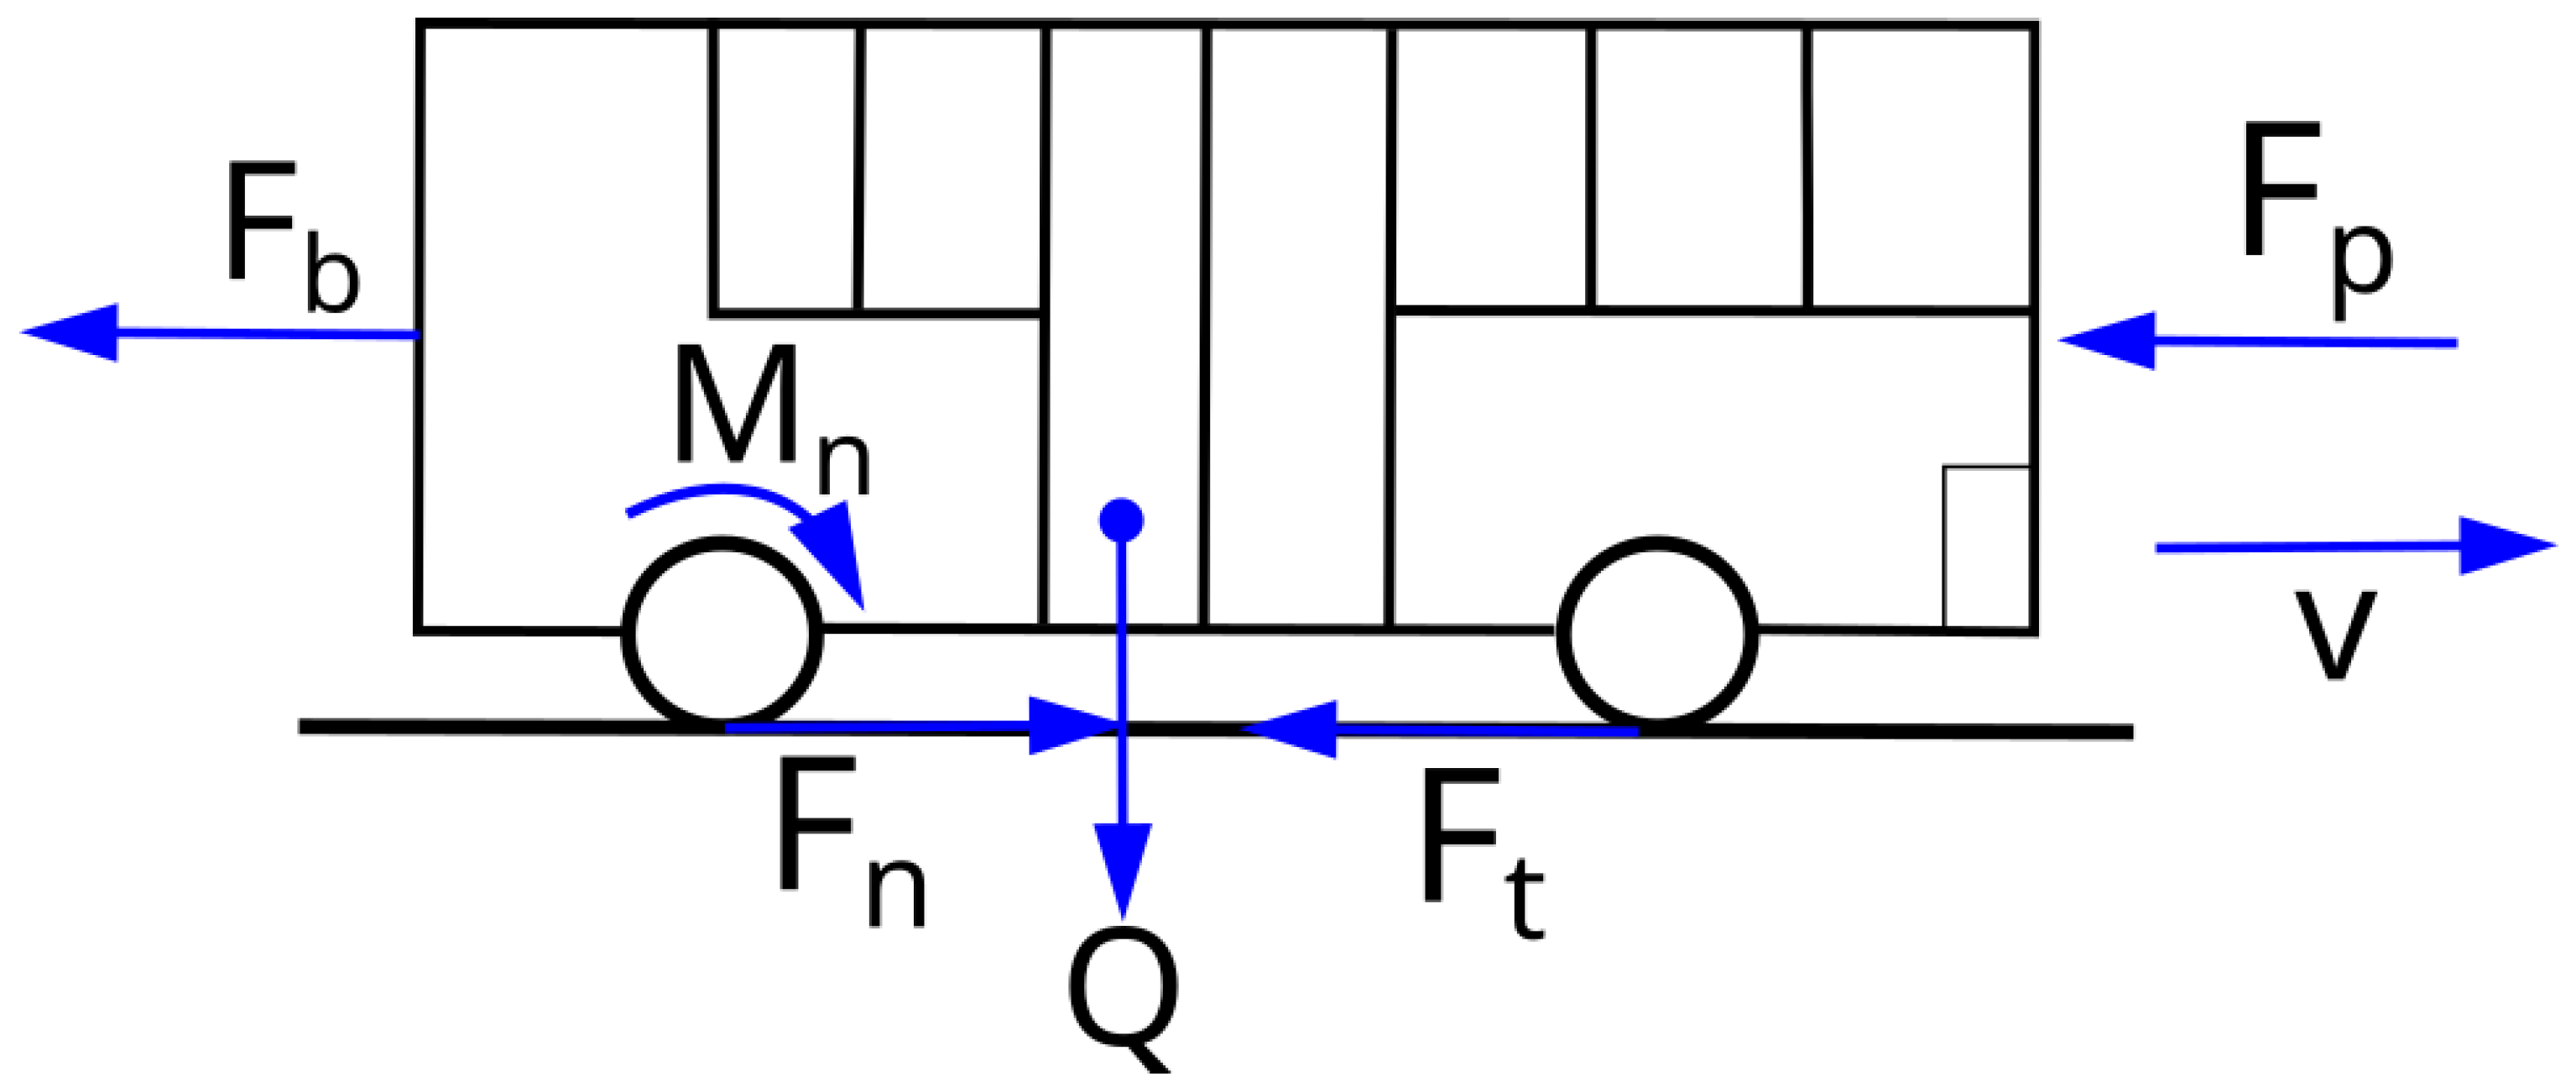
2. Energy Balance of the Bus

A system of forces shown in Figure 1 [22,23] acts on a moving vehicle. In the figure presented, the road is assumed to be horizontal, hence the absence of the resistance force of the hill Fw.
Due to the speeds reached by the bus (below 80 km/h), the rolling resistance force Ft is assumed to be a constant value and not dependent on speed v. The other forces acting on the vehicle, apart from the gravity force Q, depend on the traffic conditions, which include speed and acceleration.
Figure 2 shows a fragment of a simplified driving cycle of the city bus. The acceleration, steady-state movement, and braking phases, as well as the stop time, can be distinguished in Figure 2.
According to the principle of dynamics, the sum of all forces acting on the vehicle equals 0. For forces acting horizontally, it can be represented by the following relation:
F n F t F p F b F w = 0
In the further considerations presented in the article, it is assumed that the road inclination angle α = 0. This assumption results from the fact that the vast majority of the bus stops of the analysed line are located on flat terrain, characterised by an altitude of 200 to 205 metres above sea level. Then, Fw = 0 and Equation (1) takes the form
F n F t F p F b = 0
The individual parts of the equation can be described by the following relationships:
F t = m f t g
F p = ρ A c x v 2 2
where
  • cx—air resistance coefficient;
  • A—vehicle frontal area, [m2];
  • ρ—air density, [kg/m3];
  • v—vehicle speed, [m/s];
  • ft—rolling resistance coefficient;
  • m—vehicle weight, [kg];
  • g—acceleration due to gravity, [m/s2].
During acceleration, the driving force overcomes the movement resistances Ft and Fp and the inertia force Fb. At the final stage of the acceleration process, the vehicle has the kinetic energy described by the following relation:
E k = m v 2 2
During the steady-state motion phase, the kinetic energy of the vehicle does not change. The energy supplied by the engine covers the energy losses due to the drag and rolling forces described by the relationships:
W p = F p s u = ρ A c x v u 2 s u 2
W t = F t s u = m g f t s u
where
  • su—length of a road section of a steady-state motion, [m];
  • cx—air resistance coefficient;
  • A—vehicle frontal area, [m2];
  • ρ—air density, [kg/m3];
  • vu—speed of steady-state motion, [m/s];
  • ft—rolling resistance coefficient;
  • m—vehicle weight, [kg];
  • g—acceleration due to gravity, [m/s2].
In the case of braking, the kinetic energy of the vehicle Ek is converted into the work of braking forces Wb, the work of rolling resistance forces Wt, and the work of air resistance forces Wp. This is described by the following dependencies:
E k = W b + W t + W p
W t = F t s b = m g f t s b
s b = v b t b a b t b 2 2
where
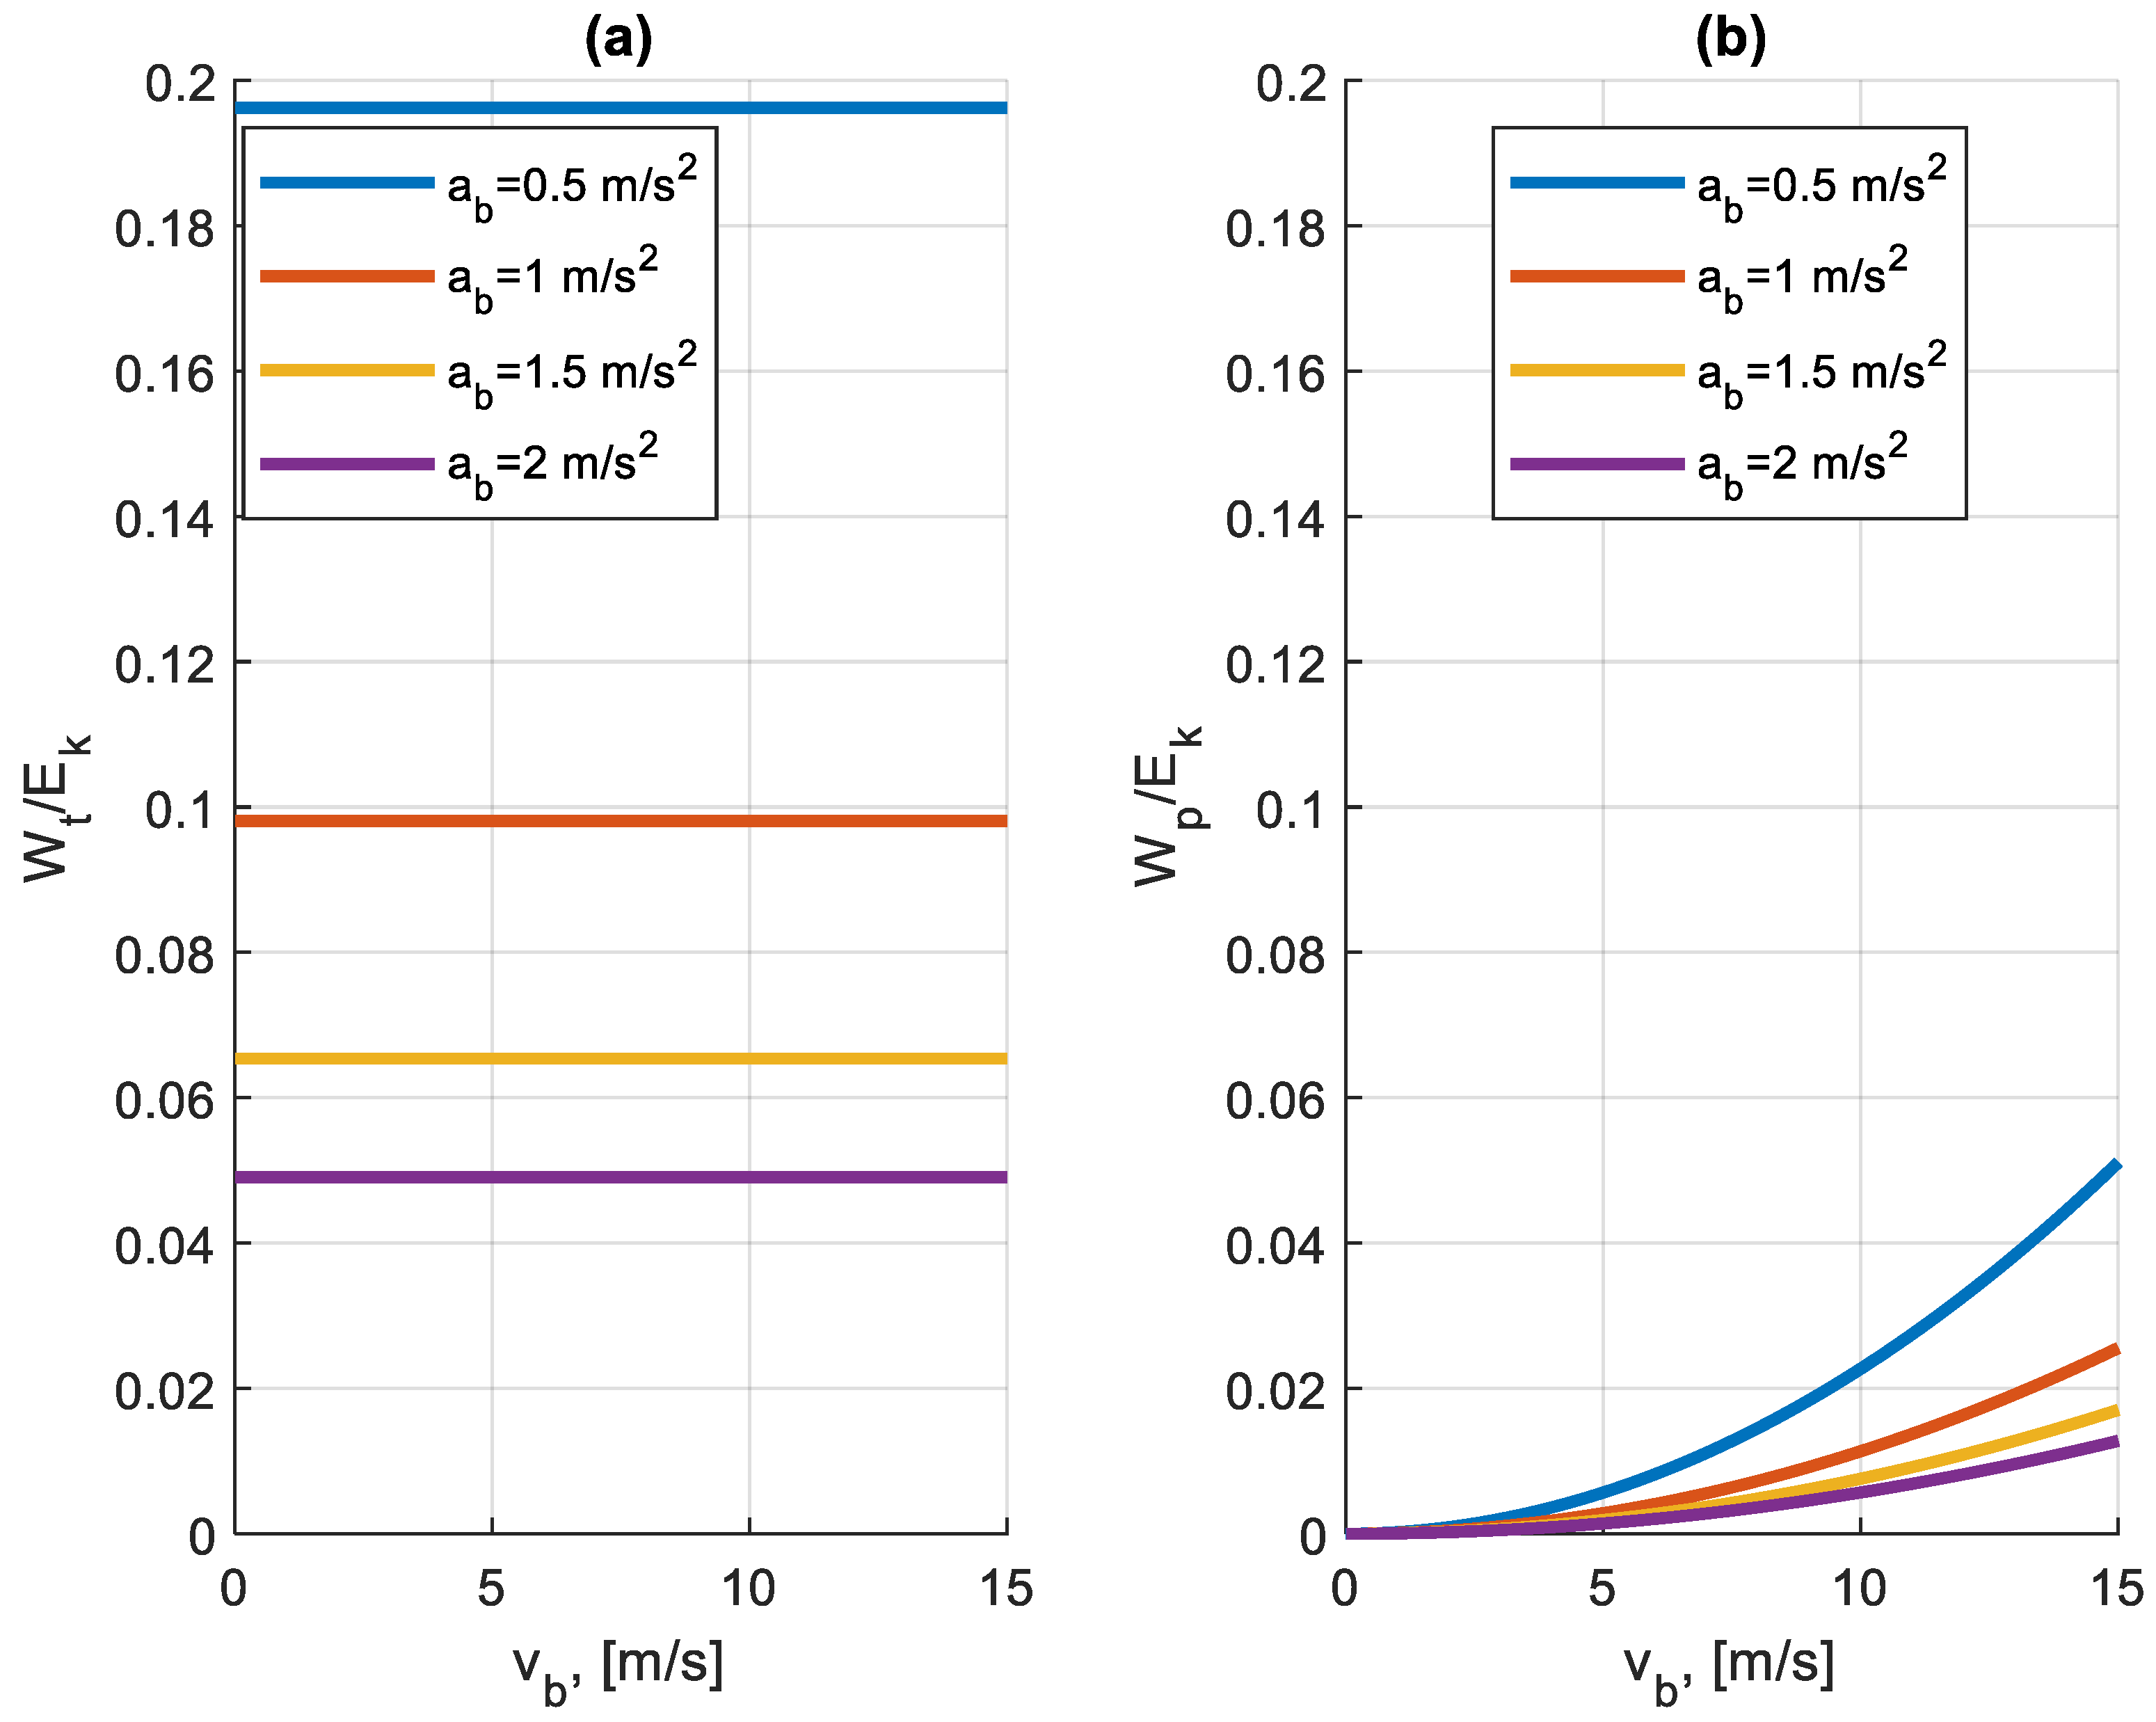
  • sb—length of braking distance, [m];
  • ab—deceleration, [m/s2];
  • tb—braking time, [s];
  • vb—the speed at which braking is initiated, [m/s].
The force of air resistance depends on the speed, which during the braking process changes from vu to 0 on the distance sb. The energy lost as a result of air resistance is presented as
W p = 0 s b F p d s = 0 s b ρ A c x v s 2 2 d s
According to Equation (8), the energy lost as a result of the braking forces is equal to the kinetic energy of the vehicle at the start of the braking process minus the works Wt and Wp. The ratio of the work of rolling resistance forces to the total kinetic energy according to Equation (12) is a value independent of the vehicle speed at the start of the braking. This ratio is influenced only by the rolling resistance coefficient and the deceleration during braking.
W t E k = g f t a
The ratio of the work of air resistance forces to the total kinetic energy is largely dependent on the vehicle’s speed at the start of braking.
Figure 3 shows the ratio of these two components to the total kinetic energy at the start of the braking.
It can be seen that for the same values of braking deceleration, the work of the rolling resistance forces is many times greater than that of the air resistance forces. In both cases, the magnitude of these forces is strongly influenced by braking deceleration. As the value of deceleration increases, the braking distance shortens and the ratio of these two quantities to the kinetic energy decreases.

3. Case Description and Analysis of Parameters Related to Vehicle Movement

3.1. Intelligent Transport System in Rzeszów

There is an Intelligent Transport System in the city of Rzeszów. This system includes the following subsystems: Area Traffic Control System, Public Transport Management System, Passenger Information System, Electronic Toll Collection System, Dynamic Vehicle Weighing System, and ICT Platform integrating the previously mentioned subsystems. The Area Traffic Control System consists of a traffic light control system that ensures smooth traffic flow and minimises waiting times at intersections, a right-of-way system for public transport that assigns priority to public transport and emergency vehicles, and a driver information system that uses variable message signs to provide quick information on traffic impediments, changes in traffic organisation and recommended detours. The basis of the signalling system are induction loops embedded in the asphalt and a camera system, which allows the signalling system to adjust the traffic intensity. In addition, at intersections with traffic lights, there is also automatic detection of pedestrian and bicycle traffic, thanks to which there is no need to press a button to change the lights. Assigning priority to public transport and emergency vehicles involves transmitting information from the vehicle to the traffic light controller, checking whether it is possible to pass without having to stop. Depending on the situation, there may be an extension of the phase of the traffic lights allowing passage, or a shortening of the phases preceding the next phase of the lights allowing passage. The Public Transport Management System enables identification of the location of vehicles, counting the number of passengers and controlling the quality standards of passenger service. This allows the current needs of public transport in the city to be responded to. Thanks to this system, passengers are informed in real time about bus delays. The Passenger Information System aims to provide efficient information to public transport passengers. It includes information boards at bus stops and a web-based system that provides more information than the information boards. The Electronic Fare Collection System is an electronic public transport ticketing system. Under this system, it is possible to buy time-based or single-trip tickets, the price of which depends on the number of bus stops travelled. The Dynamic Vehicle Weighing System is designed to detect overloaded vehicles and to record information about detected overloads. This system consists of sensors embedded in the asphalt that monitor axle loads and a central system that collects data [24,25,26].

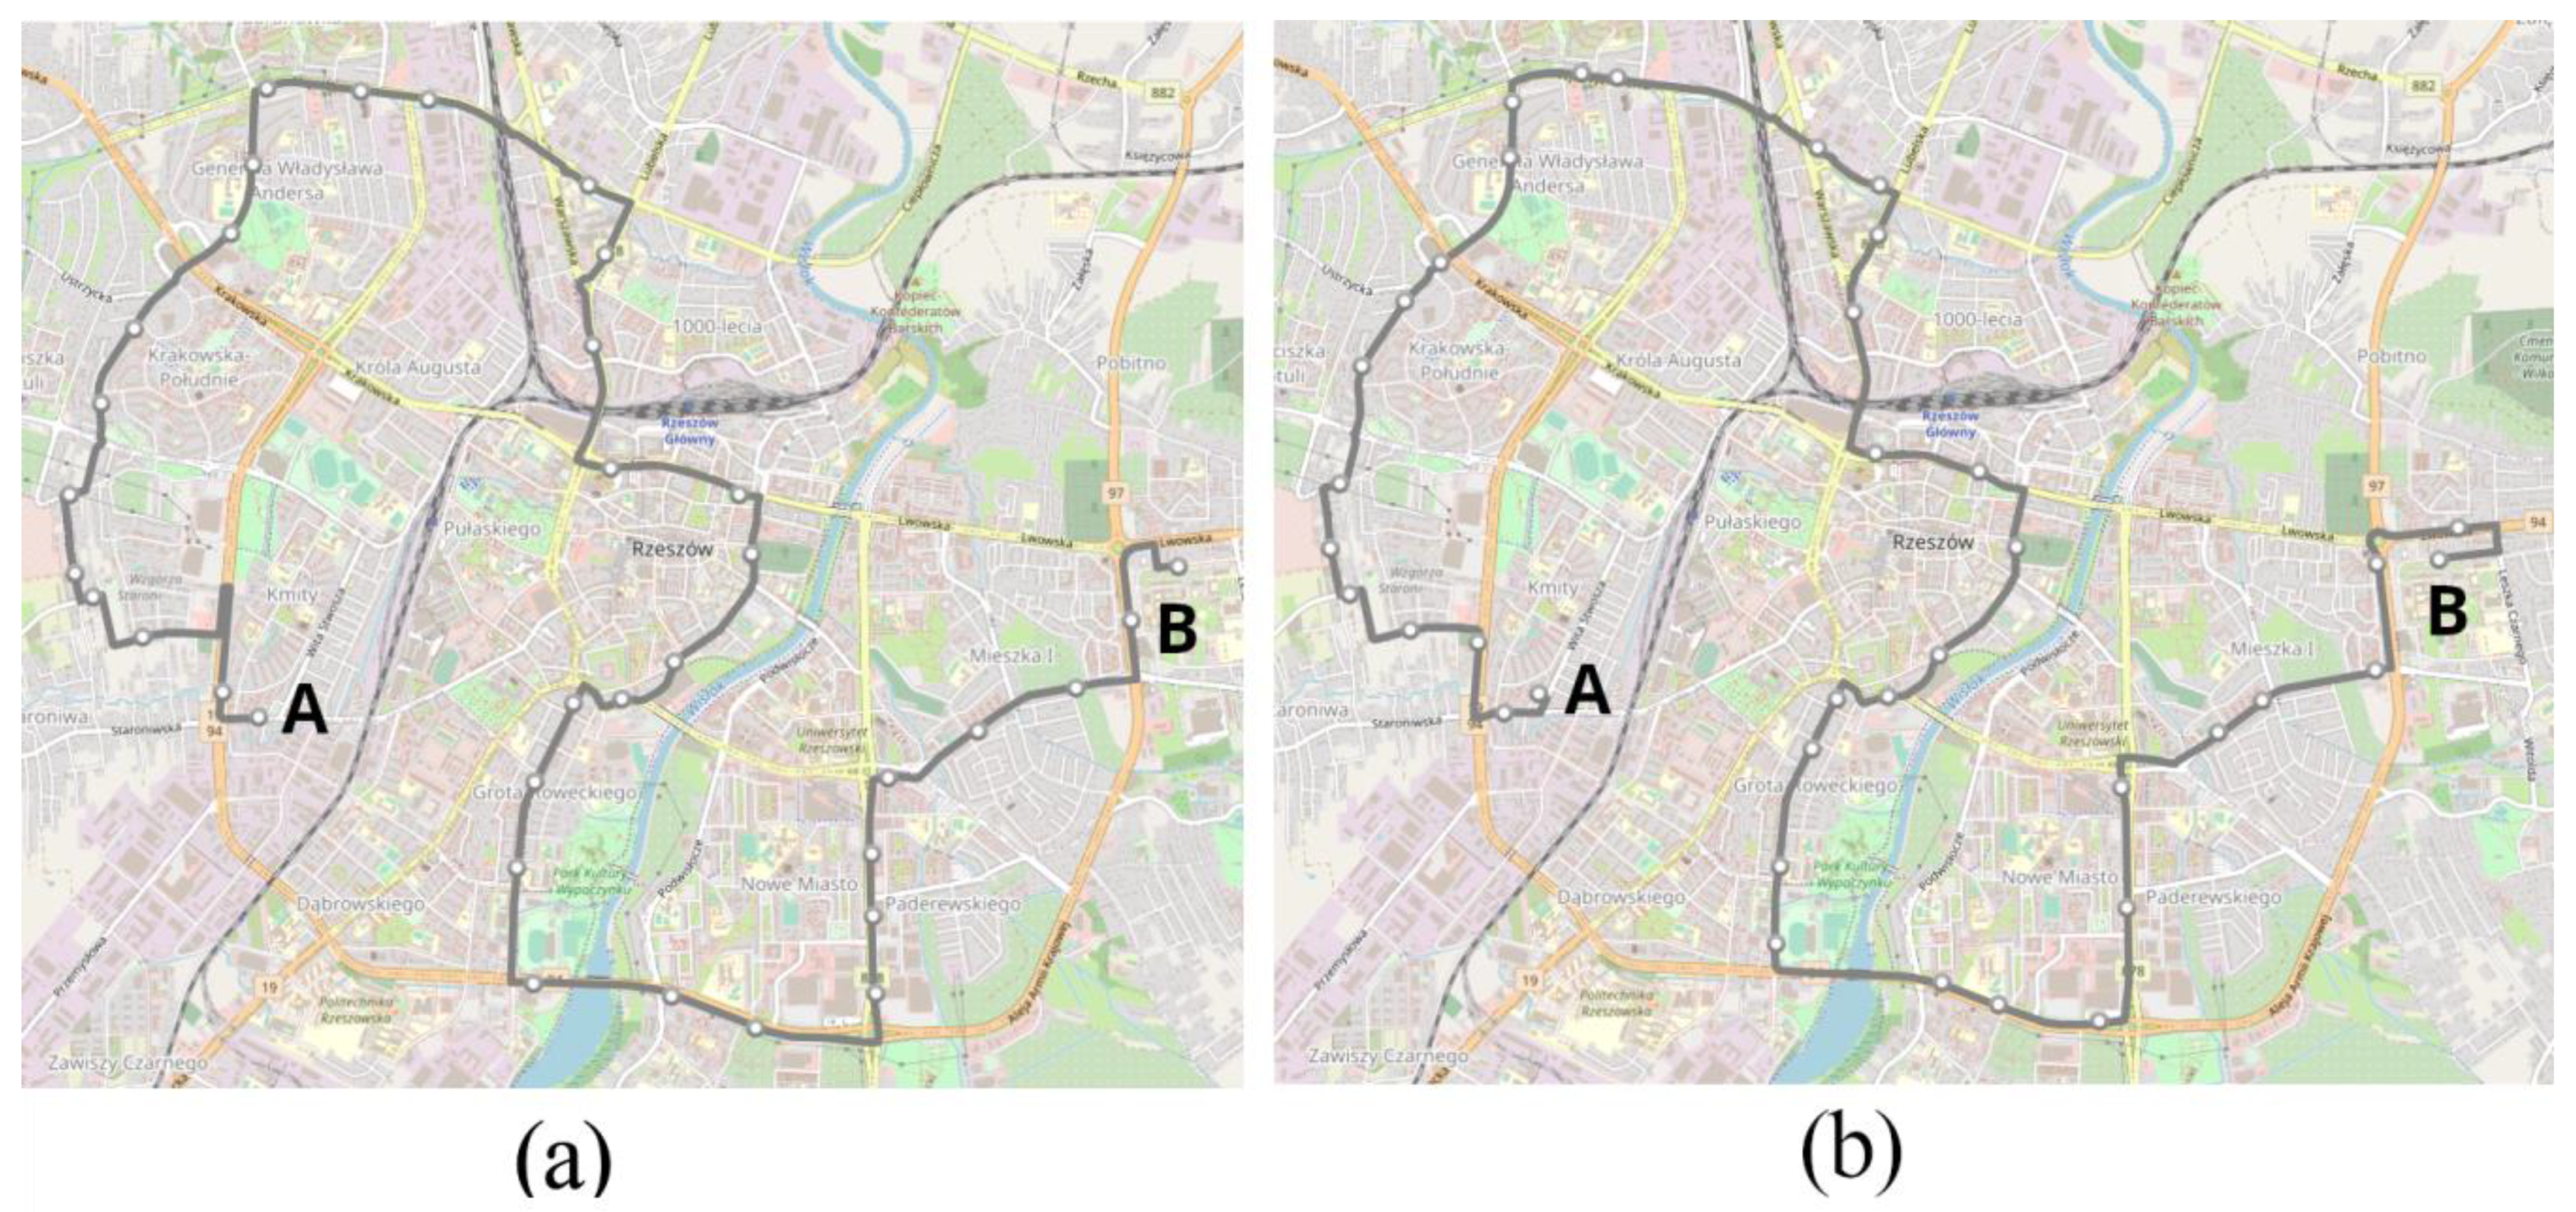
3.2. Characteristics of the Considered Route

The analysis and research carried out in this article concerns a selected public transport route in Rzeszów. It is one of the main public transport routes that practically runs through the entire city. All subsystems of the city ITS are actively involved in this route. The recorded data are from the days 16 to 18 March 2022, 21 to 25 March 2022, 29 March 2022, and 4 April 2022, and these are working days. Data are from one diesel-powered bus, a Mercedes-Benz O530 operating on city route number 13. A diagram of the route number 13 is shown in Figure 4.
Due to the road layout with separated traffic directions streets, both routes are not the same. There are 35 bus stops on the route in the A to B direction and 38 bus stops in the B to A direction. In the A to B direction, the route is 16.376 km long and in the B to A direction 16.805 km long. Depending on the time of day and the direction of traffic, the total number of stops on a given course varies. The highest number of stops occurs during the morning and afternoon rush hours. This is shown in Figure 5.
The data used in the study come from a GPS data recorder installed in the vehicle, which records data at a frequency of 1 Hz. A description of the system and its characteristics is presented in papers [27,28,29].
Fuel consumption data were provided by MPK Rzeszów (Municipal Transport Company, Rzeszów, Poland). The bus was refuelled at the end of each day after work and the amount of fuel refuelled was recorded.

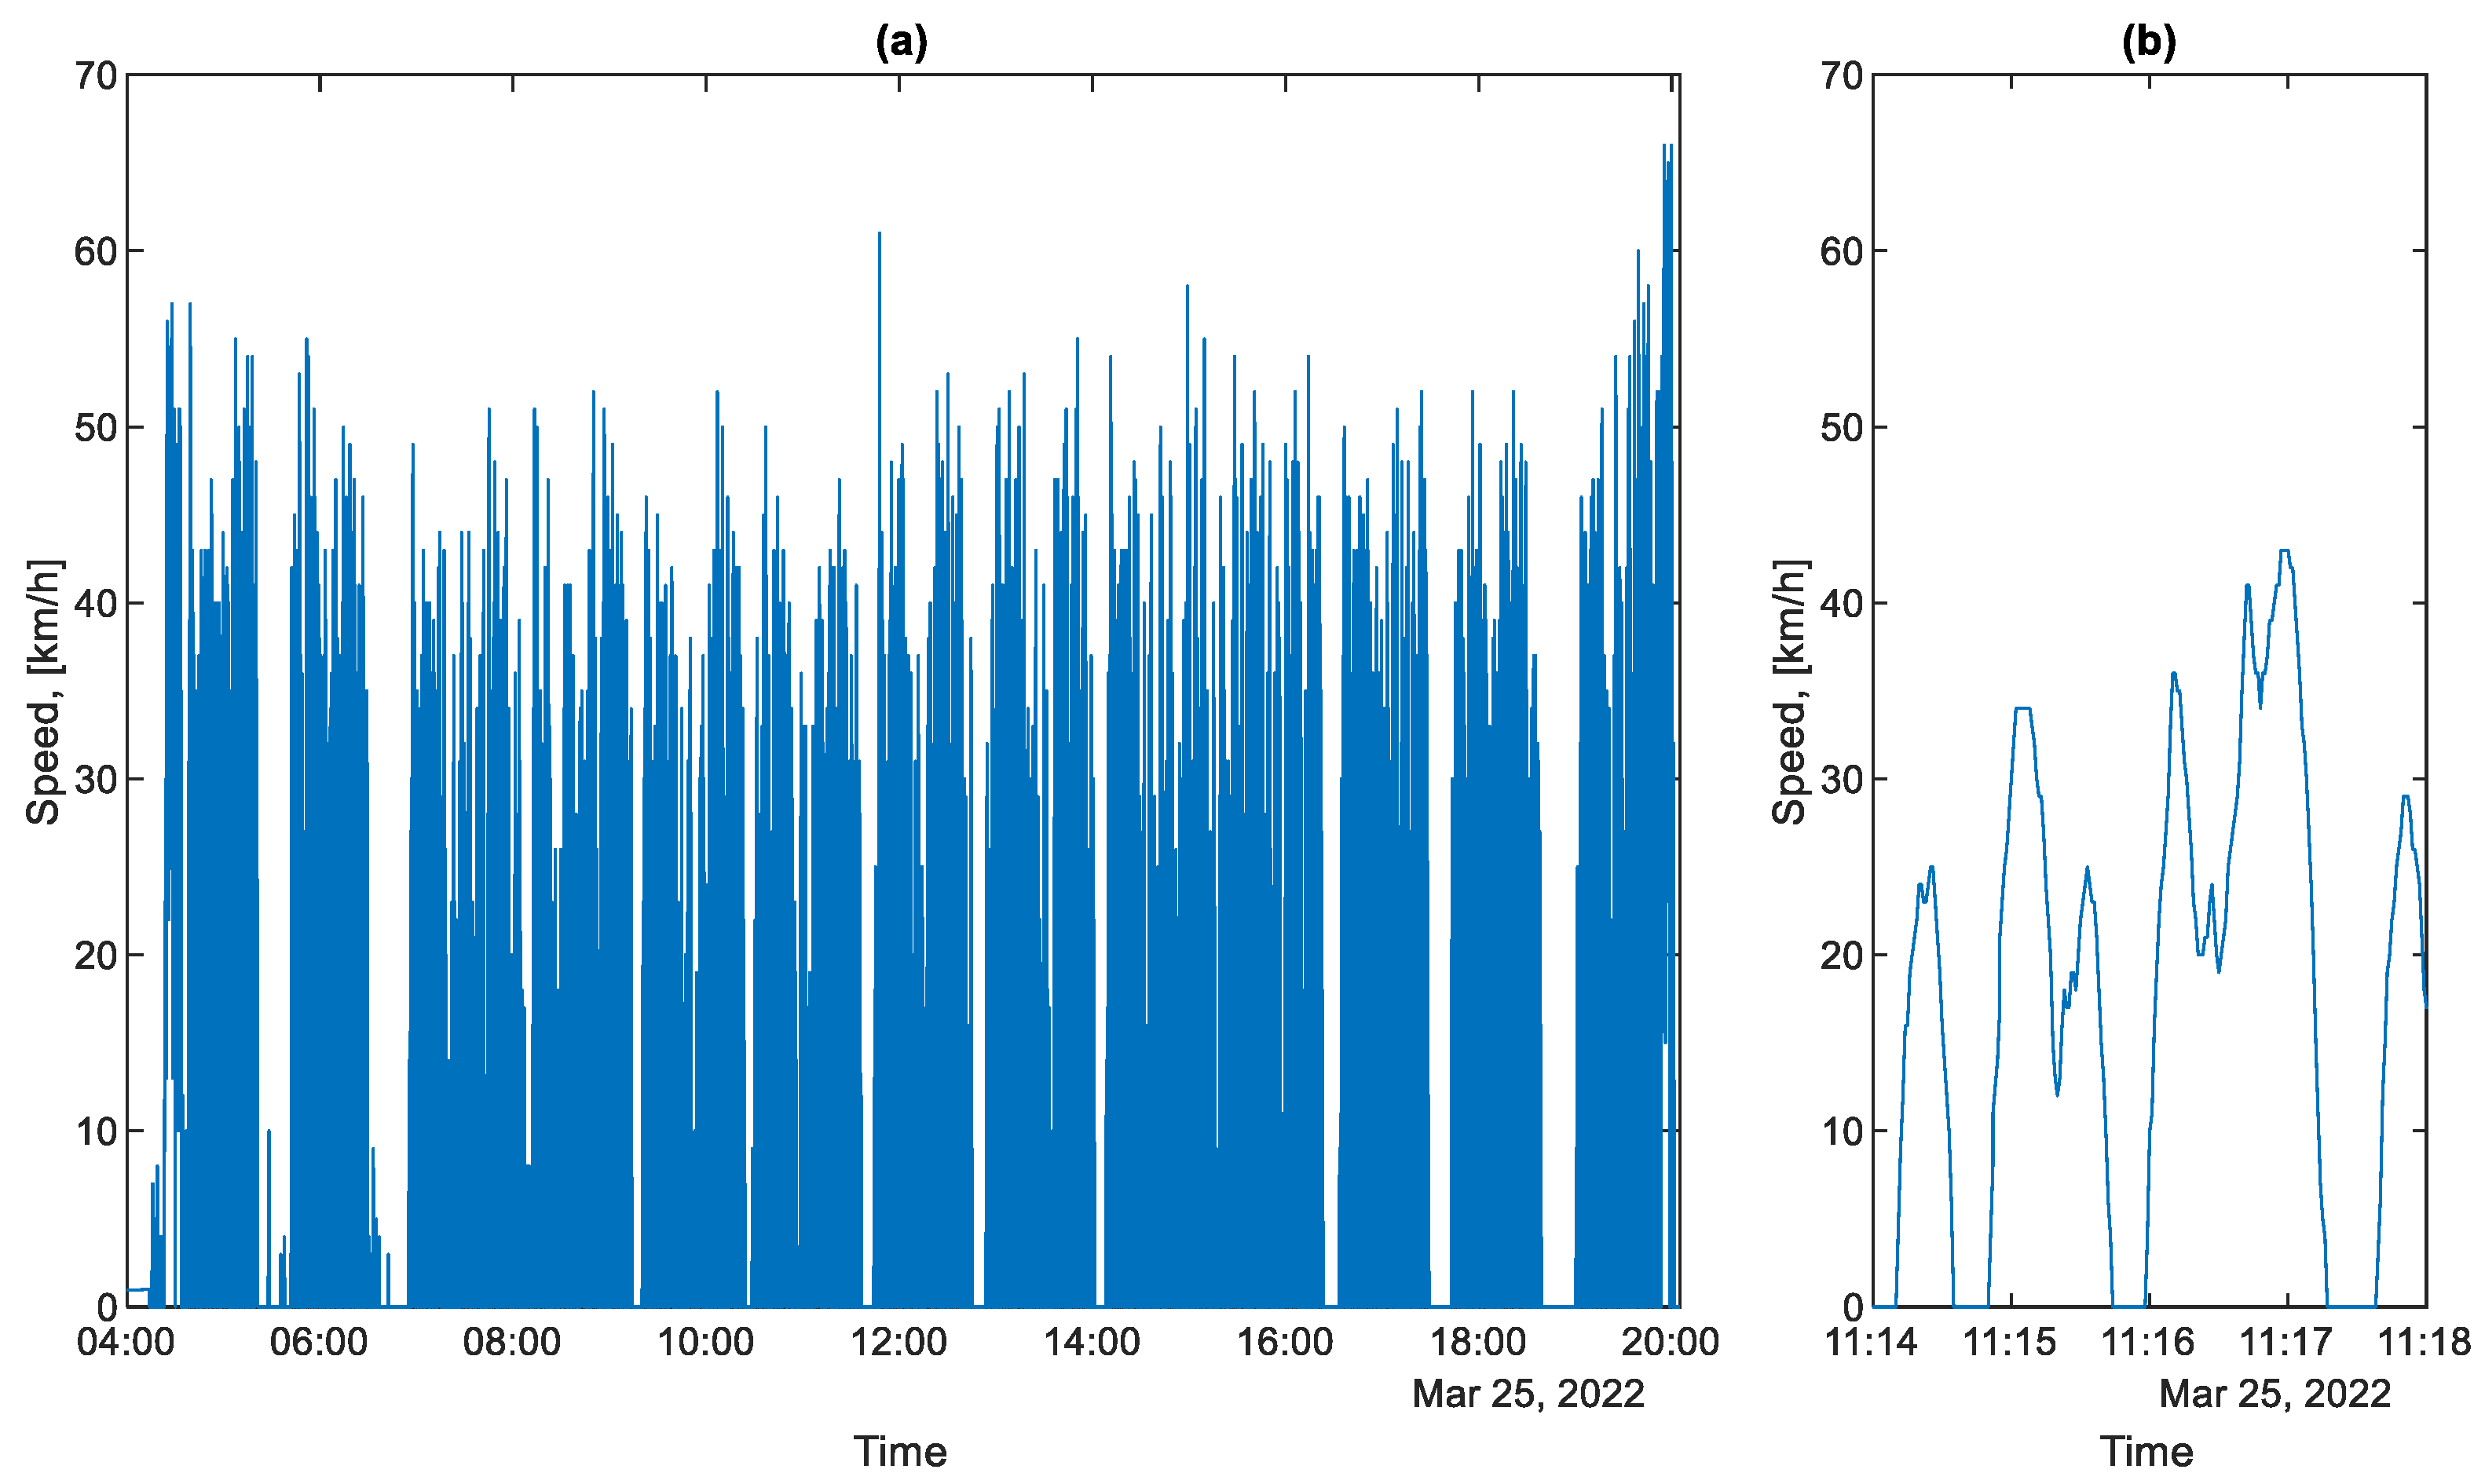
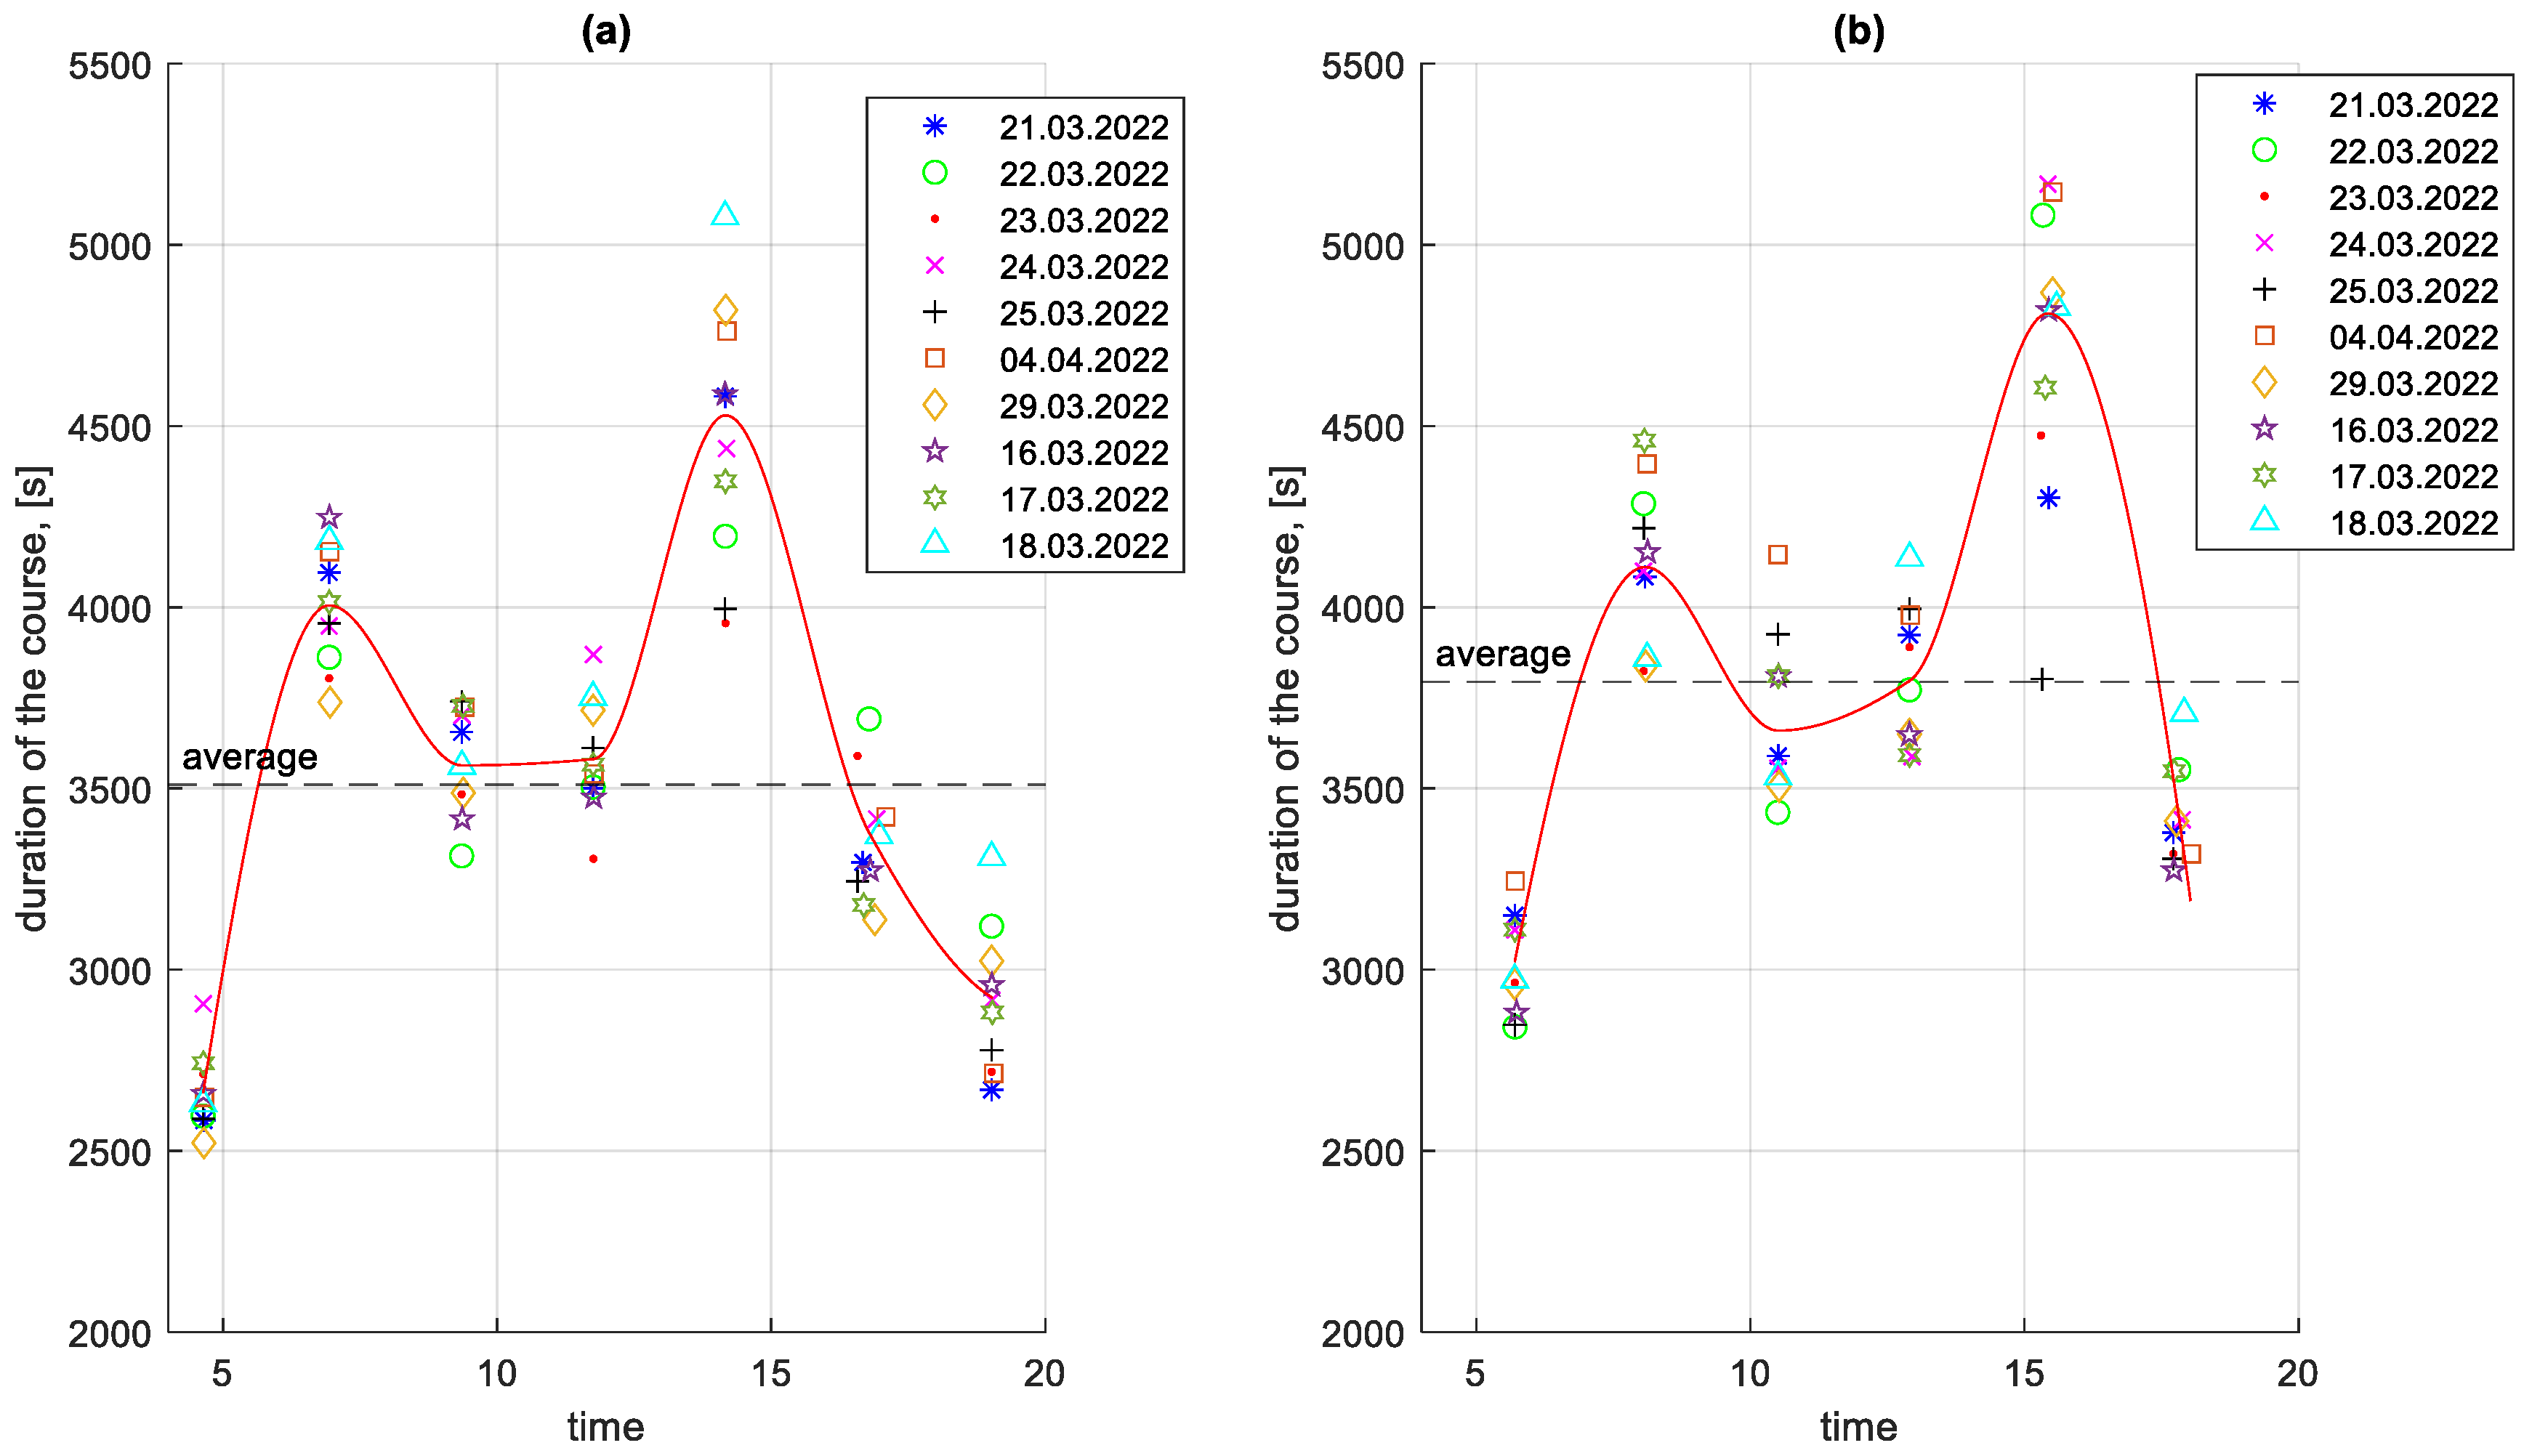
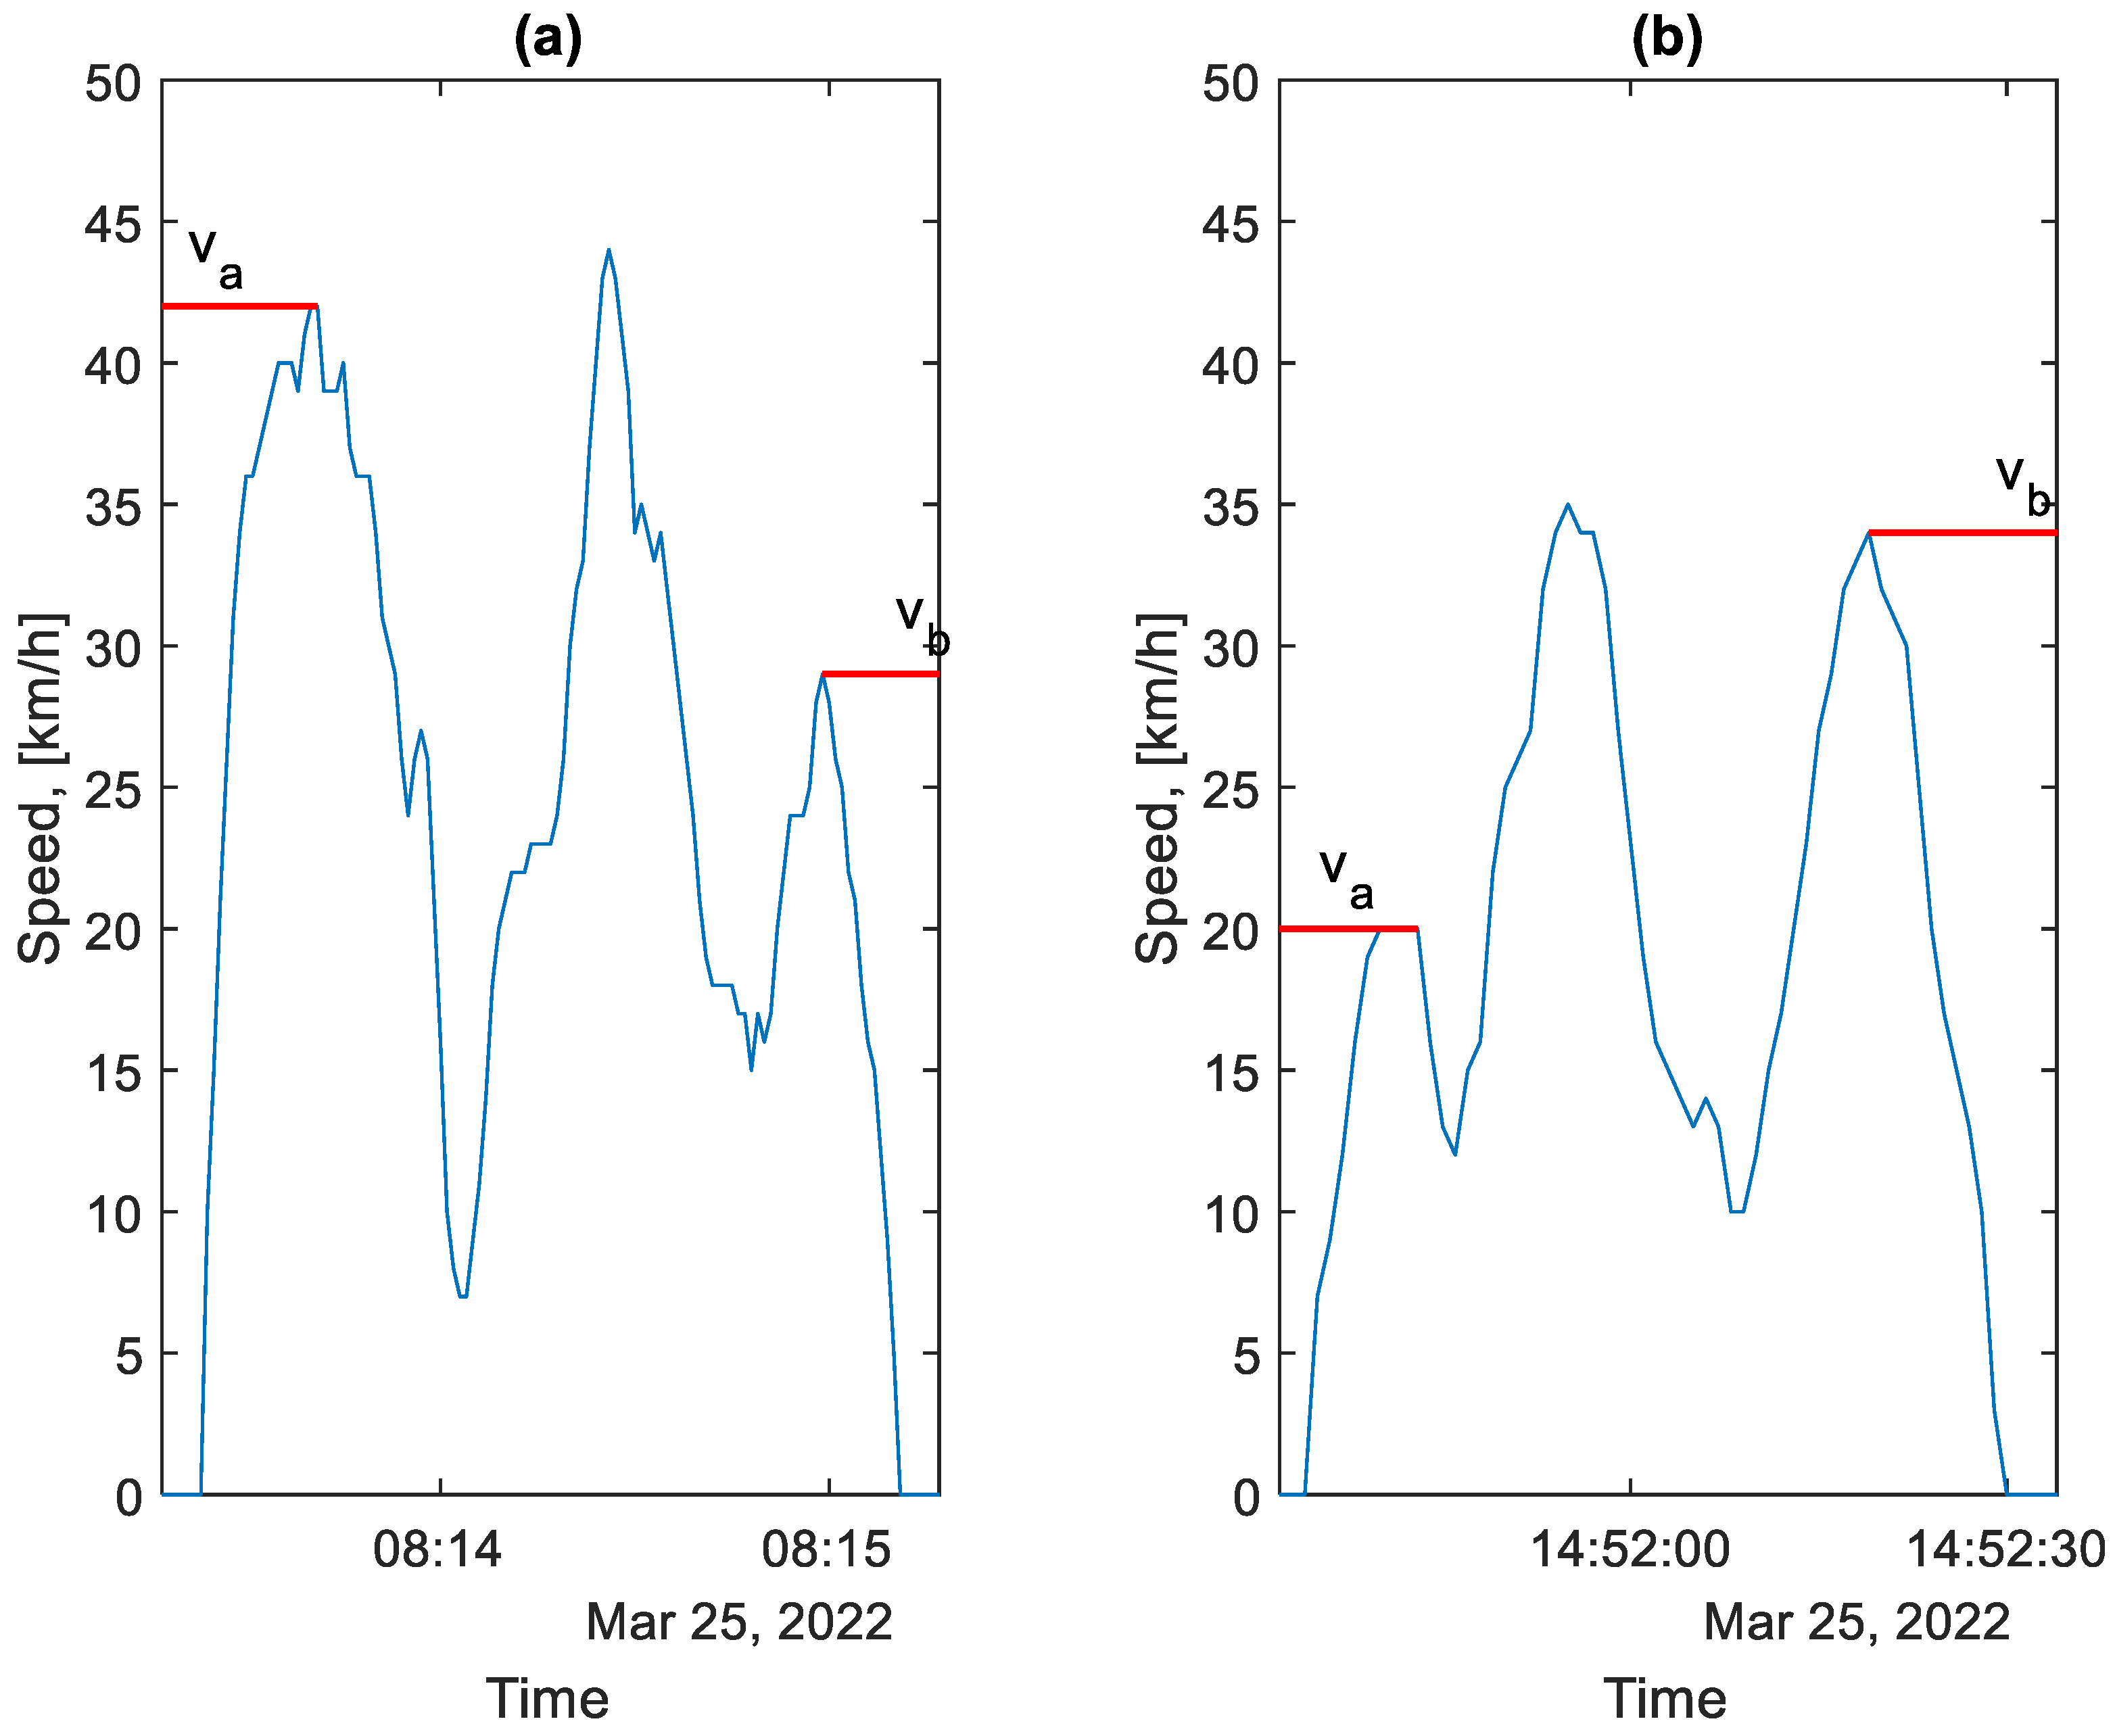
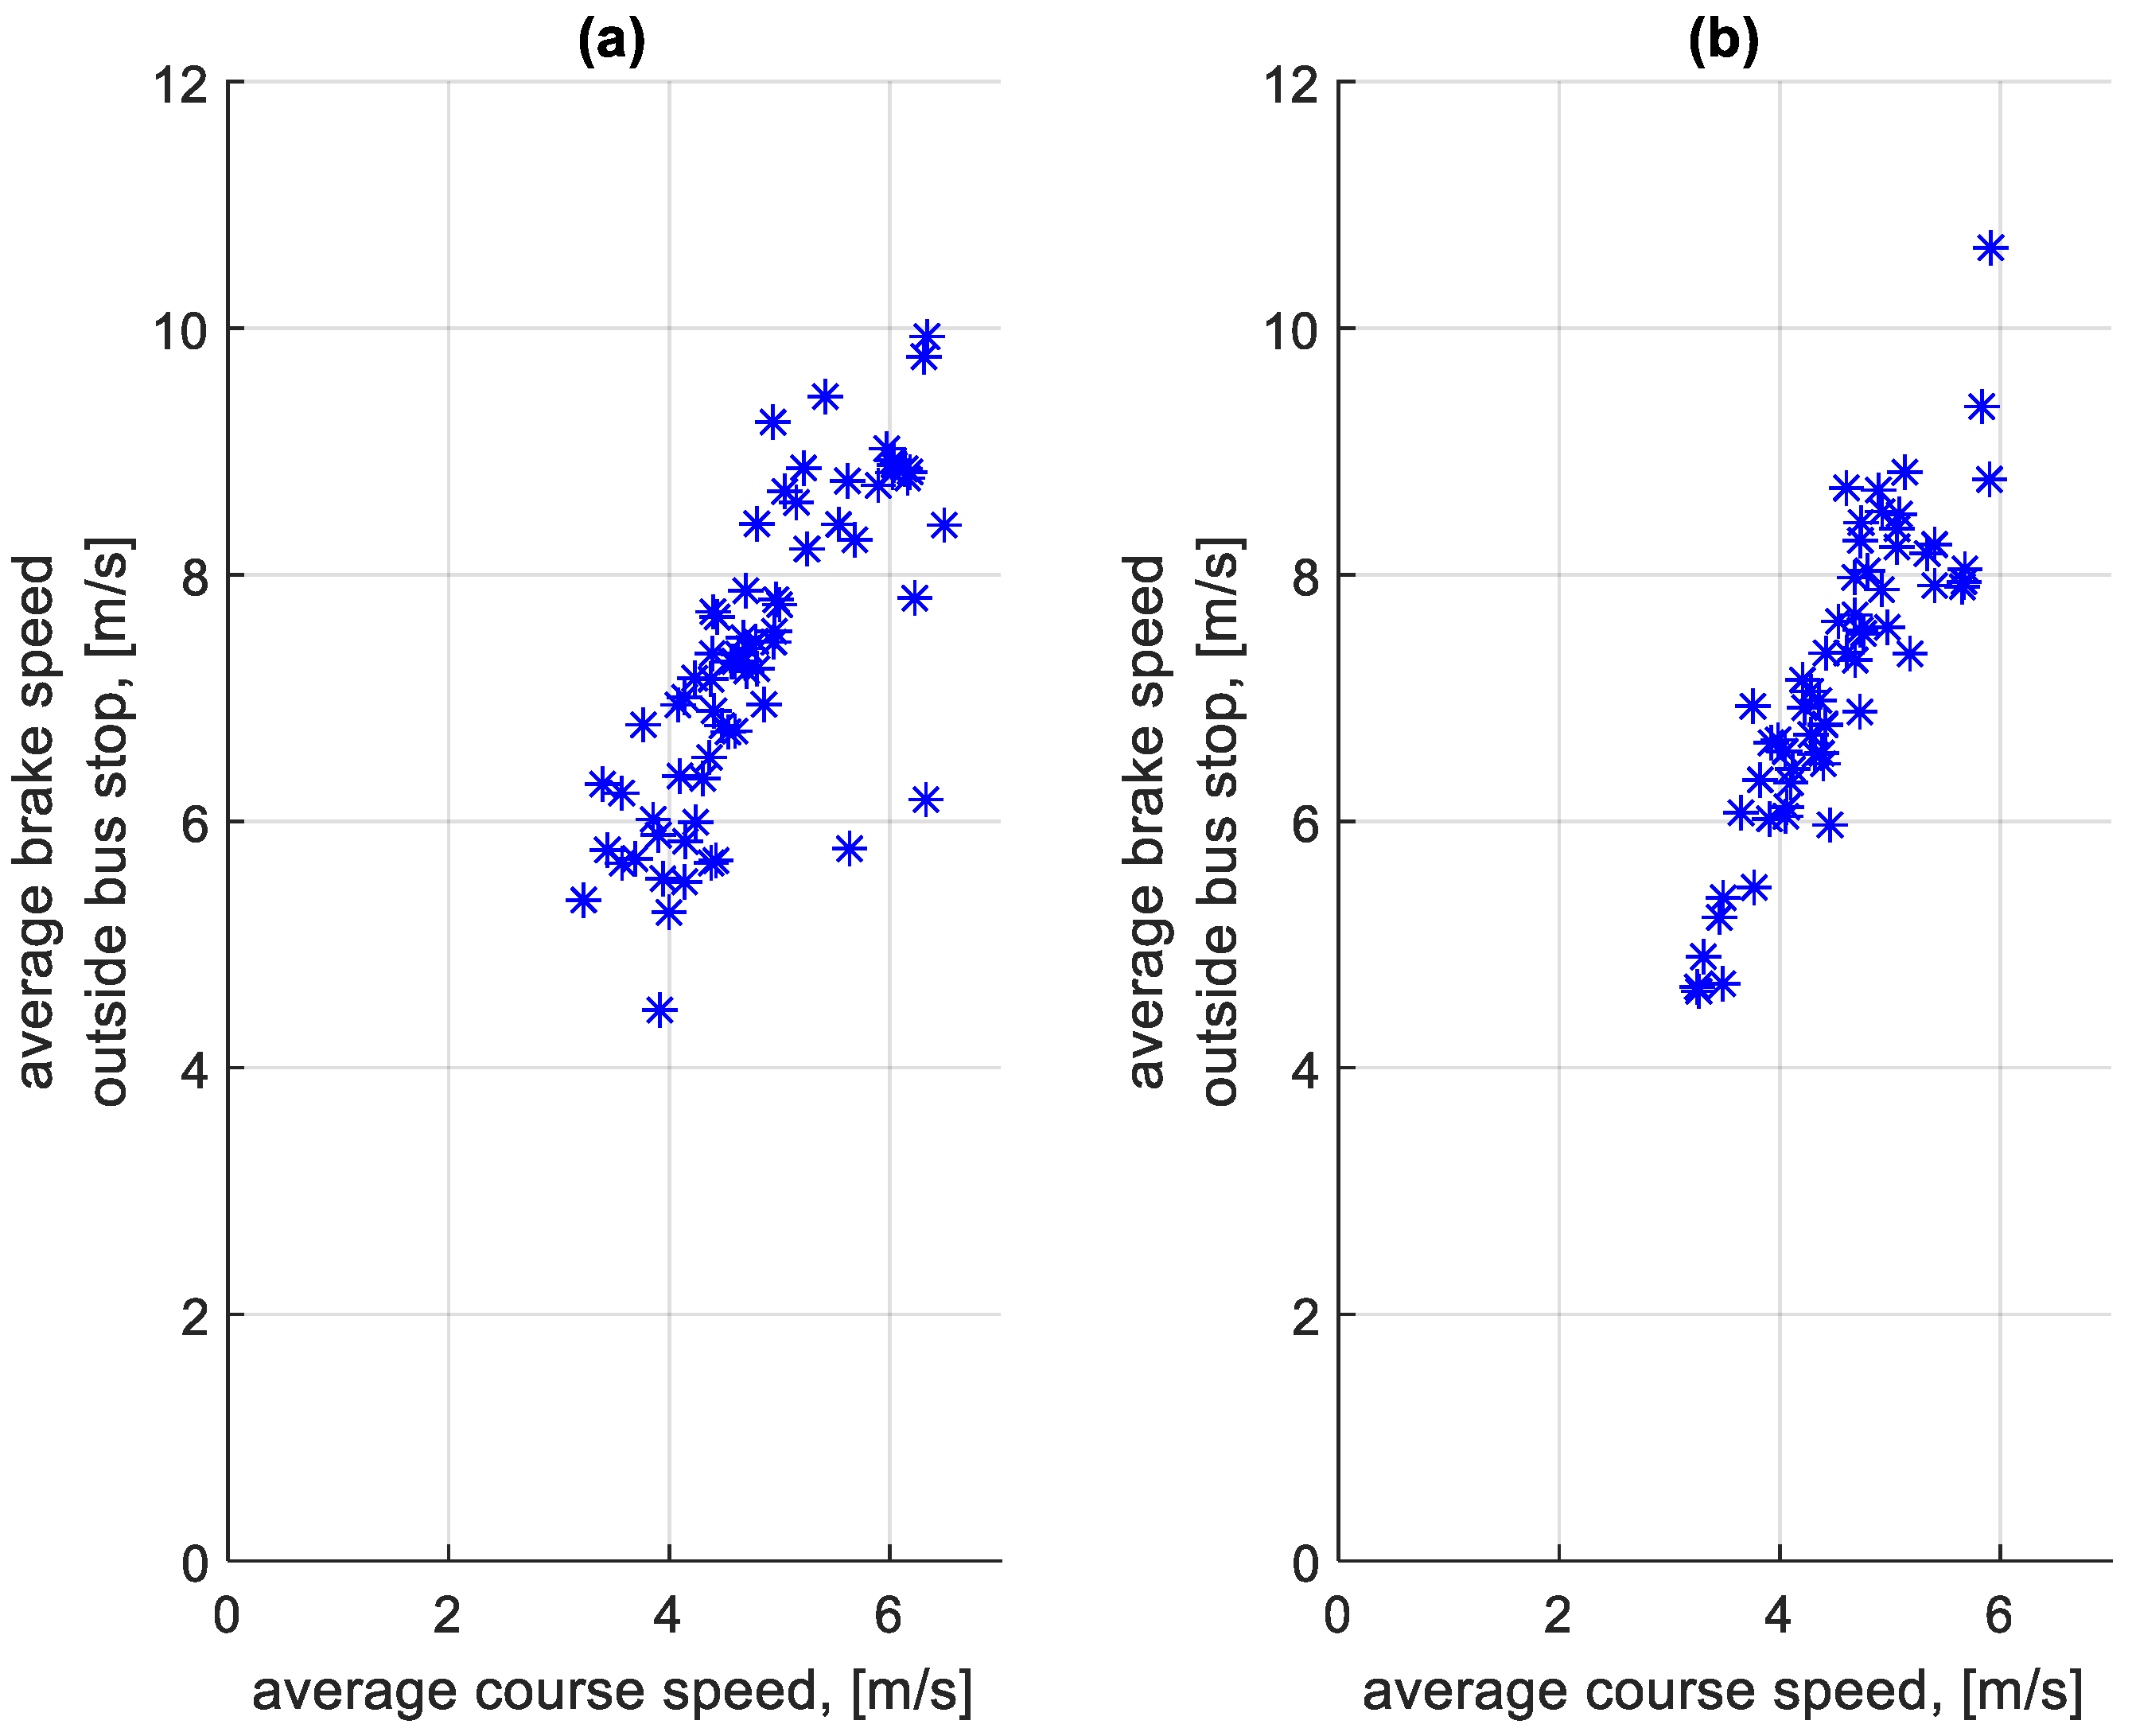
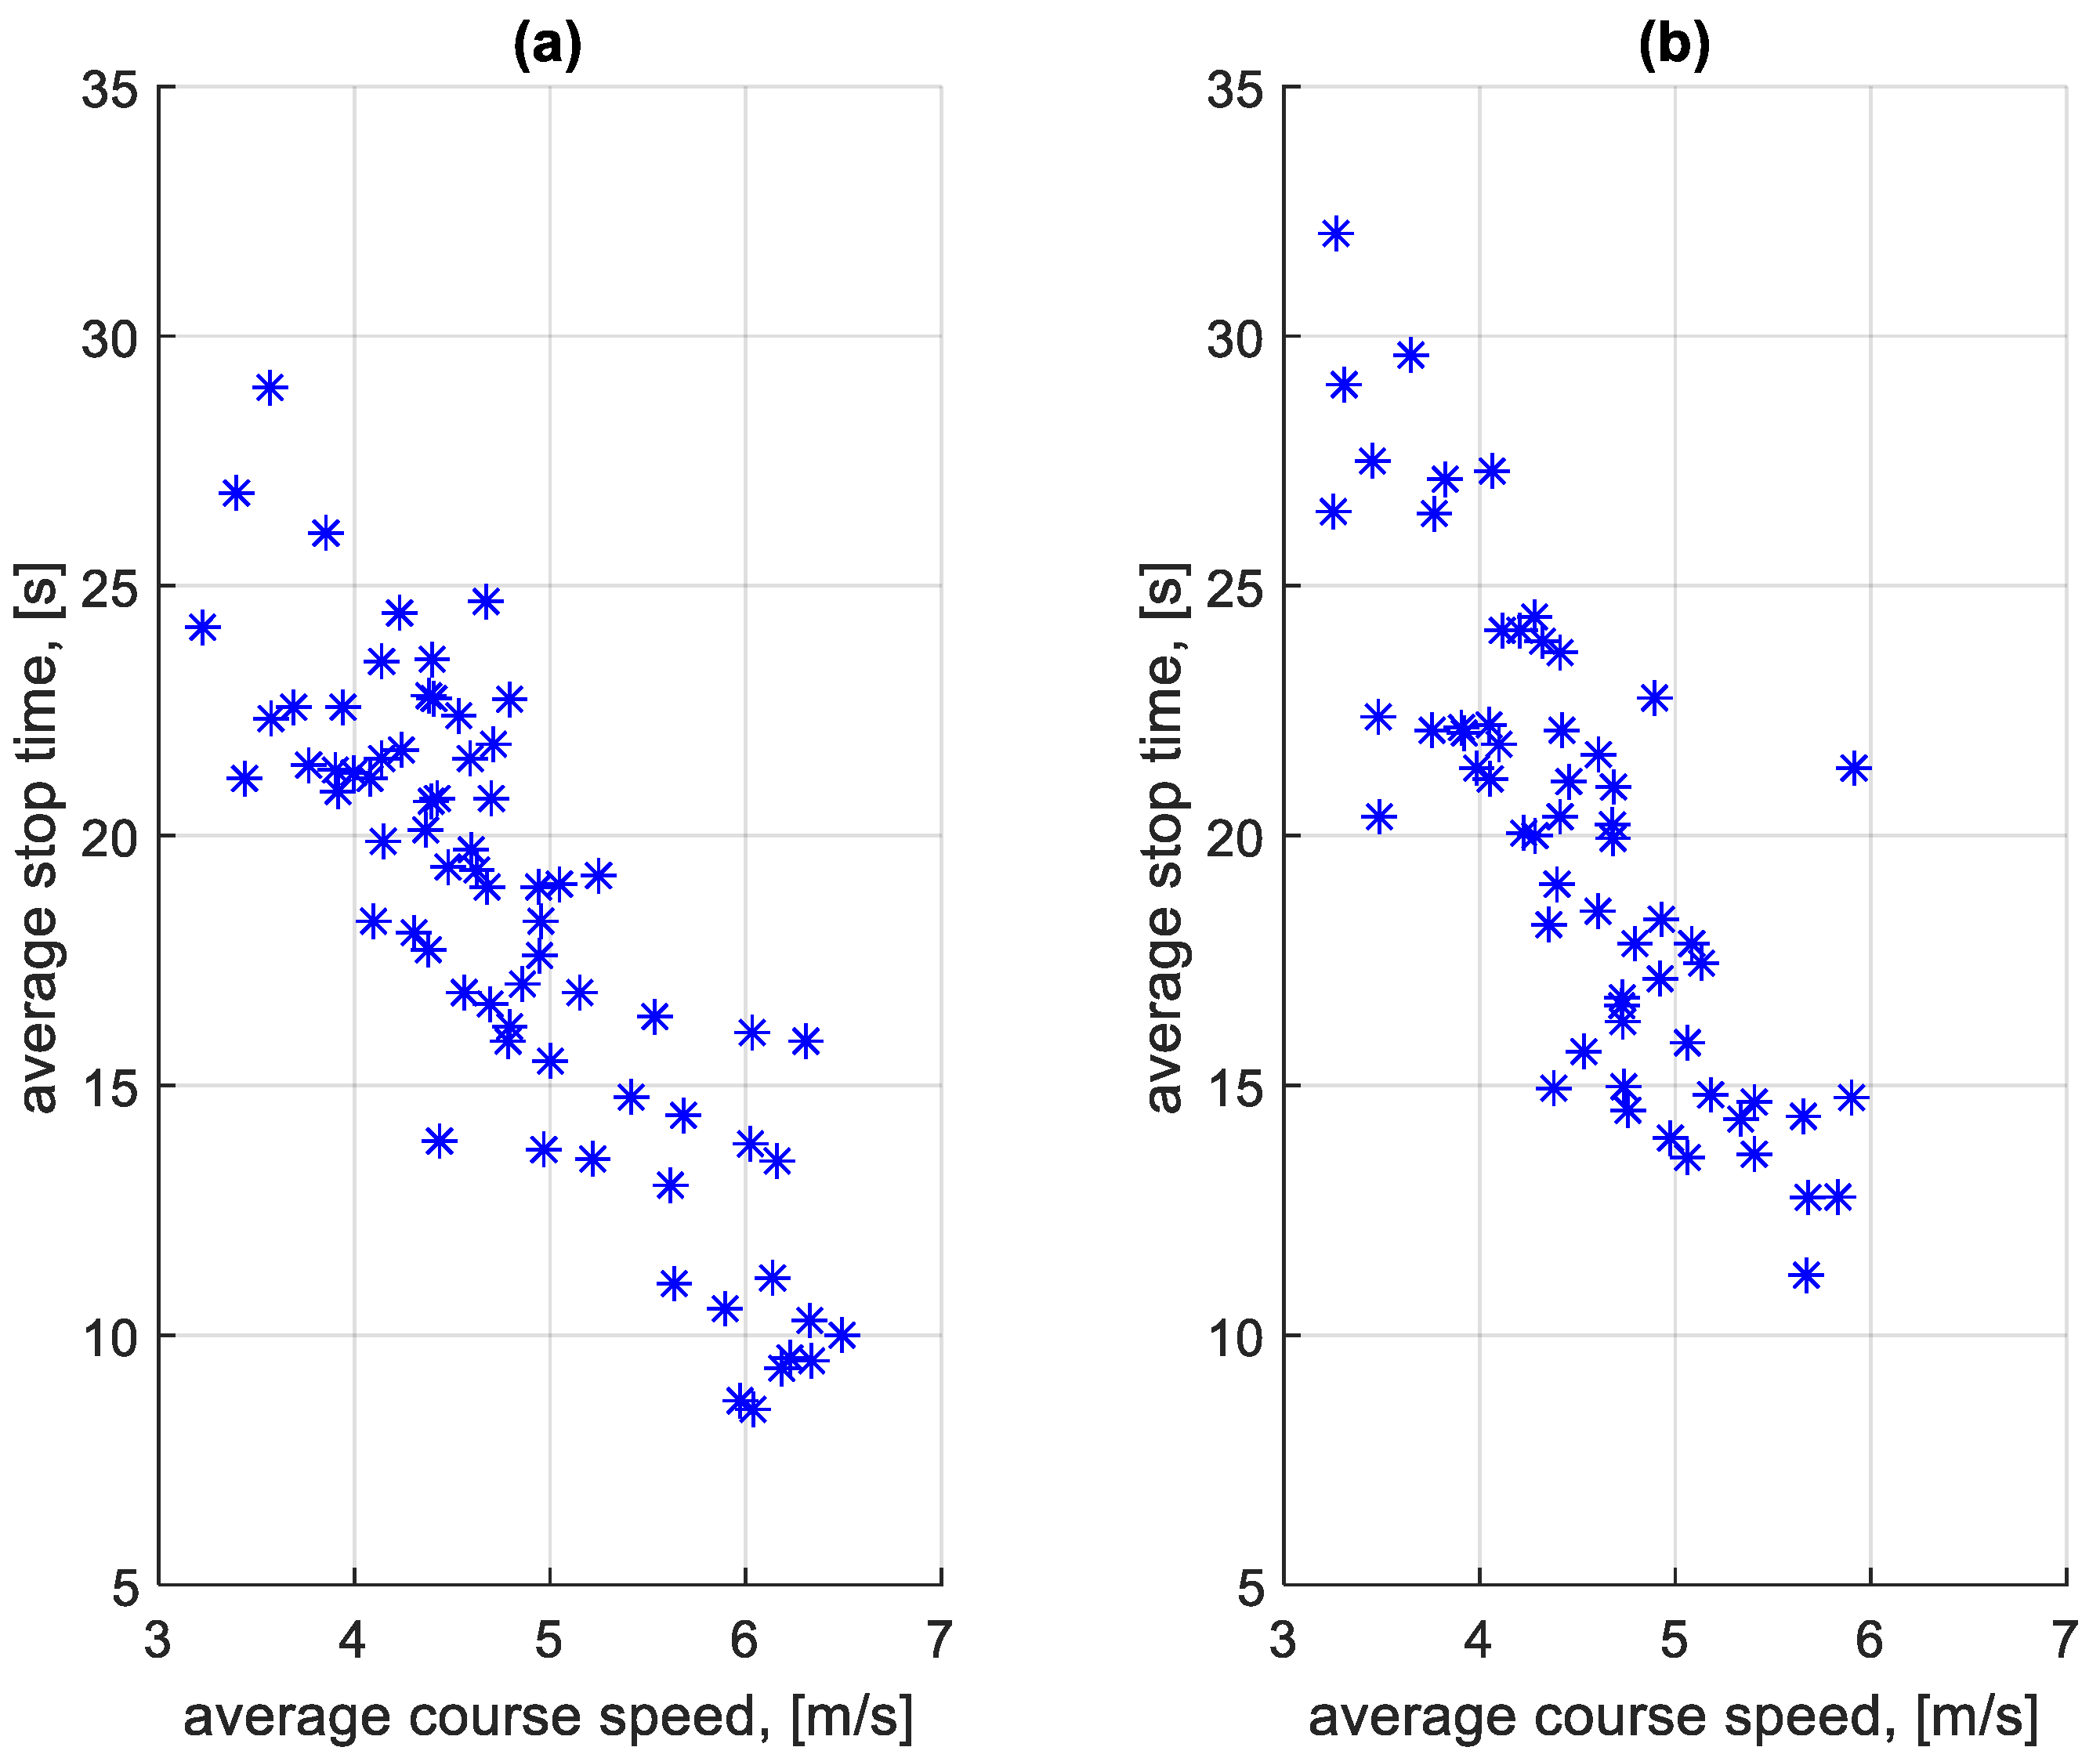
3.3. Characteristics of the Traffic Profile

All the routes under consideration are operated by the same bus running the same daily schedule. In direction A to B, the bus makes seven trips per day and in direction B to A six trips per day. Figure 6a shows an example of the speed profile during the day on 25 March 2022. The speed of the bus in urban traffic very rarely reaches values greater than 15 m/s, which corresponds to a value of 54 km/h.
As can be seen in Figure 6b, there are four phases in the movement of a public bus: the acceleration phase, the braking phase, the steady speed phase, and the stopping phase. The stopping phase results from the need to stop at a bus stop and from the current traffic conditions, e.g., stopping in front of traffic lights.
The varying traffic conditions and the number of passengers transported on a particular course affect the duration of the course and the average course speed. A chart of course durations in the studied period is shown in Figure 7.
To determine the energy lost in the braking process, it is necessary to know the vehicle speed vb at the start of the braking. In most cases, this speed does not correspond to the speed at the end of the acceleration process va, nor to the maximum speed reached by the bus between bus stops, as illustrated in Figure 8.
As each braking process is characterised by different initial conditions and intensity, the determination of the energy lost as a result of this process requires a case-by-case consideration.

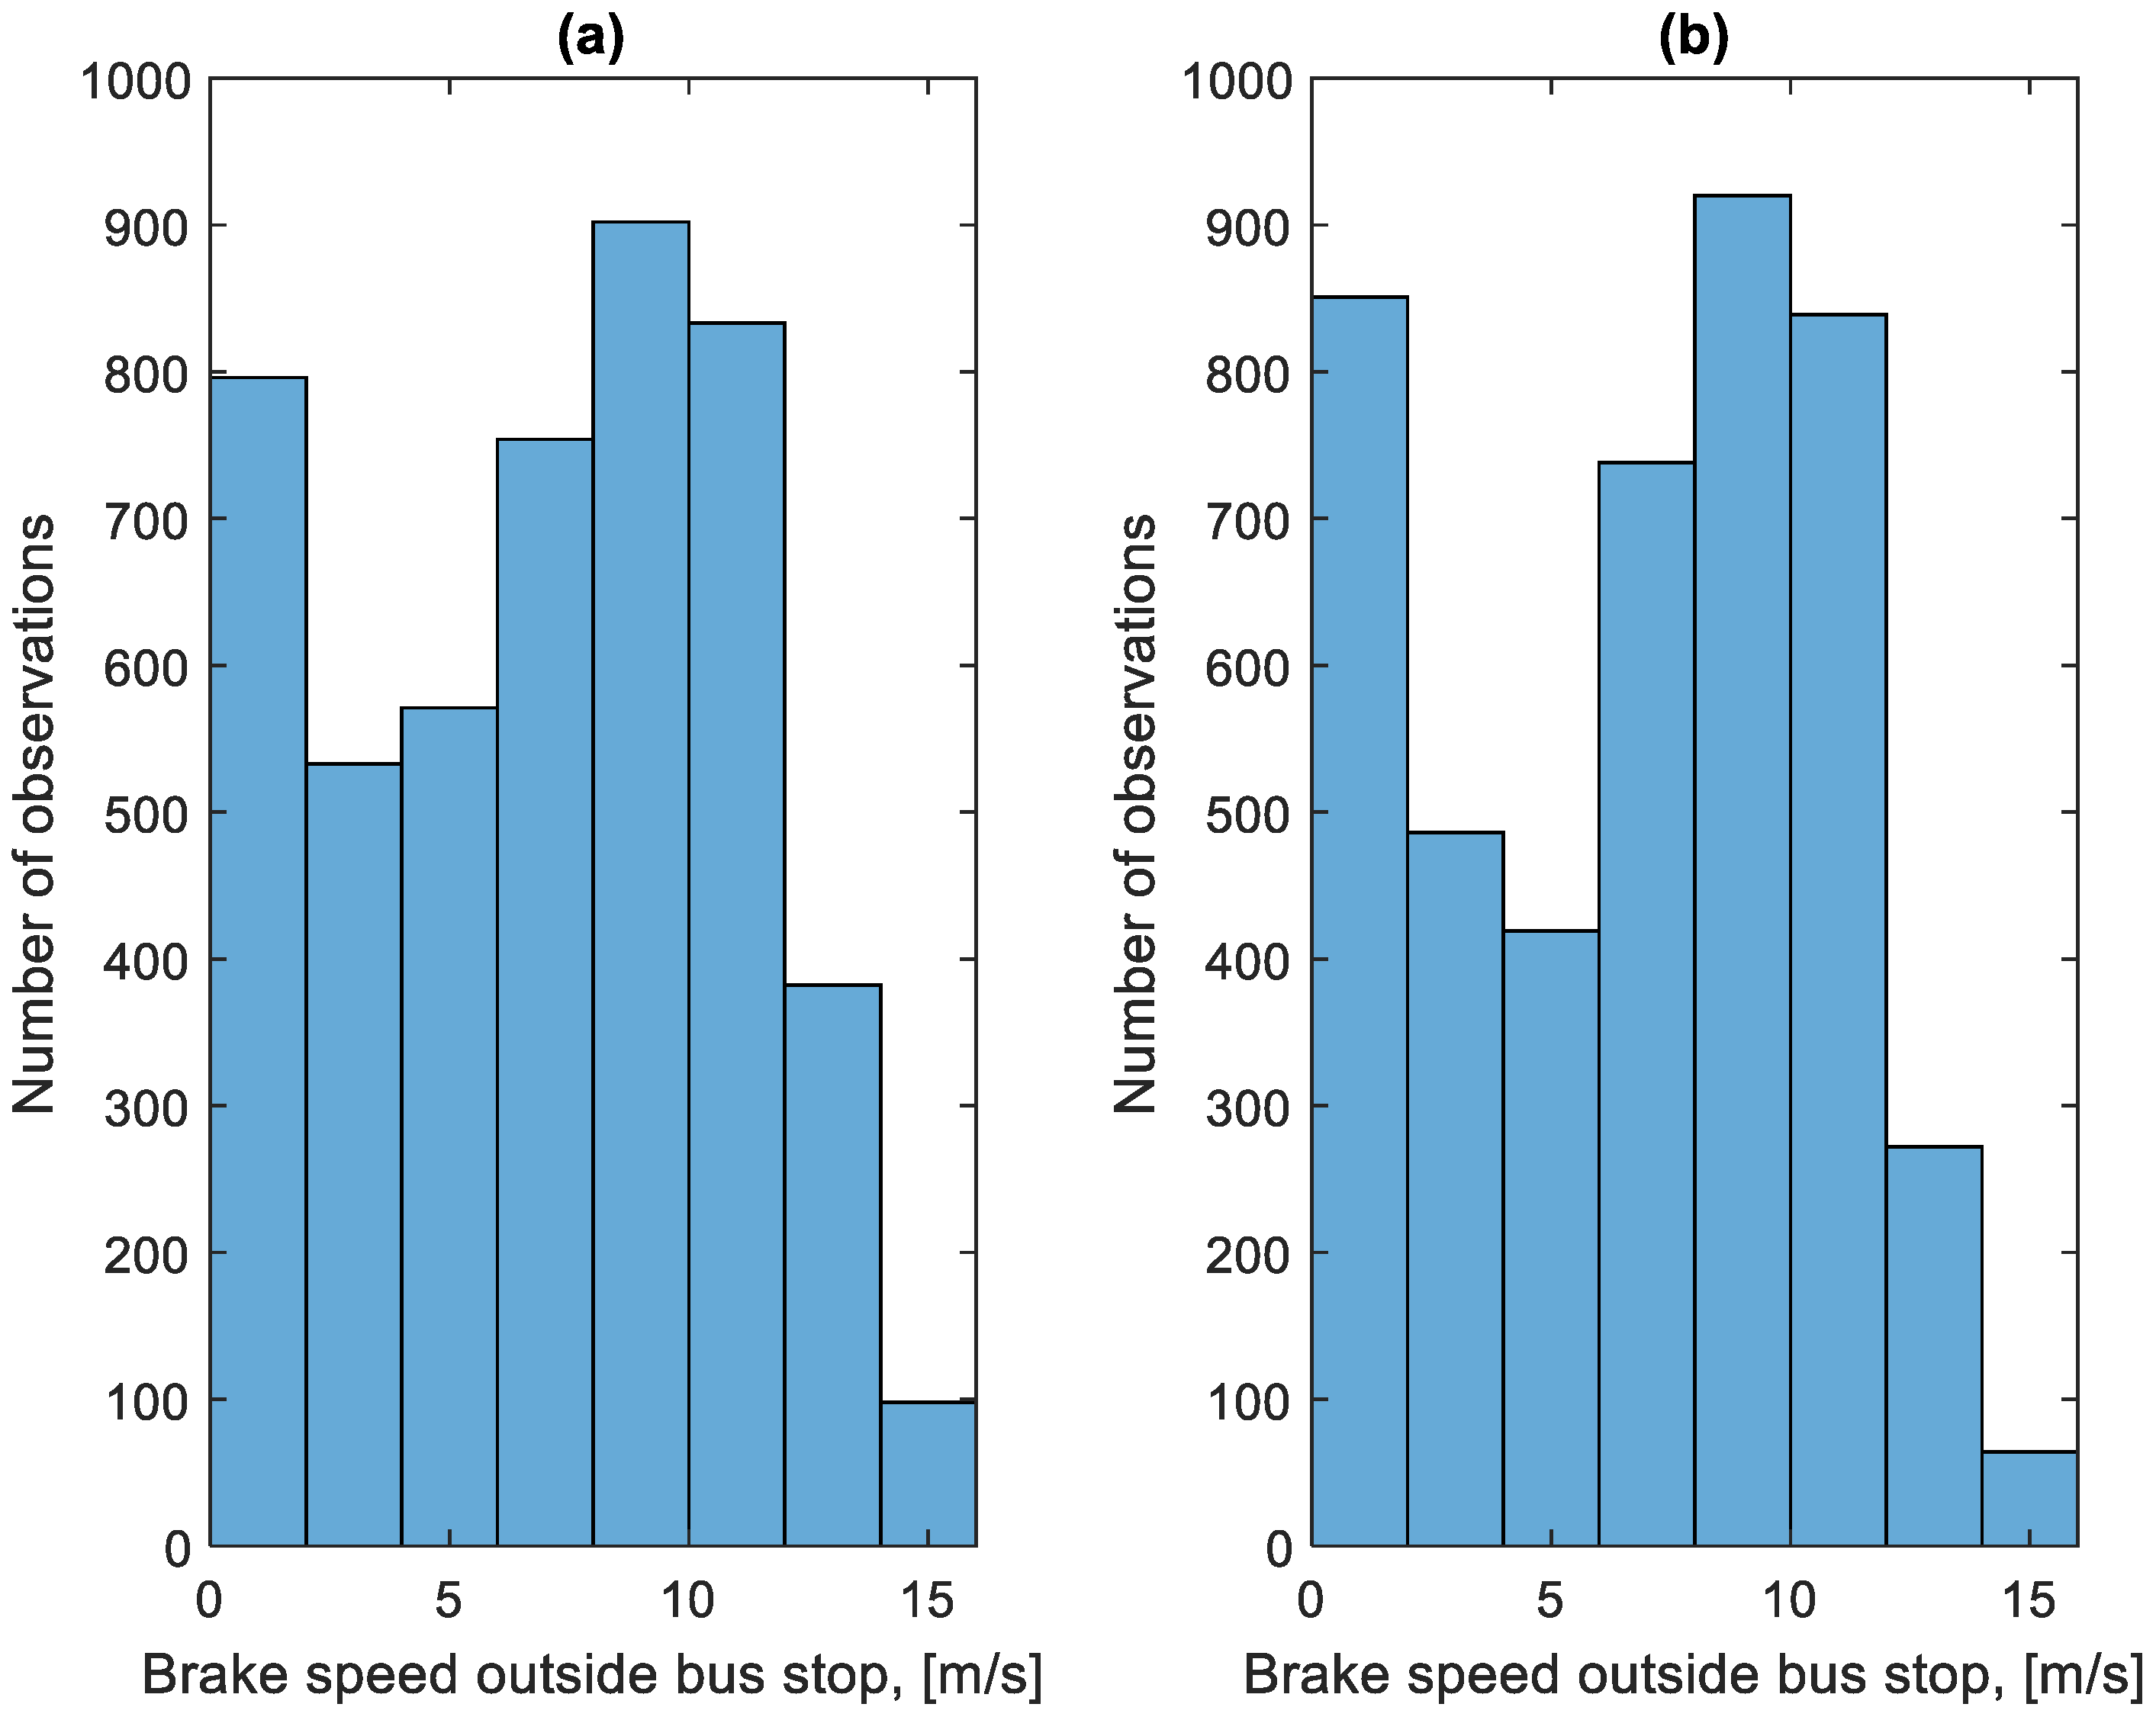
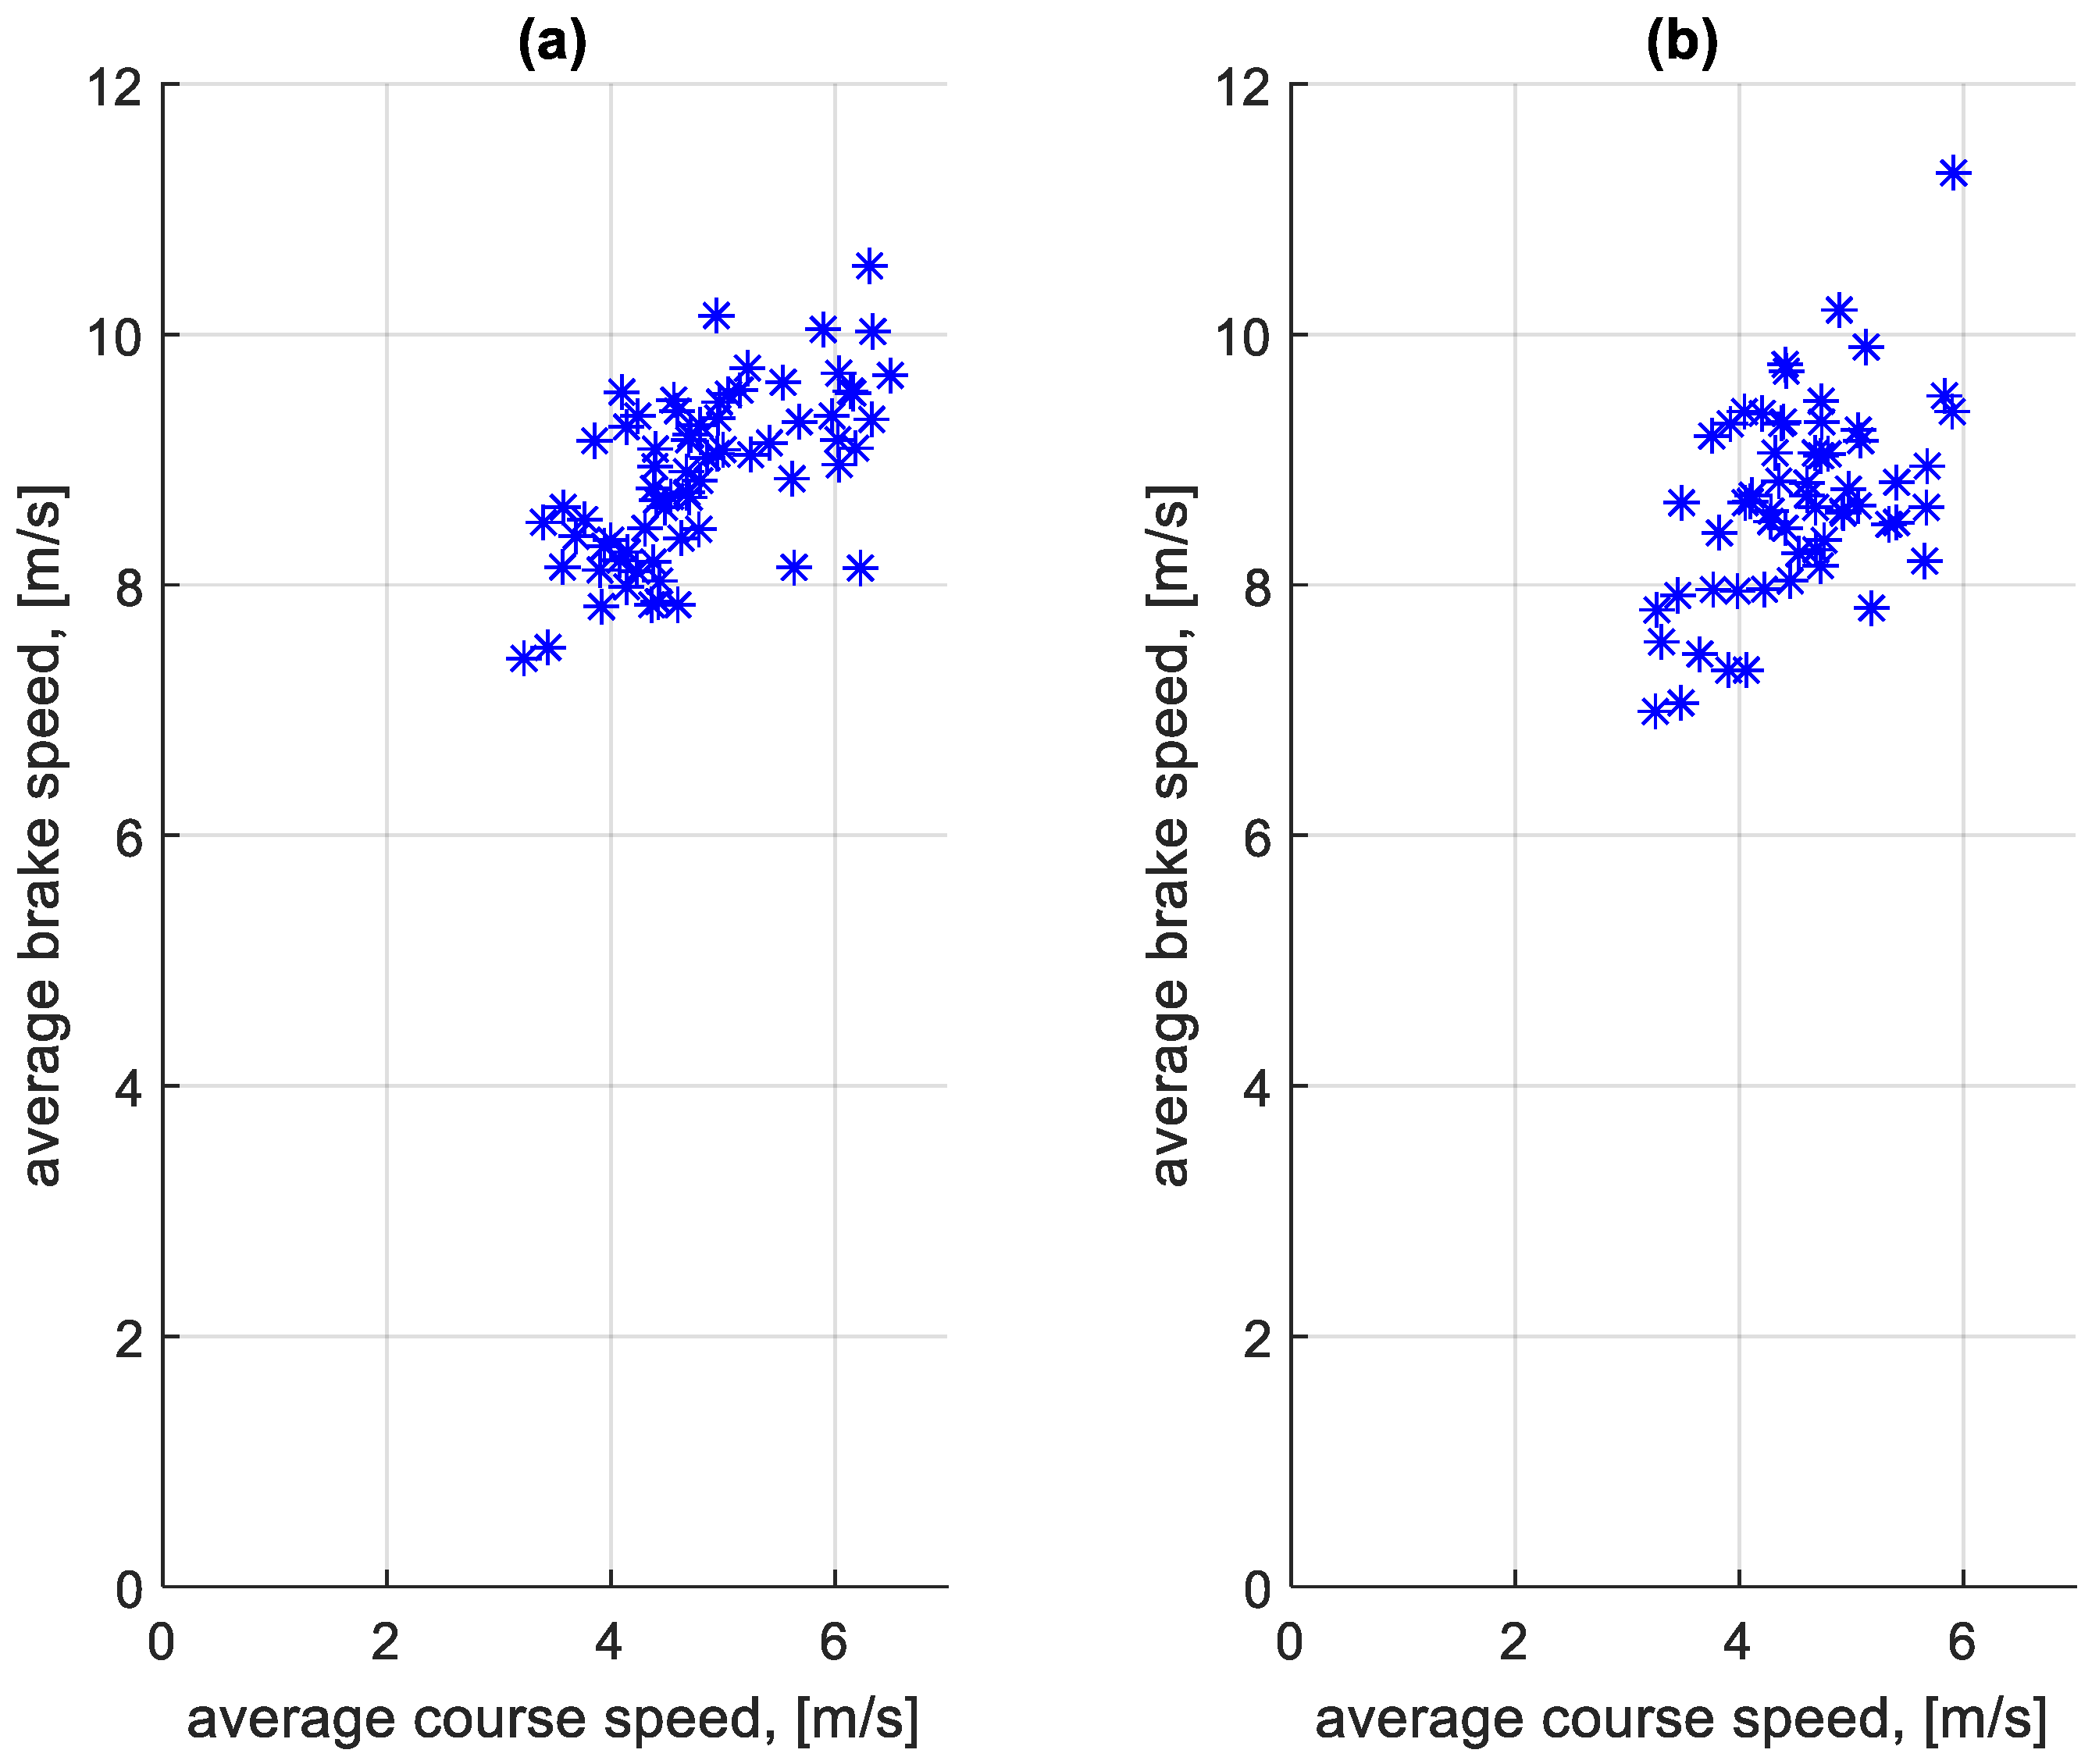
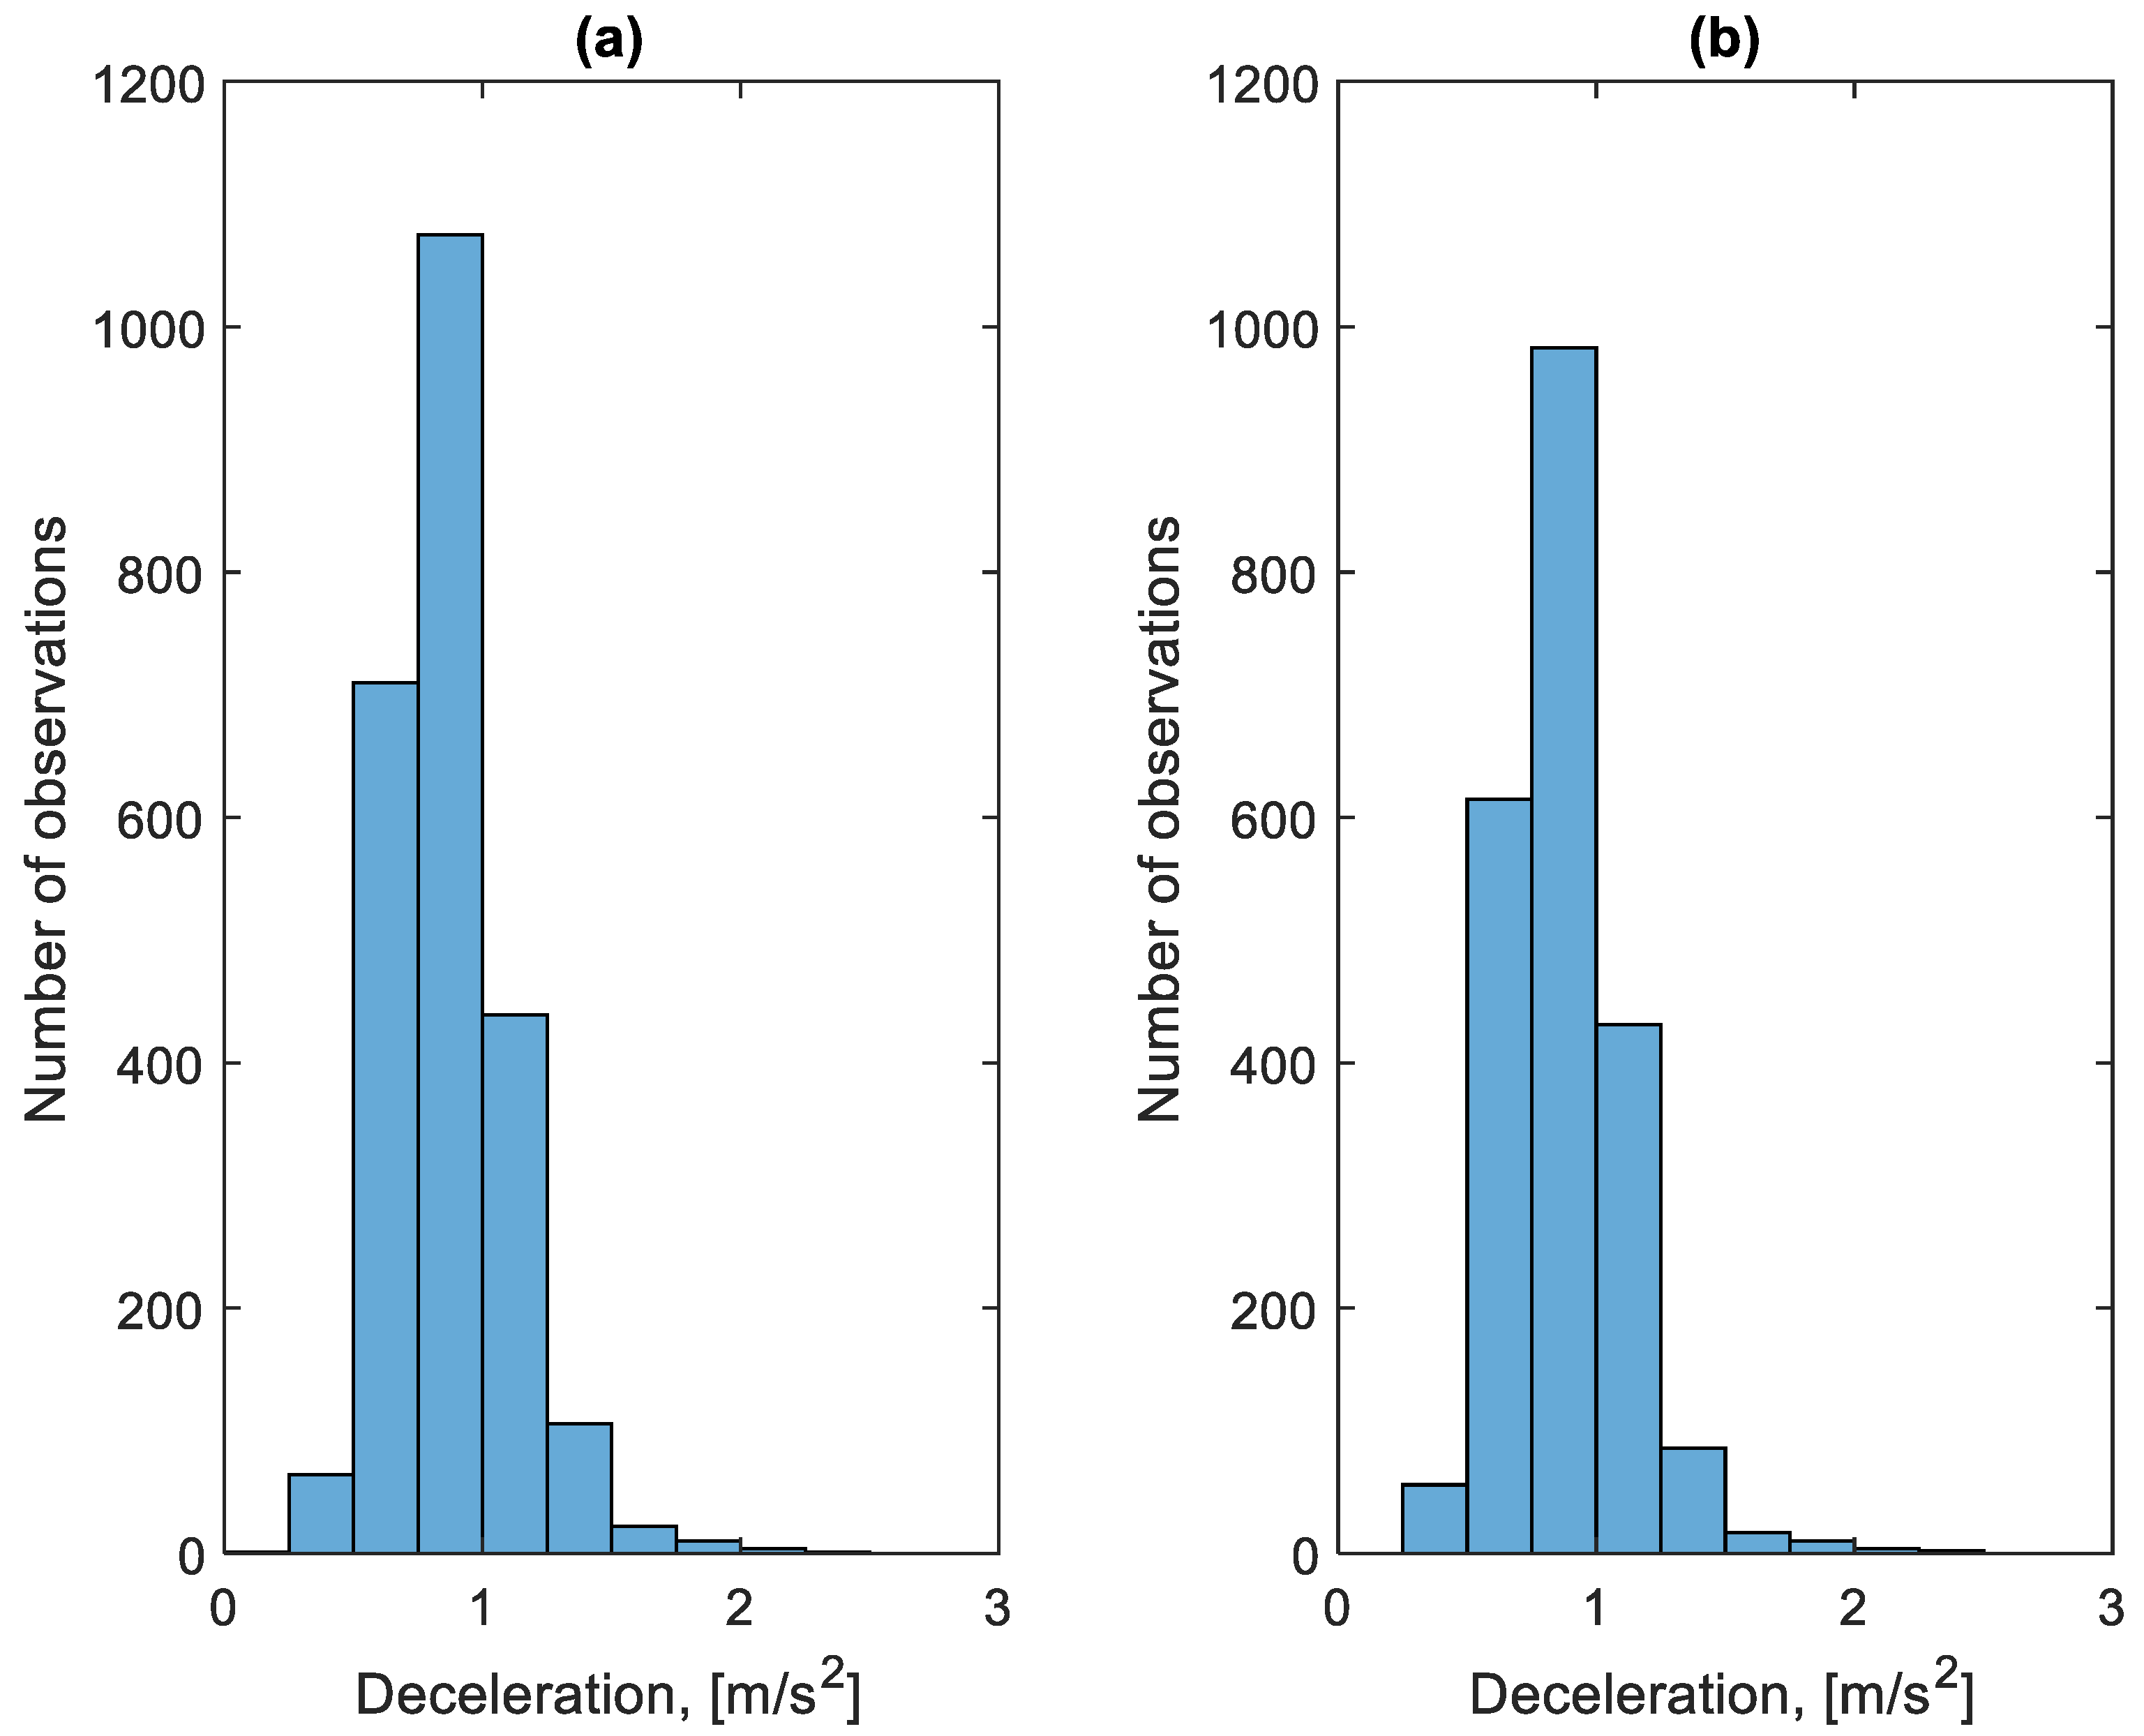
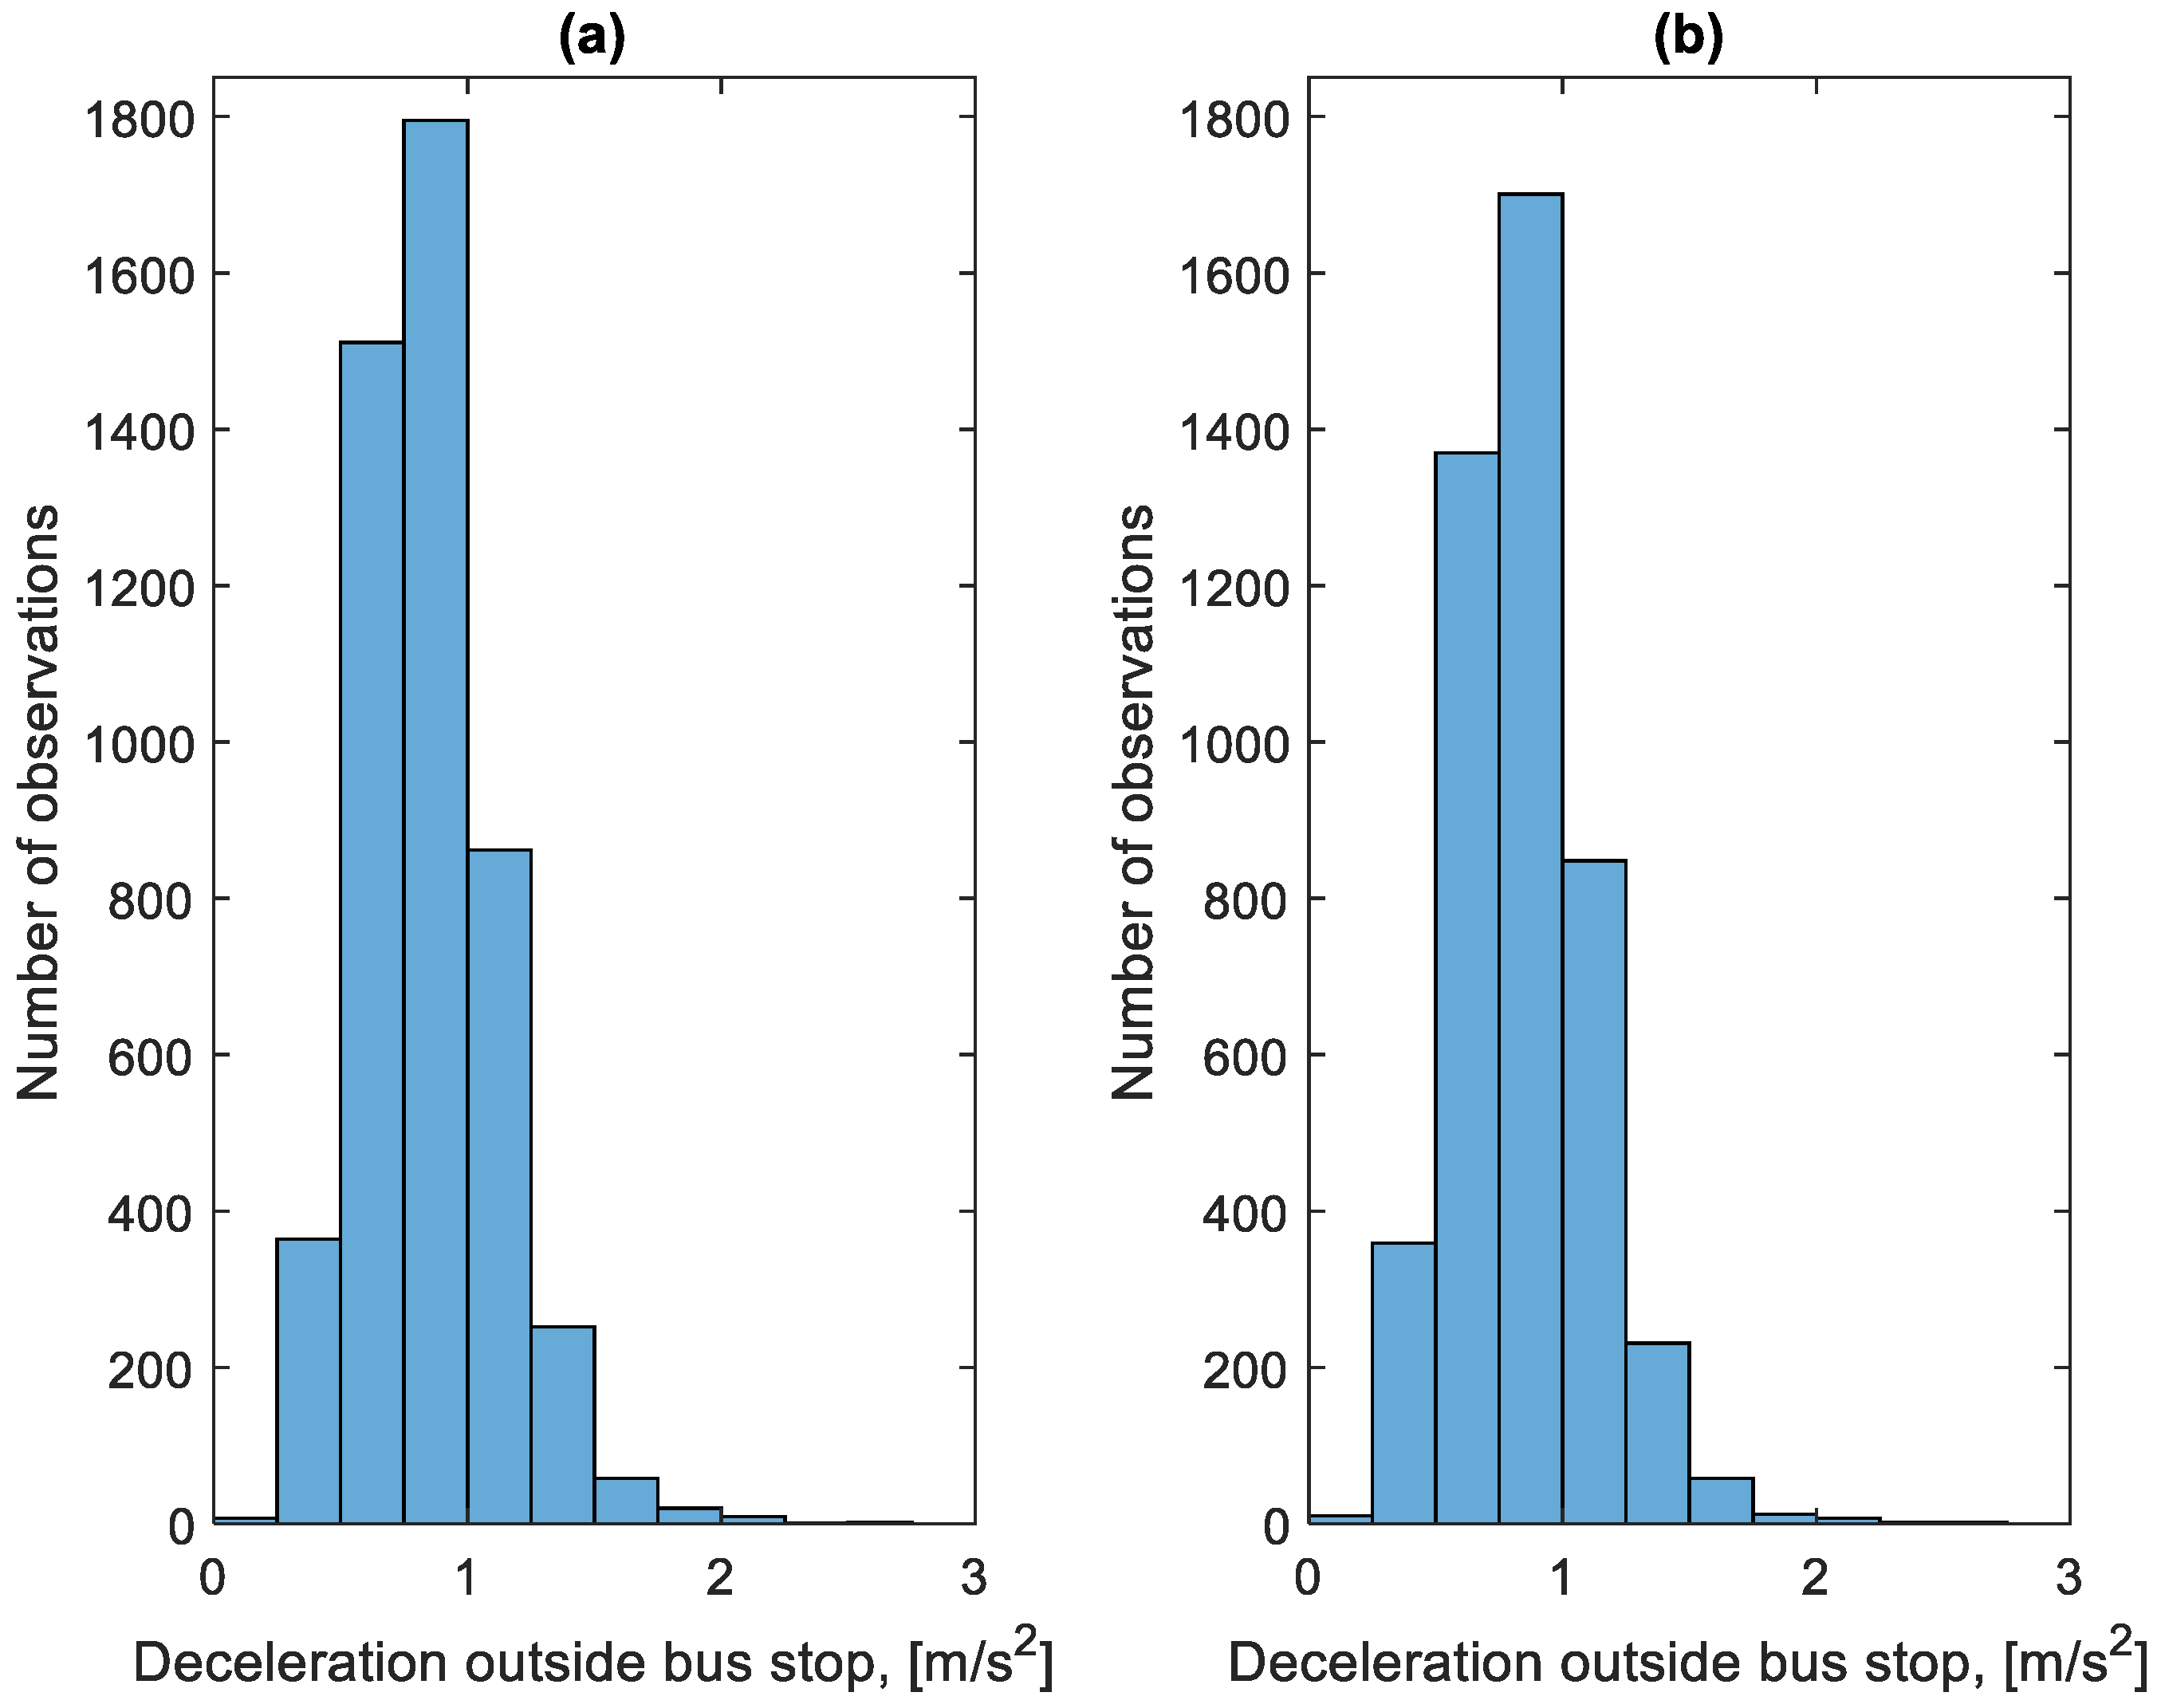
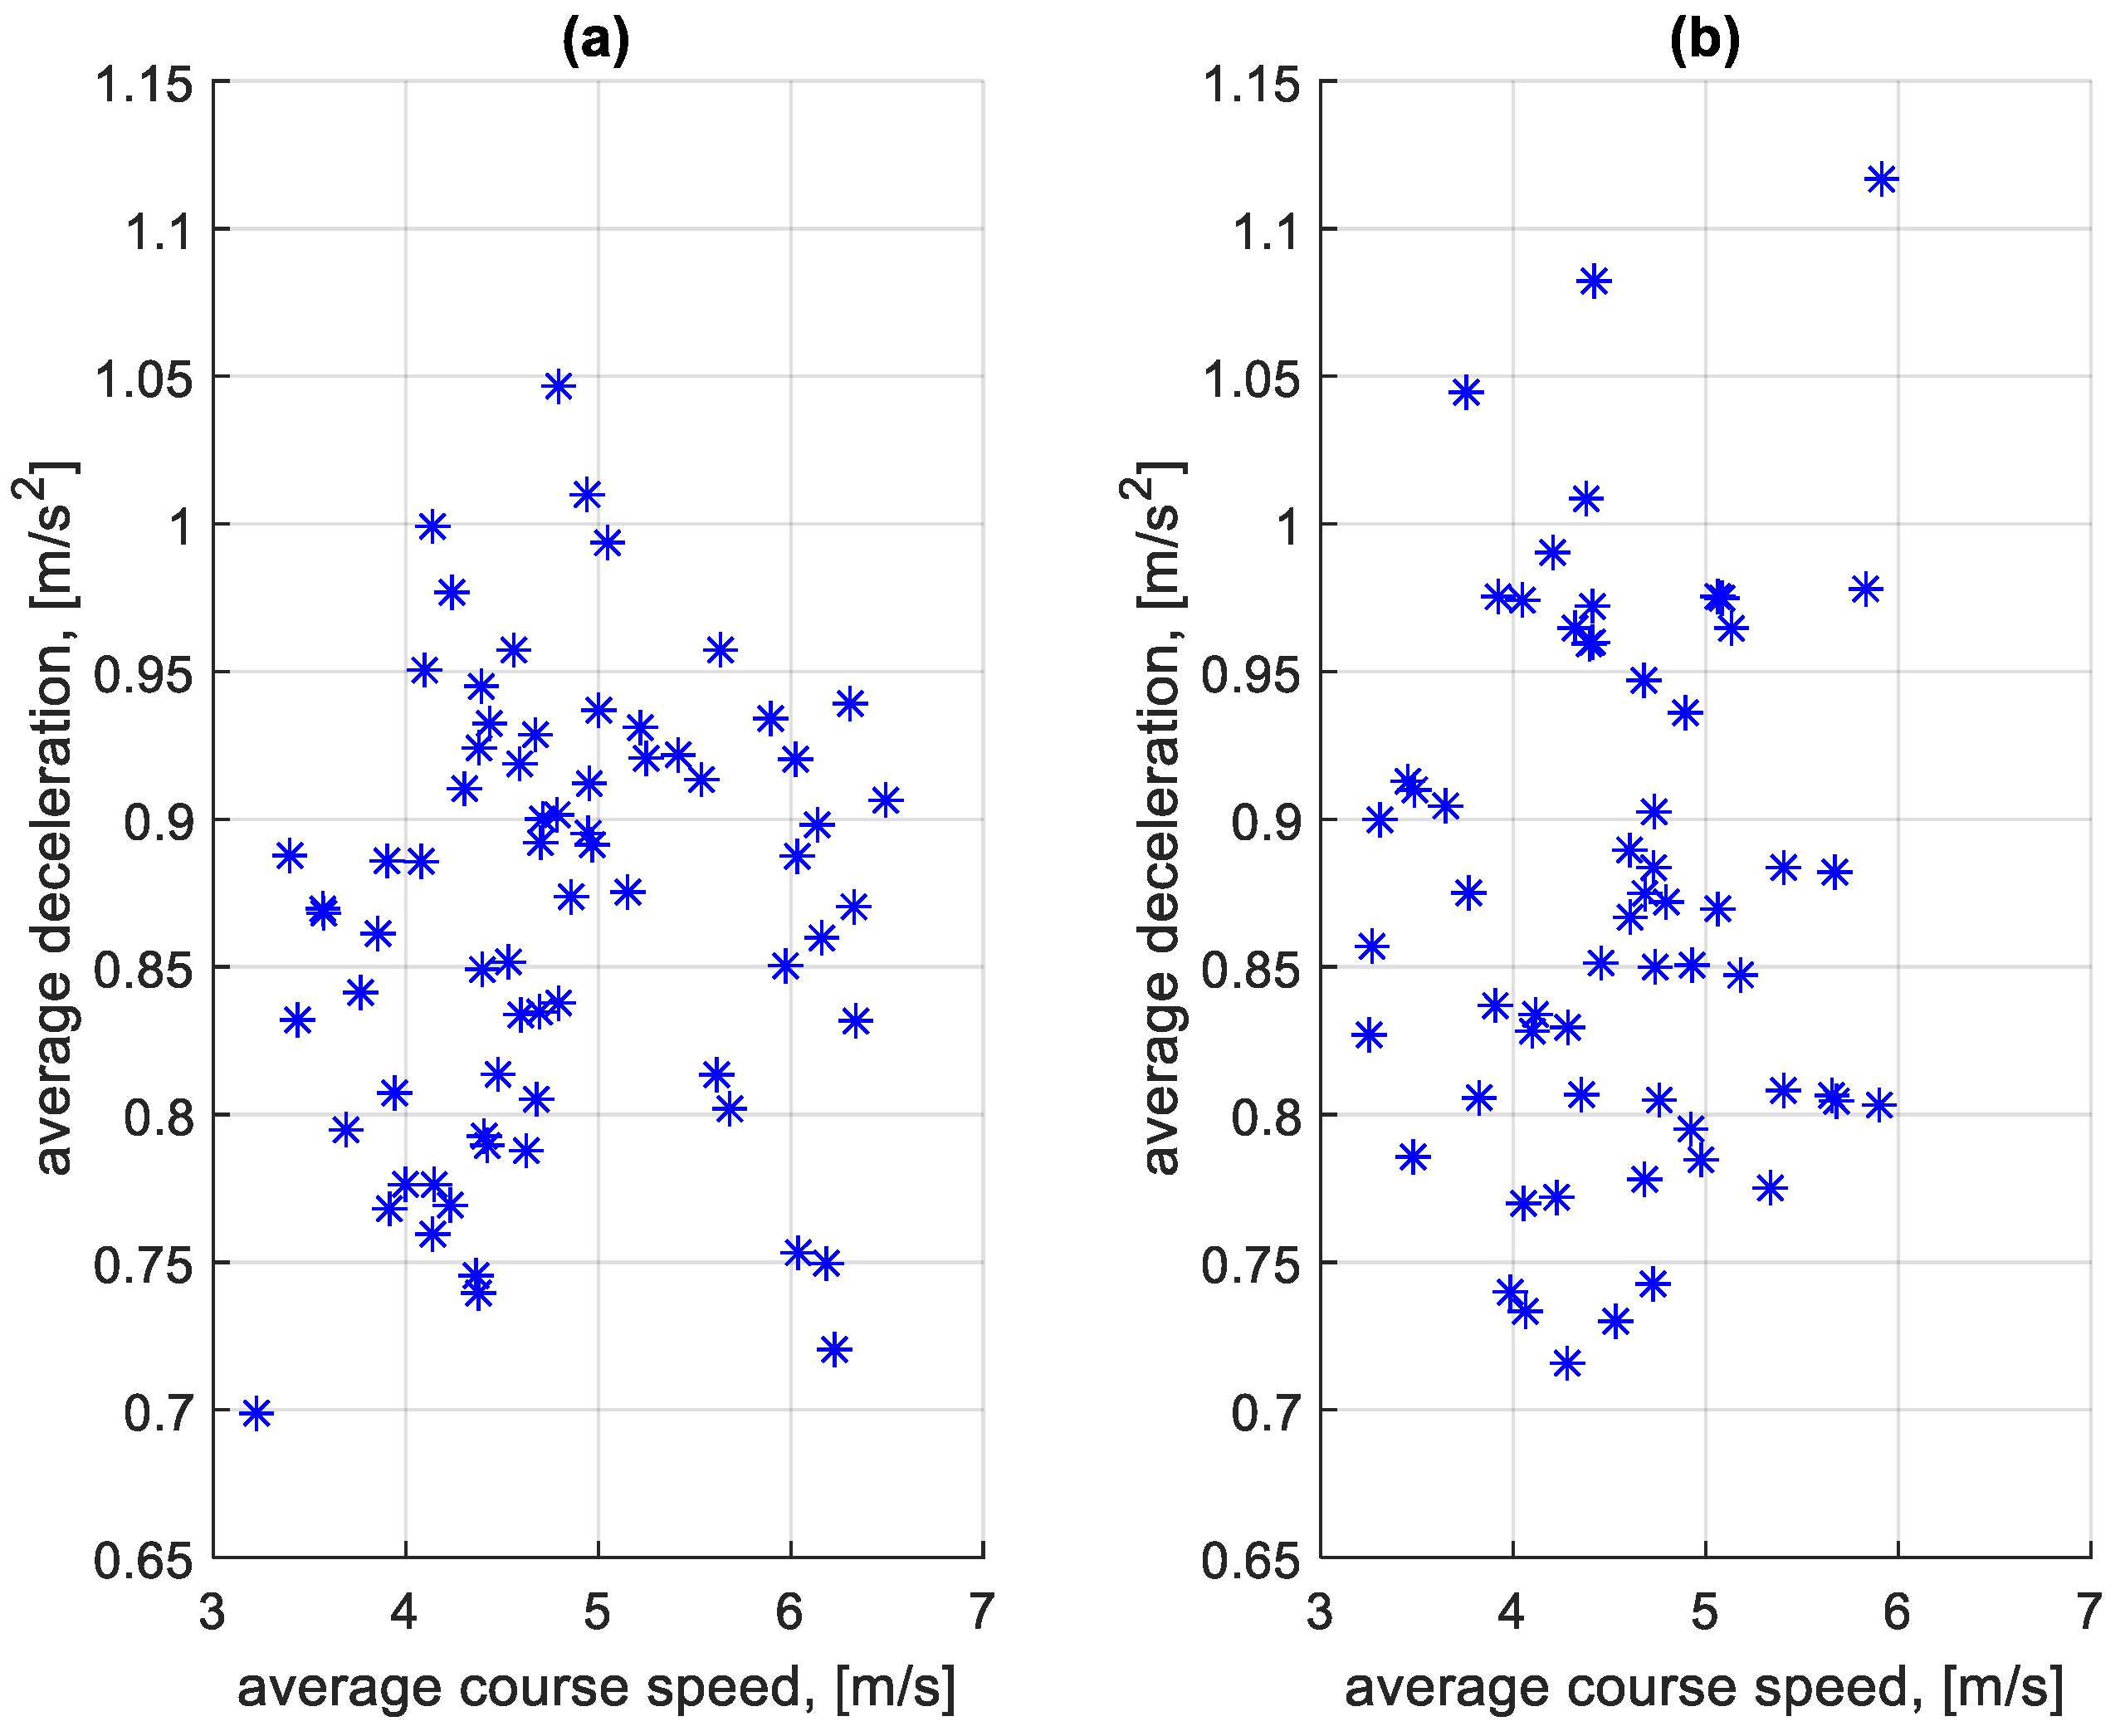
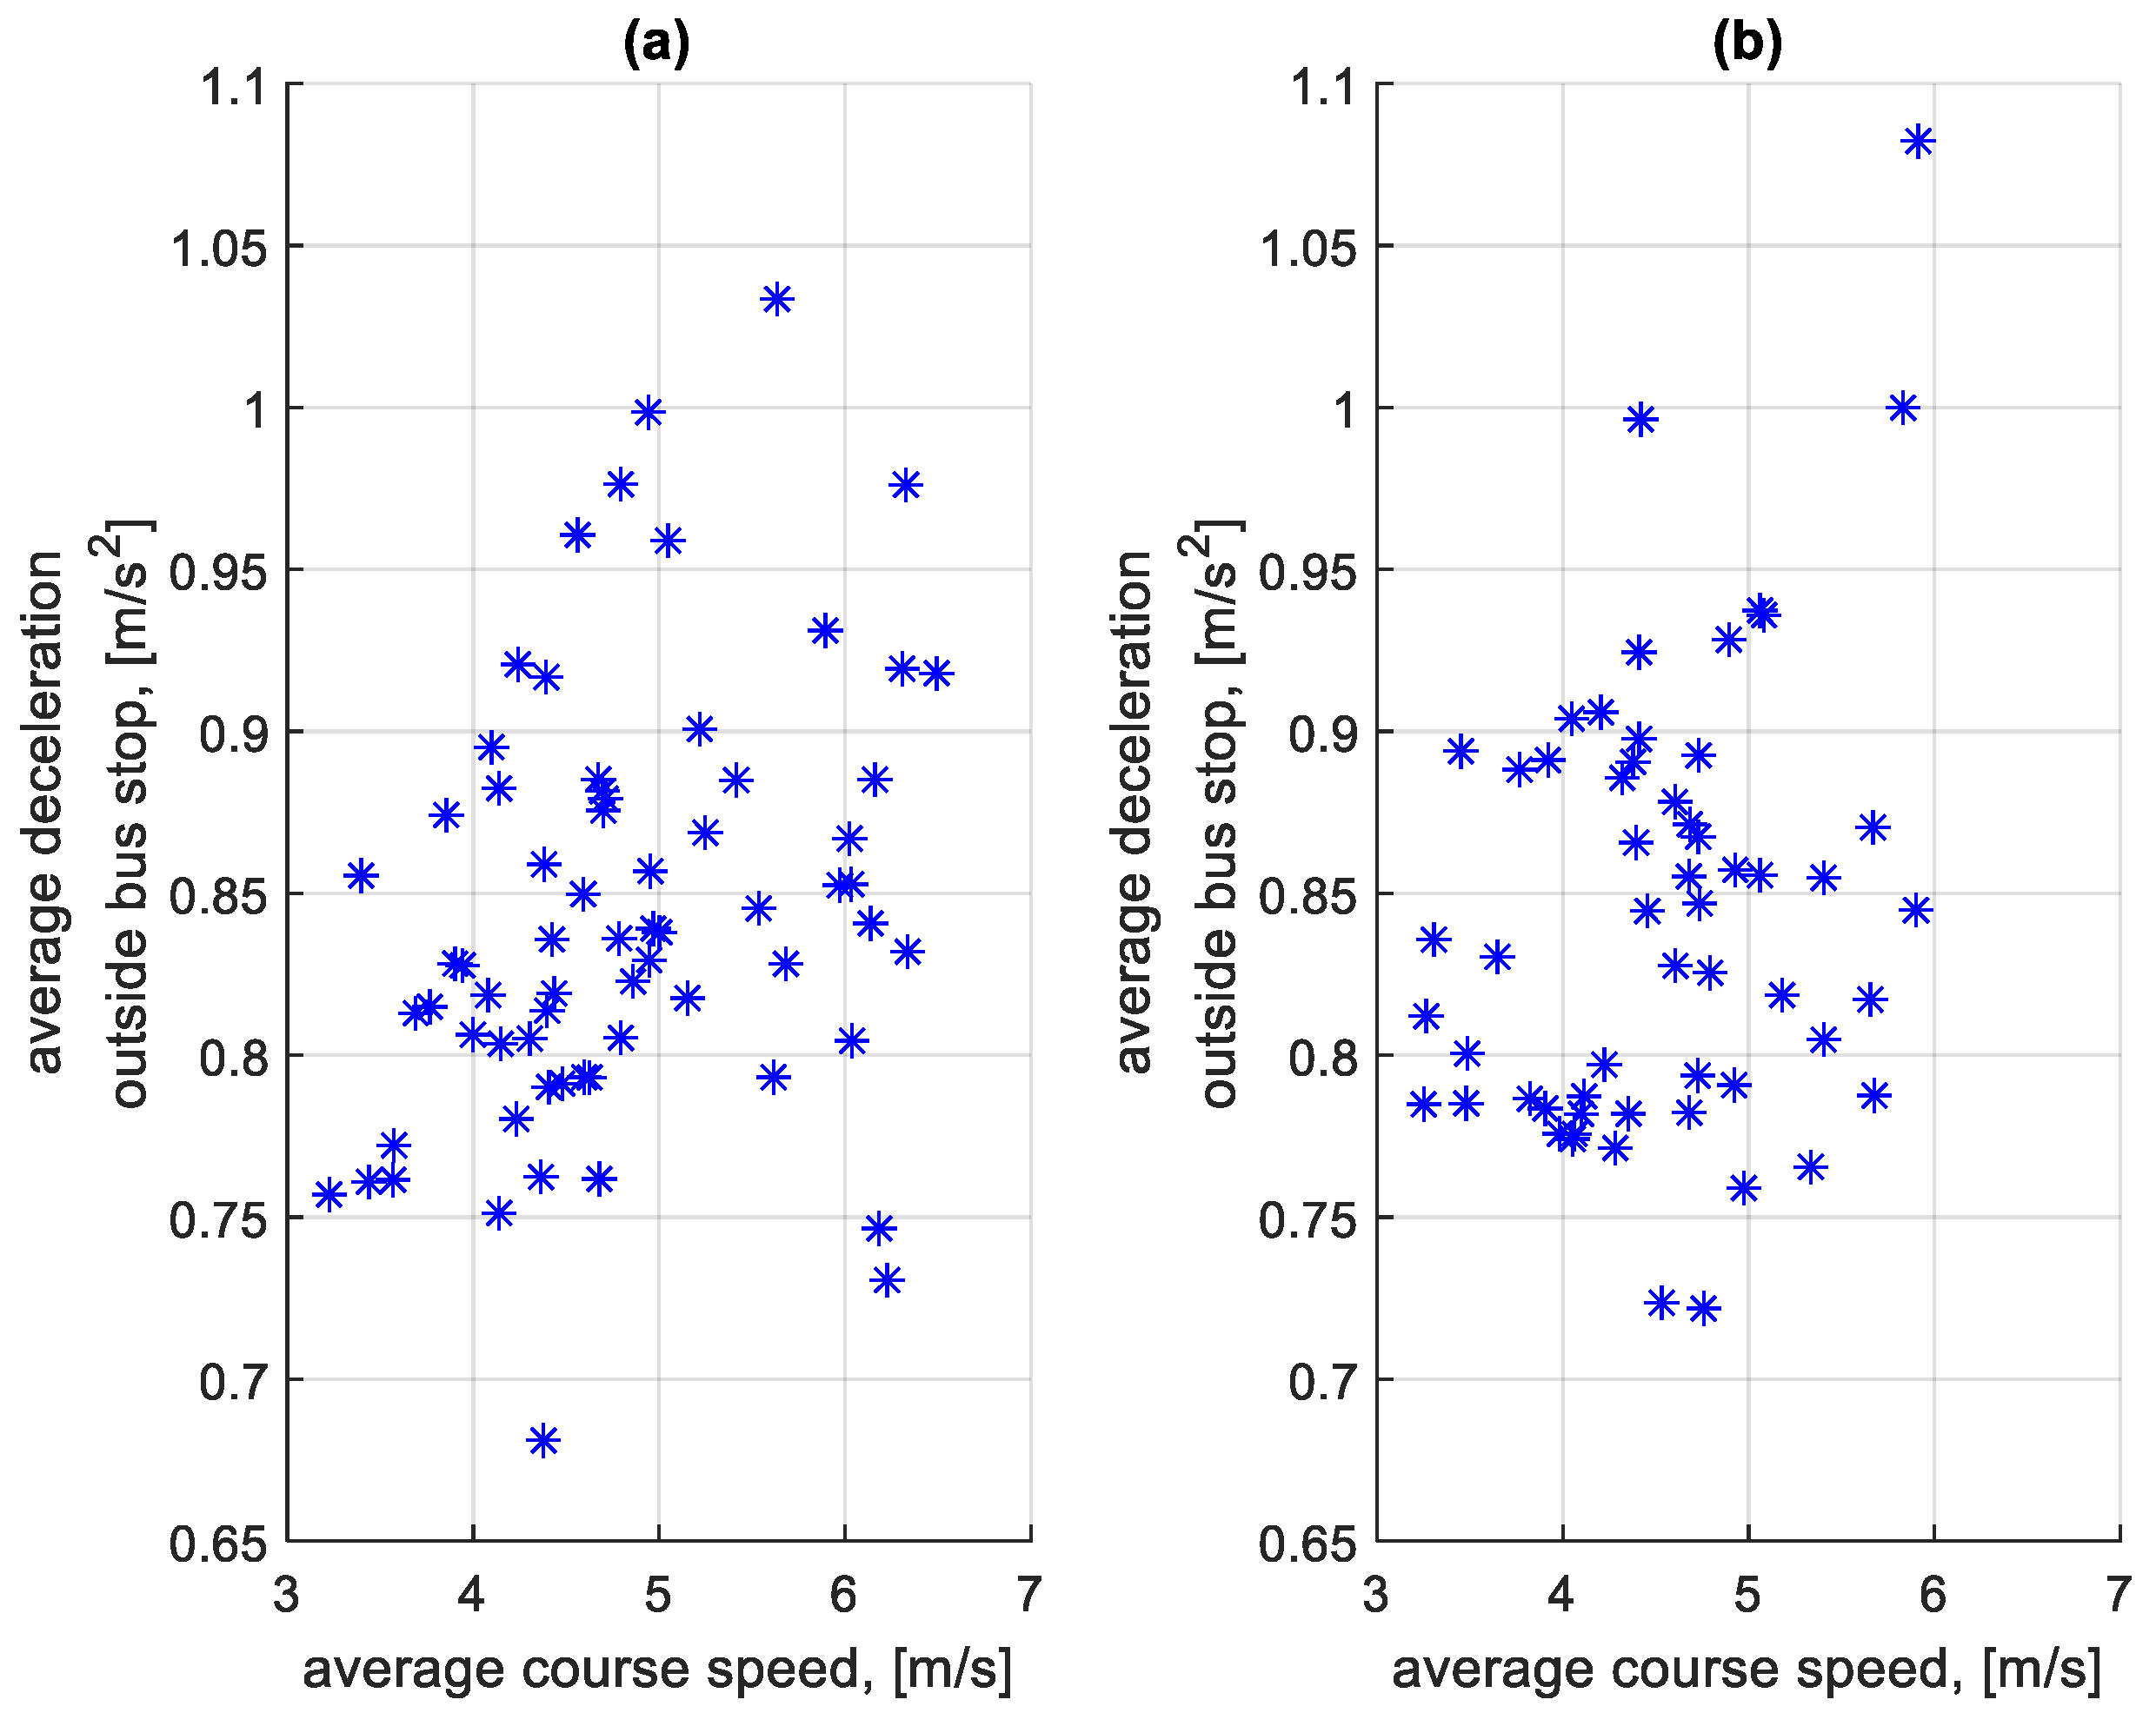
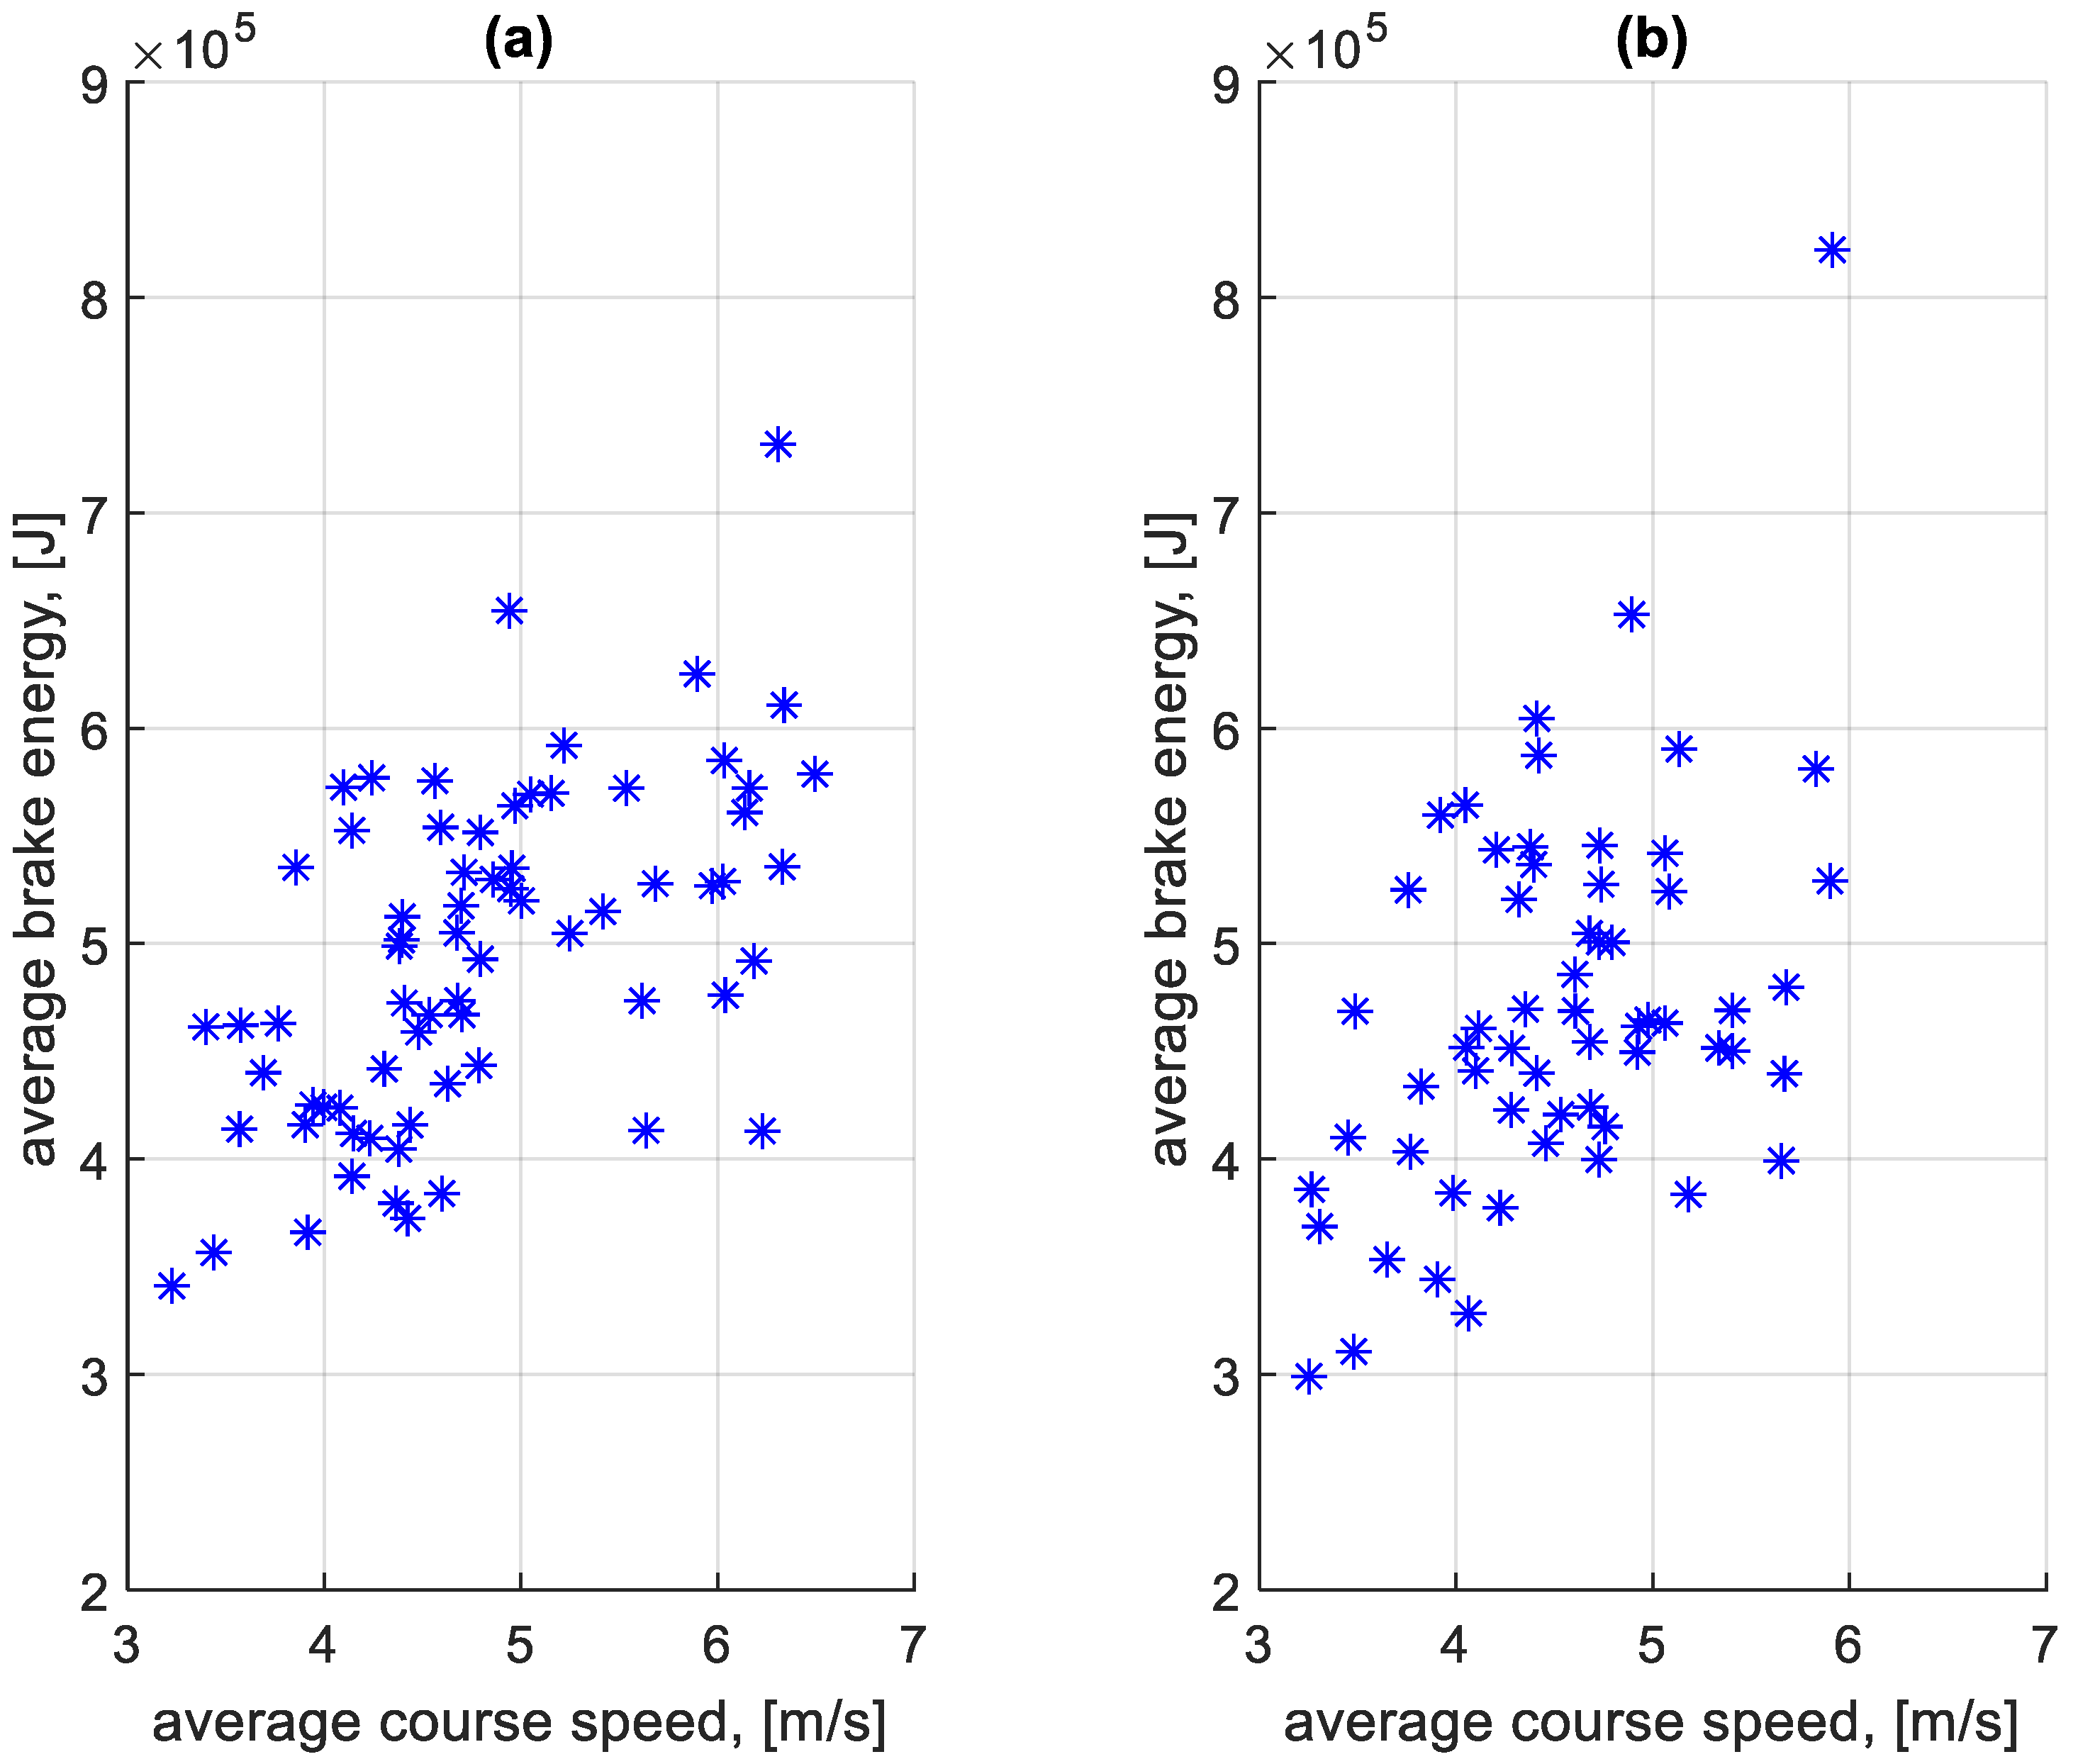
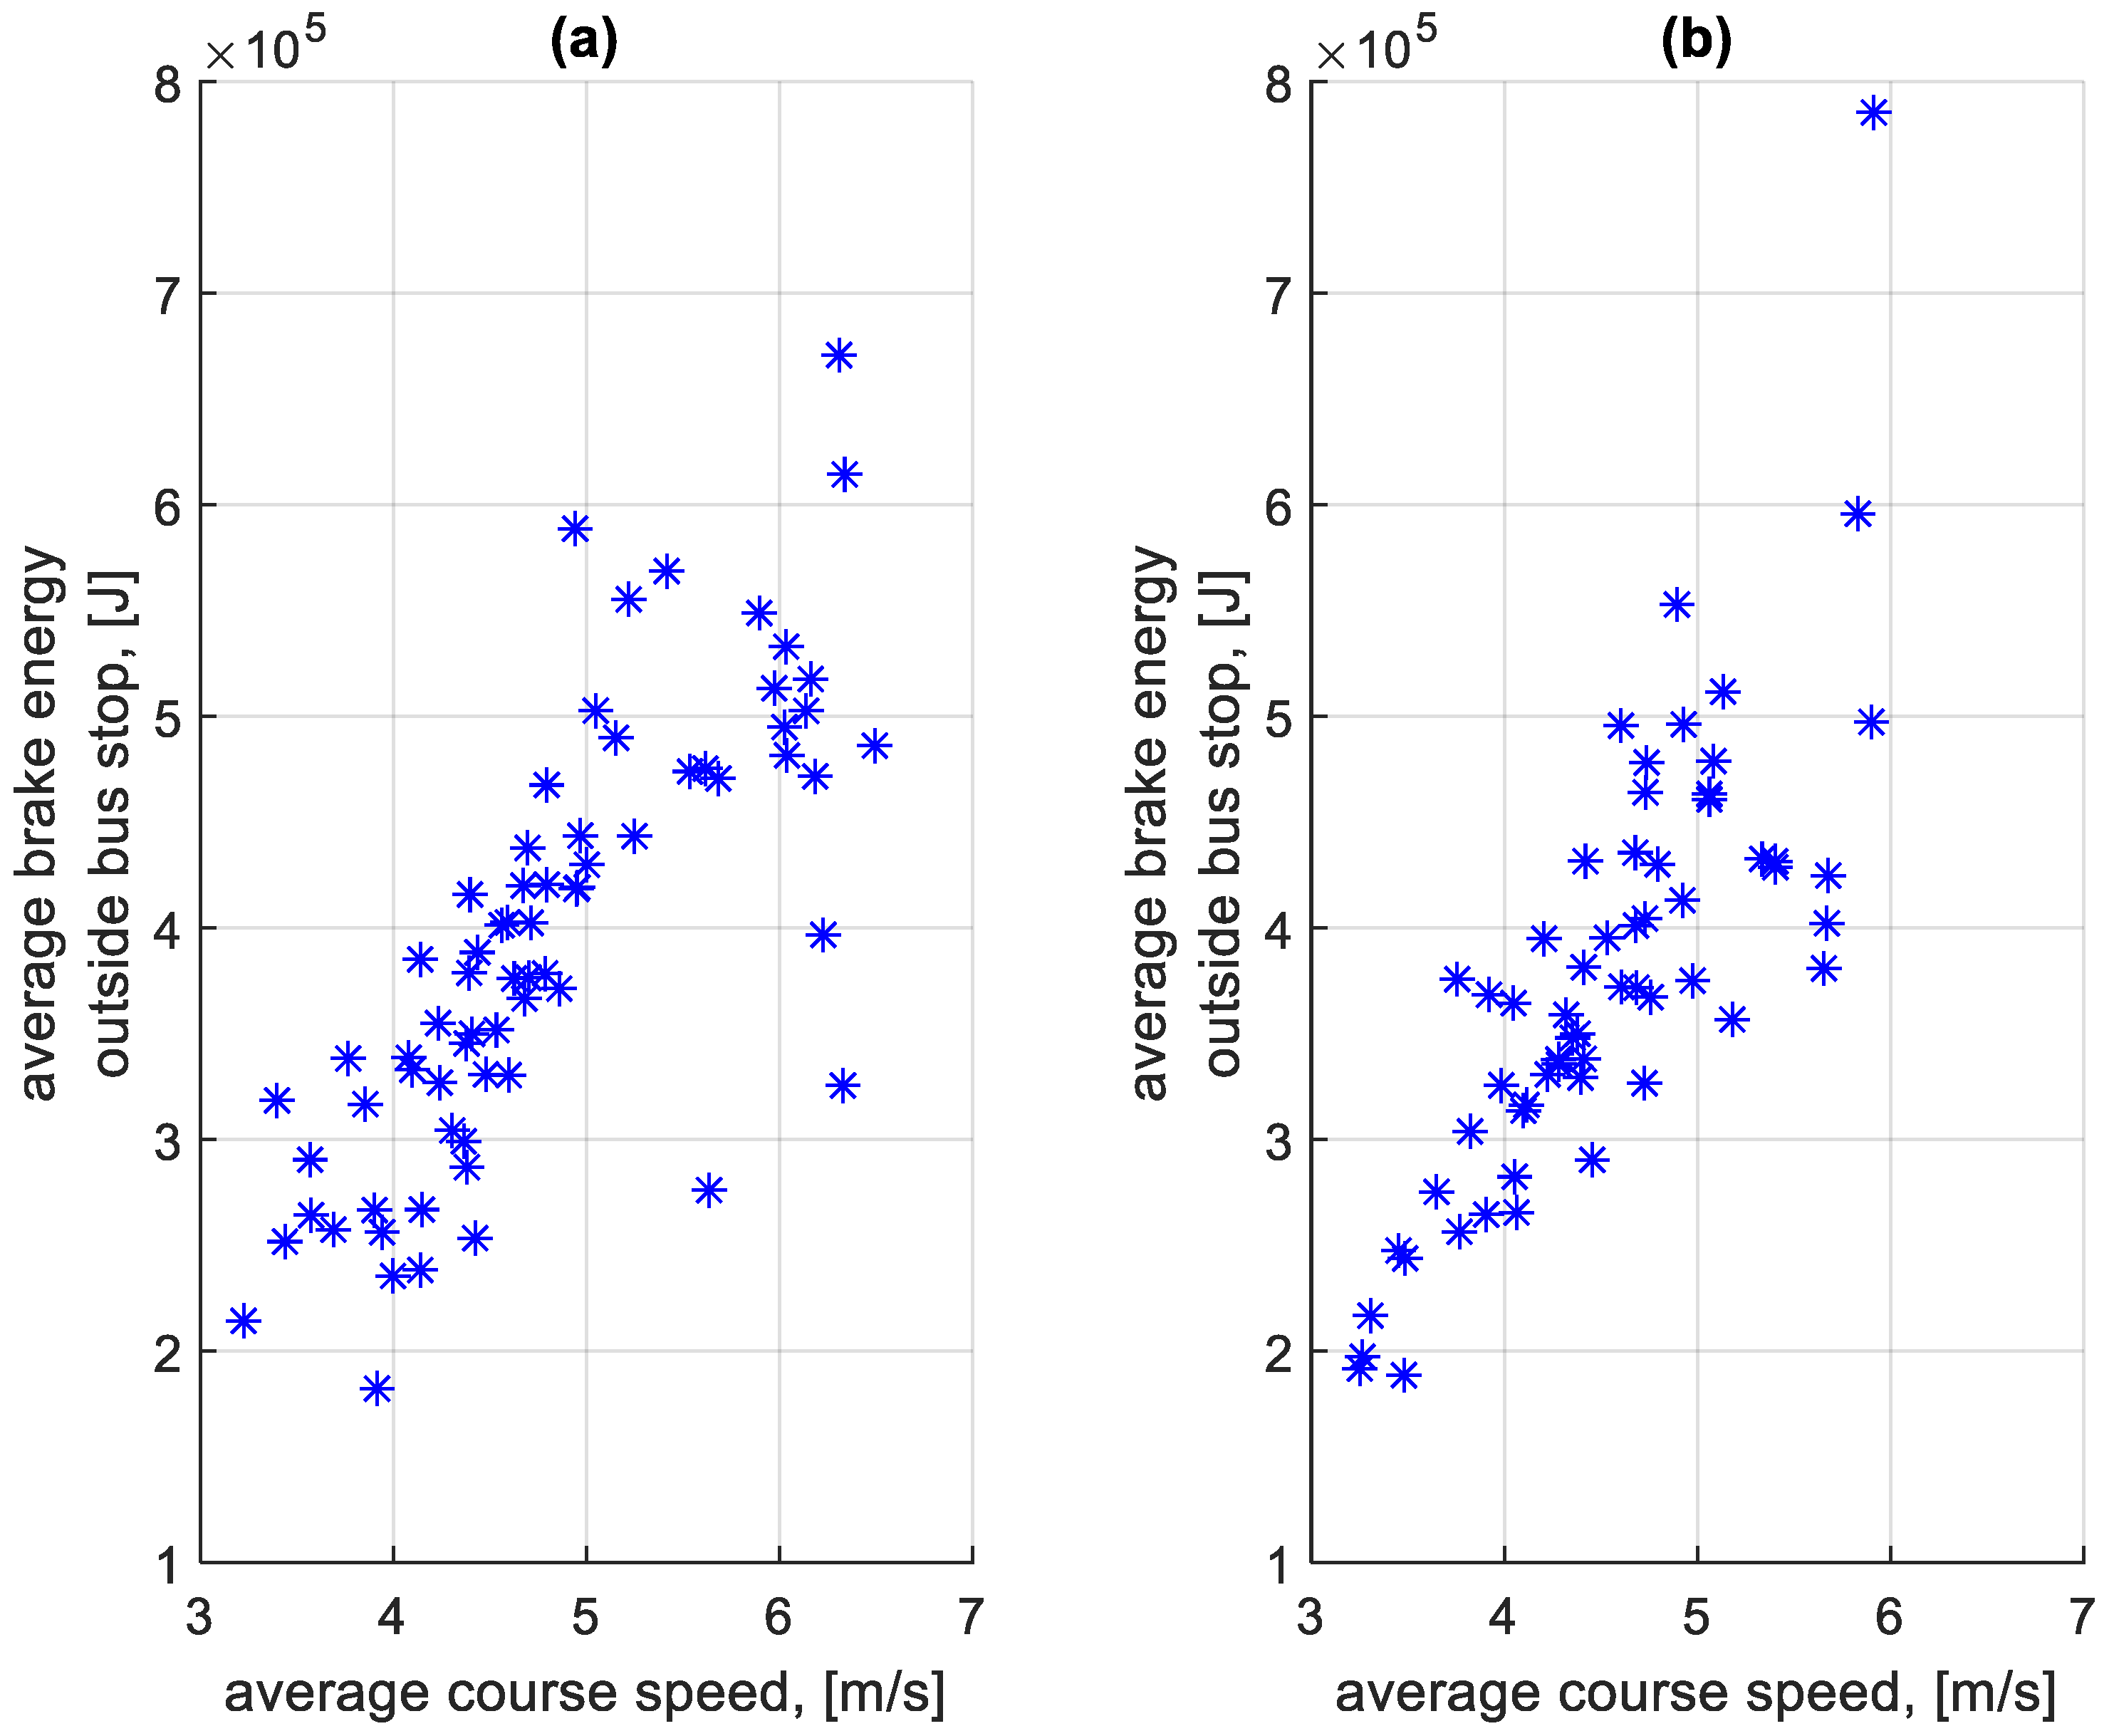
3.4. Analysis of Braking Process Parameters

As part of the study, all braking speeds vb were determined from the recorded data. The results were divided into two groups. The first is related to the braking process before the bus stop. The second group is related to stopping forced by traffic conditions. The distribution of these speeds is shown in Figure 9 and Figure 10. Figure 9 concerns the braking speed before the bus stop. Figure 10 concerns braking speeds forced by traffic conditions.
The distributions shown in Figure 9 and Figure 10 differ. In the case of Figure 10, the distribution has a flattened nature. This is due to traffic conditions in traffic jams. Vehicles involved in this traffic move at low speeds and stop frequently. In the case of Figure 9, most of the braking processes are carried out from a much higher speed. Figure 11 shows the average braking speeds before a bus stop on the course as a function of the average speed on the course. Figure 12 shows the average braking speeds outside the bus stops on the course as a function of the average speed on the course.
In the case of Figure 11, there is little change in the average braking speed before a bus stop on the course from the average speed on the course. As Figure 9 shows, the majority of braking speeds before the bus stop are clustered between values of 6 m/s and 12 m/s. In Figure 12, the significant effect of the average speed on the course is seen on the average braking speed outside the bus stops on the course. When moving in a traffic jam, the vehicle moves at low speeds, hence the low braking speeds. At higher average speeds on a given course, the braking process resulting from, for example, pedestrians at a crossing or traffic lights takes place at a higher speed, close to the braking speed before the bus stop.
Figure 13 shows the distribution of decelerations during the braking process before bus stops during the period studied. Figure 14 shows the distribution of decelerations during the braking process outside the bus stops during the period studied. In the case of the decelerations of the braking process shown in Figure 13 and Figure 14, no significant differences can be seen between the distributions of these decelerations. Most of the decelerations achieved do not exceed 1.25 m/s2. This value does not cause discomfort to passengers and does not pose any threat.
Similarly to the braking speeds in Figure 11 and Figure 12, an analysis of the effect of the average speed on a given course on the average deceleration on the course was also carried out. The dependence of the average deceleration during the braking process before bus stops on a course on the average speed on a course is shown in Figure 15. The dependence of the average deceleration during the braking process outside bus stops on a course on the average speed on a course is shown in Figure 16.
Figure 15 and Figure 16 do not indicate the effect of the average speed on a given course on the average deceleration during the braking process before a bus stop and outside a bus stop.

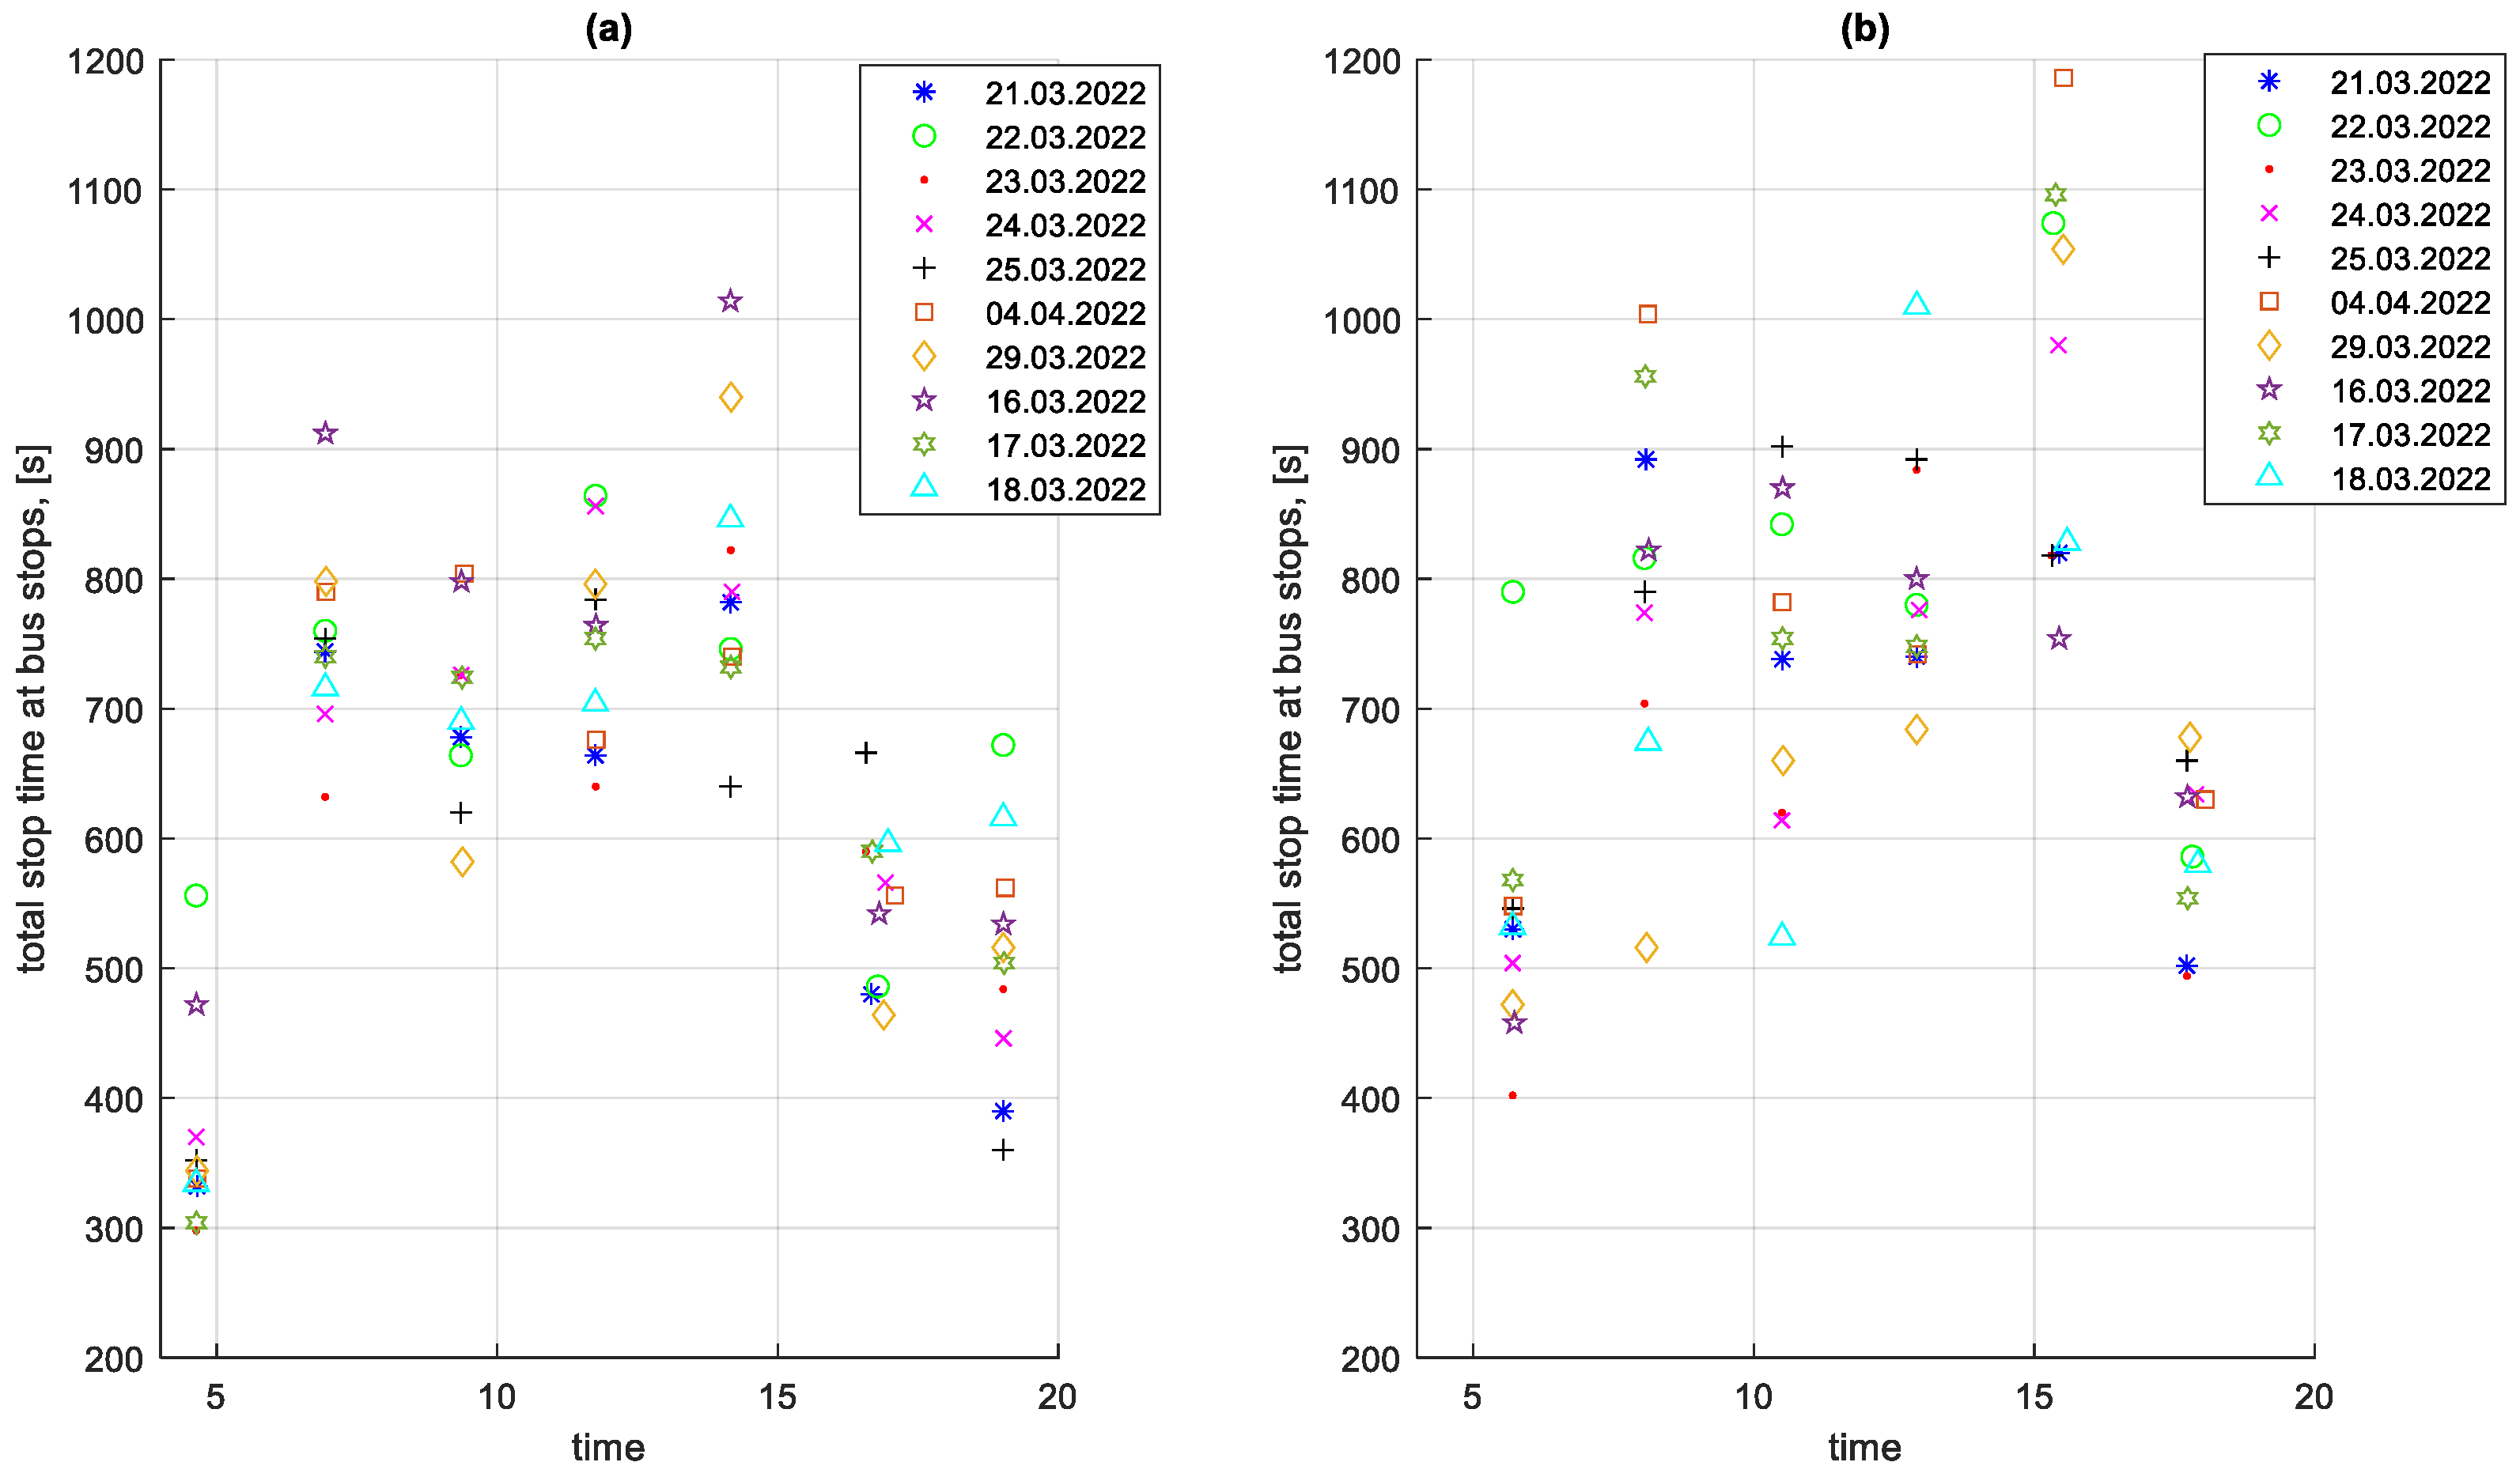
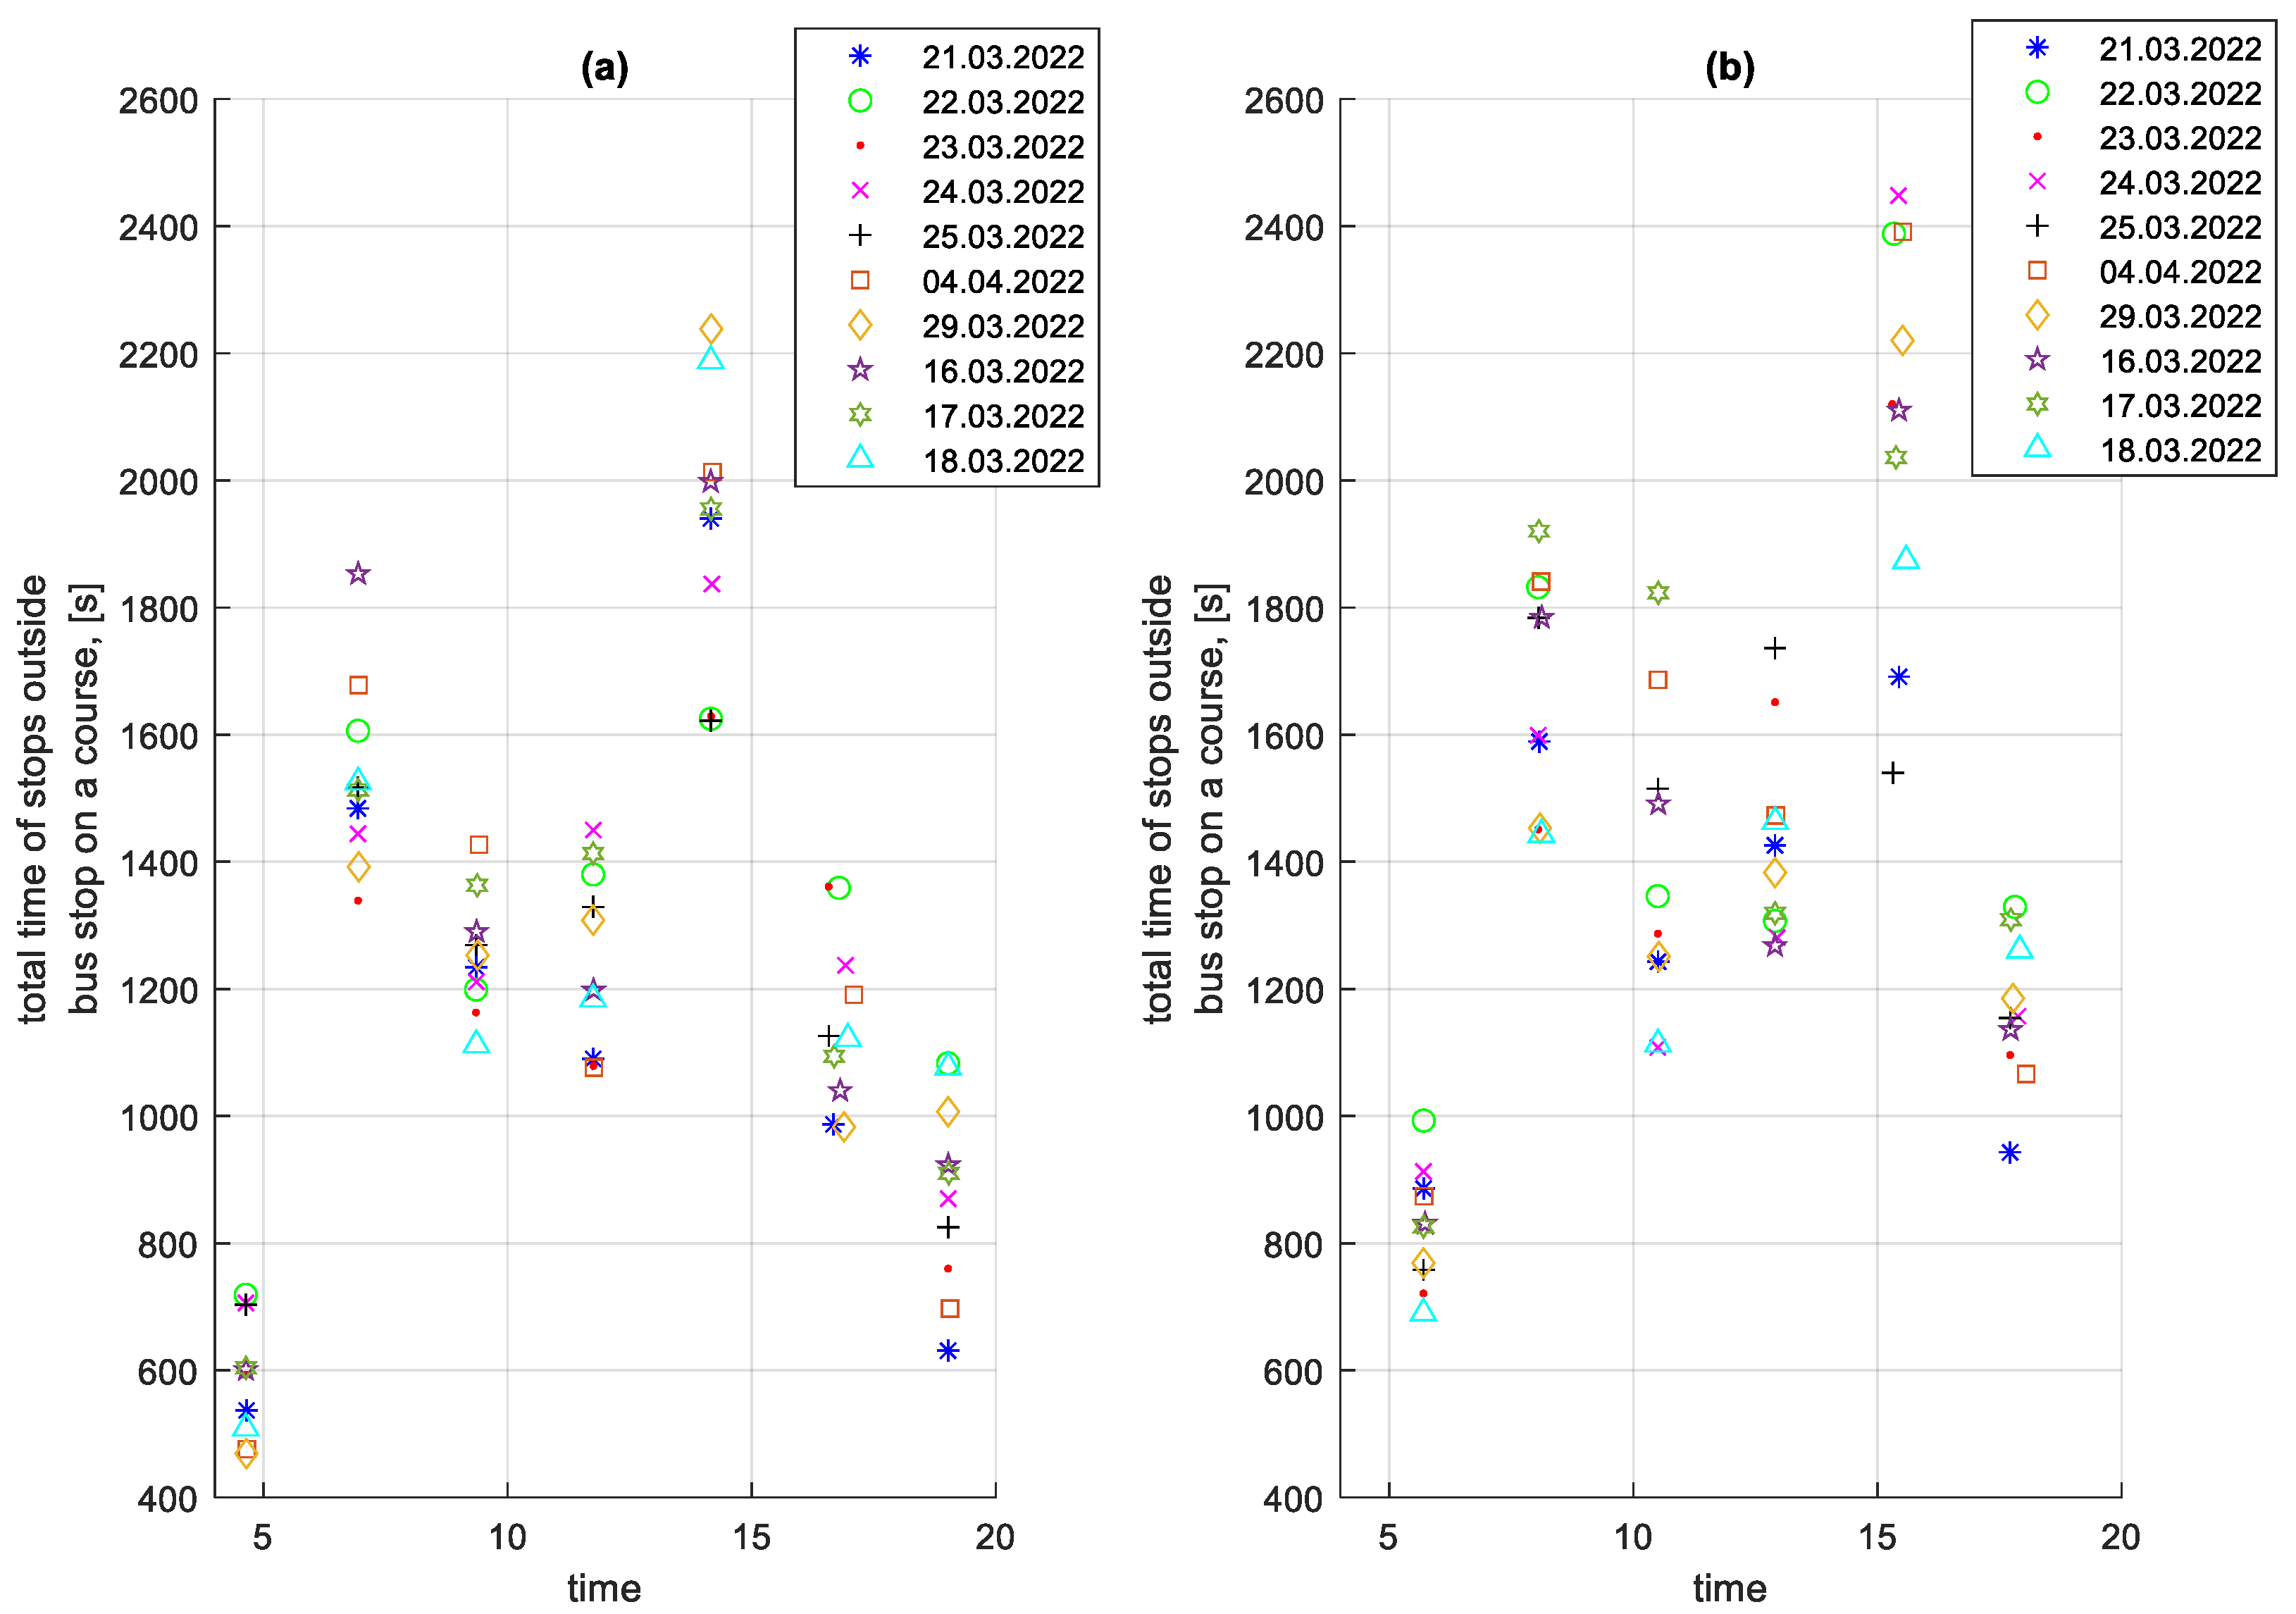
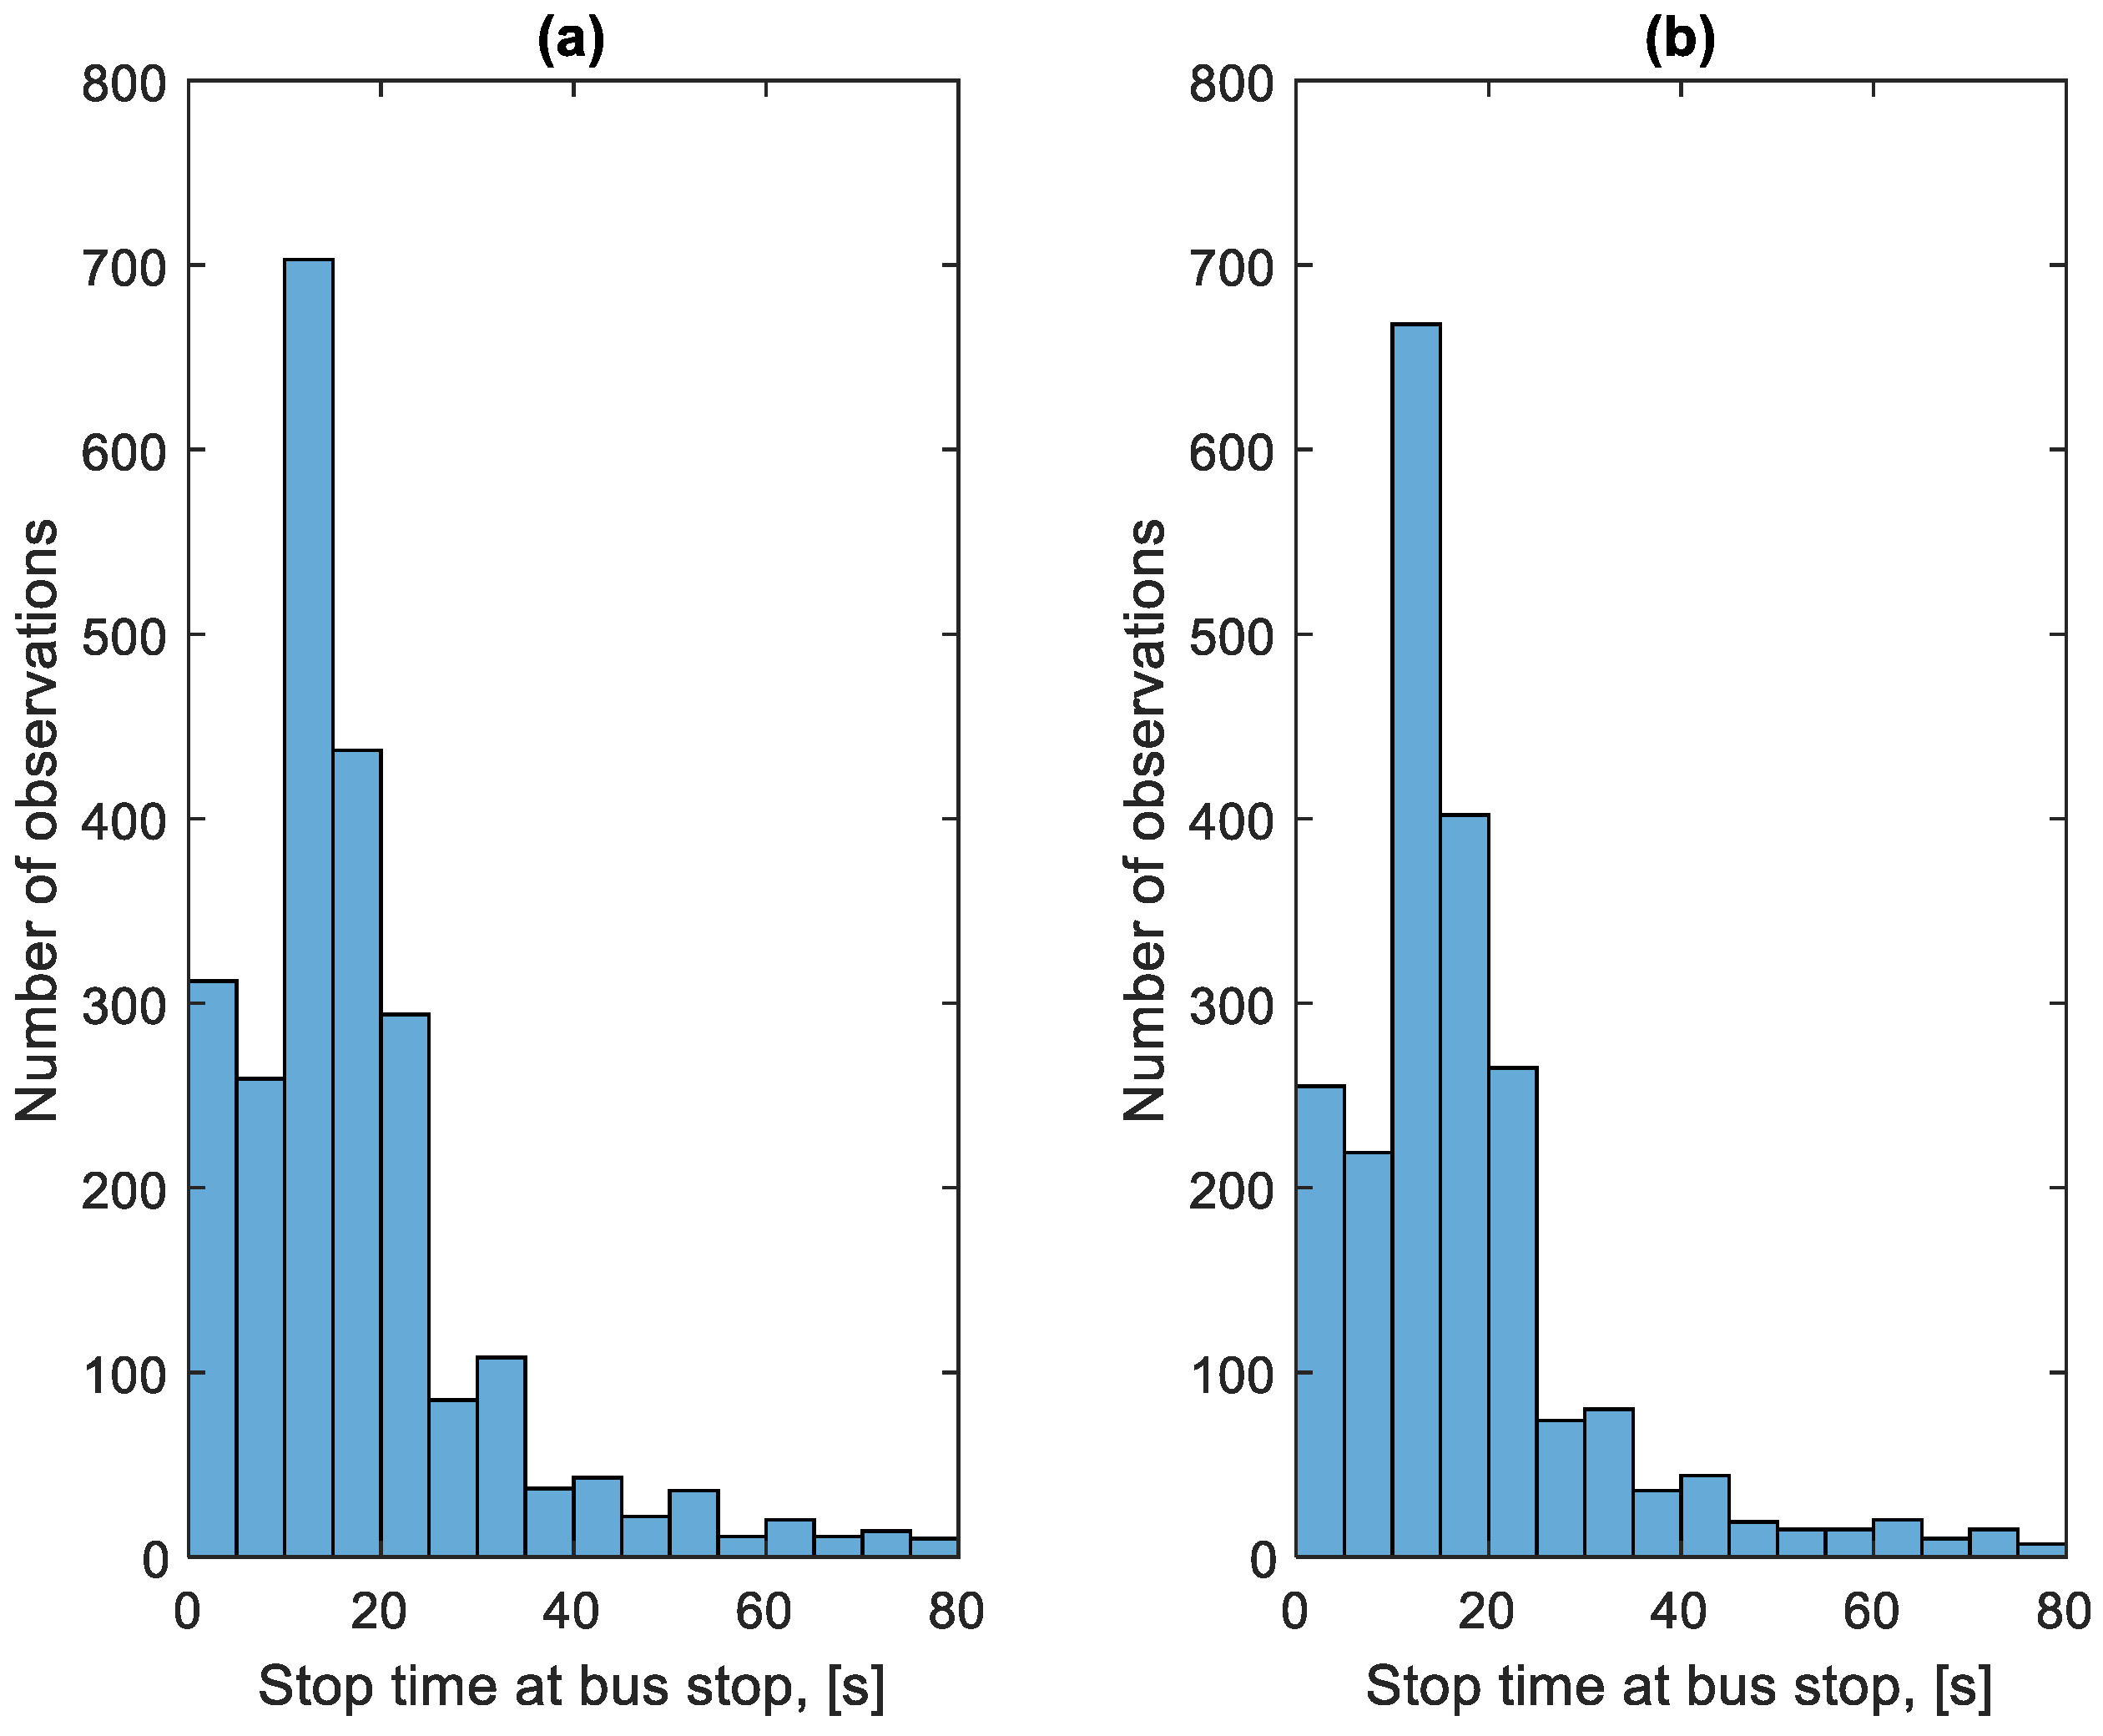
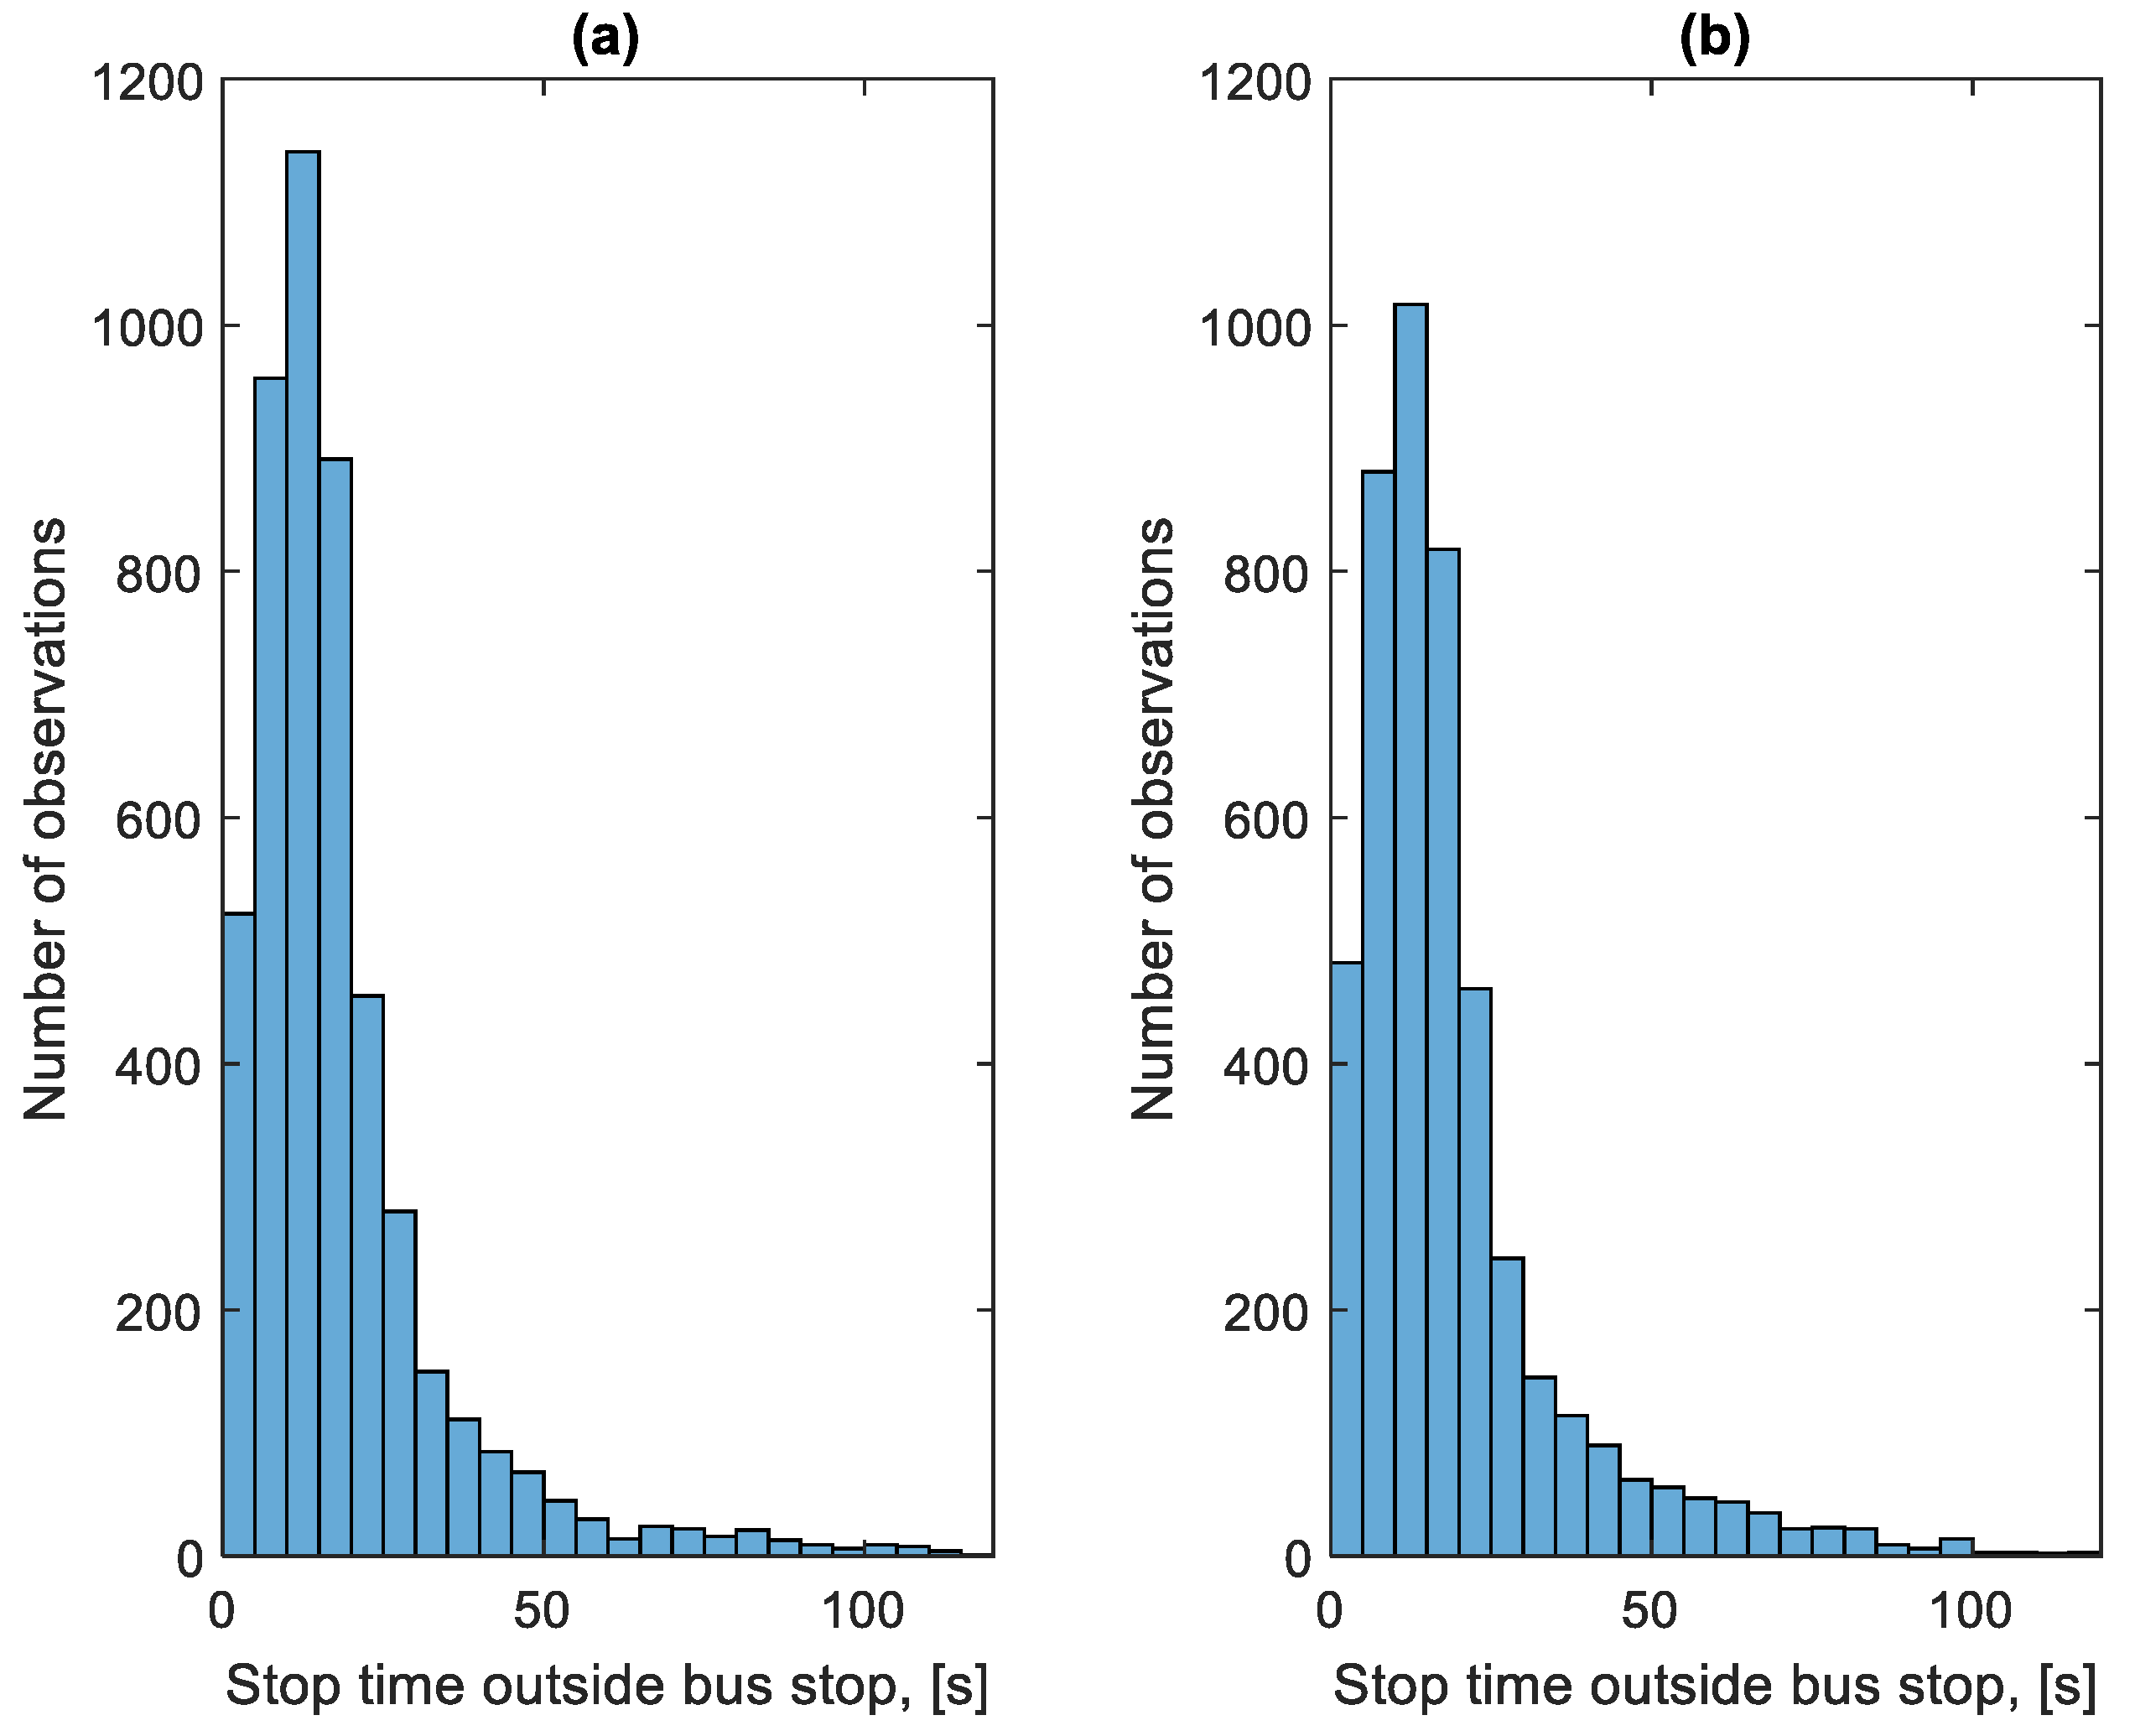
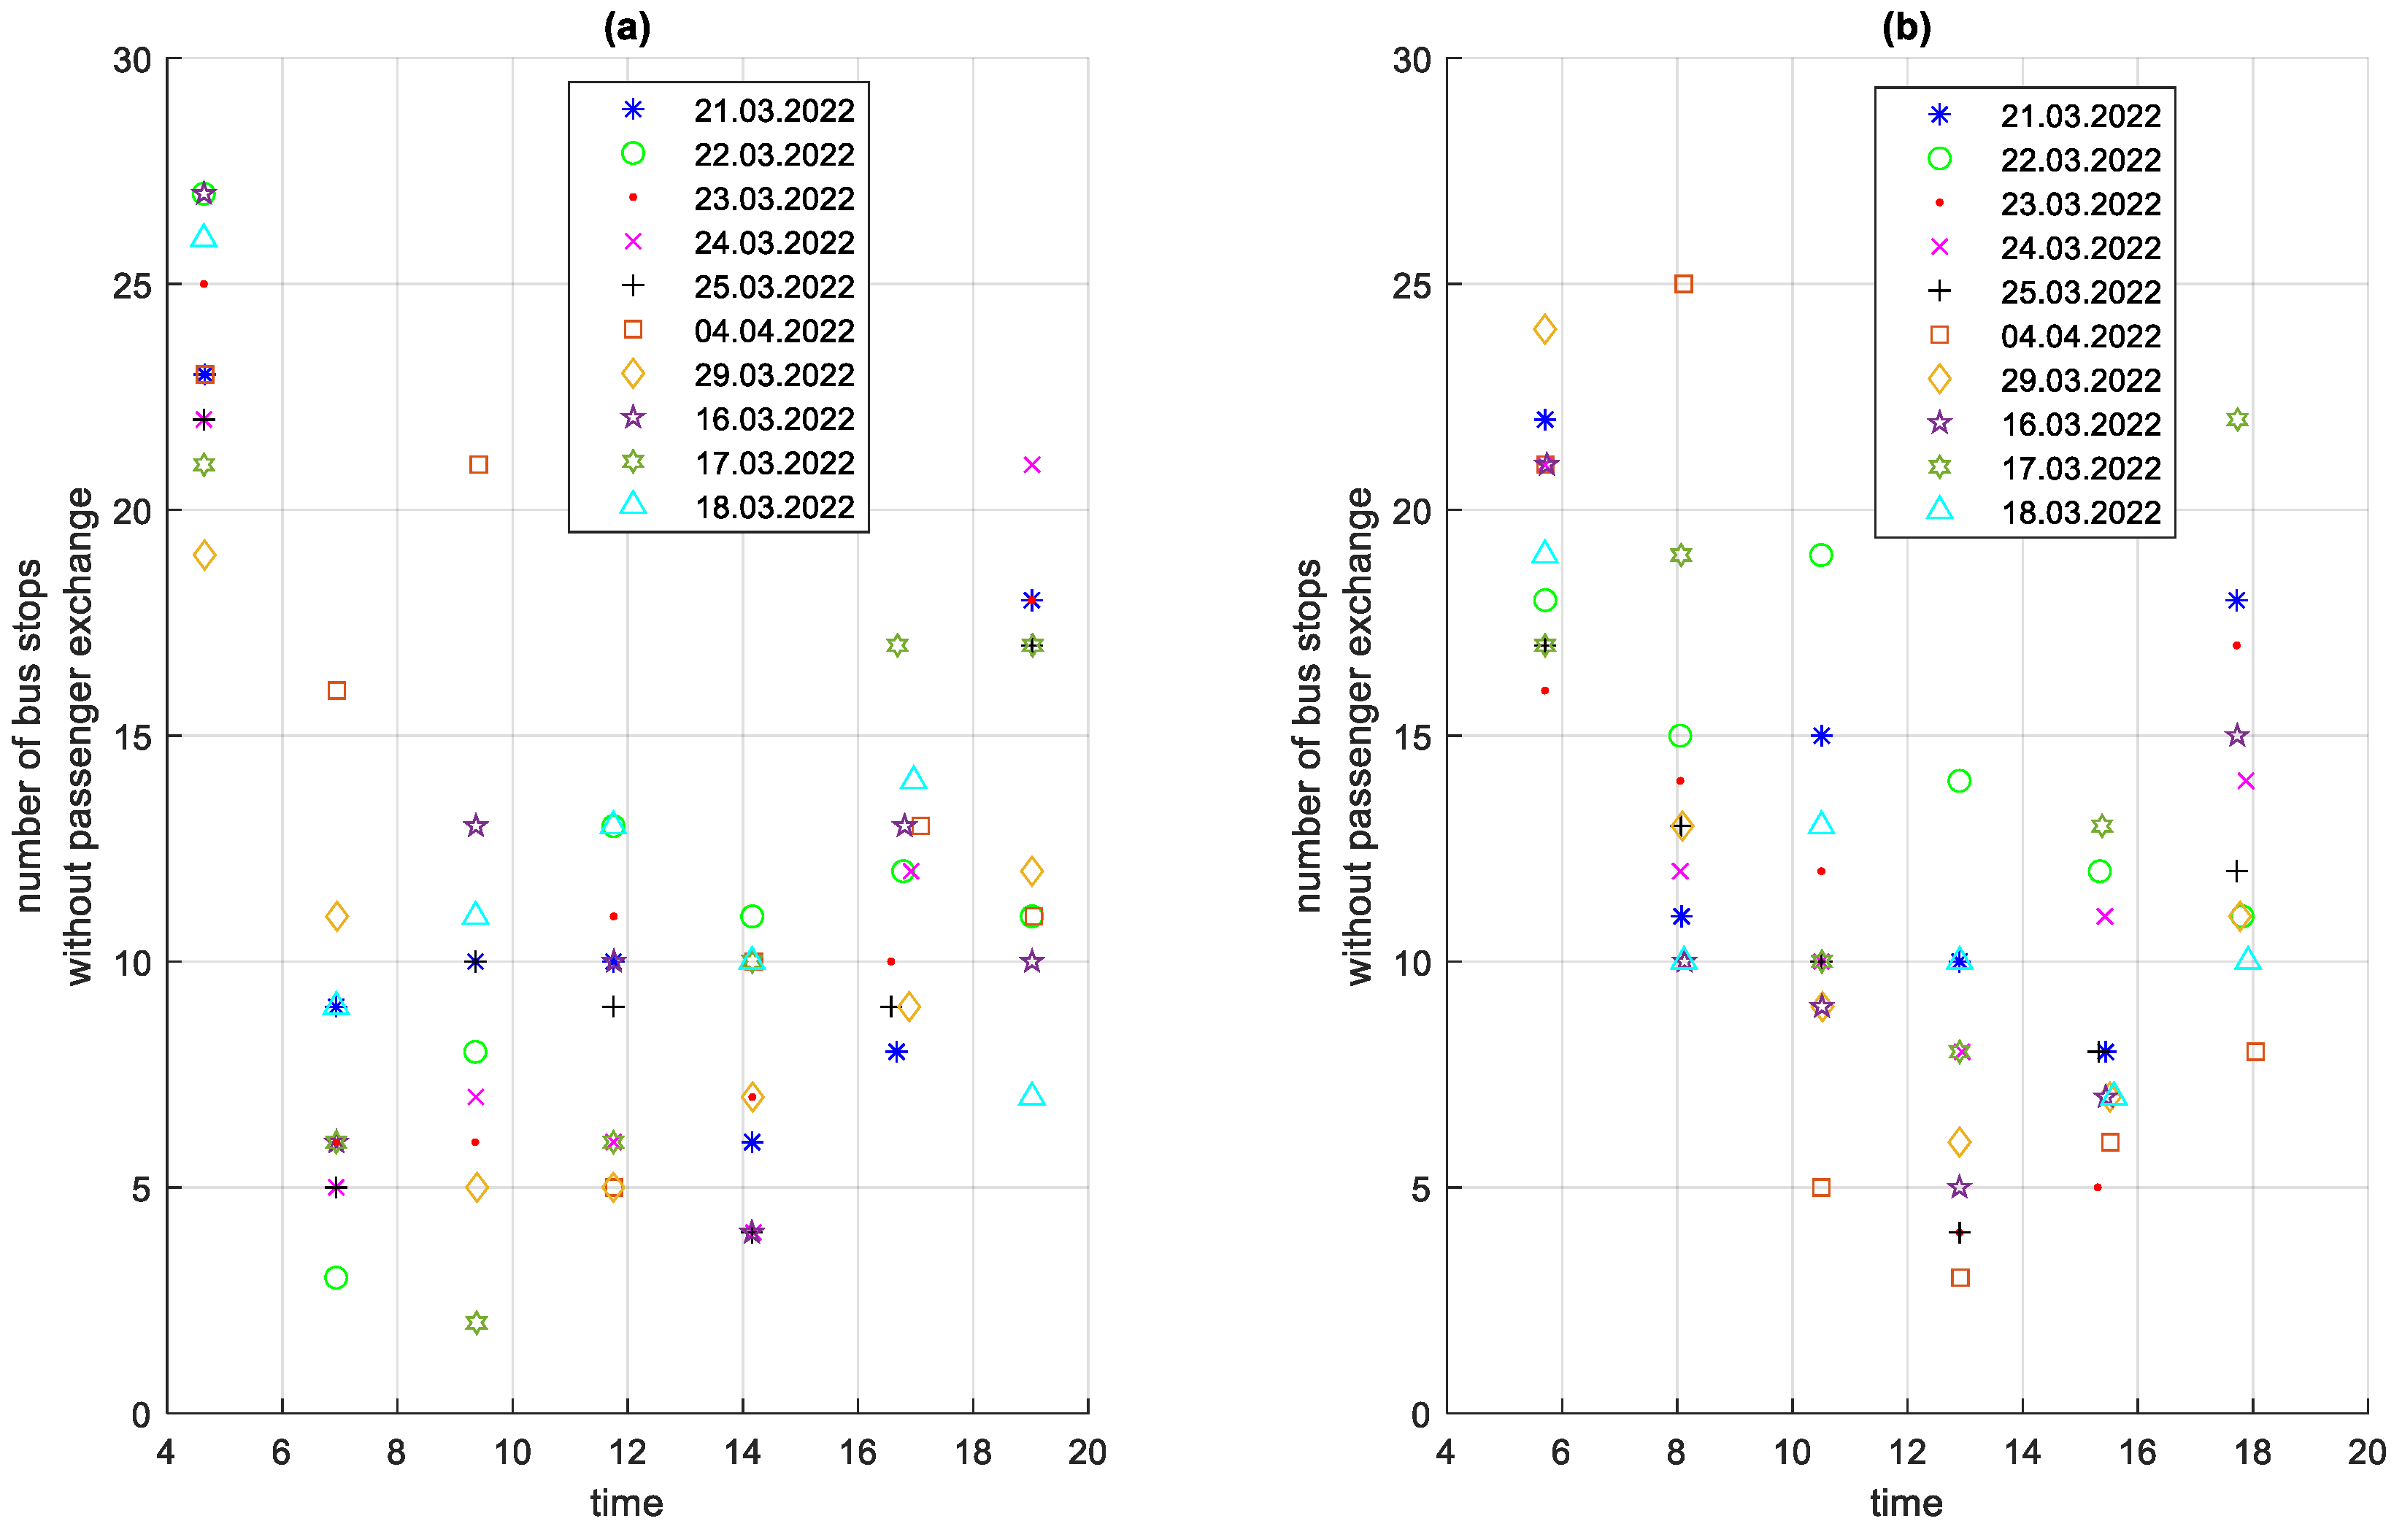
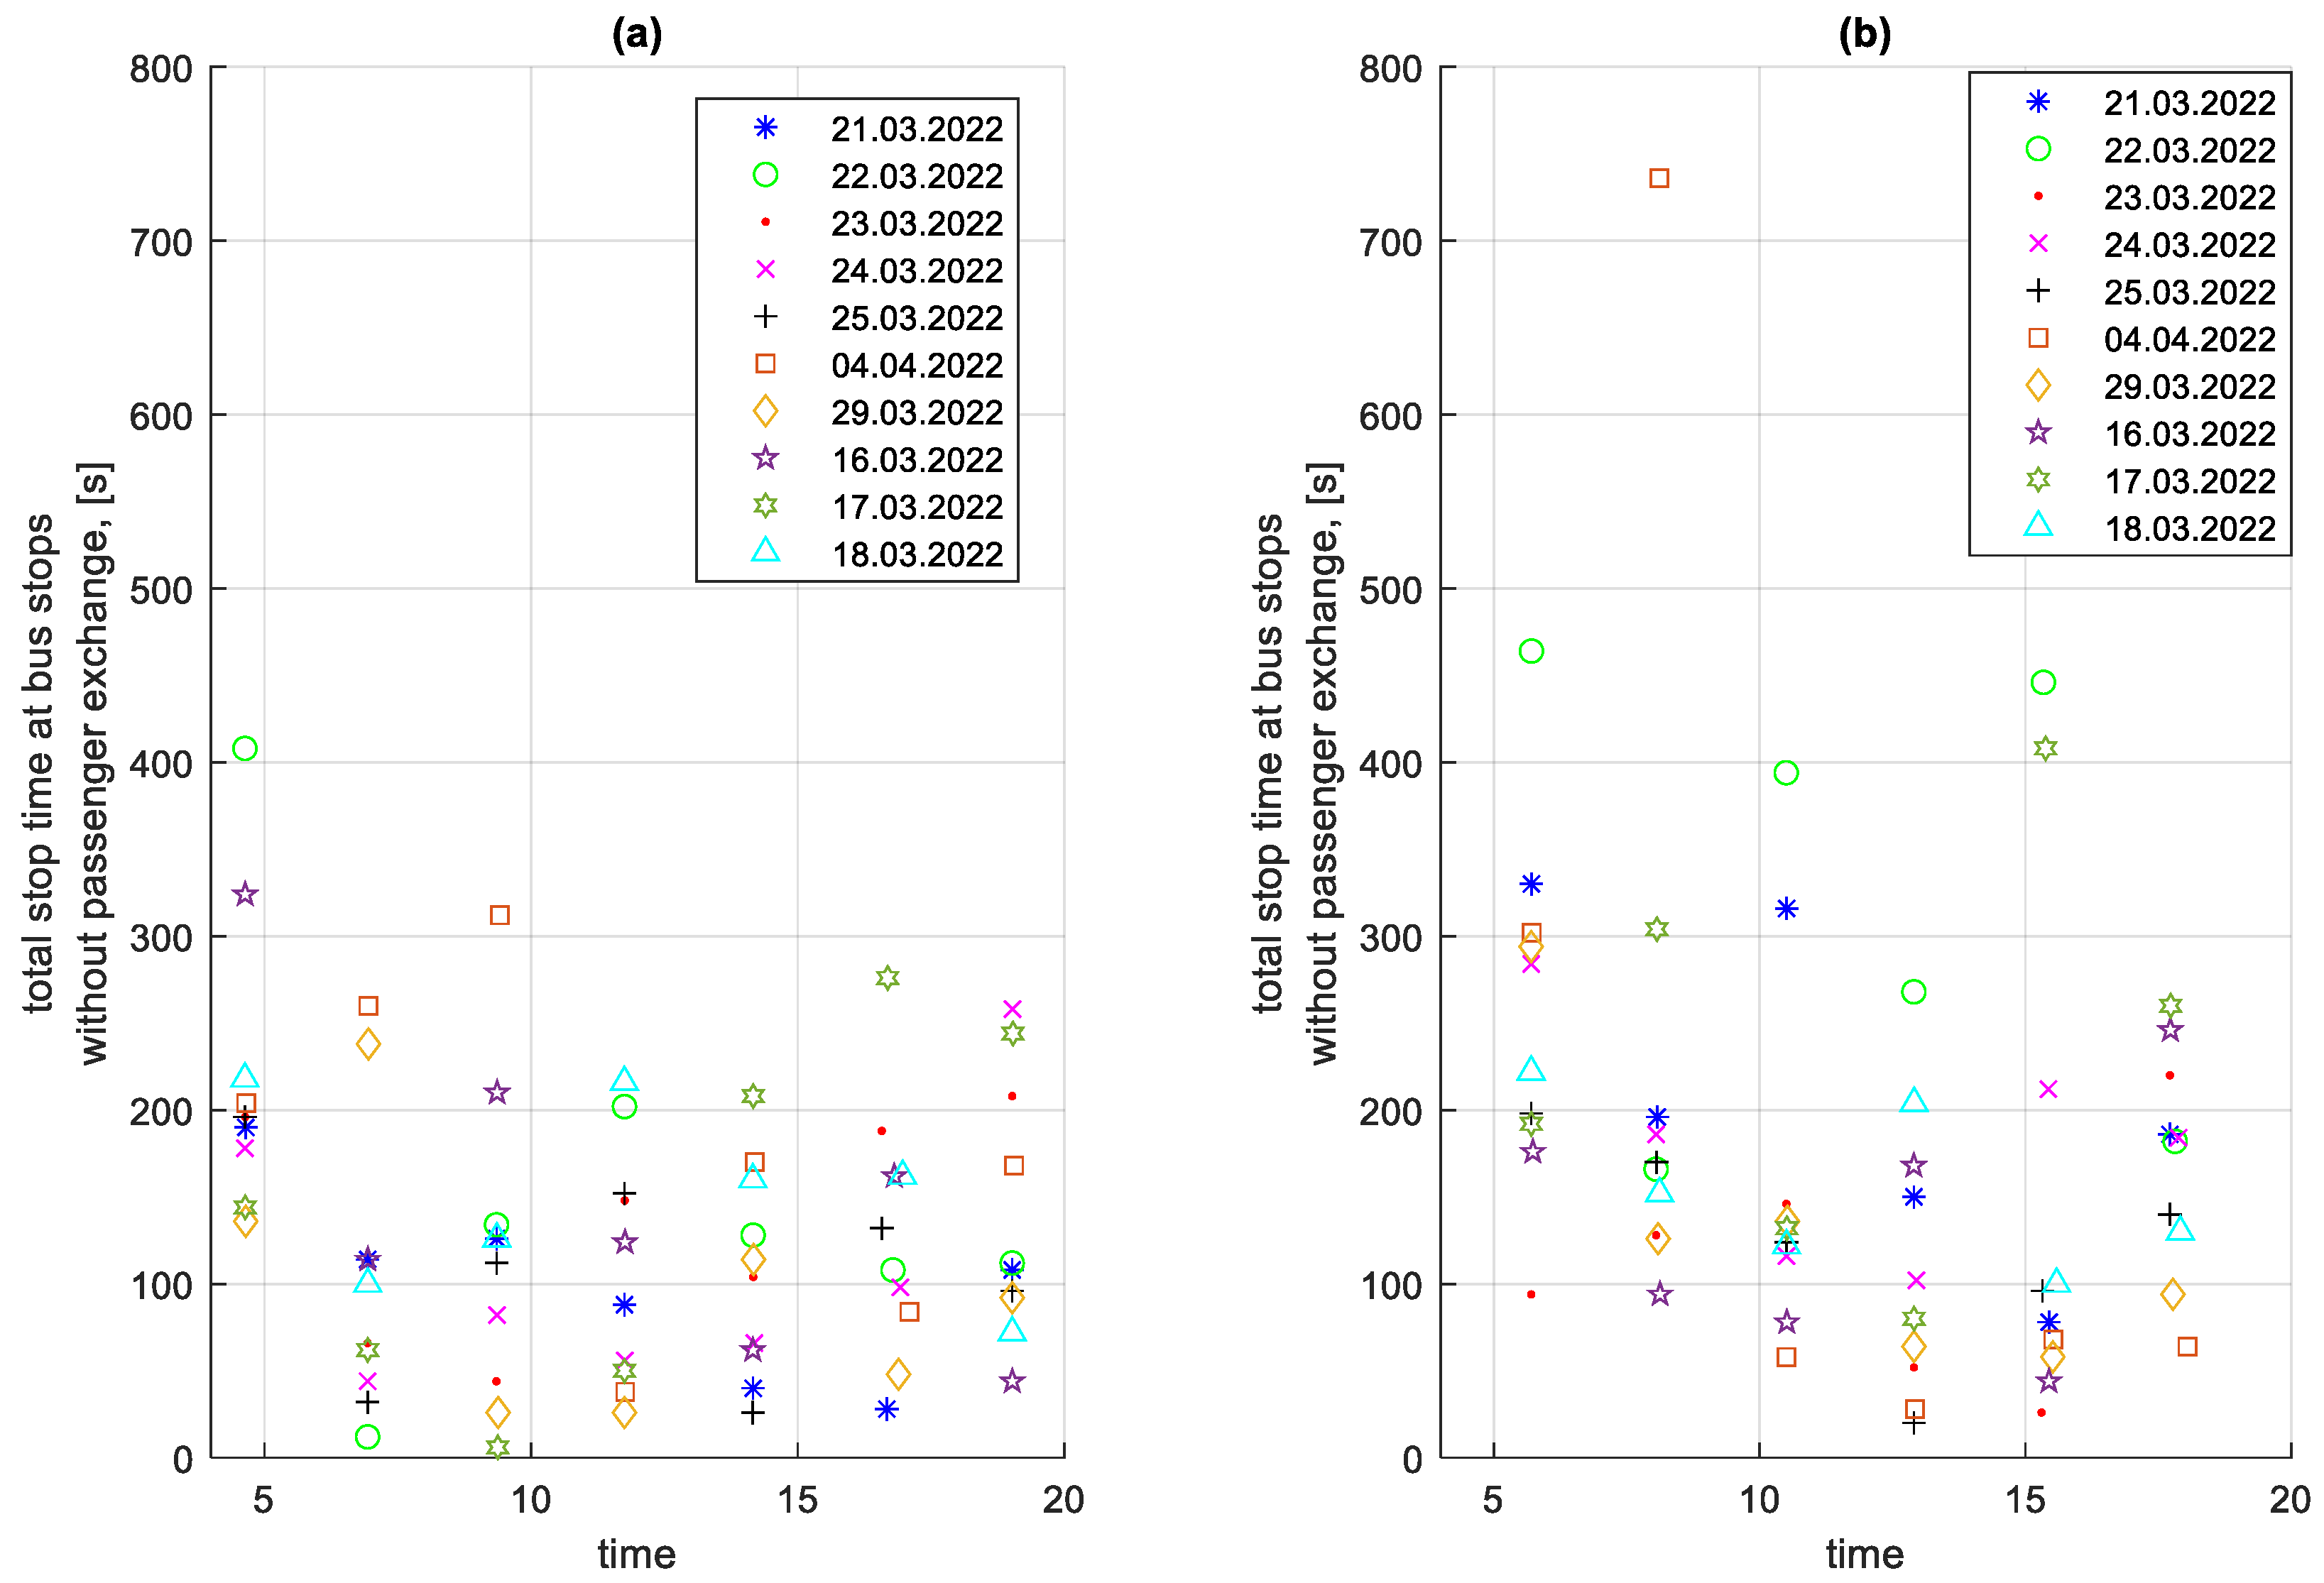
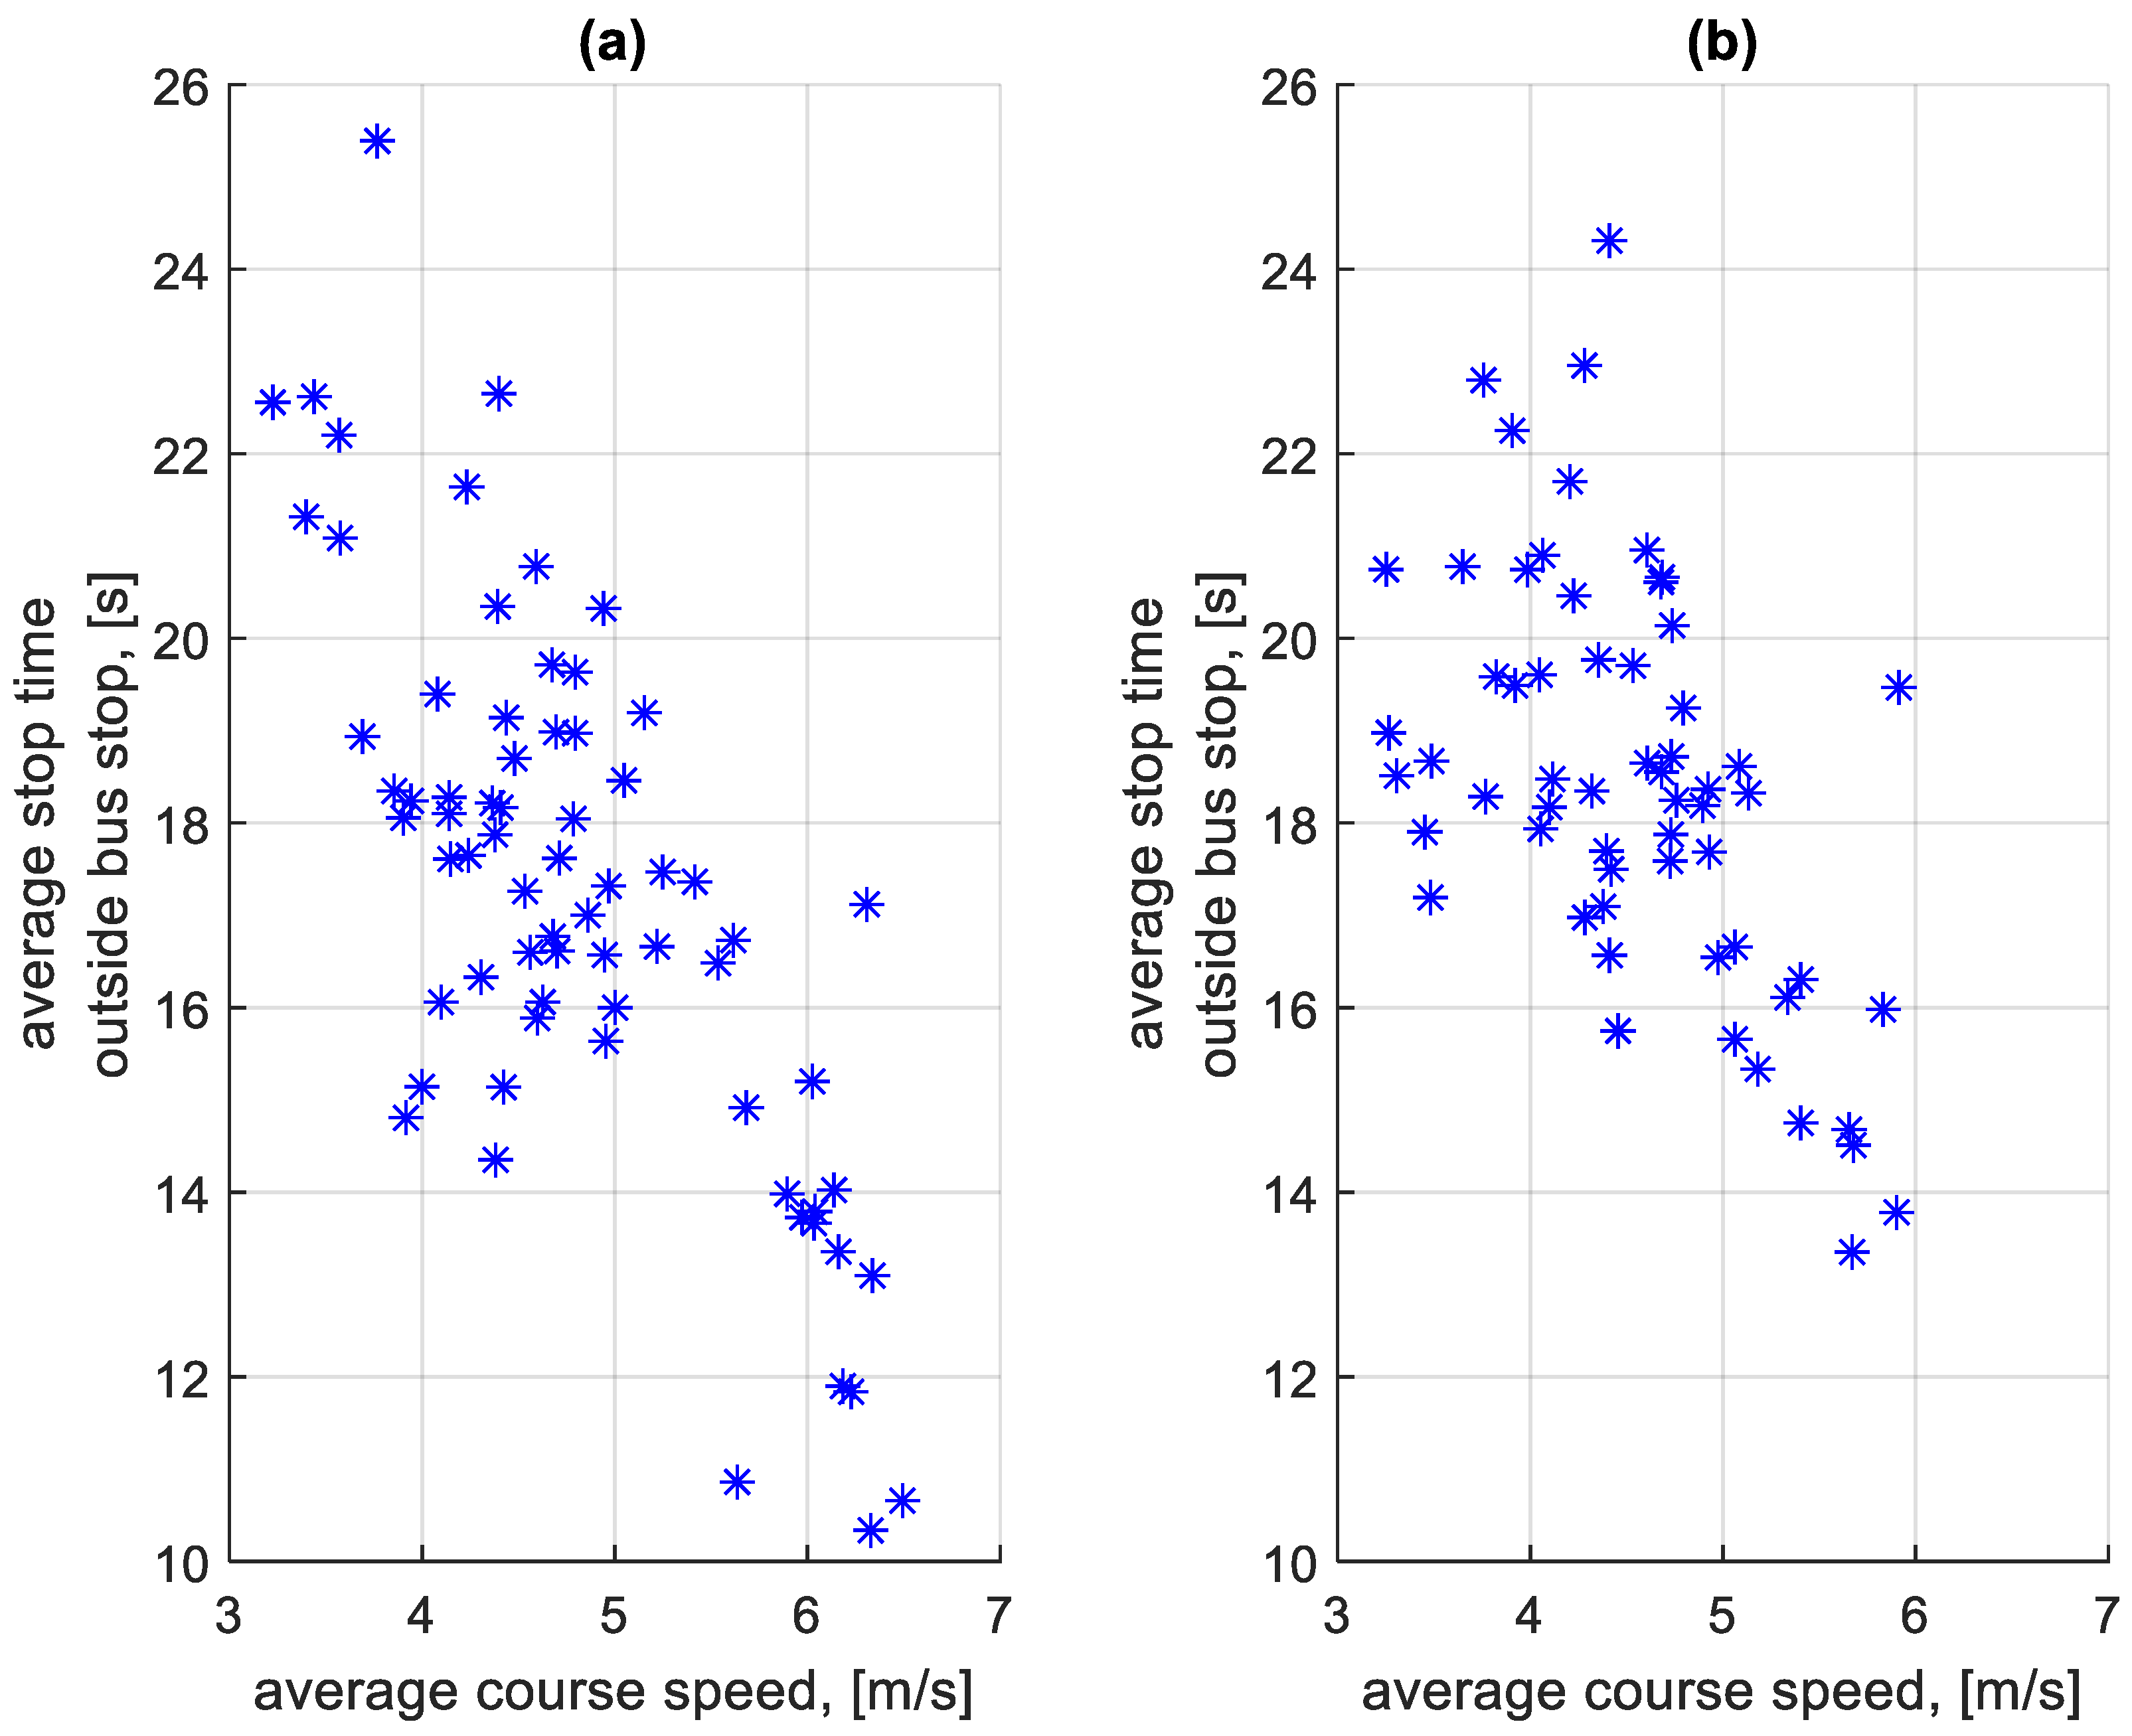
3.5. Analysis of Stop Times

An important element that affects the average speed on a given route is the stop times at and outside bus stops. In addition, these stop times contribute to increased fuel consumption. The total stop times at bus stops on a given course for the studied period are shown in Figure 17. The total stop times outside bus stops on a given course for the studied period are shown in Figure 18.
In Figure 18, the impact of rush hour on the total stop times outside bus stops for a given course is greater than on the total stop times at bus stops shown in Figure 17.
Figure 19 shows the distribution of the stop times at bus stops in the studied period. Figure 20 shows the distribution of stop times outside bus stops in the studied period.
The very low stop times of approximately 5 s are visible in Figure 19, which are unrealistic from the point of view of passenger exchange. They result from the need for the bus to stop at every bus stop, regardless of the number of passengers waiting and willing to get off. This solution is imposed by the city authorities. The number of bus stops at which there was no passenger exchange on a given route during the studied period is shown in Figure 21 and the time of stops at these bus stops is shown in Figure 22.
Figure 23 shows the dependence of the average stop times at a bus stop on a course on the average speed on a given course. Figure 24 shows the dependence of the average stop times outside a bus stop on a course on the average speed on a given course.

4. Determining Energy Consumption

4.1. Assumptions

According to part 2, the energy lost in breaking and at standstill contains two components. The first takes into account the braking speed. The second component depends on the stop time. In the calculations carried out, it was assumed that the mass of the vehicle with passengers m is equal to 13,000 kg. This is the mass of an empty bus that includes the mass of 15 passengers. The energy consumption at standstill can be determined from the stop times obtained from the analysis (Figure 19 and Figure 20) and the assumed specific fuel consumption qs. Taking into account the data obtained from the transport company and the data in the literature [5,30,31], qs was assumed to be 0.57 g/s. This represents a consumption of approximately 2.5 L/h.
The simulation took into account the work of friction forces. However, the work of the air resistance forces was not taken into account. For an average braking speed of approximately 9 m/s and an average deceleration of approximately 1 m/s2, this work amounts to approximately 1% of the kinetic energy, as shown in Figure 4b.
The speed at which a bus brakes, as well as the stop time, are not constant quantities. These quantities and, in particular, the speed at which the braking process begins, depend on many factors. Among the most relevant are the external traffic conditions and the associated average speeds on a given course.
The value of energy E b lost in the fuel is
E b = E k η n η c + E s
where
  • E b —total energy lost;
  • E k —lost kinetic energy.
E k = i = 1 n m v b i 2 2 m g f t s b
where
  • m—bus weight, m = 13,000 kg;
  • v b —the speed at which the bus brakes, m/s;
  • g—acceleration due to gravity, g = 9.81 m/s2;
  • ft—rolling resistance coefficient, ft = 0.01;
  • s b —braking distance, m;
  • η n —efficiency of the drive system, η n = 0.88 ;
  • η c —engine efficiency, η c = 0.36 ;
  • E s —energy lost during standstill.
E s = i = 1 n t i q s W u
where
  • t —bus standstill time, s;
  • q s —fuel consumption per second during standstill, g/s;
  • W u —calorific value of fuel, W u = 42 k J g .
The average energy lost per stop E b ¯ was calculated according to the formula
E b ¯ = i = 1 n E b i n
where
  • E b i —energy lost on the ith stop;
  • n—number of all stops.

4.2. Simulation of Energy Loss in the Braking Process

Using the above assumptions, a simulation of energy loss in the braking process was performed. The braking process and the standstill process were considered separately. For the calculations, the energy loss values due to the braking process and the stop time on a given course were determined for each braking separately. Figure 25 shows the dependence of the average braking energy before a bus stop on the course on the average speed on a given course. Figure 26 shows the dependence of the average braking energy outside the bus stop on the course on the average speed on a given course.
Figure 27 shows the dependence of the average standstill energy of stopping at a bus stop on a course on the average speed of a given course. Figure 28 shows the dependence of the average standstill energy of stopping outside a bus stop on a course on the average speed of a given course.

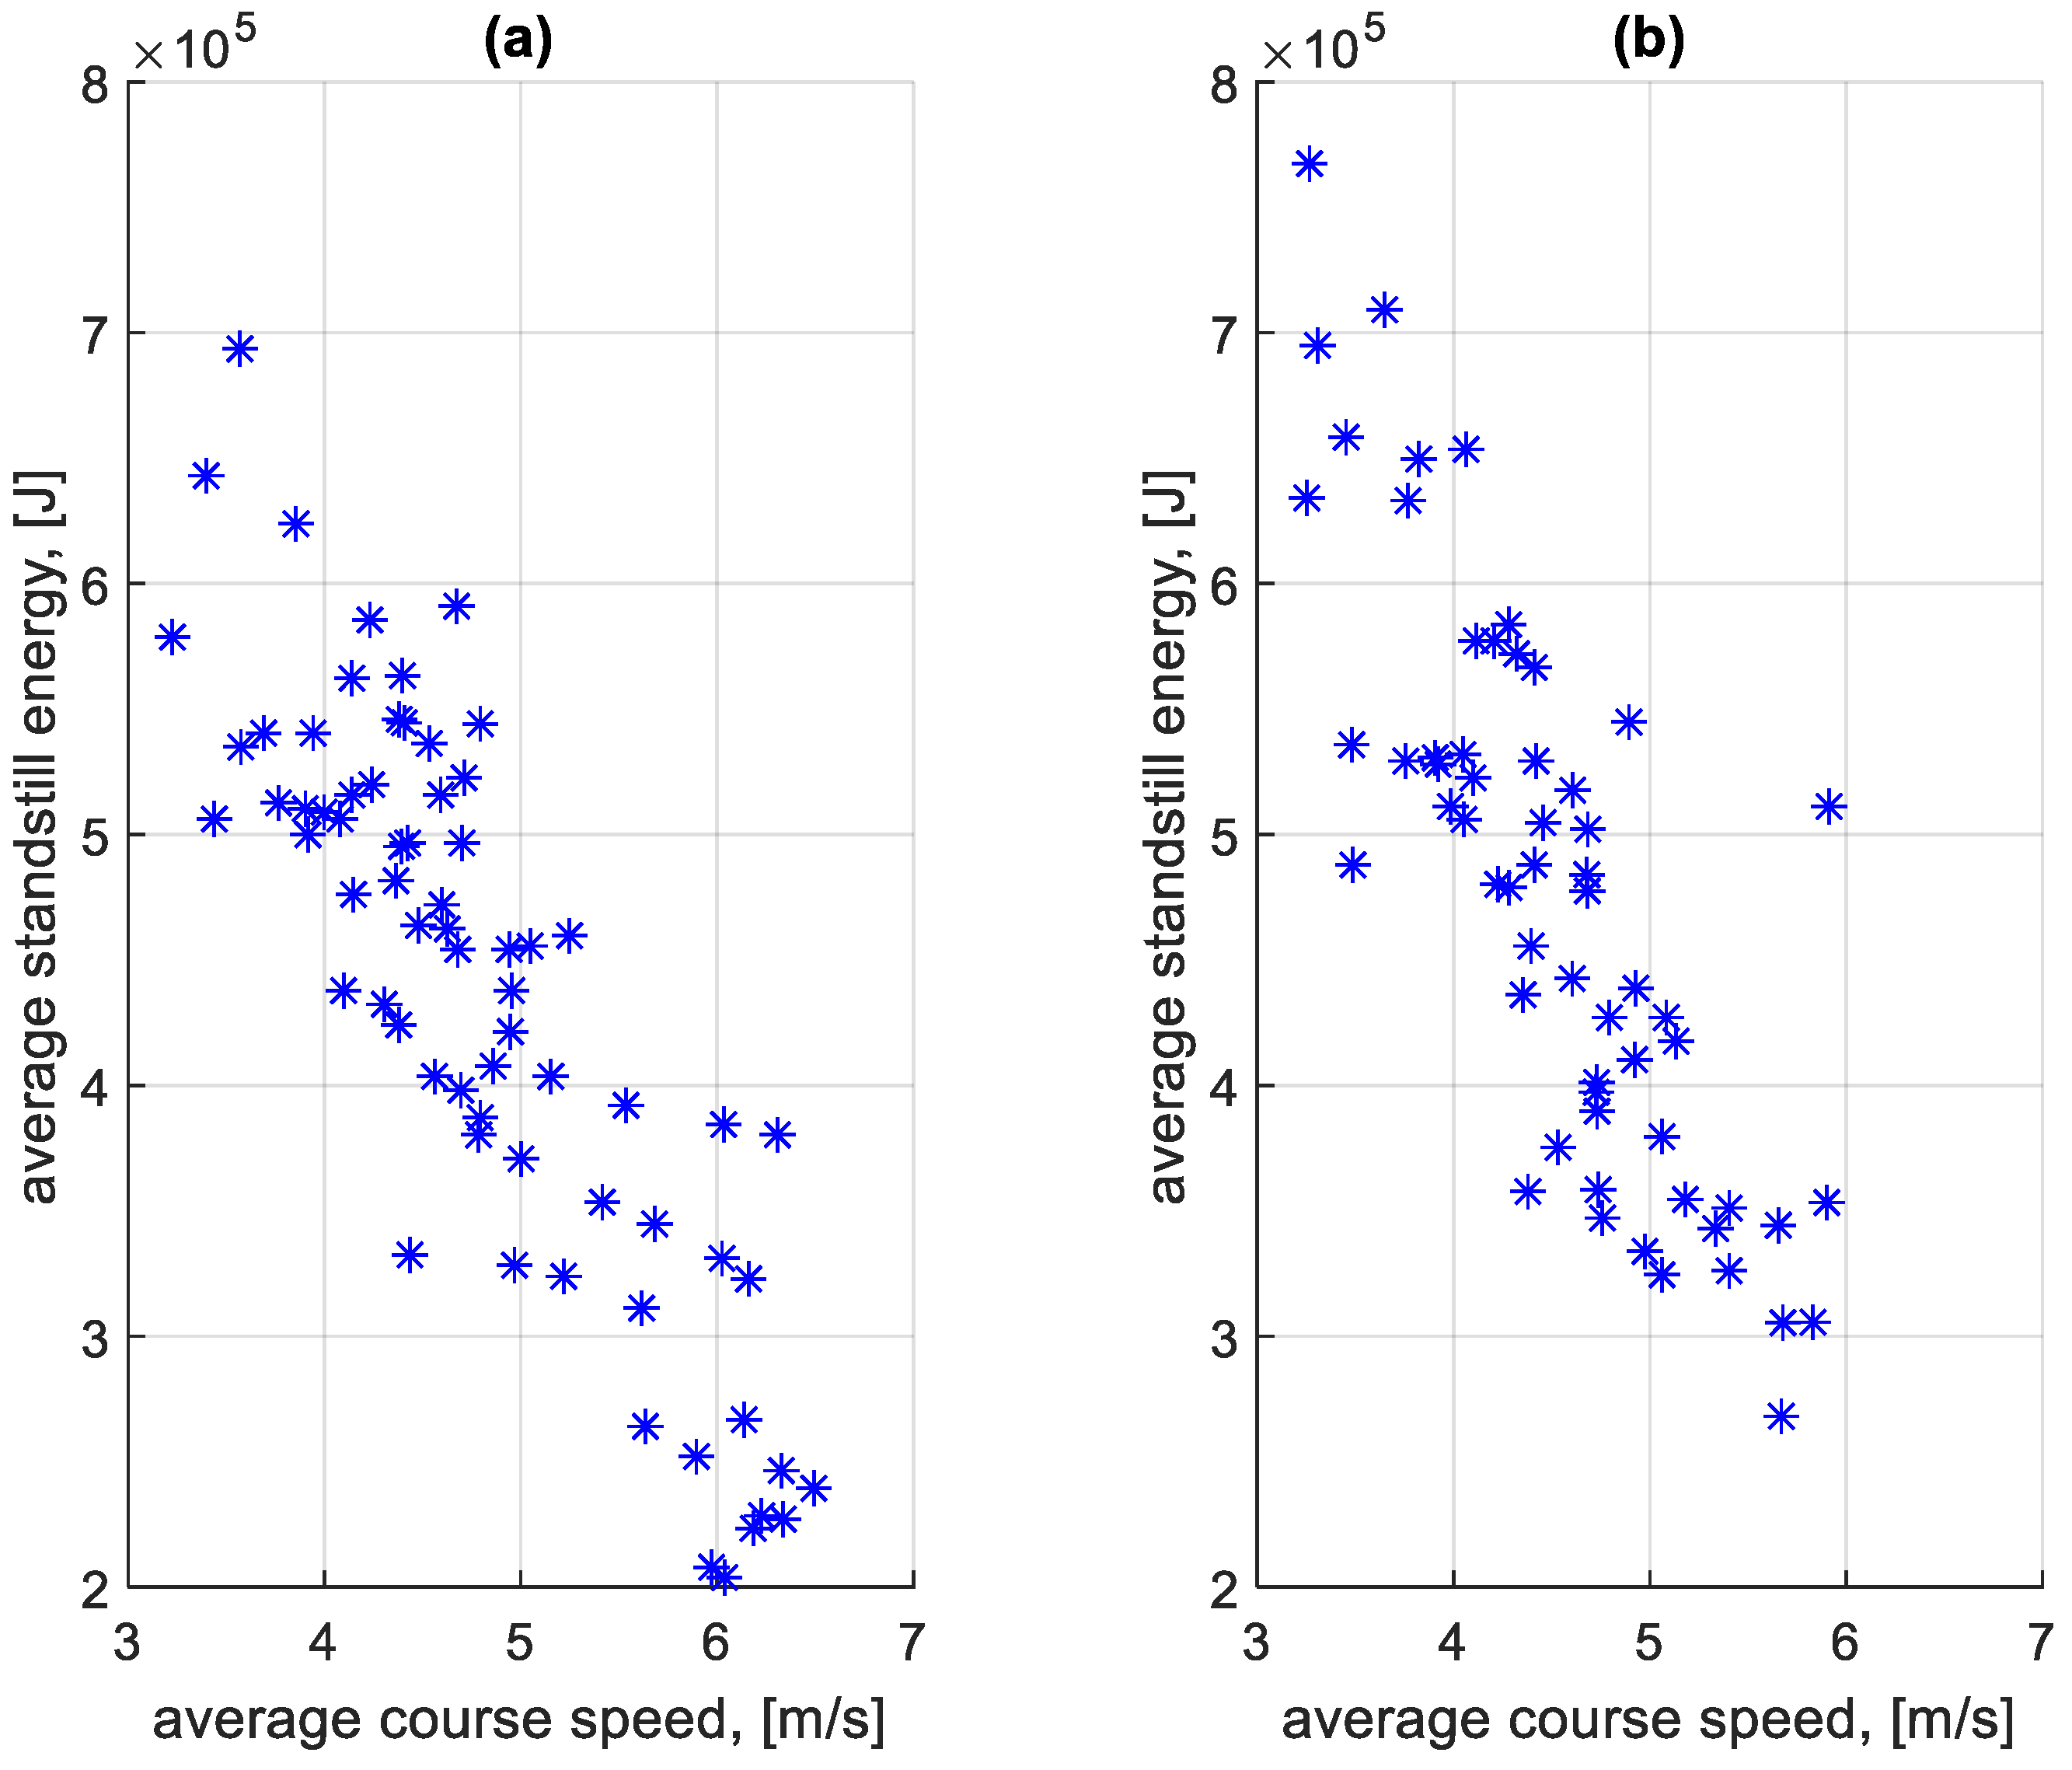
4.3. Total Energy Losses and Their Analysis

When summing the braking and standstill energy loss for each stop, the total braking and standstill energy loss was obtained. From this value calculated for each stop on a given course, the average total energy lost per stop on a given course was determined. Figure 29 shows the dependence of the average total energy lost per stop at a bus stop on a course on the average speed on a given course. Figure 30 shows the dependence of the average total energy lost per stop outside a bus stop on a course on the average speed on a given course.
Figure 31 shows the distribution of the total energy lost per stop at a bus stop. The red line presents the normal distribution of energy losses, which can be described by a Gaussian distribution function.
The average energy lost per stop at a bus stop in the direction A to B is 2.014 MJ, and in the direction B to A 1.978 MJ. During the studied period, according to data provided by the transport company, the bus was refuelled with 1020.75 L of fuel. The total energy lost during stops at bus stops in the studied period constitutes 26.15% of fuel consumption; that is, 266.97 L.
Table 1 shows the share of braking and standstill energy in the total energy lost during stops at a bus stop during the entire studied period.
Figure 32 shows the distribution of the total energy lost per stop outside a bus stop. The distribution presented in Figure 32 has a different character from the distribution in Figure 31. The bus brakes very often at low speed during a traffic jam, as can be seen in Figure 10.
The average energy lost per stop outside the bus stop in the direction A to B is 1.591 MJ, and in the direction B to A 1.578 MJ. The total energy lost during stops outside the bus stops constitutes 42.5% of the fuel consumption in the examined period; that is, 433.83 L.
Table 2 shows the shares of braking energy and standstill energy in the total energy lost during stops outside the bus stop during the entire studied period.

5. Discussion

The calculations carried out for the selected bus route showed the amount of energy lost in the process of breaking and being standstill at and outside bus stops. Within the courses analysed, the bus reached different average speeds. It can tentatively be assumed that this corresponds to the nature of operation on other routes. The amount of energy lost is an important component of the energy balance. On an average working day, the bus consumed 100 L. During the day, it made 13 courses with 473 bus stops. Fuel consumption related to stops at bus stops represents approximately 26% of total fuel consumption during the working day. The fuel consumption related to stops outside of bus stops represents approximately 42.5% of the daily fuel consumption.
The average energy lost per stop at bus stops and outside bus stops does not differ much in both directions. Traffic intensity is different in both directions, but total traffic volume is probably the same in both directions. It is indicated by almost the same average energy lost in both directions.
Most of the energy lost at stops at bus stops is braking energy. It indicates that a bus brakes from significant speed and is not standing still for long at bus stops. Most of the energy lost at stops outside of bus stops is standstill energy. It indicates that the bus spends significant time at standstill. This can be caused by traffic jams during rush hours and long waiting at intersections.
Stops at the bus stops along a given route result from the timetable. In that case, the associated energy losses do not depend on the average bus speed on a given route. The amount of these losses depends on the stop. Stop times at bus stops are determined by the number of passengers getting on and off and the number of doors. Low-floor buses with wide entrances are required on busy routes.
In order to reduce the energy consumption associated with stops at the bus stops, the number of stops could be reduced by introducing on-demand bus stops. The bus would only stop if there was a need to change passengers. Taking this into account requires further research and is part of efforts to improve existing city ITS. Those efforts should ensure the smooth running of public buses with the aim of reducing energy consumption and therefore harmful emissions. This will make public transport more environmentally friendly.

6. Conclusions

City ITS allows for smooth traffic flow and minimizes waiting time at intersections, which significantly increases the energy efficiency of vehicles in city traffic. This is especially important for public buses. Energy consumption of public buses on urban routes can be reduced by optimizing the existing network of bus stops, as well as by reducing the number of stops outside bus stops. The constant increase in the intensity of urban road traffic requires adaptive changes in the organization of road traffic and the improvement of road infrastructure through the introduction of a priority system for public transport. Such improvements of the existing ITS can be implemented only on the basis of studies of the real conditions of urban traffic, in particular, the impact of stops on a typical route of the city ITS on the energy efficiency of public buses.
The objective of this paper was to determine the energy consumption of the public bus associated with stops at bus stops and outside bus stops. Stops are an important factor of energy consumption in urban traffic. One of the main public bus routes in the city of Rzeszów was analysed. Based on the fuel consumption and GPS data, the energy model of diesel public buses was created. This model allowed the exact fuel consumption shares associated with stops at bus stops and outside bus stops to be determined. Fuel consumption shares associated with stops at bus stops and outside bus stops were determined to be 26% and 42.5%, respectively. This paper aimed to increase knowledge of how stops influence energy consumption of a public bus.
The created model was based on the movement resistance forces and energy transfer in engine and driven trains. Daily fuel consumption measurements were susceptible to errors of several litres. The method of measuring fuel consumption could be improved to reduce error to values of 1–2%.
The created model cannot be used to model losses of hybrid or battery electric buses, because the model does not take into account regenerative breaking.
As simulation studies carried out have shown, the additional energy consumption for buses related to stops outside of bus stops reaches significant values. Those values exceed the energy consumption related to stops at bus stops. These stops are the result of traffic conditions and transport infrastructure. Therefore, the reduction in the number of stops outside bus stops requires the actions of the city authorities to improve the existing ITS. Examples of such measures are changes to the traffic infrastructure consisting of separate bus lanes, adaptive changes in the organization of traffic by introducing the priority of public buses at intersections with traffic lights, and reconstruction of the road system to eliminate bottlenecks. The obtained research results are the basis for improving the ITS of the city of Rzeszow.
The second important factor is measures to reduce private vehicle traffic by taking over passenger flows by public transport. However, these measures require appropriate actions to encourage people to use public transport and the introduction of restrictions such as banning cars from entering the city centre or introducing additional entry fees.

Author Contributions

Conceptualization, M.S. and V.M.; methodology, M.S.; software, J.M.; validation, M.S. and V.M.; formal analysis, M.S.; investigation, J.M.; resources, V.M.; data curation, J.M.; writing—original draft preparation, M.S. and J.M.; writing—review and editing, V.M.; visualization, J.M.; supervision, V.M.; project administration, M.S. All authors have read and agreed to the published version of the manuscript.

Funding

This research received no external funding.

Data Availability Statement

The data presented in this study are available on request from the corresponding author due to restrictions on data made by Municipal Transport Company.

Conflicts of Interest

The authors declare no conflicts of interest.

References

  1. Zheng, X.; Zhang, L. Ecodriving for reduction of bus transit emission with vehicle’s Hybrid dynamic model. Math. Probl. Eng. 2015, 2015, 543429. [Google Scholar] [CrossRef]
  2. Alshayeb, S.; Stevanovic, A.; Effinger, J.R. Investigating impacts of various operational conditions on fuel consumption and stop penalty at signalized intersections. Int. J. Transp. Sci. Technol. 2022, 11, 690–710. [Google Scholar] [CrossRef]
  3. Abdelaty, H.; Al-Obaidi, A.; Mohamed, M.; Farag, H.E.Z. Machine learning prediction models for battery-electric bus energy consumption in transit. Transp. Res. Part D Transp. Environ. 2021, 96, 102868. [Google Scholar] [CrossRef]
  4. Grabowski, L. Modeling research of city bus fuel consumption for different driving cycles. J. Phys. Conf. Ser. 2021, 2130, 012001. [Google Scholar] [CrossRef]
  5. Frey, H.C.; Rouphail, N.M.; Zhai, H.; Farias, T.L.; Gonçalves, G.A. Comparing real-world fuel consumption for diesel- and hydrogen-fueled transit buses and implication for emissions. Transp. Res. Part D Transp. Environ. 2007, 12, 281–291. [Google Scholar] [CrossRef]
  6. Rosero, F.; Fonseca, N.; López, J.-M.; Casanova, J. Effects of passenger load, road grade, and congestion level on real-world fuel consumption and emissions from compressed natural gas and diesel urban buses. Appl. Energy 2021, 282, 116195. [Google Scholar] [CrossRef]
  7. Shahariar, G.M.H.; Bodisco, T.A.; Zare, A.; Sajjad, M.; Jahirul, M.I.; Chu Van, T.; Bartlett, H.; Ristovski, Z.; Brown, R.J. Impact of driving style and traffic condition on emissions and fuel consumption during real-world transient operation. Fuel 2022, 319, 123874. [Google Scholar] [CrossRef]
  8. Rodríguez, R.A.; Virguez, E.A.; Rodríguez, P.A.; Behrentz, E. Influence of driving patterns on vehicle emissions: A case study for latin american cities. Transp. Res. Part D Transp. Environ. 2016, 43, 192–206. [Google Scholar] [CrossRef]
  9. Wang, Y.; Boggio-Marzet, A. Evaluation of eco-driving training for fuel efficiency and emissions reduction according to Road Type. Sustainability 2018, 10, 3891. [Google Scholar] [CrossRef]
  10. Özener, O.; Özkan, M. Fuel consumption and emission evaluation of a rapid bus transport system at different operating conditions. Fuel 2020, 265, 117016. [Google Scholar] [CrossRef]
  11. Sun, R.; Chen, Y.; Dubey, A.; Pugliese, P. Hybrid electric buses fuel consumption prediction based on real-world driving data. Transp. Res. Part D Transp. Environ. 2021, 91, 102637. [Google Scholar] [CrossRef]
  12. Zhang, S.; Wu, Y.; Liu, H.; Huang, R.; Yang, L.; Li, Z.; Fu, L.; Hao, J. Real-world fuel consumption and CO2 emissions of Urban Public Buses in Beijing. Appl. Energy 2014, 113, 1645–1655. [Google Scholar] [CrossRef]
  13. Rosero, F.; Fonseca, N.; López, J.-M.; Casanova, J. Real-world fuel efficiency and emissions from an urban diesel bus engine under transient operating conditions. Appl. Energy 2020, 261, 114442. [Google Scholar] [CrossRef]
  14. Zhang, Z.; Ye, B.; Wang, S.; Ma, Y. Analysis and estimation of energy consumption of electric buses using real-world data. Transp. Res. Part D Transp. Environ. 2024, 126, 104017. [Google Scholar] [CrossRef]
  15. Ji, J.; Bie, Y.; Zeng, Z.; Wang, L. Trip Energy Consumption Estimation for electric buses. Commun. Transp. Res. 2022, 2, 100069. [Google Scholar] [CrossRef]
  16. Ghaffarpasand, O.; Talaie, M.R.; Ahmadikia, H.; Khozani, A.T.; Shalamzari, M.D.; Majidi, S. Real-world assessment of Urban Bus Transport in a medium-sized city of the Middle East: Driving behavior, emission performance, and Fuel Consumption. Atmos. Pollut. Res. 2021, 12, 113–124. [Google Scholar] [CrossRef]
  17. Ma, X.; Miao, R.; Wu, X.; Liu, X. Examining influential factors on the energy consumption of electric and diesel buses: A data-driven analysis of large-scale public transit network in Beijing. Energy 2021, 216, 119196. [Google Scholar] [CrossRef]
  18. Wang, A.; Ge, Y.; Tan, J.; Fu, M.; Shah, A.N.; Ding, Y.; Zhao, H.; Liang, B. On-road pollutant emission and fuel consumption characteristics of buses in Beijing. J. Environ. Sci. 2011, 23, 419–426. [Google Scholar] [CrossRef]
  19. de Abreu e Silva, J.; Moura, F.; Garcia, B.; Vargas, R. Influential vectors in fuel consumption by an urban bus operator: Bus route, driver behavior or vehicle type? Transp. Res. Part D Transp. Environ. 2015, 38, 94–104. [Google Scholar] [CrossRef]
  20. Macián, V.; Tormos, B.; Ruíz, S.; Ramírez, L. Potential of low viscosity oils to reduce CO2 emissions and fuel consumption of urban buses fleets. Transp. Res. Part D Transp. Environ. 2015, 39, 76–88. [Google Scholar] [CrossRef]
  21. Li, P.; Zhang, Y.; Zhang, Y.; Zhang, K.; Jiang, M. The effects of dynamic traffic conditions, route characteristics and environmental conditions on trip-based electricity consumption prediction of electric bus. Energy 2021, 218, 119437. [Google Scholar] [CrossRef]
  22. Yang, X.; Liu, L. Analysis of the influence of passenger load on bus energy consumption a vehicle-engine combined model-based simulation framework. Sci. Rep. 2022, 12, 14535. [Google Scholar] [CrossRef] [PubMed]
  23. Abdelaty, H.; Mohamed, M. A prediction model for battery electric bus energy consumption in transit. Energies 2021, 14, 2824. [Google Scholar] [CrossRef]
  24. Stankiewicz, J.; Michalski, K. Rozwiązania Z Zakresu Inteligentnych systemów transportowych W Wybranych Miastach w Polsce. Ekon. I Organ. Logistyki 2018, 3, 79–91. [Google Scholar] [CrossRef]
  25. W Rzeszowie na Wszystkich Skrzyżowaniach Z Sygnalizacją Świetlną będą Detektory Ruchu. (In Polish). Available online: https://nowiny24.pl/w-rzeszowie-na-wszystkich-skrzyzowaniach-z-sygnalizacja-swietlna-beda-detektory-ruchu/ar/c4-16359805 (accessed on 24 April 2024).
  26. Kilka Słów O Rzeszowskim inteligentnym Systemie Transportowym: Wiadomości: Focus on Business—Created by Pro Progressio. (In Polish). Available online: https://focusonbusiness.eu/pl/wiadomosci/kilka-slow-o-rzeszowskim-inteligentnym-systemie-transportowym/11213 (accessed on 24 April 2024).
  27. Śmieszek, M.; Mateichyk, V. Determining the fuel consumption of a public city bus in urban traffic. IOP Conf. Ser. Mater. Sci. Eng. 2021, 1199, 012080. [Google Scholar] [CrossRef]
  28. Smieszek, M.; Kostian, N.; Mateichyk, V.; Mosciszewski, J.; Tarandushka, L. Estimation of the public transport operating performance: Example of a selected city bus route. Commun.-Sci. Lett. Univ. Zilina 2023, 25, B7–B21. [Google Scholar] [CrossRef]
  29. Śmieszek, M.; Kostian, N.; Mateichyk, V.; Mościszewski, J.; Tarandushka, L. Determination of the model basis for assessing the vehicle energy efficiency in urban traffic. Energies 2021, 14, 8538. [Google Scholar] [CrossRef]
  30. Wang, J.; Rakha, H.A. Fuel consumption model for conventional diesel buses. Appl. Energy 2016, 170, 394–402. [Google Scholar] [CrossRef]
  31. Rahman, S.M.A.; Masjuki, H.H.; Kalam, M.A.; Abedin, M.J.; Sanjid, A.; Sajjad, H. Impact of idling on fuel consumption and exhaust emissions and available idle-reduction technologies for diesel vehicles—A Review. Energy Convers. Manag. 2013, 74, 171–182. [Google Scholar] [CrossRef]
Figure 1. System of forces acting on an accelerating vehicle moving on a horizontal surface (Fb—inertia force, Fp—air resistance force, Ft—rolling resistance force, Fn—driving force, Q—vehicle weight, Mn—driving torque, v—vehicle speed).
Energies 17 04179 g001
Figure 2. Theoretical driving cycle between stops (ta—acceleration time, tu—steady-state motion time, tb—braking time, ts—stop time, tc—cycle time).
Energies 17 04179 g002
Figure 3. The ratio of the work of the motion resistance forces to the kinetic energy Ek at the start of braking for different values of deceleration ab (vb—the speed at which braking is initiated), (a) the ratio of the work Wt of the rolling resistance forces to the kinetic energy Ek, (b) the ratio of the work Wp of the air resistance forces to the kinetic energy Ek.
Energies 17 04179 g003
Figure 4. Diagram of the route no. 13: (a) direction A to B; (b) direction B to A.
Energies 17 04179 g004
Figure 5. Total number of stops on courses in the analysed period depending on the time of the start of the course: (a) direction A to B; (b) direction B to A.
Energies 17 04179 g005
Figure 6. Bus speed profile for a selected working day: (a) from the entire day; (b) from the selected section.
Energies 17 04179 g006
Figure 7. Course durations in the studied period depending on the time of the start of the course: (a) in the direction A to B; (b) in the B to A direction.
Energies 17 04179 g007
Figure 8. Graph of bus speed from two selected parts of the route between bus stops (va—acceleration speed after the stop, vb—braking speed before the stop): (a)—morning rush hour, (b)—afternoon rush hour.
Energies 17 04179 g008
Figure 9. Distribution of braking speeds before the bus stop in the studied period: (a) in the direction A to B; (b) in the B to A direction.
Energies 17 04179 g009
Figure 10. Distribution of braking speeds forced by traffic conditions in the studied period: (a) in the direction A to B; (b) in the B to A direction.
Energies 17 04179 g010
Figure 11. Average braking speed before bus stop on a course depending on the average speed on a given course: (a) in the direction A to B; (b) in the B to A direction.
Energies 17 04179 g011
Figure 12. Average braking speed outside bus stops on a course depending on the average speed on a given course: (a) in the direction A to B; (b) in the B to A direction.
Energies 17 04179 g012
Figure 13. Distribution of decelerations during braking before a bus stop: (a) in the direction A to B; (b) in the B to A direction.
Energies 17 04179 g013
Figure 14. Distribution of decelerations during braking outside the bus stop: (a) in the direction A to B; (b) in the B to A direction.
Energies 17 04179 g014
Figure 15. Average decelerations during braking before bus stops on a course depending on the average speed on a given course: (a) in the direction A to B; (b) in the B to A direction.
Energies 17 04179 g015
Figure 16. Average decelerations during braking outside bus stops on a course depending on the average speed on a given course: (a) in the direction A to B; (b) in the B to A direction.
Energies 17 04179 g016
Figure 17. Total stop times at bus stops on a given course depending on the time of the start of the course: (a) in the direction A to B; (b) in the B to A direction.
Energies 17 04179 g017
Figure 18. Total stop times outside bus stops on a given course depending on the time of the start of the course; (a) in the direction A to B: (b) in the B to A direction.
Energies 17 04179 g018
Figure 19. Distribution of stop times at bus stops: (a) in the direction A to B; (b) in the B to A direction.
Energies 17 04179 g019
Figure 20. Distribution of stop times outside bus stops: (a) in the direction A to B; (b) in the B to A direction.
Energies 17 04179 g020
Figure 21. Number of bus stops without passenger exchange on a given course depending on the time of the start of the course: (a) in the direction A to B; (b) in the B to A direction.
Energies 17 04179 g021
Figure 22. Total stop times at bus stops without passenger exchange on a given course; (a) in the direction A to B; (b) in the B to A direction.
Energies 17 04179 g022
Figure 23. Average stop times at a bus stop on a course depending on the average speed on a given course: (a) in the direction A to B; (b) in the B to A direction.
Energies 17 04179 g023
Figure 24. Average stop times outside the bus stop on a course depending on the average speed on a given course: (a) in the direction A to B; (b) in the B to A direction.
Energies 17 04179 g024
Figure 25. Average braking energy before bus stop on a course depending on the average speed on a given course: (a) in the direction A to B; (b) in the B to A direction.
Energies 17 04179 g025
Figure 26. Average braking energy outside a bus stop on a course depending on the average speed on a given course: (a) in the direction A to B; (b) in the B to A direction.
Energies 17 04179 g026
Figure 27. Average standstill energy of stopping at a bus stop on a course depending on the average speed on a given course: (a) in the direction A to B; (b) in the B to A direction.
Energies 17 04179 g027
Figure 28. Average standstill energy of stopping outside a bus stop on a course depending on the average speed on a given course: (a) in the direction A to B; (b) in the B to A direction.
Energies 17 04179 g028
Figure 29. Average total energy lost per stop at a bus stop on a course depending on the average speed on a given course: (a) in the direction A to B; (b) in the B to A direction.
Energies 17 04179 g029
Figure 30. Average total energy lost per stop outside the bus stop on a course depending on the average speed on a given course: (a) in the direction A to B; (b) in the B to A direction.
Energies 17 04179 g030
Figure 31. Distribution of the total energy lost per stop at a bus stop: (a) in the direction A to B; (b) in the B to A direction.
Energies 17 04179 g031
Figure 32. Distribution of the total energy lost per stop outside a bus stop: (a) in the direction A to B; (b) in the B to A direction.
Energies 17 04179 g032
Table 1. Shares of braking and standstill energy in the total energy lost during stops at a bus stop.
DirectionShare of Braking Energy [%]Share of Standstill Energy [%]
A to B78.3521.65
B to A75.8924.11
Table 2. Shares of braking and standstill energy in the total energy lost during stops outside the bus stop.
DirectionShare of Braking Energy [%]Share of Standstill Energy [%]
A to B 23.3276.68
B to A 22.7477.26
Disclaimer/Publisher’s Note: The statements, opinions and data contained in all publications are solely those of the individual author(s) and contributor(s) and not of MDPI and/or the editor(s). MDPI and/or the editor(s) disclaim responsibility for any injury to people or property resulting from any ideas, methods, instructions or products referred to in the content.

