Article

Study on the Gas Phase Liquid Carrying Velocity of Deep Coalbed Gas Well with Atomization Assisted Production

1
Shanghai Branch of CNOOC (China) Limited, Shanghai 200335, China
2
School of Petroleum and Natural Gas Engineering, Liaoning Petrochemical University, Fushun 113001, China
3
School of Petroleum Engineering, Northeast Petroleum University, Daqing 163319, China
*
Author to whom correspondence should be addressed.
Energies 2024, 17(16), 4185; https://doi.org/10.3390/en17164185
Submission received: 14 July 2024 / Revised: 17 August 2024 / Accepted: 20 August 2024 / Published: 22 August 2024
(This article belongs to the Special Issue Advances in the Development of Geoenergy: 2nd Edition)

Abstract

:
In order to clarify the gas-phase carrying capacity after the atomization of water from the bottom of deep coalbed wells, considering characteristics of atomization-assisted production and the dynamic equilibrium principle of gas–liquid two-phase flow in the wellbore, the gas-phase liquid-carrying drop model was established, and the solution method of the upstream and downstream driving force of liquid drop flow was studied. We also verified the theoretical model through physical simulation. Then, the law for the influence of droplet size, wellbore inclination, wellbore diameter, and wellhead back pressure of the critical liquid-carrying velocity in the gas phase is analyzed using the model. The results show the following: ① the larger the diameter of atomized droplets, the greater the gravity force applied to it, the worse the ability to be carried by the gas phase, a onefold increase in droplet diameter corresponds to the increase in the minimum critical velocity of the gas phase by 1.45 times; ② with the increase in wellbore inclination, the liquid-carrying capacity of the gas phase decreases, and the minimum critical liquid-carrying velocity of equal diameter droplets increases by 0.01438 m/s or 1.27 times for the increase in wellbore inclination by 10°; ③ with the increase in wellbore diameter, both the driving force of a droplet of equal diameter and the flow resistance through the gas phase in the wellbore decrease within the range of a driving pressure difference of 0.2 Mpa; the decrease in liquid-carrying velocity caused by the decrease in received flow resistance can reach the maximum value of 0.0473 m/s; ④ with the increase in wellhead back pressure, the driving force of equal-diameter droplets decreases, the resistance against passing through the high-concentration gas phase increases, and the gas-phase-carrying droplets start the game; ⑤ the atomization-assisted production has the function of drainage gas recovery, and the adoption of atomization-assisted production technology can increase the production time of a coalbed gas flowing well, enabling the wells to have a good transition time interval for the conversion of flowing wells to pumping ones, which provides a precise production dynamic basis for the efficient design and implements the overall strategy of drainage gas recovery by deep-well pumping. In short, this technology has the high-efficiency liquid-carrying function of “water atomization to help liquid-phase flow and increase gas production”, as well as obvious technical advantages, which can provide a new idea for the development of deep coalbed methane wells and other types of gas wells with water.

1. Introduction

The current tense energy situation urgently requires unconventional oil and gas resources to supplement or replace, and coalbed methane is one of the potential ones [1,2,3]. The exploration and development of CBM (Coalbed Methane) in China has been developing at a high speed after the 11th Five-Year Plan, and with the realization of large-scale production capacity in the southern part of Qingshui Basin and the eastern edge of Ordos Basin, the middle and deep depth CBM has come into people’s view. During the “13th Five-Year Plan” period, the national assessment of CBM resources within the range of 1500 m and 3000 m of reservoir depth is as high as 30 trillion cubic meters, demonstrating a huge prospect of deep-depth CBM development [4].
Subsequently, at the beginning of the “14th Five-Year Plan”, the deep-depth CBM horizontal wells in the eastern edge of the Ordos Basin accomplished the feat of producing about 75,000 cubic meters of gas per day, which is one of the highest production wells in the country, and marked an important breakthrough in China’s development of deep-depth CBM, but at this stage, the development of deep CBM wells is still in the beginning stage, and there are still many problems, such as: ① deep coalbed methane storage state is not clear, favorable target evaluation and development countermeasures targeted design is not strong; ② adaptability technology of pressure reduction by drainage for gas production needs further research; ③ gas–liquid wellbore two-phase flow law, especially the gas-phase liquid-carrying speed quantitative description of the mathematical model is not clear, which will lead to the subsequent selection of drainage production model, process and optimization design is difficult to clarify. Some solutions for the above problems have been carried out. For problem ①, people have been researching and tackling, putting forward the method for determining whether the CBM endowment state is a free state or an adsorption state and then determining the development strategy for improving CBM recovery [5]. This is the basic principle of the design of efficient and stable development of CBM wells, which forms the basis for exploring the tectonic evolution and hydrodynamic conditions of the mechanism of the influence of CBM endowment [6], analyzing the degree of hydrodynamic influence on CBM adsorption and desorption, and initially forming the development method and process of the adsorption gas stage of drainage and production. Subsequently, in the process of deep-CBM exploration in the Junggar Basin, it was found that free gas should be the main focus, followed by adsorbed gas. CBM should be organically combined with conventional gas [7], which is of great significance to the design of deep CBM well development and can establish the development design sequence of deep CBM wells to first collect the free gas and then drain the adsorbed gas. The production characteristics of the target wells in this paper are similar to the Sichuan shale gas; the current free gas self-flowing stage, followed by the adsorbed gas, will be drained; therefore, the connection between the two stages is very important. For problem ②, production technology usually includes: conventional rod pump [8], hydraulic rodless pump [9], hydraulic jet pump [10], electric submersible pump [11], diaphragm pump [12] and other production technologies and processes, production practice shows that rod pumps are prone to rod and pipe abrasion in the production of wells of large inclination and horizontal wells (the problem can be dealt with a correcting device) [13,14,15], as well as rod pumps from the development of the transition from the early to the late stage, due to rapid changes in production conditions caused by the production equipment and water production, gas production mis-match, it leads to the gas recovery efficiency is not optimal [16]; the process of rodless pump production has the advantage of effectively avoiding large inclined wells and horizontal wells tubing abrasion, but at the same time there are poor prevention ability for coal dust and sand [17], corrosion prevention and anti-scaling ability is also generally [18], the existence of high-pressure puncture leakage risk, the depth of downpumping restricted, ground equipment reliability is not strong and other shortcomings [10,19]. Therefore, the design of new drainage and production technology should first consider the combined advantages of rod pump and rodless pump or design corresponding drainage and production technology in the unstable stage between the self-flowing period and pumping.
Specifically, this paper proposes for the first time the atomization-assisted production technology for the trend of water coming from the bottom of deep coalbed methane wells and fluid accumulation in the wellbore, relying on the atomization-assisted production device to atomize the coming water from the bottom of the well. The atomized droplets will easily float in the wellbore, thereby assisting the wells in self-flowing. At the same time, this technology can also be used to transition the unstable stage of water and gas production from self-flowing to pumping and provide a solid foundation for efficient pumping pattern selection and process design. The atomization of gas production measures to maximize the prolongation of gas wells’ self-flowing time as the goal. Therefore, the key is whether the atomized droplets can be lifted by the airflow at the minimum speed. Related research will be carried out in this paper. In response to problem (3), the existing conventional gas-phase liquid-carrying flow model does not have a good understanding of atomization-assisted production. This paper will reveal the new model and its laws.
Based on the current production properties of deep coalbed methane well X-1, this paper proposes a gas production method by atomization. The method aims to atomize the coming water from the bottom of the well, reduce the fluid accumulation rate in the wellbore, and enhance the liquid-carrying capacity of the gas phase. Then, to prolong the period of the gas well’s self-flowing, a long time will be provided for the design pumping and equipment entry into the field. Thus, of great significance, this paper establishes the theory of atomization to help jet gas production in deep CBM wells. It specifies the two-phase flow behavior of gas production by atomization in order to provide a practical reference and guidance for a cost-effective design and development of the same CBM or shale gas well.

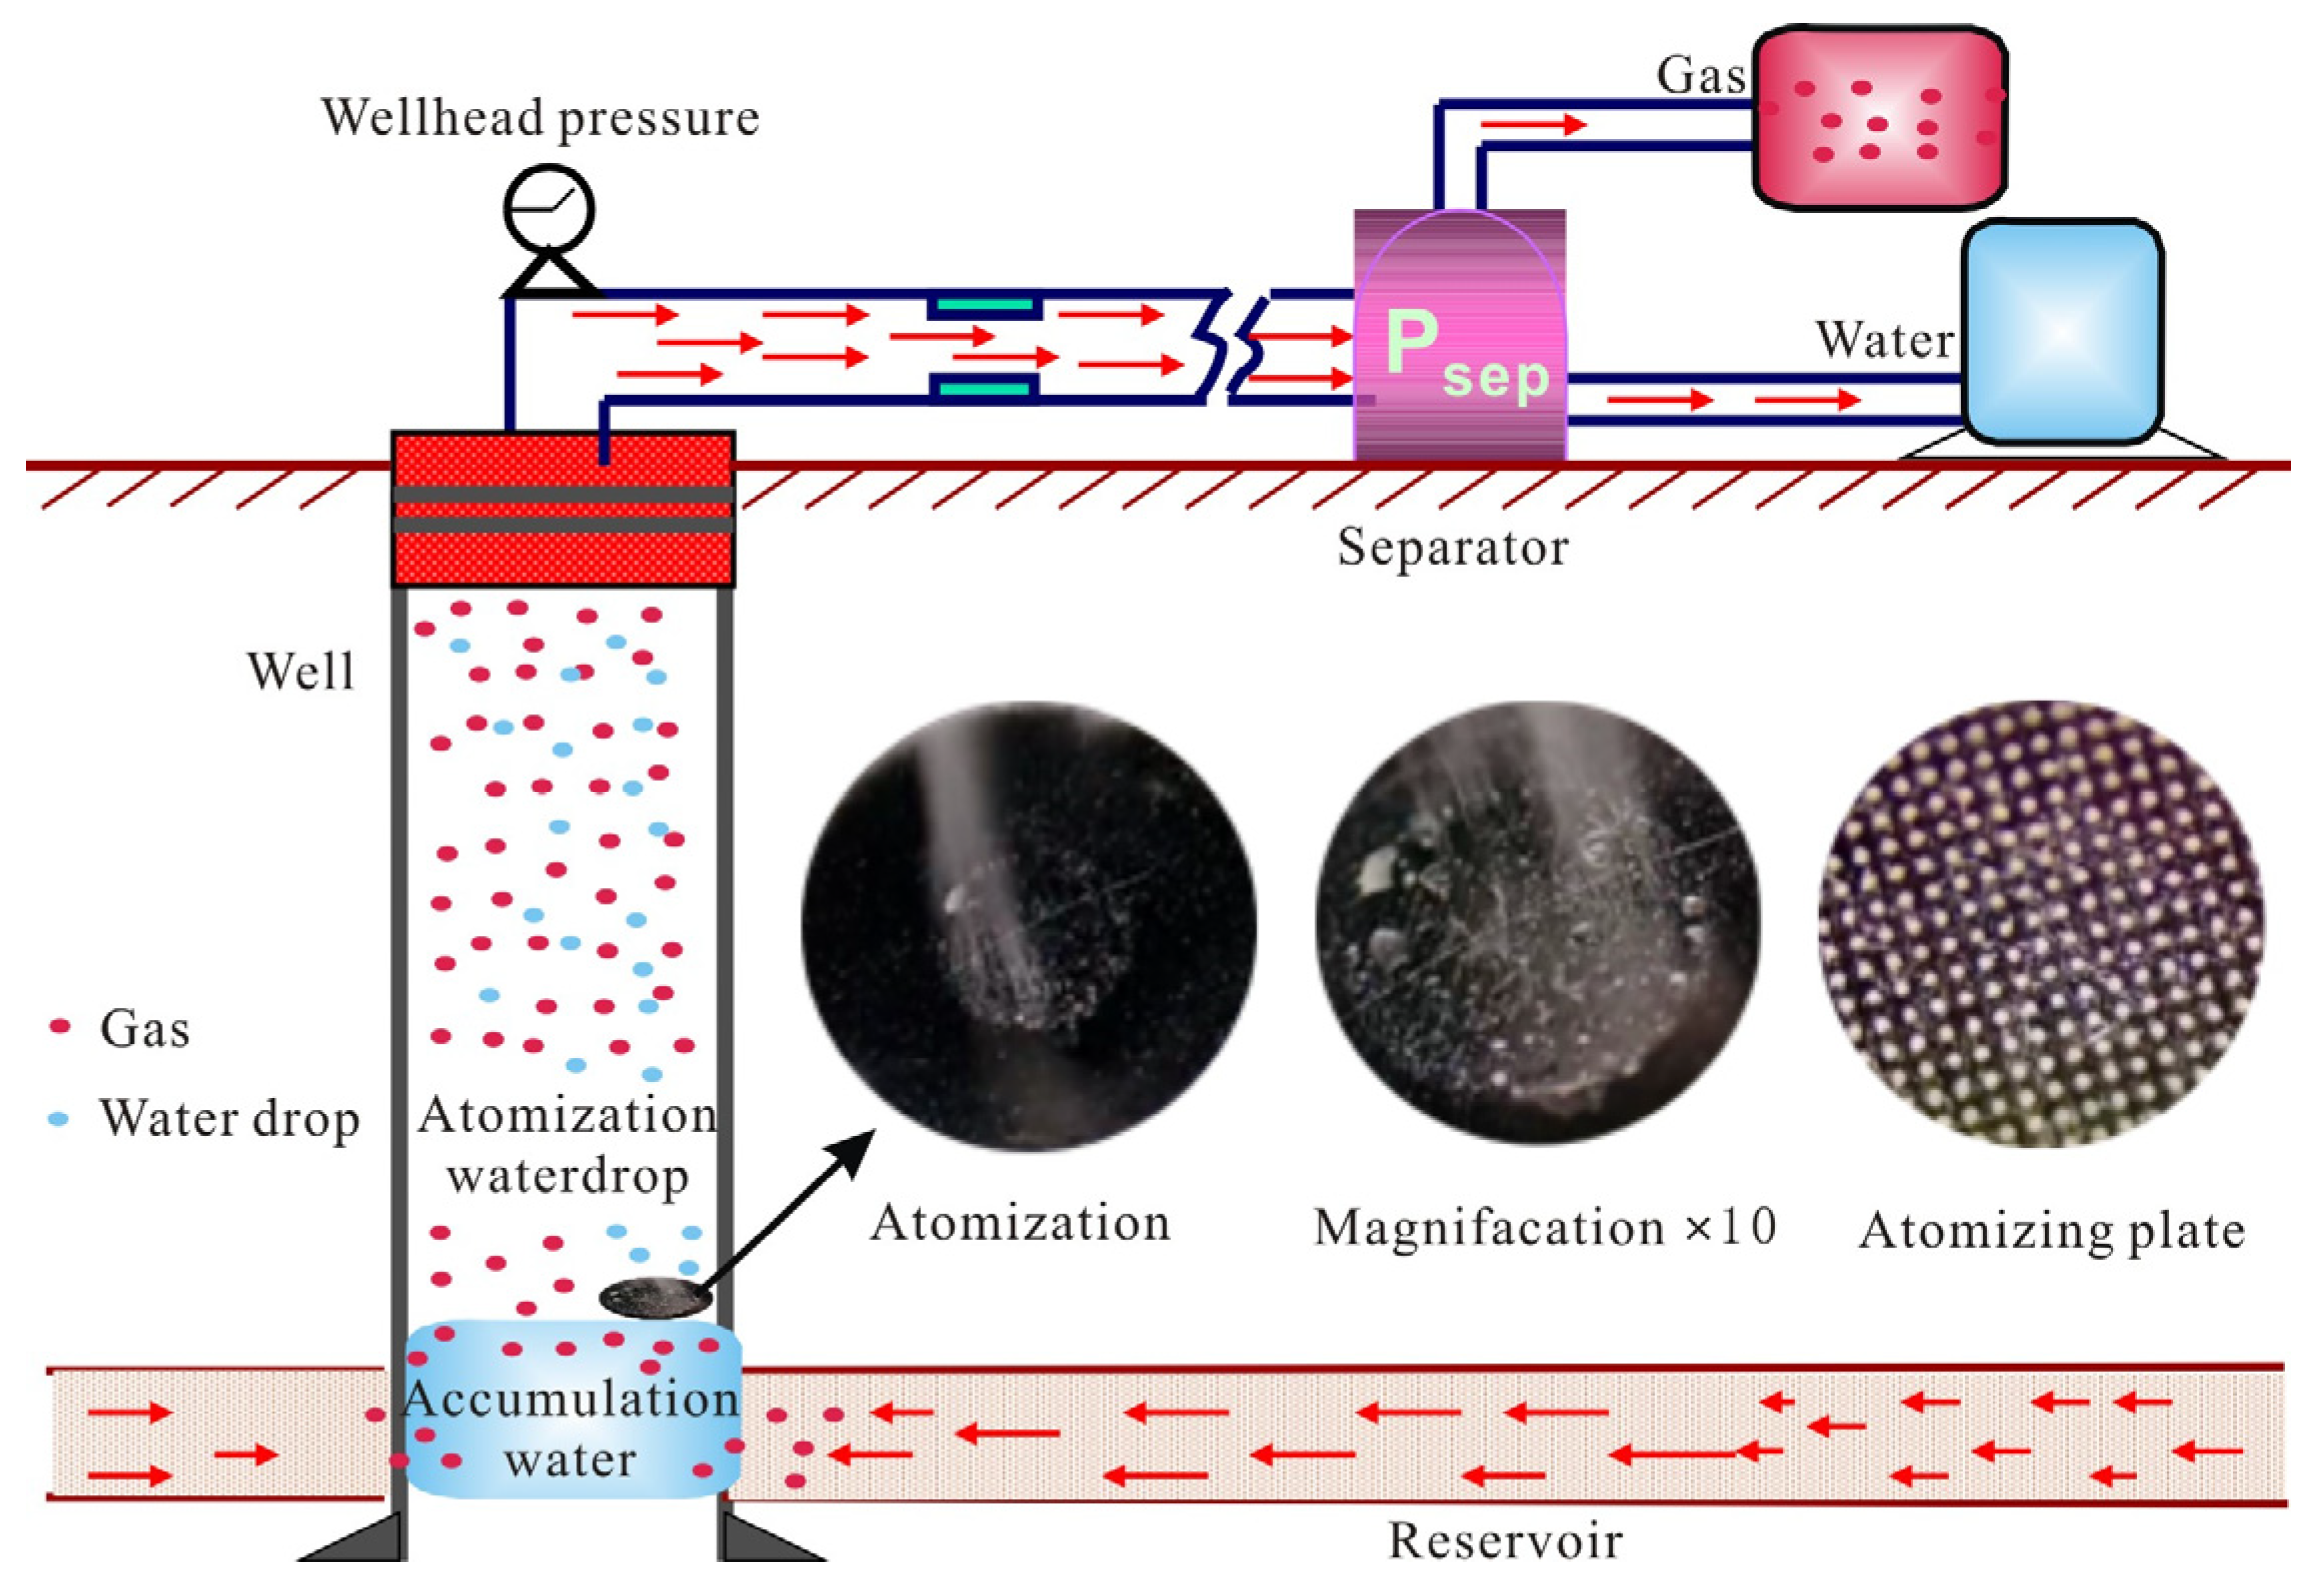
2. Function and Principle of Production by Atomizing

The main factor affecting the gas recovery behavior during the development of deep coalbed methane wells is the gas well’s outflow water. In deep coalbed methane wells, artificially adjusting the internal water plugging is difficult. Plugging water could be plugging gas; it needs to drain to help gas production, but the discharge pump put into the horizontal section of the horizontal well is more difficult. The pump shaft and the horizontal impeller combination of the structure are also unfavorable working factors, which can lead to the pump shaft deviation failure, causing a greater risk. Therefore, this paper focuses on the research entry point of extending the self-flowing duration of deep coalbed methane wells, as seen in Figure 1. Regarding the extension of the well’s self-flowing time, almost all domestic and foreign studies are conducted through the control of production speed to optimize the design of a reasonable discharge system and then directly produced by the deep-well pump. This paper proposes that in the period of self-flowing and deep-well pump production should be set up as a fogging method of spraying should act as a transition technology, which can play an important role in prolonging the self-flowing period of the well when the well starts to accumulate fluids and provide a buffer time for equipment installation. Therefore, this paper carries out an experimental study on the mechanism and effect of fogging spraying to explore new technology to prolong the self-flowing period of deep coalbed methane wells and scientifically guide the subsequent discharge process to achieve the purpose of reducing costs and improving recovery efficiency.
The ultrasonic atomizer [20], prepared by the piezoelectric ceramic atomizer, drives the output terminal on the microporous piezoelectric ceramic atomizer plate with applied voltage. The atomizer plate undergoes microdeformation, resulting in the high-frequency resonance of the water into tiny droplets through the diameter of 5 μm spray holes to form a water atomization phenomenon (see Figure 1). The experiment shows that the atomized water droplet could occur in a re-combination phenomenon; the diameter of the combined droplet is about 50 μm.

3. Modeling of Gas-Phase Carrying Droplet

As the premise of the study is to set up the atomization spraying device in the wellbore, the water at the bottom of the well becomes a mist. Then, the main form of distribution of the actual liquid becomes the droplets suspended flow in the wellbore. The suspended droplets from the bottom of the well are to be carried by the reservoir output gas. It can first take the maximum value of the atomized droplets and then analyze the droplet’s force in the movement, as shown in Figure 2. The droplets flowing can rely on the gas-phase buoyancy and pressure difference between upstream and downstream droplets to overcome the droplets’ own gravity and the gas-phase resistance. Thus, this is the principle of the establishment of equilibrium equations in order to obtain the minimum gas flow rate that can carry the droplets.

3.1. Force Analysis of Droplet Flow

The buoyancy of the gas relative to the droplet can be expressed as:
F b = ρ g g s i n θ π d 3 6
The force of gravity on the droplet is:
F g = ρ l g i n θ π d 3 6
The driving force of the droplet flow by its upstream and downstream flow pressure difference can be expressed as:
F d = ( p 1 p 2 ) π d 2 4
The gas phase’s resistance to droplet flow can be expressed as:
F r = 1 2 ρ g c a v g 2 π d 2 4
When the droplet moves upward at a uniform speed, the power and resistance of the droplet reach equilibrium, and the above Equations (1)–(4) can be obtained: Fd = Fr, which can be derived from the minimum gas-phase critical carry liquid velocity:
v g , c = ( Δ p ( ρ l ρ g ) g s i n θ 2 3 d 1 2 ρ g c a ) 0.5
In order to better specify the dimension when calculating, assuming that the equivalent force of the driving force is N times the gravity of the droplet, then the velocity magnitude is more specified, and the driving differential pressure can be expressed as:
Δ p = p 1 p 2 = N ρ l 2 3 d g
For Equation (5), droplet diameter, droplet upstream and downstream flow pressure difference force, and other parameters are unknown or difficult to confirm. The following is a clear method for the droplet diameter d, not on the atomization booster, which is generally used to participate in the calculation of the Weber number proposed by Hinze. The expression is as follows:
N w e = ρ g d v g 2 σ
In particular, the atomized spraying droplets described herein are manufactured by human initiative, and their droplet diameter is highly uniform. Therefore, the droplet diameter d can be directly taken as a value of about 50 μm, which is relatively small and easier to be carried by the production gas. Secondly, the gas-phase resistance coefficient Ca is commonly taken as 0.4–0.6, and this paper expands the range of this value and then clarifies its influence, which is used to further clarify the influence of this value on the gas-phase carrying droplets. In addition, the upstream and downstream differential pressure force on the droplet flow is temporarily difficult to confirm. Therefore, it is necessary to establish the wellbore gas–liquid two-phase flow model further to determine the pressure distribution in the wellbore and implement the specific value of the differential pressure according to the droplet diameter span and the pressure gradient.

3.2. Pressure Gradient and Calculation Method for Two-Phase Flow in Wellbore

3.2.1. Hypothesis

In order to establish the model smoothly, the following assumptions should be made first: taking atomization as the precondition for spraying, the incoming water at the bottom of the well is dispersed by the atomizer into equal-size droplets, the flow in the wellbore is transient, and the gas–liquid two-phase flow direction is from the bottom of the well to the wellhead direction. Meanwhile, the pressure inside the wellbore is distributed longitudinally along the wellbore, and the pressure on each overflow cross-section and the gas–liquid single-phase flow velocity on the overflow cross-section are all the same.

3.2.2. Gas-Liquid Two-Phase Transient Flow Modeling

Ignoring temperature effects and using the laws of conservation of mass, momentum, and energy as modeling bridges, the following equations can be written separately [21,22].
The continuity equations for gas-phase and liquid-phase flow in the wellbore can be expressed as follows:
t ( ρ g H g ) + z ( ρ g H g v g ) = 0
t ( ρ l H l ) + z ( ρ l H l v l ) = 0
The gas–liquid two-phase equation of motion can be expressed as:
t ( ρ g H g v g + ρ l H l v l ) + z ( p + ρ g H g v g 2 + ρ l H l v l 2 ) + ( ρ g H g + ρ l H l ) g + f ρ g l v g l 2 2 D = 0
Obviously, there are five unknown parameters in the above equations (p, H g ,   ρ g , v g , v 1 ) and the number of existing equations is only three. Therefore, it is necessary to supplement two auxiliary equations to solve all the unknowns successfully in order to form a complete gas–liquid two-phase wellbore pressure calculation model. Then, according to the most widely used natural gas compression equation and the gas–liquid wellbore percentage distribution, the gas equation of state and the atomization-assisted jetting equation of state are supplemented, and they can be expressed as:
ρ g = M p Z R T f
H g = 1 H l   ( atomized flow )

3.2.3. Numerical Model

Usually, analytical and numerical methods can be used to solve partial differential equations, and this paper chooses the numerical method to avoid making all kinds of assumptions that may be inconsistent with the actual situation. The specific idea of the numerical method is to discretize the system of partial differential equations into a system of finite difference equations, then linearize the nonlinear coefficients to obtain a system of linear equations, and then solve the system of unknown quantities according to the conventional method.
Equations (8)–(10) generalize to:
E t + F z = G
The values of E, F, and G in Equations (8)–(10) are shown in Table 1:
Let j and m denote spatial and temporal nodes, respectively. Equation (13) is discretized at the point (j + 1/2, m + 1), then let the space and time steps be L, δ, respectively, and then let Ω = h/2δ to establish the difference equation as follows:
Ω ( E j + 1 m + 1 + E j m + 1 E j + 1 m + 1 E j m ) + F j + 1 m + 1 F j m + 1 = L ( G j + 1 m + 1 + G j m + 1 ) 2
This fully implicit differential format equation possesses convergence, stability, and compatibility. Substituting E, F, and G of the different equations in Table 1 into Equation (14), the following expression for the gas-phase converted velocity is obtained:
( v s g ) j + 1 m + 1 = ( ρ g v s g ) j m + 1 + Ω β 1 ( ρ g ) j + 1 m + 1
The liquid phase converted velocity expression is as follows:
( v s l ) j + 1 m + 1 = ( ρ l v s l ) j m + 1 + Ω β 2 ( ρ l ) j + 1 m + 1
The pressure expression is as follows:
ρ j + 1 m + 1 = ρ j m + 1 Ω β 3 + β 4 L g β 5 β 6 L 2
Of which:
β 1 = ( ρ g H g ) j + 1 m + ( ρ g H g ) j m ( ρ g H g ) j + 1 m + 1 ( ρ g H g ) j m + 1 β 2 = ( ρ 1 H 1 ) j + 1 m + ( ρ 1 H 1 ) j m ( ρ 1 H 1 ) j + 1 m + 1 ( ρ 1 H 1 ) j m + 1 β 3 = ( ρ g v s g + ρ l v s l ) j + 1 m + 1 + ( ρ g v s g + ρ l v s l ) j m + 1 ( ρ g v s g + ρ l v s l ) j + 1 m ( ρ g v s g + ρ l v s l ) j m β 4 = ( ρ g v s g 2 H g + ρ l v s l 2 H l ) j m + 1 ( ρ g v s g 2 H g + ρ l v s l 2 H l ) j + 1 m + 1 β 5 = ( ρ g H g + ρ l H l ) j m + 1 + ( ρ g H g + ρ l H l ) j + 1 m + 1 β 6 = ( f ρ g l v g l 2 2 D ) j m + 1 ( f ρ g l v g l 2 2 D ) j + 1 m + 1
The discretized form of Equation (11) can be written as:
ρ j + 1 m + 1 = M p j + 1 m + 1 R ( Z T f ) j + 1 m + 1

3.2.4. Solution Step

The numerical model was clarified in the previous section as a basis for the subsequent iterative method to find the required differential pressure upstream and downstream of the droplet in Section 3.1. The flowchart of the equations solution method is shown in Figure 3, and the specific steps are performed as follows:
(1)
First, the underlying computational parameters should be specified, and then the initial and boundary conditions should be circled;
(2)
Discretize the fixed solution domain;
(3)
Give a set of m + 1 moments and j + 1 nodes at the corresponding ( ρ g 0 ) j + 1 m + 1 and ( H g 0 ) j + 1 m + 1 calculate the unknown quantity ( v s g ) j + 1 m + 1 , ( v s l ) j + 1 m + 1 , ( p ) j + 1 m + 1 ;
(4)
The mist flow pattern and several physical parameters calculated in the previous step are used to calculate   ( H g ) j + 1 m + 1 and ( ρ g ) j + 1 m + 1 ;
(5)
Comparison with ( H g 0 ) j + 1 m + 1 , ( H g ) j + 1 m + 1 , ( ρ g 0 ) j + 1 m + 1 and ( ρ g ) j + 1 m + 1 , view the error of both, if less than 98%, from step (3), recalculate ( v s l ) j + 1 m + 1 and ( v s g ) j + 1 m + 1 ; on the contrary, if the calculated value is accurate, you can continue to calculate until the calculation is made to the ground wellhead.
Figure 3. Flowchart of the equations solution method.
Energies 17 04185 g003

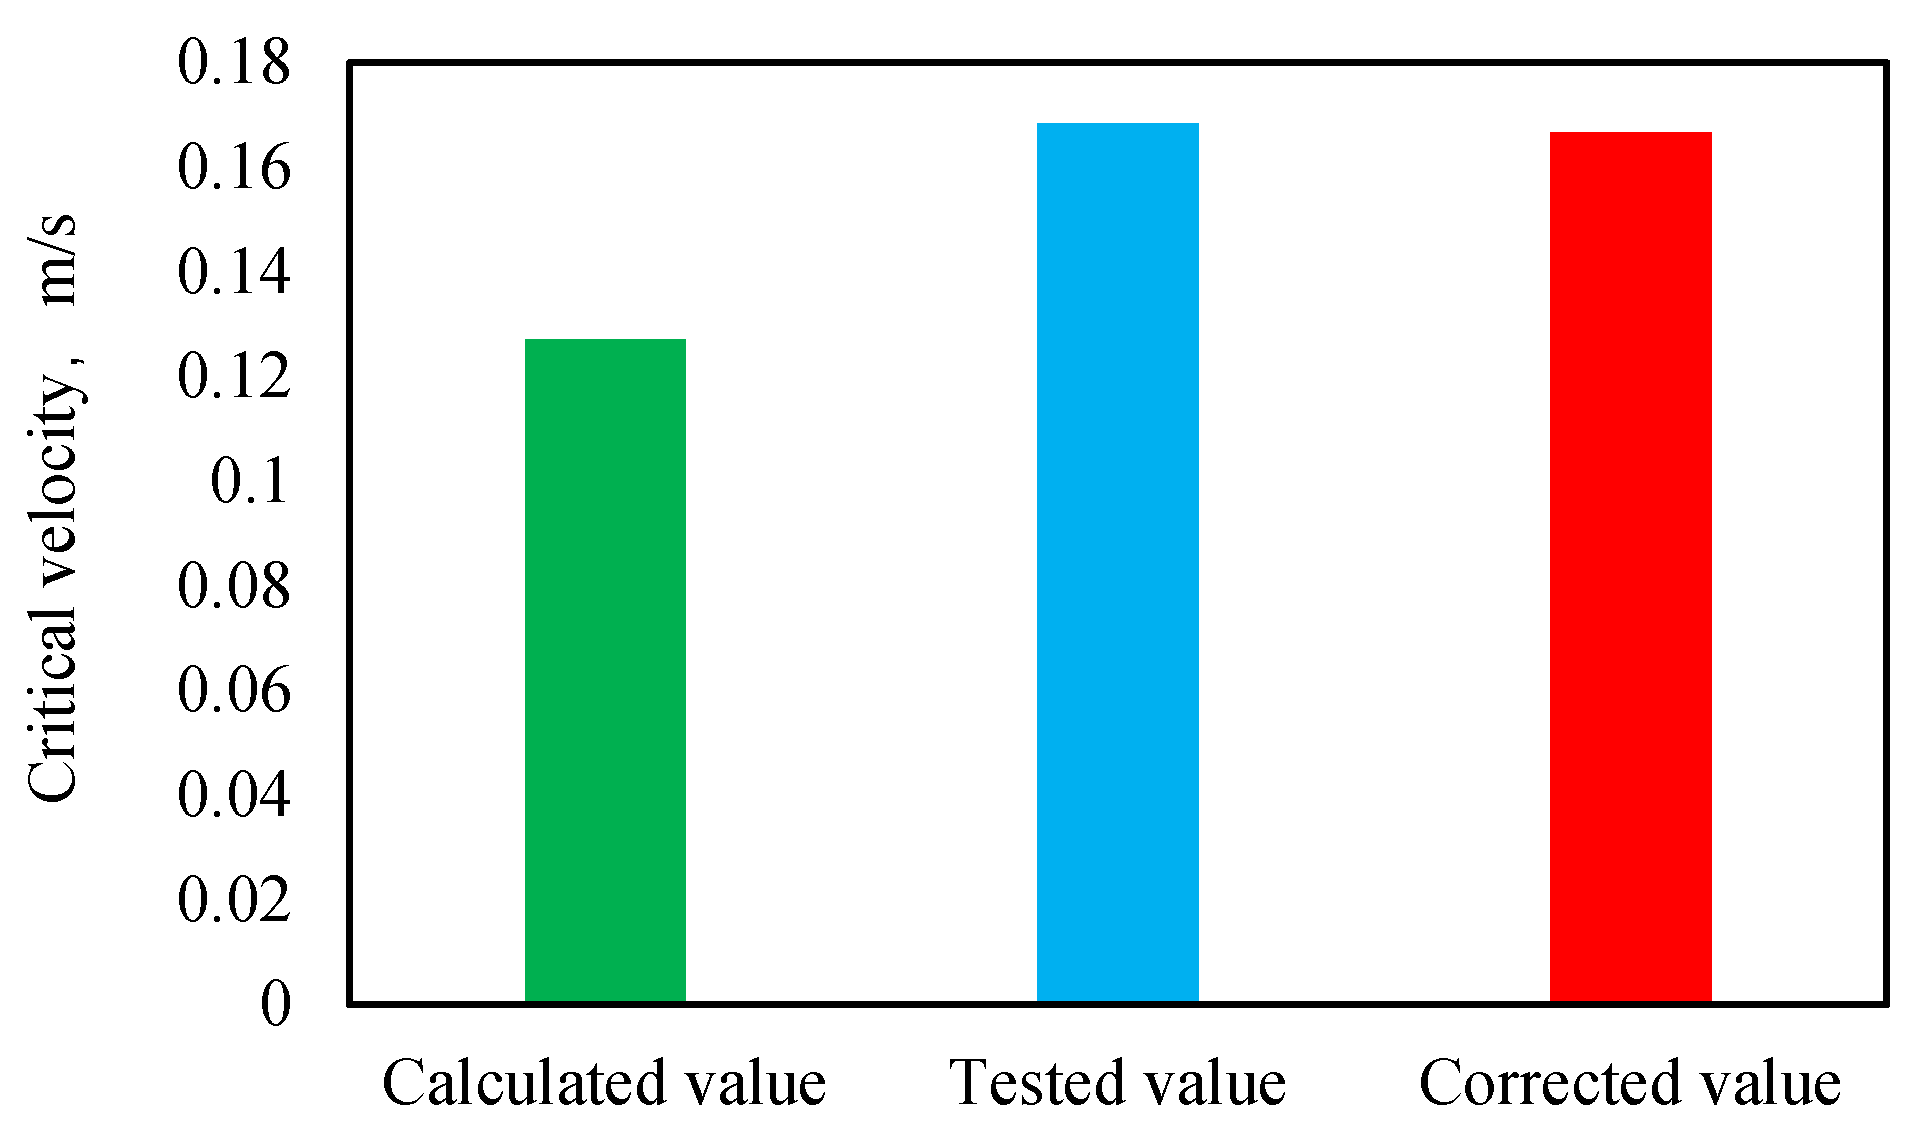
3.2.5. Model Validation

The general idea of model validation is as follows: (1) provide the base parameters of the wellbore and formation; (2) calculate the critical fluid-flowing rate according to the theoretical model and solution method mentioned above; (3) carry out the corresponding indoor simulation experiments based on the base data of wellbore and formation parameters given in the idea (1); (4) Compare and analyze the theoretically calculated values with the experimental results to derive the accuracy of the model, and then make corrections to the model.
According to the above algorithm and the basic data in Table 2, the wellbore pressure distribution of the two-phase flow of atomization-assisted injection is first calculated theoretically. The bottom of the well is assumed to be the boundary condition at the initial moment to fill the wellbore with coalbed methane, and the pressure distribution in the wellbore is calculated according to the coalbed methane column. Then, the results of the change in the wellbore pressure with the depth are obtained by the wellbore gas–liquid two-phase transient flow pressure calculation program, shown in the blue line in Figure 4.
Then, the experiment is used to verify the results of the model calculations. The test flow of the experiment is shown in Figure 4. The experimental device consists of a standpipe, gas source (air compressor), inlet valve, water tanks, water pumps, water inlet valves, back pressure valves, pressure sensors, gas flowmeter, gas–liquid separator, nebulizer, and other components. In order to ensure the stability of the liquid supply, a high-performance pump with the ability to maintain constant pressure and constant velocity is used to provide the corresponding injection water, and a buffer is installed at the pump outlet to stabilize the outlet pressure, the injection pressure of the pump ranges from 0 to 70 MPa. The maximum flow rate of the air source is 35 m3/min (outlet pressure:0.8 MPa). The air flowing out of the compressor first enters the pressure stabilizer tank with a volume of 2 m3 for pressure stabilization, and the gas in the stabilizer tank can be tested after drying.
Verification experiments are also based on the basic parameters in Table 2 as a benchmark to carry out experiments. The experimental steps are briefly described as follows:
(1)
First, the liquid is injected through the injection hole at the lowest part of the wellbore to simulate wellbore liquid accumulation, and the liquid should be injected slowly to prevent liquid splashing. After liquid injection, wait for the liquid accumulation speed to reach a stable in the tube;
(2)
Next, open the atomizer (droplet aperture diameter of 0.1 mm) and observe whether the accumulated liquid is going to droplets. If droplets form, proceed to the next step. On the contrary, check the atomizer.
(3)
Then, open the valve of the gas tank and set an injection pressure difference of 0.1 MPa. Pay attention to the observation that the gas flow rate at this time is small and does not reach the critical liquid-carrying state. After a period of stability, liquid accumulation may occur again in the wellbore.
(4)
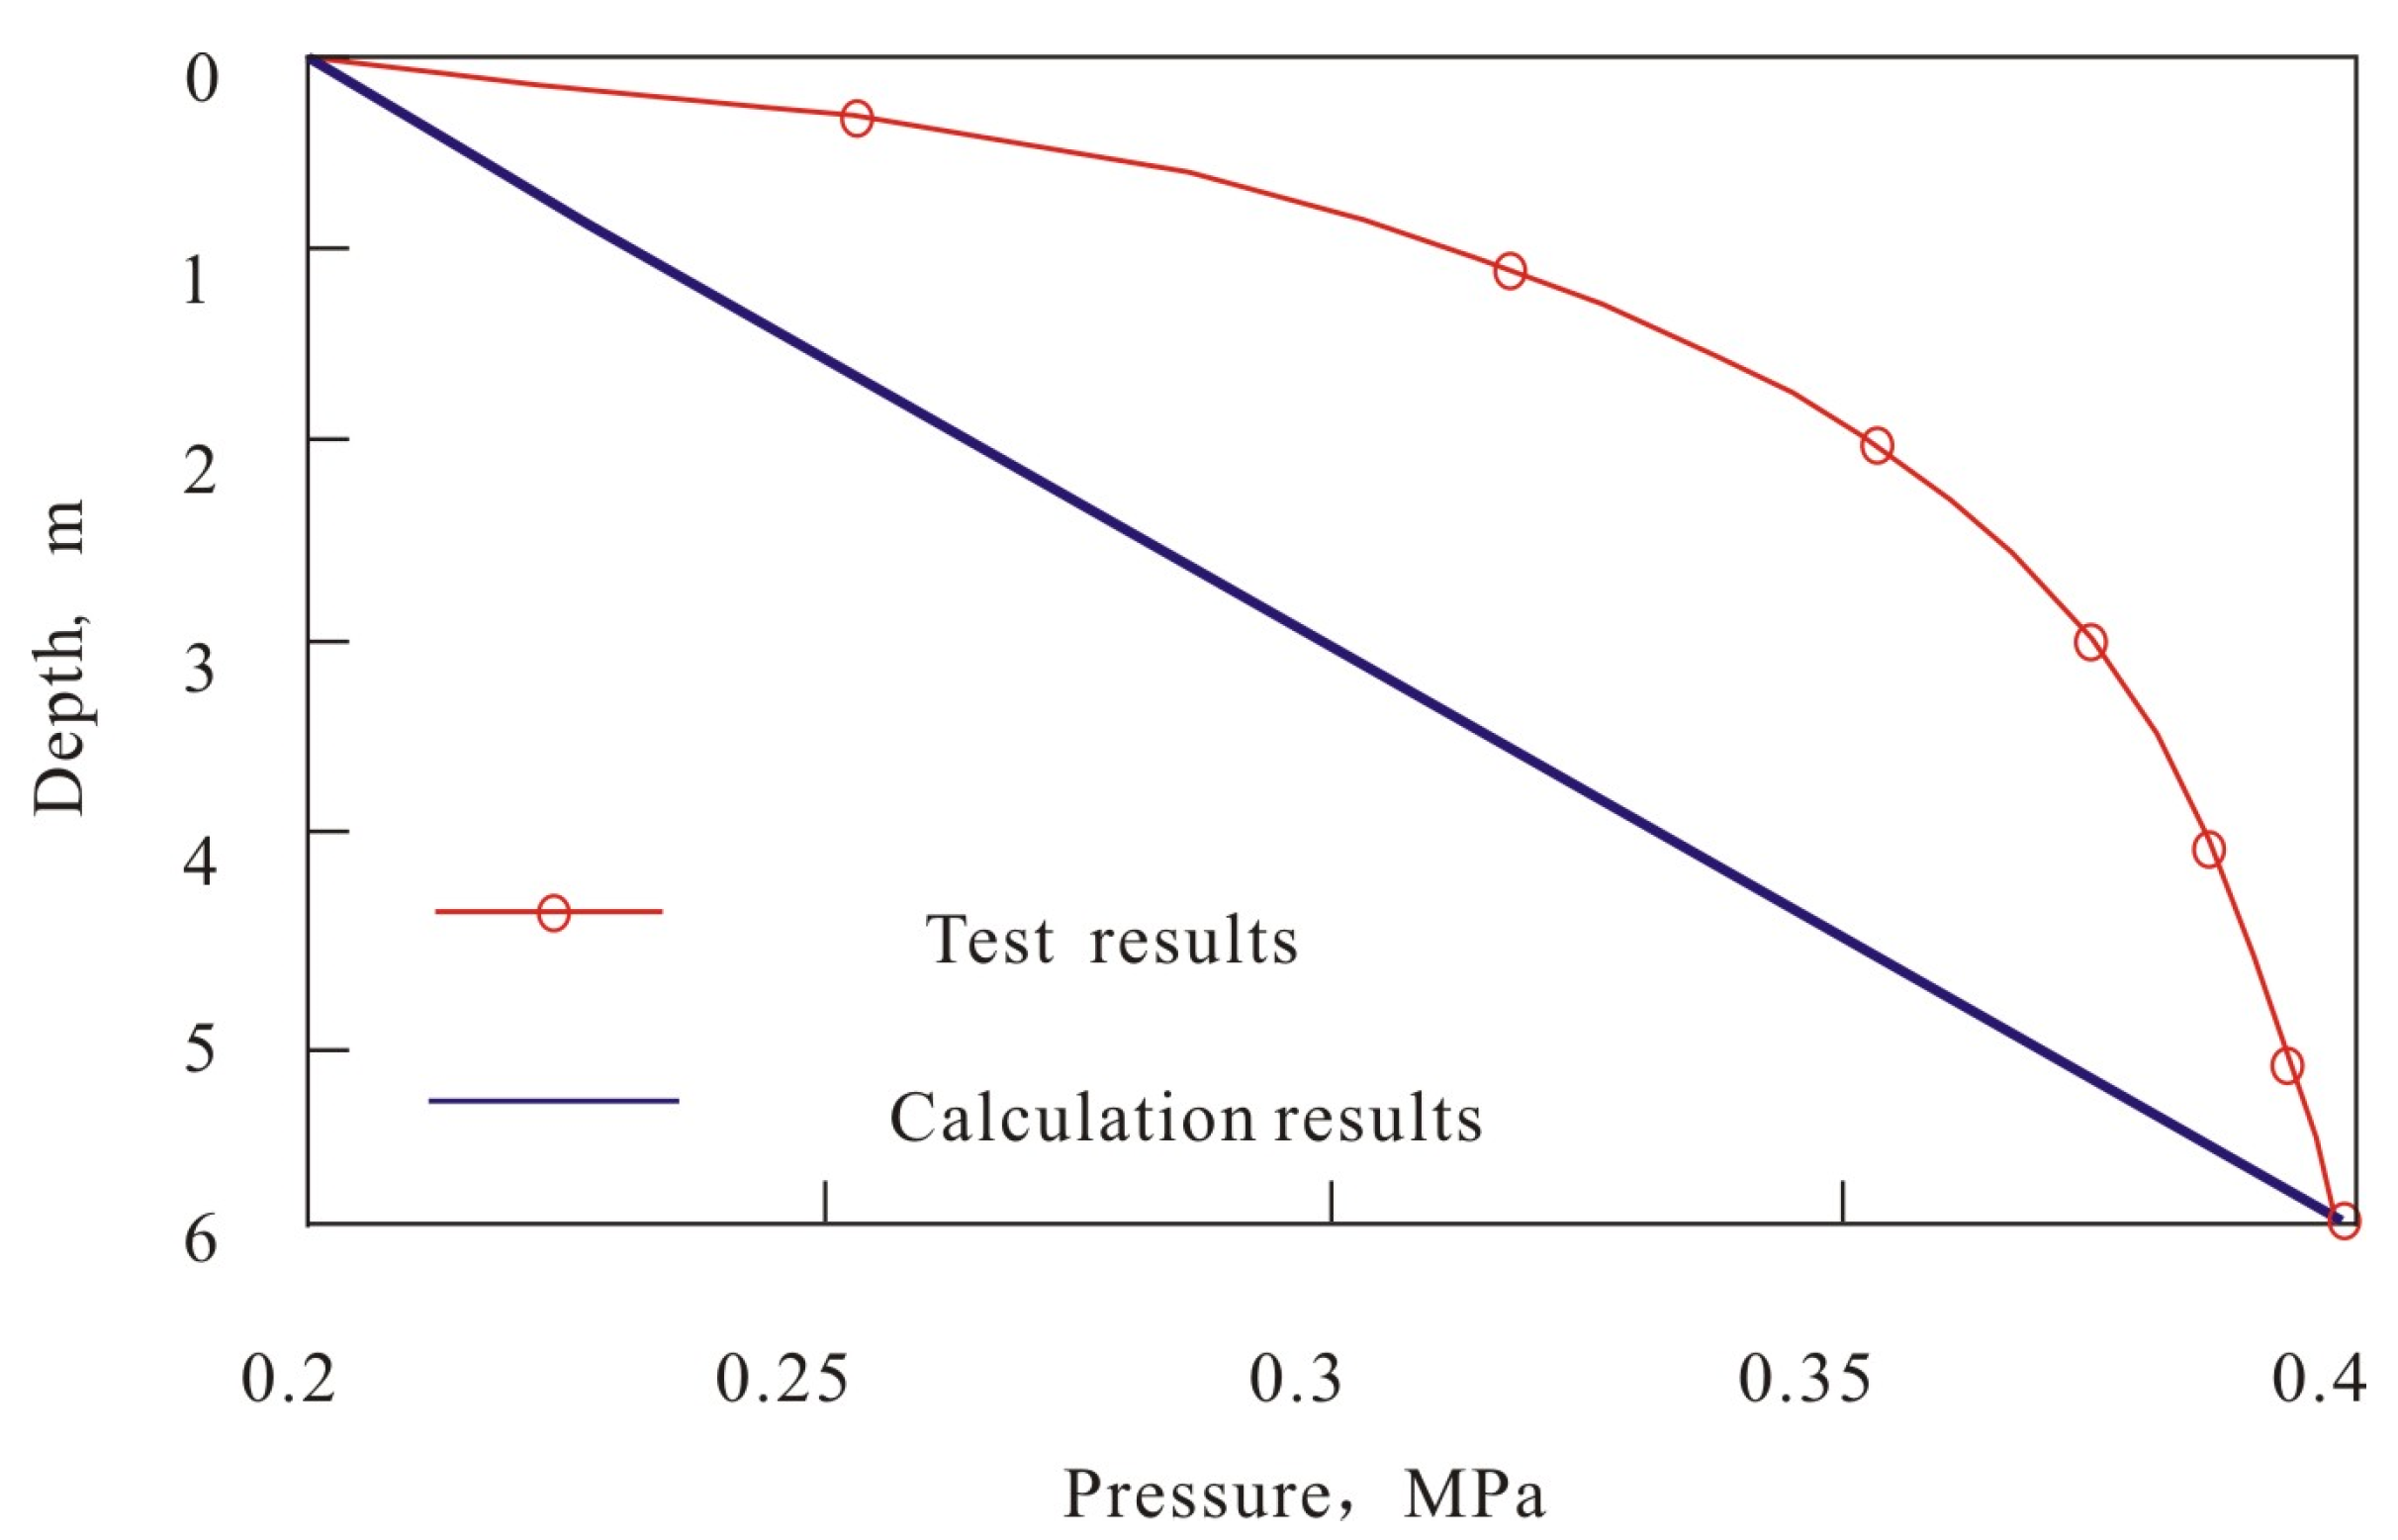
The injection pressure was increased step by step (0.02 MPa each time) until no liquid accumulation occurred in the wellbore, the minimum liquid-carrying velocity was measured, and the pressure distribution along the wellbore was recorded, as shown in the red line in Figure 4.
As shown in Figure 5, there are some differences between the theoretically calculated and experimentally tested wellbore pressure distribution versus depth curves.
Obviously, the theoretically calculated values show a straight line. At the same time, the pressure distribution in the actual wellbore is funnel-shaped, which can be seen as the closer to the wellhead, the larger the pressure gradient. This is because after venting the wellhead, the pressure conduction at the near-wellhead end is more rapid than near the bottom of the well.
Whether the atomized droplets can be completely carried and lifted depends on the value of the minimum pressure gradient distribution in the wellbore, and the theoretical pressure gradient at the bottom of the well is larger than the actual minimum pressure gradient in the wellbore. Therefore, to theoretically calculate the actual value of a better fit, the relationship between the two can be fitted; then, the theoretically calculated value can be corrected to the actual real minimum pressure gradient of the wellbore. The minimum pressure gradient correction coefficient is 0.1795.
Then we can clarify the pressure gradient based on this, using the atomized droplet diameter multiplied by the pressure gradient to obtain the droplet upstream and downstream pressure difference (take the minimum value of the pressure gradient in the wellbore because the smallest driving force can lift the droplet, then the larger driving force can also lift the droplet), the droplet upstream and downstream pressure difference is the driving force, the driving force obtained with the basic data of Table 2 can be brought into the Equation (5) to acquire the minimum carry droplet discharge wellbore. The calculated results, modified results, and experimental test results are shown in Figure 6. The error of the modified critical fluid flow rate is 1.01%, and the accuracy is 98.99%, which is high, and it can be transformed and applied to the field of giant scale field to guide the specific production practice.

4. Analysis of Factors Affecting the Fluid-Carrying Process in Gas Wells
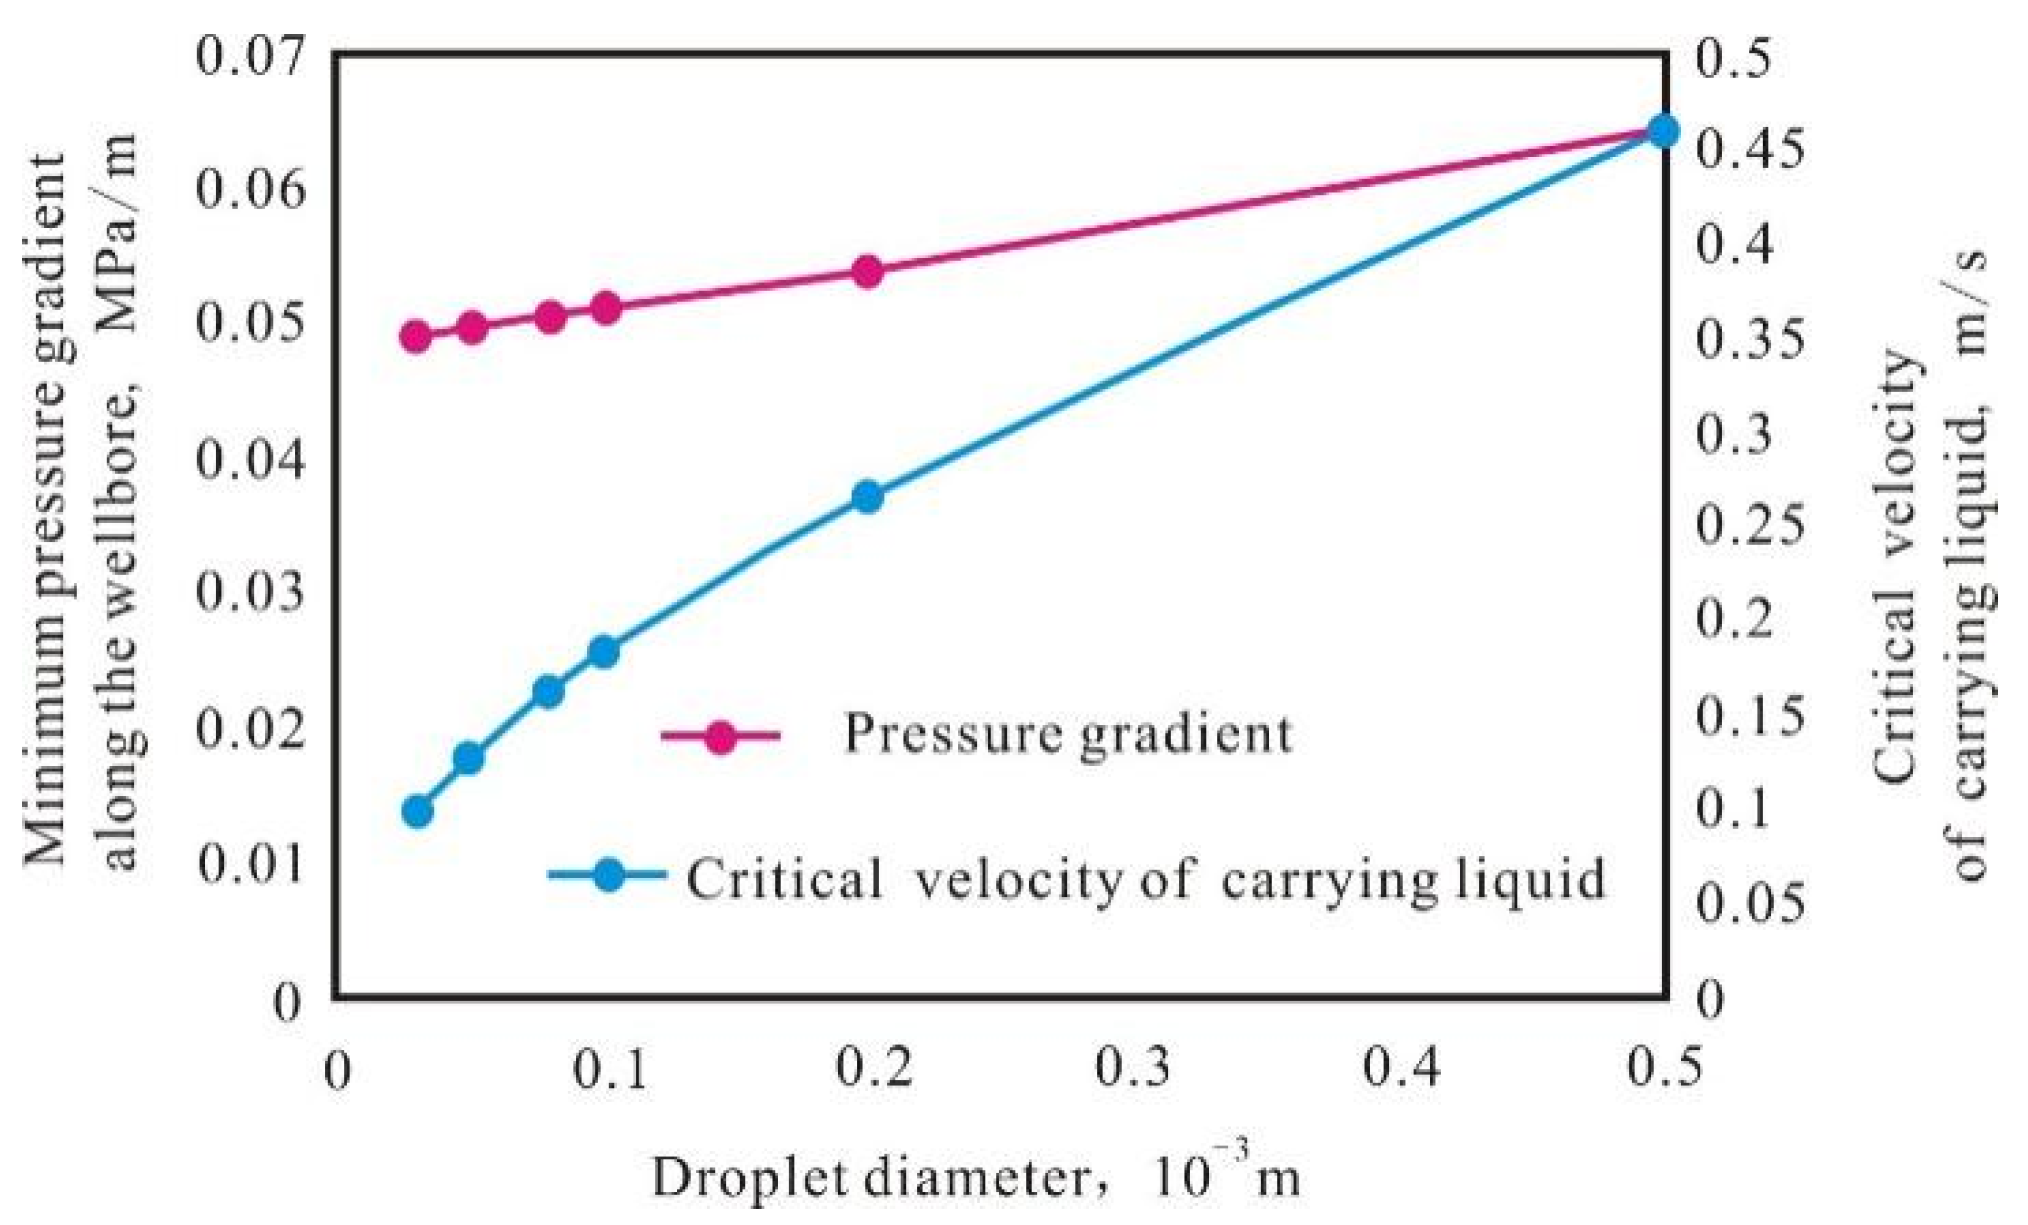
In the previous section, a model of gas well atomization-assisted production was established, and the solution method was given. Then, the theoretical model was verified and corrected by using experiments. In this subsection, the above model will be used to correlate and analyze the several main influencing factors of the process of gas-well atomization-assisted production, which cover the following factors: droplet size, wellbore inclination angle, wellbore diameter, and wellhead pressure.

4.1. Droplet Size

The size of liquid droplets is another form of gravity. One of the primary resistances to be carried and lifted by the gas phase is its own gravity, and the gravity loss of liquid droplets to be lifted from the bottom of the well to the wellhead is larger than the total energy consumption of the deep coalbed methane gas wells in the target deposit with a depth of more than 2000 m. Therefore, based on the above theoretical model, the critical liquid-carrying velocity of the gas phase is calculated when the water from the bottom of the gas well is atomized into water droplets that can be carried up by the gas phase. The assumed droplet diameters are 0.03 × 10⁻³ m, 0.05 × 10⁻³ m, 0.08 × 10⁻³ m, 0.1 × 10⁻³ m, 0.2 × 10⁻³ m, and 0.5 × 10⁻³ m according to the droplet size of the atomizer and the size of the floating droplets. The results of pressure distribution and gas-phase liquid-carrying velocity calculations are shown in Figure 7.
The results show: (1) with the increase in the droplet diameter in the wellbore, the pressure gradient in the wellbore increases. It is consistent with the law of gas–liquid two-phase flow because with the increase in the droplet diameter, the total density of the mixed fluid in the wellbore increases, and then the pressure gradient in the wellbore becomes larger; (2) the critical carry velocity increases with the droplet diameter, which is due to the gravity of the droplet increases with the increase in the droplet diameter. The gravity of the droplet in the process of the flow shows a resistance effect, and the droplet is carried by the gas phase. Suppose the droplet is carried by the gas phase and lifted up. In that case, a larger liquid-carrying velocity is required, which is shown by the fact that the liquid-carrying velocity needs to be increased by 1.45 times when the droplet diameter is increased by onefold.

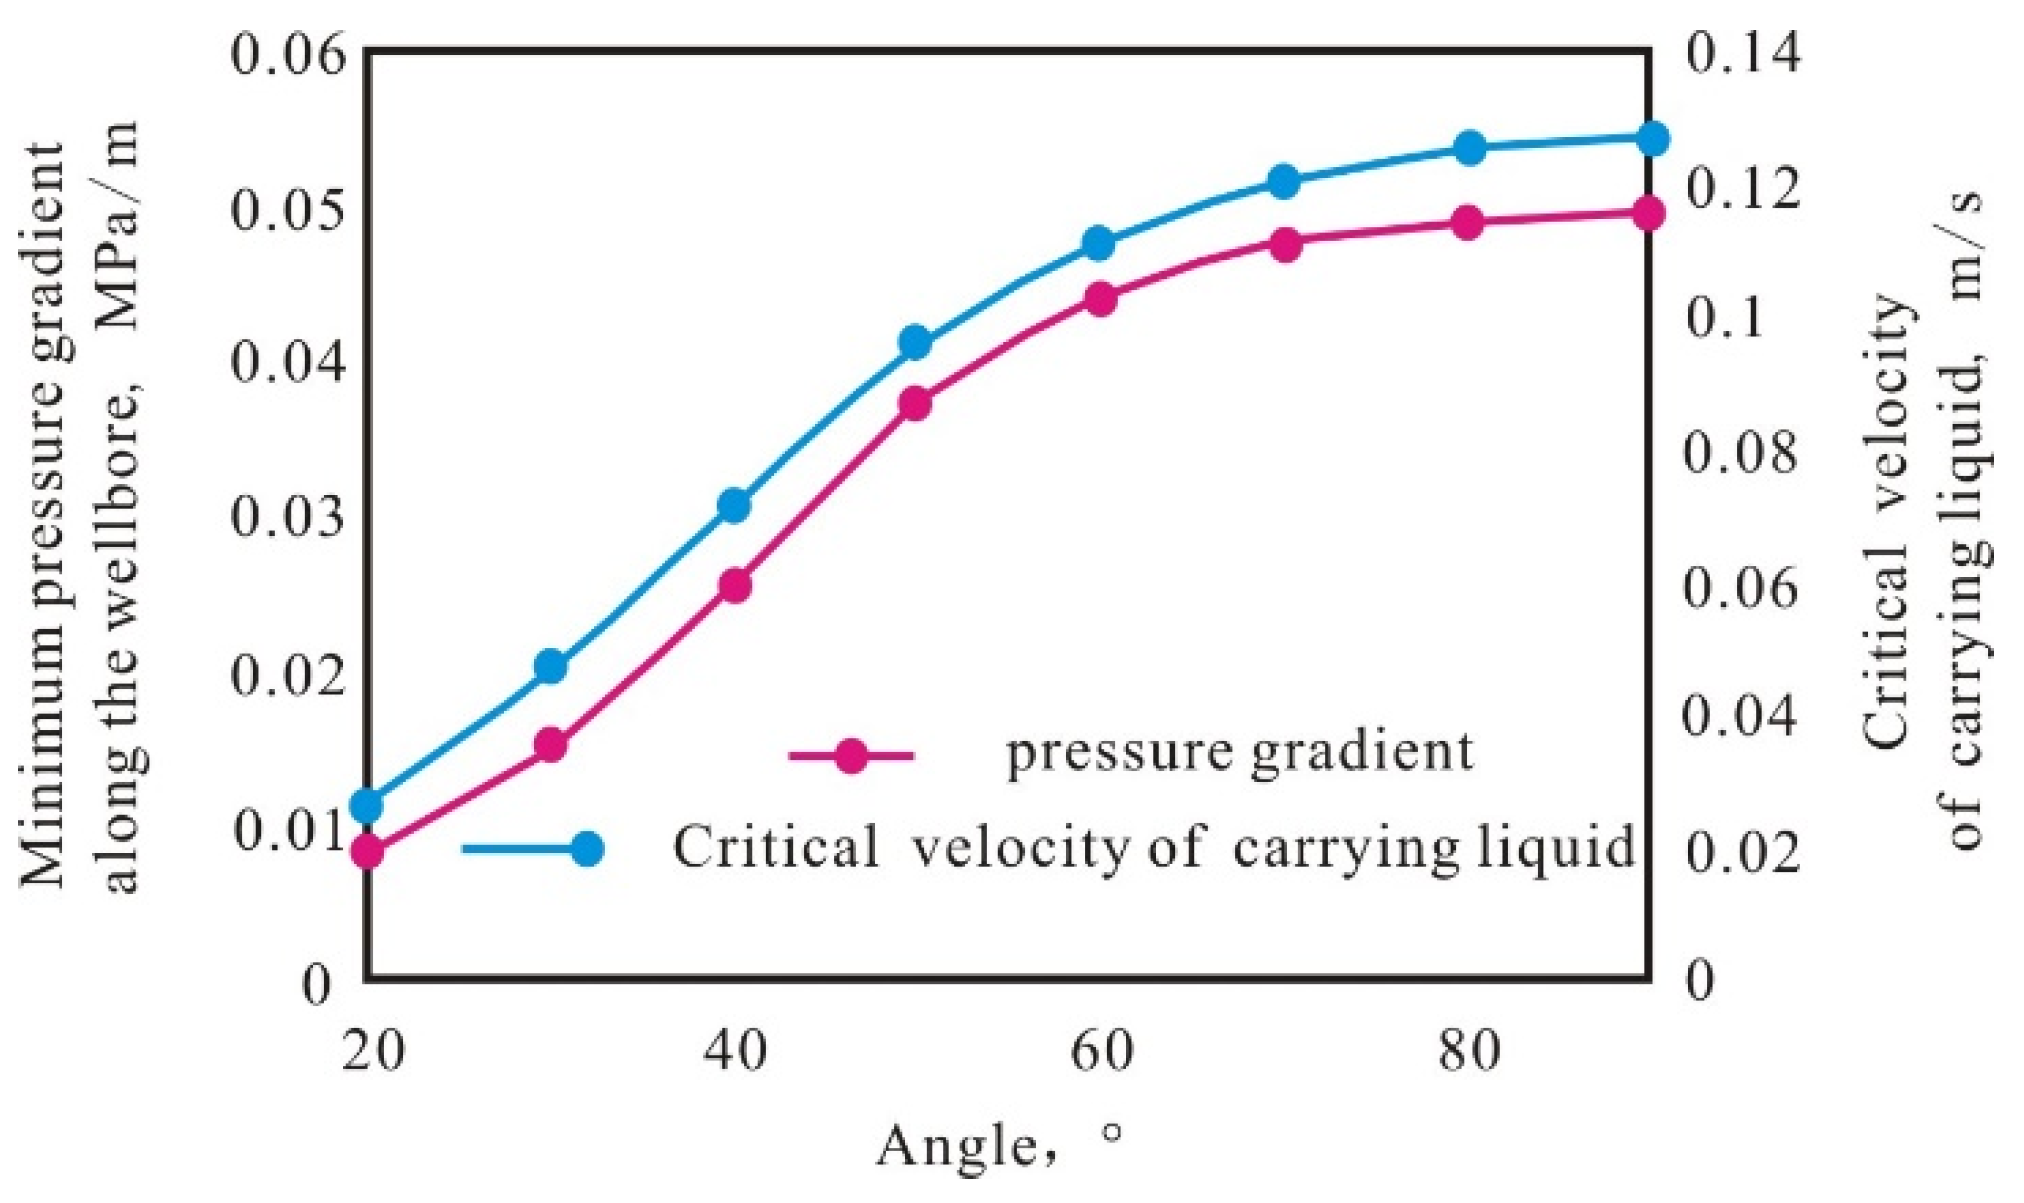
4.2. Wellbore Inclination Angle

Tilting the wellbore will change the force on the droplets and the pressure gradient in the wellbore. Therefore, the wellbore inclination angles were assumed to be 80°, 70°, 60°, 50°, 40°, 30°, and 20°. Then, the calculations of the pressure distribution in the wellbore and the gas-phase liquid-carrying capacity for a variable wellbore inclination angle with all other conditions remaining unchanged (Table 2) were carried out. The results of the calculations are shown in Figure 8.
The results show that the increase in the wellbore angle causes the pressure gradient in the wellbore to increase; this is because the more the wellbore tends to be vertical, the more the gravity effect is significant, and the gas-phase carrying droplets needs more energy. After being converted into the index of the gas-phase critical fluid-carrying velocity, the critical fluid-carrying velocity can be obtained from calculations that show that it is larger with the increase in wellbore inclination angle. In other words, lifting the vertical droplets requires more gas-phase overflow velocity than lifting the inclined droplets in the wellbore. That is, the droplets in the lifted vertical well require a larger gas-phase overflow velocity than the droplets in the lifted inclined wellbore, which is manifested in the fact that the minimum critical liquid-carrying velocity of an isometric droplet needs to be increased by 0.01438 m/s, or 1.27 times, for every 10° increase in wellbore inclination.

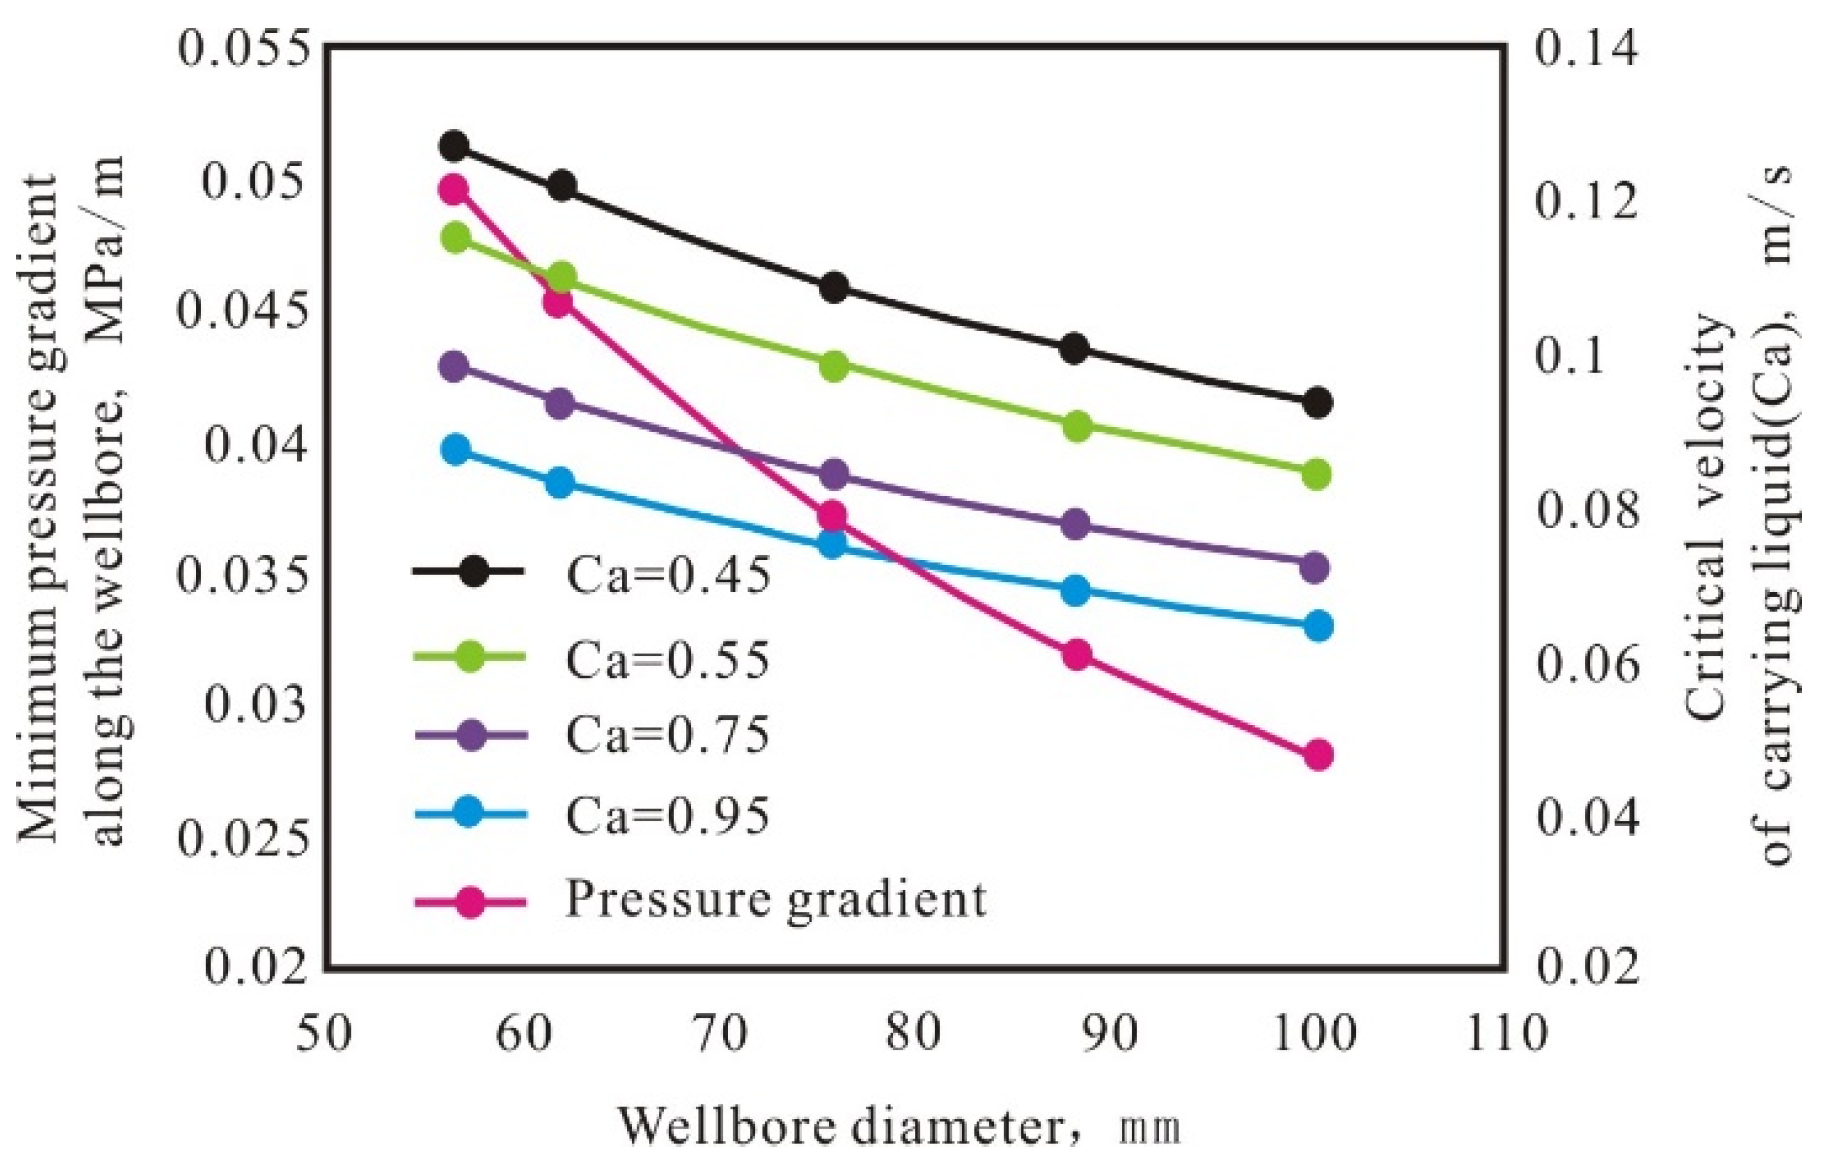
4.3. Wellbore Diameter

The size of the wellbore diameter will change the pressure distribution in the wellbore. Therefore, the wellbore diameter is assumed to be 56.67 mm, 62 mm, 75.9 mm, 88.3 mm, and 100.53 mm. Then, the calculation of the pressure distribution in the wellbore and the gas-phase liquid-carrying capacity for variable wellbore diameters, with all other conditions remaining unchanged (Table 2), is carried out. The results are shown in Figure 9.
The results show that an increase in the wellbore diameter leads to a decrease in the pressure gradient inside the wellbore, which is due to the fact that the larger the diameter of the wellbore, the larger the internal space and the better pressure conduction. It shows a decrease in the pressure gradient with an increase in the diameter of the wellbore, i.e., the droplet driving force, shows a decrease in the diameter with an increase in the diameter of the wellbore.
In addition, the gas-phase resistance coefficient should not be brought into the solution as a constant. The real scenario should be that, due to the increase in wellbore size, the collision of droplet molecules with other droplets and the friction with the well’s wall during the flow process inside the wellbore is reduced in frequency and probability compared with that inside the small wellbore, which shows that the abrasive resistance of the flow process of the droplet is reduced. The resistance coefficient decreases. Therefore, assuming that the resistance coefficients Ca are 0.95/0.75/0.55/0.45, according to the reduction in abrasion resistance to re-solve the critical liquid-carrying velocity, the value should be reduced. Therefore, the integrated wellbore pressure gradient and gas-phase medium physical properties in the wellbore caused by wear resistance change the comprehensive analysis. The overall impact of the two critical liquid-carrying velocity values is reduced, specifically for the driving pressure difference in the range of 0.2 MPa over the flow resistance, which is caused by the reduction in the liquid-carrying velocity due to the reduction in the maximum value of up to 0.0473 m/s. In addition, when the liquid flow rate in the large pipe is less than the critical flow rate, the phenomenon of liquid accumulation in the pipe will certainly occur if we keep the production differential pressure and flow rate constant at this time and then reduce the diameter of the pipe to implement the process. Then, the flow rate in the pipe can be increased to the critical liquid-carrying velocity above to achieve the purpose of the small pipe to lift the liquid.

4.4. Wellhead Pressure

The magnitude of the wellbore backpressure will change the pressure distribution in the wellbore. When wellbore backpressure is considered, the main behavior is resistance coefficient (Ca) changes. Therefore, in this paper, the effect of backpressure is calculated equivalently by adjusting the Ca value of the gas phase. The relationship between Ca and back pressure is as follows: 0.1 MPa (Ca = 0.6), 0.15 MPa (Ca = 0.5), 0.2 MPa (Ca = 0.45), 0.3 MPa (Ca = 0.43), 0.35 MPa (Ca = 0.4). Then, the gas-phase liquid-carrying capacity with variable wellhead backpressure and other conditions unchanged (Table 2) is carried out. The results are shown in Figure 10.
It is indicated that an increase in wellbore backpressure causes the pressure gradient in the wellbore to change in a decreasing trend, which is due to the fact that the higher the wellbore backpressure, the smaller the actual true production pressure difference from the bottom of the well to the wellhead, which exhibits a decrease in the pressure gradient. The calculation of critical fluid-carrying velocity shows that it decreases with the increase in wellbore back pressure; because the fluid density inside the wellbore increases with the increase in wellbore back pressure, the concentration of the gas phase increases, and the overflow resistance of the droplet across the highly concentrated gas phase increases. Therefore, lifting the droplet under the condition of the driving force decreasing can be achieved by decreasing the total resistance. In analyzing Equation (4), the gas density has been increased with the increase in the back pressure of the wellbore, and the total resistance needs to be decreased. This is due to the liquid-carrying velocity term being a quadratic term; the change in its value is more sensitive to the resistance value. The resistance of the droplet across the gas phase decreases with the decrease in the velocity; thus, the total resistance is adjusted to be less than or equal to the driving force, and then the droplet can be lifted again.

5. Field Scale Application Prediction

The deep X-1 well, with a burial depth of 2000–2200 m, belonging to the deep coalbed methane wells, was completed in October 2021 with a horizontal section length of 1000 m, 11 fracturing sections, and a large amount of liquid discharge first after pressing. It was then formally put into operation and is currently using casing for self-flowing production, with a cutoff area of 0.01266 m2, producing gas of about 75,000 m3/day, making it one of the highest production wells of coalbed methane in China. The water production has been reduced to 60 m3/day and may be reduced to 5–20 m3/day in the follow-up. The casing pressure is around 4.0 MPa, and the flow pressure is between 7–8 MPa. Qualitatively, the well is characterized as a deep CBM well with a larger overall free-gas content than conventional CBM wells and is expected to self-inject production for about 1–2 years. The research point focuses on the primary concern of whether the straight well section accumulates fluids taking the maximum value of wellbore inclination of 90°, the inner wall roughness of the tubing column of 0.01524, the specific gravity of gas of 0.63, the specific gravity of liquid of 1, the diameter of the atomized droplets of 0.05 mm, the initial wellbore flow pressure of 7.5 MPa, the initial wellhead backpressure of 4.0, and the coefficient of drag of 0.44.
Applying the above liquid-carrying velocity calculation method and substituting known parameters, it is possible to clarify whether fluid accumulation occurs in the wellbore at different production pressure differentials, as shown in Table 3.
Then, according to the calculation of the interval between fluid accumulation and non-accumulation of fluid, we can acquire the following results: when the pressure gradient in the wellbore is 0.00234 MPa/m, the bottom hole’s flow pressure at the lower limit of the atomization and spraying of deep LF-X-2 wells is 4.68 MPa. The fluid does not occur in the wellbore when the bottom hole’s flow pressure is greater than this value, and when the pressure is less than this value, specific drainage and gas production measures are required. Then, this paper also calculates the size of the wellbore flow pressure corresponding to the cutoff of self-blowout of conventional wells without measures, i.e., taking the wellhead pressure of 0.1 MPa as the starting point for calculating the pressure and calculating the wellbore flow pressure along the wellbore downward. The maximum holding rate is calculated according to the daily production of 20 m3/d of water and the daily production of 7.5/(7.4/bottom well flow pressure) 10,000 m3/day. The actual pressure needs to be iterated in the calculation, and the wellbore flow pressure is 5.14 MPa after the calculation. According to the principle of flow coordination, it is known that if the wellbore flow pressure is less than 5.14 MPa, the wellbore will begin to accumulate liquid. Obviously, the atomization measures can delay the time of the gas well’s self-flowing, which can provide a transition time for the entry of pumping equipment, and the specific transition time is the bottom hole flow pressure decreases from 5.14 MPa to 4.68 MPa.

6. Conclusions

(1)
The wellbore droplet mechanics flow equilibrium equations were established, making it clear that the driving force on the droplets in the wellbore is the pressure difference between the upstream and downstream of the droplet flow as well as the buoyancy of the gas phase in the wellbore, and the resistance of the droplets is its own gravity and its resistance to the over-flow of the gas phase traversing the wellbore. Those are balanced, mutual games and indispensable, and it reveals that the reason for the accumulation of fluid in gas wells lies in the fact that the driving force on the droplets is less than the resistance to the flow, and the capacity of the gas phase to carry the fluid increases with the increase in the driving force.
(2)
The pressure gradient in the wellbore is the core of whether the gas phase can carry droplets from the bottom of the well to the wellhead, and the influencing factors of the liquid-carrying capacity should be considered: droplet size, wellbore inclination, wellbore diameter, wellhead backpressure; the pressure gradient decreases with the increase in droplet diameter, and the liquid-carrying speed needs to be increased by 1.45 times when the diameter increases by one time, and the liquid-carrying speed needs to be increased by 1.27 times when the inclination increases by one time. Moreover, the liquid-carrying capacity increases with the increase in wellbore diameter and decreases with the increase in wellhead backpressure.
(3)
Fogging-assisted production is a newly developed method for the gas well’s outflowing water, which can break well water into tiny droplets that can be more easily carried by the gas phase in the wellbore. It is conducive to prolonging the gas production time and providing an effective period of transitioning from self-flowing to pump production. It has a good prospect and potential for practical application.

Author Contributions

Investigation, R.W.; writing—review and editing, H.W.; data curation, G.S.; visualization, D.D.; conceptualization, C.Z. and Y.L.; formal analysis, W.Z.; writing—original draft preparation, H.W.; resources, H.W.; supervision, H.W.; funding acquisition, Y.L. All authors have read and agreed to the published version of the manuscript.

Funding

This research was funded by the company Shanghai Branch of CNOOC (China) Limited, funding name is “Study on fine reservoir description and residual gas distribution in Canxuebei Gas field”. Funding number: CCL2023SHPS013RS.

Data Availability Statement

The original contributions presented in the study are included in the article, further inquiries can be directed to the corresponding author.

Acknowledgments

Thanks to the co-authors Liu Yikun and WU Ruidong. Looking forward to cooperating with them again.

Conflicts of Interest

Authors Ruidong Wu, Gangxiang Song, Dongping Duan, Chunguang Zhang, Wenjuan Zhu were employed by the company Shanghai Branch of CNOOC (China) Limited. The remaining authors declare that the research was conducted in the absence of any commercial or financial relationships that could be construed as a potential conflict of interest.

Description of Symbols

c a Resistance factor, dimensionless
d Droplet diameter, m
D Tube diameter, m
f Resistance factor, dimensionless
g Gravitational acceleration, m s 2
H g Porosity, dimensionless
H l Liquid retention rate, dimensionless
M Molecular weight of gases, dimensionless
p Fluid pressure, MPa
R Universal gas constant
T f Fluid temperature, °C
v g Gas phase velocity, m s
v l Liquid phase velocity, m s
v g l Mixing speed, m s
z Gas compression factor, dimensionless
ρ g Gas phase density, kg m 3
ρ l Liquid phase density, kg m 3
ρ g l Mixture density, kg m 3
θ Wellbore inclination, °
σ Gas–water interface tension, N m

References

  1. Li, Q.; Liu, J.; Wang, S.; Guo, Y.; Han, X.; Li, Q.; Cheng, Y.; Dong, Z.; Li, X.; Zhang, X. Numerical insights into factors affecting collapse behavior of horizontal wellbore in clayey silt hydrate-bearing sediments and the accompanying control strategy. Ocean Eng. 2024, 297, 117029. [Google Scholar] [CrossRef]
  2. Li, Q.; Wang, Y.; Wang, F.; Wu, J.; Usman Tahir, M.; Li, Q.; Yuan, L.; Liu, Z. Effect of thickener and reservoir parameters on the filtration property of CO2 fracturing fluid. Energy Sources Part A Recovery Util. Environ. Eff. 2019, 42, 1705–1715. [Google Scholar] [CrossRef]
  3. Wang, F.J.; Xu, H.; Liu, Y.K.; Meng, X.H.; Liu, L.H.F. Mechanism of Low Chemical Agent Adsorption by High Pressure for Hydraulic Fracturing-Assisted Oil Displacement Technology: A Study of Molecular Dynamics Combined with Laboratory Experiments. Langmuir 2023, 39, 16628–16636. [Google Scholar] [CrossRef]
  4. Yun, J.; Xu, F.; Liu, L.; Zhong, N.; Wu, X. New progress and future prospects of CBM exploration and development in China. Int. J. Min. Sci. Technol. 2012, 22, 363–369. [Google Scholar] [CrossRef]
  5. Xu, F.; Yan, X.; Wang, F.; Ma, X.; Yun, J.; Wang, H.; Xu, B.; Zhang, S.; Mao, D. Development Strategy and Countermeasures of China’s CBM Industry under the Goal of “Carbon Peak and Neutrality”. J. Earth Sci. 2023, 34, 975–984. [Google Scholar] [CrossRef]
  6. Gao, L.-J.; Tang, D.-Z.; Xu, H.; Meng, S.Z.; Zhang, W.Z.; Meng, Y.J.; Wang, J.J. Geologically controlling factors on coal bed methane (CBM) productivity in Liulin. J. Coal Sci. Eng. 2012, 18, 362–367. [Google Scholar] [CrossRef]
  7. Li, X.; Fu, X.; Yang, X.; Ge, Y.; Quan, F. Coalbed methane accumulation and dissipation patterns: A Case study of the Junggar Basin, NW China. J. Asian Earth Sci. 2018, 160 (Suppl. S1), 13–26. [Google Scholar] [CrossRef]
  8. Liu, X.F.; Qi, Y.G.; Liu, C.H.; Zhao, P.H.; Yang, L. Calculation of dynamic loads of the sucker rod pumping system in CBM wells. J. Coal Sci. Eng. (China) 2010, 16, 170–175. [Google Scholar] [CrossRef]
  9. Yan, Y.W.; Li, Z.G.; Liu, K.; Li, F.; Zhang, Z. Application of hydrodynamic drive rodless pump drainage gas production technology in Bao-Ping 10 horizontal multilateral well. Oil Field Equip. 2021, 50, 61–65. [Google Scholar]
  10. Li, C.; An, Y.; Yang, Y.; Jiang, W.; Peng, L.; Liu, Y. Research on the Application of Double-Tube Gas Lift Drainage Recovery in Coalbed Methane Wells: A Case Study of the Hancheng Block, China. Lithophere 2022, 12, 9886330. [Google Scholar]
  11. Yan, X.; Zhang, S.; Tang, S.; Li, Z.; Zhang, Q.; Wang, J.; Deng, Z. Quantitative optimization of drainage strategy of coalbed methane well based on the dynamic behavior of coal reservoir permeability. Sci. Rep. 2020, 20, 202306. [Google Scholar] [CrossRef] [PubMed]
  12. Kurteev, V.A. Diaphragms for pneumatic pumps. Chem. Pet. Eng. 2011, 47, 550–556. [Google Scholar] [CrossRef]
  13. Liu, C.; Hu, C.; Chen, T. Wear analysis and life prediction of sucker rod and tubing under ternary emulsion lubrication in Daqing oilfield: A case study in block H. J. Pet. Explor. Prod. Technol. 2024, 14, 271–287. [Google Scholar] [CrossRef]
  14. Wang, H.; Dong, S. Research on the Coupled Axial-Transverse Nonlinear Vibration of Sucker Rod String in Deviated Wells. J. Vib. Eng. Technol. 2020, 9, 115–129. [Google Scholar] [CrossRef]
  15. Doty, D.R.; Schmidt, Z. An Improved Model for Sucker Rod Pumping. Soc. Pet. Eng. J. 1983, 23, 33–41. [Google Scholar] [CrossRef]
  16. Fakher, S.; Khlaifat, A.; Hossain, M.E.; Nameer, H. A comprehensive review of sucker rod pumps’ components, diagnostics, mathematical models, and common failures and mitigations. J. Pet. Explor. Prod. Technol. 2021, 11, 3815–3839. [Google Scholar] [CrossRef]
  17. Yang, Y.; Cui, S.; Ni, Y.; Zhang, G.; Li, L.; Meng, Z. Key technology for treating slack coal blockage in CBM recovery: A case study from multi-lateral horizontal wells in the Qinshui Basin. Nat. Gas Ind. B 2016, 3, 66–70. [Google Scholar] [CrossRef]
  18. Katagiri, N.; Kioka, A.; Nonoyama, M.; Hayashi, Y. Inhibiting flow-accelerated copper corrosion under liquid jet impingement by utilizing nanobubbles. Surf. Interfaces 2023, 40, 103067. [Google Scholar] [CrossRef]
  19. Wang, H.W.; Liu, C.J. Process parameters design method of drainage gas recovery technology in gas-driven pump for coalbed methane production. J. Pet. Sci. Eng. 2021, 207, 109167. [Google Scholar]
  20. Wu, D.; Tang, Z.; Dong, L.; Li, G.; Li, D.; Wang, L.; Shi, T.; Rahman, M.M.; Zhang, X. Enhanced ultrasonic spray ionization for direct mass spectrometry analysis of aqueous solution and complex samples using a single-orifice piezoelectric atomizer. Talanta 2023, 255, 124237. [Google Scholar] [CrossRef]
  21. Wang, W.; Cui, G.; Wei, Y.; Pan, J. A new model for predicting the critical liquid-carrying velocity in inclined gas wells. Pet. Explor. Dev. 2021, 48, 1218–1226. [Google Scholar] [CrossRef]
  22. Yang, J.; Chen, J.; Wang, Q.; Ye, C.; Yu, F. A simple and accurate model to predict pressure drop in vertical gas wells. Energy Sources Part A Recovery Util. Environ. Eff. 2024, 46, 1245–1259. [Google Scholar] [CrossRef]
Figure 1. Atomization-assisted gas production and atomization effect.
Energies 17 04185 g001
Figure 2. Physical model of a liquid droplet and force analysis.
Energies 17 04185 g002
Figure 4. Experimental test device and flowchart.
Energies 17 04185 g004
Figure 5. Comparison of wellbore pressure distribution.
Energies 17 04185 g005
Figure 6. Comparison of experimental and theoretical results.
Energies 17 04185 g006
Figure 7. Relationship between droplet size and critical liquid-carrying velocity.
Energies 17 04185 g007
Figure 8. Relationship between wellbore inclination and critical liquid-carrying velocity.
Energies 17 04185 g008
Figure 9. Relationship between wellbore diameter and critical liquid-carrying velocity.
Energies 17 04185 g009
Figure 10. Relationship between wellhead back pressure and critical liquid-carrying velocity.
Energies 17 04185 g010
Table 1. Parameter in partial differential numerical models.
FormulasEFG
(8) ρ g H g ρ g H g v g 0
(9) ρ l H l ρ l H l v l 0
(10) ρ g H g v g + ρ l H l v l p + ρ g H g v g 2 + ρ l H l v l 2 ( ρ g H g + ρ l H l ) g f ρ g l v g l 2 2 D
Table 2. Basis parameters of theoretical calculations and experimental test.
Parameter CategoryParameter ValueParameter CategoryParameter Value
well depth, m6specific gravity of gas0.63
Inner diameter of oil pipe, mm62specific gravity of a liquid1
Resistance coefficient, Ca0.45Atomizing droplet diameter, mm0.05
Wellbore Inclination, °90bottoming-out pressure, MPa0.4
Tube wall roughness0.00834Wellhead back pressure, MPa0.2
Table 3. Results of the relationship between bottom-flowing pressure and liquid accumulation.
Well
Bottom Flowing
Pressure
MPa
Wellhead Pressure
MPa
Minimum Pressure Gradient in the Wellbore.
MPa/m
Fluid AccumulationCritical Liquid-Carrying Velocity
m/s
Whether or Not to Atomize
7.54.00.00362No fluid accumulation0.020973yes
73.50.0034No fluid accumulation0.019096yes
6.530.0031No fluid accumulation0.016189yes
62.50.00286No fluid accumulation0.013418yes
5.520.00256No fluid accumulation0.008803yes
51.50.00239No fluid accumulation0.004401yes
4.510.00216fluid accumulation/yes
4.50.50.00222fluid accumulation/yes
4.50.10.00233fluid accumulation/yes
Disclaimer/Publisher’s Note: The statements, opinions and data contained in all publications are solely those of the individual author(s) and contributor(s) and not of MDPI and/or the editor(s). MDPI and/or the editor(s) disclaim responsibility for any injury to people or property resulting from any ideas, methods, instructions or products referred to in the content.

