Abstract
It is essential to protect control, regulation and data storage units used in automated robotic manufacturing from the consequences of harmful electrical grid harmonics. In this paper, the effectiveness of active/passive harmonic filters built into LED lamps, test benches, and industrial robots was investigated (in the latter two cases, light and heavy load states were applied). Based on network analysis, it was found that the built-in passive harmonic filters of the luminaries were ineffective because the THD of the current was approximately two or three times the permissible value according to the IEEE 519-2022 standard. It was proved that the built-in active harmonic filter of the test bench at a heavy load worked properly, but at a light load it was not effective, while the magnitude of harmonic distortion of the industrial robot exceeded the allowed level (three times the limit at a light load, seven times the limit at a heavy load). Further measurements were also performed at three locations: an engineering room, a gearbox house machine tool, and an office room (where there were no built-in filters). The results proved that in each case, there was a significant exceedance of the limit value. Therefore, protection against harmonics needs to be installed, and then the measurements must be repeated.
1. Introduction
Today, there are almost no mechanical movement or electrical energy conversion devices that do not rely on electronic power control. Since the electricity network is constantly changing, the main directions of research are forecasting and prognosis. Due to the drastic increase in the number of non-linear loads, it is possible to estimate the magnitude of harmonic distortions and the level of losses in residential, industrial, and office environments; one method for this is the Norton equivalent modelling technique []. Semiconductor production requires very high-quality electricity, and thus some energy providers create special strategies to improve the quality, which contribute to ensuring that its quality does not deteriorate either now or in the future []. In the processing industry, e.g., paper production, specific research has been carried out on the possible consequences of poor energy quality, what losses can be caused by inadequate electricity quality, and the effects of high harmonic injection equipment on the operation of other equipment []. The effect of harmonics was also investigated in a large steel factory and a forecasting program was developed to estimate the expected harmonic loads, which can also be used in the installation of new factories []. Since the load of IT equipment cannot be precisely determined in advance, research is being conducted to predict the harmonic injection of a large number of single-phase computer equipment in the case of offices and office buildings []. Currently, the impact of renewable energy sources on energy quality is also a major problem, since the basic component of these devices is a DC/AC inverters containing non-linear elements; therefore, due to their mass distribution, they must be treated as a high or even priority hazard []. The EMS (Energy Management System ISO 50001) standard [] also requires the use of power-controlled drives above certain power limits, but different types of induction heating devices can also be classified as electrical energy conversion equipment. These non-linear devices have electrical transducer feedback. The possible theoretical errors caused by distorted waveforms are well known; the sine waves of current and voltage under normal conditions are pure sine waves, but they are distorted in systems containing harmonics [].
Researchers often deal with the comprehensive modelling of the components of an energy supply system, as well as the simulation of wind and solar power plants and the in-depth description of the effects of harmonics. One of the possible methods for reducing harmonics is the design of passive filters []. In the electricity system, photovoltaic (PV) energy belonging to renewable energy sources is connected to the electricity distribution network via an inverter which can generate harmonics near the switching frequency. Therefore, losses due to harmonics must also be considered in this case. The harmonic impedance can be modelled, and the harmonic losses can also be calculated in advance []. Problems caused by the distortion of waveforms generally include the distortion of power supply voltage waveforms, resonance risks in systems at high frequencies, the failure of sensitive electronic devices, PLC and CNC devices, malfunctions in protection and control systems, and overheating in electric motors and transformers []. Studying the effect of current harmonics on distribution transformers is crucial for the network planning and maintenance activities of energy providers. Therefore, the effects of harmonics on eddy current and other stray losses, the temperature of the hottest point, and the lifetime of distribution transformers are investigated []. The frequency and magnitude of the problem depends on factors such as the type of installation, the operating voltage level of the installation, the type/intensity of the load and the short-circuit power of the network [].
Practical experience shows that in electricity supply, it is difficult to recognize whether the size of the harmonics in the grid is already harmful. Unfortunately, even nowadays, suppliers carry out direct network analysis only for large consumers and there is an ongoing debate about what amount is produced by the industrial installation and what is delivered to the consumer from the supplier’s network. Companies seldom carry out audits of their internal electrical network and these analyses are mostly only aimed at detecting and documenting “blackouts”. Direct testing of low-power equipment [] such as office and production control equipment, controls, light sources, dimmers, etc., is often left out of the audit. Today’s largest sources of harmonic disturbance are electronic power controls and LED light sources [,]. Several types of LED lamps produce different amounts of harmonic current depending on the ballast configuration. This harmonic distortion can be reduced by combining different types of LED lamps, although this is not common practice in industrial halls in order to maintain the homogeneity of lighting. The voltage sag tests show that all tested lamps are sensitive to the magnitude and duration of the voltage sag []. The high harmonic content of the phase currents and the current of the neutral conductor can be detected in the case of LED lamps. LED lamps with controls can cause excessive heat production in the wires during operation. In circuits loaded with such current harmonics, it is necessary to apply the methodology of cable selection, primarily because of the possible high neutral conductor current []. Of course, the development of models of LED lamps and their analysis makes it possible to calculate and predict the harmonic emission. The parameterization of these model is determined based on experimental measurements [].
Plug-in hybrid and pure electric vehicle chargers are sources of harmonic disturbance as well. For predictions, the effects of EV charging load on cable current and temperature in the presence of harmonic currents of different magnitudes and orders are modelled for two typical modes of EV charging, peak-time and off-peak home charging []. In the case of plug-in hybrid electric vehicles (PHEV), not only is their harmonic injection investigated, but also the effect of their charging electric load on the transformer loss-of-life, since the accurate prediction of charging load is almost impossible due to its stochastic nature. Therefore, a stochastic model can be used to examine the effect of real-time charging rates on the charging load and the resulting effect on transformer derating. By using a stochastic model, the effect of real-time charging rates on the charging load and the resultant impact on transformer derating can be investigated []. When designing the load control of intelligent distribution systems, the effect of generated current harmonics by electric vehicle battery chargers must be considered. Research shows that charging EV batteries in plug-in electric vehicles increases power losses more than harmonic currents. It was proved that charging EV batteries in plug-in electric vehicles increases power losses rather than the harmonic currents [].
2. Harmonic Disturbance Sources
Any distorted, non-sinusoidal periodic function can be analyzed using Fourier’s theorem and represented as the sum of terms consisting of the following components [,,]:
- The DC component, if applicable;
- A sinusoidal term at the fundamental frequency;
- Sinusoidal members (harmonics) with a frequency represented by a multiple of the fundamental frequency.
The nth-order harmonic (usually called the nth harmonic) in the signal is the sinusoidal component with a frequency n times the fundamental frequency. A distorted periodic current waveform expanded into a Fourier series is expressed as follows []:
where I0 is the DC component, In is the maximum value (amplitude) of the nth harmonic, ω is the angular frequency (2π times the fundamental frequency), while Φn is the initial phase of the harmonic component at time t = 0. That is, a distorted periodic signal has a fundamental frequency component, namely 50 Hz, plus a second harmonic component of 100 Hz, plus a third harmonic component of 150 Hz, and so on. Harmonic distortion of the voltage waveform affects both electricity distribution networks and consumer equipment. Harmonic distortion levels have increased rapidly in electricity networks in recent years, mainly due to the increasing use of non-linear semiconductor devices, which are responsible for a large portion of the harmonic distortion [,].
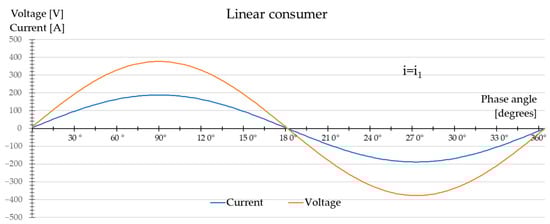
Figure 1.
Linear consumer waveforms.
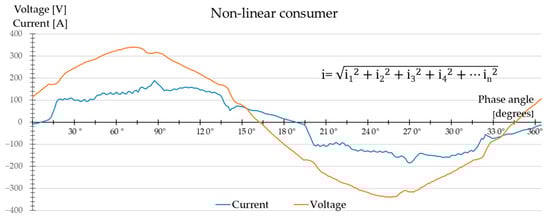
Figure 2.
Non-linear consumer waveforms.
One can see that the current of linear consumers is proportional to the voltage applied to them with the same waveform. In the case of non-linear consumers, the resulting current is calculated by the RMS (root mean square) [] formula, i.e., the square root of the sum of the squared harmonic currents. If their current in the frequency domain is analyzed (the spectrum of the signal is obtained by Fourier transform), one can see that, in addition to the fundamental harmonic of the mains (50 Hz), there are also integer multiples of it (100, 150, 200, 250 Hz, etc.). The harmonic distortion of the mains voltage is due to the harmonic currents of non-linear loads. These currents flow through the impedances of the electrical network, creating harmonic voltages. This effect is called the harmonic feedback of consumers [].
It should be noted that not all types of loads inject harmonics into the supply system. This depends on the type of load characteristics. While in the previous figures the line current and its harmonic components are represented by time-domain waveforms, it is simpler and more common to represent harmonics using the current spectrum. In Figure 3, the fundamental harmonic of the current (50 Hz) and the third (150 Hz), fifth (250 Hz), seventh (350 Hz) and ninth (450 Hz) harmonics of the current are plotted in the time domain over a period T.
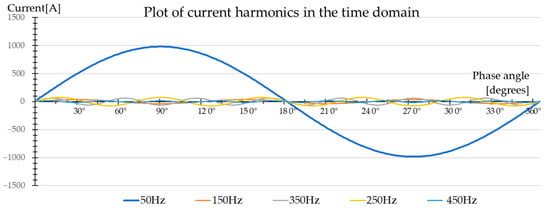
Figure 3.
Plot of the current harmonic components of a distorted current waveform.
Summing these sinusoidal waveforms gives the true waveform of the current, as illustrated in Figure 4.
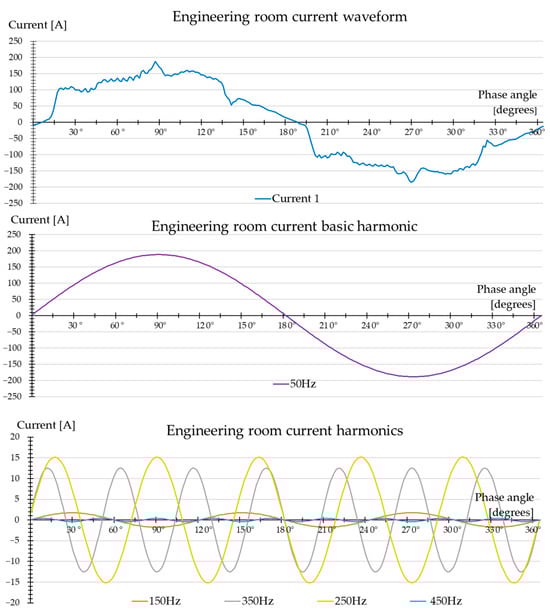
Figure 4.
Distorted Current 1 waveform with fundamental and harmonic components.
Waveforms can be produced from a basic sine component and the sum of superimposed sinusoidal harmonics. The generation of the waveform of Current 1 is illustrated in Figure 4. Current 1 consists of a 50 Hz fundamental component and harmonics of different orders and magnitudes with respect to the fundamental harmonic. In this case, harmonics are only denoted to the ninth odd order, but they can be denoted up to 256 orders (of course, it is worth investigating this as far as useful information can be obtained).
The frequency domain spectra of these harmonic currents are illustrated in Figure 5 as amplitude (magnitude) values in reference to the fundamental harmonic (50 Hz). This spectrum shows the amplitudes of the harmonic orders for each harmonic frequency. As shown in Figure 4, the fifth and seventh harmonics have a greater amplitude. Since the plots are based on our own real measurements, the ratios of the time- and frequency-domain currents are the same.
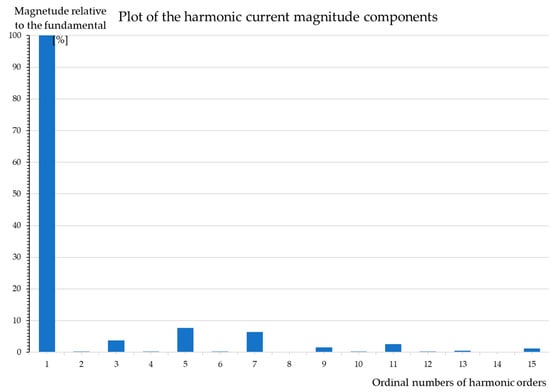
Figure 5.
Plot of the harmonic current magnitude components of a distorted current waveform.
It is well known that harmonics are sinusoidal voltages or currents whose frequency is a multiple of the fundamental frequency at which the power supply is designed to operate (e.g., 50 Hz). An electrical supply system is inherently very passive, and the source outputs and the voltages measured across the system would be close to sinusoidal at the declared frequency if there was no load connected to the system. It is well known that for a pure sinusoidal voltage wave with a frequency of 50 Hz and an amplitude of 230 V, the spectrum would be zero at all frequencies except 50 Hz, where the value would be 230 V. For a distorted voltage wave, the spectrum contains harmonic frequencies characteristic of the nature of the distortion. The basic frequency is the component of the spectrum at which the network is designed to operate. It is usually the first and largest component of the spectrum, as can be seen in Figure 5. The term “total harmonic distortion” (THD) describes the effective sum of the voltages of all harmonic frequencies present relative to the fundamental.
The two most commonly used distortion indicators are the individual and the total harmonic distortion indices, which are usually described by Equations (2) and (3). The former shows the ratio of the component observed at a given ordinate h to the fundamental harmonic, while the latter relates the resulting harmonic content of the signal to the basic harmonic. The two indicators can be determined for both voltage and current as follows []:
where Uh is the harmonic voltage of order h, U1 is the fundamental harmonic voltage, Dh is the individual harmonic distortion, while THDU is the total harmonic distortion. During the measurements, the true RMS [] value for any signal was measured. This true effective value of the current returns the effective value that has the same effect and is capable of the same performance as the direct current of the same voltage or current. Thus, in the case of a non-linear consumer, according to Figure 2, the true effective value of the current is equal to the square root of the square sum of the current of the fundamental harmonic and harmonics described by Equation (4).
3. Switching Power Supplies
Over the last 20 years, switching power supplies have increasingly replaced the transformer rectifier power supplies in electronic equipment. These devices generate a large amount of fifth harmonic emissions relative to their rated power consumption, which are randomly phase-directed and thus can add up [,]. Consequently, in power systems, at all voltage levels up to 400 kV, the background level of harmonic level distortion is increasing. In three-phase distribution networks, odd harmonics are most common. It is essential to measure harmonics of the orders 3, 5, 7, 9, 11, 13, etc., up to harmonics of the order 25, as practical experience has shown. As the harmonic voltage distortion increases, the risk of widespread problems due to premature ageing of the equipment and overloading of the neutral conductors increases. Generators in the power system usually produce a pure sine waveform at their end points. This sinusoidal waveform is considered to be the pure form of the AC voltage, and deviation from it is called distortion. More and more consumers are drawing a non-sinusoidal current from the electricity system. As a result, as described above, due to sine wave distortion of the grid voltages and currents, several zero crossings can occur within a period []. The consequence will be a malfunction of the switching power supplies. As an example, consider the circuit shown in Figure 6.
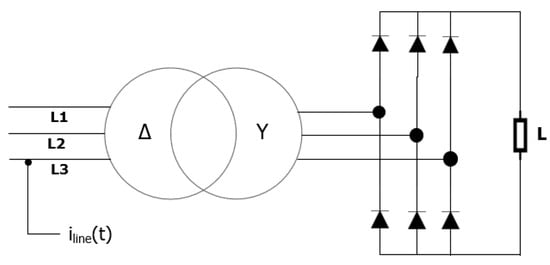
Figure 6.
Example of a load that takes a non-sinusoidal load from the network.
The thyristor bridge is connected to a pure sine wave network via a transformer. The frequency of this sine wave is called the fundamental frequency f1. When the load is connected to the power supply, a line current flows, denoted as iline(t). Figure 7 shows an approximation of the current waveform.
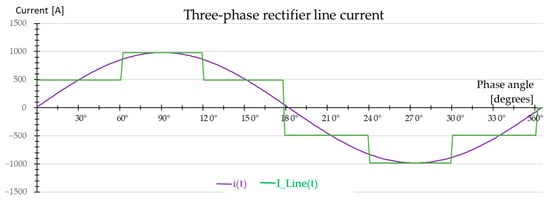
Figure 7.
Line current flowing in the branch of a three-phase, two-way, six-stroke (3F, 2W, 6S) diode rectifier power supply.
From this figure, it can be seen that the line current iline(t) is very different from the sinusoidal current waveform, the fundamental component i(t), and therefore something must be added to this sinusoidal component to obtain the actual current flowing. To determine what this “something” is, look at Figure 8, which shows the waveform of the current obtained by adding component i_h5(t) with a frequency equal to five times the fundamental frequency to the i(t) component.
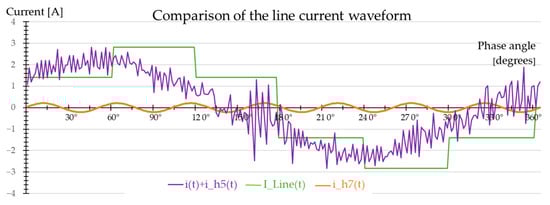
Figure 8.
Comparison of the line (t) line current waveform with the i(t) + i_h5 (t) waveform.
Currently, power electronic control-based equipment is the main source of harmonic pollution in low-voltage networks []. Usually, in such equipment, the switching semiconductor conducts only in a fraction of the base period, as this is how this type of equipment can gain its main characteristics of energy saving, dynamic performance, and control flexibility. It has been mentioned earlier that generators in the power supply system usually output a pure sinusoidal waveform at their end points; this sinusoidal waveform is the pure form of the AC voltage, and deviation from this is called distortion. Currently, there are more and more consumers with different power electronics solutions—due to the use of semiconductors in switching mode—causing the equipment to draw a non-continuous current from the power system, rather than a sinusoidal current, with a significant amount of distortion. The explanation for the formation of harmonics is as follows. While in linear consumers there is a direct proportionality between voltage and current, in non-linear, non-continuous consumers, it is observed that the current no longer follows the sinusoidal voltage waveform, but so-called positive and negative current peaks occur. Since the semiconductors used in switching mode conduct for only a fraction of the base period of the mains period, the consumers draw pulsating input currents from the mains, and these feedbacks caused by the pulsating currents cause the harmonics in the mains.
The aim of this study is to identify precisely the potential problems caused by harmonics, especially in electronic and IT devices used in industry. Later, an exact mathematical method must be found to identify the harmonics generated and to calculate the network feedbacks for preventive purposes, so that the expected magnitude of harmonics can be predicted at the design stage of electronic circuits. In addition, this information can be used to find specific, local, cost-effective filtering methods for existing harmonics in the electrical network, targeting to the sensitivity of the equipment concerned.
4. Possible Consequences of the Presence of Harmonics
From the distorted signal shapes shown in Figure 8, it can be seen that if multiple zero crossings are created, the circuit controlling the thyristors, synchronized with the zero crossing, will make faulty connections and thus, due to the increase in the fill factor, the output voltage of the switching power supply may increase—if no overvoltage protection is installed—and destroy the circuits it supplies. This process can be seen in Figure 9.
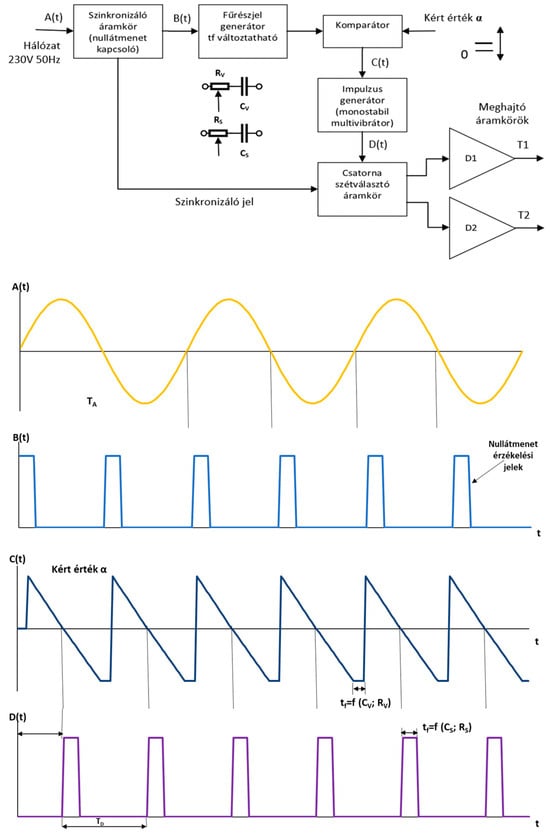
Figure 9.
Block diagram and control of a network zero-crossing synchronized thyristor IC.
The presence of harmonics can also have other consequences, such as the skin effect []. DC current is homogeneously distributed across the cross-section of the conductor, so the current density is the same over the entire surface of the conductor. In the case of alternating current, at high frequencies, this is no longer true because the alternating current always tends to flow near the outer surface of the conductor, caused by the electro-magnetic field surrounding the conductor and varying with frequency, which creates a current in the conductor similar to an eddy current. According to Lenz’s law, this current is not eddy-like, but is in the opposite direction to the current generating the magnetic field. As the two currents repel each other, the collateral magnetic field forces the conductor current to the surface, which becomes more and more pronounced at increasing frequencies.
In the vast majority of cases, this is not considered at the mains frequency of 50 Hz, as the effect is negligible at this frequency. However, from 250 Hz onwards, i.e., from the fifth harmonic upwards, at higher frequencies, the skin effect is significant, as it creates increasing collateral losses. This should be considered especially when sizing single-core cables. Harmonics also influence plated busbars, reducing the skin effect, but because of their sizing in relation to the resonance, harmonics must be taken into account.
5. Filtering Harmonics
If the distribution network is “polluted” with harmonics, the quality parameters of the energy service are also significantly degraded []. The true RMS value of the current in the neutral conductor increases. If a fully symmetrical load is assumed in the three-phase power system, i.e., loads of equal magnitude are connected between each phase and the neutral, then the fundamental, positive-order, and negative-order harmonics are eliminated in the summation, while the zero-order ones are summed algebraically. For this reason, the current in the neutral conductor will not be zero even with a symmetrical load since the sum of the zero-sequence currents in the three phase conductors flows in the neutral conductor in the case of a four-wire Y connection. The effective value of the current of the neutral conductor can be calculated as the square root of the sum of the squares of the effective value of the zero-order currents. In the case of symmetrically connected non-linear loads, this results in a significant additional load in the neutral conductor. This results in a substantial excess load in the neutral conductor for symmetrically coupled non-linear loads. In locations where most loads are non-linear, e.g., office buildings, two to three times the phase conductor current may flow in the neutral []. Harmonics may cause overloading in generators, motors, and transformers []. In a harmonics-contaminated network, electrical equipment may be subject to unwanted vibration and premature ageing, as well as the hum and unwanted sound effects of transformers are also increased, not to mention the overloading of phase correction capacitors, which can also lead to their premature ageing and premature replacement, generating significant costs for users.
In a three-phase symmetrical system, if there are no current harmonics, of course no current flows in the neutral conductor. However, in the presence of harmonics, significant current flows in the neutral conductor, which can be several times that of the phase current. The protections may be unduly tripped, reducing the security of the power supply and the life of the protection circuit breakers. The reactive current also causes disturbances in the operation of compensation systems, generating resonant voltages in the resonant circuit formed by the inductive nature of the network and the capacitive system of the reactive current compensation.
In reality, the resulting voltage distortion is proportional (to a limited extent) to the impedance of the power supply, which proves that the harmonic source is a current generator. The impedance of the supply network is usually very small, so the voltage distortion caused by the harmonic current will be small, often so small that it is lost in the background noise. This can be misleading because it gives the impression that there is no harmonic problem, when in fact there are large harmonic currents. This problem can be compared in an attempt to find circulating currents in the ground by measuring the voltage. So, if one suspects or tries to prove that there are no harmonics, the current has to be measured.
One of the simplest solutions for filtering out the third harmonic is the transformer [,], which is provided by default in all medium-voltage/low-voltage transformers (MV/LV transformers), so that in the case of wye/delta grounded transformers, the 3rd harmonic current is not transferred to the delta side. This is not only applicable for the MV/LV voltage conversion, but can also be used as a decoupling transformer, thus ensuring that the third harmonic is filtered out. However, in the case of high-power transformers, due to the capacitance between the primary and secondary windings, which can be very high, high power can be used to transfer harmonic voltages from the primary side to the secondary side. Also problematic are the harmonics from the power grid coming through the neutral and the earth conductor, of which the transformer does not filter out any harmonics. Therefore, when choosing the cross-section of the neutral conductor, it is essential to consider the harmonic potential content of the grid.
With active harmonic filters, the consumer current signal is made as perfect as possible by injecting an opposite-signature harmonic current in “real time” into the harmonic-contaminated current drawn by the consumer, thus providing a clean (50 Hz) sinusoidal signal waveform to the mains, which does not distort the mains voltage. Today’s active harmonic filters can track this with a response time of 300–500 µs, which is comparable to the 50 Hz mains frequency, i.e., the 20 ms mains T period. Compensation is carried out up to the 50th harmonic, but in practice currents above the 25th harmonic are not often encountered. IGBT-insulated gate bipolar power transistors with a switching frequency of 10 to 15 kHz are used to generate the signal waveforms.
Another power quality improvement technique is APLC (active power line conditioning) [,], which is an active filter type that compensates for distortion of the power system waveform. The objective was to develop and present a procedure to calculate the amount of APLC-injected current required to minimize voltage harmonic distortion in the entire power system. The procedure is intended to be applied with APLC frequency domain correction in networks where periodic harmonic distortion is experienced. The injection currents are determined using non-linear optimization theory. The main solution lies in the development of a simple procedure for finding the Fourier series of the optimal APLC injection current waveform. The procedure can be applied in any of the following situations: 1. single-phase APLC in a single-phase network; 2. single-phase APLC in a three-phase network; or 3. three-phase APLC in a balanced three-phase network.
An active harmonic filter with a series design is shown in Figure 10.
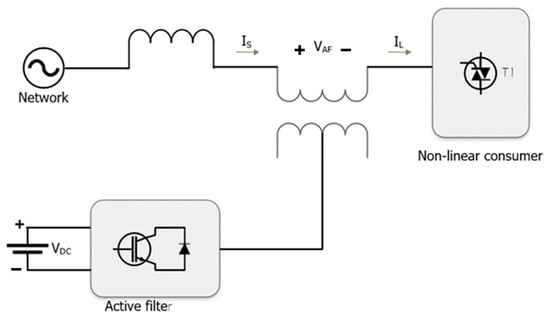
Figure 10.
Active filter with in-line design.
This type of filter is connected to the mains through a dedicated transformer. It has the advantage of compensating for the effects of voltage drops and directly influencing the harmonic content of the voltage. Its major disadvantage is its high production cost due to its complex design and, as can be seen from the wiring diagram, the fact that it is very difficult to integrate into the existing electrical network. Therefore, instead of this type of filter, the shunt-type filter has become more widespread in practice and is almost the only one used today.
An example of an active harmonic filter with a shunt design is shown in Figure 11.
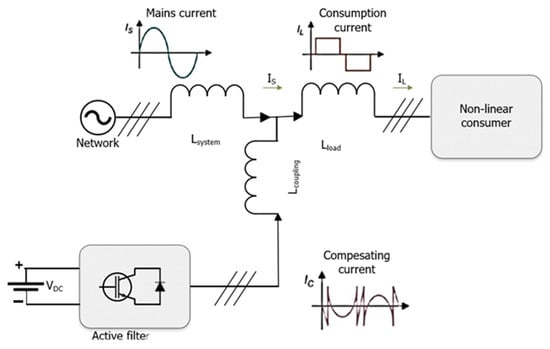
Figure 11.
Shunt design active filter.
This type of filter injects a current of the same magnitude as the measured harmonic current generated by the non-linear consumer, but in phase opposition, into the network, resulting in a current flowing to the incoming network containing only fundamental harmonics []. This is described by Equation (5).
Inetwork = Ifilter + Iload
The filter uses PWM (pulse-width modulation) to generate the expected signal shape. This filters is capable of filtering harmonics up to 50 orders. For this purpose, an inverter with an NPC (neutral point clamped) [] topology is used, using IGBT upstream drivers [].
6. The IEEE 519-2022 Standard Recommends
In order to evaluate the measured data, it is essential to know the relevant standards. When examining the standards, a distinction must be made between the maximum permissible voltage and current distortion values recommended for the power supply’s electricity distribution network, devices and equipment connected to the so-called residential network, and the internal electrical network of industrial facilities. The MSZ EN 61000-3-12 or IEC 61000-3-12 standards must be used to test a product under laboratory conditions, while the IEEE 519-2022 standard (not yet a Hungarian standard) recommends maximum permissible harmonic distortion values for equipment installation. In cases of current harmonics, the creators of the IEEE 519 standard decided to limit the magnitude of current harmonics depending on the power of the voltage source. This is logical since a network with a high electrical power can suppress the effect of current harmonics to a much greater extent without affecting its voltage than a network with a lower power. The purpose of creating current harmonic limits was to limit the harmonic injection of individual consumers into the network so that they do not cause unacceptable voltage sine wave distortion []. The IEEE 519 standard specifies limits for order-by-order harmonic distortion and total current demand distortion (TDD), not total harmonic distortion (THD). THD specifies the maximum possible values only for the voltage and causes its magnitude to depend on the voltage level of the common connection point (Point of Common Coupling—PCC). A significant difference is that in the IEEE 519 standard, the limit values of voltage harmonics are constant at all frequencies, while in IEC 519, the permissible magnitude of voltage harmonics decreases with frequency. Among other things, the IEEE 519-2022 standard imposes two requirements on harmonics—the absolute maximum voltage distortion (THD), i.e., the previously mentioned THDU, as well as the harmonic distortion according to the variable maximum total current demand (TDD). In the case of the former, one can see the relevant limits in Table 1, while for the latter, they can be seen in Table 2. TDD depends on the ratio of the short-circuit current (ISC) of the common electrical network connection point (PCC) and the load current (IL) of the connected device. In this way, the effect of current harmonics produced by individual equipment on the network can be distinguished. The reason for this is that the harmonics produced by consumers with lower current consumption are less able to influence the quality of electricity on the network compared to large consumers. The TDD values allowed in the standard refer to the given common connection point (PCC), which ensures the connection between the high-current supply point and the connected equipment and can be used at any voltage level. In industrial conditions, the PCC is considered an internal point of the own electrical network or electrical distribution system. IEEE 519-2022 differs from the original intent of IEEE 519 in that the latter considers only the point of connection between the power supplier and the consumer. In contrast, IEEE 519-2022 already allows the internal electrical network to be divided into several connection points (PCC). Thus, in a large-scale industrial facility, the limit values of the standard can be applied separately to several common connection points with different power currents protected by circuit breakers.

Table 1.
Recommended possible voltage distortion limits by the IEEE 519-2022 standard.
Table 2.
Recommended possible current distortion limits for systems rated 120 V through 69 kV by IEEE 519-2022 standard.
7. Network Analysis
It is essential to investigate the sine-wave distortion effect of non-linear loads on the network under real measurement conditions [,]. Our analyses were carried out in 2023 and 2024 at an industrial facility. The aim of the measurements was to test the harmonic injection of individual equipment and equipment groups at the PCC of the electrical network. This allowed us to obtain information on the extent to which building services and manufacturing equipment, office buildings, and halls can be considered as the potential sources of harmonic disturbances and their impact on power quality. These measurement results can be used in comparative analyses in our future research. For example, whether the principle of superposition can be applied to current harmonics in grouped installations, whether the magnitude of harmonics increases linearly with the number of identical installations, or whether the magnitude of harmonics of the same order decreases for certain harmonics can be assessed. For similar machines, the questions of do they add together in orders and does the amplitude of the current harmonics increase proportionally with the frequency can be addressed. During the analyses, the effectiveness of the passive and active harmonic filters installed by the manufacturers both in the loaded and unloaded states of the tested equipment were validated. For the measurements, the network analyzer type PQA824 from the manufacturer HT Italia SRL Faenza (RA)-ITALY [] was used. The main features of the instrument were recording MIN/MAX/AVG, voltage anomaly detection, harmonic analysis, patch analysis, flicker analysis, recording of high-speed voltage transients from 5.5 μs, and recording of turn-on currents. The instrument was parameterized according to the user’s manual, while the recorded data were read out by using HT Italia’s Topview software version 2.2.2.3 []. The measurement results were evaluated using fast Fourier transform (FFT). Measurements were performed for three different consumers: an LED lamp, a test bench, and an industrial robot.
7.1. LED Lamp Built-In Passive Harmonic Filter Validation
Currently, LED lighting is used in almost all industrial facilities, halls, and offices, but also in the case of workplace lighting. It can be predicted that these electricity consumers can also have a serious impact on the quality of electricity []. The aim of this study is to determine the effectiveness of the passive harmonic filters built into the luminaires. This was investigated through network analysis, in the case of a single LED luminaire, and by measuring the lighting of an entire hall at the feed point. First, one HIAL 2000/840/W/F type LED lamp was examined with 230 V voltage and 140 W electrical power. These fixtures have a built-in passive harmonic filter, according to the distributor.
The voltage and current waveforms for one period are shown in Figure 12. The waveform of the current has been distorted to such an extent that its sinusoidal waveform cannot even be recognized. One can also see multiple zero crossings. The total harmonic distortion (THD) of the current was 15.20%. The harmonic distortion according to the total current demand (total current demand distortion—TDD) was also determined. It was 16 A/1 A = 16. According to Table 2 the permissible distortion could only ne 5%, so the difference is more than three times the permissible level, namely 10.20%.
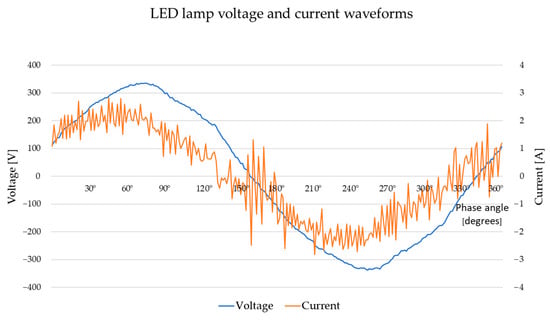
Figure 12.
LED lamp’s distorted current and voltage waveform.
Figure 13 shows the current spectrum. According to Table 2, the maximum possible value per harmonic order up to the 11th harmonic recommended in the standard is 4%, but these current amplitude values are 7.82% and 7.45% for the 3rd and 7th harmonics. Since the waveform of the current in this case also indicates that there may be harmonic emissions at higher frequencies, the spectrum of the current in the supraharmonic range (2–150 kHz) was also examined, which can be seen in Figure 14. From the 79th order (3.95 kHz) to the 127th (6.35 kHz), it approaches and in many cases even significantly exceeds the 0.6% allowed magnitude of the amplitude relative to the fundamental harmonic according to Table 2. This is important because in practice, the harmonic pollution of the equipment above the 15th harmonic order is no longer examined and, as one can see, it would also be necessary to carry out this in the case of higher orders.
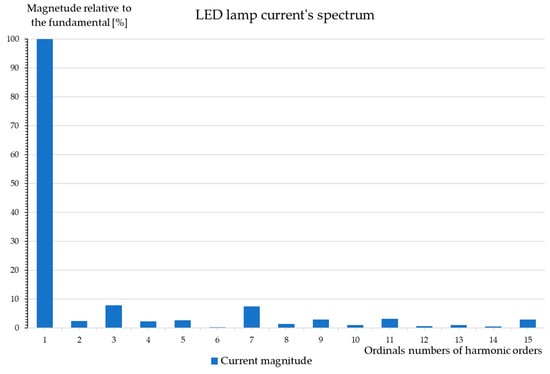
Figure 13.
LED lamp’s harmonic current magnitude components of the distorted current waveform.
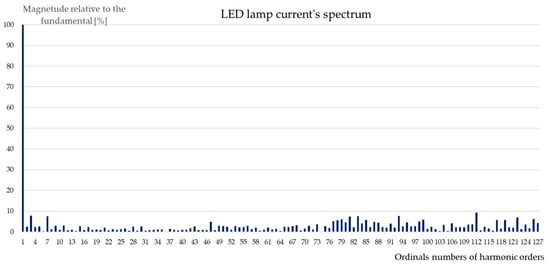
Figure 14.
LED lamp’s supraharmonics current magnitude components of the distorted current waveform.
This measurement was performed with one and two LED lamps, and there were no significant differences in the signal shapes and the degree of distortion. The table provided by the TopView software version 2.2.2.3 displaying the voltage, current and THD measurement results of the analyzer is shown in Figure 15. From the measurement results based on the graphs, it can probably be concluded that the built-in passive harmonic filter is either not included or is ineffective.
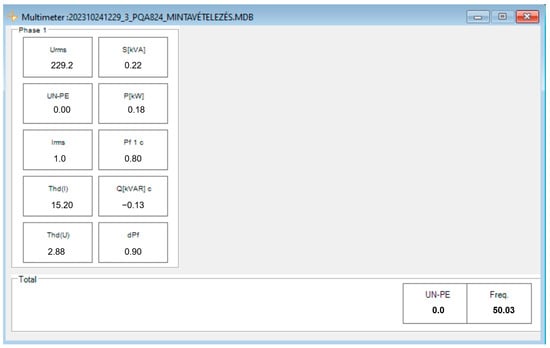
Figure 15.
LED lamp’s measured voltage, current, THD, and power factor provided by TopView.
7.2. LED Lamp Built-In Passive Harmonic Filter Validation in the Case of Hall Lighting
It was found that the larger these distortions are in the case of lighting an entire production area, the larger the harmonic injection of the hall lighting towards the electrical distribution network is. The hall was empty, meaning that there was no production equipment or other office equipment that could influence the measurement. Figure 16 shows the measurement results of this hall. Four hundred 140 Watt electric power lamps were installed, with a total of 56 kW of maximum effective electric power consumption. Based on Figure 16, it can be said that the voltage waveform is almost pure sinusoidal, and the distortion of the current is not significant. Since the magnitude of the currents of each phase and the THD of the currents were almost the same, it made sense to analyze only the current of phase 2.
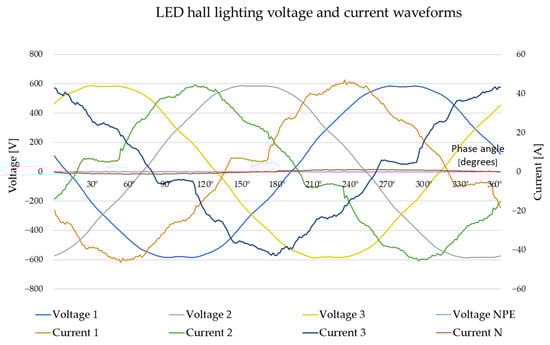
Figure 16.
LED hall lights’ distorted current and voltage waveform.
The value of the current’s total harmonic distortion was 14.71% for the i2 current. The harmonic distortion according to the total current demand (TDD) is 2300 A/28.3 A = 81.27. According to Table 2, the permissible distortion can be only 8%, so the deviation from the limit value is 6.71%. Figure 17 shows the current spectrum. One can see that instead of the 7% allowed value up to the 11th harmonic in Table 2, the values of the 3rd and 7th harmonics are 10.98% and 6.73%, respectively. The table provided by the TopView [] software displaying the voltage, current, THD, and reactive energy measurement results of the analyzer is shown in Figure 18.
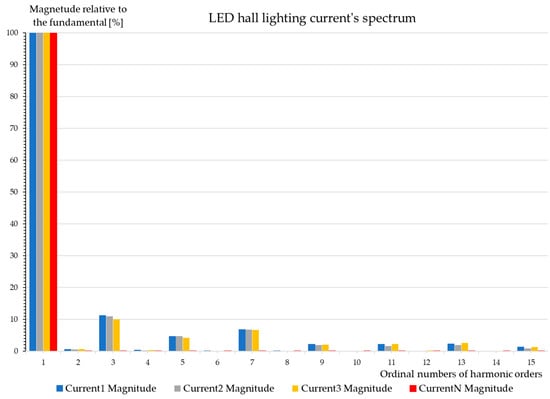
Figure 17.
LED hall lights’ harmonic current magnitude components of the distorted current waveform.
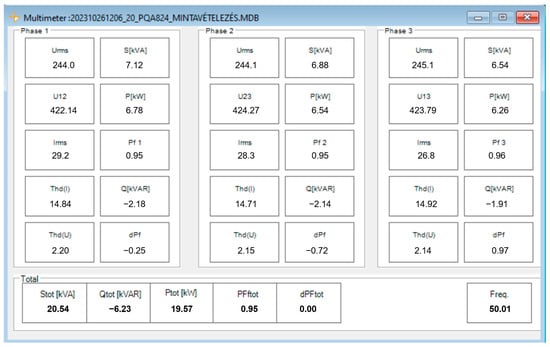
Figure 18.
LED hall lights’ measured voltage, current, THD, and power factor provided by TopView.
Comparing the results of the individual LED lamp and the group LED hall lighting, the difference is clearly visible. According to Figure 16, the current sine wave distortions of the same magnitude as in the case of a single LED lamp do not appear. But, by looking at the spectra in Figure 17, one can see that the magnitude of the amplitudes per order is very similar to the individual luminaire measurement in Figure 13. This proves that the harmonic distortions of the individual LED luminaires are preserved even in the case of grouping a large number of units distributed by phase, and they do not compensate for each other’s distortions. However, the harmonics of the individual luminaires do not add up according to the principle of superposition. This will be an important research result for sizing the central harmonic filter of the lighting distribution network.
7.3. Test Bench Built-In Active Harmonic Filter Validation
In the following, the measurement results performed in a modern factory are presented. The efficiency of an active harmonic filter installed in a test bench equipped with a high-performance frequency converter at full load and during use in the more typical low-load or idling state was examined.
7.3.1. Test Bench at a Heavy Load
In this case as well, the magnitude of the currents of each phase and the total harmonic distortion of the currents was almost the same (see Figure 19); therefore, only Current 3 was analyzed here. The maximum value of the current of the neutral conductor was 5.15 A, which is negligible compared to the maximum phase currents of 108.2 A. The network analysis was carried out with the machine in the extended state under normal production conditions. The applied current varied between 103.3 A and 108.2 A per phase, so it can be considered symmetrical. On the other hand, there was a high level of harmonic current pollution, and therefore the current waveform was also highly distorted. Thus, the THD of the current was 4.35% for Current 3. As was mentioned before, the proposed maximum allowable value of THD as defined in IEEE 519-2022 is given by the TDD. This ratio is now 630 A/108.2 A = 5.82, and according to Table 2, the permissible distortion can only ne 5%. In the case of Current 3, this value is 4.35%, which corresponds to the requirements of the standard, and the built-in active harmonic filter works properly.
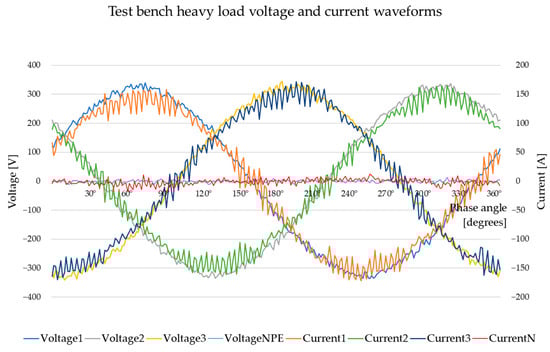
Figure 19.
Distorted current and voltage waveforms measured on the test bench at a heavy load.
Note that the current of the neutral conductor is 5.15 A, but it should be zero in normal operation. The current in the neutral conductor is caused by the not perfectly symmetrical (slightly asymmetrical) load, which was negligible in this case. But in the case of larger neutral conductor currents when its magnitude approaches the magnitude of the phase conductor current, this can cause overloading and overheating in the line in the transformer, which can lead to failures []. Electricity distribution networks are in most cases TN (three-phase neutral systems) [], and in this system, the secondary windings of the transformer are connected to a star and the star points of the windings are grounded and the neutral conductor is connected to this point. All harmonics are found in the phase voltages, and hence harmonics appear in the phase and line currents. The neutral current is the sum of the phase currents. The effective value of this current will be the square root of the square sums of the zero sequence currents. This current causes an additional load in the neutral conductor for symmetrically connected non-linear loads, the magnitude of which may be as high as two to three times the phase current. If this current is not considered in network design and the current in the neutral conductor due to harmonics—which causes potential shifts due to voltage drops in individual conductor sections—is not taken into account, it can cause serious disturbances in the operation of electronic equipment. Later, the possible direct consequences of harmonic disturbances on the power sources of equipment operating on the electrical network will be discussed. Figure 20 shows the spectrum of the phase of currents.
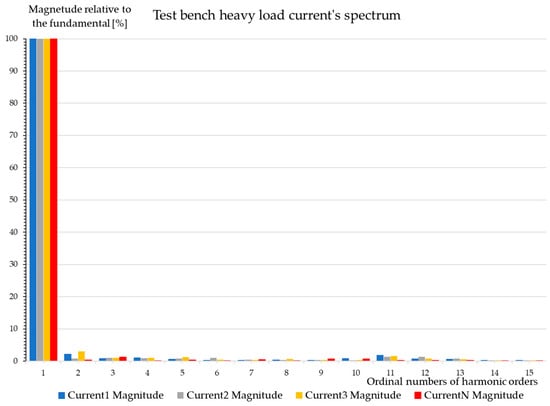
Figure 20.
Harmonic current magnitude components of the distorted current waveforms measured on the test bench at a heavy load.
As before, on the horizontal axis, the line numbers represent the harmonic orders, the integer nth multiples of the fundamental frequency (50 Hz), while on the vertical axis, the amplitude is plotted against the fundamental harmonic. Based on the measurements, it can be said that the magnitude of harmonic distortion does not exceed the level allowed by the standard in the case of harmonic orders and the active filter works very well at a heavy load.
The table provided by the TopView software displaying the voltage, current, THD, and reactive power measurement results of the analyzer is shown in Figure 21.
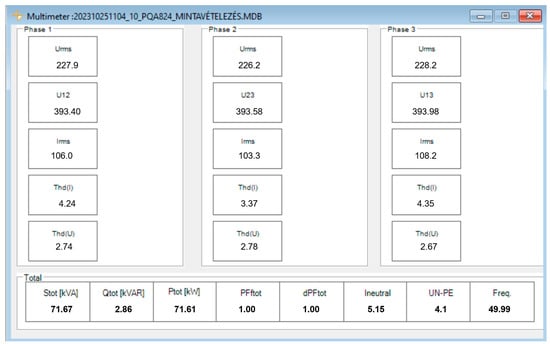
Figure 21.
Measured voltage, current, THD, and power factor of test bench at heavy load provided by TopView.
7.3.2. Test Bench at Light Load
Figure 22 shows the voltage and current waveforms at a light load state. The voltage sine is almost free of distortion, but the current sine cannot be recognized; accordingly, the current THD value was 104.54%. As was mentioned before, the standard specifies the recommended maximum value of the total harmonic distortion of the current with the value of the total current demand harmonic distortion (TDD), which depends on the ratio of the short-circuit current of the common electrical network connection point and the load current of the given device. This ratio is now 630 A/10.4 A = 60.57, which is between 50 and 100, so the permissible distortion would be only 12%. The deviation from the limit value is 92.54%.
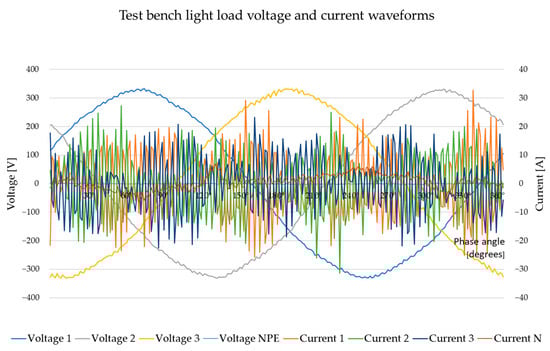
Figure 22.
Distorted current and voltage waveforms measured on the test bench at a light load.
In the current spectrum shown in Figure 23, one can see that there is no harmonic order whose value relative to the fundamental harmonic does not exceed the maximum possible value of 4% up to the 11th harmonic written in the standard. Current amplitude values vary between 10% and 88%. Based on the above, it can be stated that the built-in active filter is not effective in a small or unloaded state and allows serious signal shape distortions in the network. It is advisable to increase the efficiency of the filtering as soon as possible, because it can cause serious problems in the various data recording and control units.
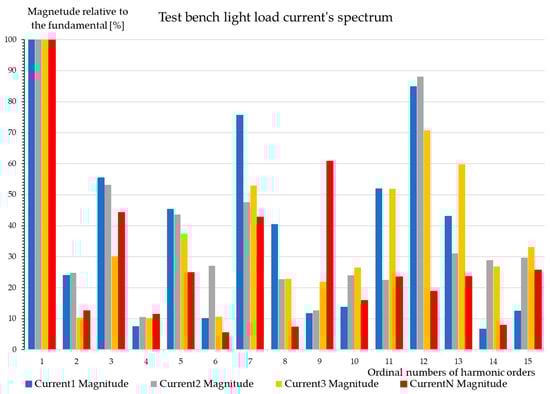
Figure 23.
Harmonic current magnitude components of the distorted current waveforms measured on the test bench at a light load.
The table provided by the TopView software displaying the voltage, current, THD, and reactive power measurement results of the analyzer is shown in Figure 24.
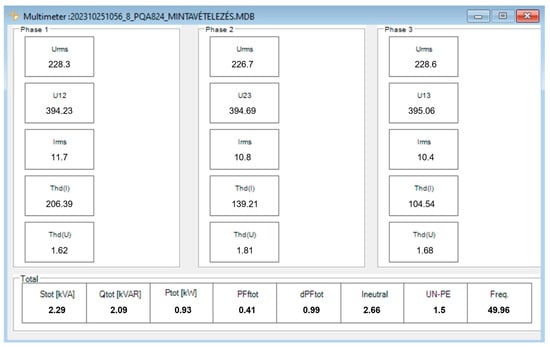
Figure 24.
Measured voltage, current, THD, and power factor of test bench at light load provided by TopView.
7.4. Industrial Robot Built-In Active Harmonic Filter Validation
Currently, there is almost no industrial facility where robots, robot cells, and cobots are not used for various technologies. In their variety of applications, they are considered as very significant consumers of electricity, especially if we take into account the automated equipment directly connected to them, such as robot cells or machining centers. Since it can be said that such devices are highly automated, their control and regulation electronics can be highly sensitive to electrical network disturbances and possible voltage dips. In this section, the magnitude of the harmonic injection of such an industrial robot and the efficiency of the built-in active harmonic filter at light load and heavy load states of the robot are examined.
7.4.1. Industrial Robot at Light Load
Figure 25 shows the measured voltage-current waveforms. Since the magnitude of the currents of each phase and the total harmonic distortion of the currents were almost the same, only Current 2 was analyzed. The voltage sine is almost free of distortion, but the current sine cannot be recognized. The measured current varies between 1.6 A and 2 A per phase, so it can be considered symmetrical. In Figure 25, one can see that the current sine waveform is very distorted, and the THD of the current was 59.42% for Current 2. The proposed maximum allowable value of THD according to IEEE 519-2022 is given by the TDD, which depends on the ratio of the PCC termination current ISC to the load current IL of the device, as was previously presented. This ratio is now 630 A/2 A = 315; therefore, the permissible distortion according to Table 2 can be only 15%, so the difference is more than three times, namely 44.42%.
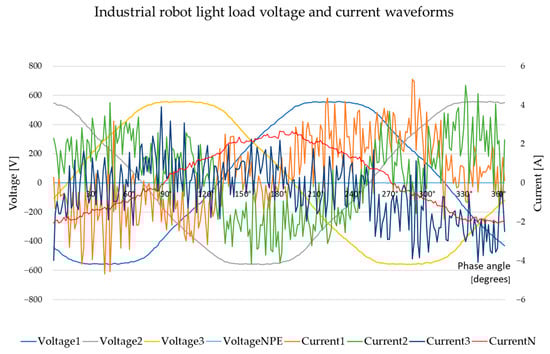
Figure 25.
Distorted current and voltage waveforms measured on an industrial robot at a light load.
Figure 26 shows the frequency spectrum of the measurement, i.e., the magnitudes of the harmonics with respect to the fundamental harmonic. However, it can also be concluded from the measurement that according to Table 2, instead of the recommended 12% up to the 11th harmonic, the maximum harmonic current distortions in the case of Current 2 were 33.96%, 21.16%, and 7.63% for the 5th, 7th, and 9th harmonics, respectively. Instead of the recommended 5.5% from the 11th to the 17th harmonic, for the 15th harmonic, it was 7.68%. In the case of higher harmonic orders, their magnitudes were already negligible; therefore, they are not included in the analysis.
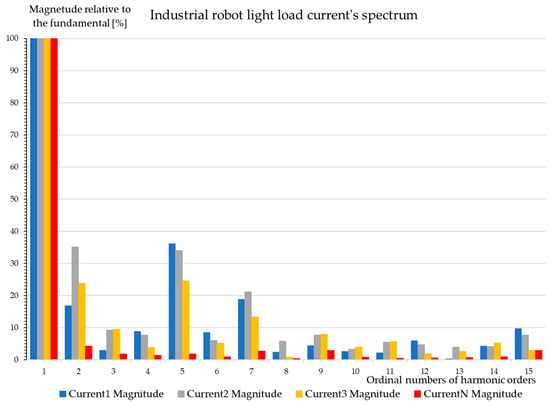
Figure 26.
Harmonic current magnitude components of the distorted current waveforms measured on an industrial robot at a light load.
The measured data provided by the network analyzer (voltage, current, THD and reactive power) can be seen in Figure 27.
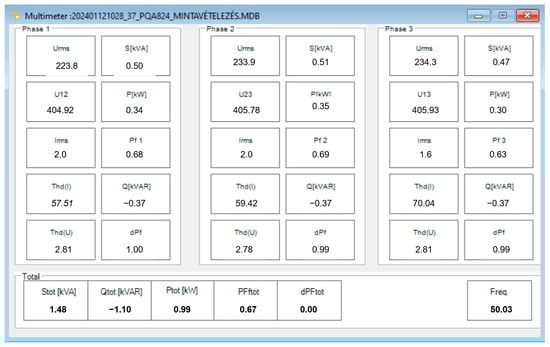
Figure 27.
Measured voltage, current, THD, and power factor of industrial robot at light load provided by TopView.
7.4.2. Industrial Robot at Heavy Load
During the analysis, measurements were also performed under heavy load. After all, the more robot axes operate at the same time, the greater the simultaneous electric power consumption of the drive cards that operate them. This therefore represents the greatest opportunity to measure the greatest distortion of electric signals and the injection of harmonics into the network. The measured voltage and current waveforms are illustrated in Figure 28. It can be stated that the voltage sine wave is slightly distorted, while the current sine wave is already significantly distorted, and the shape of the sine waves of the current clearly demonstrates the non-linear current draw from the network. After all, the direction of the current changes four times instead of once within one period. If one looks at the significant number of zero crossings within one period, it is clear that this must be taken into account not only for the robot, but also for the robot cell equipment when designing their switch mode power supplies.
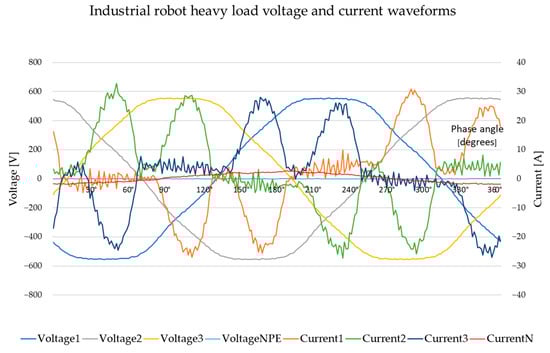
Figure 28.
Distorted current and voltage waveforms measured on an industrial robot at a heavy load.
Figure 29 shows the current spectrum. The harmonic distortion of the total current measured at the common connection point (PCC) of the robot cell is THD(I), and in the case of Current 3 it was 83.94%. In this case, the permissible maximum value of the total harmonic distortion of the current is also given by the TDD. The short-circuit current of the common electrical network connection point (PCC) is 800 A, and the load current of the robot cell is 8.3 A. The required ratio is 800 A/13 A = 61.53. The maximum allowable total current demand harmonic distortion (TDD) recommended by the IEEE 519-2022 standard is 12%. Therefore, THD = 83.94% is seven times the permissible value. Based on the ratio number 61.53, the permissible harmonic current distortion is 10% for the 2nd–11th harmonics, and 4.5% for the 11th–17th harmonics. These limits are exceeded multiple times for every odd harmonic order. The value for the 5th harmonic (250 Hz) is 66.06%, that for the 7th (350 Hz) is 40.74%, and that for the 11th (550 Hz) 7.61%.
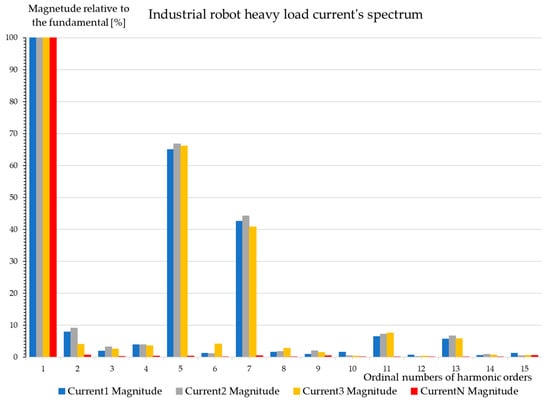
Figure 29.
Harmonic current magnitude components of the distorted current waveforms measured on an industrial robot at a heavy load.
The table provided by the TopView software displaying the measurement results of the analyzer is shown in Figure 30.
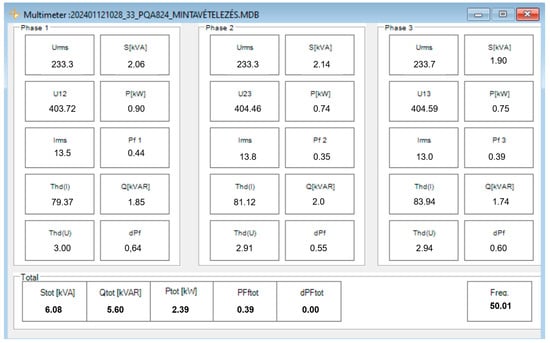
Figure 30.
Measured voltage, current, THD, and power factor of industrial robot at heavy load provided by TopView.
8. Network Analysis of Different Locations of the Industrial Facility
In the previous section, the efficiency of the built-in filters was investigated. Measurements were also performed at three different locations within an industrial facility: the engineering room, the gearbox house machine tool, and an office room. In these cases, there are no built-in filters. These measurement results will contribute to the subsequent development of what kind of protection against harmonics needs to be installed for each location. After installing the proposed active filters, network analysis will be performed again, and thus in the future a similar validation process will be carried out like in Section 7.
8.1. Engineering Room
Figure 31 shows a voltage–current waveform diagram in a mechanical room. Since the magnitude of the currents of each phase and the total harmonic distortion of the currents were almost the same, only Current 2 was analyzed in this paper. It can be seen that the current of the neutral conductor was almost zero, while all voltage and current waveforms are distorted. These network analysis results correspond to the literature description of harmonic distortions. The measurement also shows how the current waveform is distorted by harmonics in the building services room, where the electronic speed regulation of electric motors and the use of switching power supply units to power the control electronics are significant.
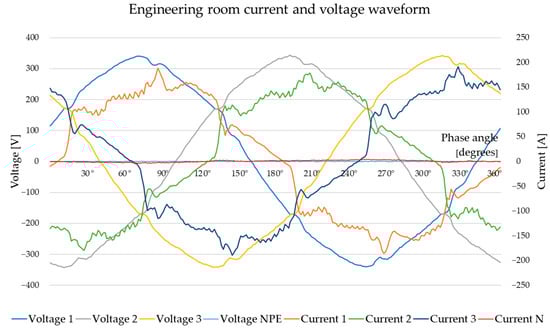
Figure 31.
Distorted current and voltage waveform measured in the engineering room.
Figure 32 shows the frequency spectrum of the measurement.
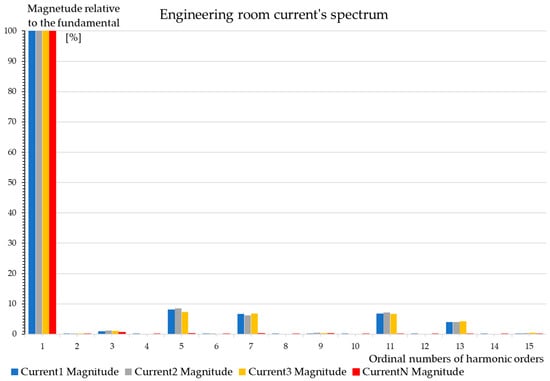
Figure 32.
Harmonic current magnitude components of the distorted current waveform measured in the engineering room.
The table provided by the TopView software displaying the measurement results of the analyzer is shown in Figure 33.
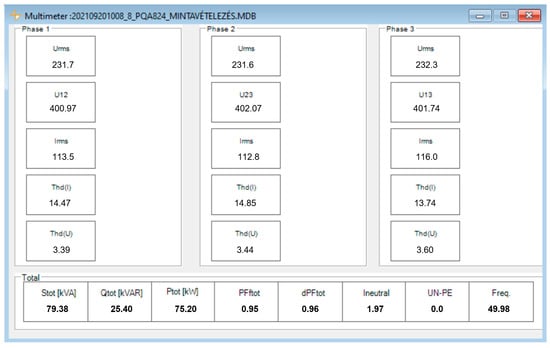
Figure 33.
Measured voltage, current, THD, and power factor of engineering room provided by TopView.
The scale shows the magnitudes of the harmonics with respect to the fundamental harmonic. One can observe that the harmonics of the neutral conductor were negligible. Therefore, the current of the neutral conductor was not analyzed either. The recorded current varies between 113.5 A and 116 A per phase, so it can be said to be symmetrical. But in Figure 6, one can also see that the current sine waveform is very distorted, and the THD of the current was 14.85% for Current 2. The proposed maximum allowable value of THD according to IEEE 519-2022 is given by the TDD, which depends on the ratio of the PCC termination current ISC to the load current IL of the device, as was previously presented. This ratio is now 2000 A/112,8 A = 17.73; therefore, the permissible distortion according to Table 2 would be only 5%, so the THD of 14.85% is almost three times the recommended maximum value, and the limit value was exceeded by 9.85% in the case of Current 2. However, it can also be concluded from the measurement that according to Table 2, instead of the recommended 4% up to the 11th harmonic, the maximum harmonic current distortion for Current 2 was 8.53%, 6.19%, and 7.2% for the 5th, 7th, and 11th harmonics, respectively (these values are almost twice the recommended value). Instead of the recommended 2% from the 11th harmonic to the 17th harmonic, the distortion was 4.00% for the 13th harmonics. In the case of higher harmonic orders, their magnitudes were already negligible; therefore, they are not included in the analysis. Of course, further measurements should also be carried out in this case to determine the exact sources of the main harmonic disturbances.
8.2. Gearbox House Machine Tool
Measurements were also performed in a gearbox house machine tool. The voltage and current waveforms of a special machine tool can be seen in Figure 34.
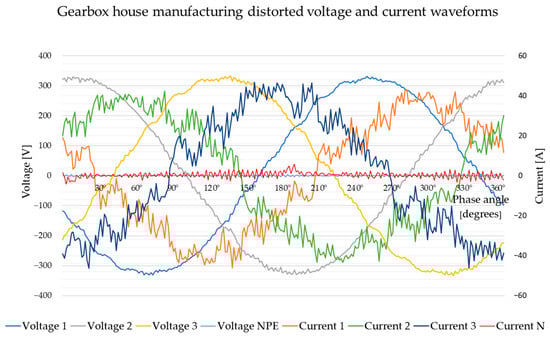
Figure 34.
Gearbox house manufacturing distorted voltage and current waveforms.
In this case as well, the magnitude of the currents of each phase and the total harmonic distortion of the currents were almost the same; therefore, only Current 3 was analyzed here. The maximum value of the current of the neutral conductor was 1.56 A, which is negligible compared to the maximum phase currents of 43 A.
The network analysis was carried out with the machine in the extended state under normal production conditions. The applied current varied between 26.7 A and 28.2 A per phase, so it can be said to be symmetrical. On the other hand, there was a high level of harmonic current pollution and therefore the current waveform was also highly distorted. Thus, the THD of the current was 17.3% for the Current 3. As was mentioned before, the proposed maximum allowable value of THD as defined in IEEE 519-2022 is given by the TDD. This ratio is now 630 A/28.2 A = 22.34; according to Table 2, the permissible distortion should only be 8%. The limit value was thus exceeded by 9.85% in the case of Current 3. The other problem is that the current of the neutral conductor is 1.56 A, whereas it should be zero under normal operation. The current in the neutral conductor is caused by the asymmetrical load, and the current flowing in the neutral conductor can cause overloading and overheating in the line in the transformer, which can lead to failures. Electricity distribution networks are in most cases TN (three-phase neutral systems), where the secondary windings of the transformer are connected to a star and the star points of the windings are grounded and the neutral conductor is connected to this point. All harmonics are found in the phase voltages, and hence harmonics appear in the phase and line currents. The neutral current is the sum of the phase currents. The effective value of this current will be the square root of the square sums of the zero-sequence currents. This current causes an additional load in the neutral conductor for symmetrically connected non-linear loads, the magnitude of which may be as high as two to three times the phase current. If this current is not considered in network design and the current in the neutral conductor due to harmonics—which causes potential shifts due to voltage drops on individual conductor sections—is not taken into account, it can cause serious disturbances in the operation of electronic equipment. Later, the possible direct consequences of harmonic disturbances on the power sources of equipment operating on the electrical network will be discussed.
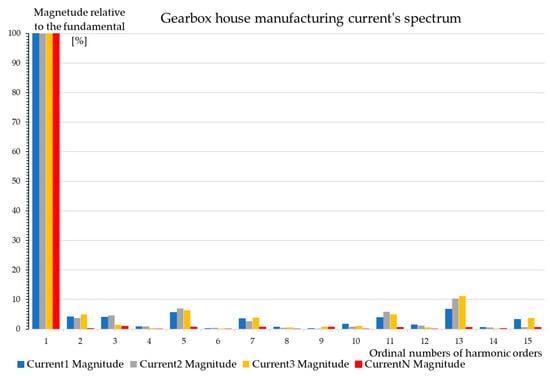
Figure 35.
Gearbox house manufacturing harmonic current magnitude components of the distorted current waveform.
The table provided by the TopView software displaying the measurement results of the analyzer is shown in Figure 36.
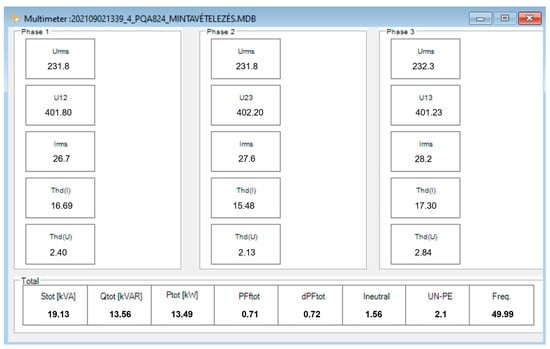
Figure 36.
Measured voltage, current, THD, and power factor of gearbox house provided by TopView.
As before, on the horizontal axis, the line numbers represent the harmonic orders, the integer nth multiples of the fundamental frequency (50 Hz), while on the vertical axis, the amplitude is plotted against the fundamental harmonic. It can be observed that the harmonics of the neutral conductor were also negligible in this case. Therefore, the current of the neutral conductor was not analyzed either.
One can see that the magnitude of the 5th-, 7th- and 11th-order harmonics exceeds the maximum possible 4% value up to the 11th harmonic recommended in the standard, because these current amplitude values were 6.31%, 3.92%, and 5.90% respectively. From the 11th harmonic to the 17th harmonic, instead of the recommended 2%, the magnitude of the 13th harmonic was 11.15%, while that of the 15th harmonic was 3.71%. In the case of higher harmonic orders, their magnitudes were already negligible; therefore, they are not included in the analysis. So, based on the measurements, it can be said here again that the magnitude of harmonic distortion exceeds the level allowed by the standard and it is necessary to filter these values and eliminate the cause of the current flowing in the neutral conductor.
8.3. Office Room
In the following, the results of a single-phase network analysis in an office room are presented. The waveforms of one period of voltage and current are shown in Figure 37.
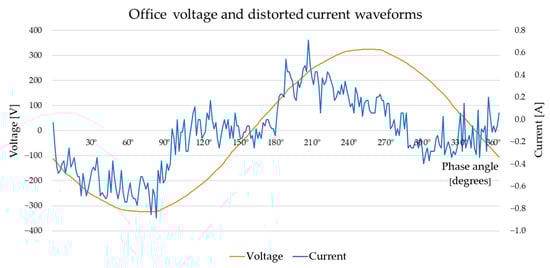
Figure 37.
Office distorted voltage and current waveforms.
The current waveform is distorted to such an extent that its sinusoidal waveform is unrecognizable. One can also see the multiple zero transitions. The TDD value was also determined in this case. The value of THD of the current was 59.47%. The total current demand distortion (TDD) is 16 A/0.3 A = 53.33; according to Table 2, the permissible distortion should only be 12%. The limit value was exceeded by 47.47%.
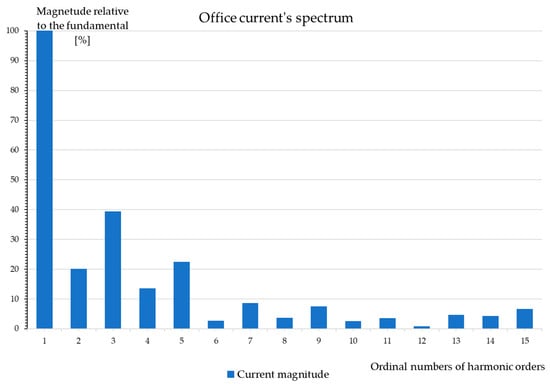
Figure 38.
Office distorted current waveform components of harmonic current.
The table provided by the TopView software displaying the measurement results of the analyzer is shown in Figure 39.
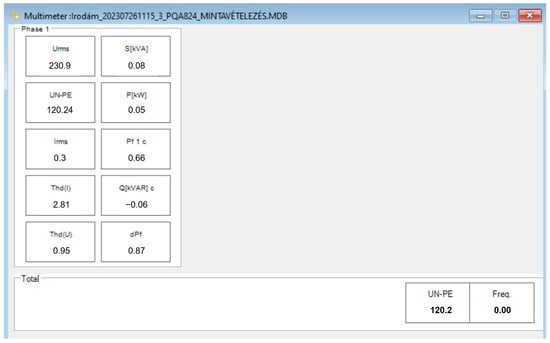
Figure 39.
Measured voltage, current, THD, and power factor of office room provided by TopView.
It can be seen that the third harmonic (150 Hz) is very high, which is mainly typical of LED lighting, so the luminaires in the office are not fitted with filters, contrary to the contractor’s claim. According to Table 2, the maximum possible value of 4% per harmonic order up to the 11th harmonic is recommended in the standard, but these current amplitude values for the 3rd and 5th harmonics were 39.38% and 22.39%. The measured value is ten times the recommended maximum value. Targeted research is also currently being carried out to identify the devices in office consumers that could cause the current amplitudes shown in this figure. Based on the measurement, it was proved that the built-in harmonic filters claimed by the manufacturers of office equipment and computers are in many cases not true or their quality is not adequate. Our future plan is to install a test filter in the central electricity supply network of the offices and then carry out the measurements again.
9. Conclusions
Virtually all modern electrical and electronic equipment has a switching power supply, controlling the electricity drawn and thus creating a non-linear load. The voltage and frequency of a perfect power supply are within the permissible limits, and its voltage curve is perfectly sinusoidal. Electrical harmonics are a by-product of modern electronics. They are particularly prevalent where there are a large number of computing and electronic power control devices. The technical quality of electricity, especially the value of harmonics is receiving more and more attention currently. A modern way to reduce harmonics is to use active harmonic filtering devices. These devices are designed to fulfill several functions at the same time, performing a complex electrical power shaping task instead of harmonic filtering.
The aim of the first presented measurements was to investigate equipment with in-built active and passive filters. Measurements were performed on three different devices: an LED lamp, a test bench, and an industrial robot. For the appropriate validation in the latter two cases, light and heavy load states were both investigated. The measured total harmonic current distortion (THD) values were compared to the IEEE 519-2022 standard. In the case of a single LED lamp, the total harmonic distortion of the current was 15.20%, while the permissible distortion should be only 5%, so the difference is more than three times (similar results were obtained for two luminaires). In the case of the LED hall lighting, the limit value should be only 8%, so the THD of 14.71% is almost twice the recommended maximum value. In the case of the test bench at a light load, the THD value was 139.21%, which is more than twelve times the permissible value of 12%. However, when the test bench was under a heavy load, the harmonic distortion was 4.24%, 3.37%, and 4.35% THD per phase, which can meet even the strictest requirements (5%) according to the IEEE 512-2022 standard. The THD value of an industrial robot under a heavy load was 90%, which is more than ten times the permissible 8%. Overall, it can be concluded that the built-in passive filters of the LED lamps were not effective, while in the case of the test bench and the robot, the efficiency of the active harmonic filters was not adequate. When sizing the active filters in these cases, the designers did not consider the condition of the machines, which can be significant even in series production due to transitions and machine failures. The solution is to install an active harmonic filter that performs equally well in the cases of low and high current consumption. From the measurement results it can be said that the built-in active harmonic filter of the tested industrial robot was completely ineffective at both low and full load. The effectiveness of the filters in the case of machine tools was also examined, and the same result was obtained. The authors (at the concern level) are in contact with filter manufacturers, sharing the measurement results and experience, and joint research is planned in order to increase active harmonic filtering efficiencies.
The aim of the second presented set of measurements was to investigate the current harmonic injection and to examine the compliance with the standard of equipment connected to the internal electrical network of an industrial structure. Measurements were performed in these cases at three different locations: an engineering room, a gearbox house machine tool, and an office room. The current harmonic distortion per unit current and the total harmonic current distortion were measured during network analysis. The values were compared to the IEEE 519-2022 standard. For the machine room, the allowed distortion could be only 5%, so the THD, at 14.85%, was almost three times the recommended maximum value; for the gearbox manufacturing machine, the THD was 17.3%, which is higher than the allowed 12%. For the office room, the THD was 59.47%, almost five times the permitted value of 12%.
As it can be seen, the amount of permissible harmonic distortion [] depends on the short-circuit current PCC of the electrical connection point, but this varies between installation locations. Therefore, in industrial facilities where networks have smaller short-circuit currents, the same harmonic injection will have a much greater impact on the quality of electricity. In the future, the possibilities of using current harmonics for predictive maintenance, machine learning, and anomaly detection will be investigated.
Author Contributions
Conceptualization, A.K. and J.S.M.; methodology, A.K.; software, A.K.; validation, A.K., J.S.M. and K.J.; formal analysis, A.K.; investigation, A.K.; resources, A.K.; data curation, A.K.; writing—original draft preparation, A.K and J.S.M.; writing—review and editing, A.K. and J.S.M.; visualization, A.K.; supervision, J.S.M.; project administration, J.S.M.; funding acquisition, A.K. All authors have read and agreed to the published version of the manuscript.
Funding
This research received no external funding.
Data Availability Statement
The raw data supporting the conclusions of this article will be made available by the authors on request.
Conflicts of Interest
The authors declare no conflict of interest.
Glossary
| THD | Total harmonic distortion |
| EMS | Energy Management System ISO 50001 |
| PHEV | Plug in hybrid vehicle |
| PLC | Programmable logic controller |
| CNC | Computer numerical control |
| LED | Light-emitting diodes |
| DC | Direct current |
| RMS | Root mean square |
| TDD | Total current demand distortion |
| PCC | Point of common coupling |
| FFT | Fast Fourier transform |
| TN | Three-phase neutral system |
| AC | Alternating current |
| MV | Medium voltage |
| LV | Low voltage |
| APLC | Active power line conditioning |
| PWM | Pulse-width modulation |
| NPC | Neutral point clamped |
| IGBT | Insulated-gate bipolar transistor |
References
- Ghorbani, M.J.; Mokhtari, H. Impact of harmonics on power quality and losses in power distribution systems. Int. J. Electr. Comp. Eng. 2015, 5, 166–174. [Google Scholar] [CrossRef]
- Hunter, I. Power quality issues-a distribution company perspective. Power Eng. J. 2001, 15, 75–80. [Google Scholar] [CrossRef]
- Radmehr, M.; Farhangi, S.; Nasiri, A. Effects of power quality distortions on electrical drives and transformer life in paper industries: Simulations and real time measurements. In Proceedings of the Pulp and Paper Industry Technical Conference, Appleton, WI, USA, 18–23 June 2006. [Google Scholar]
- Yan, Y.H.; Chen, C.S.; Moo, C.S.; Hsu, C.T. Harmonic analysis for industrial customers. IEEE Trans. Ind. Appl. 1994, 30, 462–468. [Google Scholar] [CrossRef]
- Mansoor, A.; Grady, W.M.; Staats, P.T. Predicting the net harmonic currents produced by large numbers of distributed single-phase computer loads. IEEE Trans. Power Deliv. 1995, 10, 2001–2006. [Google Scholar] [CrossRef]
- Masoum, M.A.S.; Fuchs, E.F. Power Quality in Power Systems and Electrical Machines, 2nd ed.; Academic Press: Cambridge, MA, USA, 2015. [Google Scholar]
- ISO (International Organization for Standardization). ISO Central Secretariat. ISO 50001:2018. Vernier, Geneva, Switzerland. 2018. Available online: https://www.iso.org/files/live/sites/isoorg/files/store/en/PUB100400.pdf (accessed on 20 August 2024).
- Pinyol, R. Harmonics: Causes, Effects and Minimization. Salicru White Papers. 2015. Available online: https://www.salicru.com/files/pagina/72/278/jn004a01_whitepaper-armonics_(2).pdf (accessed on 2 August 2024).
- Das, J.C. Power System Harmonics and Passive Filter Designs. Power System Harmonics and Passive Filter Designs, 1st ed.; Wiley-IEEE Press: Hoboken, NJ, USA, 2015. [Google Scholar]
- Wenqian, Y.; Xiang, Y.; Longwei, X.; Chao, Z.; Xinsheng, M. Harmonic loss analysis of low-voltage distribution network integrated with distributed photovoltaic. Sustainability 2023, 15, 4334. [Google Scholar] [CrossRef]
- Sumaryadi, D.; Gumilang, H.; Suslilo, A. Effect of power system harmonic on degradation process of transformer insulation syste. In Proceedings of the IEEE 9th International Conference on the Properties and Applications of Dielectric Materials, Harbin, China, 19–23 July 2009. [Google Scholar]
- Shafiee-Rad, M.; Kazerooni, M.; Ghorbany, J.; Mokhtari, H. Analysis of the grid harmonics and their impacts on distribution transformers. In Proceedings of the IEEE Power and Energy Conference, Champaign, IL, USA, 24–25 February 2012. [Google Scholar]
- Aktif. Problems Caused by Harmonics in Electrical Plants. Available online: https://aktif.net/en/problems-caused-by-harmonics-in-electrical-plants/# (accessed on 2 August 2024).
- Szűcs, V.; Fodor, A.; Görbe, P. Examination of nonlinear distortion of IT power supplies in low voltage grid from the current quality point of view. Acta Phys. Pol. 2018, 134, 307–310. [Google Scholar] [CrossRef]
- Caicedo, E.J.; Romero, A.A.; Zini, C.H. Assessment of the harmonic distortion in residential distribution networks. Ing. Investig. 2017, 37, 72–84. [Google Scholar] [CrossRef]
- Bonner, A.; Grebe, T.; Gunther, E.; Hopkins, L.; Marz, M.B.; Mahseredjian, J.; Xu, W. Modeling and simulation of the propagation of harmonics in electric power networks. Part I: Concepts, models, and simulation techniques. IEEE Trans. Power Deliv. 1996, 11, 452–465. [Google Scholar]
- Uddin, S.; Shareef, H.; Mohamed, A. Power quality performance of energy-efficient low-wattage LED lamps. Measurement 2013, 46, 3783–3795. [Google Scholar] [CrossRef]
- Poplawski, T.; Kurkowski, M. Nonlinear Loads in lighting installations—Problems and threats. Energies 2023, 16, 6024. [Google Scholar] [CrossRef]
- Molina, J.; Mesas, J.J.; Mesbahi, N.; Sainz, L. LED lamp modelling for harmonic studies in distribution systems. IET Gener. Transm. Distrib. 2017, 11, 1063–1071. [Google Scholar] [CrossRef]
- Wang, H.; Zhou, W.; Qian, K.; Meng, S. Modelling of ampacity and temperature of MV cables in presence of harmonic currents due to EVs charging in electrical distribution networks. Int. J. Electr. Power Energy Syst. 2019, 112, 127–136. [Google Scholar] [CrossRef]
- Jouybari-Moghaddam, H.; Alimardani, A.; Hosseinian, S.H. Influence of electric vehicle charging rates on transformer derating in harmonic-rich battery charger applications. Arch. Electr. Eng. 2012, 61, 483–497. [Google Scholar] [CrossRef]
- Heidarian, T.; Joorabian, M.; Reza, A. The effect of plug-in electric vehicles on harmonic analysis of smart grid. Int. J. Emerg. Electr. Power Syst. 2015, 16, 559–567. [Google Scholar] [CrossRef]
- Sallam, A.A.; Malik, P.O. Harmonics in Electric Distribution Systems. In Electric Distribution Systems, 2nd ed.; El-Hawary, M.E., Ed.; Wiley-IEEE Press: Piscataway, NJ, USA, 2019; Chapter 14; pp. 379–402. [Google Scholar]
- Fourier Analysis. Carl von Ossietzky University Oldenburg—Faculty V—Institute of Physics. Module Introductory Laboratory Course Physics—Part I. Available online: https://uol.de/f/5/inst/physik/ag/physikpraktika/download/GPR/pdf/E_Fourieranalyse.pdf?v=1666712279 (accessed on 2 August 2024).
- Emanuel, A.E.; Janczak, J.; Pileggi, D.J.; Gulachenski, E.M.; Root, C.E.; Breen, M.; Gentile, T.J. Voltage distortion in distribution feeders with nonlinear loads. IEEE Trans. Power Deliv. 1994, 9, 79–87. [Google Scholar] [CrossRef]
- Teng, J.H.; Liao, S.H.; Leou, R.C. Three-phase harmonic analysis method for unbalanced distribution systems. Energies 2014, 7, 365–384. [Google Scholar] [CrossRef]
- What is True-RMS? Available online: https://www.fluke.com/en-us/learn/blog/electrical/what-is-true-rms (accessed on 2 August 2024).
- Magadum, P.K. Effects of nonlinear loading on power quality. In Proceedings of the 13th International Conference on Advances in Computing, Control, and Telecommunication Technologies, Hyderabad, India, 27–28 June 2022; Volume 8, pp. 1119–1123. [Google Scholar]
- Tarnik, I. Villamos Hálózati Zavarok/Electrical Network Disturbances. 2008. Available online: https://www.muszeroldal.hu/measurenotes/tarmikcikk.pdf (accessed on 2 August 2024).
- Peng, F.Z. Harmonic sources and filtering approaches. IEEE Ind. Appl. Mag. 2001, 7, 18–25. [Google Scholar] [CrossRef]
- Mustafa, T.I.A.H.; Cabral, S.H.L.; Almaguer, H.A.D.; Meyer, L.H.; Puchale, L.H.B.; Vier, G.B.; Cereja, J.E. Analysis of the Behavior of the 5th Harmonic over Power Transmission Lines. In Proceedings of the IEEE PES Asia-Pacific Power and Energy Engineering Conference (APPEEC), Kota Kinabalu, Malaysia, 7–10 October 2018; pp. 400–405. Available online: https://ieeexplore.ieee.org/document/8566407 (accessed on 11 August 2024).
- Jewel, W.; Miller, W.L.; Casey, T. Filtering dispersed harmonic sources on distribution. IEEE Trans. Power Deliv. 2000, 15, 1045–1051. [Google Scholar] [CrossRef]
- Chapman, D. Application Note—Harmonics: Causes and Effects, 2nd ed.; European Copper Institute: Brussels, Belgium, 2011; pp. 1–21. [Google Scholar]
- Calvas, L. Electrical Disturbances in LV, 1st ed.; Cahier Technique No. 141; Schneider Electric: Claix, France, 2000; Available online: https://www.tekdok.dk/files/cahiers_techniques/Electrical_disturbances_in_LV.pdf (accessed on 2 August 2024).
- Wagner, V.E.; Balda, J.C.; Griffith, D.C.; McEachern, A.; Barnes, T.M.; Hartmann, D.P.; Phileggi, D.J.; Emannuel, A.E.; Horton, W.F.; Reid, W.E.; et al. Effects of harmonics on equipment. IEEE Trans. Power Deliv. 1993, 8, 672–680. [Google Scholar] [CrossRef]
- Emanuel, A.E.; Orr, J.A.; Cyganski, D.; Gulachenski, E.M. A survey of harmonic voltages and currents at distribution substations. IEEE Trans. Power Deliv. 1991, 6, 1883–1890. [Google Scholar] [CrossRef]
- Grady, W.M.; Samotyj, M.J.; Noyola, A.H. Minimizing network harmonic voltage distortion with an active power line conditioner. IEEE Trans. Power Deliv. 1991, 6, 1690–1697. [Google Scholar] [CrossRef]
- Ketabi, A.; Farshadnia, M.; Malekpour, M.; Feuillet, R. A new control strategy for active power line conditioner (APLC) using adaptive notch filter. Int. J. Electr. Power Energy Syst. 2013, 47, 31–40. [Google Scholar] [CrossRef]
- Imperix: Neutral Point Clamped Inverter (NPC). Available online: https://imperix.com/doc/implementation/neutral-point-clamped-inverter (accessed on 2 August 2024).
- Wu, J.-C.; Jou, H.-L.; Hsaio, H.-H.; Xiao, S.-T. A new hybrid power conditioner for suppressing harmonics and neutral-line current in three-phase four-wire distribution power systems. IEEE Trans. Power Deliv. 2014, 29, 1525–1532. [Google Scholar] [CrossRef]
- IEEE 519-2022; IEEE Standard for Harmonic Control in Electric Power Systems. IEEE: Piscataway, NJ, USA, 2022. Available online: https://standards.ieee.org/ieee/519/10677/ (accessed on 2 August 2024).
- Caramia, P.; Carpinelli, G.; Rossi, F.; Verde, P. Probabilistic iterative harmonic analysis of power systems. IEE Proc.-Gener. Transm. Distrib. 1994, 141, 329–338. [Google Scholar] [CrossRef]
- Medina, A.; Segundo, J.; Ribeiro, P.; Xu, W.; Lian, K.L.; Chang, G.W.; Watson, N.R. Harmonic analysis in frequency and time domain. IEEE Trans. Power Deliv. 2013, 28, 1813–1821. [Google Scholar] [CrossRef]
- HT Italia. Available online: https://www.ht-instruments.com/en/ (accessed on 2 August 2024).
- HT Italia: Management Software Topview. Available online: https://www.ht-instruments.com/en/accessories/topview/ (accessed on 2 August 2024).
- Karim, F.A.; Ramdhani, M.; Kurniawan, E. Low pass filter installation for reducing harmonic current emissions from LED lamps based on EMC standard. In Proceedings of the International Conference on Control, Electronics, Renewable Energy and Communications, Bandung, Indonesia, 13–15 September 2016; pp. 132–135. [Google Scholar]
- Lakervi, E.; Holmes, E.J. Electricity Distribution Network Design, 2nd ed.; Peter Peregrinus LTD, Institution of Engineering and Technology: London, UK, 2003. [Google Scholar]
Disclaimer/Publisher’s Note: The statements, opinions and data contained in all publications are solely those of the individual author(s) and contributor(s) and not of MDPI and/or the editor(s). MDPI and/or the editor(s) disclaim responsibility for any injury to people or property resulting from any ideas, methods, instructions or products referred to in the content. |
© 2024 by the authors. Licensee MDPI, Basel, Switzerland. This article is an open access article distributed under the terms and conditions of the Creative Commons Attribution (CC BY) license (https://creativecommons.org/licenses/by/4.0/).