Article

Analysis of the Impact of Volt/VAR Control on Harmonics Content and Alternative Harmonic Mitigation Methods

Institute of Electric Power Engineering, Poznan University of Technology, Piotrowo 3A, 60-965 Poznan, Poland
*
Author to whom correspondence should be addressed.
Energies 2024, 17(22), 5561; https://doi.org/10.3390/en17225561
Submission received: 11 September 2024 / Revised: 29 October 2024 / Accepted: 1 November 2024 / Published: 7 November 2024
(This article belongs to the Special Issue Advances in Electrical Power System Quality)

Abstract

:
This article presents information about harmonic distortion and resonance in distribution networks. The theory behind harmonics and resonance is presented. Examples from the literature and the results of power quality measurements, as well as the authors’ experiences connected with significant changes in harmonic distortions, are presented. The harmonic resonance phenomenon is explained, and the risk of resonance in a distribution system network is highlighted. Attention is paid to the connection of a new power plant to the network; however, other risks, e.g., those connected to network reconfiguration, are also highlighted. Further simulation case studies are presented to show interactions between volt/VAR control and harmonic distortion. Simulations consider a few scenarios: impact of voltage change on impedance characteristics and resulting harmonics amplitudes, the impact of a capacitor on impedance characteristics, and the impact of network expansion on harmonic distortion. The final part presents alternative, low-cost harmonics mitigation methods. The concept of the utilization of phase-shifting transformers for two twin-type 1 MW plants located next to each other is verified by on-site measurement. The concept of adapting the harmonics spectrum of new devices to impedance characteristics is presented. Finally, an alternative concept for active mitigation of harmonics under resonance conditions is provided. The concept is based on the reactive power correction in order to change the harmonics phase shift. A comparison of harmonic mitigation methods and general recommendations are provided. Further research is outlined.

1. Introduction

The development of renewable energy sources allows for reducing the utilization of fossil fuels and limiting CO2 emissions. Unfortunately, the development of renewable energy sources is connected to many technical issues, which arise in all fields of electrical power engineering, e.g., protection relay coordination, voltage control complexity, power quality issues unwanted islanding, and many more [1]. At the same time, however, there is significant growth in technology that allows for compensating technical issues. Among many improvements, one can mention better observability of network, better coordination of devices, development of new monitoring technologies, and control algorithms [2]. This paper focuses on problems connected to power quality issues, which can be divided into a few categories [3,4]:
-
Level of voltage;
-
Slow and fast voltage changes, rapid voltage changes;
-
Asymmetry of voltage;
-
Voltage distortions.
Each category requires a detailed explanation. For the sake of simplicity, one can say that the level of voltage is the most common issue. The voltage level is easy to observe using even the simplest meters and has a direct impact on devices, e.g., inverters switch off above the voltage threshold. Voltage changes have an important impact on the operation of devices, since voltage changes result in varying currents drawn by devices and therefore varying outputs, e.g., light emission [5]. Voltage asymmetry is connected to higher energy losses and faster aging, which have a particularly large impact on three-phase motors [6].
Voltage distortions are categorized into subgroups depending on the frequency range of the distortion harmonics up to 2 kHz and supraharmonics in the range of 2 kHz to 150 kHz [7]. Harmonics are calculated using Fourier transformation in sine or cosine form (1, 2) [8]. Harmonics are classified into groups and subgroups, as marked in yellow in Figure 1 [9]. Harmonics groups exhibit a wide frequency spectrum, while harmonics subgroups include only ±5 Hz (±1 bar in Figure 1). Interharmonic groups and subgroups include frequencies between harmonics. Interharmonic groups exhibit a wider frequency band ±5 Hz compared with interharmonic subgroups.
i t = I d c + h = 1 I h s i n ( h ω 1 t + Θ k )
i t = I d c + h = 1 I h c o s ( h ω 1 t + Θ k 90 ° )
where Θ k is the harmonic phase angle.
Typically, the literature presents selected power quality problems separately; however, nowadays, in networks, one may expect more and more interactions between power quality parameters because of the high variation of voltage, which is the result of the integration of renewable energy sources and storages as high power loads, like charging stations. Variations in voltage have a great impact on reactive power flow and capacitive and reactive power (3, 4), which in turn has an impact on the impedance characteristics of the power system and harmonics resonance frequencies. The goal of this paper is to present the interactions between voltage, VAR, and harmonics changes, as well as potential issues and risks connected with harmonics. The simulation results show that voltage changes shift the harmonic resonance band and resulting harmonic flow, the modification of reactive power obtained by capacitor tap change has an impact on the resonance band, whereas harmonic mitigation under resonance conditions is based on reactive power change, which has an impact on voltage level. Further, it is worth underlining that all the modifications have an impact on the loading level.
Q c = U · I = U 2 2 π f C
Q L = U · I = U 2 2 π f L
where Q L / c is the reactor/capacitor power, L is the inductance, and C is the capacitance.
Current and voltage distortion may be connected to a great number of issues—additional energy losses, extensive heating and thermal aging, risk of sudden failure particularly in the context of resonances, maloperation of control or protection algorithms, malfunction of consumer loads, specific heating of cable terminal, and others [7,10]. The high spectrum of negative consequences of voltage distortions requires monitoring, analysis, and proper utilization of mitigation methods. The monitoring is carried out using smart meters and power quality meters. Smart meters, the main task of which is to calculate power consumption and generation, typically allow for the monitoring of basic parameters, like asymmetry or THD (5), which express general harmonic distortions [11]. Power quality meters are much more advanced devices. PQ meters allow for observing the harmonic spectrum up to 40 or 50, and the harmonics angle, with additional indicators like TDD (6) and supraharmonics. TDD is total demand distortion, where harmonics are normalized to the maximum current. TDD allows us to observe when the harmonics have the greatest impact on the power system. As a result of the presented features, smart meters can be considered a simple PQ indicator, whereas PQ analyzers allow for gathering data for detailed analysis. PQ analyzers are both fixed and portable. Regulations require installing fixed PQ meters at the point of renewable energy source coupling, which ensures that all relevant data are available.
T H D = h = 2 h m a x ( Y h ) 2 Y h 1
where Uh is the content of the harmonic row and Uh1 is the content of the first (fundamental 50 Hz) harmonic.
T D D = h = 2 h m a x I h 2 I d
where Id is the maximum peak demand load current and Ih is the content of the harmonic row.
Based on the situation and results of analysis, one can utilize mitigation methods, among which one can mention probably the most popular passive and active filters, proper arrangement of devices, and minimization of harmonic emissions by the optimization of the hardware and control algorithms e.g., use of the variable switching frequency of inverters [12].
The modification of the inverter control algorithm is typically beyond the possibilities of network engineers due to the lack of access to configuration software, high complexity, and an enormous amount of different inverter topologies [13]. Power electronic engineers typically have limited knowledge about power systems, which consist of hundreds or thousands of elements; therefore, the improvement of inverters is generally focused on the general THD level, not on specific harmonics. More advanced inverters may be equipped with adaptive mitigation algorithms; however, such algorithms are often still at the research stage [14,15,16]. As a result of the presented problems, typical harmonic mitigation methods require special considerations at the design stage or extra devices afterward, which increase costs. The mitigation methods proposed in this paper can be introduced in a relatively simple way without additional costs; however, the effective operation can be observed only for resonance band mitigation. The solution may be important in case of hostile actions where the structure of the power system may be outside the design specifications and a dangerous resonance band could occur. The risk of resonances is also increasing under normal operating conditions due to the increasing number of devices and their characteristic harmonics, e.g., energy storages being charged from PV panels. A detailed description of conventional harmonic mitigation methods including advanced STATCOM devices can be found in [17,18,19].
This paper presents requirements connected to harmonics limits and results of power quality measurement taken in a 110 kV and MV network. Examples of sudden changes in harmonics and resulting THD are presented. Factors affecting harmonic distortion are explained, and general recommendations are provided. The next paragraph presents simulation case studies. Simulations present the impact of distribution system extension on harmonic distortions. Additionally, the impact of volt/VAR control on harmonic amplitude is provided. The next paragraph presents proposed passive and active harmonic mitigation methods—utilization of transformer phase shift to reduce harmonics or analysis of the energy source’s harmonics spectrum to avoid the resonance band. Finally, the concept of reactive power regulation in order to reduce harmonic distortion under resonance conditions is provided and a comparison of different harmonic mitigation methods is performed. The summary contains the most important findings and outlines further research.

2. Harmonics in the Distribution System Network

2.1. Basics of Harmonics Load Flow

Harmonics analysis requires knowledge about voltage harmonics (existing distortions) in power networks, and knowledge about the structure of power systems and different devices. Further, it requires knowledge of harmonics summation or cancellation effects [20,21,22]. The voltage harmonics describe distortions resulting from the operation of all devices connected to the analyzed network. The structure of the power system is needed in order to develop a simulation or mathematical model of the analyzed network, which allows for detailed analysis, e.g., planning of new devices or analysis of failures causes [23].
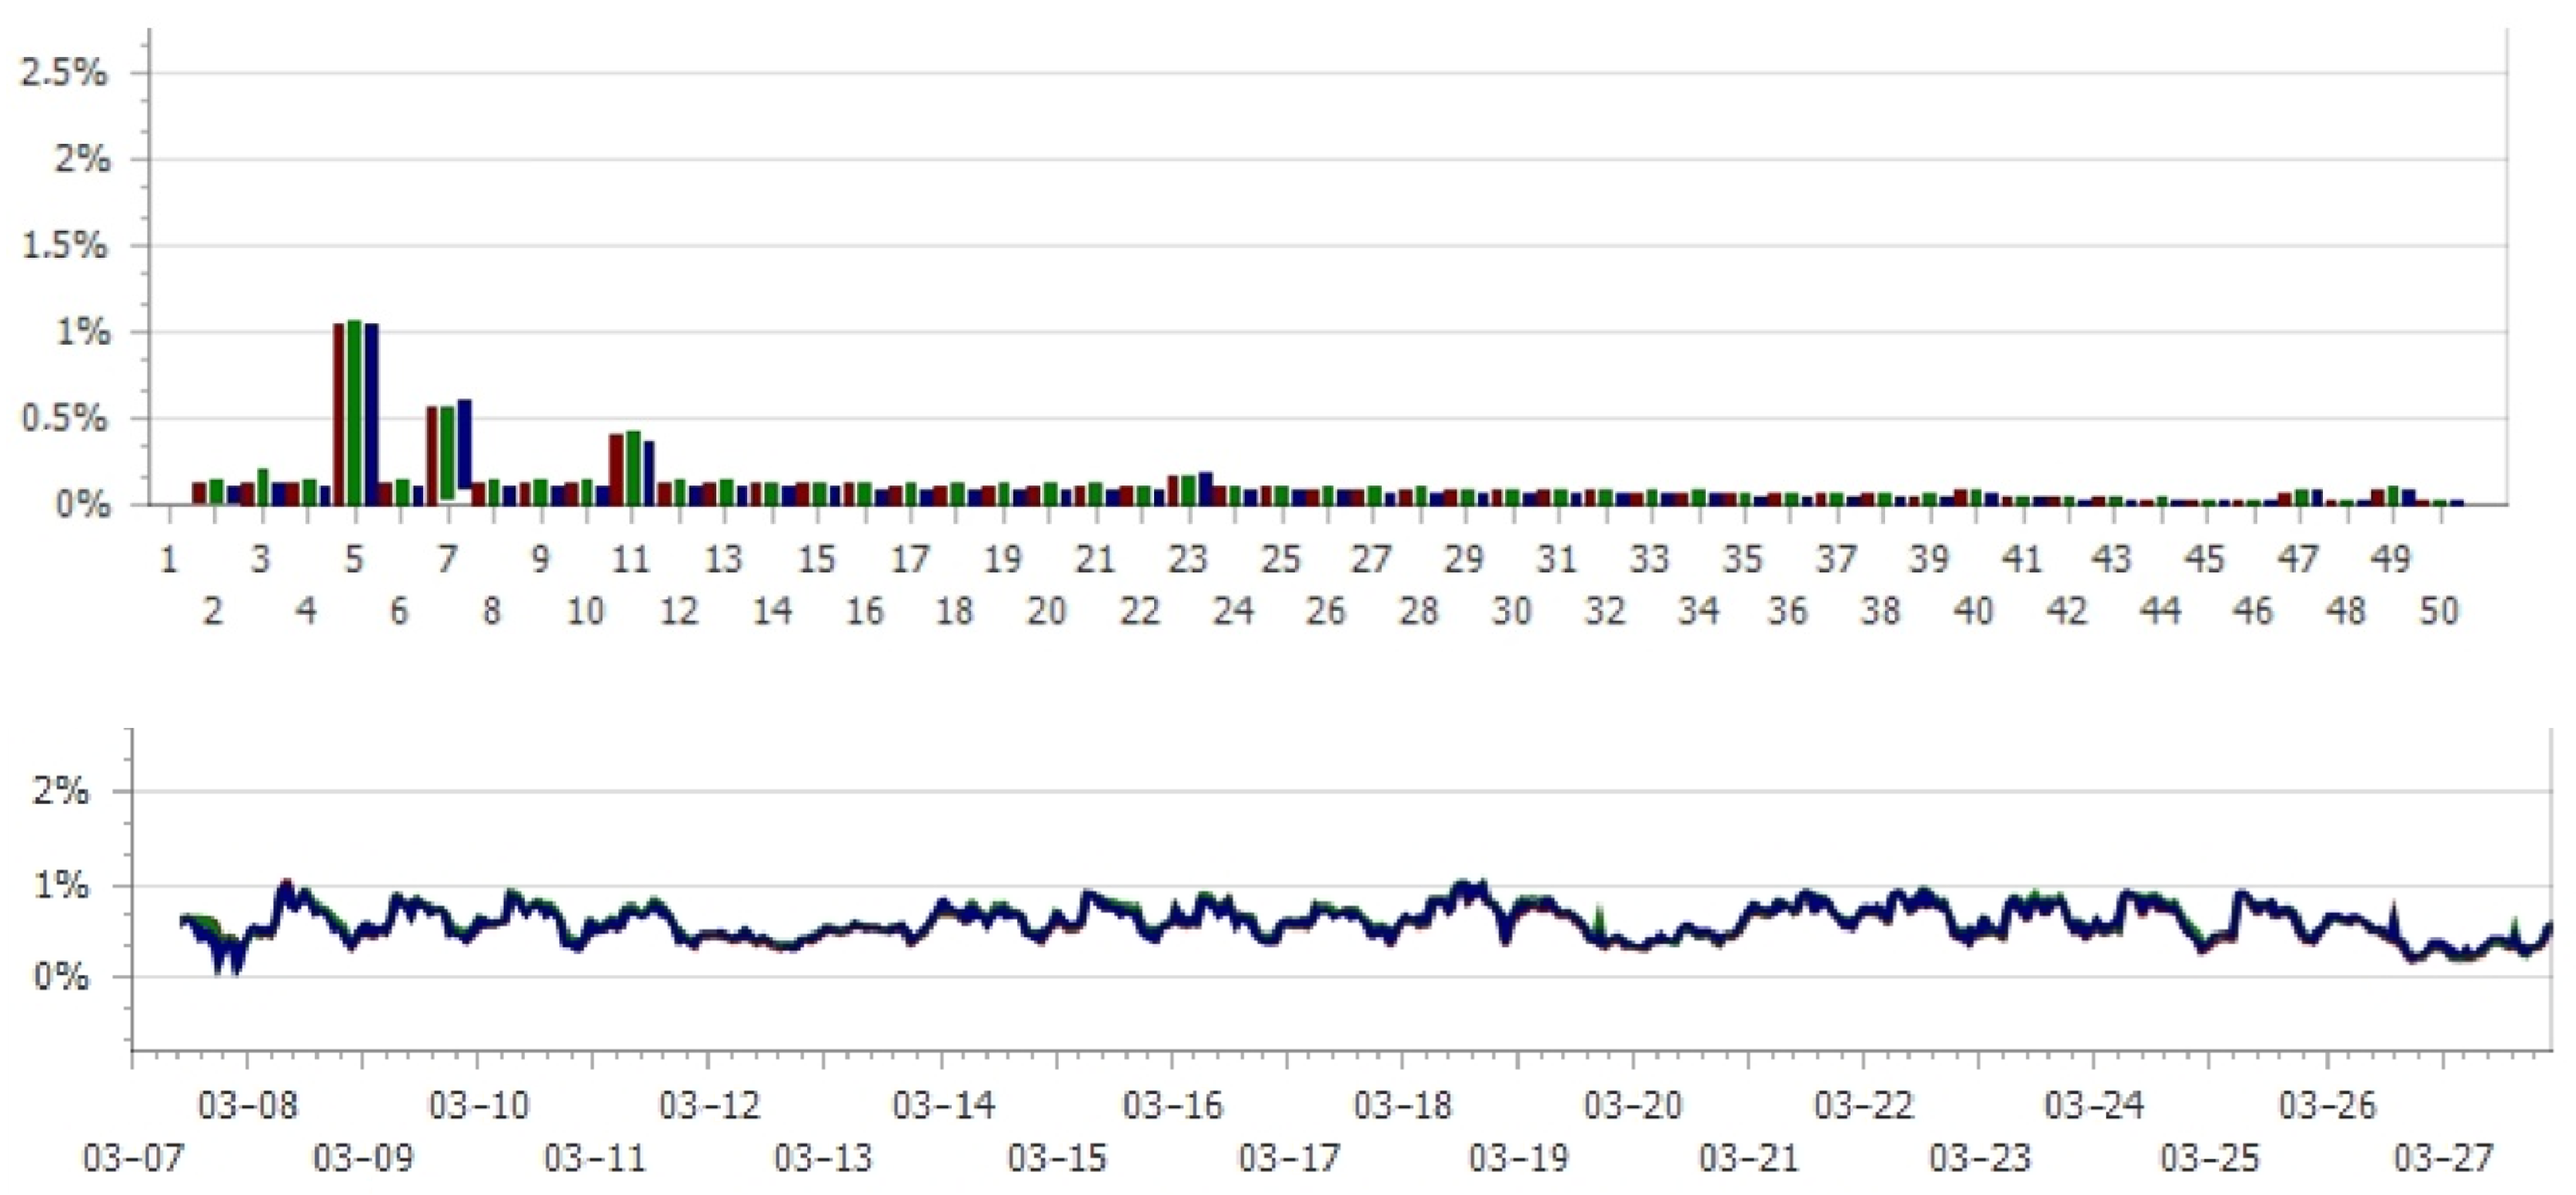
According to common knowledge, the voltage harmonics in high voltage networks are negligibly small, which is often true. However, in the case of high penetration of renewables and industrial devices, e.g., rectifiers, and inverters, the voltage distortions can be noticeable. An example of the harmonics content is shown in Figure 2. Typically, the 5th, 7th, and 11th harmonics have the largest amplitude; it is explained that those are characteristic harmonics emitted by conventional rectifying units [24]. Figure 2 presents voltage distortions expressed as THD (5). The THD varies between 0 and 1% over time.
Analyzing the harmonics presented in Figure 2 (measurement using A class quality meter) allows us to conclude that the amplitudes of the harmonics are below the thresholds specified in norms and regulations. According to [25], 95% of 10 min average values of harmonics must be below the permissible values specified in Table 1. There are different permissible values depending on the type of connection group [26]:
  • I group—entities whose devices, installations, and networks are connected directly to networks with a rated voltage higher than 110 kV;
  • II group—entities whose devices, installations, and networks are connected directly to the network with a rated voltage of 110 kV;
  • III group—entities whose devices, installations, and networks are connected directly to networks with a rated voltage higher than 1 kV but lower than 110 kV;
  • IV group—entities whose devices, installations, and networks are connected directly to the network with a rated voltage not higher than 1 kV and a connection power higher than 40 kW or the rated current of the pre-meter protection in the current path higher than 63A;
  • V group—entities whose devices, installations, and networks are connected directly to the network with a rated voltage not higher than 1 kV, a connection power not higher than 40 kW, and a rated current of the pre-meter protection not higher than 63A;
  • VI group—entities whose devices, installations, and networks are connected to the network through a temporary connection, which will be, under the terms specified in the contract, replaced by a target connection, or entities whose devices, installations, and networks are connected to the network for a specified period, but not longer than a year.
The general trend is that the higher the harmonic row, the lower the acceptable level of harmonic amplitude. For the connection groups I and II, the permissible value of harmonics above the 25th order is roughly 0.5%. The more detailed analysis of Figure 2 allows us to notice that 47 and 49 harmonics also have significant amplitudes in relation to acceptable values. One can observe an amplitude of ~0.15, which is approximately 33% of the acceptable value (0.02 + 0.5·25/47). Harmonics limits may differ around the world depending on the standards and regulations, e.g., [27].
Harmonics analysis is even more complicated, since the inverters are always delivered with the OEM (original equipment manufacturer) filters inside the inverter [28]. It is also possible that additional dedicated filters are installed on the AC or DC side [29,30]. Unfortunately, producers rarely provide information about the internal filters; therefore, often in practice, one needs to accept that the results of harmonics analysis are connected to errors. To avoid potential errors, on-site measurements are typically recommended. Currently, every time new energy sources are installed, power quality (PQ) analysis devices are also installed, which allows for better monitoring of the whole network [31].

Current Situation in the Distribution System

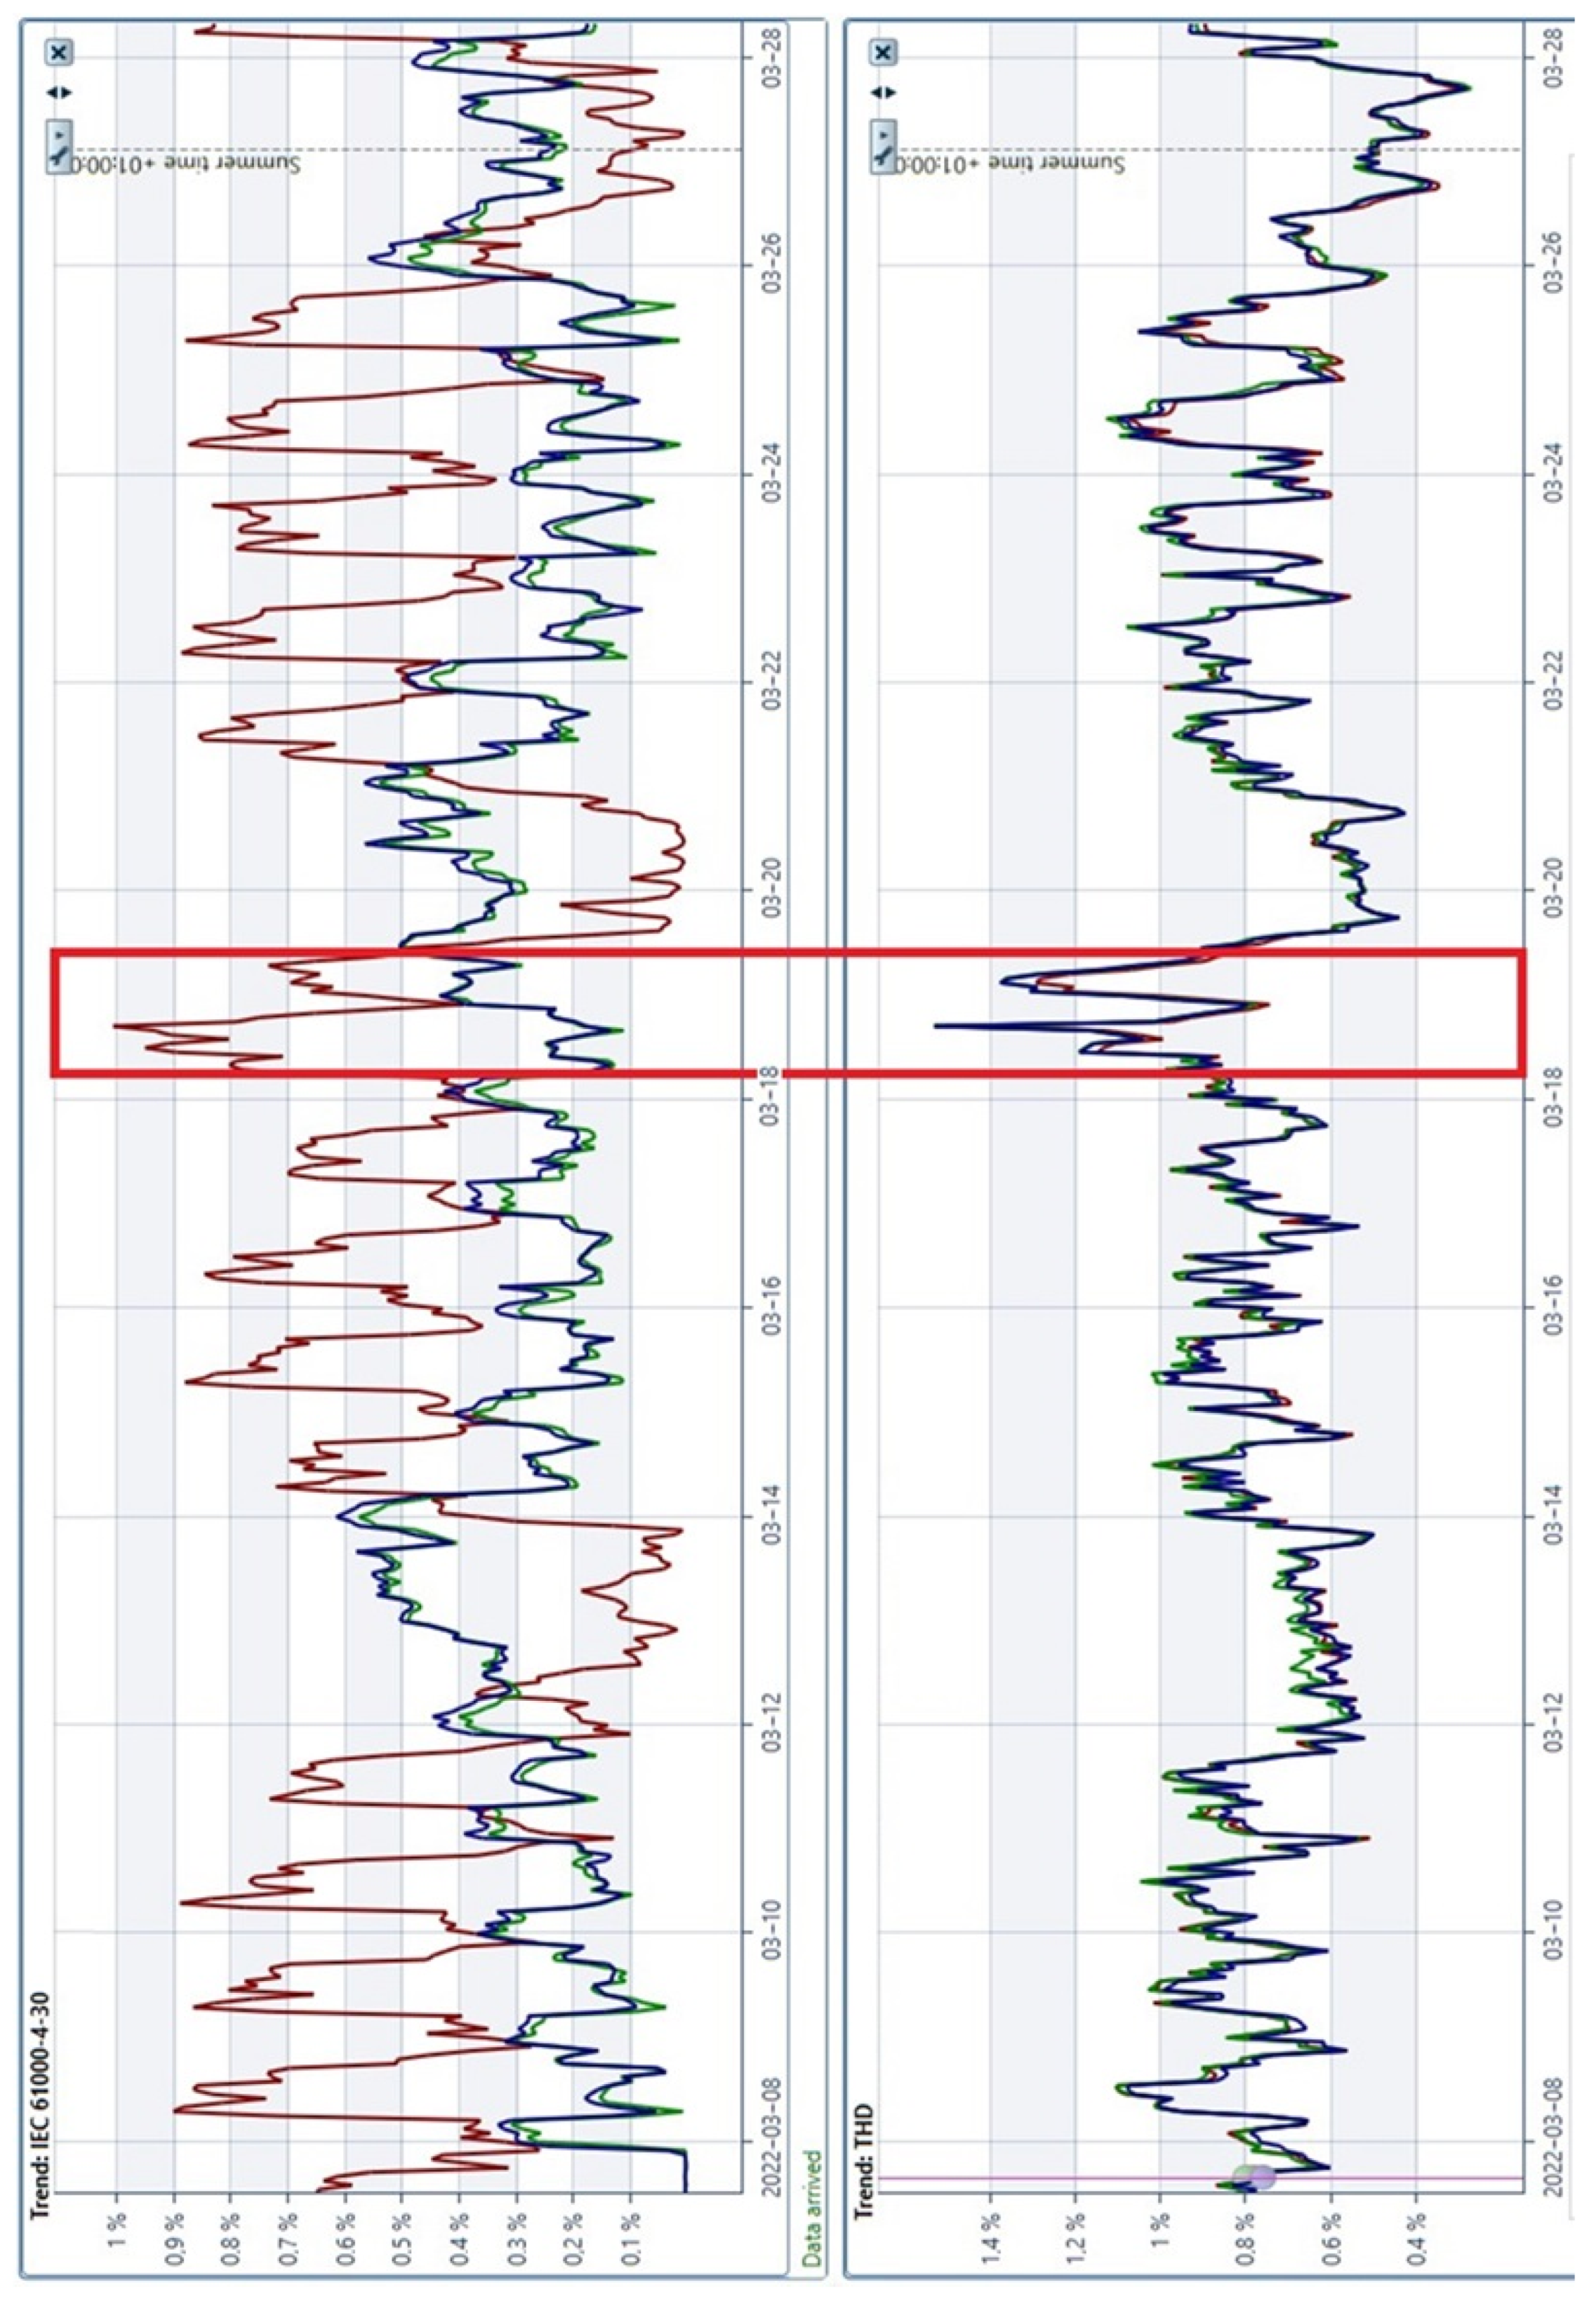
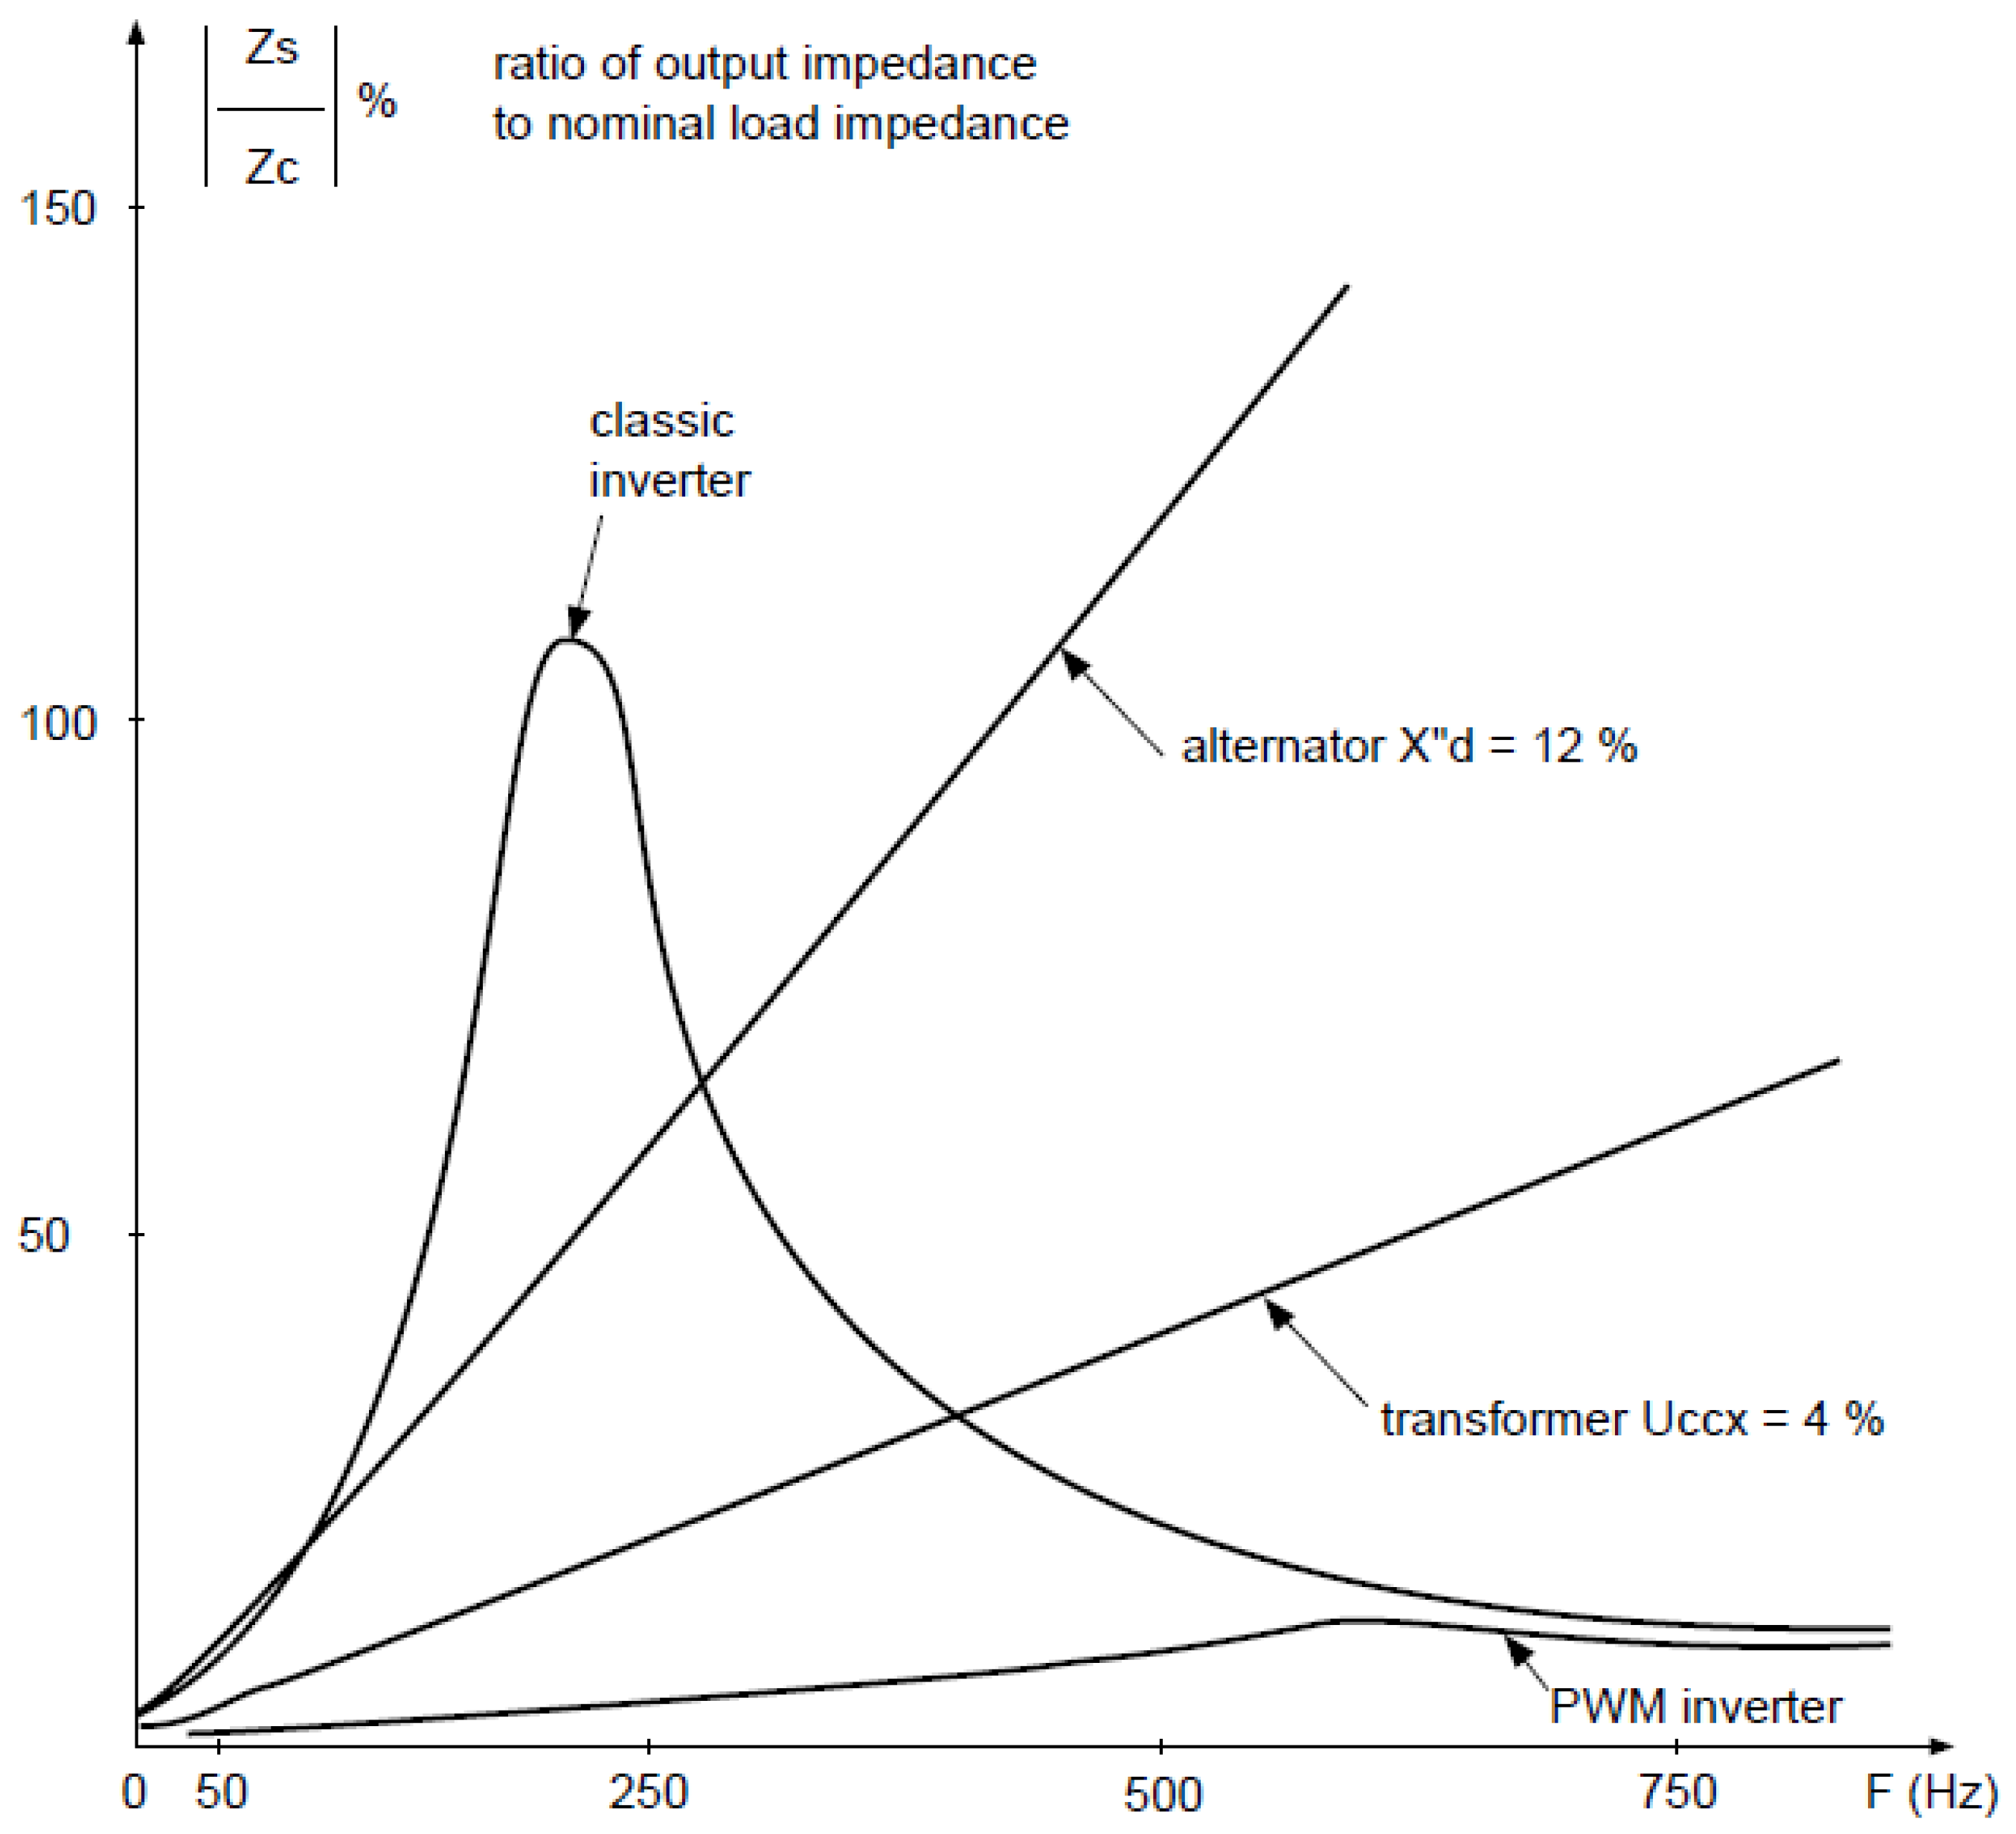
The voltage harmonic distortions can be strongly influenced by the modification of the power system structure. Figure 3 shows the fifth harmonic amplitude measured in three phases, varying over time. Based on the time of occurrence, one can indicate that distortions are higher during working days and lower during weekends; therefore, the changes are most likely caused by nearby industrial activities. The 5th harmonic, 19.03, reached 1% (marked in red), which was caused by the modification of the power system structure—a disconnection of one of two 110 kV lines, which was closer to the 220/110 station. In the presented case, the amplitudes of the harmonics have a large safety margin from the limits defined in Table 1; at the same time, the presented case shows that one needs to be very careful during the analysis of the impact of new devices on the power system, since the harmonic content may change instantaneously when the power system structure and the resulting impedance characteristic change. The impedance characteristics of exemplary power system elements are presented in Figure 4. The resulting impedance is a combination of elements’ impedances, e.g., line impedance is additional to source impedance. The PWM inverter ensures lower impedance than the conventional inverter, which ensures the minimization of harmonic distortion [32].
The impedance characteristics show that impedance strongly differs depending on the distortion frequency (harmonic row). As a result, there is a risk that the impedance will be reduced to low/high levels, resulting in dangerously high currents/voltage—series/parallel resonance. Resonance may occur during both steady and transient states and result in devastating surges—transient overvoltage (TOV) [33].
As a result of the presented factors, harmonics analysis is difficult. Moreover, because of the long time frame, preferably a few weeks, numerous configurations of the power system that need to be considered, and operating points, e.g., tap charger positions, harmonics analysis is a time-consuming process. One needs to underline that regulations may state that only normal power system configurations are subject to verification of requirements. In practice, in the case of a 110 kV network, the 5th, 7th, and 11th harmonics are often characterized by the highest amplitudes because both the rectifiers and inverters often emit a large amount of the 5th and 7th harmonics. Furthermore, the harmonics can be within the resonance band of the network [34]. Authorial analysis shows that EHV lines could also be susceptible to the resonance effect and potentially dangerous resonance of low-order harmonics. The analysis is performed in order to verify if, after the modification of the generation module, the NC RFG grid code requirements were fulfilled [35]. Among many different requirements, the reactive power capability requirements have an indirect impact on the harmonics distortions in the power network due to the impact of new devices on the power system impedance characteristics. In some cases, it is difficult to fulfill reactive power capability requirements without modification of the power system structure. The power plant operator is allowed to change the position of transformer tap changers or use conventional reactive power sources, e.g., capacitor banks, in order to fulfill the requirements. As a result, the impedance characteristics of the power system can be changed; therefore, the possibility of resonance for some operational points of the power plant exists [36]. The structure of the power network could also be changed during maintenance activities of power plants, e.g., disconnection of one of the internal feeders of a power plant. Therefore, many different configurations of power plants have to be carefully analyzed to exclude the risk of unwanted resonances and potential resulting failures.
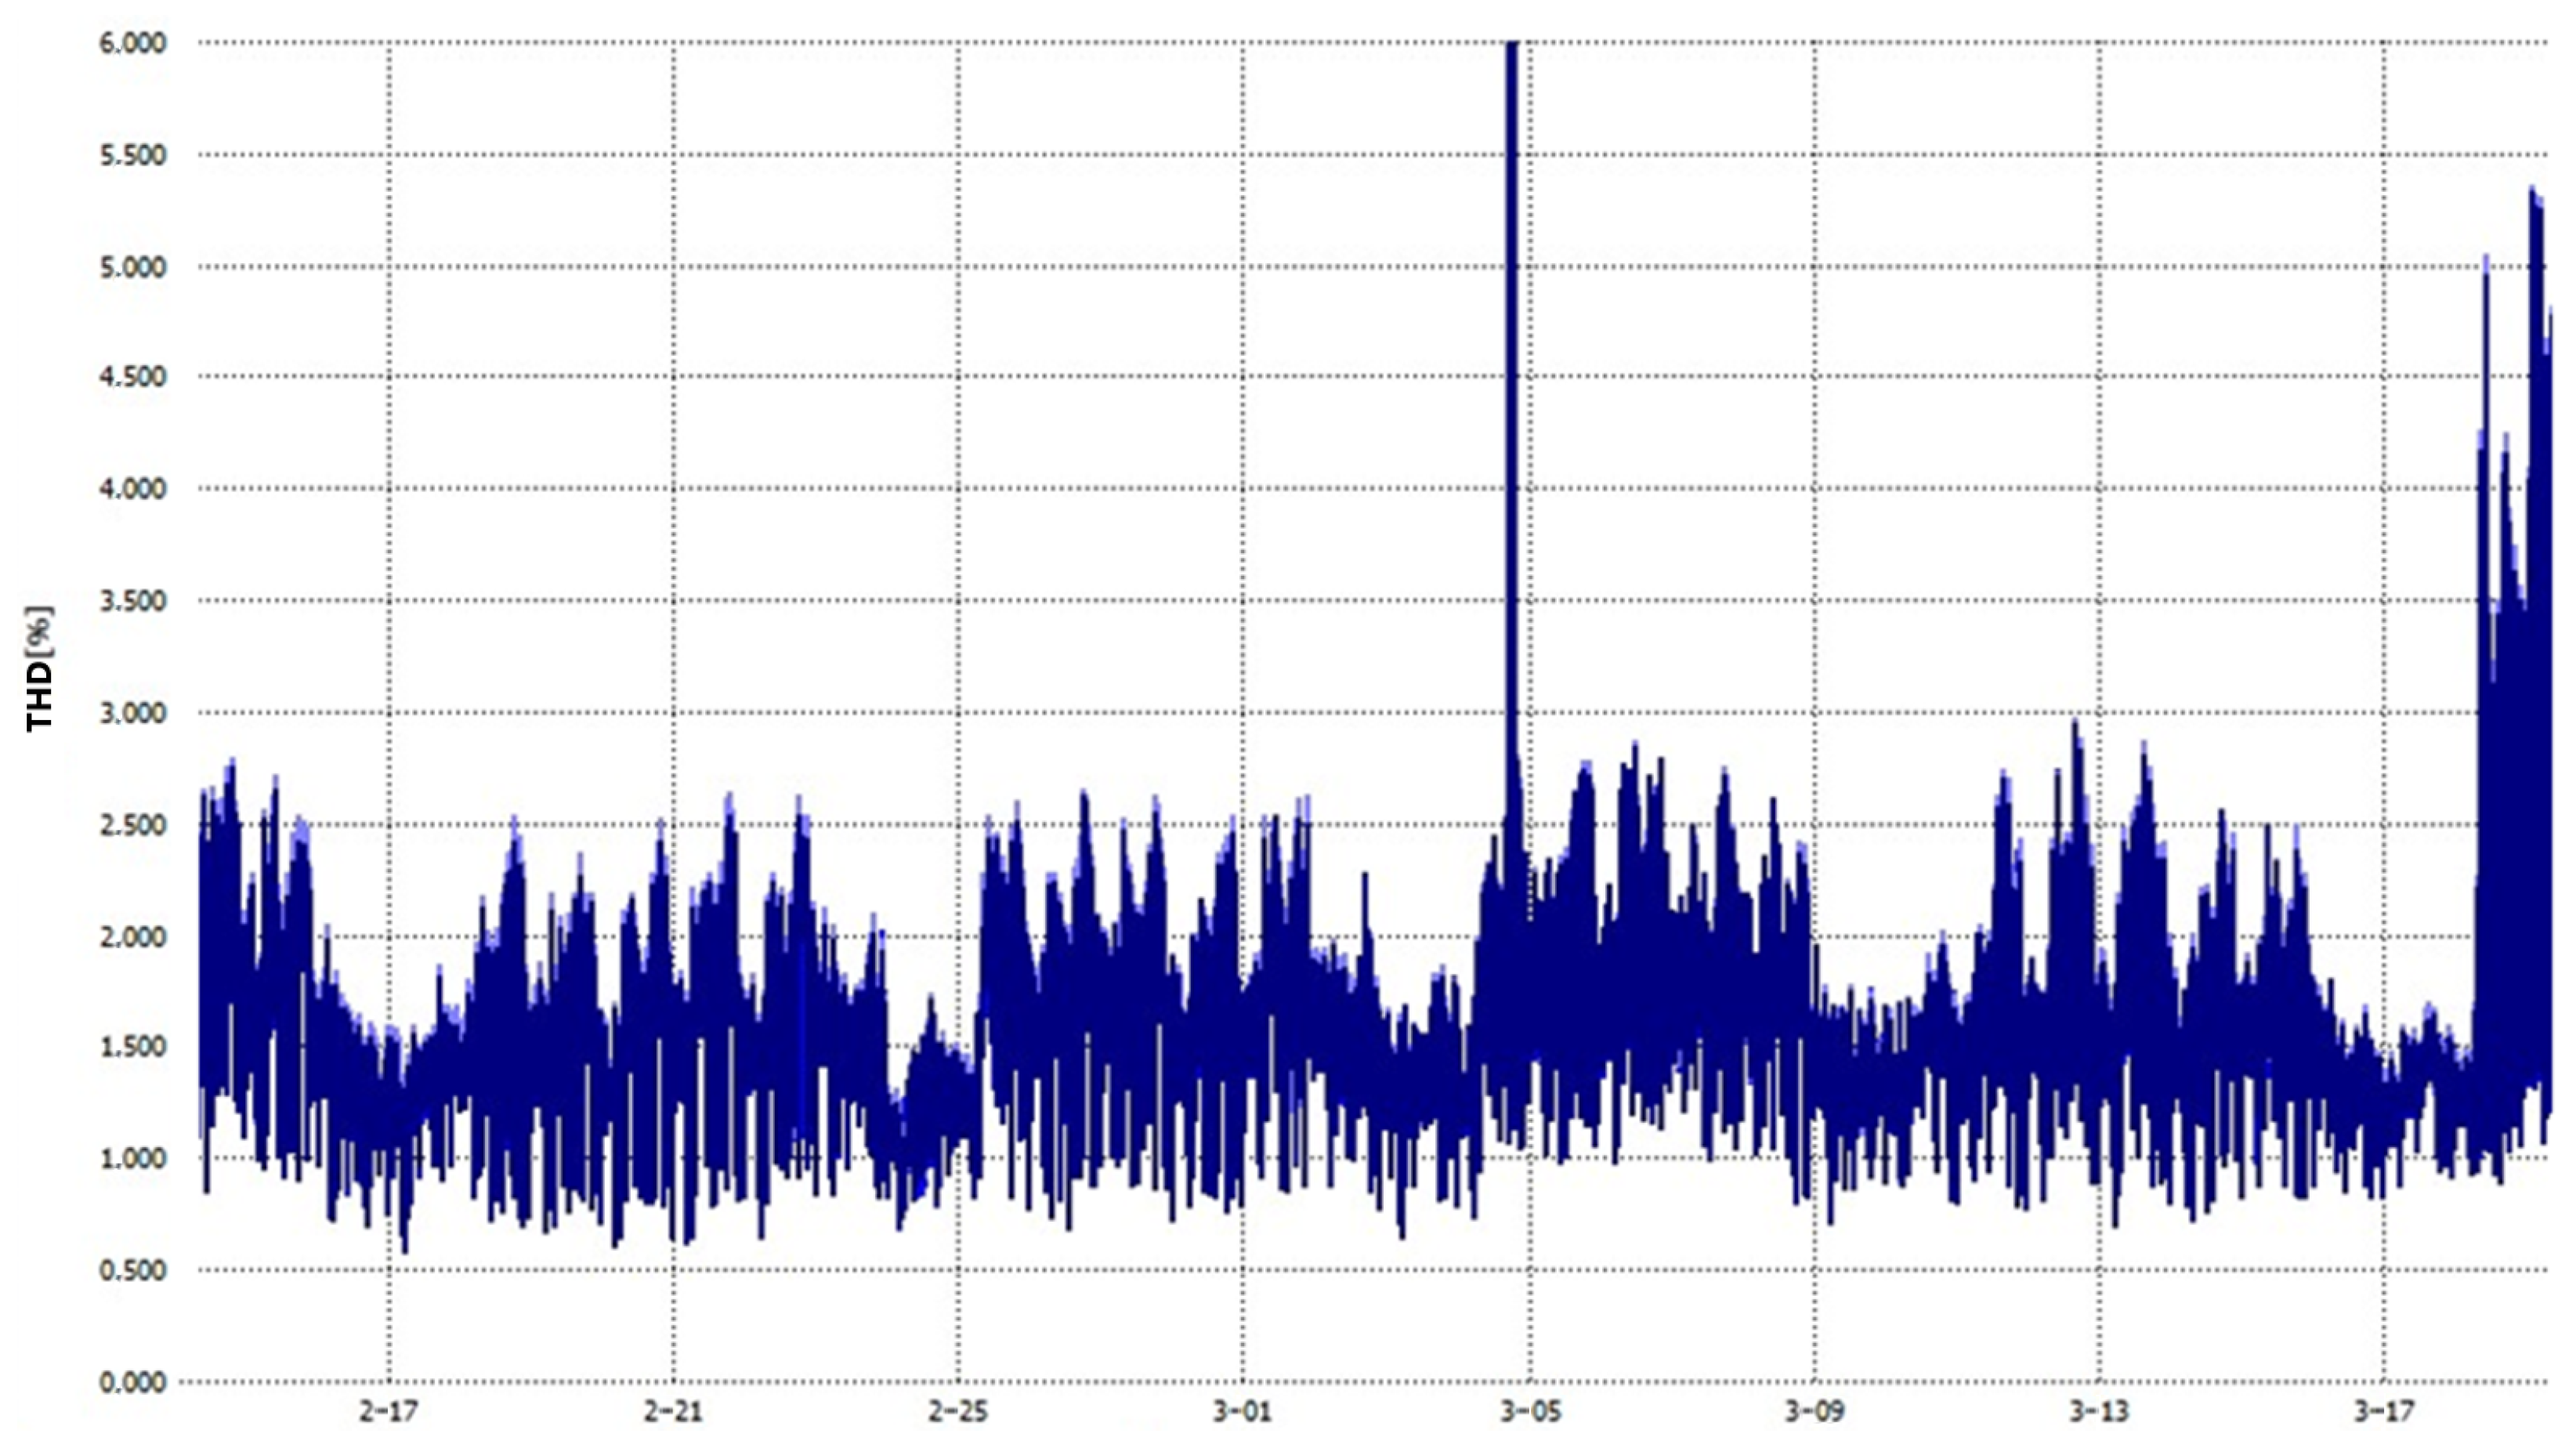
The measurements show that short-term (1s presented) amplitudes of harmonics and THDu in MV networks can be much higher than those in HV networks. Figure 5 presents the 1 s voltage distortion THD. The voltage distortion varied between 0.5 and 2.5% for most of the time (between 15.02 and 18.03). At the end of the measurement period (18.03), the THD increased significantly. The THD level varied between 1 and 3.5% for most of the time; however, values up to 5.5% could be observed relatively often. According to the norms, the limits may be exceeded for a short time, e.g., a few seconds, because the requirements are specified regarding the 10 min average values. Moreover, the PQ norm allows that 5% of the 10 min average values will be above the thresholds specified in 50, 160 [37]. On the other hand, the requirements describing connection possibilities indicate that if any limit, e.g., single harmonic, is exceeded, the decision about the integration of a new device should be negative [38]. New connection requirements indicate that harmonic analysis may be omitted if inverters are certified by PTPIRE [39], which is justified by the great technological progress in inverters over the years. The harmonic spectrum of an exemplary new-generation inverter is presented in Table 2. The omission of analysis creates a risk that potential resonances could be initially missed. Moreover, one needs to note that even the best inverters in high numbers may have a noticeable impact on power quality. Despite new renewables, one may expect that more high-power electronic loads will be introduced to power systems, e.g., electric vehicle charging stations. Therefore, it is expected that the power quality will degrade in the future.
Power quality issues are a result of the power of electronic converters; however, the susceptibility to distortion is a result of the short-circuit power of the network (and other parameters) at the point of coupling. The lower the voltage level, the smaller the short-circuit power, and therefore the higher the distortions that typically exist in lower-voltage power networks. Typically, the short-circuit power in substations is in the following ranges: EHV substations 10,000–30,000 MVA, HV (110 kV) 1000–10,000 MVA, and 150–250 MVA in MV networks. Higher short-circuit powers are observed when short-circuit power sources are closer to the substation and are larger, e.g., the higher nominal power of a transformer or synchronous generator.
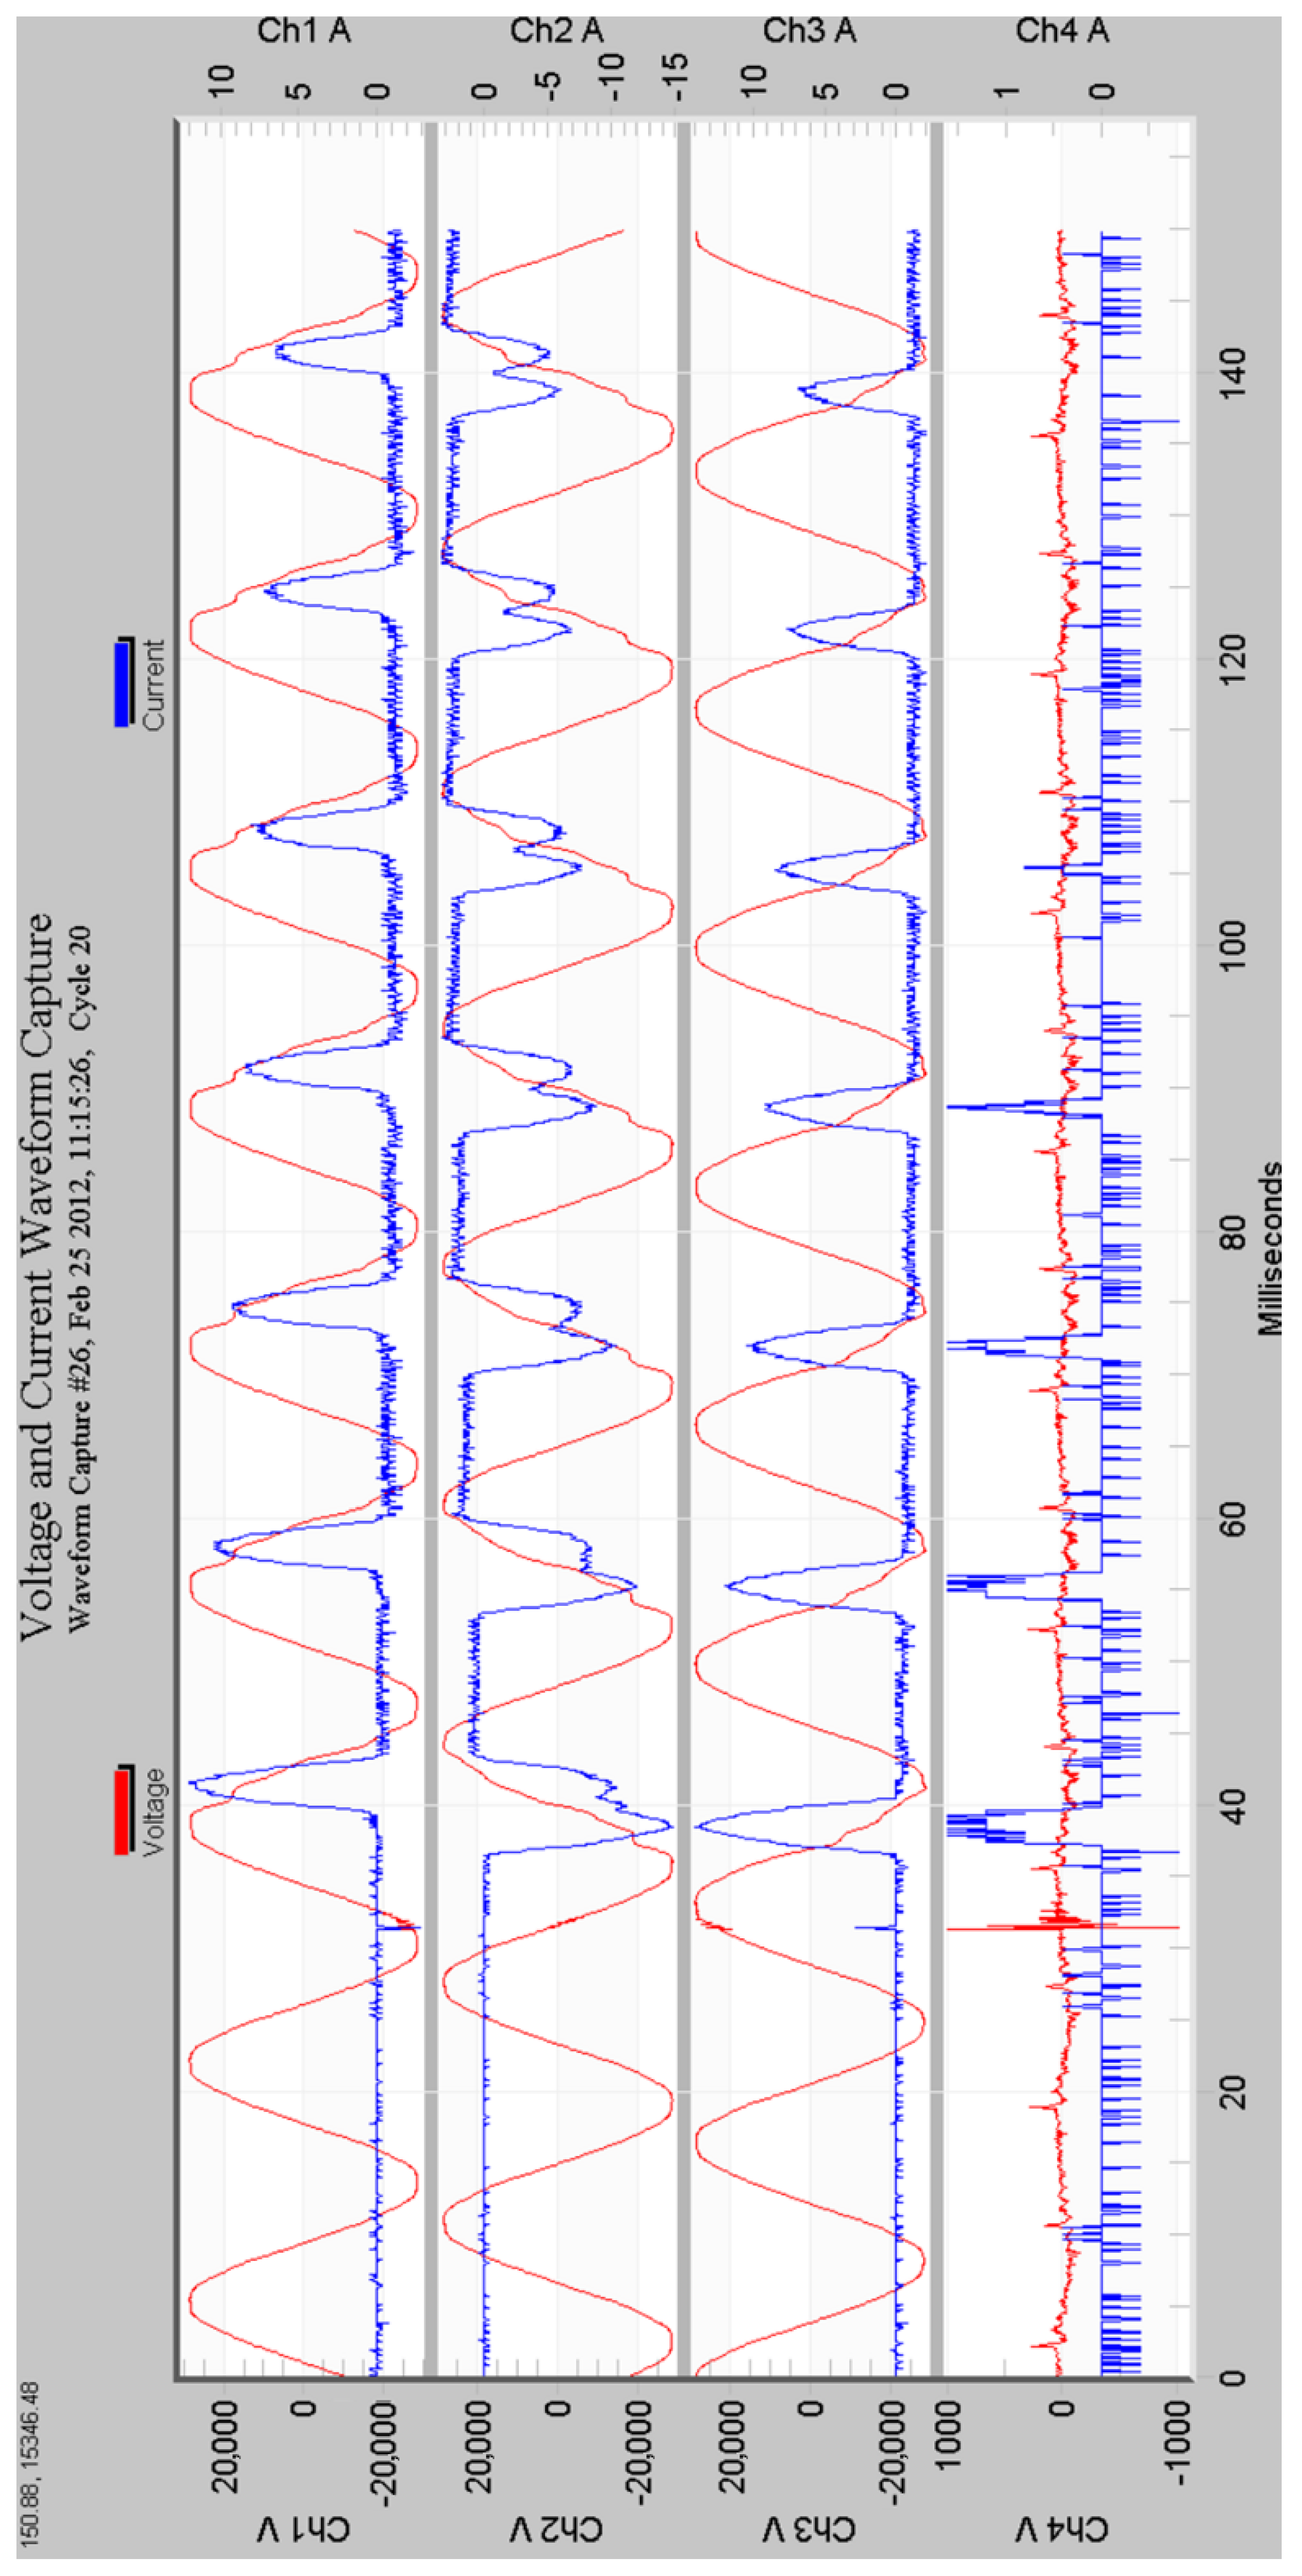
Recently, the Polish Railway (PLK, PKP) announced a green railway initiative, according to which a high share of electricity is produced using renewables [41]. The integration of renewables with railway networks is even more challenging than distribution networks because the short-circuit power is even lower, and the traction loads emit a large amount of harmonics due to passive 6- or 12-pulse rectifiers. The short-circuit power decreases with the increase in distance from the substation. Therefore, deep in the MV network, the power quality may be significantly lower, e.g., 5 km of 240 mm2 cable decreases the short circuit power from 200 MVA to 137 MVA, which is often the case for the supply of MV railway substations. As a result, the susceptibility of the network to harmonic distortions increases. The railway substation may also be supplied from the 110 kV network. In this case, the railway substation is equipped with four winding transformers: primary 110 kV, two windings for traction, and one non-traction load winding [42]. From the harmonics perspective, the best point of connection would be a 110 kV network; however, from the techno-economical perspective, the integration of a new source is justified when the power is roughly 20 MW or more. Another option for energy source connection is the non-traction load winding, typically 15 kV. Unfortunately, the non-traction load winding has very little power, in the range of 1 MVA, which results in a great reduction in the short circuit power to approximately 20–30 MVA. The final option for the integration of renewables with the railway network is connection to the DC network, which considers specific regulations and also distortions [43,44]. Harmonic analysis should also include analysis of waveforms, at least for typical transient conditions, e.g., the switching on of the inverter, particularly in locations with a high share of devices activated at similar time periods [45]. An exemplary startup of a high-power PV plant is presented in Figure 6 below (current marked in blue and resulting voltage distortions marked in red). One can see strongly distorted currents and resulting voltage distortions.

3. Harmonic Analysis—Simulations

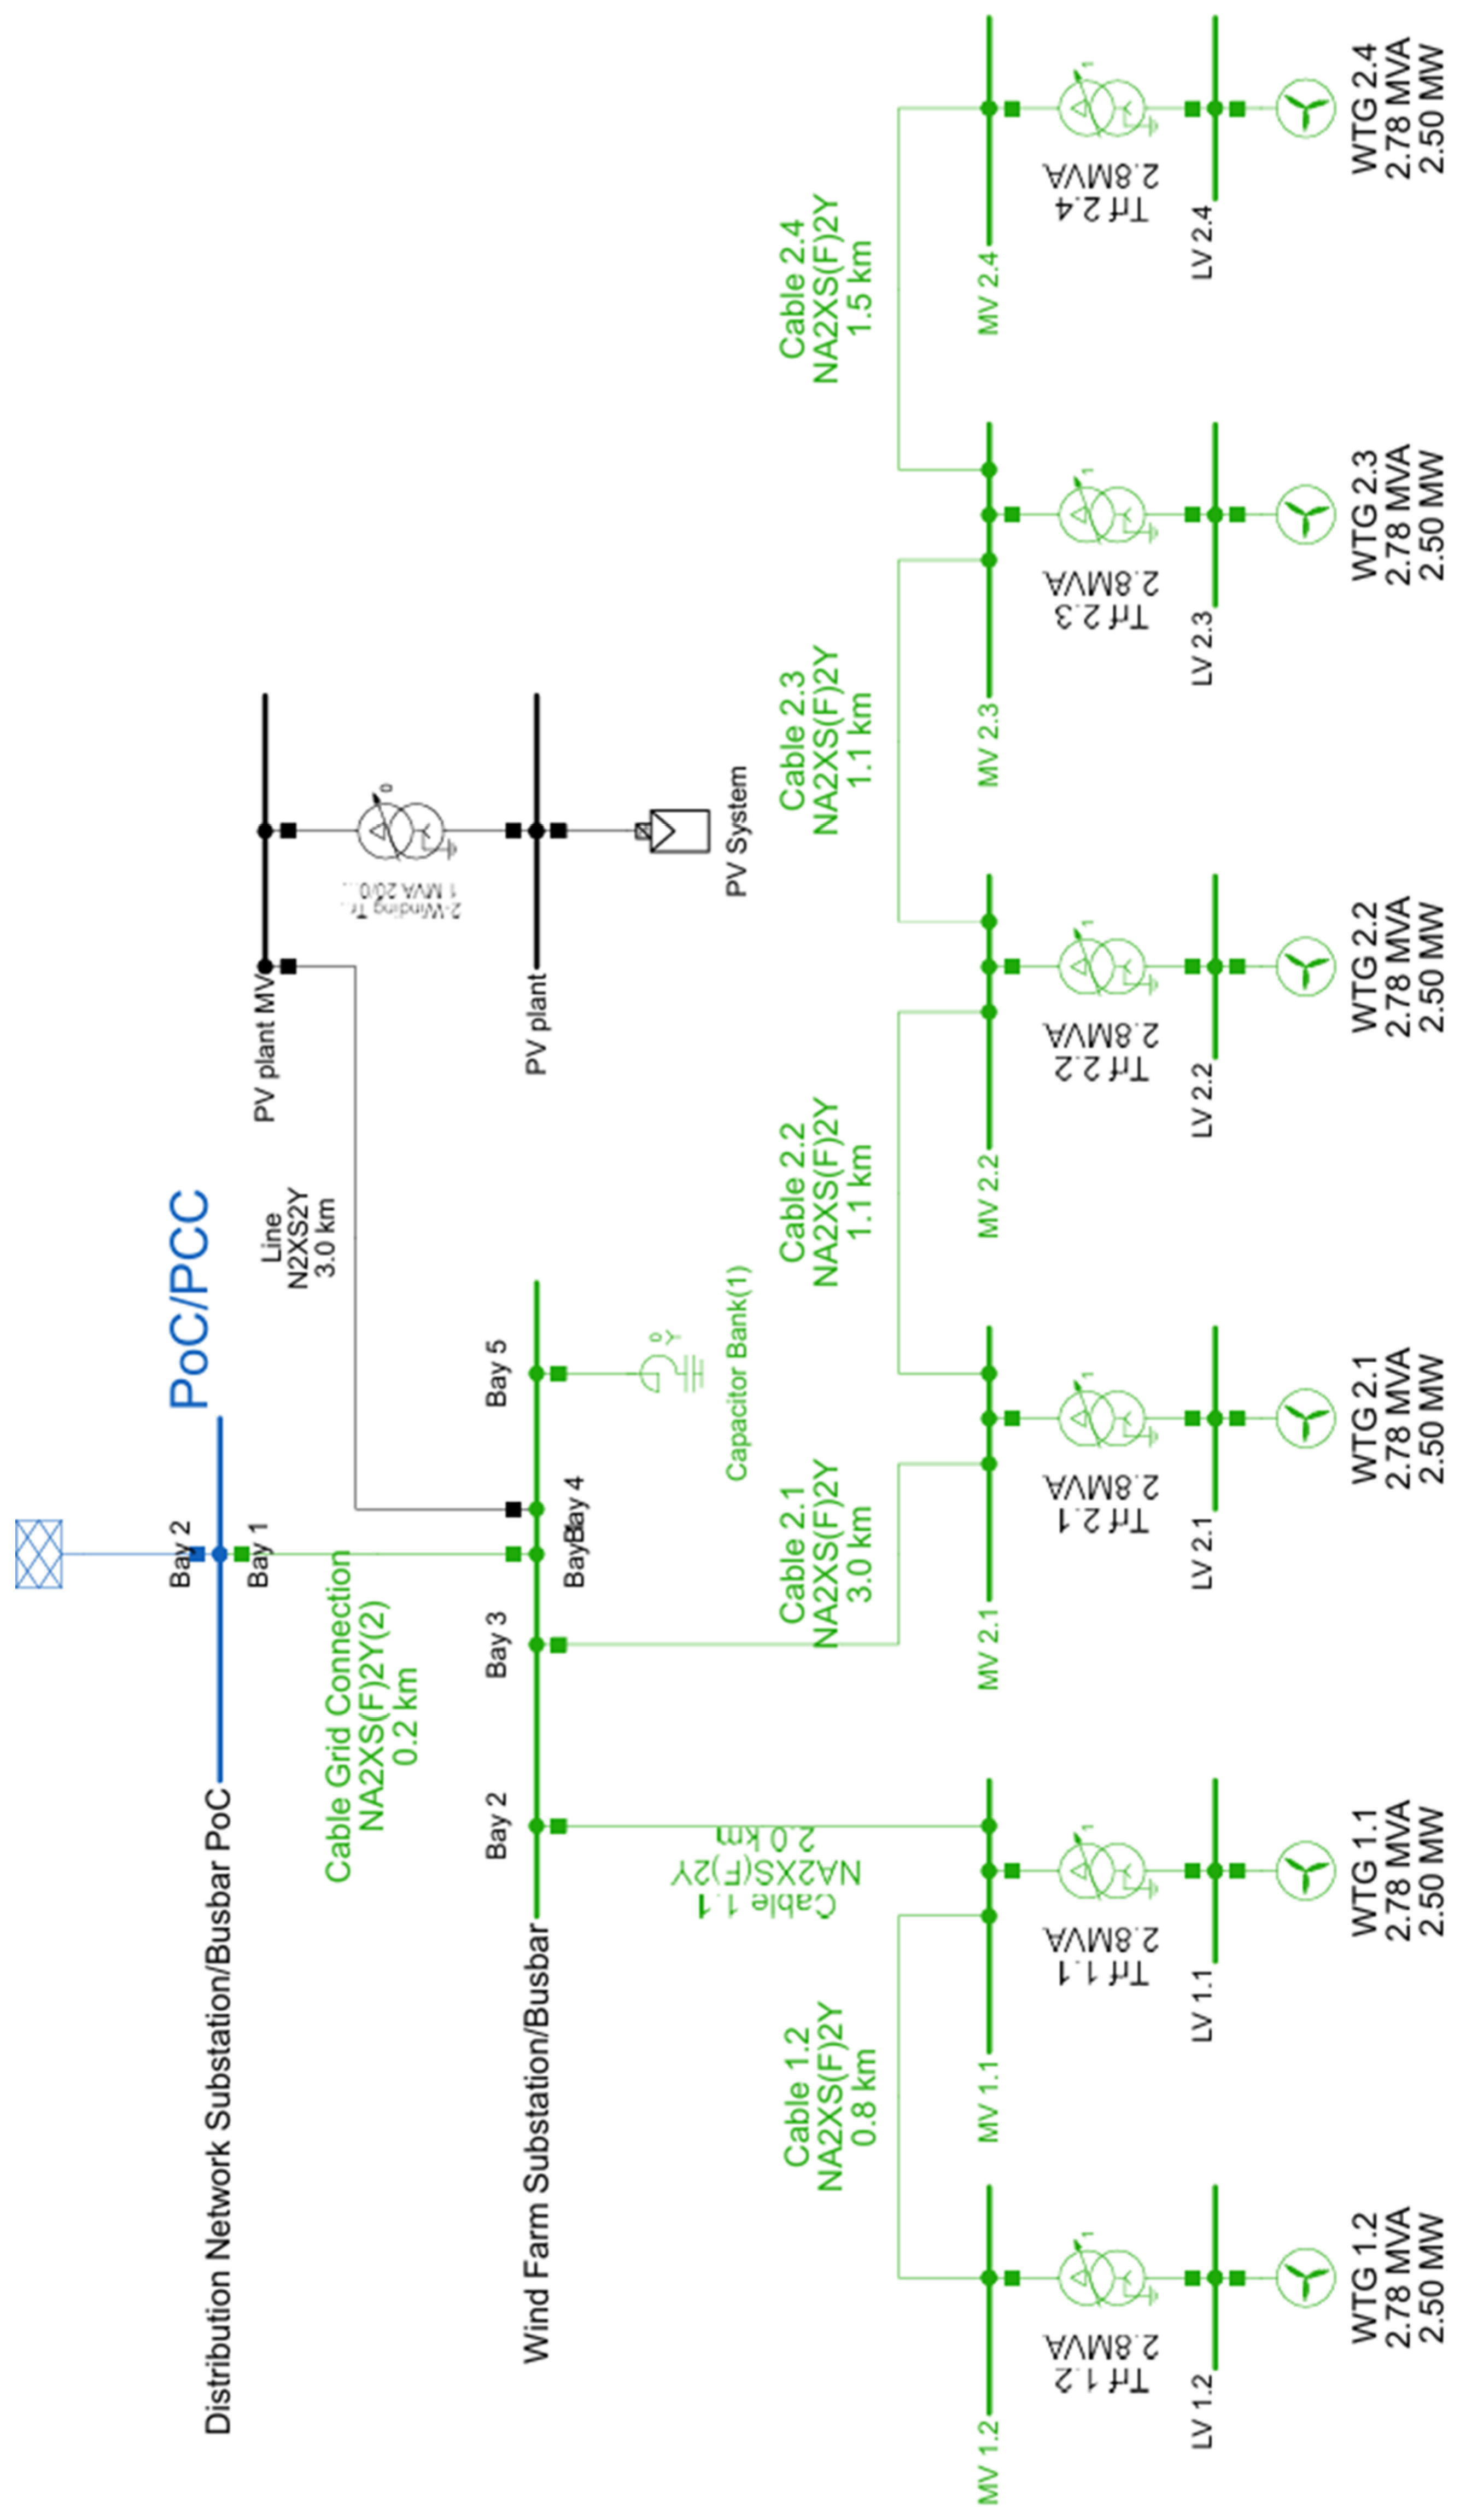
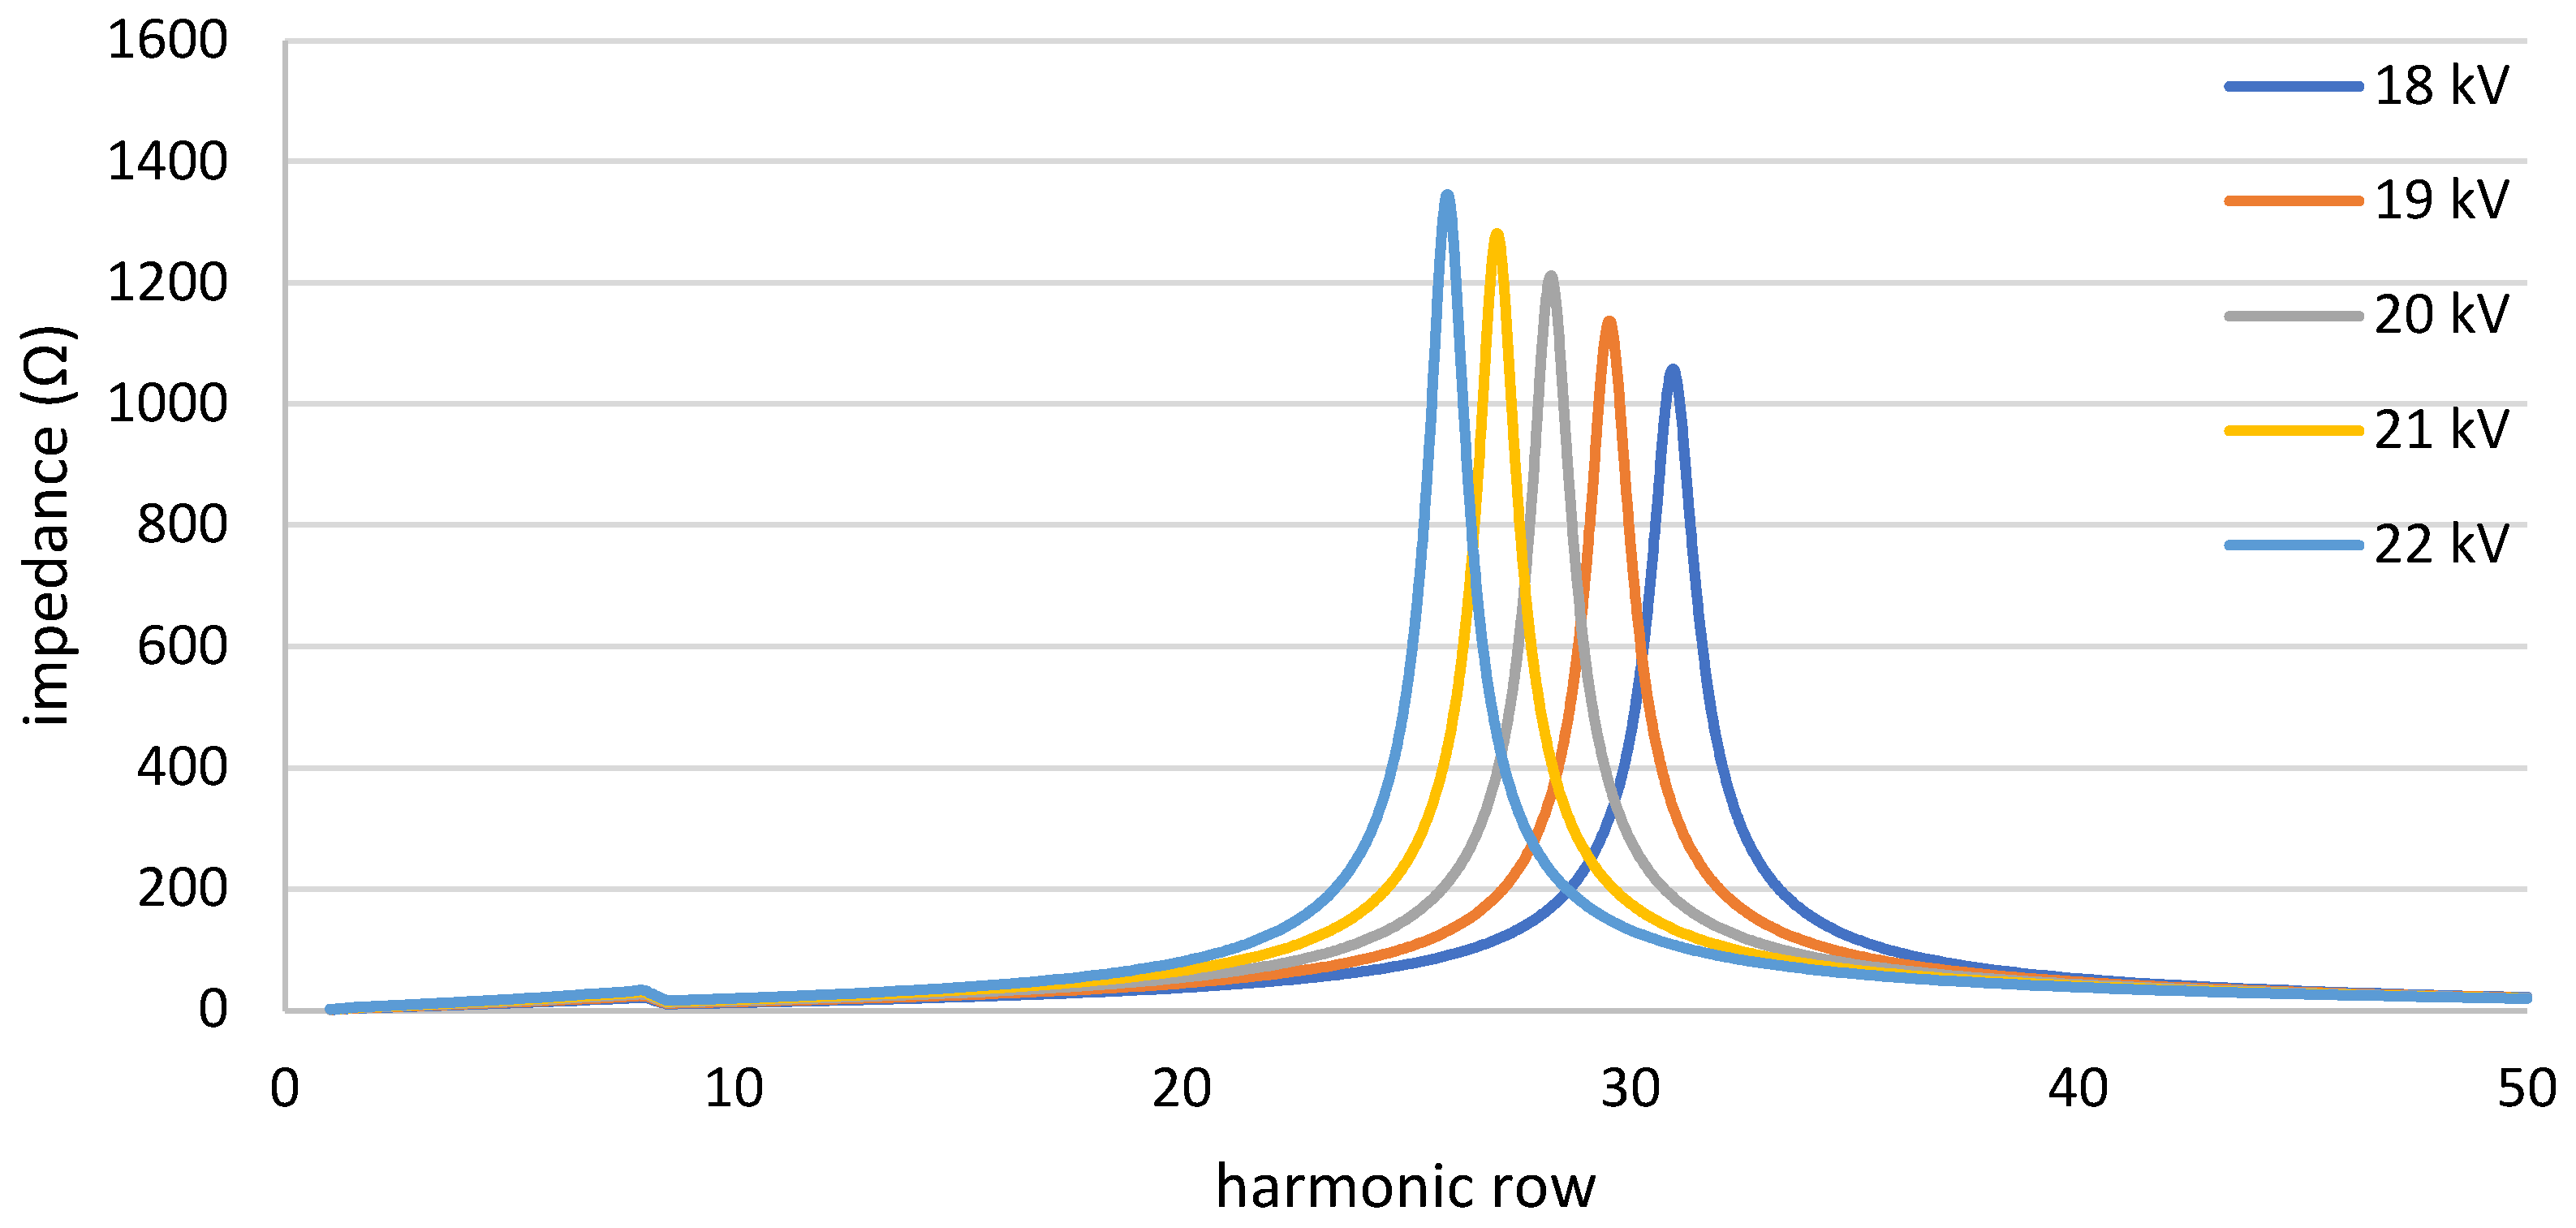
The purpose of the simulation was to draw attention to changes in the power system during system regulation or development. Attention is paid to the resonance band and its sensitivity to power system development and volt/VAR regulation. Simulations were performed using a modified test model available in the PowerFactory software 2024 SP4—wind farm of 20 kV [47]. The network topology and basic parameters are presented in Figure 7 (parameters in the Appendix A). First, the impact of the voltage level is analyzed. As can be seen in Figure 8, the analyzed model is susceptible to voltage change.
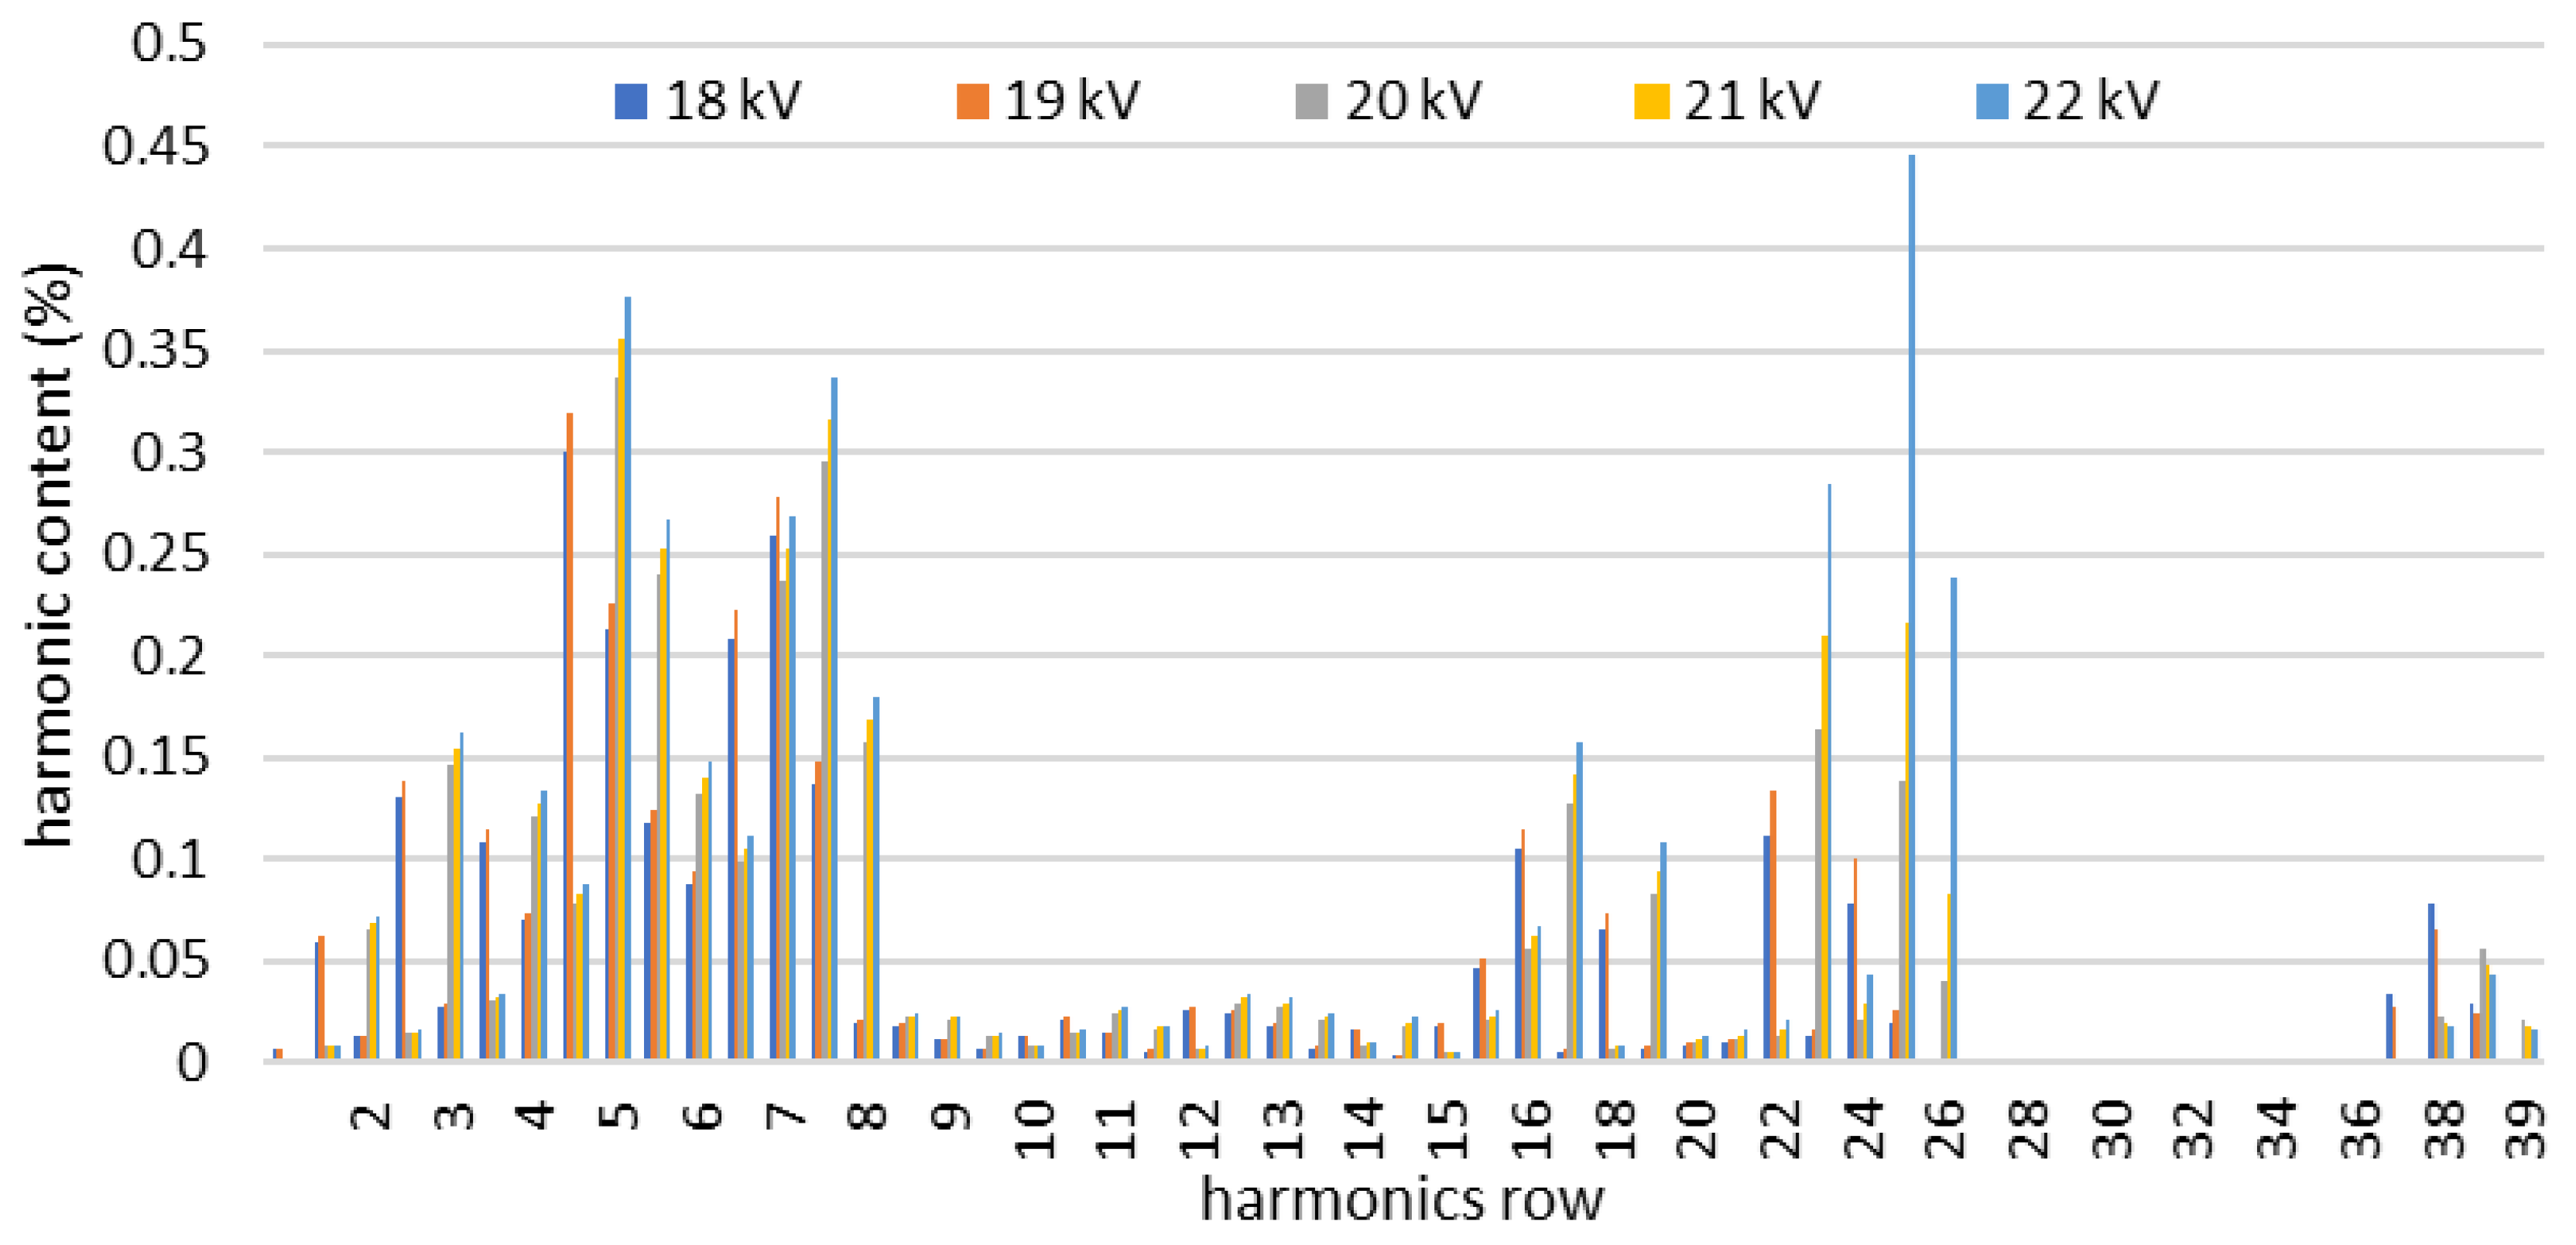
In the case of a nominal voltage—20 kV—the resonance is observed for the 28th harmonic, whereas a reduction in voltage to 18 kV (10%) shifts the resonance to the 31st harmonic. A voltage increase to 22 kV (10%) shifts the resonance to the 26th harmonic. The shift may trigger the resonance of harmonics, which are negligible under normal operating conditions. The resulting voltage harmonics are presented in Figure 9. The harmonics are the result of wind farm inverters with default settings connected to the network, as defined by the impedance characteristics presented in Figure 8. It can be seen that when a harmonic, e.g., 24, is in the resonance band (22 kV), the distortions are increased.
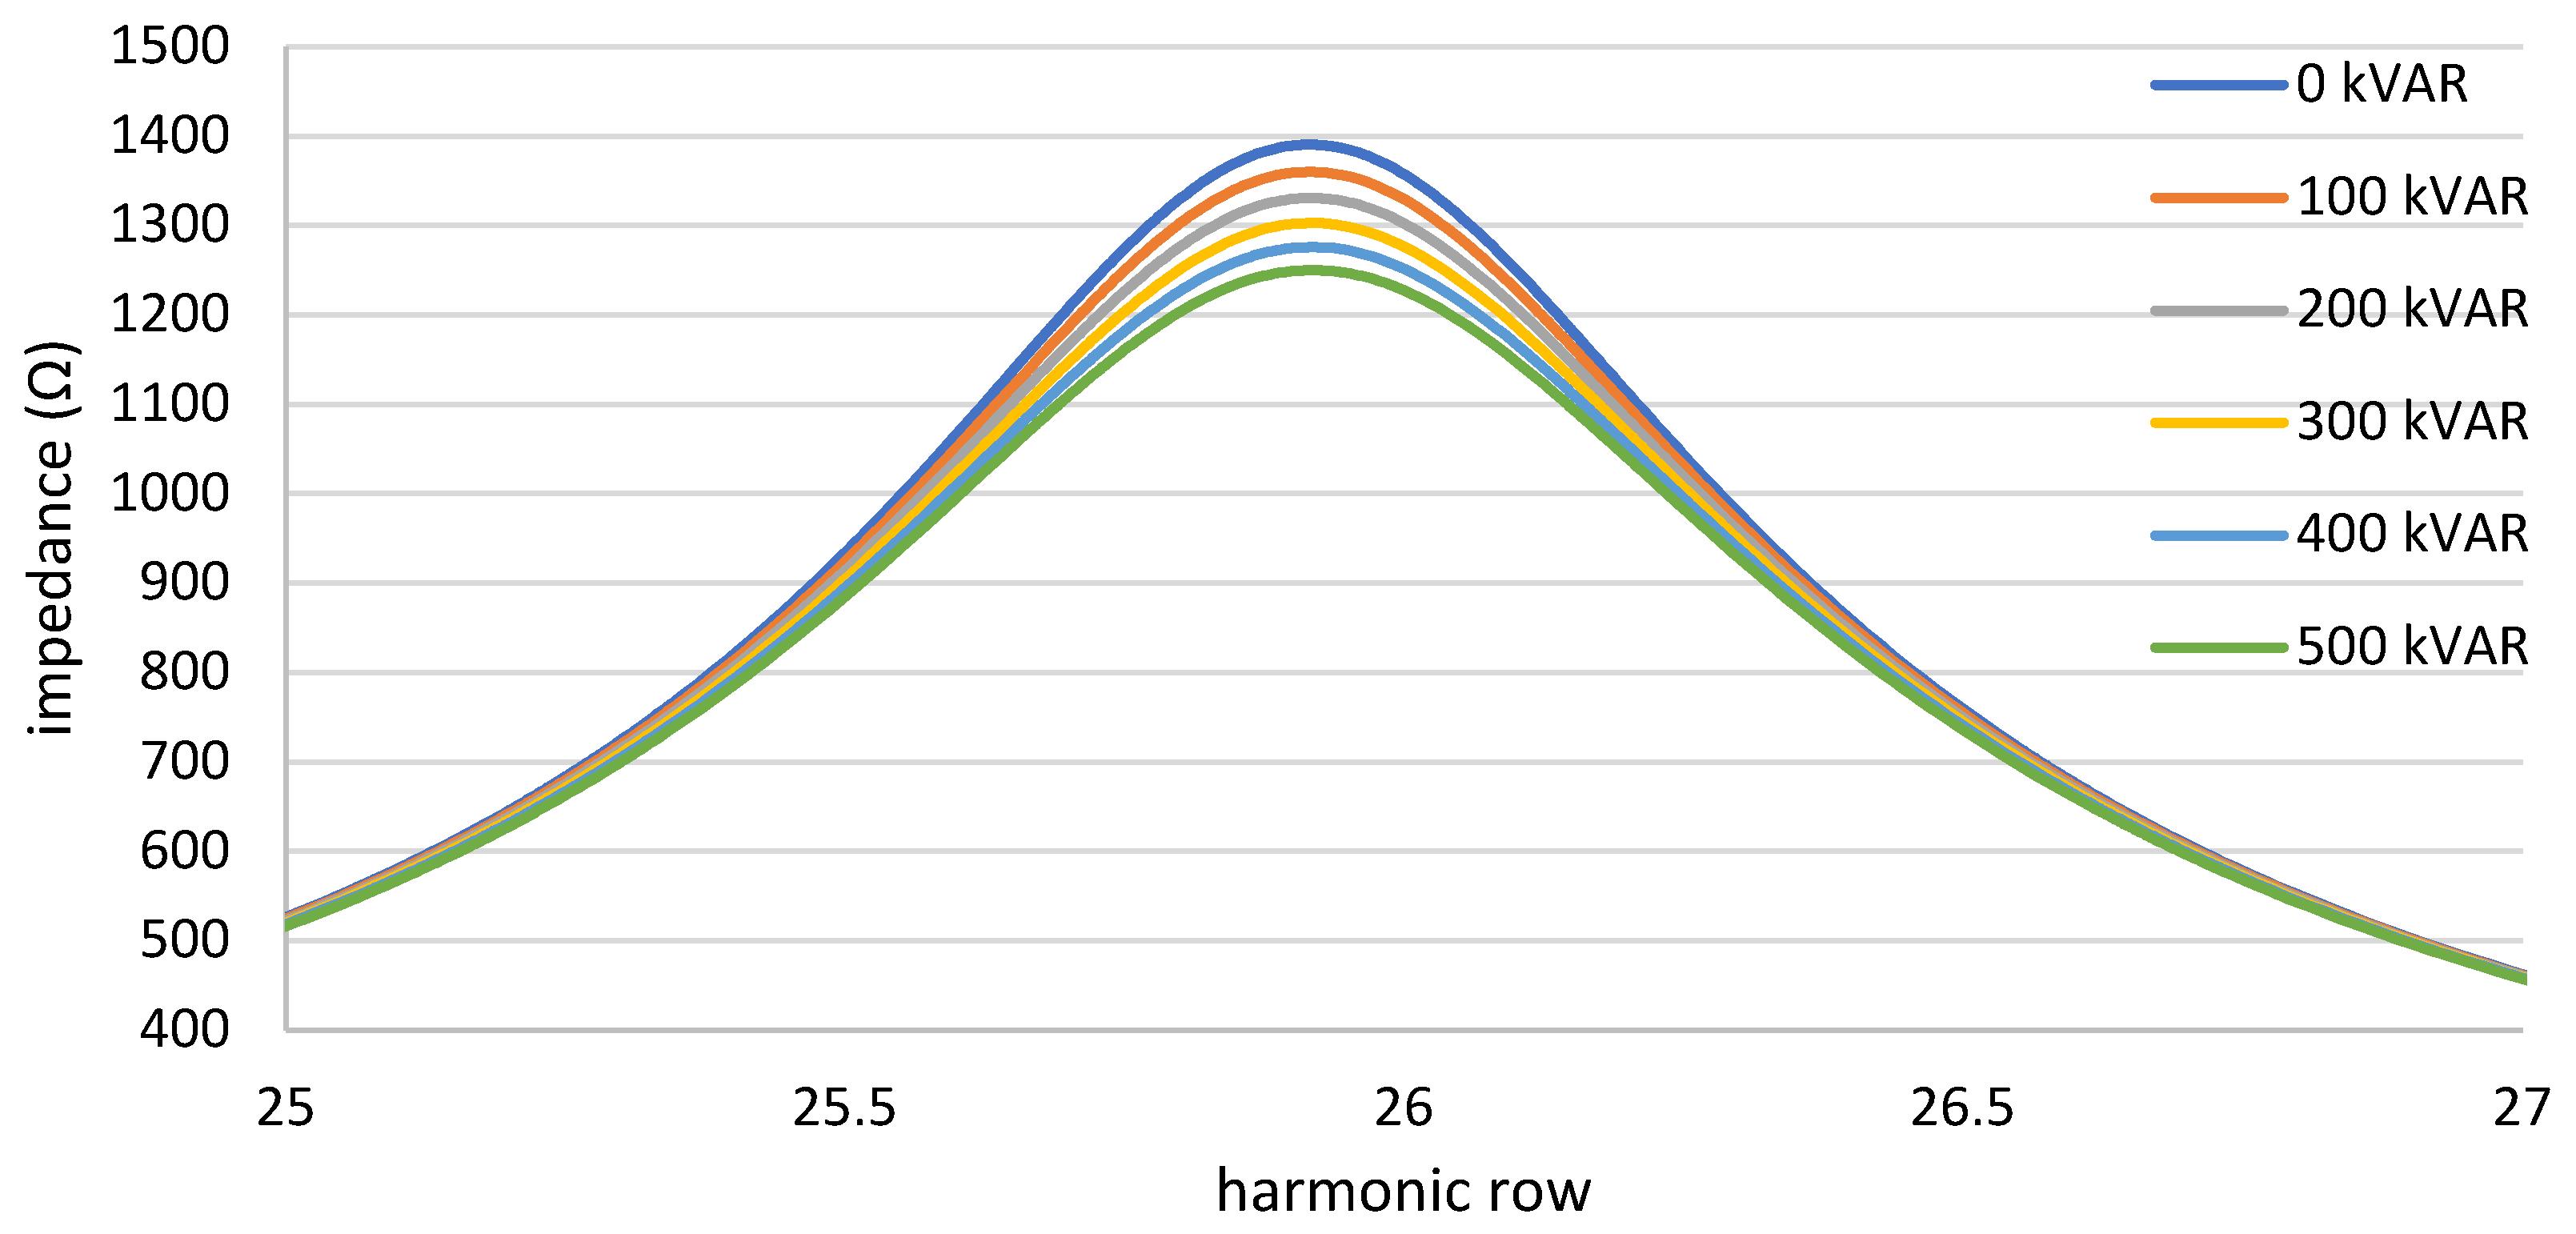
Further, the impact on the capacitor bank is analyzed and presented in Figure 10. As can be seen in the analyzed case, the resonance band is not shifted, but is dampened with the increase in capacitor power. One has to underline that it is also possible that the resonance band will be shifted depending on the power system’s conditions.
The next stage of the simulation is to indicate the impact of network expansion accompanying the connection of a photovoltaic power plant on the impedance characteristics of the power grid—Figure 11. The initial value of the network impedance is marked in blue. The addition of a power cable representing the new PV source power output system is marked with the following colors:
Orange—cable with a cross-section of 70 mm2 and a length of 1 km;
Gray—cable with a cross-section of 95 mm2 and a length of 1.5 km;
Yellow—cable with a cross-section of 120 mm2 and a length of 2.5 km.
It was found that the addition of further cable lines led to a further shift in the resonance band toward lower harmonic orders, which in practice means that the risk of exceeding the permissible harmonic values in extensive networks with a large share of cable lines or networks operating with only one supply transformer (two in the normal mode) is greater. Theoretically, to minimize the shift in the resonance band toward lower harmonics, it is worth considering the use of overhead lines with lower capacitance, but this is rather unlikely, since cable lines are characterized by higher reliability, which is often a superior feature.
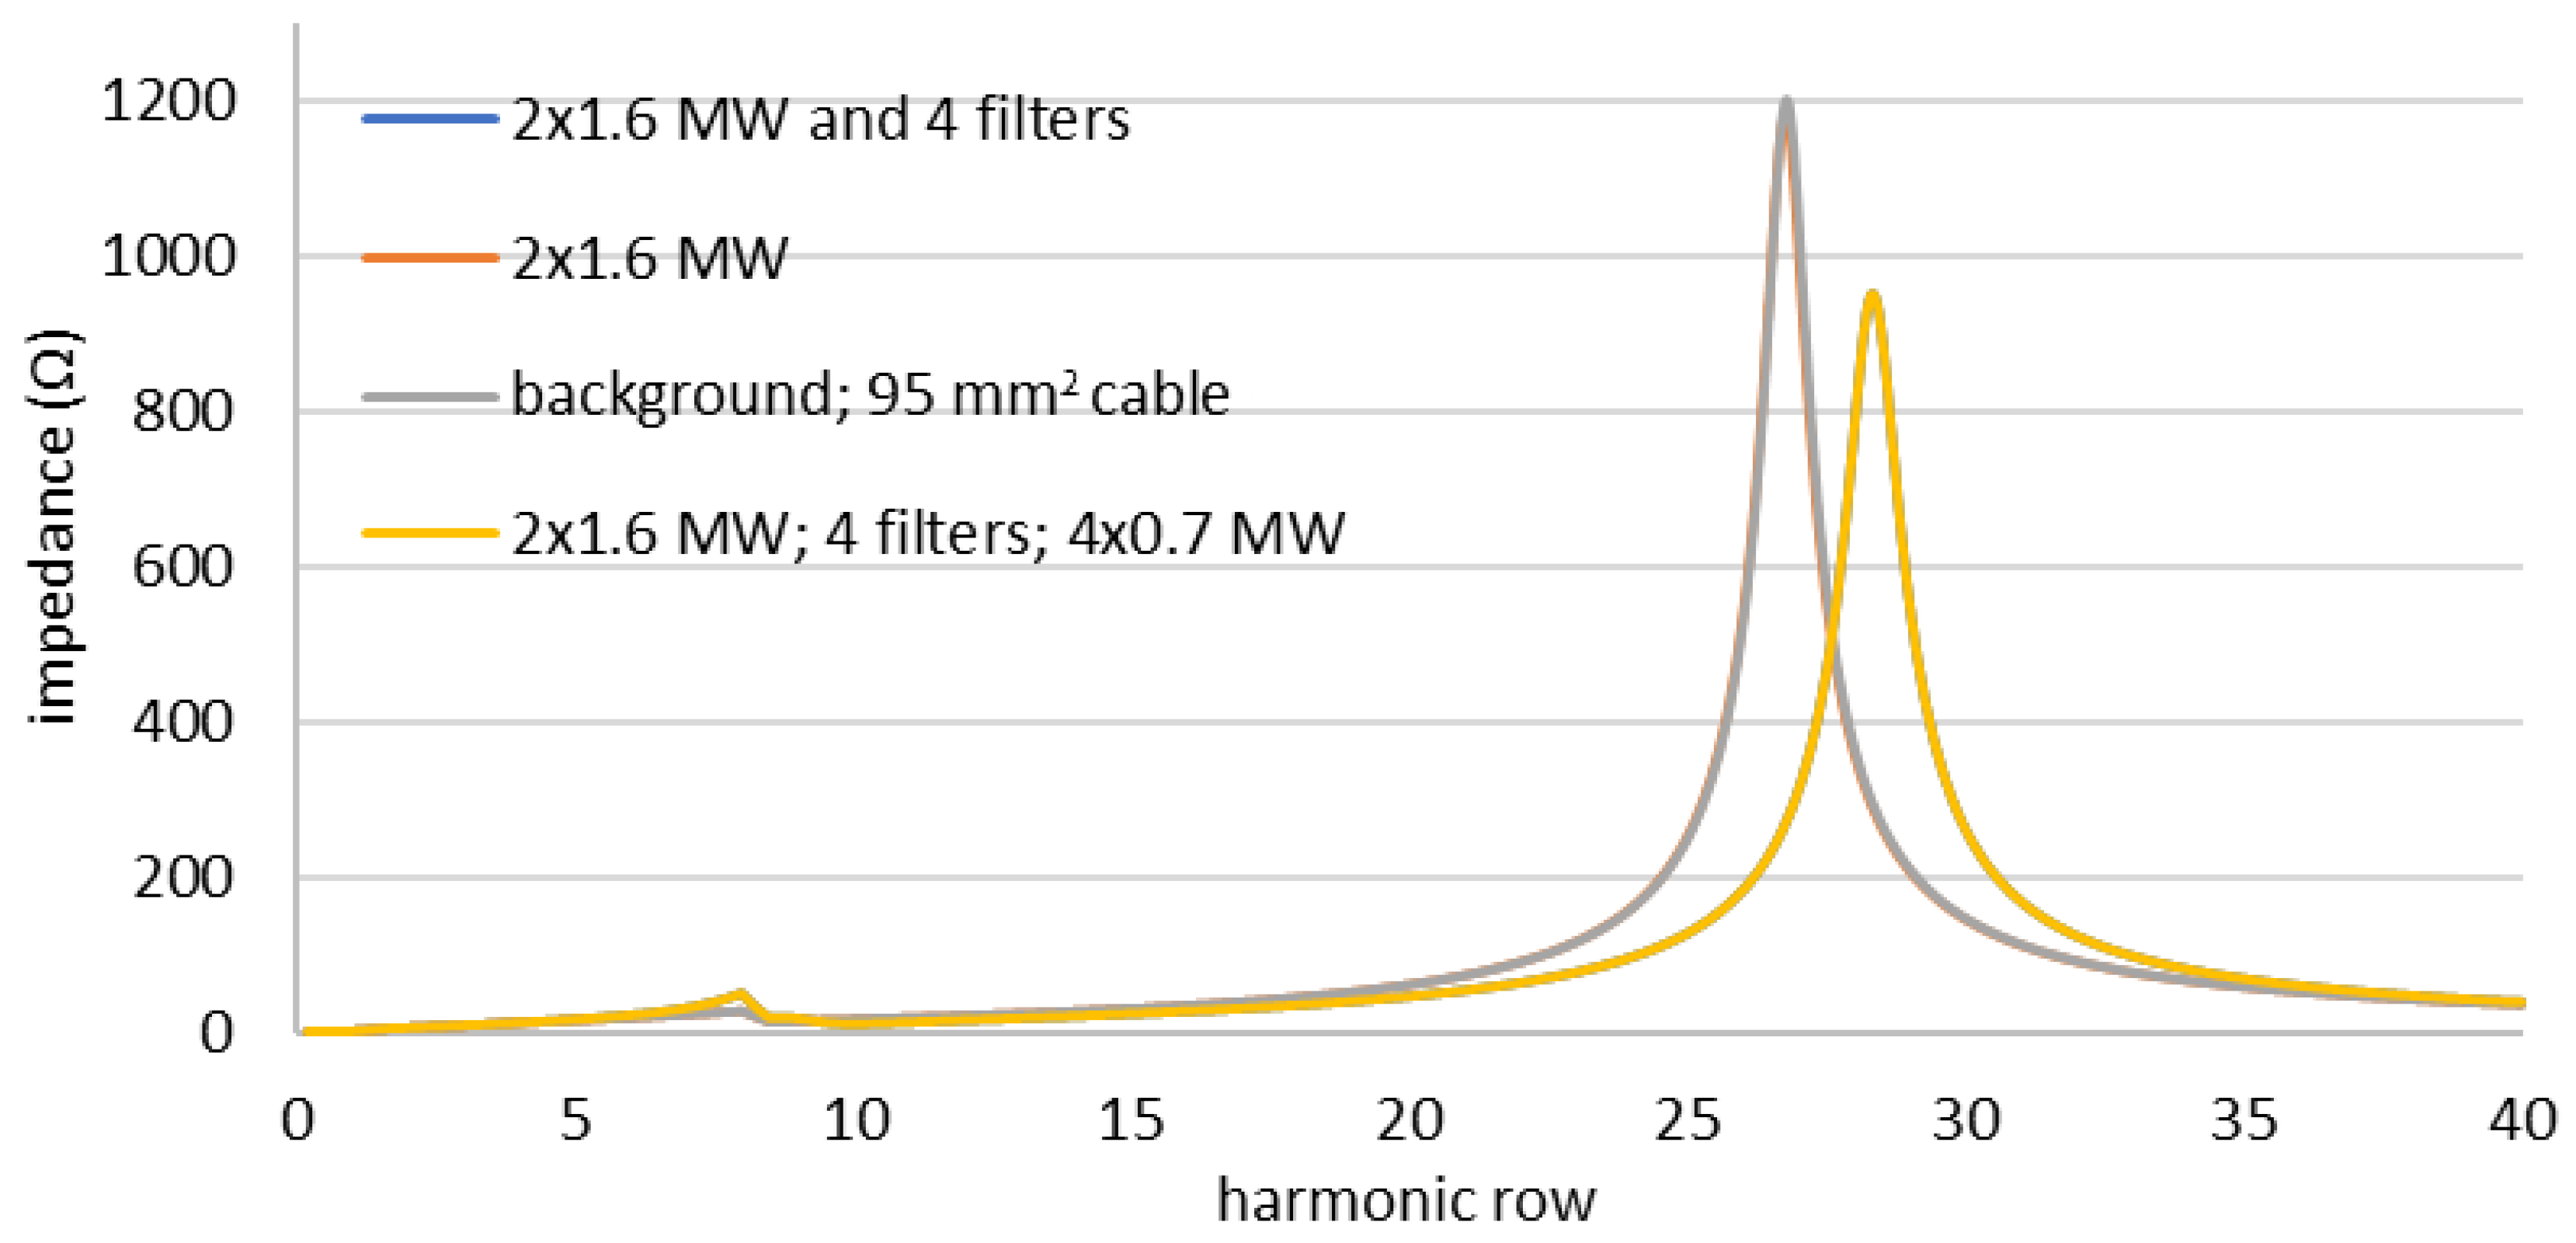
In the next stage, the impact of power plant transformers and the exemplary low-pass filter installed in 750 kW inverters is analyzed [48]. The filter consists of series-connected inductances with L1 = 170 mH, L2 = 80 mH, C = 466 μF, R = 0.1Ω (Figure 12). The gray color shows the impedance characteristics of the network expanded with a 1.5 km 95 mm2 cable line. The orange color shows the network expanded with two 1.6 MVA transformers. The impact of transformers in the analyzed case is negligible, as evidenced by the overlapping characteristics. The impact of transformer capacity is also verified, but no significant impact on the results in the analyzed network is found [49]. The impact of four inverter filters is shown in blue (covered by yellow). Adding filters leads to a clear shift in the resonance band toward higher harmonics, which is usually beneficial, but at the same time, a deterioration in the conditions in the lower harmonics is observed (small resonance band around the eighth harmonic).
The presented simulation shows that the resonance band may be significantly shifted when regulation activities within normal operating limits are performed. The modification of the power system due to the new power plant installation may also have a noticeable impact on impedance characteristics.

4. Harmonic Mitigation—Alternative Methods

There are different mitigation measures against harmonics—passive and active filters or sophisticated control algorithms; however, traditionally, three winding transformers are used as a basic harmonic mitigation measure. The mitigation methods need to be considered at the design stage or afterward, but additional devices are required e.g., filters, which increase the cost [50].
To minimize the risk of exceeding harmonic values, it is worth considering the selection of inverters that generate harmonics that do not coincide with the resonance band. An example is shown in Figure 13. As can be seen, the large variety of characteristics allows the selection of devices that do not exceed the permissible values. However, it should be emphasized that, regardless of the amplitudes of individual voltage harmonics, the relative value of THDu harmonics cannot be exceeded.
The simulation software allows for the analysis of the phase shifts of harmonics—however, for the phase correct option, the data required for such simulations are difficult to obtain as only harmonics amplitudes are reported by manufacturers.
The harmonics amplitude can be reduced if the harmonics sources are in antiphase. In the case of the most common fifth and seventh harmonics, the antiphase occurs when the same loads are supplied with a 30° phase shift, which is obtained by a properly designed three-winding transformer and proper load distribution [52].
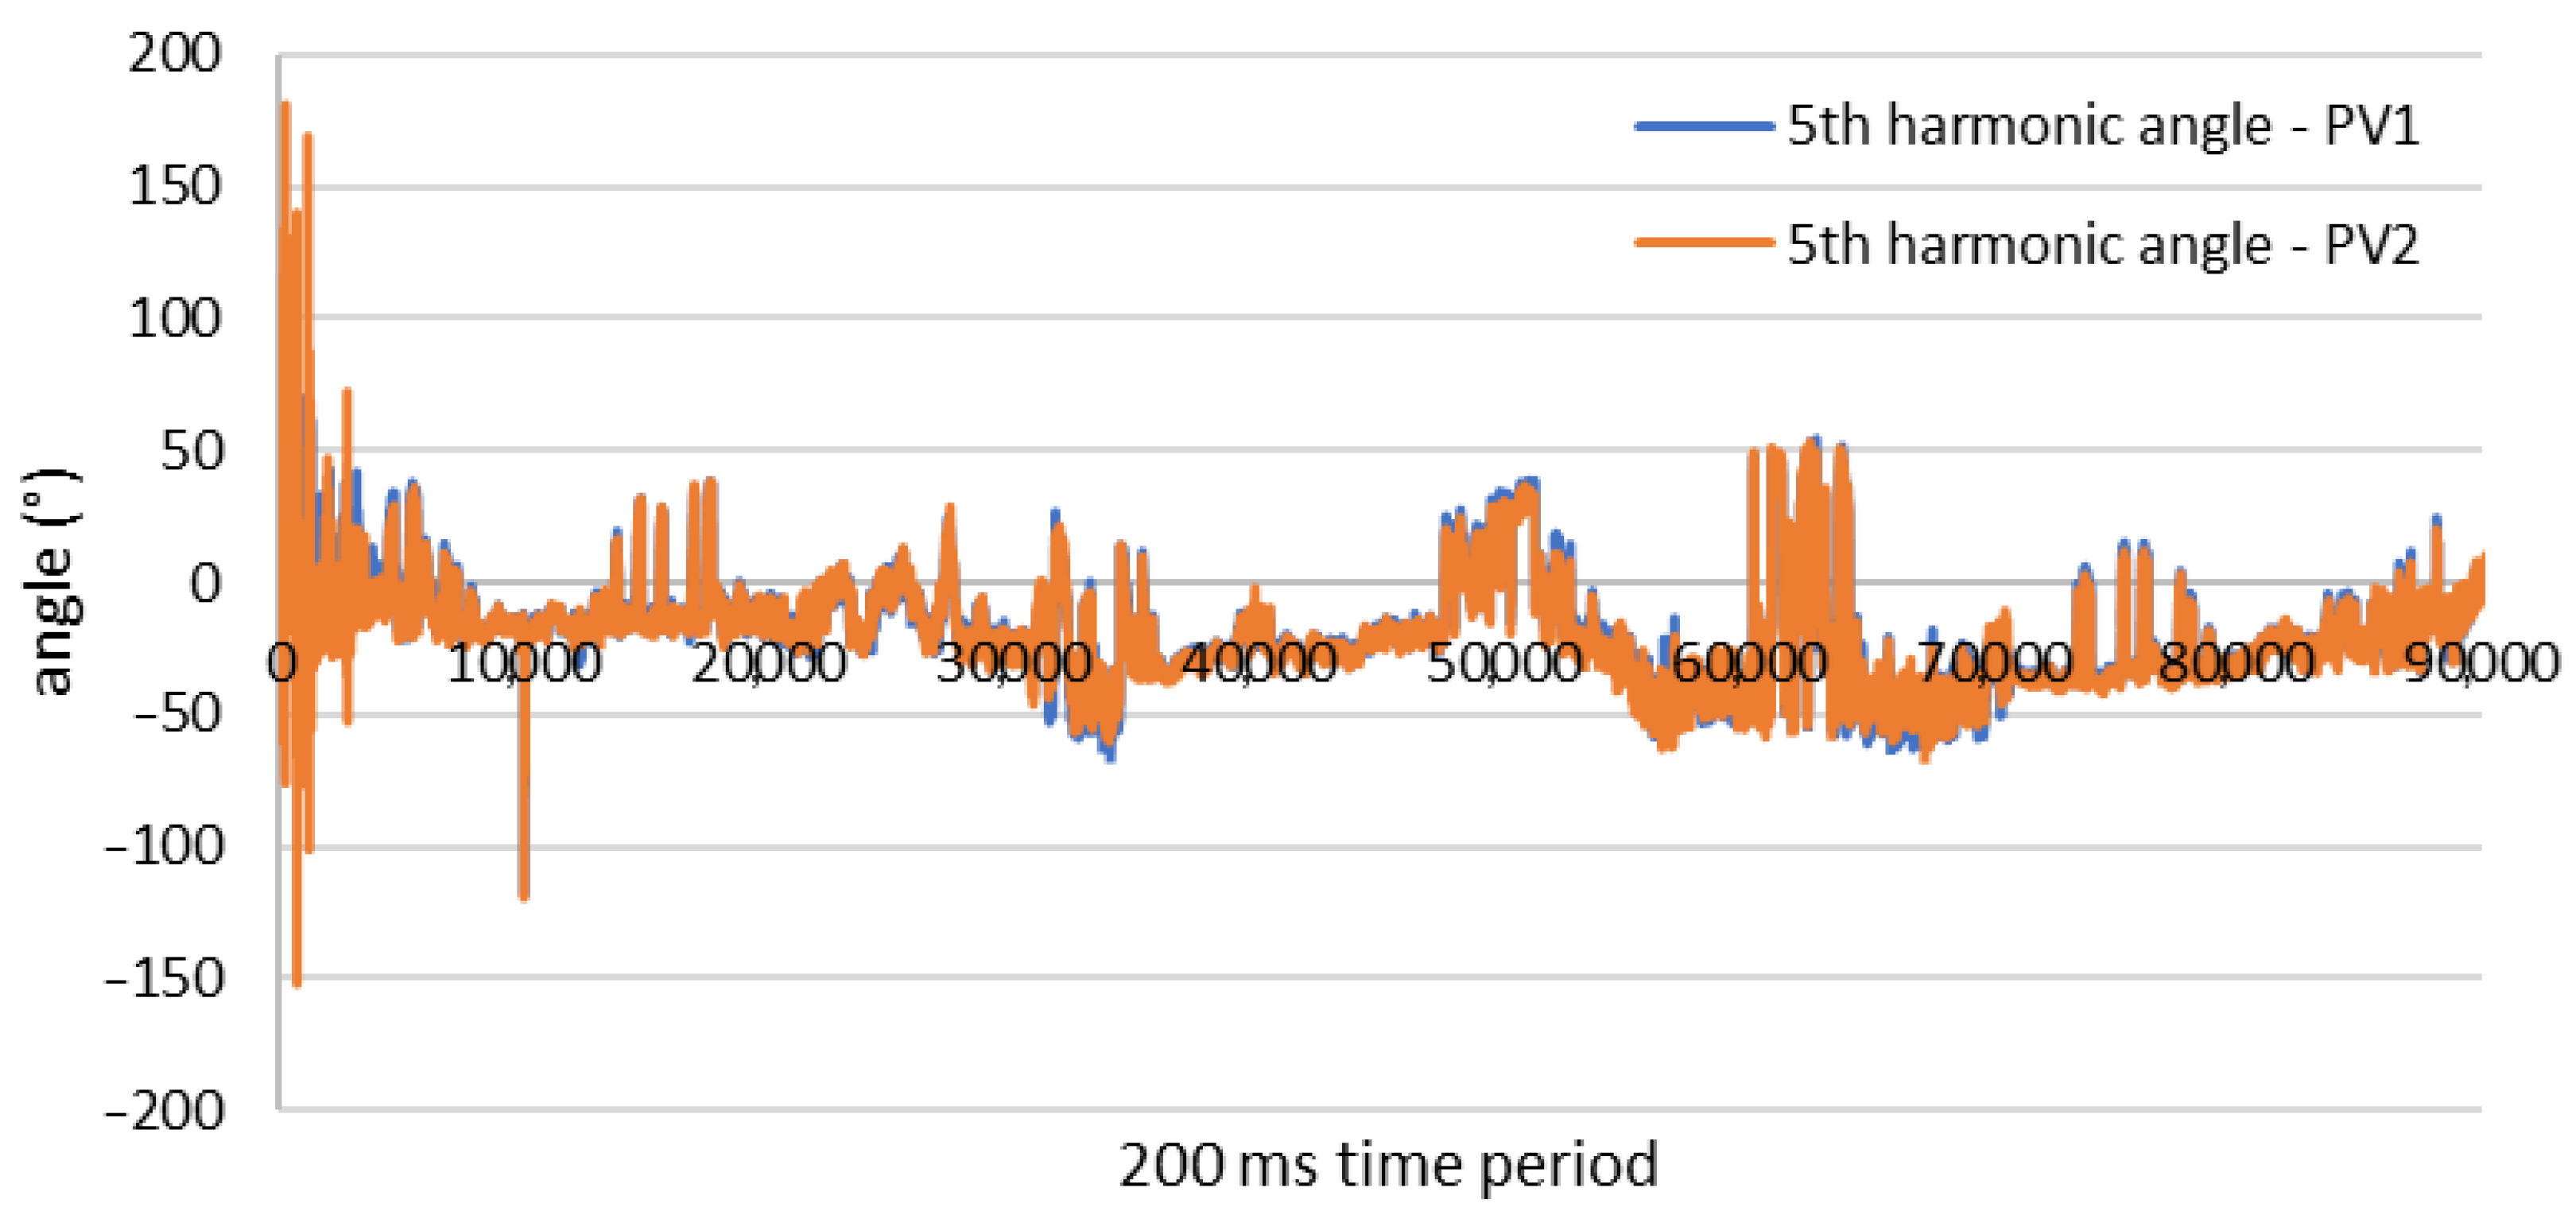
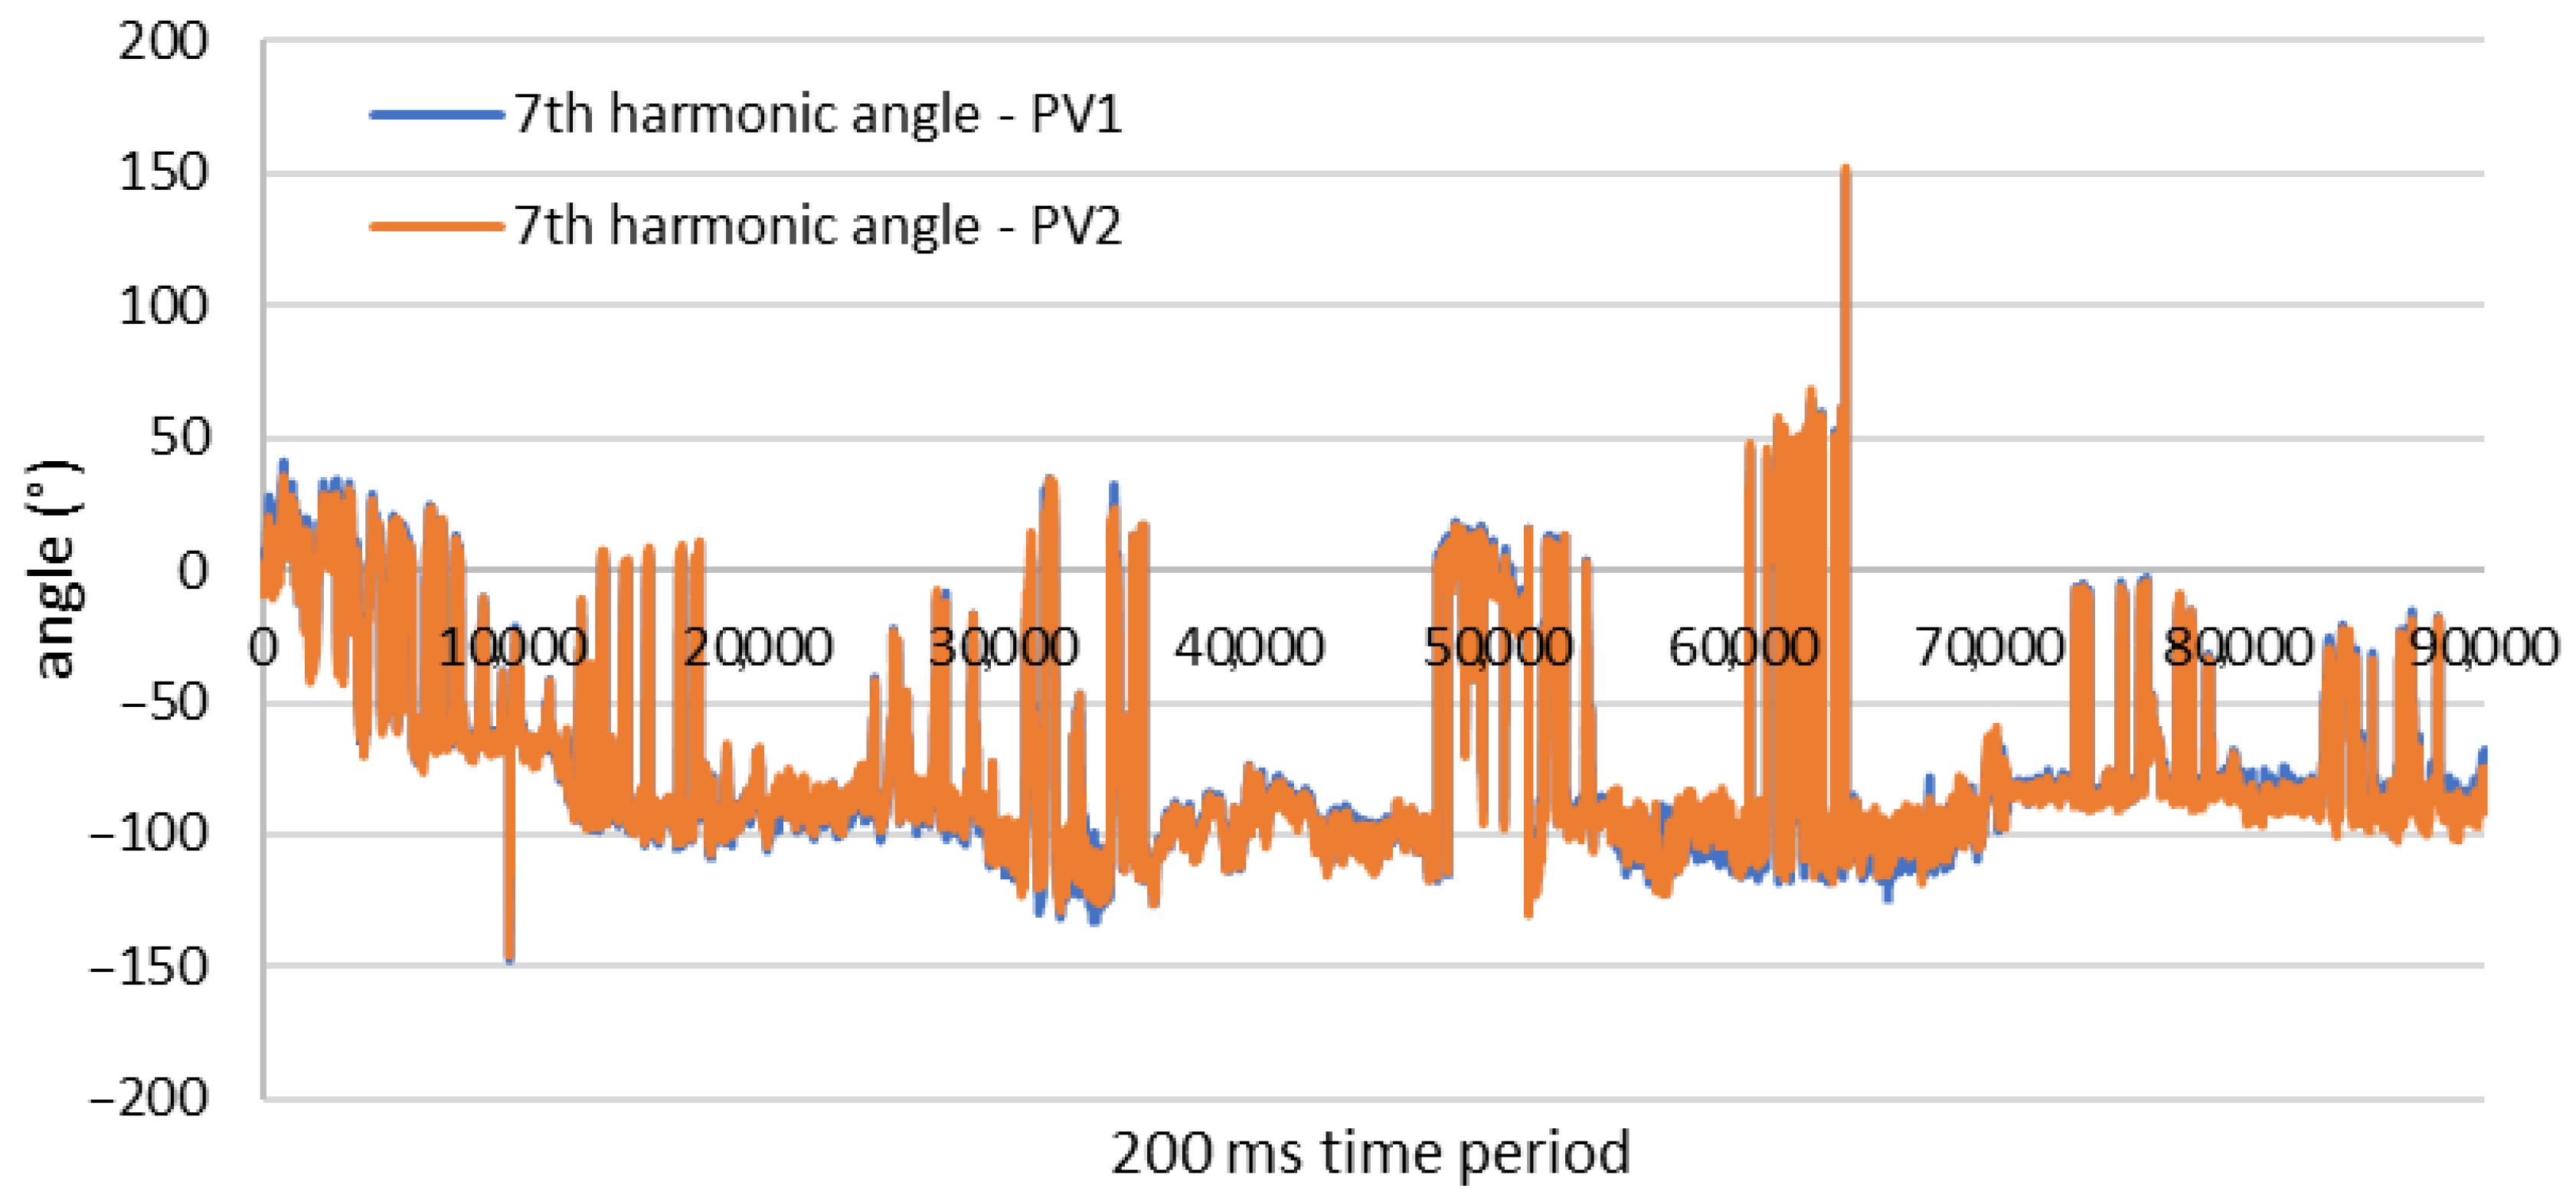
Measurements allowed us to notice that the new generation of PV inverters generates a stable harmonics spectrum, not only in the context of harmonics amplitude, but also harmonics phase, which is the basis for the utilization of phase shift transformers for harmonics mitigation. Measurements (Figure 14 and Figure 15) show that twin-type PV sources located nearby generate almost the same harmonics, including angles that allow for the utilization of different transformers’ phase shifts to minimize harmonic distortion.
PV plants typically deliver the power using two winding transformers with the same phase shift. Two winding transformers with different phase shifts are rare but available on the market [53].
A change in reactive power causes a phase shift of the generated current and therefore a shift in the harmonics [54]. The effect of reactive power generation requires on-site verification; nevertheless, assuming that the harmonics shift ideally with the fundamental component of current, one may conclude that it is possible to cancel chosen harmonics by shifting the reactive power. To cancel the harmonic completely, one must create a signal in the opposite phase to the existing signal, which is obtained by a signal shift equal to half of the harmonic period (7). If the number of inverters taking part in harmonics cancellation is an odd number e.g., 3, then one needs to ensure phase shift equal to one-third of the harmonic period (8)
φ h = 1 2 · 1 50 · h
φ h = 1 3 · 1 50 · h
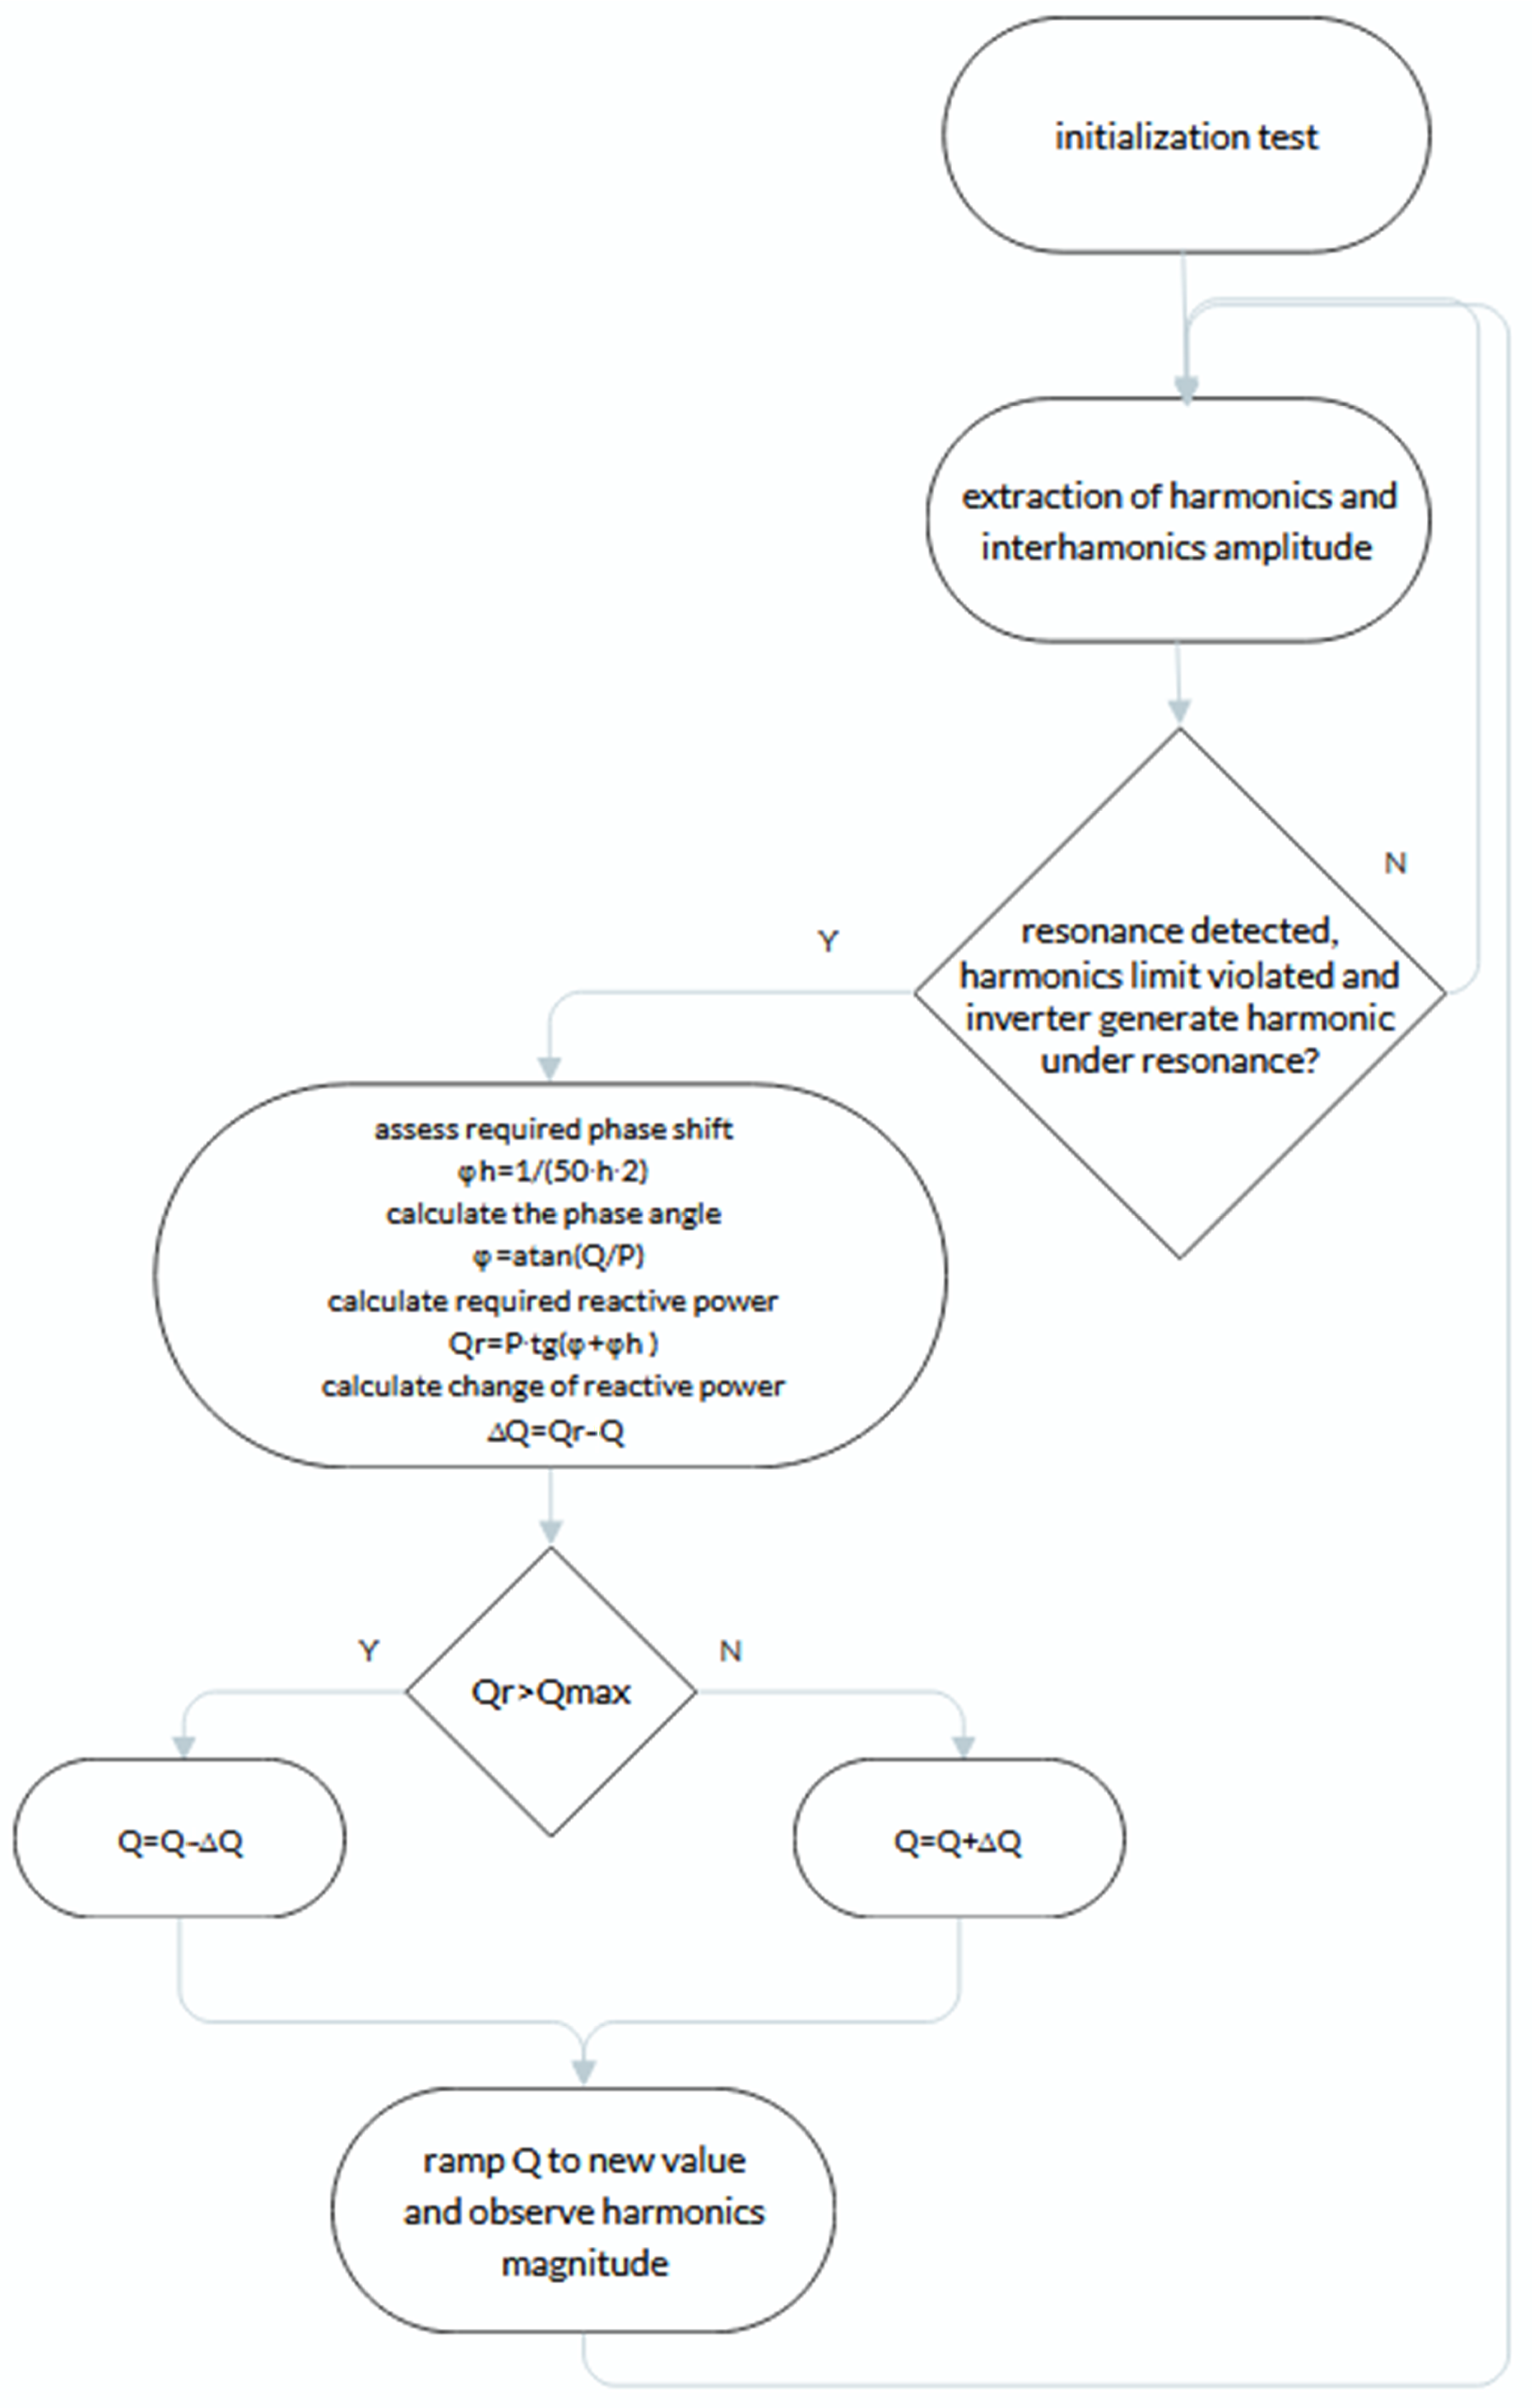
The methodology of using reactive power to mitigate harmonics under resonance conditions is presented in Figure 16. The initiation phase requires on-site measurement, which confirms the proper operation of the presented algorithm for given inverters. After successful verification, the algorithm continuously extracts information about harmonics to detect potential resonance bands. If resonance is detected, the harmonics limit of the harmonics under resonance is violated, the inverter generates resonating harmonics, and the next action is performed. The algorithm assesses the required phase shift (7) or (8) depending on the configuration; further, the phase angle is calculated (or measured) and the required reactive power is calculated based on the sum of the measured angle and required angle change according to (9). Finally, the reactive power change is added to the measured reactive power to obtain a new operating point and the power is changed according to the ramp function, so the best compensation point can be chosen. One needs to note that the detailed phase shift is impossible to calculate because harmonics may consist of different-frequency signals, not just the ideal frequency. Further, it may be required to set an active power threshold above which regulation can be activated because of unstable operation in low harmonics ranges.
Q r = P · t g ( φ + φ h )
Calculation of the Q adjustment range is performed in order to avoid unnecessary changes in reactive power and their impact on voltage level. One should also consider that inverters need to change the reactive power according to the Q(U) characteristic (Figure 17), which could result in a change in harmonics flow. The typical V2 and V3 setting is ~±5% Vn. That of V1 and V2 is typically ~±8% Vn. The proposed algorithm can shift the reactive power within the calculated band to compensate for the potential negative effects. It is believed that the risk of the unwanted resonances is higher in generation stations, since typically the same inverters are used, whereas in distribution substations, the negative effect is often reduced by interactions between many different types of devices.
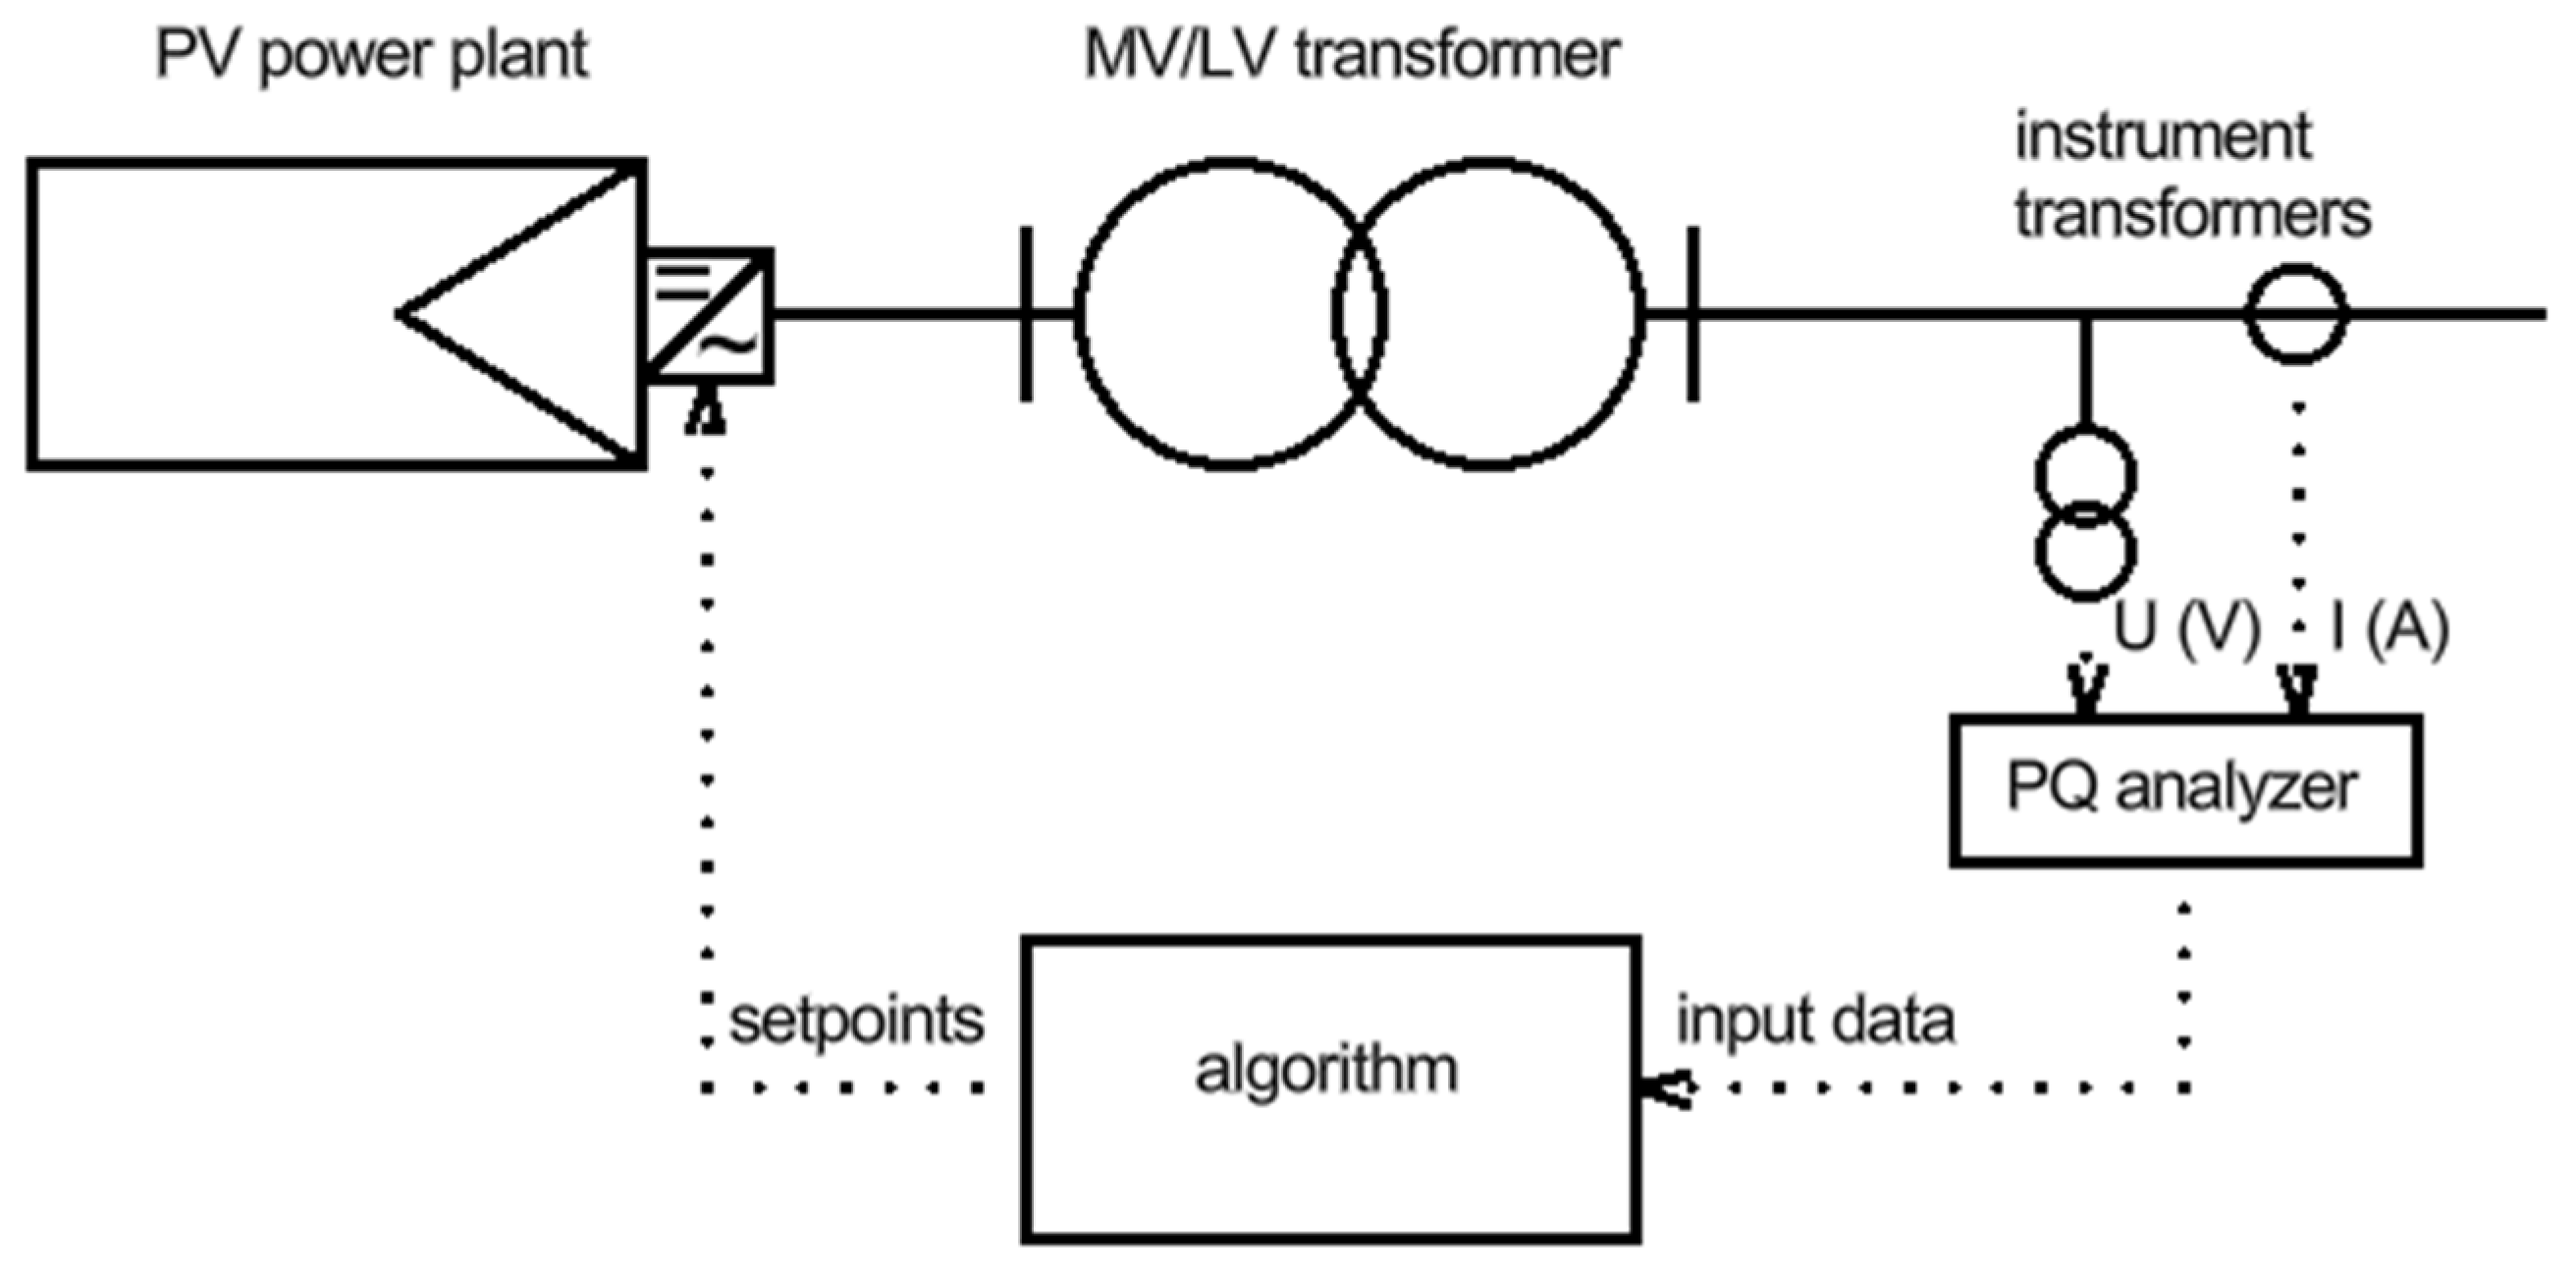
A general diagram of controlled objects is presented in Figure 18. The voltage and current transformer provide signals to the PQ analyzer installed on-site. The PQ analyzer sends signals to the controller, which run the algorithm presented in Figure 16. The presented diagram does not consider PQ measurement on the low-voltage side of the power plant, because the whole operating range should be verified at the commissioning stage. In case one has any doubts, additional PQ measurements are recommended.
To ensure the proper operation of the proposed algorithm, one needs to consider the measuring errors. In order to ensure acceptable measurement errors, one needs to utilize high-accuracy equipment. In particular, one needs to utilize:
-
An A-class power quality analyzer, which is characterized by measurement uncertainty equal to 0.1% of the declared input voltage;
-
A high-accuracy instrument transformer, e.g., 0.2 class (0.2 amplitude error) [55].
One needs to make sure that the measurement range of the PQ analyzer and its current sensors are adapted to the current flowing at the secondary side of current transformer. Both current clamps or a Rogowski coil could be used. One needs to be aware that the instrument transformer can introduce additional measurement errors. The Rogowski coils can be installed directly on the cable lines and therefore the current transformer and its measurement errors are eliminated. Despite the amplitude measurement errors, one needs to consider the frequency characteristics of the instrument transformers. According to [56], inductive transformers are suitable for measurements of 50th-order harmonics, but only in 10 kV networks. In case of 20 kV networks, only harmonics up to the 20th order are measured within an acceptable error range. Taking into account numerous designs of instrument transformers, it is recommended to contact manufacturers or analyze the technical specifications in order to validate the harmonics measurement accuracy.
The power plant controller is required by distribution system operators and needs to fulfill global requirements e.g., the NCRFG grid code, and local requirements. There are different communication standards available e.g., DNP3.0, 61400-25, 61850-7, and 61850-5, which allow for receiving commands from the power system operator. The above-mentioned modifications of reactive power and ramping are state-of-the-art functionalities of controllers and inverters. The controller sets parameters according to the grid code requirements e.g., above-mentioned Q(U) characteristic, so the modifications to the reactive power under the U regulation band may be blocked. One needs to underline that the settings could be modified only with the consent of the distribution network operator.
Ongoing efforts connected to the optimization of inverters and other electronic devices allow for reducing the risk of harmonic-related issues. Typically, in order to reduce the harmonics content, passive or active filters are used. A general comparison of harmonics mitigation methods is presented in Table 3. Passive filters may be susceptible to overloads and may be ineffective in case of power system structure modification. Active filters are effective for different configurations of power systems and any harmonics order. Additionally, despite harmonic filtering and reactive power correction, active filters are able to perform phase-balancing. Active filters are rather expensive; therefore, they are typically used in case of low-power applications. In case of high-power applications, hybrid filters, which are a combination of passive and active filters, are used [57]. Filters are often used in industrial networks; however, the filters are relatively rarely used in distribution system networks. In case of harmonics issues in a distribution system, the harmonic source is often transferred to an individual power transformer in order to minimize the negative impact on the surrounding area. In case of railway substations, the three winding phase-shifting transformers and filters e.g., gamma filters, and 12 pulse converters are typically used in order to minimize harmonics pollution [58]. Furthermore, in cases of high-power distortion sources, the series reactor is used. Different filter types can be adapted to the situation in the network [59].
The proposed solution could reduce the resonance effect and reduce the risk of resulting failures. If problems are detected, it is recommended to install conventional filters. It is also possible to simultaneously use an active filter and the proposed solution if the filter power is not sufficient. Further research is planned in order to validate the proposed solutions.
One needs to be aware that the proposed alternative harmonic mitigation methods are not perfect.
-
Different transformers’ phase shifts may be used only in the case of twin PV designs, and it may be difficult to find transformers with different phase shifts in the market;
-
The harmonic spectrum of energy sources is one of many parameters e.g., short circuit power, cost, warranty, etc.; therefore, it may not always be possible to find an optimal harmonic spectrum for the location. Moreover, it is often difficult to obtain the harmonic spectrum for analysis;
-
Active changing the reactive power to mitigate harmonics is effective in case of high-frequency harmonics; however, in the case of low-frequency resonances, the method requires high reactive power, which could have an impact on voltage level or energy losses. The effectiveness of the proposed method may be different depending on the inverter type; therefore, a special test may be required to confirm that the solution is effective, e.g., the harmonic angle changes as a function of the generated power.
Future research is connected to the testing of the proposed method. Both laboratory and on-site tests are recommended at the initial stage. The laboratory tests allow for observing the exact impact of reactive power change on harmonics amplitudes and harmonic angles. The differences between theoretical and real values may be a result of apparent power change as a result of reactive power change (negligible for higher-order harmonics) and nonlinear dependency of harmonics as a function of the apparent power. Furthermore, additional errors are expected at the low power level. Typically, the current distortions is strong at low power levels, e.g., 10–20% THD for powers below 10% of the nominal value. Taking into account the great number of inverters available on the market, it is recommended to start the tests using the most popular inverters. Alternatively, it is possible to choose inverters that are installed in locations where harmonics resonances are detected. In that case, however, it is possible to run on-site tests and verify the harmonic mitigation methods under real conditions. The on-site tests should be preceded by developing a simulation model, which indicate the impedance characteristics of the network in order to observe the resonance points. This analysis is needed to verify if the mitigation of one harmonic resonance band would not cause a violation of another harmonic band, since, in some cases, a few resonance bands may be observed. Another solution to observe resonance bands is to observe harmonics histograms. If there is no harmonic resonance band, the harmonics amplitudes decrease with the increase in harmonics rows. In the case of resonance bands, one can observe peaks on the histogram. One must underline that the voltage harmonics peaks may be observed only for specific hours.
After the effectiveness of the proposed method is confirmed, however, the mitigation strength is too low, and one can use another inverter within the network. In order to avoid erroneous results of harmonics compensation, inverter regulation should be performed in a coordinated manner. One needs to develop the regulation plan and adapt time delays between inverters as a function of the harmonics row e.g., inverter A starts the regulation first in case of a specific harmonics violation and inverter B starts the regulation after the inverter A regulation cycle is finished. For different harmonics rows, inverter B starts the regulation first, and inverter A follows. The advanced coordination schemes could be performed by advanced systems, e.g., artificial intelligence.

5. Conclusions

This paper presents the authors’ measurements and experiences with harmonics resonance, which is supplemented with examples from the literature. It is believed that the risk of resonance is particularly high in the case of generation stations with a high share of cable lines and uniform inverters; therefore, a simulation model presenting the interaction between volt/VAR/harmonics control is analyzed.
The contribution of this paper is:
Pointing out the potential problem in the power system—the risk of resonance under various conditions like control actions in the power system and power system extension;
Providing measurements that show examples of resonances;
Development of simulation study cases that present the interaction between volt/VAR control and harmonics interactions;
Recommendations about the need to monitor harmonics in case of volt/VAR regulation;
Alternative passive and active harmonics mitigation methods are proposed:
-
Utilization of transformers with different phase shifts for mitigation of harmonics emitted by twin PV plants and proof of concept measurements are presented;
-
Active reactive power regulation is proposed in order to shift harmonics in the resonance band to reduce the risk of serious issues. The general methodology and further research are presented;
-
The adaptation of the design to mitigate harmonic issues is presented, e.g., utilization of different line types or sources that are the sources of harmonics outside the potential resonance band.
The proposed methods are compared with typical harmonic mitigation methods. It is believed that the proposed reactive power regulation method could reduce the risk of failure in distribution systems in the case of resonance band activation due to sudden changes in power system structure, e.g., during power system restoration or failures of the power system.

Author Contributions

Conceptualization, K.L.; methodology, K.L.; software, K.L.; validation, K.L., J.G. and M.U.; formal analysis, M.U. and Z.N.; investigation, K.L., J.G. and M.U.; resources, J.G.; data curation, K.L.; writing—original draft preparation, K.L., J.G. and M.U.; writing—review and editing, K.L.; visualization, K.L.; supervision, J.G. and Z.N.; project administration, J.G.; funding acquisition, K.L., J.G. and Z.N. All authors have read and agreed to the published version of the manuscript.

Funding

This research was funded by 0711/SBAD/4616.

Data Availability Statement

The data presented in this study are openly available according to references below.

Conflicts of Interest

The authors declare no conflicts of interest.

Appendix A

Table A1. Cable parameters.
R (Ω)X (Ω)B (mS)
Cable Grid Connection0.02040.03323.12
Cable 1.10.4220.244159.59
Cable 1.20.1680.09863.92
Cable 2.10.6330.367239.39
Cable 2.20.2320.13487.78
Cable 2.30.2320.13487.78
Cable 2.40.3170.183119.69
PV 1 km 70 mm20.4460.13761.57
PV 1.5 km 95 mm20.5010.196101.79
PV 2.5 km 120 mm20.6410.317197.07
Table A2. Transformer parameters.
Wind Turbine TransformerPV Transformer
Voltage20/0.6920/0.8
Short circuit voltage6%6%
Cooper losses20 kW14 kW
No load loss10 kW2.4 kW
No load current0.8%0.15%
Table A3. Wind turbine harmonics and interharmonics (percentage of fundamental component).
Harmonic RowHarmonic Content (%)Interharmonic RowInterharmonic Content
20.281.50.11
30.412.50.12
40.253.50.18
50.914.50.35
60.295.50.85
70.436.50.29
80.247.50.72
90.068.50.1
100.029.50.05
110.0810.50.05
120.0211.50.05
130.0712.50.08
140.0213.50.05
150.0114.50.04
160.115.50.04
170.216.50.
180.0117.50.
190.118.50.
200.0119.50.
210.0120.50.
220.0121.50.
230.122.50.
240.0123.50.
250.0524.50.
260.0125.50.
27026.50.
28027.50.
29028.50.
30029.50.
31030.50.
32031.50.
33032.50.
34033.50.
35034.50.
36035.40.
37036.50.
380.0237.50.
390.0238.50.05
39.50

References

  1. Miller, P.; Wancerz, M. Praca zrodeł fotowoltaicznych przy zmianach i zanikach napiecia w sieci nn. Rynek Energii 2017, 1, 56–61. [Google Scholar]
  2. Fantana, N.L.; Lowczowski, K.; Javora, R.; Myrda, P.; Gegot, F.; Brun, P.; Carpenter, J.; Beaudry, J.; Kaiser, N.; Yusa, H.; et al. Substation Servicing and Supervision Using Moblie Devices and Smart Sensing; CIGRE: Paris, France, 2020; ISBN 978-2-85873-528-0. [Google Scholar]
  3. Musial, E. Ocena jakosci energii elektrycznej w sieciach przemyslowych. Autom. Zaklocenia 2010, 1, 30–45. [Google Scholar]
  4. Barros, J.; de Apráiz, M.; Diego, R.I. A review of international limits for rapid voltage changes in public distribution networks. Renew. Sustain. Energy Rev. 2021, 144, 110966. [Google Scholar] [CrossRef]
  5. Lodetti, S.; Azcarate, I.; Gutierrez, J.J.; Leturiondo, L.A.; Redondo, K.; Saiz, P.; Melero, J.J.; Bruna, J. Flicker of Modern Lighting Technologies Due to Rapid Voltage Changes. Energies 2019, 12, 865. [Google Scholar] [CrossRef]
  6. Kostic, M.; Nikolic, A. Negative Consequence of Motor Voltage Asymmetry and Its Influence to the Unefficient Energy Usage. WSEAS Trans. Circuits Syst. 2010, 9, 547–552. [Google Scholar]
  7. Mariscotti, A.; Mingotti, A. The Effects of Supraharmonic Distortion in MV and LV AC Grids. Sensors 2024, 24, 2465. [Google Scholar] [CrossRef]
  8. Grady, M. Understanding Power System Harmonics. IEEE Power Eng. Rev. 2012, 21, 8–11. [Google Scholar] [CrossRef]
  9. Arranz-Gimon, A.; Zorita-Lamadrid, A.; Morinigo-Sotelo, D.; Duque-Perez, O. A Review of Total Harmonic Distortion Factors for the Measurement of Harmonic and Interharmonic Pollution in Modern Power Systems. Energies 2021, 14, 6467. [Google Scholar] [CrossRef]
  10. Pinyol, R. Harmonics: Causes, Effects and Minimization; Salicru: Barcelona, Spain, 2015. [Google Scholar]
  11. Landis Gyr. Landis+Gyr S650 Smart Grid Terminal A Smart Grid Innovation; Landis Gyr: Zug, Switzerland, 2013. [Google Scholar]
  12. Tran, Q.-T.; Truong, A.V.; Le, P.M. Reduction of harmonics in grid-connected inverters using variable switching frequency. Int. J. Electr. Power Energy Syst. 2016, 82, 242–251. [Google Scholar] [CrossRef]
  13. Prodanovic, M.; Green, T. Control of Power Quality in Inverter-Based Distributed Generation. In Proceedings of the 28th Annual Conference of the IEEE Industrial Electronics Society, Sevilla, Spain, 5–8 November 2002; Volume 2, pp. 1185–1189. [Google Scholar] [CrossRef]
  14. Liu, W.; Chung, I.-Y.; Liu, L.; Leng, S.; Cartes, D.A. Real-time particle swarm optimization based current harmonic cancellation. Eng. Appl. Artif. Intell. 2011, 24, 132–141. [Google Scholar] [CrossRef]
  15. Zhang, M.; Wang, J.; Zhang, S.; Gao, L.; Guo, X.; Chen, L.; Xu, Y. Harmonic Resonance Analysis and Impedance Remodeling Method of Multi-Inverter Grid-Connected System. Electronics 2023, 12, 3684. [Google Scholar] [CrossRef]
  16. Shen, X.; Liu, J.; Liu, Z.; Gao, Y.; Leon, J.I.; Vazquez, S.; Wu, L.; Franquelo, L.G. Sliding-Mode Control of Neutral-Point-Clamped Power Converters with Gain Adaptation. In IEEE Transactions on Power Electronics; IEEE: New York, NY, USA, 2024; Volume 39, pp. 9189–9201. [Google Scholar] [CrossRef]
  17. Kalair, A.; Abas, N.; Kalair, A.R.; Saleem, Z.; Khan, N. Review of harmonic analysis, modeling and mitigation techniques. Renew. Sustain. Energy Rev. 2017, 78, 1152–1187. [Google Scholar] [CrossRef]
  18. Jha, K.; Shaik, A.G. A comprehensive review of power quality mitigation in the scenario of solar PV integration into utility grid, e-Prime—Advances in Electrical Engineering. Electron. Energy 2023, 3, 100103. [Google Scholar] [CrossRef]
  19. Micallef, A. Review of the current challenges and methods to mitigate power quality issues in single-phase microgrids. IET Gener. Transm. Distrib. 2019, 13, 2044–2054. [Google Scholar] [CrossRef]
  20. Michalec, Ł.; Jasinski, M.; Sikorski, T.; Leonowicz, Z.; Jasinski, L.; Suresh, V. Impact of Harmonic Currents of Nonlinear Loads on Power Quality of a Low Voltage Network–Review and Case Study. Energies 2021, 14, 3665. [Google Scholar] [CrossRef]
  21. Zagrajek, K.; Paska, J.; Klos, M.; Pawlak, K.; Marchel, P.; Bartecka, M.; Michalski, L.; Terlikowski, P. Impact of Electric Bus Charging on Distribution Substation and Local Grid in Warsaw. Energies 2020, 13, 1210. [Google Scholar] [CrossRef]
  22. Baraniak, J.; Starzynski, J. Modeling the Impact of Electric Vehicle Charging Systems on Electric Power Quality. Energies 2020, 13, 3951. [Google Scholar] [CrossRef]
  23. Miller, P.; Wancerz, M. Wpływ sposobu wyznaczania parametrów linii 110 kV na dokładność obliczeń sieciowych. Prz. Elektrotech. 2014, 4, 187–190. [Google Scholar]
  24. ABB. Technical Guide No. 6 Guide to Harmonics with AC Drives. Available online: https://library.e.abb.com/public/bc35ffb4386c4c039e3a8ec20cef89c5/Technical_guide_No_6_3AFE64292714_RevF_EN.pdf (accessed on 10 September 2024).
  25. Dziennik Ustaw Rzeczypospolitej Polskiej, Rozporzadzenie Ministra Klimatu I Srodowiska z dnia 22 Marca 2023 r. w Sprawie Szczegolowych Warunkow Funkcjonowania Systemu Elektroenergetycznego. Available online: https://isap.sejm.gov.pl/isap.nsf/download.xsp/WDU20230000819/O/D20230819.pdf (accessed on 10 September 2024).
  26. Energa Operator. Available online: https://energa-operator.pl/przylaczenie-do-sieci/definicje (accessed on 10 September 2024).
  27. IEEE. IEEE Recommended Practice and Requirements for Harmonic Control in Electric Power Systems; IEEE: New York, NY, USA, 2014; Volume 519. [Google Scholar]
  28. Villanueva, I.; Vazquez, N.; Vaquero, J.; Hernandez, C.; Lopez, H.; Osorio, R. L vs. LCL Filter for Photovoltaic Grid-Connected Inverter: A Reliability Study. Int. J. Photoenergy 2020, 2020, 7872916. [Google Scholar] [CrossRef]
  29. EMC/EMI Filter for PV Inverters. Available online: https://www.schaffner.com/product/FN2200/Schaffner_datasheet_FN2200.pdf (accessed on 10 September 2024).
  30. Dash, D.K.; Sadhu, P.K. A Review on the Use of Active Power Filter for Grid-Connected Renewable Energy Conversion Systems. Processes 2023, 11, 1467. [Google Scholar] [CrossRef]
  31. Enea Operator, Instrukcja Ruchu I Eksploatacji Sieci Dytaustrybucyjnej. 2024. Available online: https://www.operator.enea.pl/bricks/instrukcja-ruchu (accessed on 15 August 2024).
  32. Fiorina, J.N. Inverters and Harmonics (Case Studies of Non-Linear Loads); Cahier Technique Merlin Gerin: Lyon, France, 1993. [Google Scholar]
  33. Lowczowski, K. Wplyw odksztalcenia napiecia na przepiecia ziemnozwarciowe. Prz. Elektrotech. 2018, 94, 41–44. [Google Scholar] [CrossRef]
  34. Zheng, R.; Bollen, M. Harmonic Resonances Associated with Wind Farms; Lules University of Technology: Skelleftes, Sweden, 2010. [Google Scholar]
  35. Rozporządzenie Komisji (UE) 2016/631 z dnia 14 Kwietnia 2016 r. Ustanawiające Kodeks Sieci Dotyczący Wymogów w Zakresie Przyłączenia Jednostek Wytwórczych do Sieci. Available online: https://eur-lex.europa.eu/legal-content/PL/TXT/PDF/?uri=CELEX:32016R0631&from=SK (accessed on 10 September 2024).
  36. Bollen, M.; Mousavi-Gargari, S.; Bahramirad, S. Harmonic resonances due to transmission-system cables. Renew. Energy Power Qual. J. 2014, 712–716. [Google Scholar] [CrossRef]
  37. PN-EN 50160:2023-10; Supply Voltage Parameters in Public Power Grids. Polish Committee for Standardization: Warsaw, Poland, 2023.
  38. Tauron Dystrybucja, Kryteria Techniczne Oceny Możliwości Przyłączenia Jednostek Wytwórczych, Magazynów Energii Oraz OSDn do Sieci Dystrybucyjnej Średniego Napięcia, Krakow. 2014. Available online: https://www.tauron-dystrybucja.pl/przylaczenie-do-sieci/przylaczenie/zrodla-wytworcze (accessed on 15 August 2024).
  39. Enea Operator, Kryteria Techniczne Oceny Mozliwosci Przylaczenia Jednostek Wytworczych, Magazynow Energii oraz OSDn do Sieci Dystrybucyjnej Sredniego Napiecia ENEA Operator sp. z o.o. August 2023. Available online: https://www.operator.enea.pl/uploads-ev2/Operator/ospolce/raporty/Kryteria%20przy%C5%82%C4%85czania%20obiekt%C3%B3w%20do%20sieci%20SNna%20stronk%C4%99.pdf (accessed on 15 August 2024).
  40. Available online: https://forum.huawei.com/enterprise/en/Harmonic-spectrum-for-SUN2000-100-KTL-M1-inverter/thread/667249710882242560-667213868771979264 (accessed on 10 September 2024).
  41. Available online: https://pgeenergetykakolejowa.pl/kolej/1-3-zielona-kolej (accessed on 10 September 2024).
  42. PLK SA, Standardy Techniczne, Tom IV Urzadzenia Trakcji Elektrycznej/Elektroenergetyki Trakcyjnej. Available online: https://www.plk-sa.pl/files/public/user_upload/pdf/Akty_prawne_i_przepisy/Standardy_techniczne/11.04.2022/3_TOM_IV.pdf (accessed on 10 September 2024).
  43. Rojek, A. Jakosc Energii Elektrycznej w Kolejowym Systemie Elektroenergetycznym; Z. 137/138; Problemy Kolejnictwa: Warszawa, Polnad, 2003. [Google Scholar]
  44. Kuznetsov, V.; Hubskyi, P.; Rojek, A.; Udzik, M.; Lowczowski, K. Progress and Challenges Connected with the Integration of Renewable Energy Sources with Railway Distribution Networks. Energies 2024, 17, 489. [Google Scholar] [CrossRef]
  45. Lowczowski, K.; Nadolny, Z. Voltage Fluctuations and Flicker in Prosumer PV Installation. Energies 2022, 15, 2075. [Google Scholar] [CrossRef]
  46. Power Monitors. White Paper: Key Issues with DG/DER Monitoring; Power Monitors: Mt Crawford, VA, USA, 2016. [Google Scholar]
  47. DigSilent. Power Factory User Manual; DigSilent: Gomaringen, Germany, 2023. [Google Scholar]
  48. Han, G.; Sang, S.; Cai, X. Impedance analysis and stabilization control of the LCL-type wind power inverter under weak grid conditions. J. Renew. Sustain. Energy 2018, 10, 035301. [Google Scholar] [CrossRef]
  49. Andrieu, C.; Dauphant, E.; Boss, D. A Frequency Dependent Model For a MV/LV Transformer. In Proceedings of the International Conference on Power System Transients, Budapest, Hungary, 20–24 June 1999. [Google Scholar]
  50. Bula, D.; Grabowski, D.; Maciazek, M. A Review on Optimization of Active Power Filter Placement and Sizing Methods. Energies 2022, 15, 1175. [Google Scholar] [CrossRef]
  51. Bollen, M.; Yang, K. Harmonics—Another Aspect of the Integration between Wind-Power Installations and the Grid. In Proceedings of the 22nd International Conference on Electricity Distribution, Stockholm, Sweden, 10–13 June 2013. [Google Scholar]
  52. Qian, G.; Wang, Q.; He, S.; Dai, W.; Wei, N.; Zhou, N. Harmonic Modeling and Analysis for Parallel 12-Pulse Rectifier under Unbalanced Voltage Condition in Frequency-Domain. Energies 2022, 15, 3946. [Google Scholar] [CrossRef]
  53. Parmar, J. Understanding Vector Group of Transformer. 2012. Available online: https://electrical-engineering-portal.com/understanding-vector-group-transformer-1 (accessed on 15 August 2024).
  54. Zainuddin, M.; Putra Surusa, F.E.; Syafaruddin, S.; Manjang, S. Constant Power Factor Mode of Grid-Connected Photovoltaic Inverter for Harmonics Distortion Assessment. Int. J. Renew. Energy Res. 2020, 10, 1525–1535. [Google Scholar] [CrossRef]
  55. ABB. Instrument Transformers, Technical Information and Application Guide. 2004. Available online: https://library.e.abb.com/public/e2462bd7f816437ac1256f9a007629cf/ITTechInfoAppGuide.pdf (accessed on 15 August 2024).
  56. CIGRE/CIRED, Guidelines for Power Quality Monitoring WG C4.112 TECHNICAL BROCHURE 596. 2014. Available online: https://www.e-cigre.org/publications/detail/596-cigrecired-guidelines-for-power-quality-monitoring-measurement-locations-processing-and-presentation-of-data.html (accessed on 15 August 2024).
  57. Lumbreras, D.; Gálvez, E.; Collado, A.; Zaragoza, J. Trends in Power Quality, Harmonic Mitigation and Standards for Light and Heavy Industries: A Review. Energies 2020, 13, 5792. [Google Scholar] [CrossRef]
  58. Olczykowski, Z.; Starula, P. Power quality in the circuits of traction substation. J. Civ. Eng. Transp. 2023, 5, 29–52. [Google Scholar] [CrossRef]
  59. Kazem, H.A. Harmonic Mitigation Techniques Applied to Power Distribution Networks. Adv. Power Electron. 2013, 2013, 591680. [Google Scholar] [CrossRef]
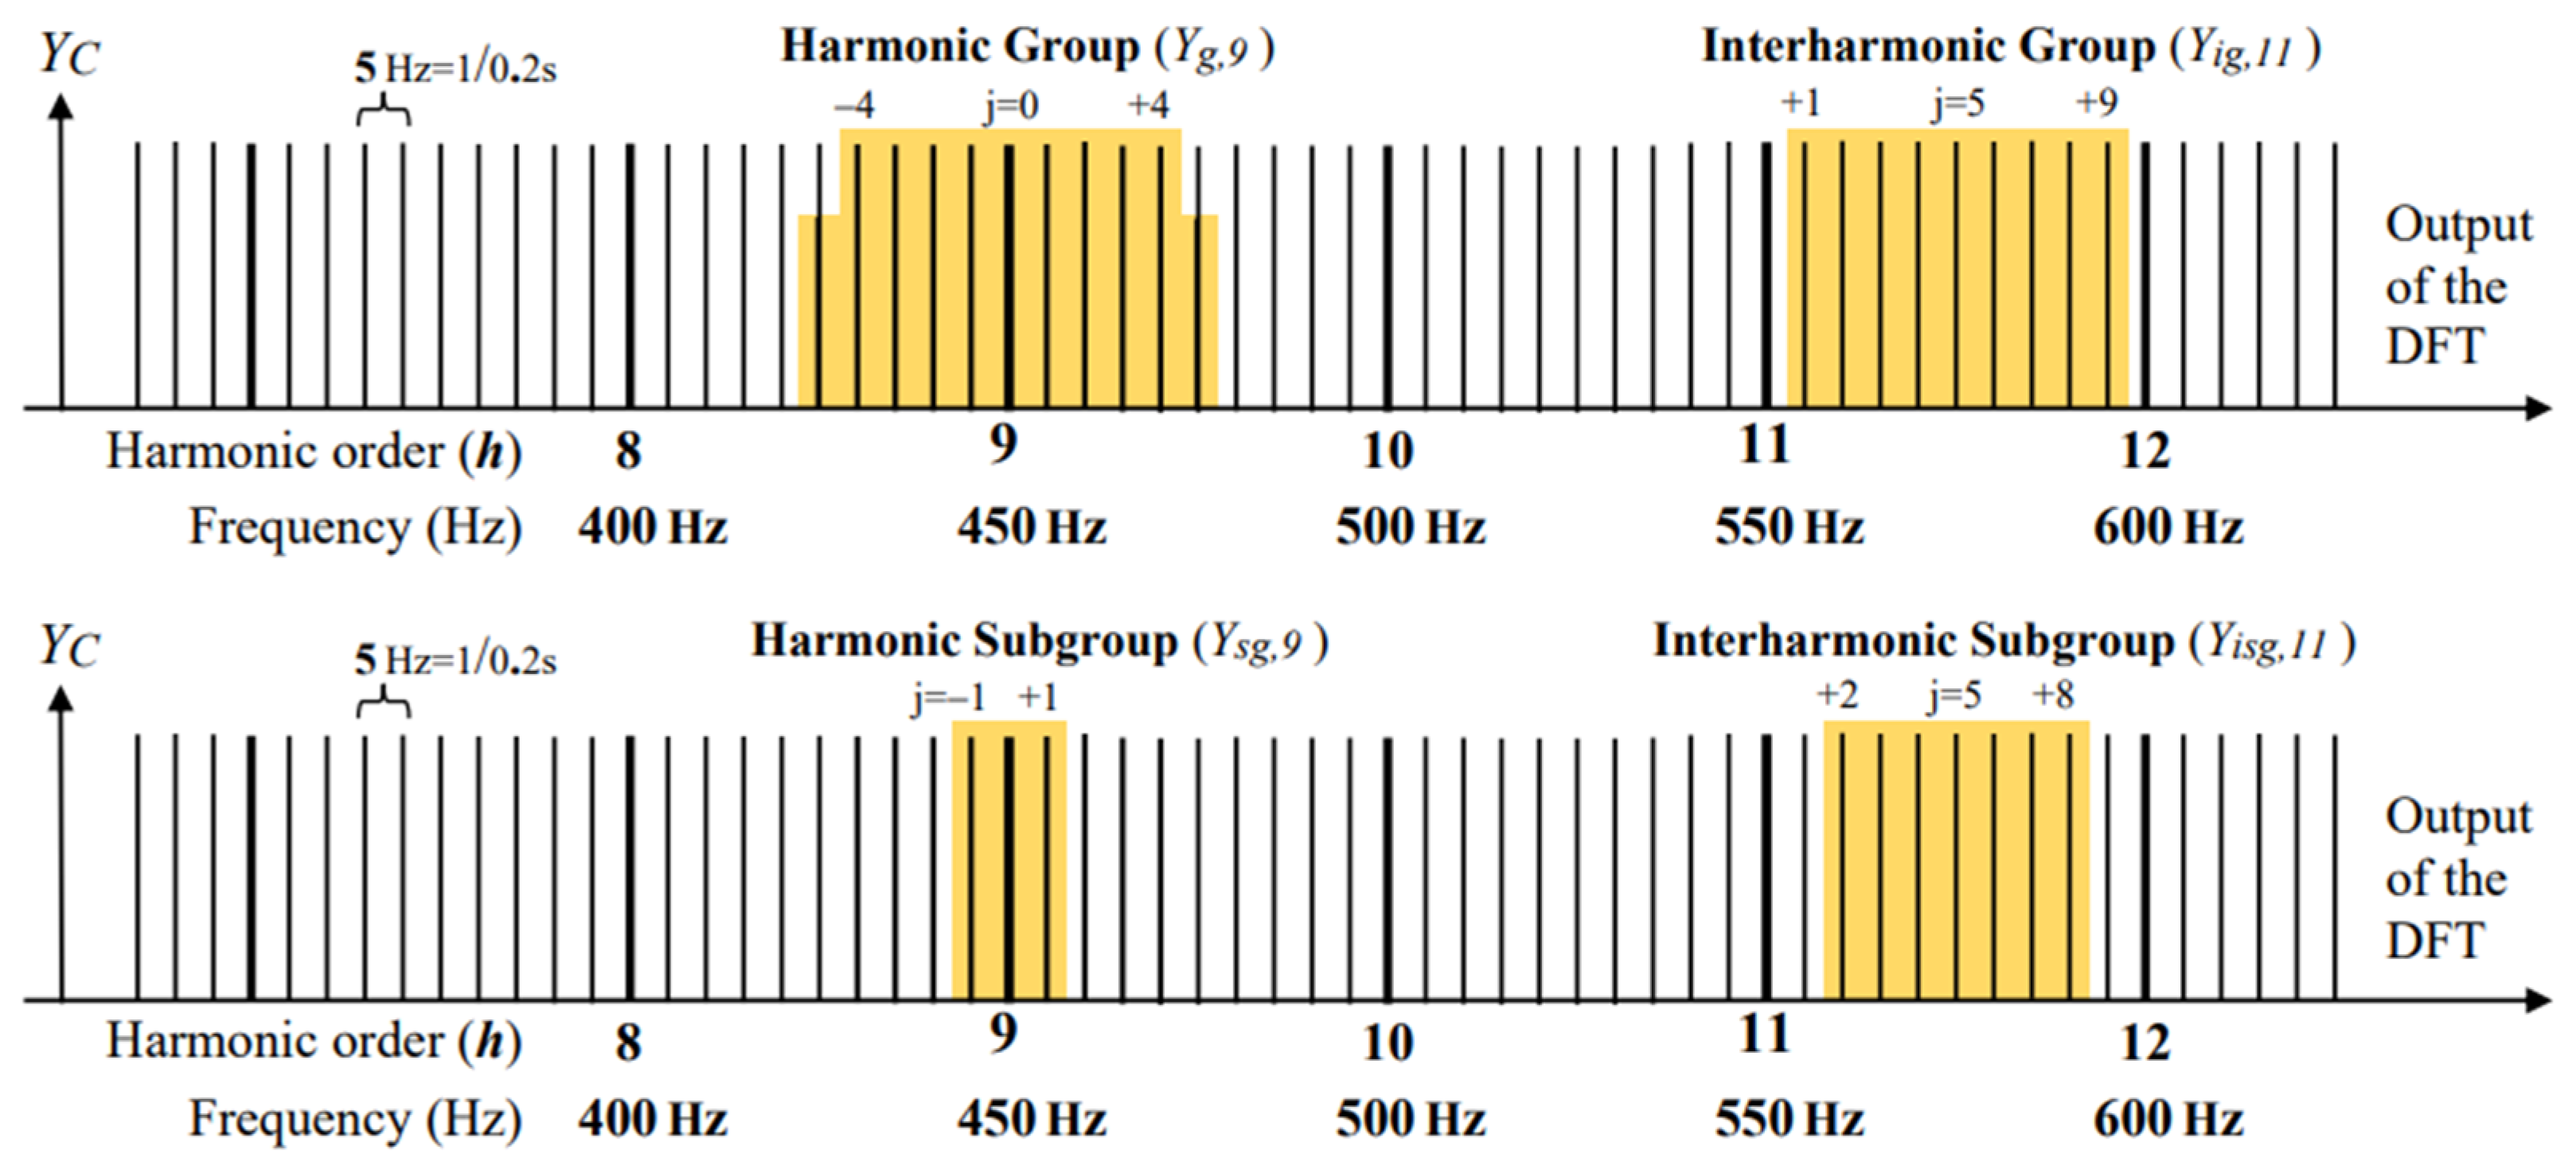
Figure 1. Illustration of the harmonic group of order 9, Yg,9, the interharmonic group of order 11, Yig,11, the harmonic subgroup of order 9, Ysg,9, and the centered interharmonic subgroup of order 11, Yisg,11, for the case of f1 = 50 Hz [9].
Energies 17 05561 g001
Figure 2. Exemplary voltage harmonic spectrum (expressed as percentage of fundamental component) in 110 kV network with a high share of wind farms and industrial devices. Voltage distortion expressed as THD (%) over time; red—phase 1, green—phase 2, and blue—phase 3.
Energies 17 05561 g002
Figure 3. Trend of the fifth harmonic and THDu (below) in exemplary 110 location.
Energies 17 05561 g003
Figure 4. Impedance characteristics of different power system elements [32].
Energies 17 05561 g004
Figure 5. Voltage distortion expressed as THD (%) as a function of time (month–day) in 110/15 kV substation at the 15 kV side.
Energies 17 05561 g005
Figure 6. High-power photovoltaic startup current (blue) [46].
Energies 17 05561 g006
Figure 7. MW diagram of the modified farm elevator network.
Energies 17 05561 g007
Figure 8. Impact of voltage level on impedance characteristic in point of coupling (PCC).
Energies 17 05561 g008
Figure 9. Impact of voltage level on voltage harmonics at PCC.
Energies 17 05561 g009
Figure 10. Impact of capacitor bank on impedance characteristic at point of coupling (PCC).
Energies 17 05561 g010
Figure 11. Impedance characteristics of the network as a function of PV plant cable marked in gray in Figure 7.
Energies 17 05561 g011
Figure 12. Impedance characteristics of the network.
Energies 17 05561 g012
Figure 13. Harmonic spectrum emitted by 2 exemplary wind turbines; based on [51].
Energies 17 05561 g013
Figure 14. Angles of harmonic shifts of 5th harmonics of two PV power plants located in close proximity.
Energies 17 05561 g014
Figure 15. Angles of harmonic shifts of 7th harmonics of two PV power plants located nearby.
Energies 17 05561 g015
Figure 16. Utilization of reactive power to dampen harmonic resonance.
Energies 17 05561 g016
Figure 17. Typical volt VAR regulation characteristics and the proposed exemplary regulation band; where V1—max reactive power generation, V2—start of reactive power generation, Vn—nominal voltage, V3—start of reactive power consumption, and V4—max reactive power consumption.
Energies 17 05561 g017
Figure 18. Diagram of controlled objects.
Energies 17 05561 g018
Table 1. Permissible values of higher harmonics.
For I and II Connection Group
Odd HarmonicsEven Harmonics
Not Being a Multiplicity of 3Being a Multiplicity of 3Harmonic OrderRelative Voltage Value in Percent of the Fundamental Component (uh)
Harmonic OrderRelative Voltage Value in Percent of the Fundamental Component (uh)Harmonic OrderRelative Voltage Value in Percent of the Fundamental Component (uh)
52%32%21.5%
72%91%41%
111.5%150.5%>40.5%
131.5%>150.5%
171%
191%
230.7%
250.7%
>250.2 + 0.5·25/h
for III to V connection group
56%35%22%
75%91.5%41%
113.5%150.5%>40.5%
133%>150.5%
172%
191.5%
231.5%
251.5%
>250.5 + 25/h
Table 2. Harmonic spectrum of new generation inverter [40].
Harmonic RowCurrent Magnitude [A]% Of Fundamental
L1L2L3L1L2L3
1134,856134,736134,840100,940100,851100,928
20.2520.1390.2990.1870.1030.221
30.3800.2090.2150.2820.1550.159
40.1070.2000.0950.0790.1480.071
50.2780.2260.2390.2060.1680.177
60.0760.0660.0440.0560.0490.033
70.0700.0960.0830.0520.0720.062
80.0470.0360.0610.0350.0270.046
90.1220.0390.1000.0910.0290.074
100.0400.0610.0710.0300.0450.052
110.2240.1670.1750.1660.1240.130
120.0750.0550.0440.0550.0410.033
130.2610.2450.2860.1930.1820.212
140.0420.0380.0580.0310.0280.043
150.0530.1020.0790.0390.0760.059
160.0430.0650.0730.0320.0480.054
170.2350.1700.1970.1750.1260.146
180.1070.0660.0530.0790.0490.039
190.2810.2420.2290.2080.1800.170
Table 3. General comparison of harmonic mitigation methods.
Passive FiltersActive FiltersInverters’ Built-in Algorithms Proposed Solution
CostBigBigNo extra costNo extra cost
ExperienceBigBigDepending on the solution Low
Analysis requiredProject needed Sizing of device and limitations of sizesNo extra projectNo extra project
Individual harmonics limitationHarmonics designed to be dampedYes, the full spectrum of problematic harmonicsDepending on the constructionYes, but only the resonance band
THD reductionYes if sized properlyYesYesYes, under resonance conditions
Losses Extra lossesExtra losses Switching losses could increaseChange of reactive power could have an impact on losses however in general the impact is minimal
Impact of power system reconfigurationBig impactNo, until power limitations are met Yes, could be reduced if adaptive algorithms are usedEffectiveness could drop in case of multi resonance point
Disclaimer/Publisher’s Note: The statements, opinions and data contained in all publications are solely those of the individual author(s) and contributor(s) and not of MDPI and/or the editor(s). MDPI and/or the editor(s) disclaim responsibility for any injury to people or property resulting from any ideas, methods, instructions or products referred to in the content.