Article

Integrated Energy Systems Modeling with Multi-Criteria Decision Analysis and Stakeholder Engagement for Identifying a Sustainable Energy Transition

by
Brynhildur Davidsdottir
1,*,
Eyjólfur Ingi Ásgeirsson
2,
Reza Fazeli
3,
Ingunn Gunnarsdottir
4,
Jonathan Leaver
5,
Ehsan Shafiei
6 and
Hlynur Stefánsson
2
1
School of Engineering & Natural Sciences, Environment & Natural Resources, University of Iceland, 102 Reykjavik, Iceland
2
School of Science and Engineering, Reykjavik University, 102 Reykjavik, Iceland
3
School of Engineering, Australian National University, Canberra, ACT 2601, Australia
4
Landsvirkjun—The National Power Company of Iceland, 105 Reykjavik, Iceland
5
School of Building Construction and Engineering, Unitec Institute of Technology, Auckland 1142, New Zealand
6
RISE Research Institutes of Sweden, 413 27 Gothenburg, Sweden
*
Author to whom correspondence should be addressed.
Energies 2024, 17(17), 4266; https://doi.org/10.3390/en17174266
Submission received: 16 June 2024 / Revised: 21 August 2024 / Accepted: 23 August 2024 / Published: 26 August 2024
(This article belongs to the Special Issue Zero Carbon Emissions, Green Environment and Sustainable Energy)

Abstract

:
The aim of this paper is to present a decision support system (DSS) to capture the complexity of the transition of a national energy system to net zero in the context of multiple sustainability themes. The paper proposes an integrated assessment framework that combines dynamic systems modeling, sustainability indicators, and multi-criteria decision analysis (MCDA) with direct stakeholder involvement. To illustrate the use of the DSS, the paper compares bundles of climate change policies that aim to decarbonize the road transport sector in Iceland. Eighteen scenarios and alternative development trajectories are defined for the Icelandic energy system based on a combination of three main driving forces. These are, firstly, economic development (three cases); secondly, changes in energy efficiency (two cases); and finally, three climate policy bundles aimed at increasing the share of electric vehicles. Based on the results from the integrated assessment framework, the performance scores of the climate policy bundles are compared across the following five sustainability themes: social impact; economic development; environmental impact; energy security; and technical aspects. The findings confirm that a different conclusion may be reached when multiple sustainability themes are applied in the selection of preferred policy bundles as compared to conventional techno-economic criteria. Banning the registration of fossil-fueled vehicles, combined with economic instruments, offers the best decarbonizing strategy to reach climate and energy policy goals simultaneously.

1. Introduction

The foundation of the Paris Agreement is a global consensus that “climate change represents an urgent and potentially irreversible threat to human societies and thus the planet requires the widest possible cooperation by all countries” [1]. In response to that threat, global greenhouse gas emissions (GHG) must decline, and net-zero CO2 emissions must be achieved as close to 2050 as possible [2]. An energy system encompasses extraction, production, and final energy use. Therefore, it includes heat and electricity generation and transmission, as well as the delivery and use of energy in sectors such as transport. According to the Emissions Gap Report [3] carbon dioxide emissions from fossil fuels account for almost two-thirds of current GHG emissions. As a result, to reach net zero emissions by 2050 necessitates deep worldwide decarbonization of energy systems [4], which has implications for human well-being. Access to modern, affordable, and reliable energy services is essential for human well-being and the social and economic development of all countries [5]. Consequently, energy plays a fundamental role in enabling sustainable development, as reflected by the 17 Sustainable Development Goals (SDG), particularly in SDG7 on affordable and clean energy. The sustainable development of energy systems, as reflected in SDG7, can be considered a prerequisite for reaching many of the other 16 SDGs, including SDG13 on climate action [6]. To realize the synergies between the diverse SDGs, analysis must be able to reveal the multi-dimensional implications of decarbonization strategies [7].
Given the significance of energy systems development for deep decarbonization and the attainment of sustainable development, a new paradigm has emerged, called Sustainable Energy Development (SED) [5,8]. SED is defined as “the provision of adequate energy services at an affordable cost in a secure and environmentally benign manner, in conformity with social and economic development needs” [5]. The definition implies that SED is a multidimensional concept involving multiple sustainability themes [9]. To realize adequate decision support tools within this context, indicators measuring the multidimensional impacts of SED need to be incorporated into energy systems analysis [10,11].
Diverse sets of sustainability indicators have been developed in the context of national energy systems development, including the World Trilemma Index, the Energy Indicators for Sustainable Development, and the Energy Architecture Performance Index [12,13]. Reviews of such energy-focused sustainability indicator systems reveal, firstly, that they tend to neglect social and environmental dimensions; secondly they are developed without recognition of national needs and formal stakeholder input; and thirdly, that they are without a connection to dynamic simulation models and are therefore not easily applicable when comparing different future decarbonization pathways [12]. When including sustainability themes and indicators in decision-making, stakeholders should be engaged throughout the assessment process to ensure that policies properly reflect stakeholders’ preferences for diverse sustainability themes. Therefore, theme-related outputs reflecting stakeholders’ preferences can be transformed into actionable information for decision-makers [14].
The aim of this paper is to present a decision support system (DSS) for the development of a national energy system that guides decision-making in the context of multiple sustainability themes. The DSS combines a process for stakeholder engagement, a systems dynamics model of an energy system, indicators for sustainable energy development (SED), and multi-criteria decision analysis (MCDA) in a dynamic integrated assessment framework. To illustrate the use of the DSS, the paper compares the implications of three different bundles of climate change policies that aim to increase the use of electric vehicles in Iceland over multiple sustainability criteria. It also illustrates how the integrated framework can support the decision-making process by transforming diverse sustainability impacts into comparable scores for each policy bundle, thereby supporting robust decision-making.
The structure of the paper is as follows. Section 2 contains a brief review of the literature. In Section 3, the analytical tools, modeling framework and scenarios are explained. In Section 4, the results of the scenario analysis and policy assessments are presented. Section 5 contains the discussion and Section 6 concludes the paper.

2. Literature Review

Energy systems models have been widely used to explore pathways towards low-carbon energy systems at national and global scales [10,15]. Reviews of commonly used energy and integrated assessment models (IAMs) reveal that stakeholders are rarely engaged formally in the model-building or analysis phases, and that these models often fail to adequately capture the multi-dimensional sustainability implications of energy systems development [10,15,16]. Van Soest et al. [17] identified interactions between all 17 SDGs, compared them with the scope of IAMs, and confirmed a lack of consideration of multi-dimensional sustainability implications. Among all SDGs, climate-related goals were best represented and a total of 13 goals could be partly quantified by IAMs, while socio-political and equality goals, and others related to human development and governance, were not covered adequately [17]. To address this limitation, integrated assessments that assess the impact of decarbonization on the SDGs have begun to emerge. For example, Moreno et al. [18] used nine different models to assess the implications of decarbonization pathways in the European Union on the SDGs, while Keyßer and Lenzen [19] analyzed the relative performance of degrowth scenarios in the context of GHG mitigation, considering several sustainability criteria related to economic, socio-technical, and socio-political feasibility, as well as equity.
Despite these recent developments, the normal limiting of implications to techno-economic considerations and GHG emissions highlights the difficulty in applying energy systems models when comparing pathways to deep decarbonization and sustainable energy development. This characterizes, for example, the PRIMES model used by the European Union to evaluate the desirability of energy-related GHG mitigation strategies of EU members, Norway, and Iceland [20,21]. As a result, multi-theme implications of deep decarbonization are rarely accounted for when formally choosing between climate policies and different decarbonization pathways [15,22,23]. In response to these limitations, systems models rooted in system dynamics are increasingly applied at global, national, and regional levels to investigate the implications of different policy targets, including GHG mitigation and the various environmental, economic, and societal implications pertaining to the fulfillment of mitigation targets. Several system models have been developed, including, but not limited to, the WORLD6 and WORLD7 models [24], which focus on the potential future supply and scarcity of a number of natural resources; the Earth3 model [25], which captures transformation pathways of seven regions of the world as a whole while accounting for the 17 SDGs; the Threshold 21 (T21) model [26], which evaluates alternative national strategies in an integrated fashion by linking a country’s environmental, economic, and social sectors into a single, customized model; and, more recently, the Integrated Sustainable Development Goals (iSDG) model, a derivative of the T21 model that can be customized to country-specific conditions [27,28]. Examples of applications include Sverdrup et al. [29], who reported on how the WORLD6 model was developed to simulate the potential future supply and scarcity of several of the world’s natural resources, and Sverdrup and Olafsdottir [30], who used WORLD7 to evaluate the climate impacts of the global cement sector. The T21 and iSDG models have been used to investigate national pathways to reach the Sustainable Development Goals [28,31,32,33].
Despite the ability of system dynamics models to capture and explore the dynamics and relationships between different dimensions of sustainable development over time, they have not normally been equipped to translate the often complex and conflicting multidimensional outputs for decision support [34]. Multi-criteria decision analysis (MCDA) serves this purpose by enabling the inclusion of conflicting criteria when comparing, for example, decarbonization trajectories across multiple sustainability themes. Furthermore, as MCDA offers a structured and clear framework for incorporating stakeholder preferences, it can establish a trustworthy and reliable decision-making process among stakeholders, which is important when working with diverse sustainability themes. This can further enable a decision-making process that engages all stakeholders and promotes democratic decision-making [35,36].
MCDA has been applied in the context of planning in the energy sector but until recently without a link to dynamic energy systems models [37,38,39,40]. For example, Ezbakhe and Pérez-Foguet [37] used MCDA to assess the best renewable energy alternative for Turkey, applying five main decision criteria (technological, technical, economic, environmental, and socio-political). Sadiq et al. [38] assessed the sustainability of scaled renewable energy systems for electrifying off-grid communities using MCDA based on the Analytical Hierarchy Process (AHP) in Pakistan, considering social, technical, environmental, and economic factors as key dimensions of sustainability. Gouraizim et al. [39] proposed a hybrid multi-criteria decision-making framework to assess renewable energy technologies for Morocco’s energy transition based on environmental, economic, technical, and social criteria. More recently, Solano-Olivares et al. [40] developed an integrated sustainability assessment framework to evaluate geothermal technologies in Mexico. They defined 36 sustainability indicators through participatory stakeholder engagement. These indicators were prioritized using MCDA. Alghassab [41] applied MCDA when comparing alternatives for a sustainable energy transition in the Kingdom of Saudi Arabia.
When conducting MCDA, systematic stakeholder engagement is key to capturing stakeholder preferences, including those of citizens [36,42]. The importance of incorporating stakeholder preferences and utilizing location-specific data was demonstrated by Mertzanakis et al. [36], who used an MCDA to reveal the preferred waste-to-energy technology in Greece. Similarly, Schmidt-Scheele et al. [42] illustrated that systematically including citizen preferences can result in different prioritization of sustainability criteria compared to prioritization based on expert judgement.
Recently, studies that integrate dynamic energy systems models and MCDA, including stakeholder preferences, have begun to emerge in the literature e.g., [34,43]. Witt et al. [34] assessed future power generation in the Lower Saxony region in Germany in the context of multiple criteria. Different development scenarios were simulated using an energy systems model, and a multi-criteria analysis (MCA) was applied to the output to reveal a desirable future pathway for the system. Naegler et al. [43] used a combination of energy systems models and multi-criteria impact assessment to compare different transformation strategies for the German energy system.

3. Methods

To demonstrate the implementation of the decision support system (DSS), which includes a system dynamics model, stakeholder engagement in selecting sustainability themes and indicators, and MCDA, we used the case of the Icelandic energy system to evaluate policies that aim for deep decarbonization of road transport. The Icelandic energy system is already largely decarbonized, with renewable energy resources accounting for 85.9% of the total primary energy supply in 2022. The remaining 14.1% comes from fossil fuels, primarily used in transport (76%) and the fishing industry (17%) [44].
Decarbonization of the road transport sector is slowly emerging, with low-carbon renewable energy accounting for 9.2% in 2022 [45]. Further decarbonization may require increased electricity generation [46,47].The country has not set specific mitigation targets for the transport sector, but through a combined commitment with the European Union under the Paris Agreement [48], Iceland will be obliged to reduce emissions from Effort Sharing Sectors, including road transport, by close to 40% by 2030 compared to 2005 levels. In addition to its formal international obligations, Iceland has announced that it aims to reach climate neutrality by 2040 [49]. The current energy policy from 2020, “A sustainable energy future; an energy policy to the year 2050”, describes aims for independence from fossil fuels by 2040, with a particular focus on the following five main themes: Energy security; Energy transition; Energy efficiency and conservation; Environment; and Society and economy [50]. Given the presence of an almost decarbonized electricity system, research indicates that electric vehicles are the most effective way, in Iceland, to simultaneously reach climate and energy goals in road transport [51].

3.1. Key Components of the Integrated Framework

The integrated framework developed in this study consists of three core components: context-specific sustainability indicators (see Section 3.1.1), a partial equilibrium system dynamics model (UniSyD_IS) of the Icelandic energy system (see Section 3.1.2), and an MCDA framework (see Section 3.1.3). Stakeholder engagement is used to develop policy-based scenarios, identify context-specific sustainability themes and indicators, and determine appropriate weights for the sustainability themes used in the MCDA. Figure 1 shows the key components of the integrated framework.
The assessment process begins with detailed stakeholder engagement to identify sustainability themes and to define policy-based scenarios. The Icelandic energy systems model (UniSyD_IS) is then used to estimate variables for each scenario, incorporating sustainability indicators that are directly related to the energy system. Other sustainability indicators are estimated based on additional environmental and macro-economic evaluations. Finally, the MCDA framework is developed based on the criteria weighting obtained from stakeholders, which is then applied to compare policy specific energy trajectory scenarios based on the sustainability themes.
The integrated framework (see Section 3.1.4)—which combines structured stakeholder engagement, sustainability indicators, the energy systems model, and MCDA—enables the identification of desirable development trajectories and policies across multiple sustainability themes.

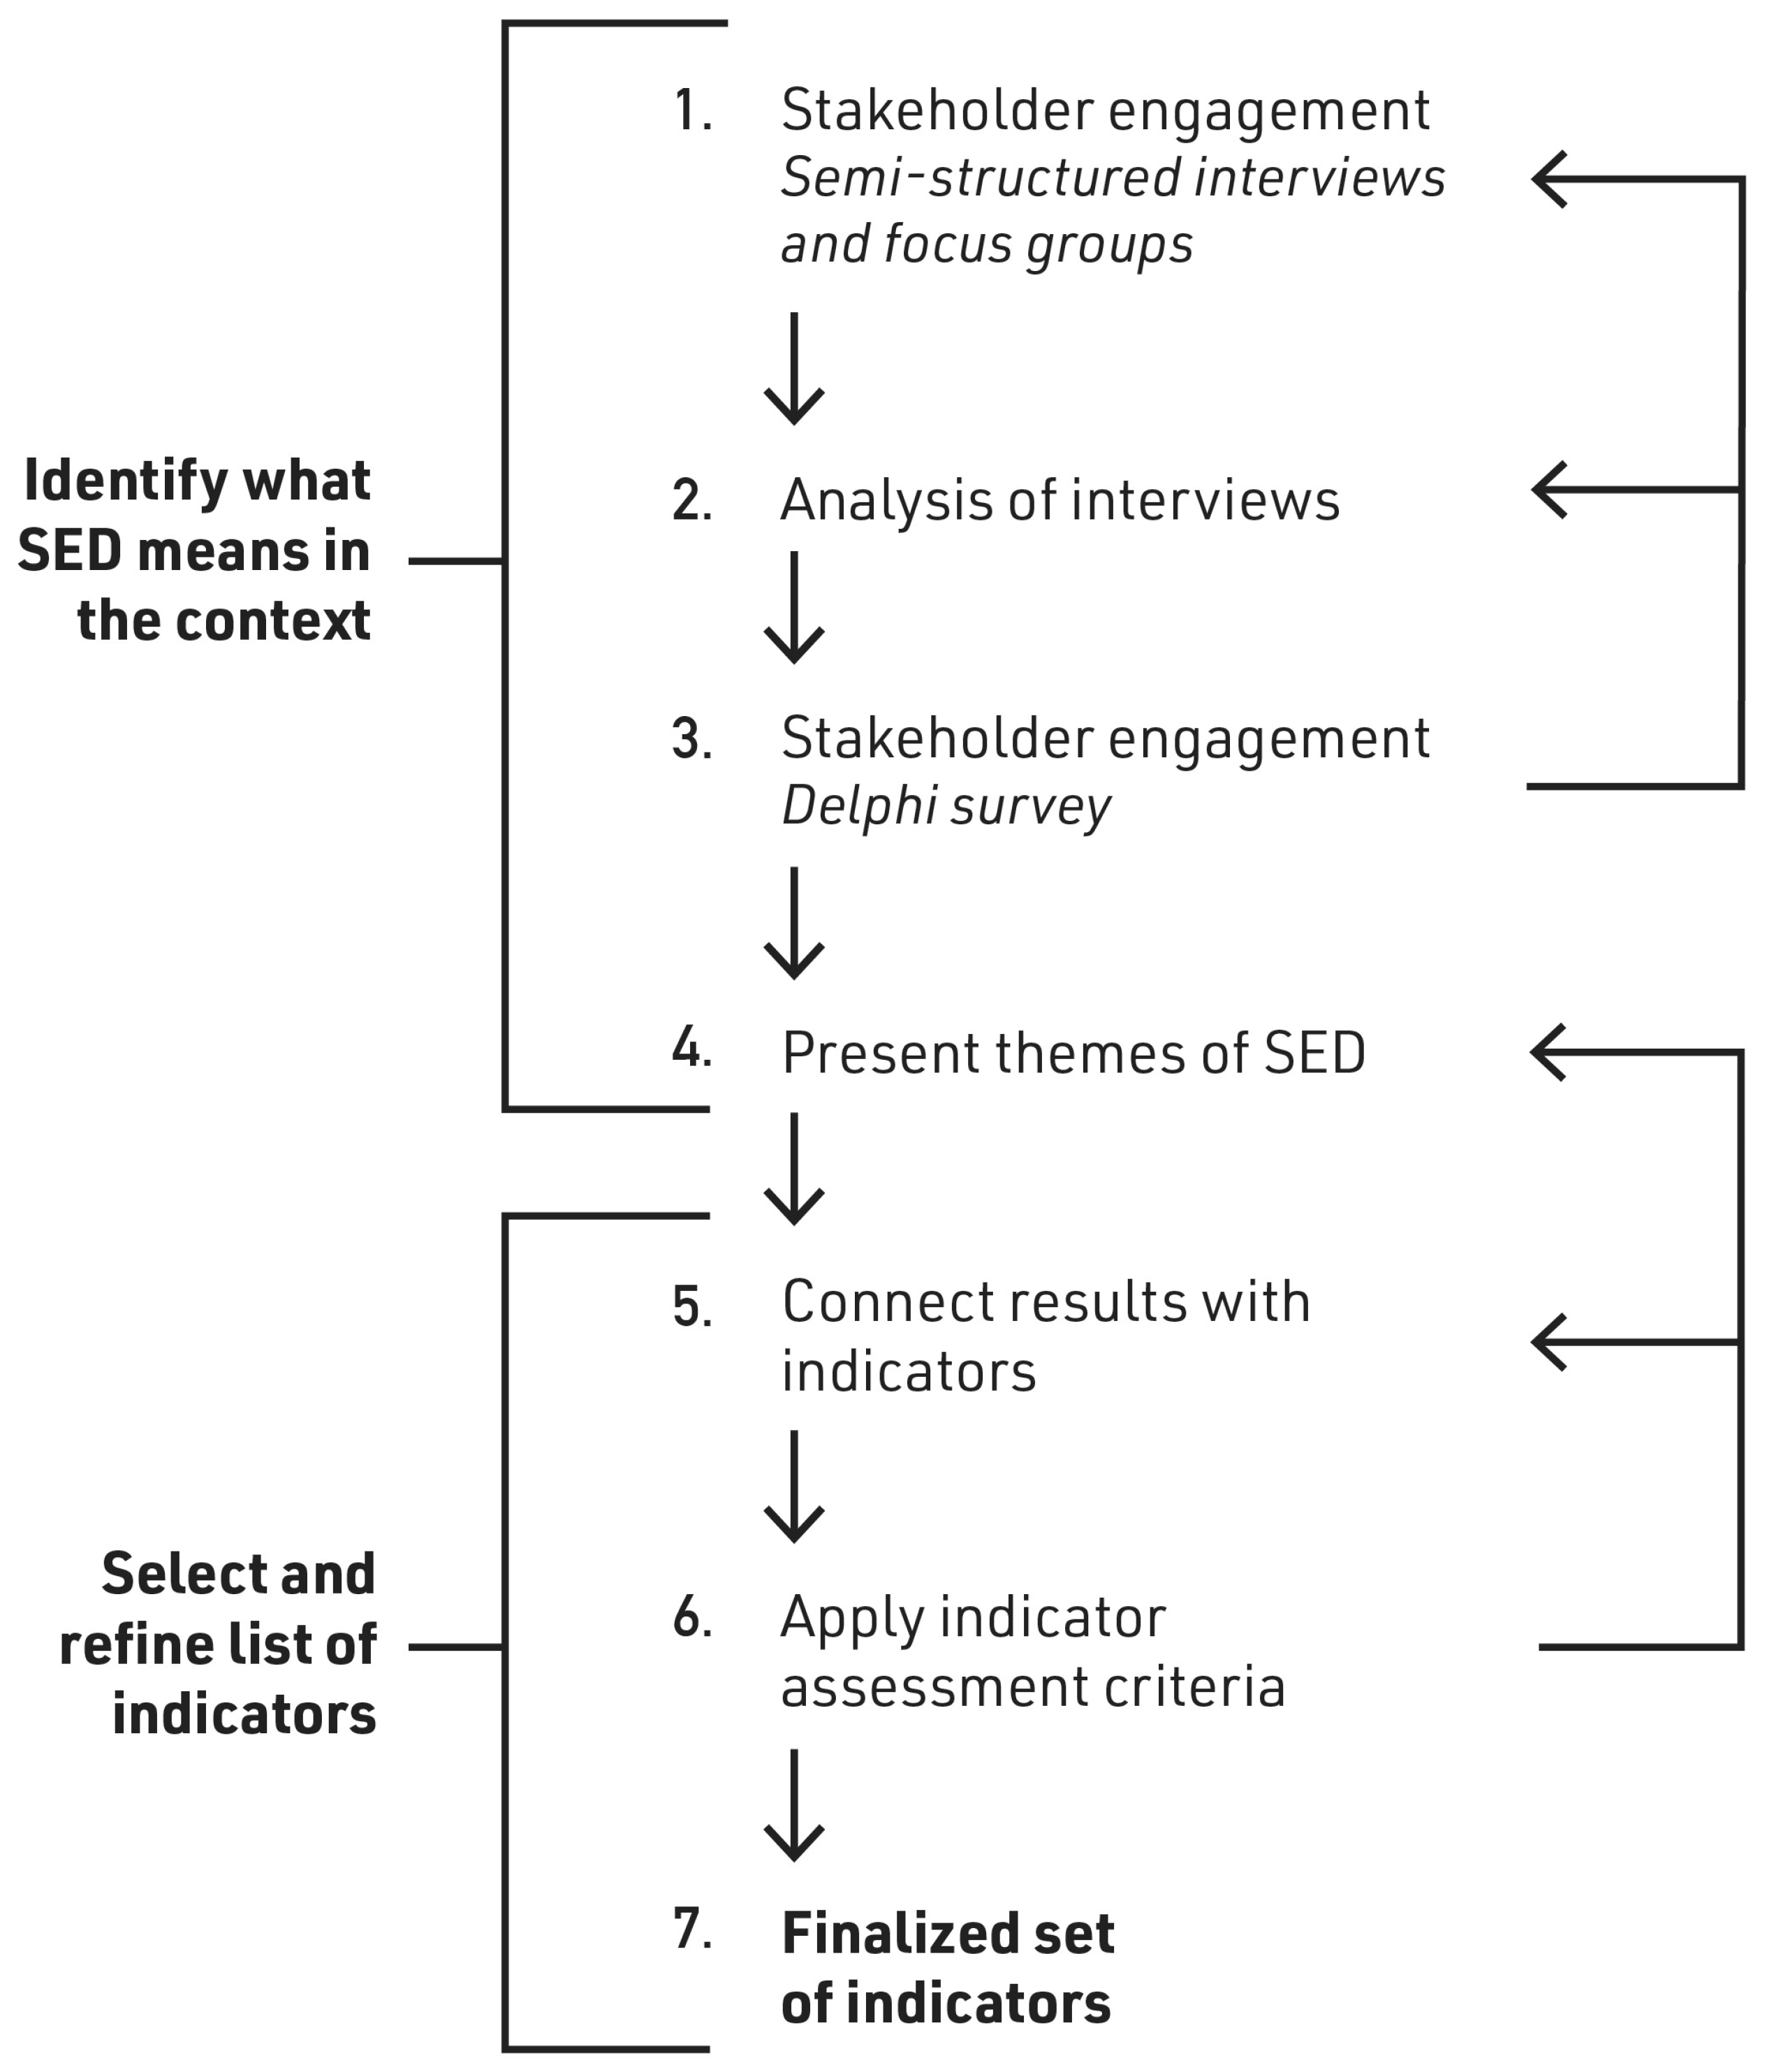
3.1.1. Sustainability Themes and Indicators

Sustainability themes and indicators for sustainable energy development (SED) were developed for the Icelandic energy system through a structured stakeholder engagement process. For this purpose, an iterative method for indicator development based on stakeholder input was developed (Figure 2), which is described in Gunnarsdottir et al. [14,52].
By engaging stakeholders at the start of the process of selecting indicators, an emphasis is placed on stakeholder preferences and minimizing researcher bias. The following seven main stakeholder groups were identified: industrial users; energy producers; public decision-makers; professional interest groups, including engineering firms; public; distribution and transmission companies; and NGOs. These were engaged in steps 1 and 3 of the process.
The purpose of the first four steps of the indicator development process is to identify what is involved in SED in Iceland, and to produce SED themes based on stakeholder input. Semi-structured interviews and focus groups were conducted and transcribed. Through coding analysis of the interviews and focus groups, initial themes and subthemes of SED in Iceland were identified. An iterative Delphi survey was then conducted to verify the identified themes, and potentially add missing elements. The survey entailed two rounds of a structured online survey, where interviewees were asked to evaluate the importance of identified themes for SED on a Likert scale from 1 to 5. An important feature of a Delphi survey is the sharing of feedback with participants between rounds of the survey to allow participants to reassess their initial responses after considering the opinions of others [53,54]. These first four steps resulted in verified SED themes for Iceland.
The last three steps of the indicator selection process involve linking the identified themes and subthemes to indicators to allow for an evaluation of SED for the Icelandic energy system. In step five, preexisting indicators for each sub-theme were identified through a literature review; in step six, an indicator assessment criterion was applied to the identified indicators. This ensured the suitability and quality of the final set of theme-based indicators for SED in Iceland that emerged in the final step [14]. A comprehensive and flexible set of indicators to assess the SED of the Icelandic energy system is presented in a study by Gunnarsdottir et al. [52]. They observe that the indicator set can be used in different ways, depending on the purpose of the analysis. These indicators were used as a basis for the selection of a smaller set of sustainability indicators that fit the stated purpose of this study.

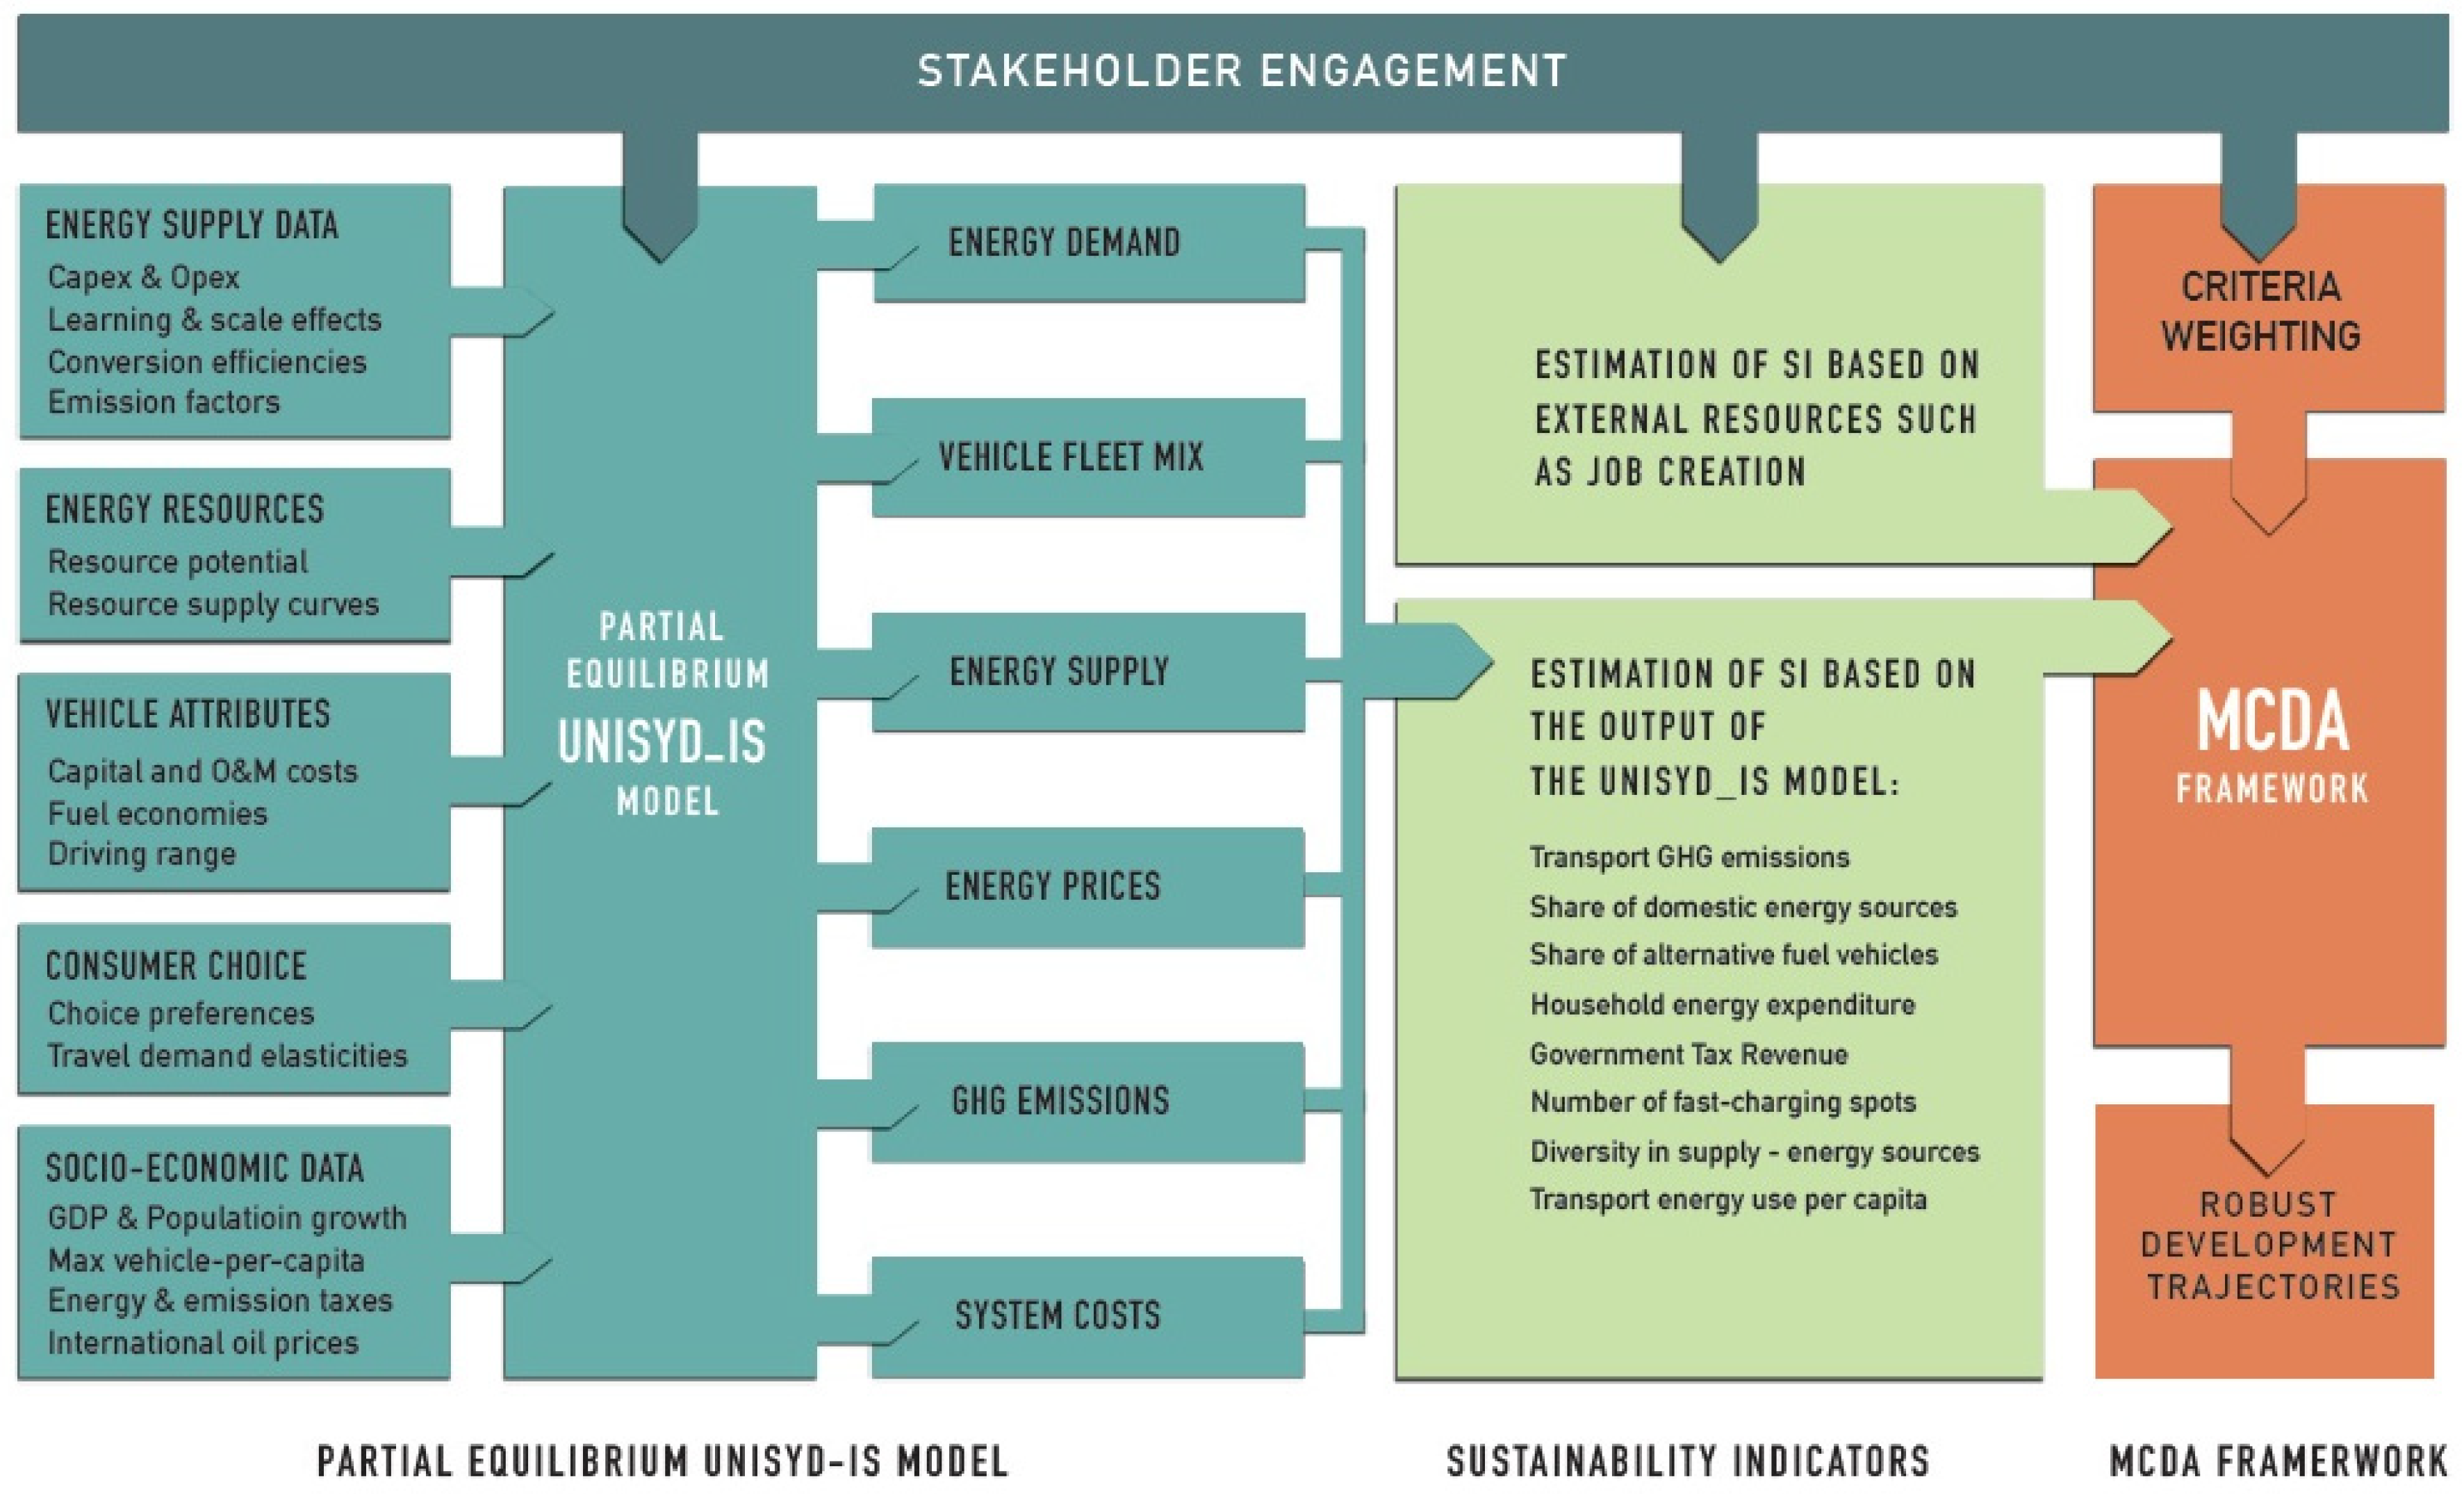
3.1.2. Dynamic Energy Systems Modeling

UniSyD_IS is a partial equilibrium simulation model of the Icelandic energy economy that uses a system dynamics approach [51,55]. It simulates the interactions among over 24,000 variables, including array expansions, across the electricity, hydrogen, biogas, bioethanol, biodiesel, and vehicle fleet markets over a flexible time horizon of typically 30–40 years and with a similarly flexible time step, typically of two weeks. The model provides detailed representations of energy resources, conversion technologies, fuel and electricity supply infrastructure, attributes of vehicle fleets, and energy prices, alongside energy demand and consumer behavior. Considering the structure of the Icelandic energy system and the importance of transport in achieving both climate and energy policy goals, the model emphasizes road transport. It captures conventional and alternative fuel supply pathways, as well as relevant vehicle technologies.
On the supply side, renewable energy resources including hydro, geothermal, wind and biogas are modeled. Residential and commercial electricity demand changes as a function of population growth. Industrial electricity demand is linked to changes in GDP growth, which is exogenously defined. A market price signal modifies the final electricity demand in these sectors through price elasticities.
In the road transport sector, travel demand, vehicle stock change, fuel economy improvement, vehicle technology shifts, and vehicle fuel switching are taken into consideration in the forecasting of road transport fuel demand, including increased electricity demand as the fleet is electrified [51]. Vehicle fleets are divided into light- and heavy-duty vehicles. A vehicle choice algorithm based on a multinomial logit (MNL) framework, informed by a multinomial utility function, forecasts the market share evolution of vehicle types within each fleet type. The algorithm gives the probability that consumers adopt new vehicle types based on their preferences towards fuel and vehicle attributes, including vehicle purchase price ($), annual maintenance cost ($/year), fuel cost per kilometer ($/km), battery replacement cost for electric vehicles ($), vehicle driving range (km), and refueling service availability [55]. Given the focus of the study on e-transport, each fleet is limited to four vehicle technologies with three energy types. These are, as follows: internal combustion engine (ICE); hybrid electric (HEV); plug-in hybrid electric (PHEV); and battery electric vehicles (BEV) powered by gasoline, diesel, or electricity. Other technologies and fuels, including biofuels, hydrogen and methanol are excluded from this simulation.
In the assessment, the UniSyD_IS model is employed to simulate the evolution of energy-system related output indicators including:
  • Fleet mix;
  • Fuel demand and the share of indigenous renewable resources;
  • GHG emissions reduction (well-to-tank, tank-to-wheel, and well-to-wheel emissions);
  • Electricity supply capacity and generation cost;
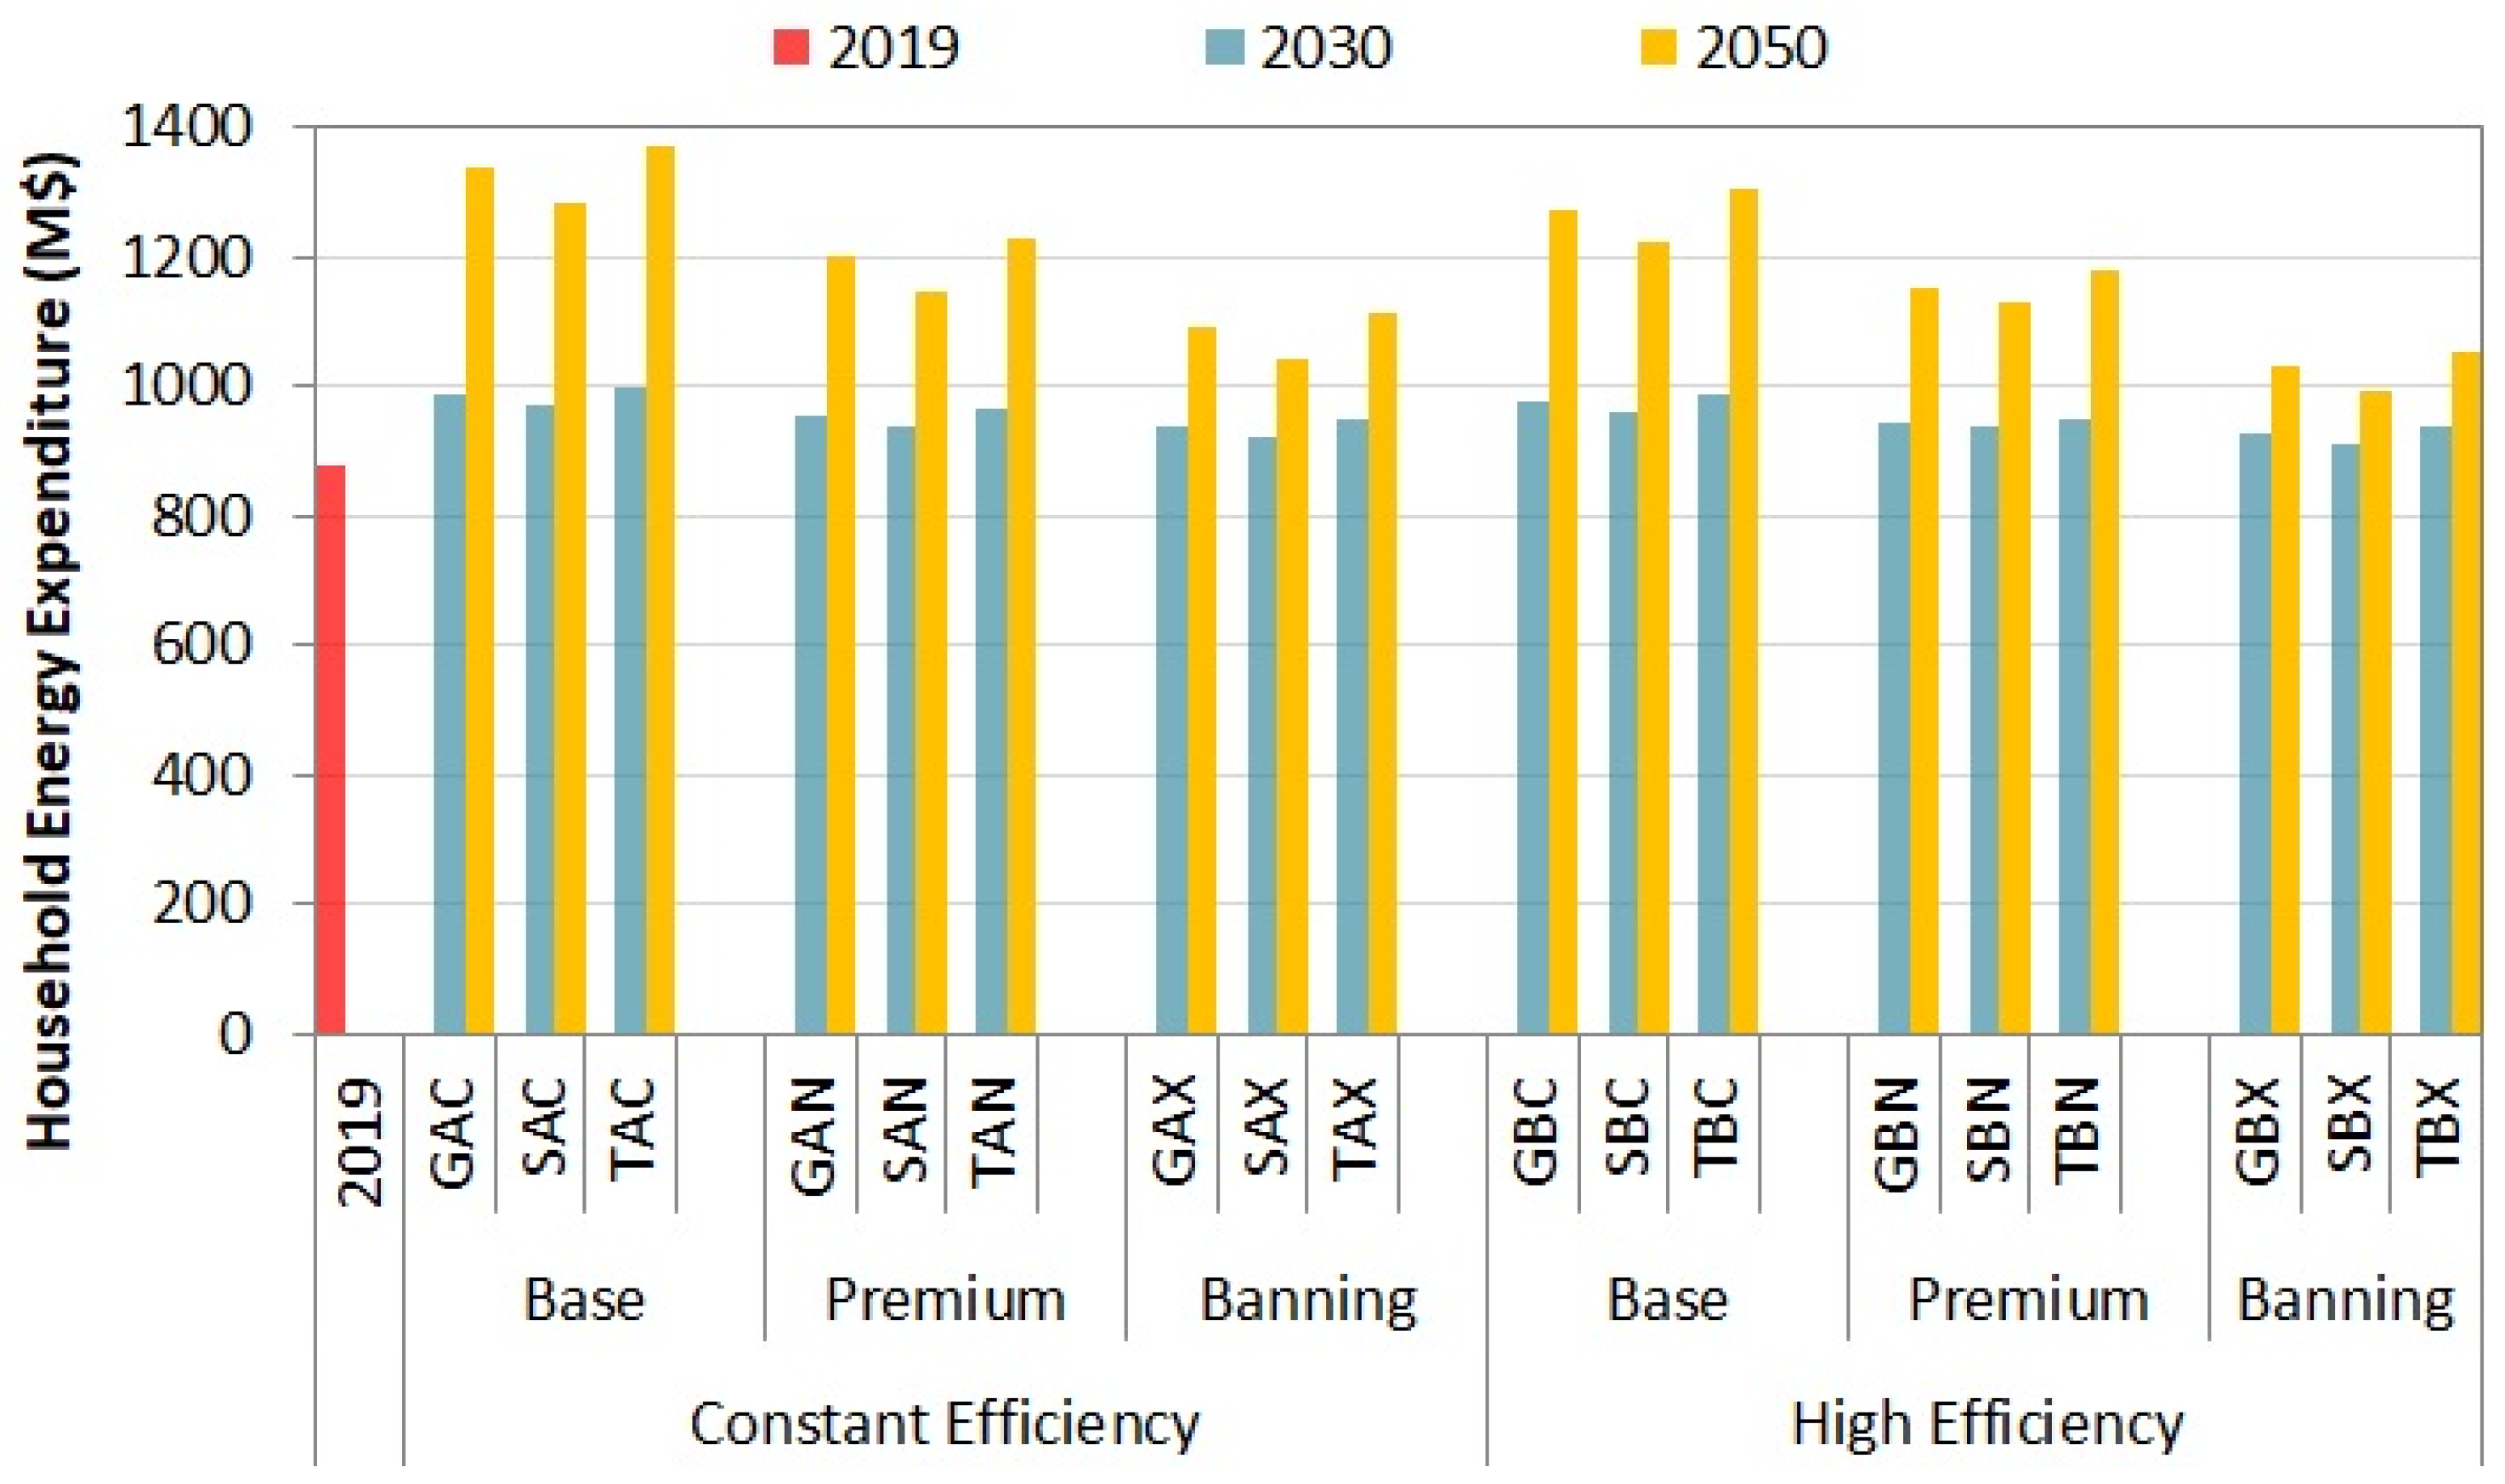
  • Consumer costs (fuel use cost, vehicle usage cost, and vehicle capital cost);
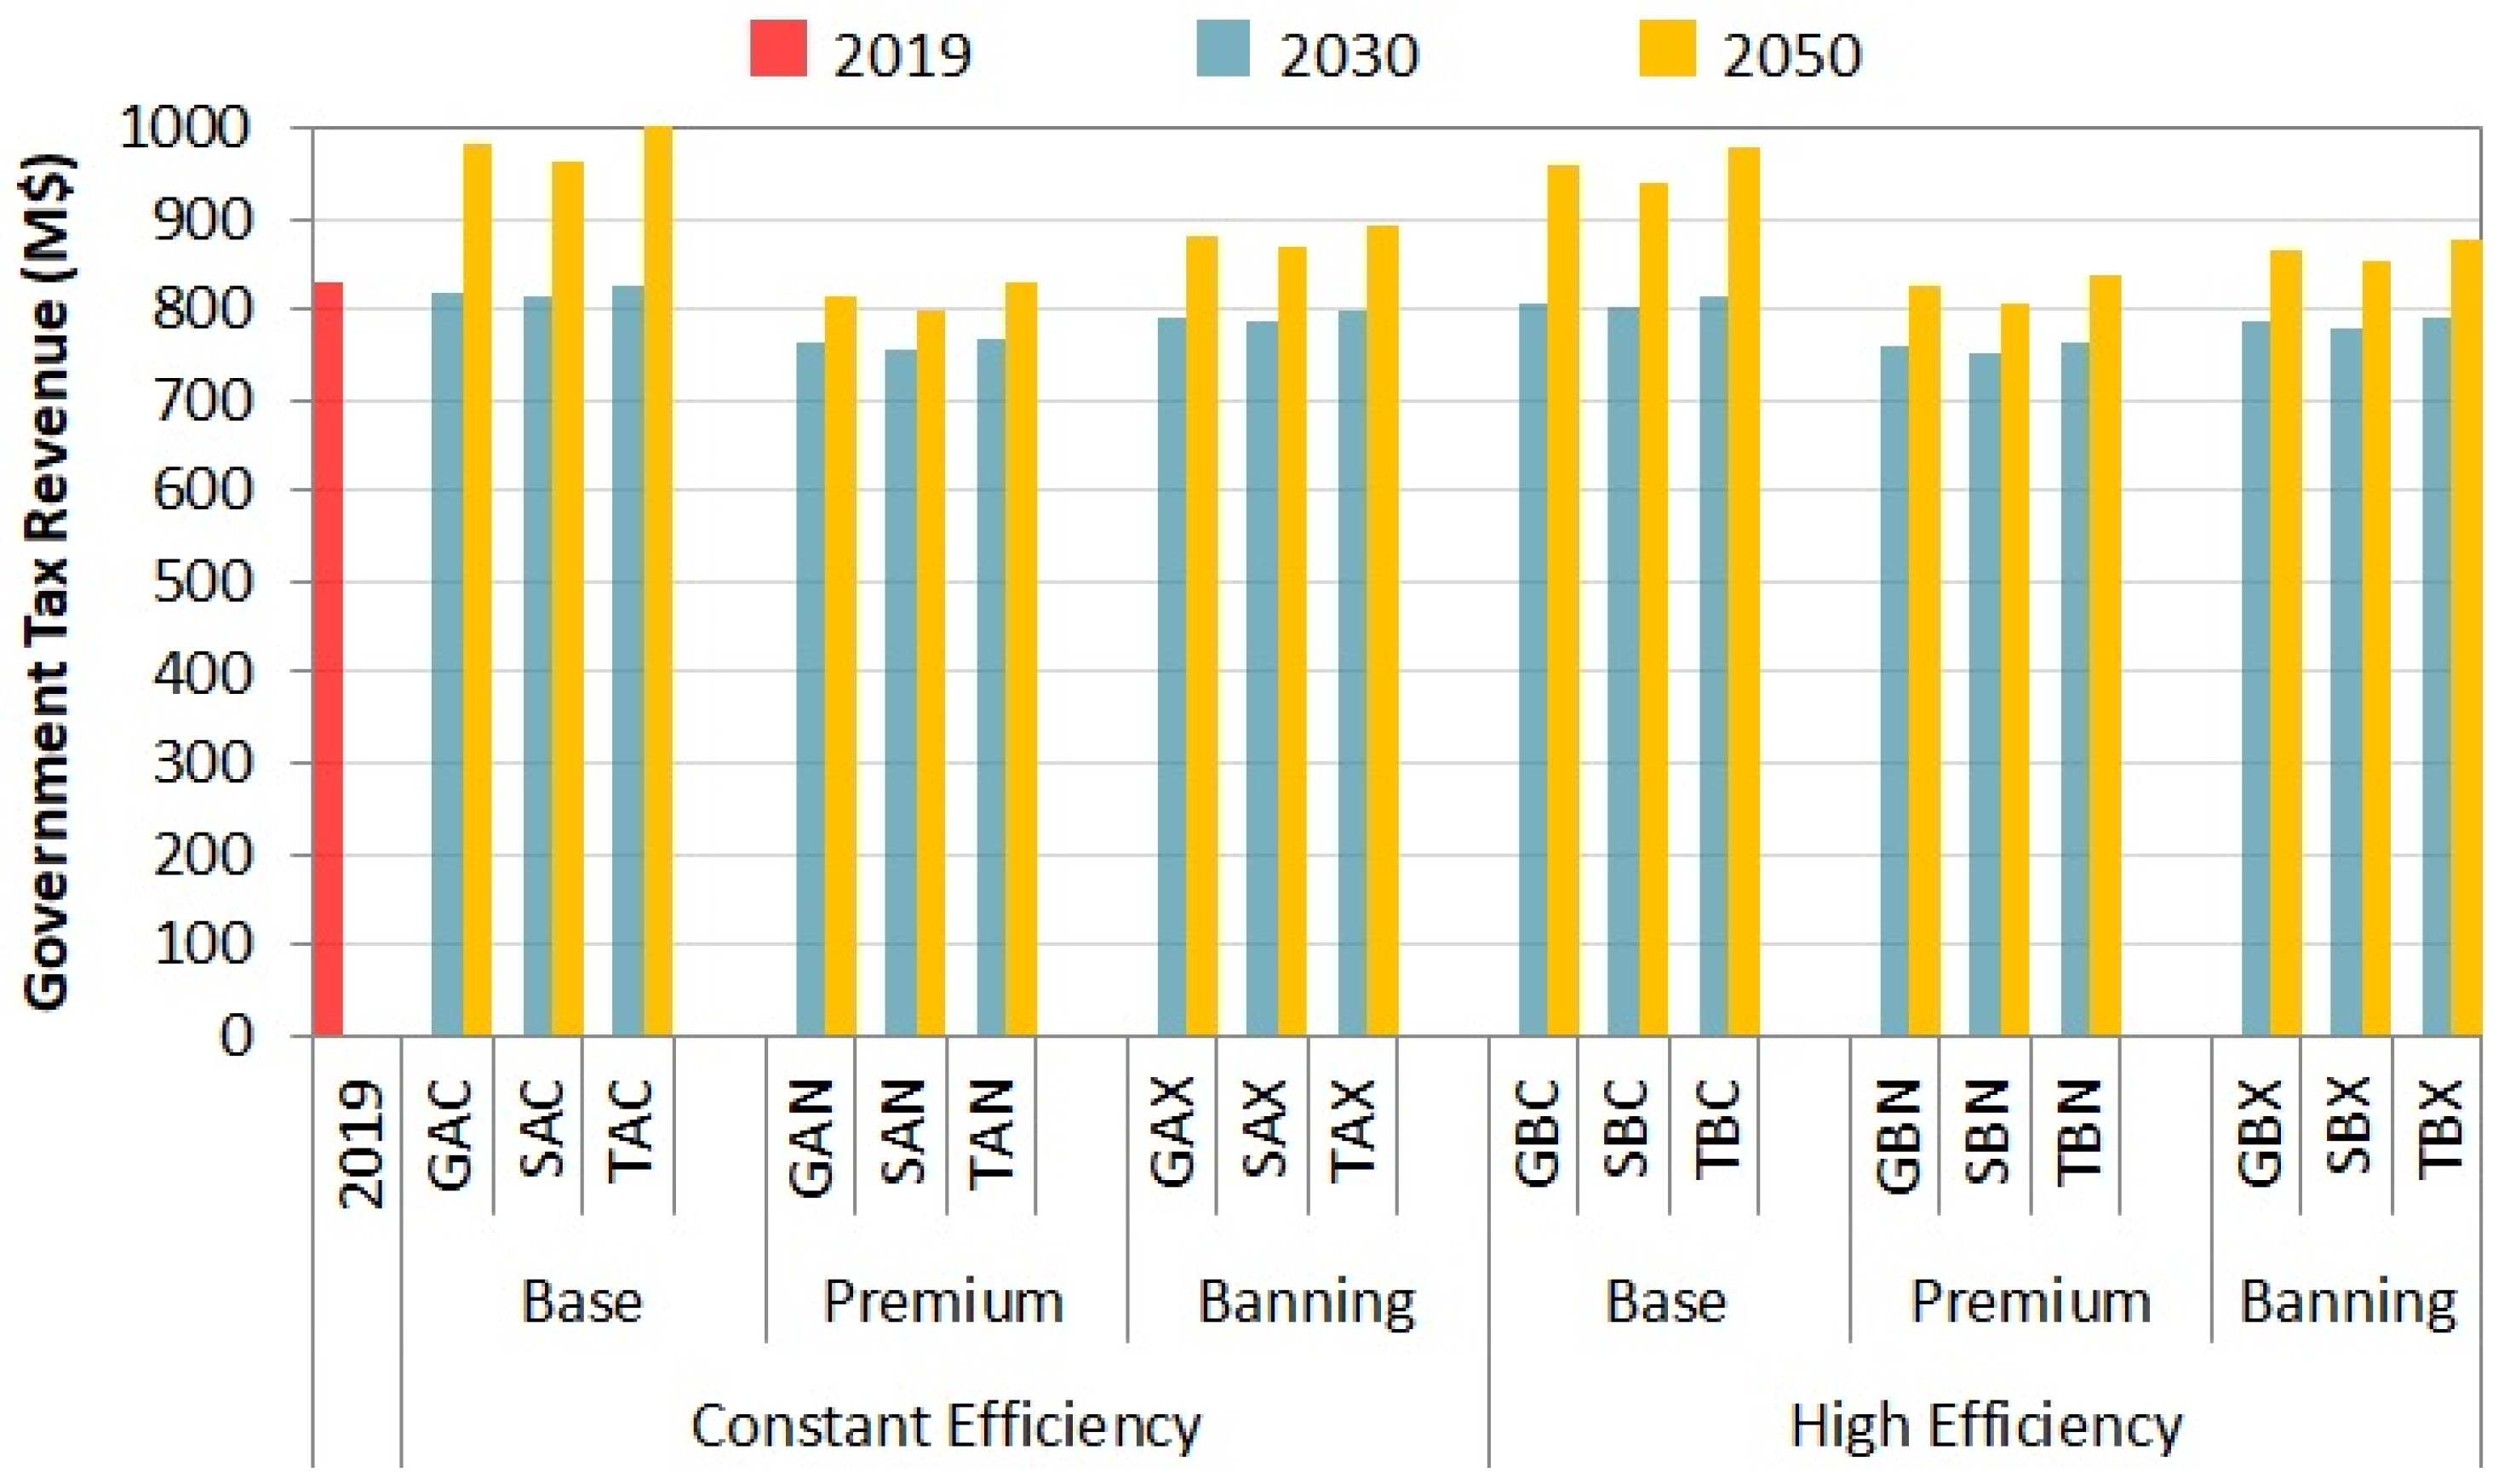
  • Government tax revenue.
The following four output indicators are estimated based on the outputs of the dynamic simulation model and macro-economic and environmental evaluation: job creation, energy intensity of the economy; impact area of power plants; and diversity of energy supply. Job creation is evaluated as a function of GDP growth and development of the tourism industry. Both are exogenously determined. The indicator to assess the energy intensity of the economy is defined as the ratio between the total energy demand obtained from the dynamic simulation model and GDP growth. The area impacted by new power plants is based on the median values for land area impact factors for hydro, geothermal, and wind power plants [56]. Finally, diversity in primary energy supply is assessed by the Herfindahl–Hirschman index (HHI) [57,58], where higher diversity implies less dependence on specific sources of energy, which translates into a lower HHI factor.

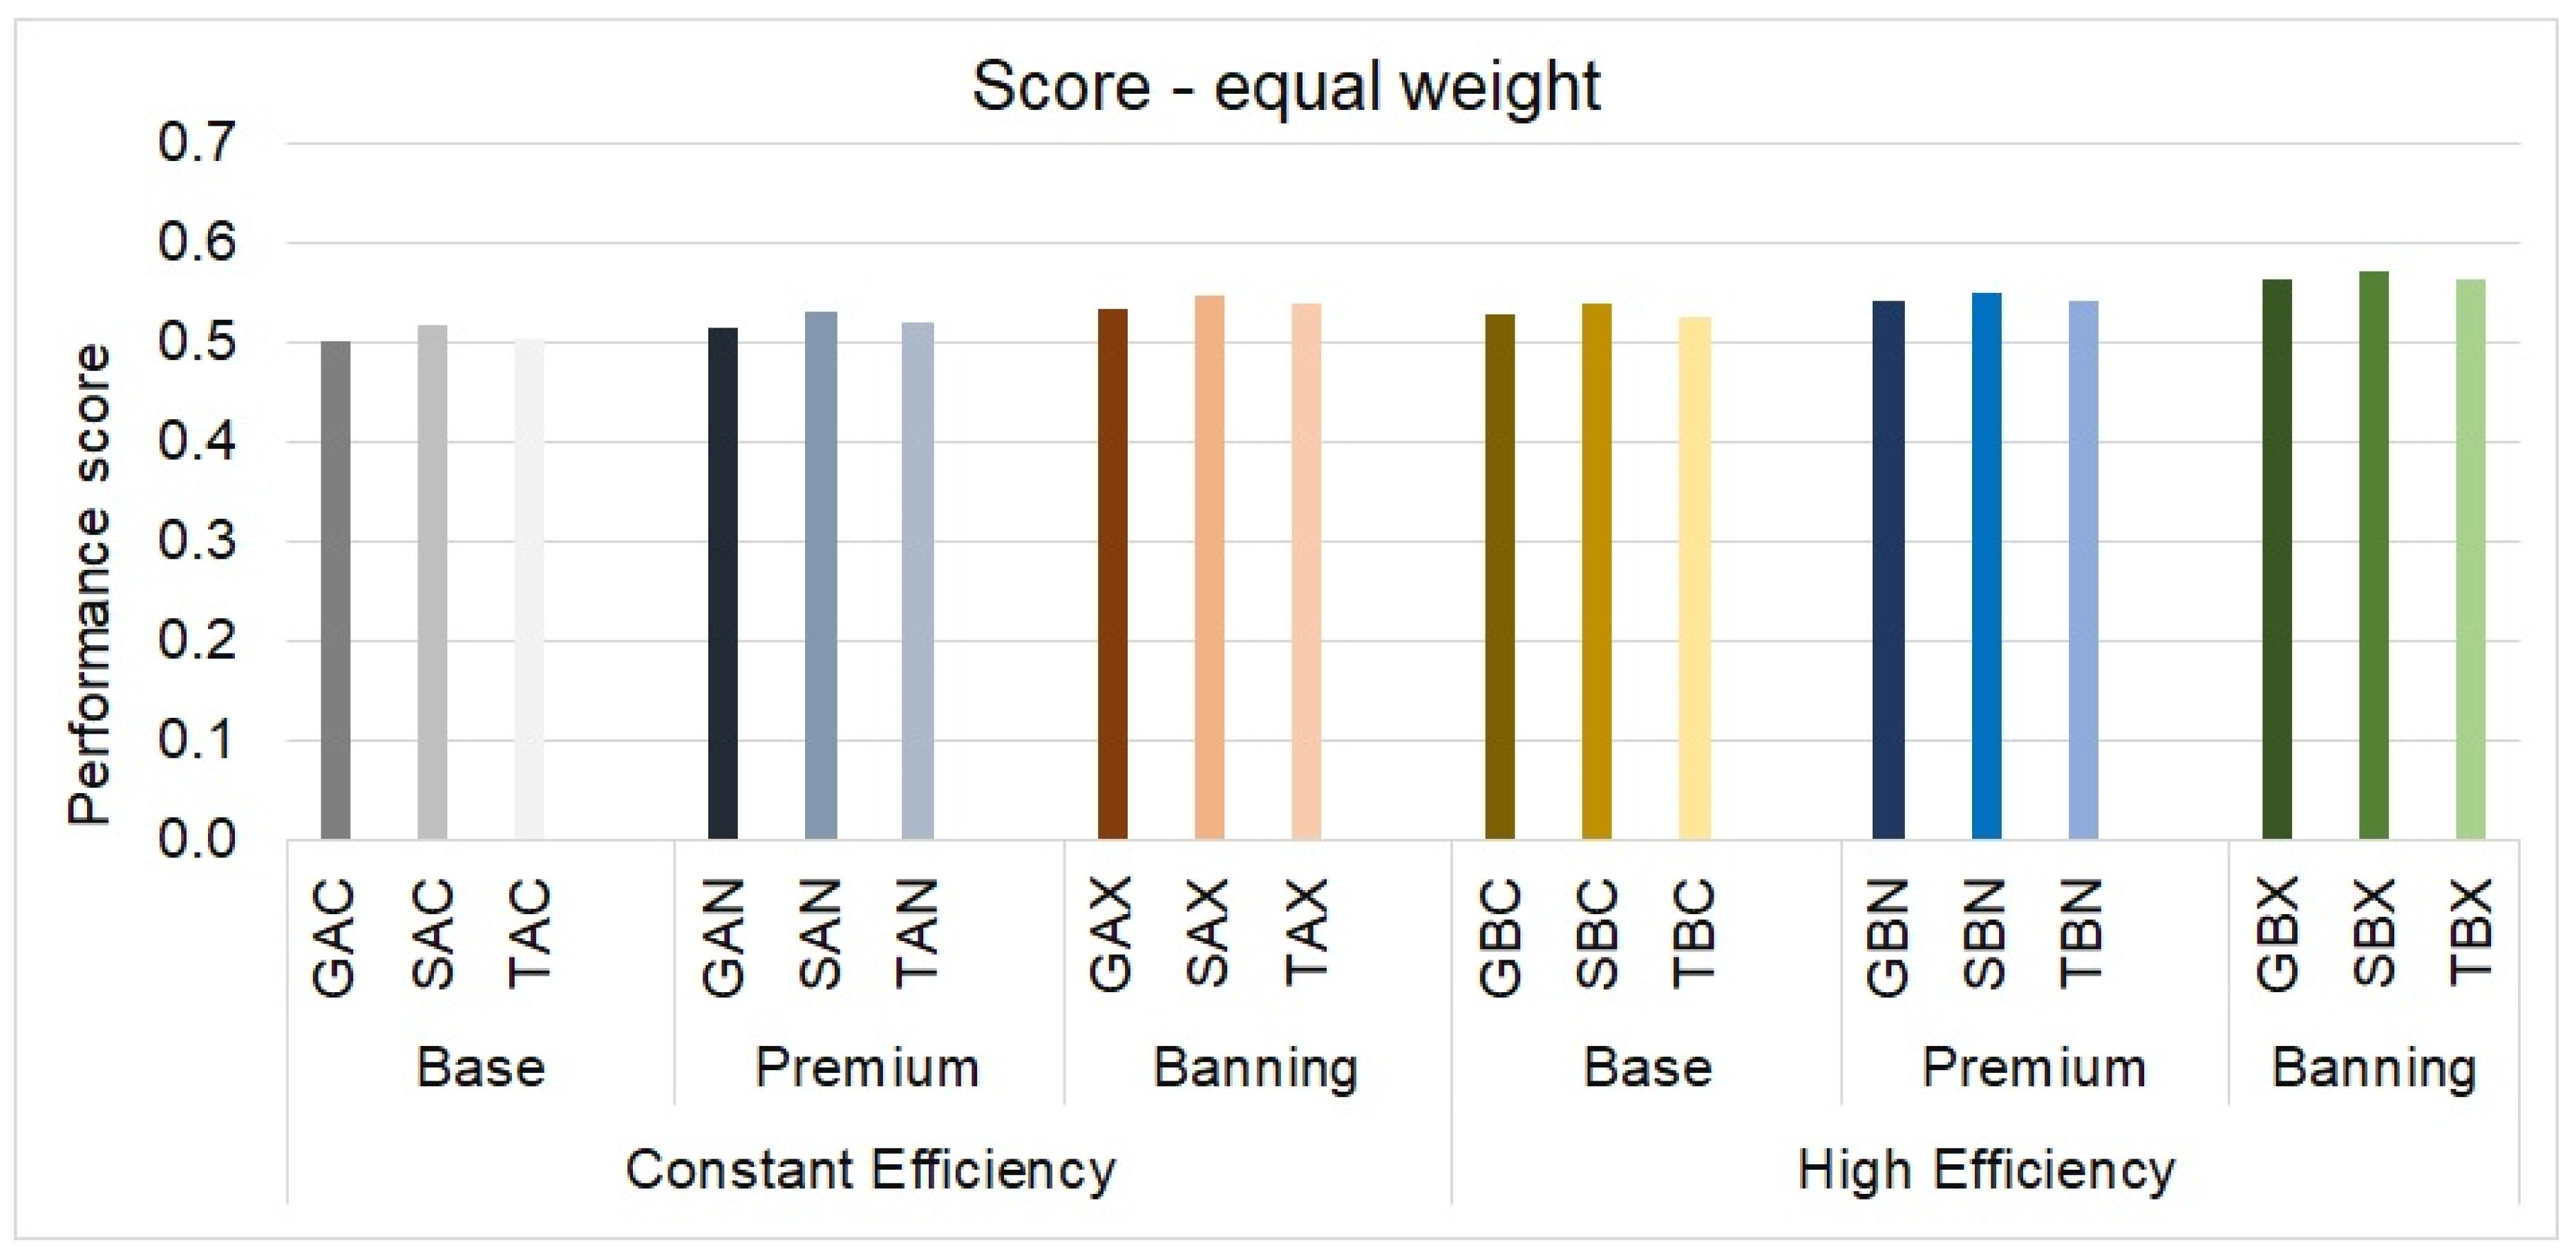
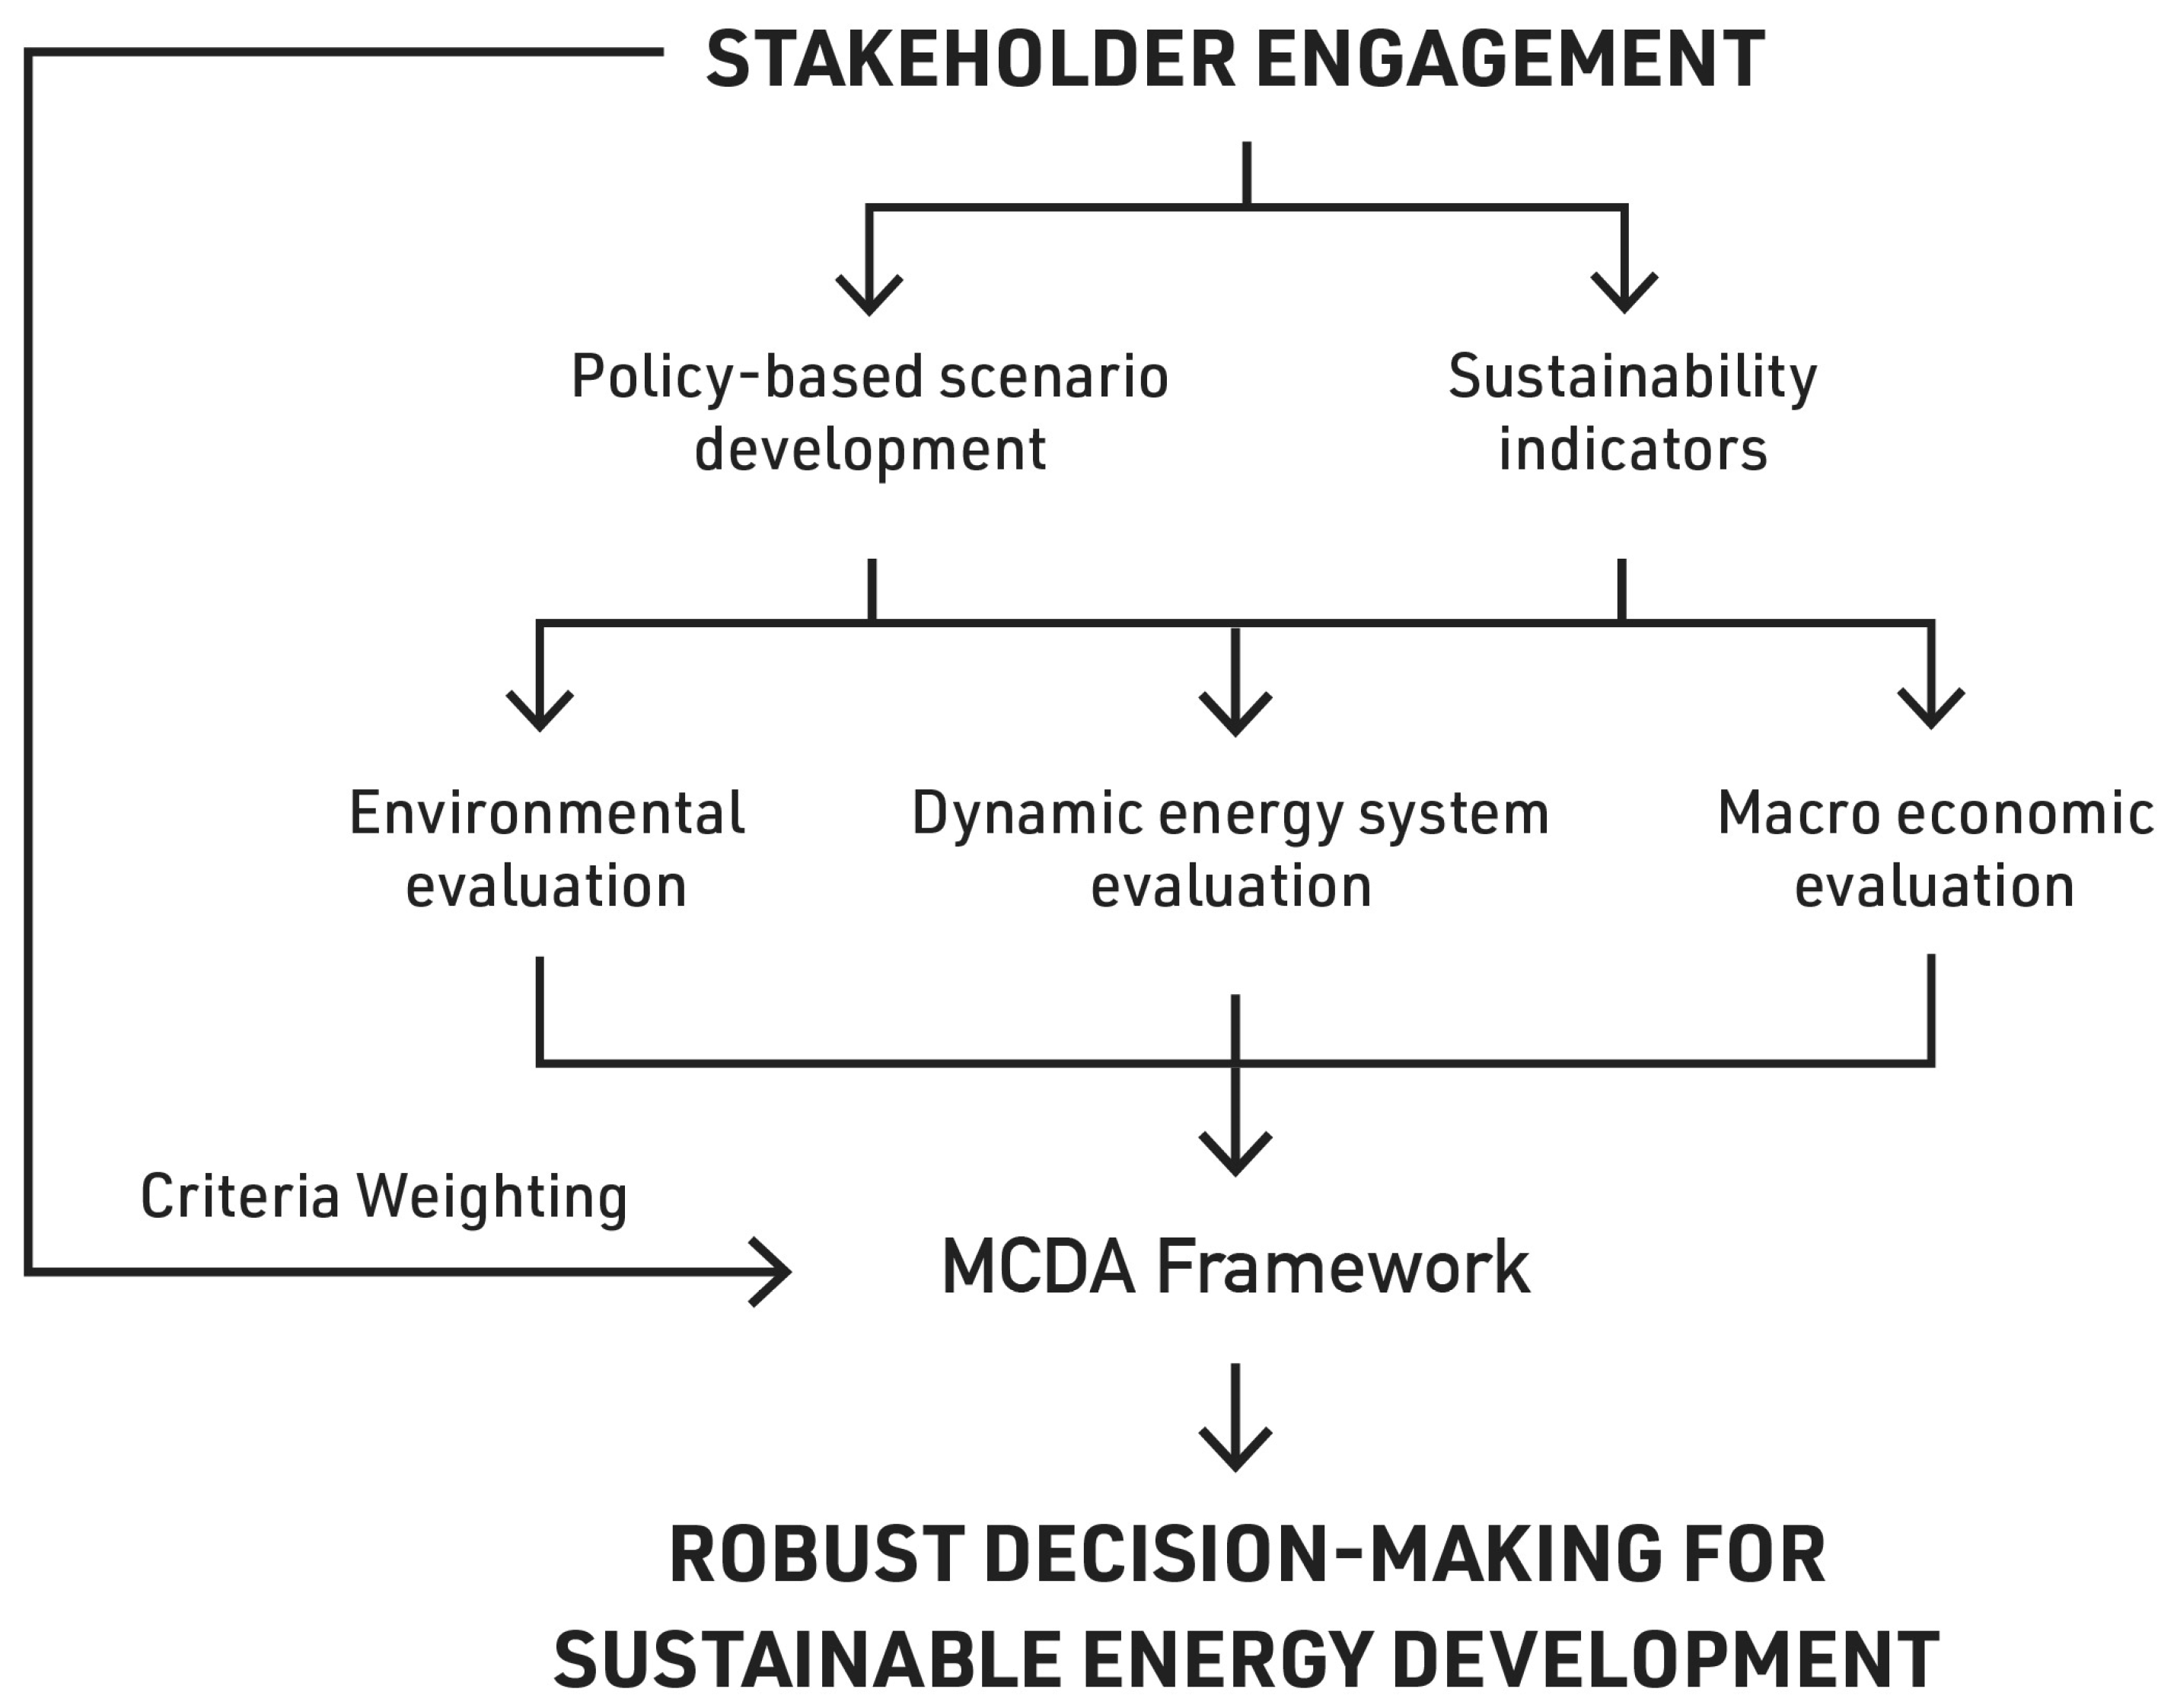
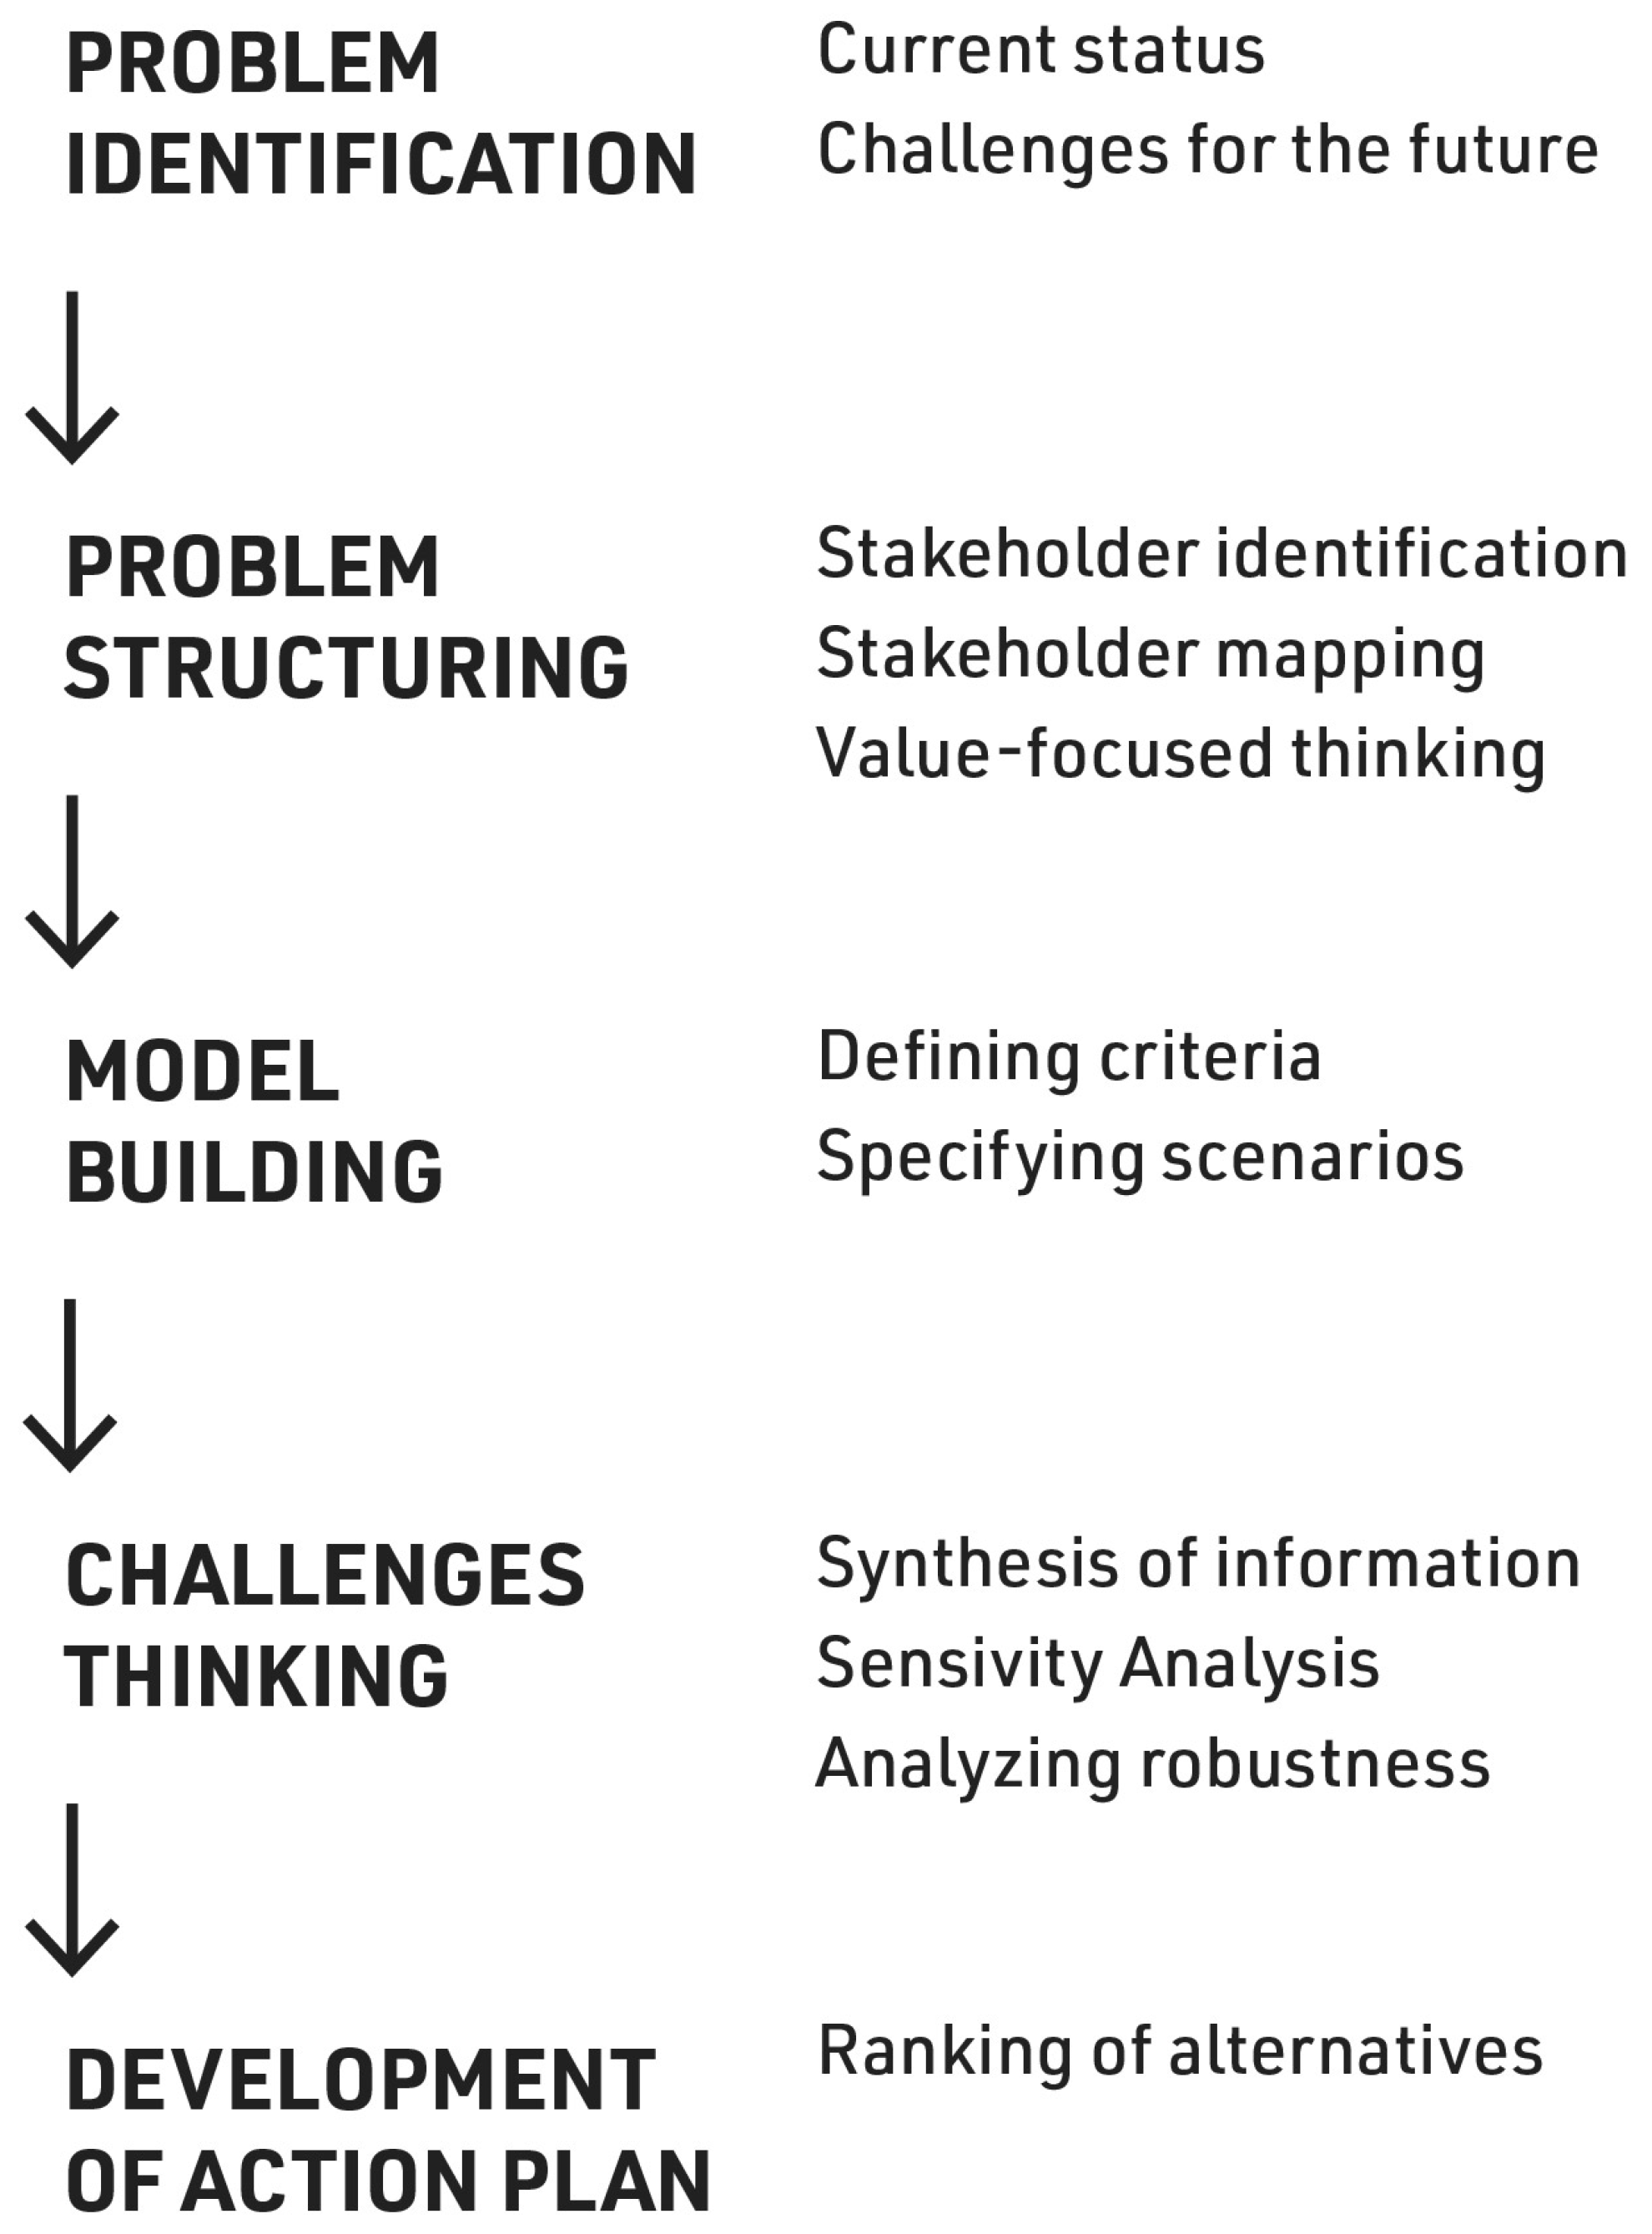
3.1.3. MCDA Framework

The simulation results for each indicator derived from the energy system simulation and the macro-economic and environmental evaluation are fed into an MCDA framework. The MCDA framework is implemented following the five steps suggested by [59] (Figure 3), as follows:
Multiple energy transition pathways can be envisioned for the future of the Icelandic energy system, but the decision regarding which pathway to follow should be based on a justifiable and transparent framework that accounts for the concerns of all relevant stakeholder groups. Therefore, a comprehensive stakeholder analysis was conducted to identify all key stakeholders. Then, the two-dimensional power-interest matrix and fuzzy logic were applied to classify stakeholder groups [60].
The value-focused thinking approach was applied to analyze transcripts of interviews with stakeholders and to recognize stakeholders’ values and objectives. The identified objectives, which are the key components of MCDA, were decision criteria that were identified as sustainability themes in this study [61]. Following this, multiple scenarios were defined (refer Section 3.2) to explore different trajectories based on three main driving forces of economic development, climate policies, and energy efficiency development. To elicit the values of scenarios across sustainability themes, the widely used TOPSIS (Technique for Order of Preference by Similarity to Ideal Solution) method was deemed suitable because it intuitively balances alternatives by evaluating their proximity to both ideal and negative-ideal solutions. This ensures efficient, clear, consistent, and transparent ranking, and the handling of both qualitative and quantitative data. The straightforward, flexible methodology makes it widely applicable and trusted across various fields [62]. The algorithm to elicit the values can be summarized in the following six steps [63]:
  • Identify the sustainability themes;
  • Create the decision matrix, where each element represents the performance of a policy bundle in each theme;
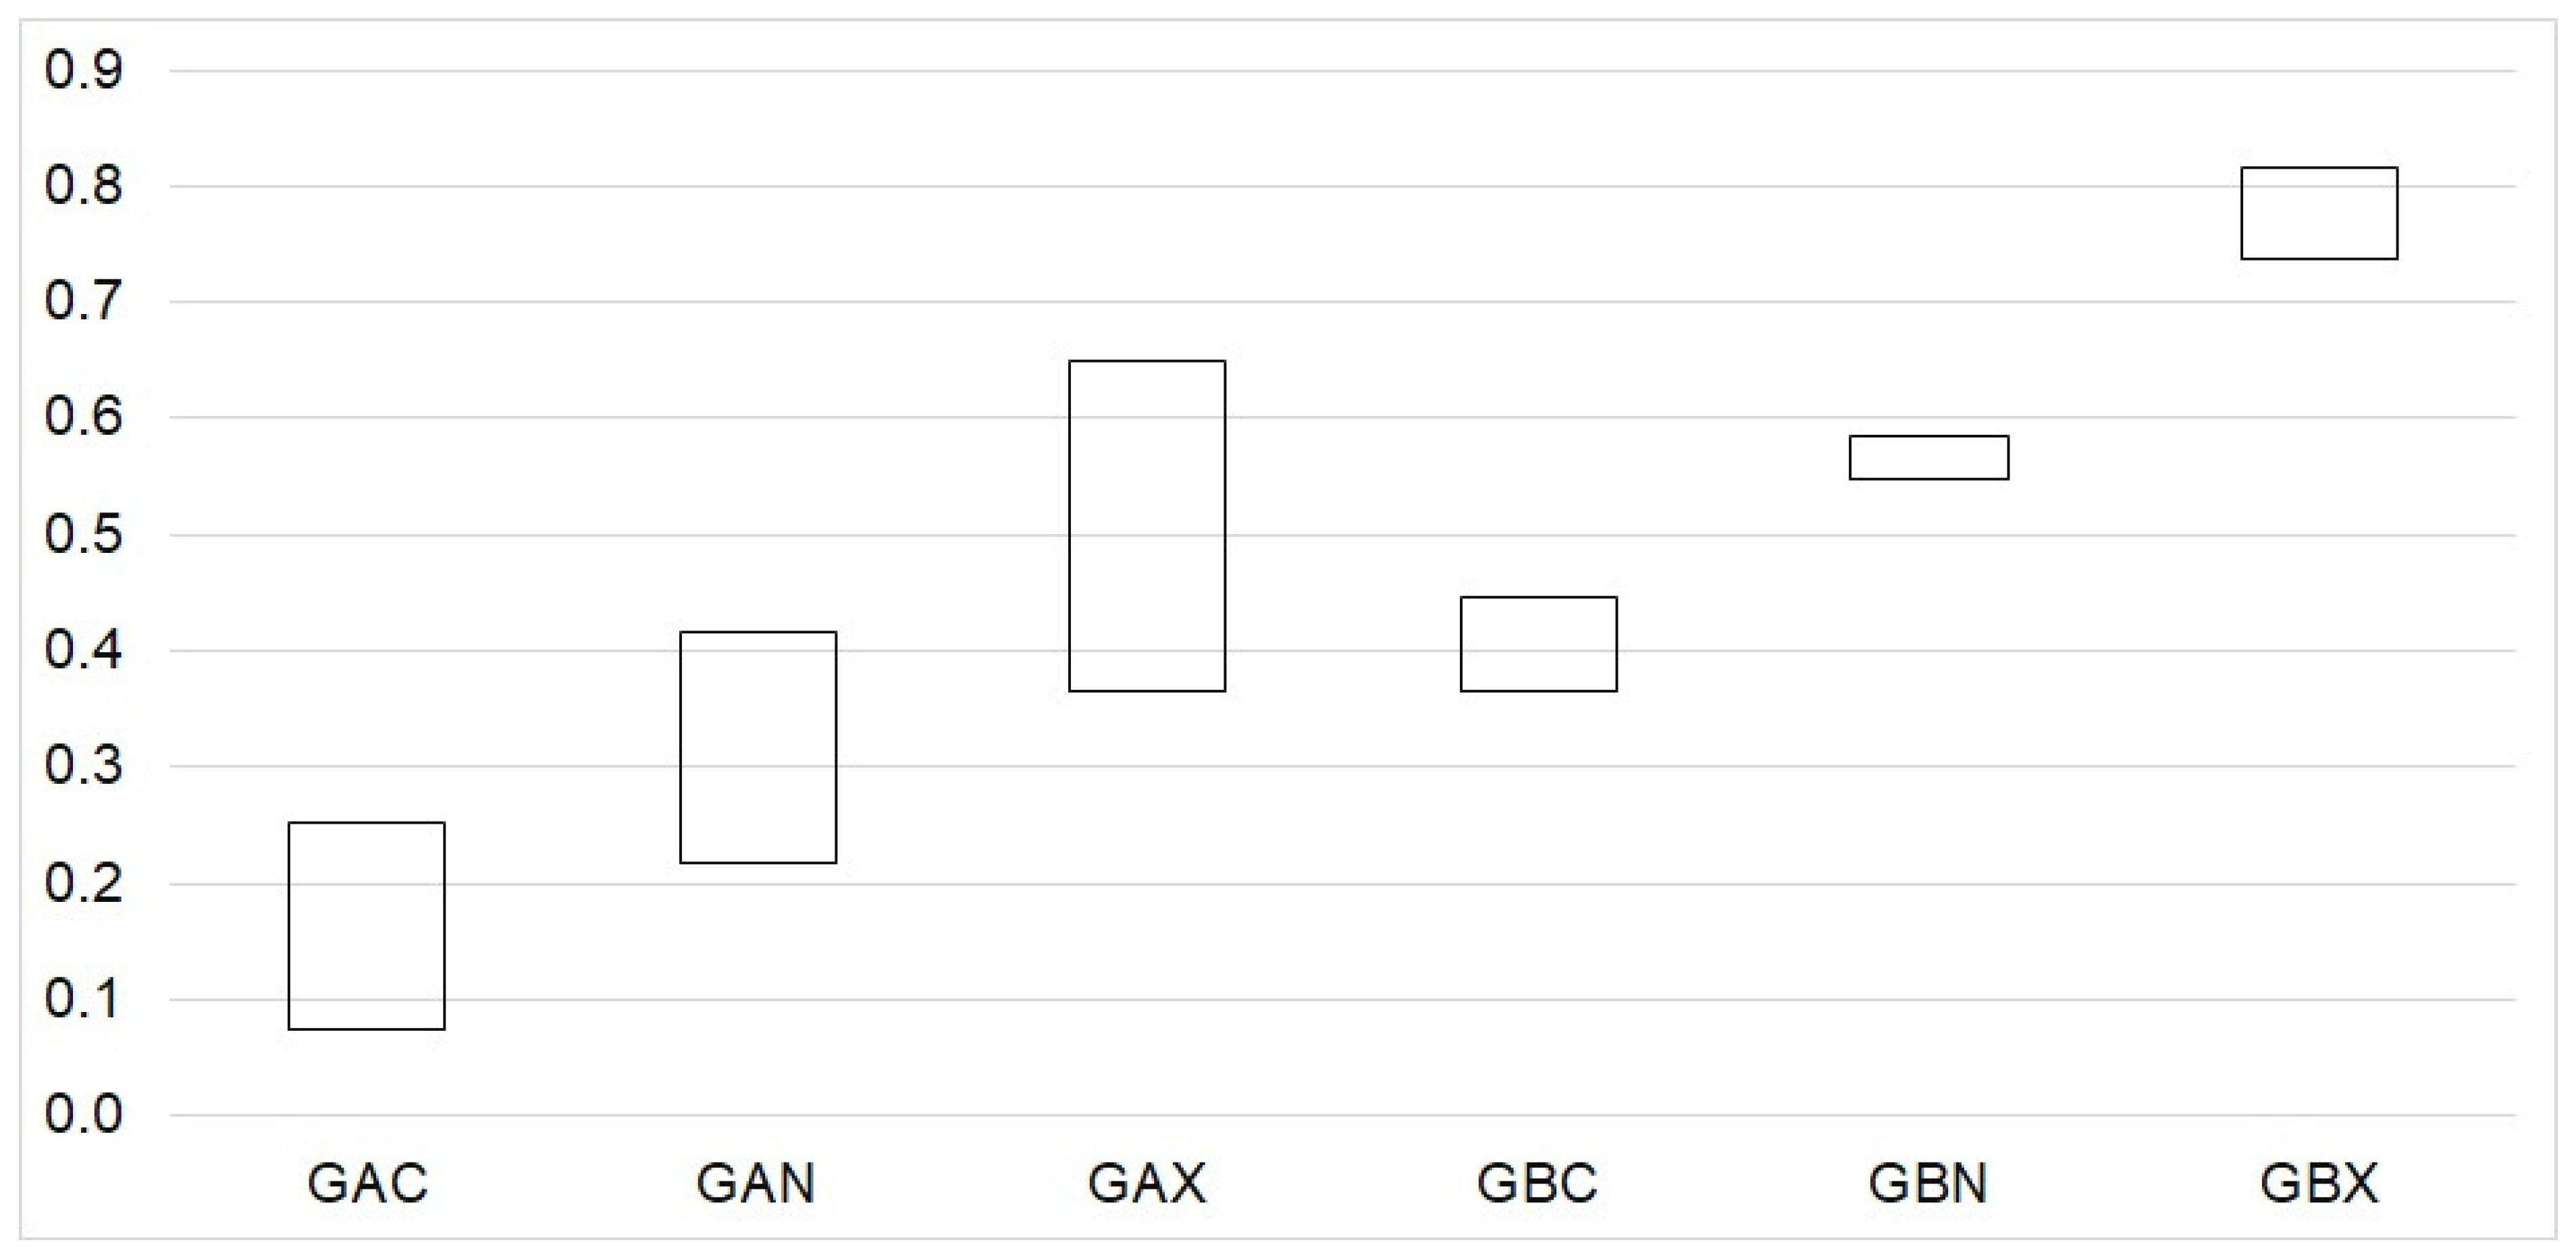
  • Normalize the decision matrix (Four normalization methods have been studied: vector normalization, linear scale transformation (Max–Min) linear scale transformation (Max), and linear scale transformation (Sum));
  • Define the ideal and negative ideal solutions;
  • Estimate the weighted Euclidean distances from ideal and negative ideal solutions;
  • Rank the alternatives based on the performance index (relative closeness to the ideal solution).
To compare the scenarios using the MCDA framework, the weights of the sustainability themes were based on subjective weights using the ranking ordering method [64]. This is because decision-makers are generally more confident about ranking and rating criteria than putting weights on them. Thus, a questionnaire with 10 questions was designed to ascertain the rank–order of sustainability themes, sub-themes, and the associated sustainability indicators, as developed through the indicator development process.

3.1.4. Integrated Framework

Figure 4 provides details on the overall structure of the integrated framework and the flow of information between framework components. As the Figure illustrates, stakeholder engagement underpins each key component of the integrated framework. Stakeholder input dictates the selection of context-specific sustainability themes and indicators that are integrated into the system dynamics model. The structuring of the MCDA framework when choosing themes and assigning weights is similarly based on stakeholders’ preferences. The system dynamics model contains information on the structure and dynamics of the energy system, including energy resources and energy supply, attributes of the transportation system, consumer choice, and various socio-economic data. The dynamic model is used to gain an understanding of changes in the energy system and provides information on, for example, changes in energy demand and supply, energy prices, vehicle fleet mix, GHG emissions, and system costs for consumers, producers, and the government. Some of the output variables from the model directly represent specific sustainability indicators, whereas others need further assessment including expected employment growth, as already mentioned. The model simulations result in the assessment of a system of sustainability indicators which in turn are fed into the MCDA framework. In the MCDA framework, the results are assessed simultaneously with respect to multiple sustainability themes, including cost, GHG emissions, and total employment. Thus, robust development trajectories are simultaneously identified.

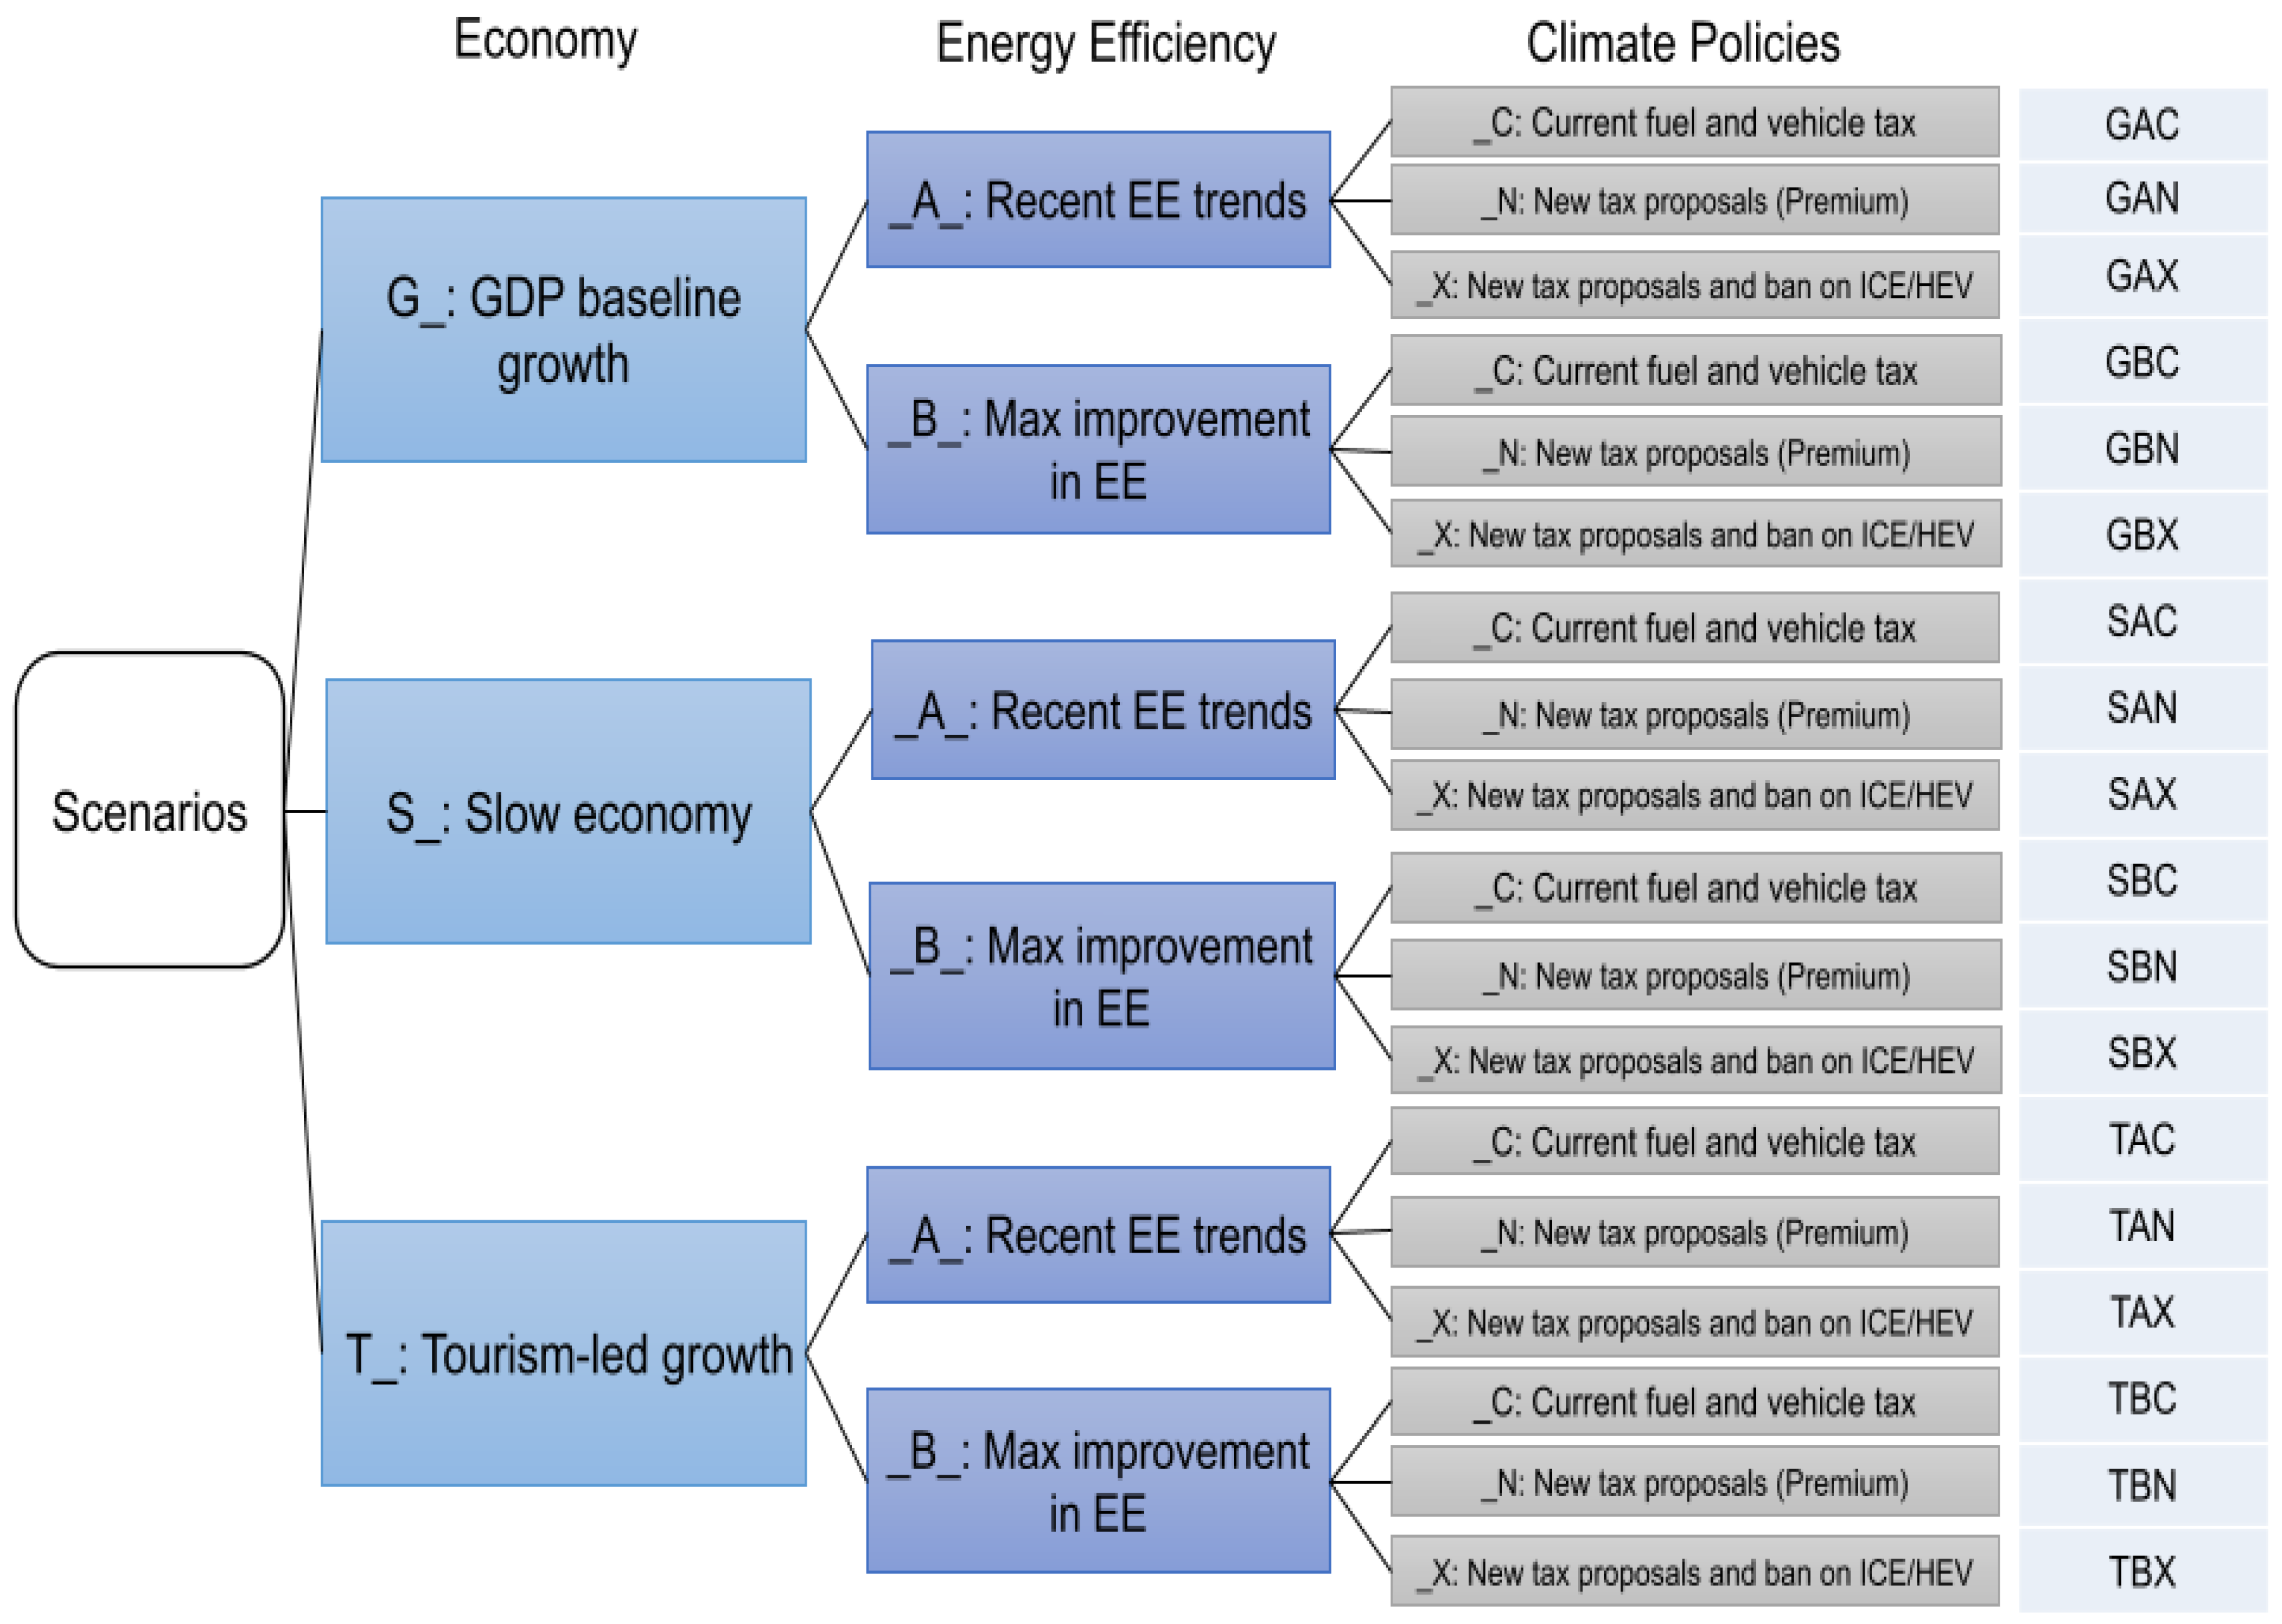
3.2. Scenario Development

The main purpose of scenario analysis is to explore the robustness of different policy bundles across the identified sustainability themes and indicators. Eighteen scenarios, resulting in eighteen alternative development trajectories for the Icelandic energy system, were defined based on combinations of the following three core driving forces of Economic growth and development (three cases); Changes in energy efficiency (two cases); and Climate policy bundles aimed at increasing the share of electric vehicles in the vehicle stock (three policy bundles). This resulted in eighteen scenarios (see Figure 5).
The three cases of annual economic growth are as follows:
  • Baseline: following recent trend: GDP growth: 2.5% until 2030 and 2% after 2030;
  • Slow GDP growth: 1% growth until 2030 and 1.5% after 2030;
  • High GDP growth driven by tourism: 3% growth until 2030 and 2.5% after 2030.
The two alternatives with respect to changes in energy efficiency are based on a report by the National Energy Authority of Iceland [65]:
  • Baseline, based on historical trends in changes in energy efficiency (constant efficiency);
  • Alternative high-efficiency pathway, where the fuel economy of new vehicles will improve by 20% by 2050 for all vehicle types, and the industrial sector, which will see an average efficiency improvement of 1.5% per year (high efficiency).
For climate policies intended to facilitate a shift to electrified transport, three alternative bundles of policies are identified:
  • Baseline bundle, based on the assumption that current regulations on vehicle and fuel taxes will remain unchanged until 2050 [66];
  • Premium policy bundle incorporating enhanced incentives in terms of continued VAT exemptions for the purchase price of BEVs within both light and heavy vehicle fleets for the duration of the simulation period [66];
  • Banning policy bundle, in which the proposed tax scheme is evaluated under a banning condition for the new registration of ICEs and HEVs (with petrol or diesel fuels) from 2025 and, therefore, only the registration of PHEVs and BEVs will be allowed after 2025. Such a banning regulation is part of the Icelandic Government’s Climate Action Plan, albeit set at a later date [67,68].
Combining all variants of the three driving forces (economic growth and development, energy efficiency, and climate policies), the 18 scenarios were generated, as shown in the scenario tree in Figure 5. The three baseline scenarios for each core driving force, when put together, create the overall business-as-usual (BAU) scenario to which all others are compared (called GAC in the scenario tree below). Each scenario is named using three letters, as shown on the right in Figure 5:
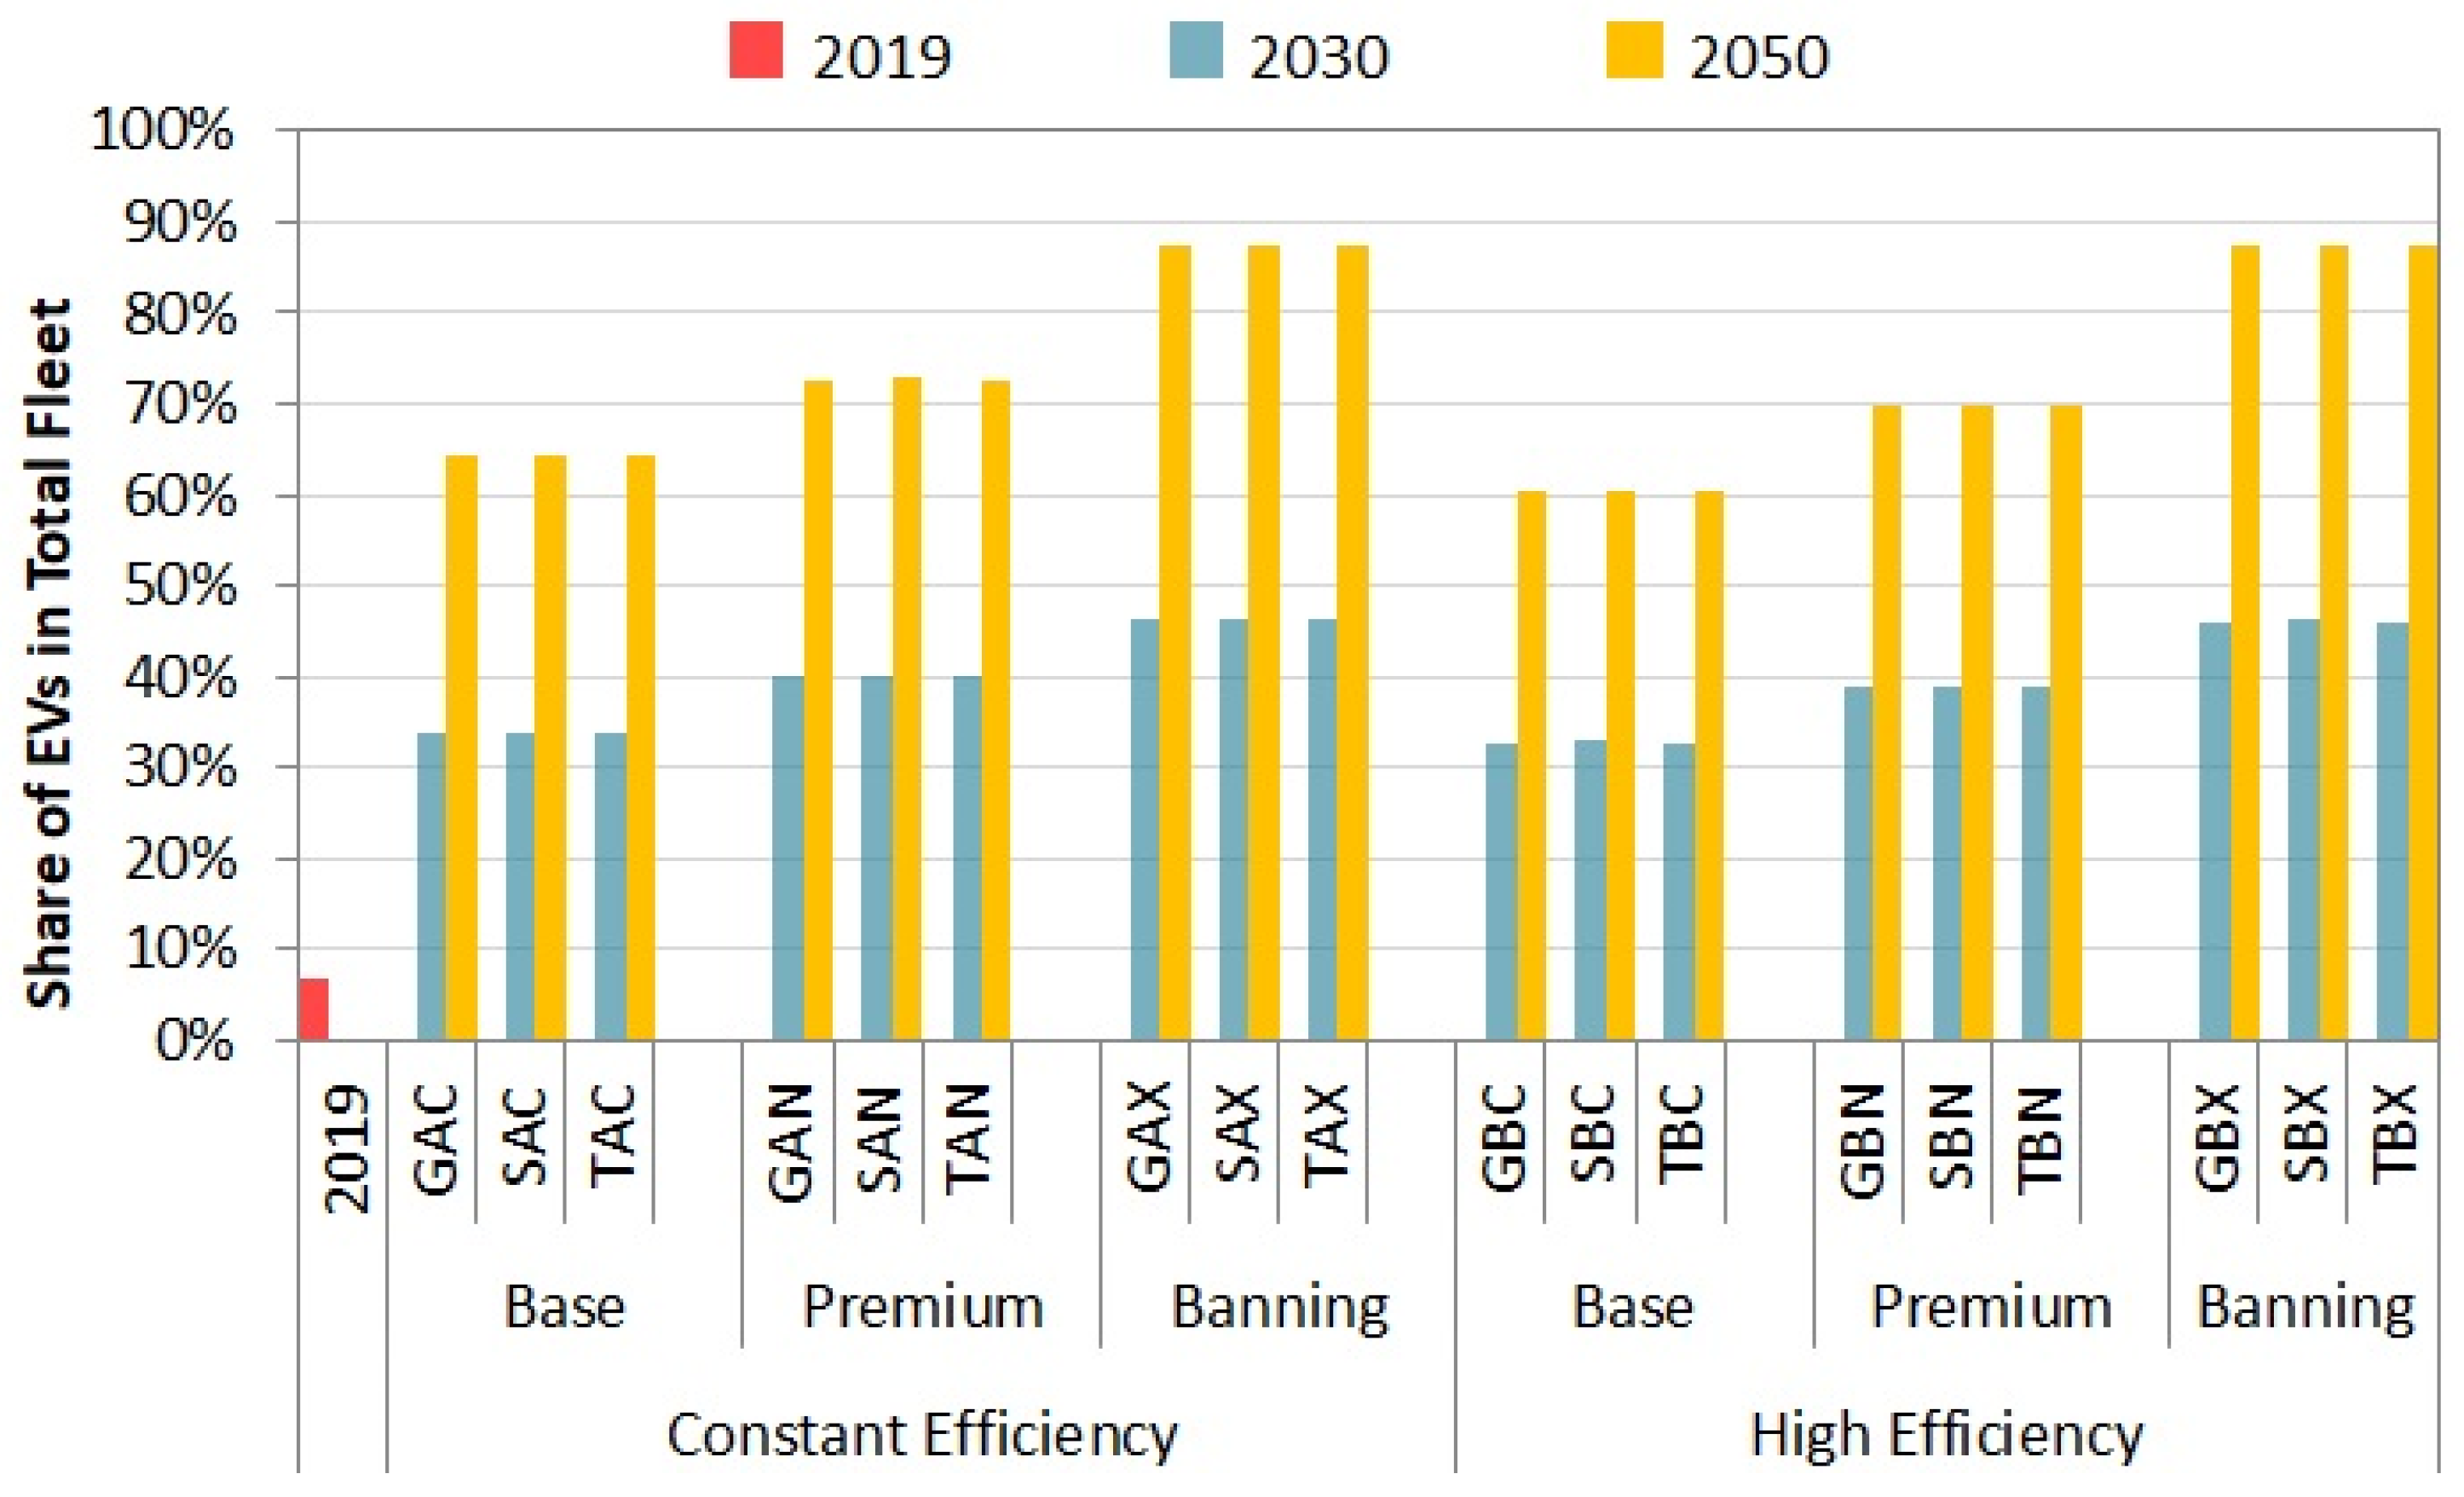
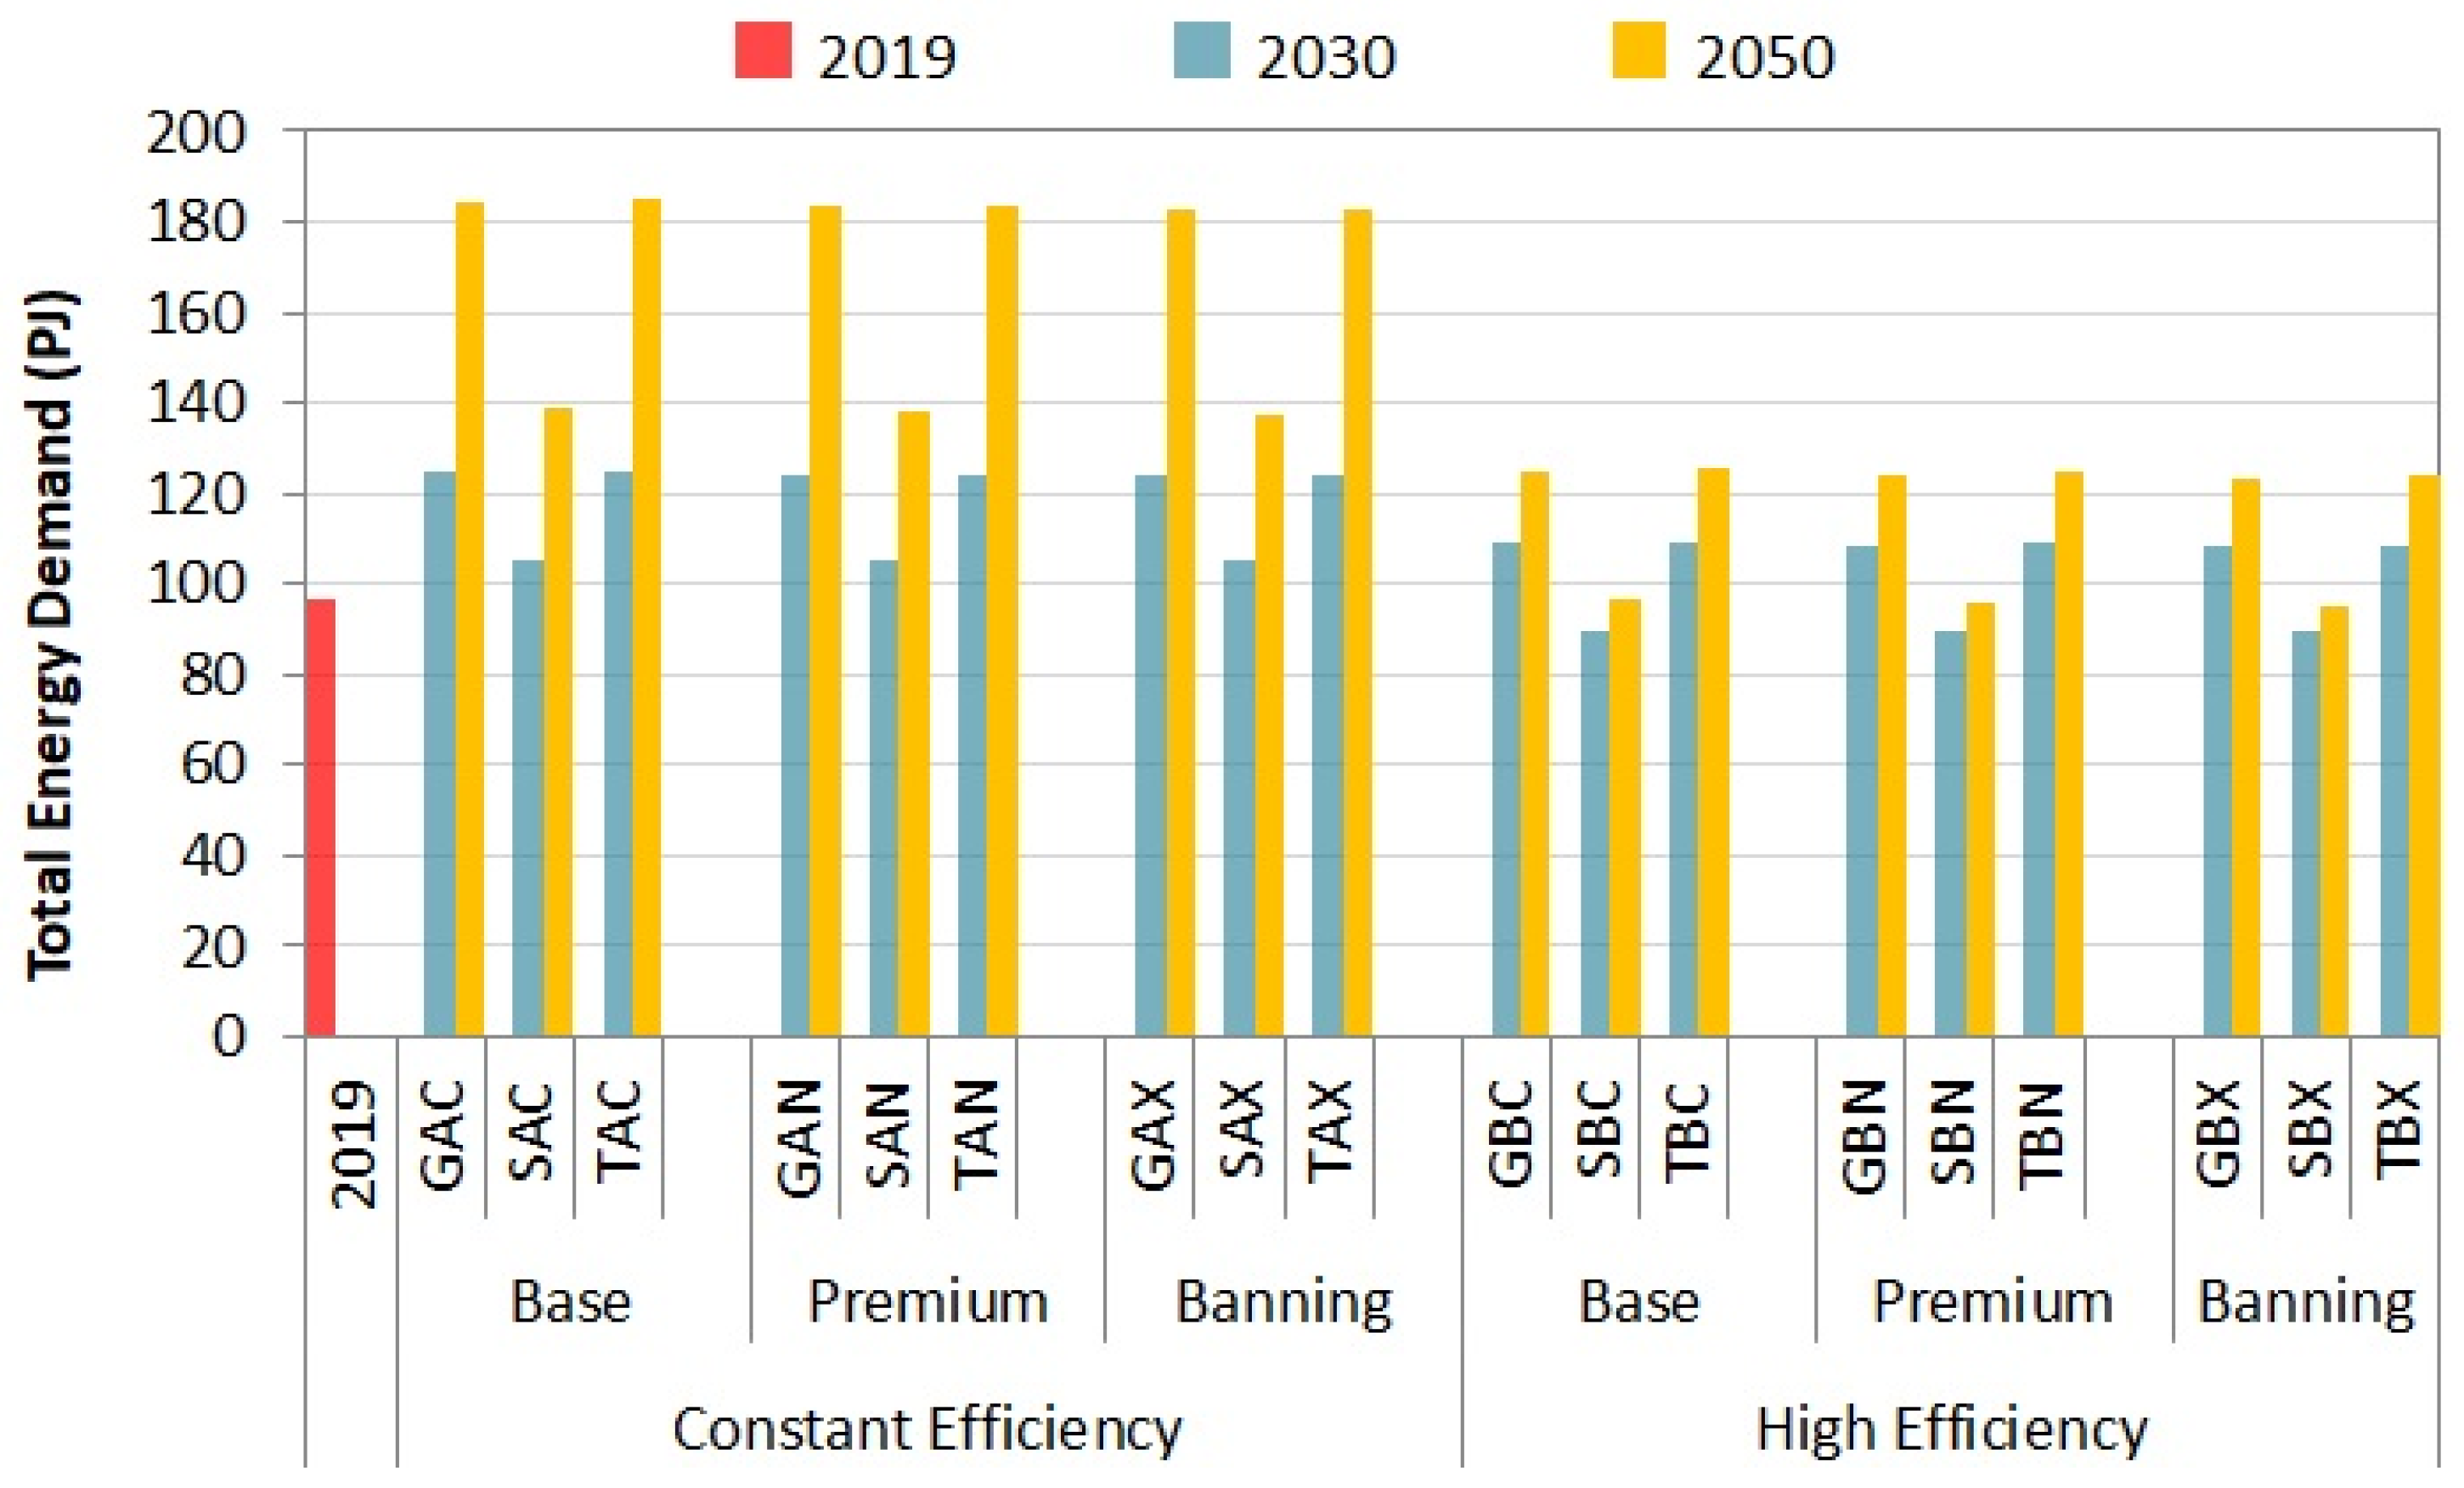
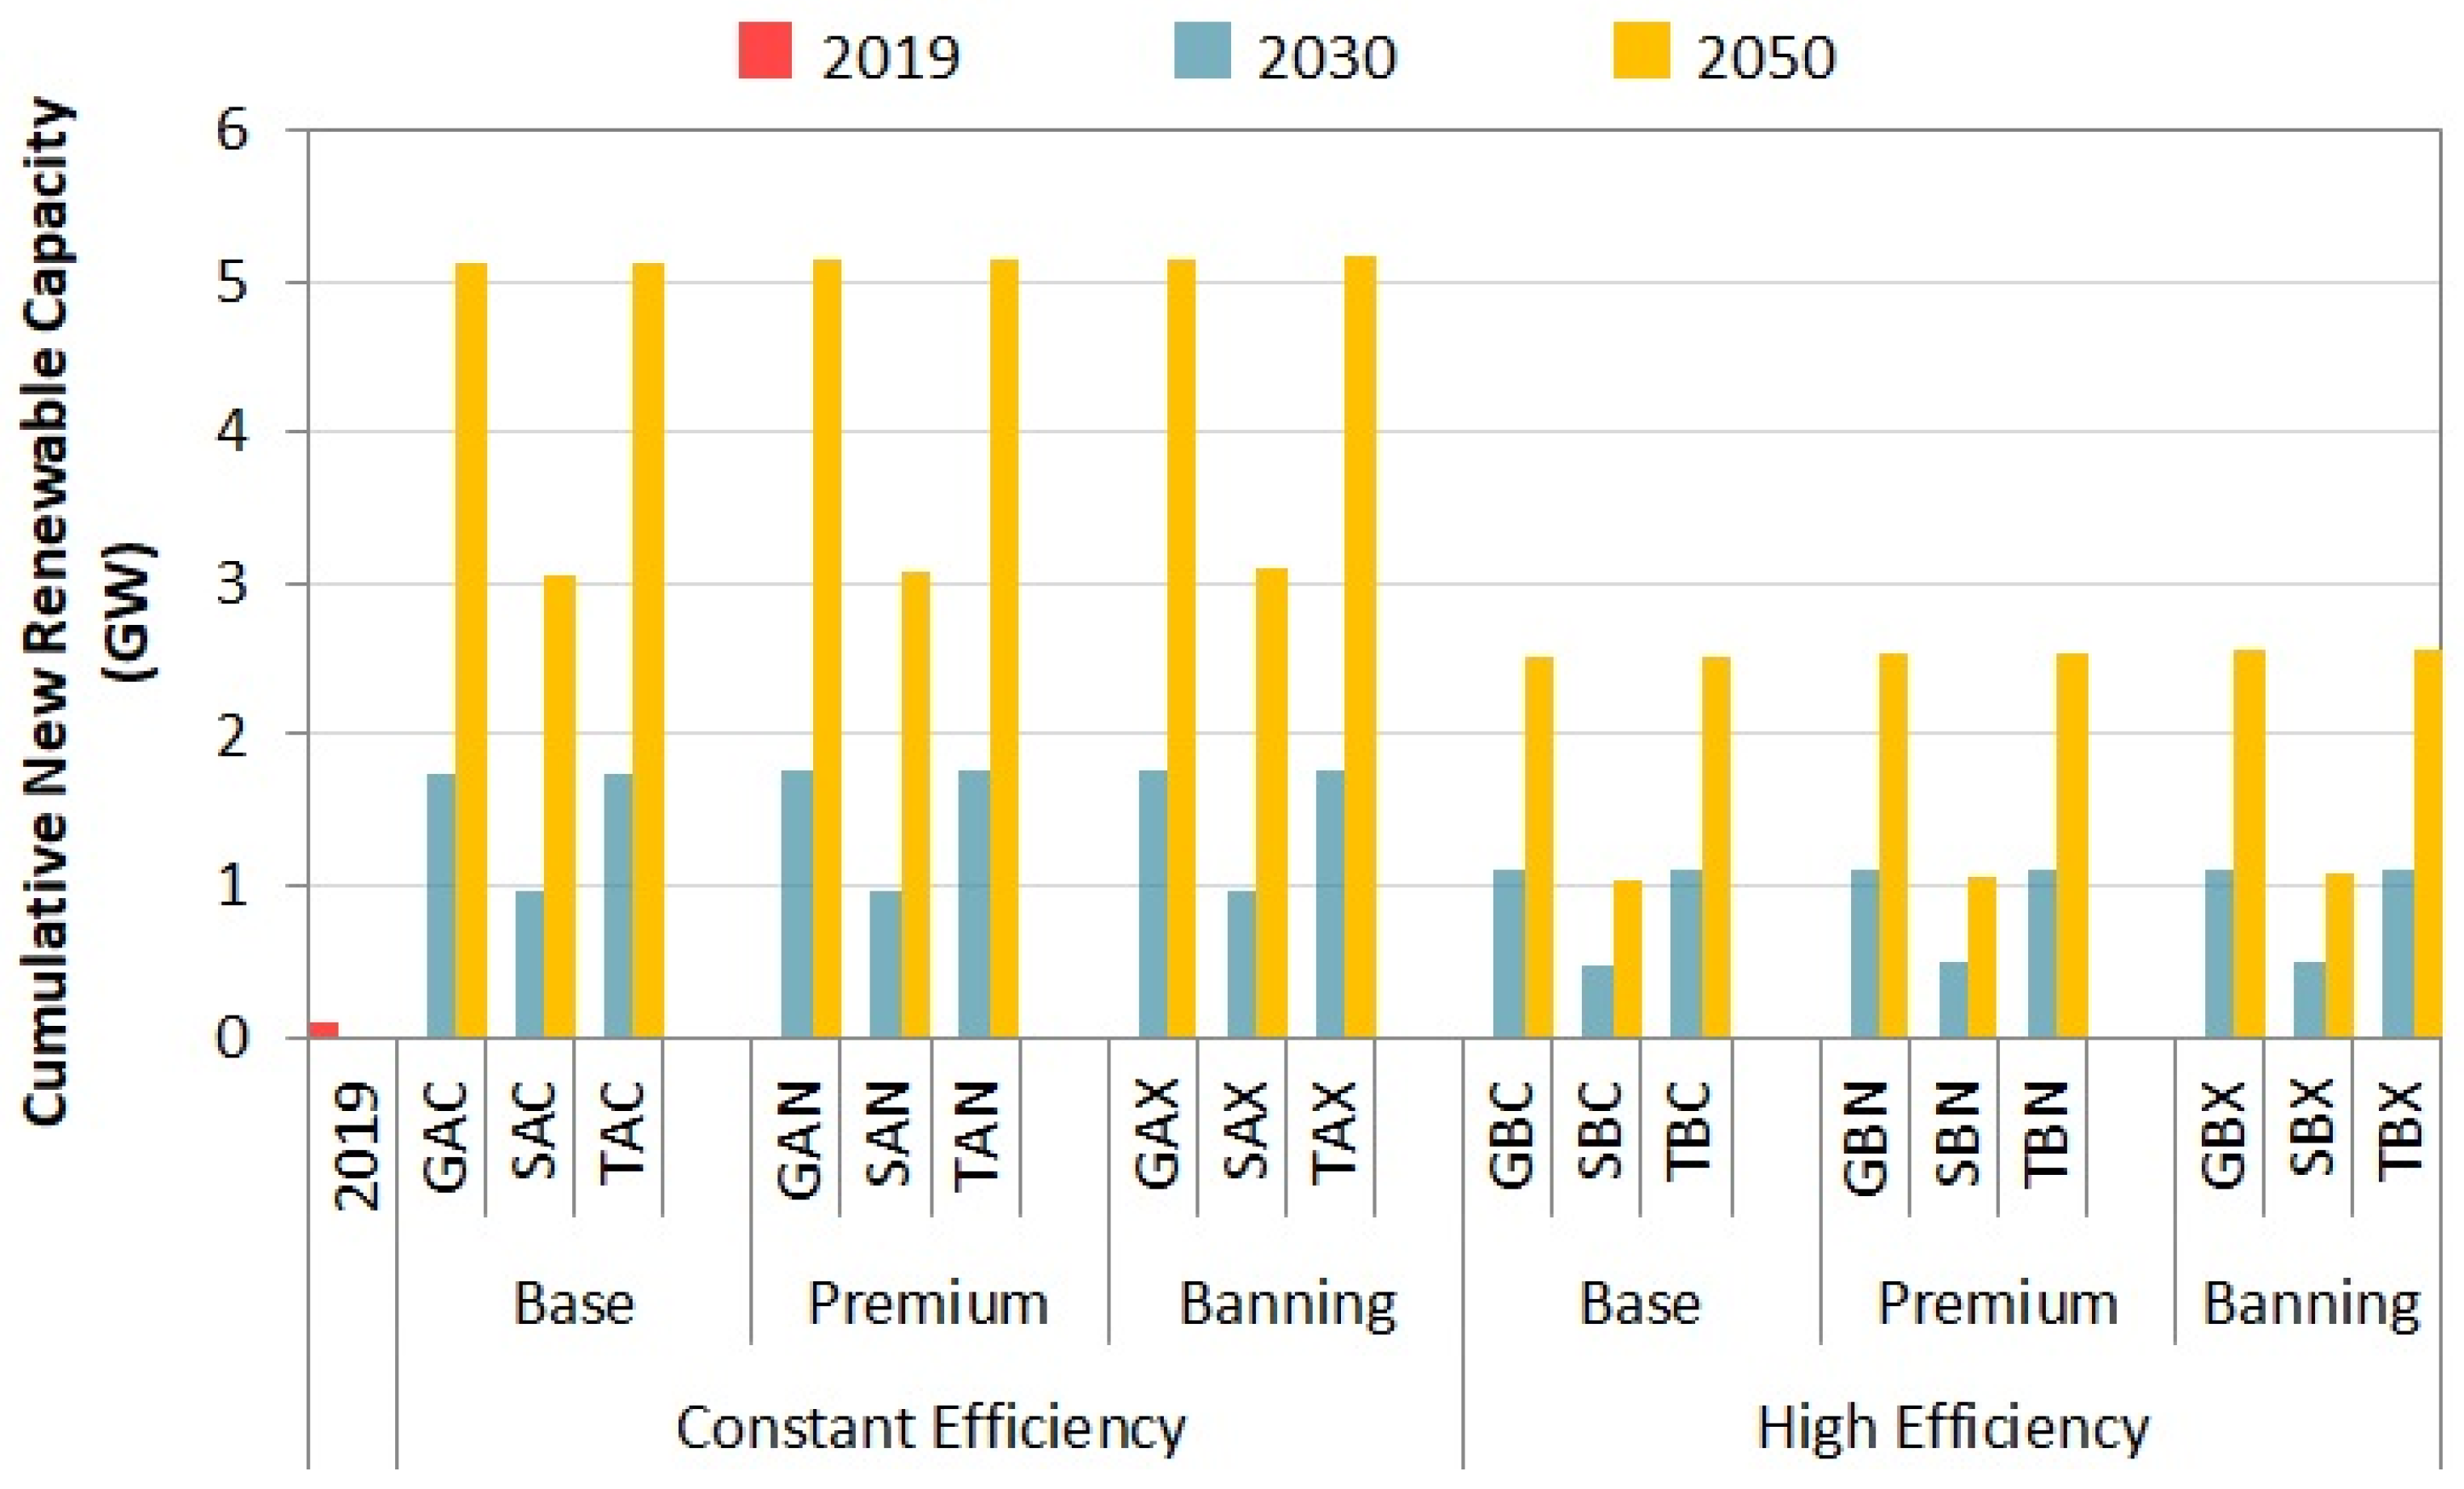
  • G__: BAU GDP Growth 2.5% until 2025, 2% until 2050
  • S__: Slow GDP growth 1% until 2025, 1.5% until 2050
  • T__: High tourism led GDP growth 3% until 2025, 2.5% until 2050
  • _A_: BAU constant energy efficiency based on current trends
  • _B_: Max improvements in energy efficiency
  • __C: BAU Current fuel and vehicle tax
  • __N: New tax proposals on fuel and vehicles
  • __X: New tax proposals and ban on ICE/HEV from 2025

4. Results

The findings contain the list of applicable themes, subthemes, and sustainability indicators selected through the stakeholder engagement process (Section 4.1); selected results from the energy systems model (Section 4.2); sustainability implications assessed from indicators (Section 4.3); and the MCDA results that reveal the most desirable policies and pathway (Section 4.4).

4.1. Sustainablity Themes, Subthemes, and Indiators

The iterative stakeholder engagement approach described in Section 3.1.1. led to the identification of SED themes for Iceland and to the selection of a broad set of indicators, as presented in Gunnarsdóttir et al. [52]. For this study, a focus was placed on themes, sub-themes, and indicators that stakeholders considered to affect or be affected by the decarbonization of the road transport sector in Iceland (see Table 1).

4.2. Energy Systems Development

The aim of the simulations was to assess the implications of the three policy bundles across the different cases, resulting in 18 trajectories. This section depicts how the energy system developed in the different trajectories. All simulation results in 2030 and 2050 were compared to actual values in 2019, the last year before the enactment of the current Climate Action Plan.
Figure 6 shows the market share of EVs (BEV + PHEV). In 2030, there are small differences between the shares of EVs under different trajectories, ranging from 33% in Base-High Efficiency cases (i.e., GBC, SBC, TBC) to 47% in Banning-Constant Efficiency cases (i.e., GAX, SAX, TAX). The contrast between the trajectories with and without efficiency improvements is expected to increase by 2050, when the share of EVs under the banning scheme will be noticeably higher, approaching 90% (i.e., _AX and _BX cases).
Figure 7 compares the total energy demand in all end-use sectors, excluding the direct use of geothermal energy for house heating. Energy demand patterns, together with energy prices, were used to determine household energy costs and fuel tax expenditures (See Figure A1 and Figure A2 in Appendix A). The main drivers of total energy demand are population growth, GDP growth, and improvements in energy efficiency. The largest changes occur in industrial electricity demand with constant efficiency improvement, which is exogenously driven by GDP growth. The trajectories with slow GDP growth (i.e., S_C, S_N, and S_X) exhibit the lowest levels of energy demand.
The industrial sector accounts for 62–70% of the total energy demand by 2030, and 62–79% by 2050, with nearly all being renewable electricity. In trajectories with slow GDP growth, the share of fossil fuels in the total energy demand, and in the primary energy supply, is higher (see Figure 8). By 2050, the share of fossil fuels in primary energy supply in the ‘constant efficiency’ case will range from 10% to 14%. In the ‘high efficiency’ case, this share is between 13-17%. The reason for the significant share of fossil fuels, despite the higher percentage of electric vehicles, is the continued use of plug-in hybrids.
Figure 9 shows the additional cumulative new capacity of renewable electricity generation technologies (hydro, geothermal, and wind). This shows that an increase in the use of electric vehicles in Iceland will not markedly increase the demand for electricity. To decide on new capacity installation, the gap between the forecasted demand and total existing production capacity was calculated. Then, the share of future plants to meet the excess demand was estimated as a function of production cost. The future costs of hydro and geothermal resources were modeled using supply curves in which the unit generation cost was expected to increase with cumulative installed capacities. Figure 10 reflects the average unit generation cost according to different trajectories. High energy efficiency improvement led to at least a 20% reduction in the cost of electricity generation by 2050 due to reduced demand for new resource utilization. Such efficiency improvement lowers the cumulative new renewable capacity to half in 2050. An increase in the use of electric vehicles does not affect the average unit generation cost, as most of the electricity demand in Iceland comes from the industrial sector; thus, the uptake of electric vehicles has a minor impact on the overall electricity demand.

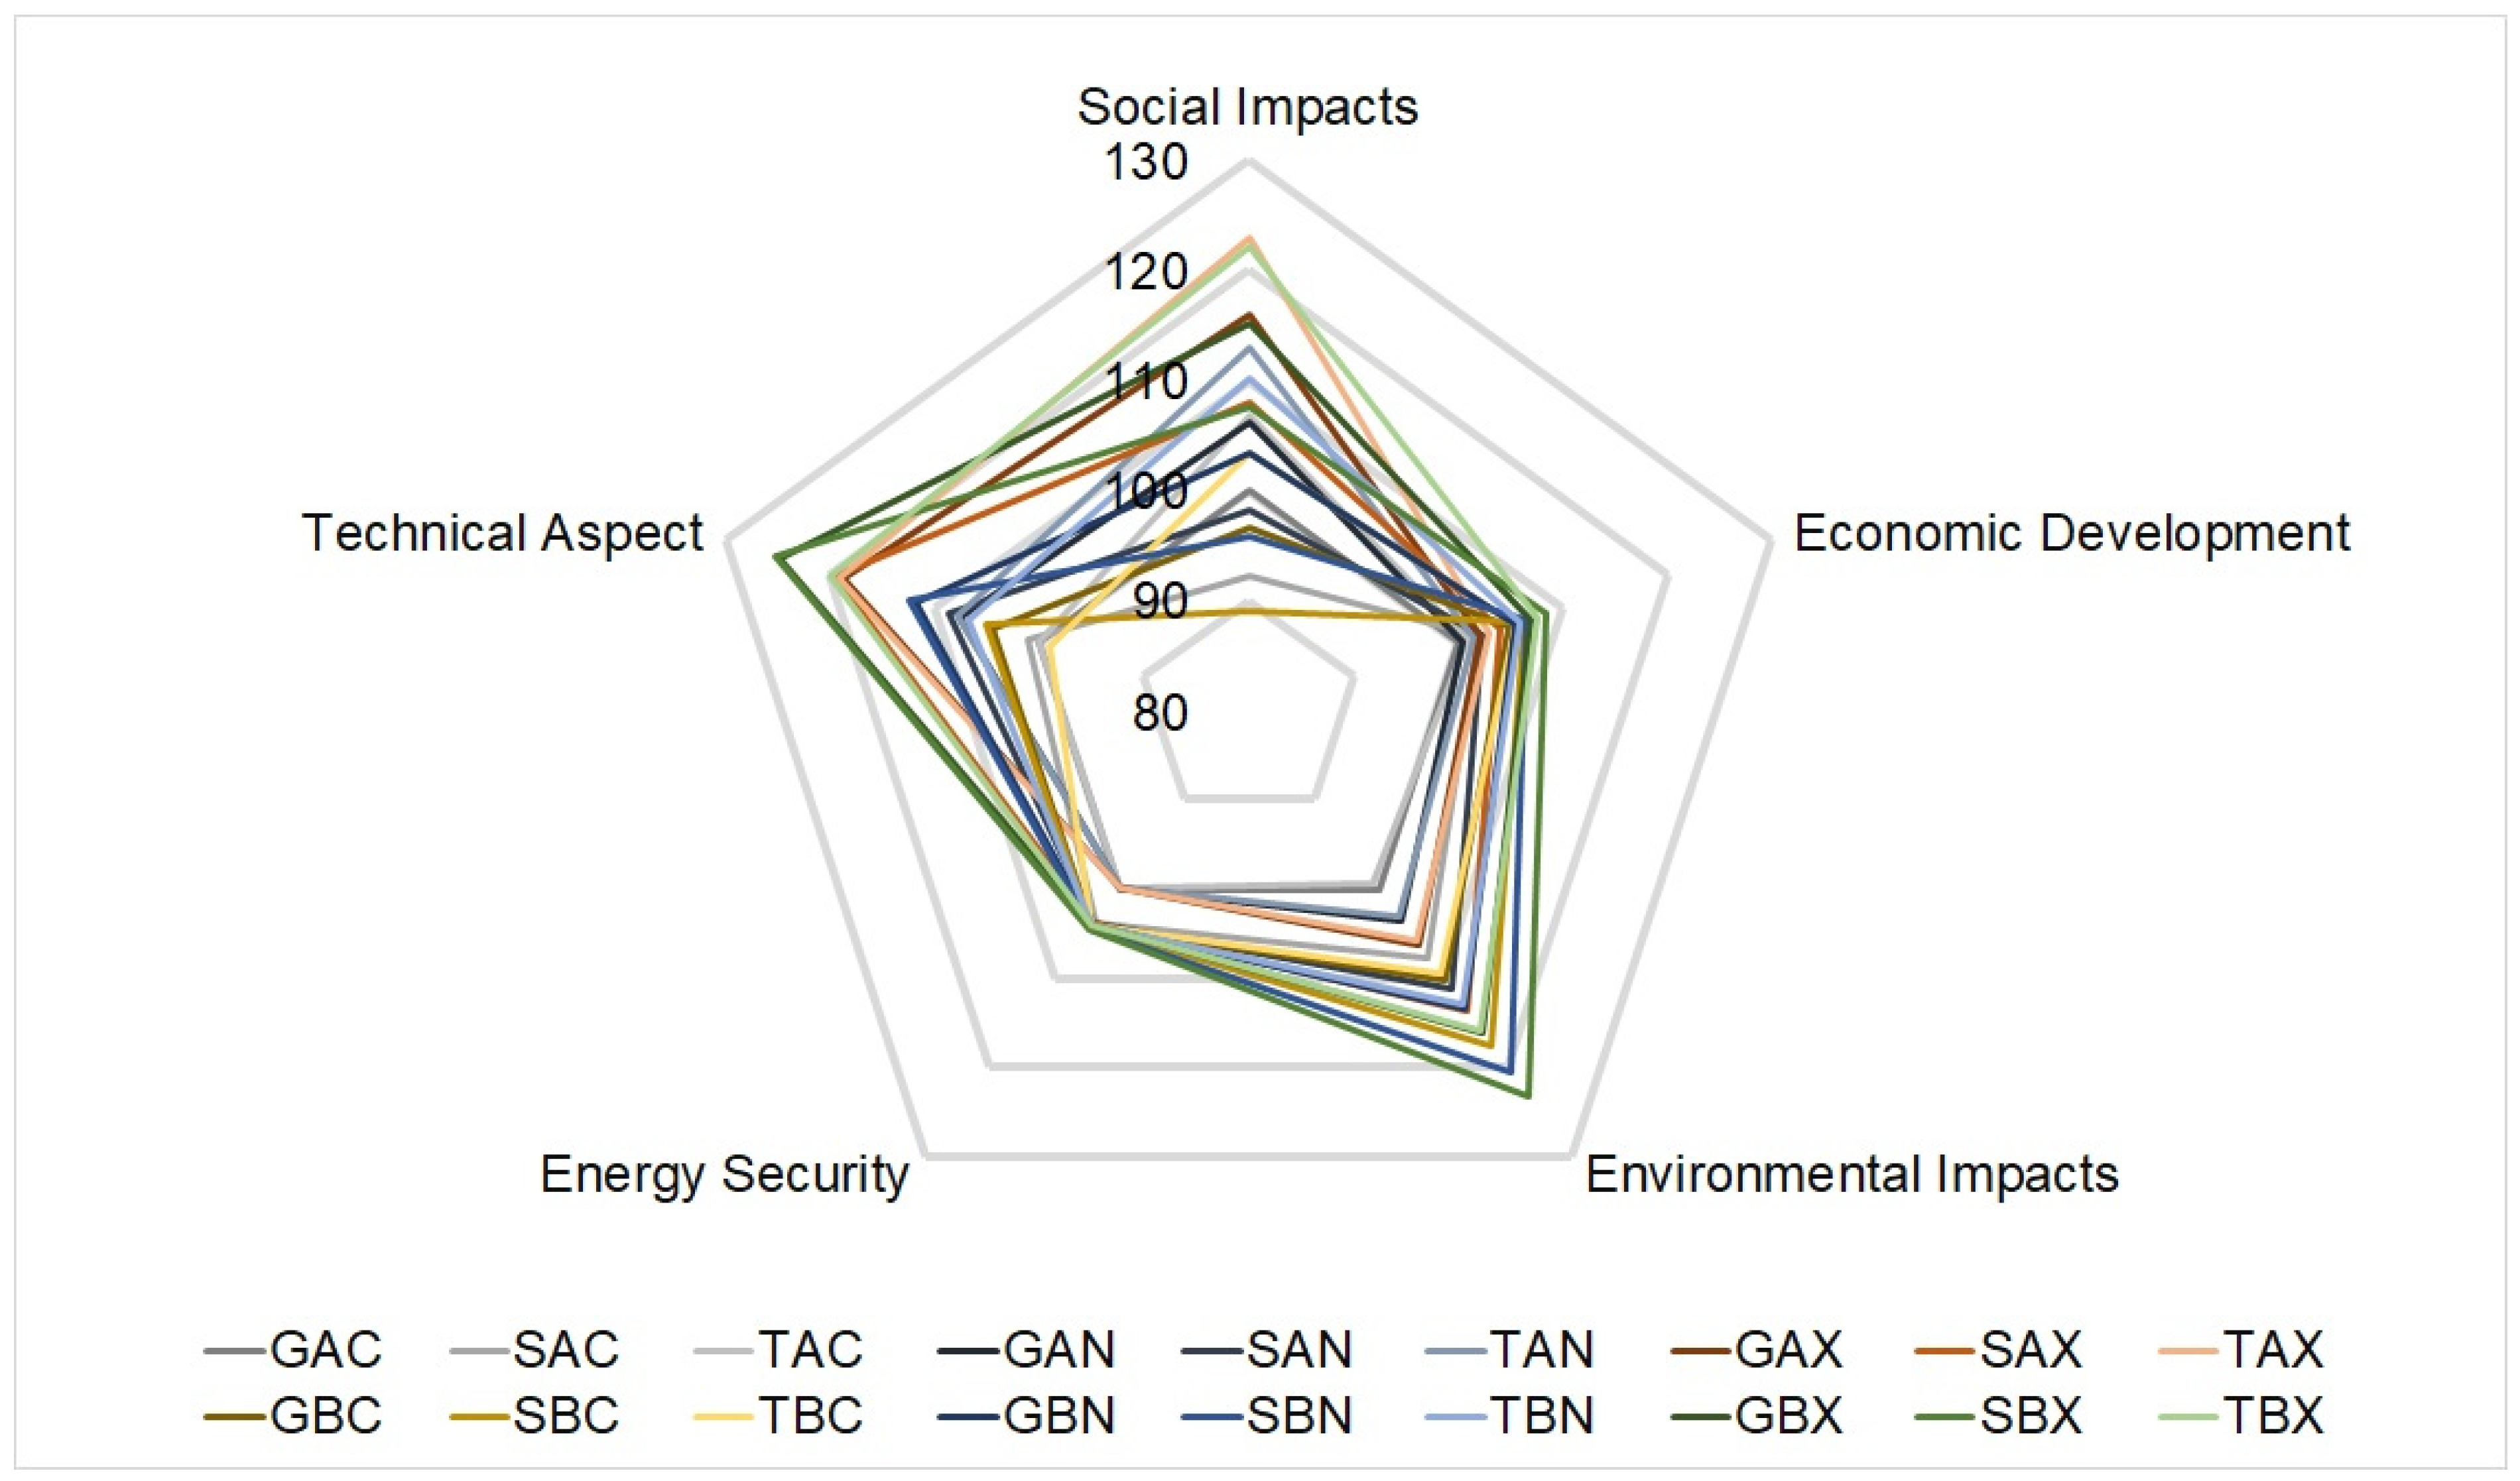
4.3. Comparing Sustainability Impacts
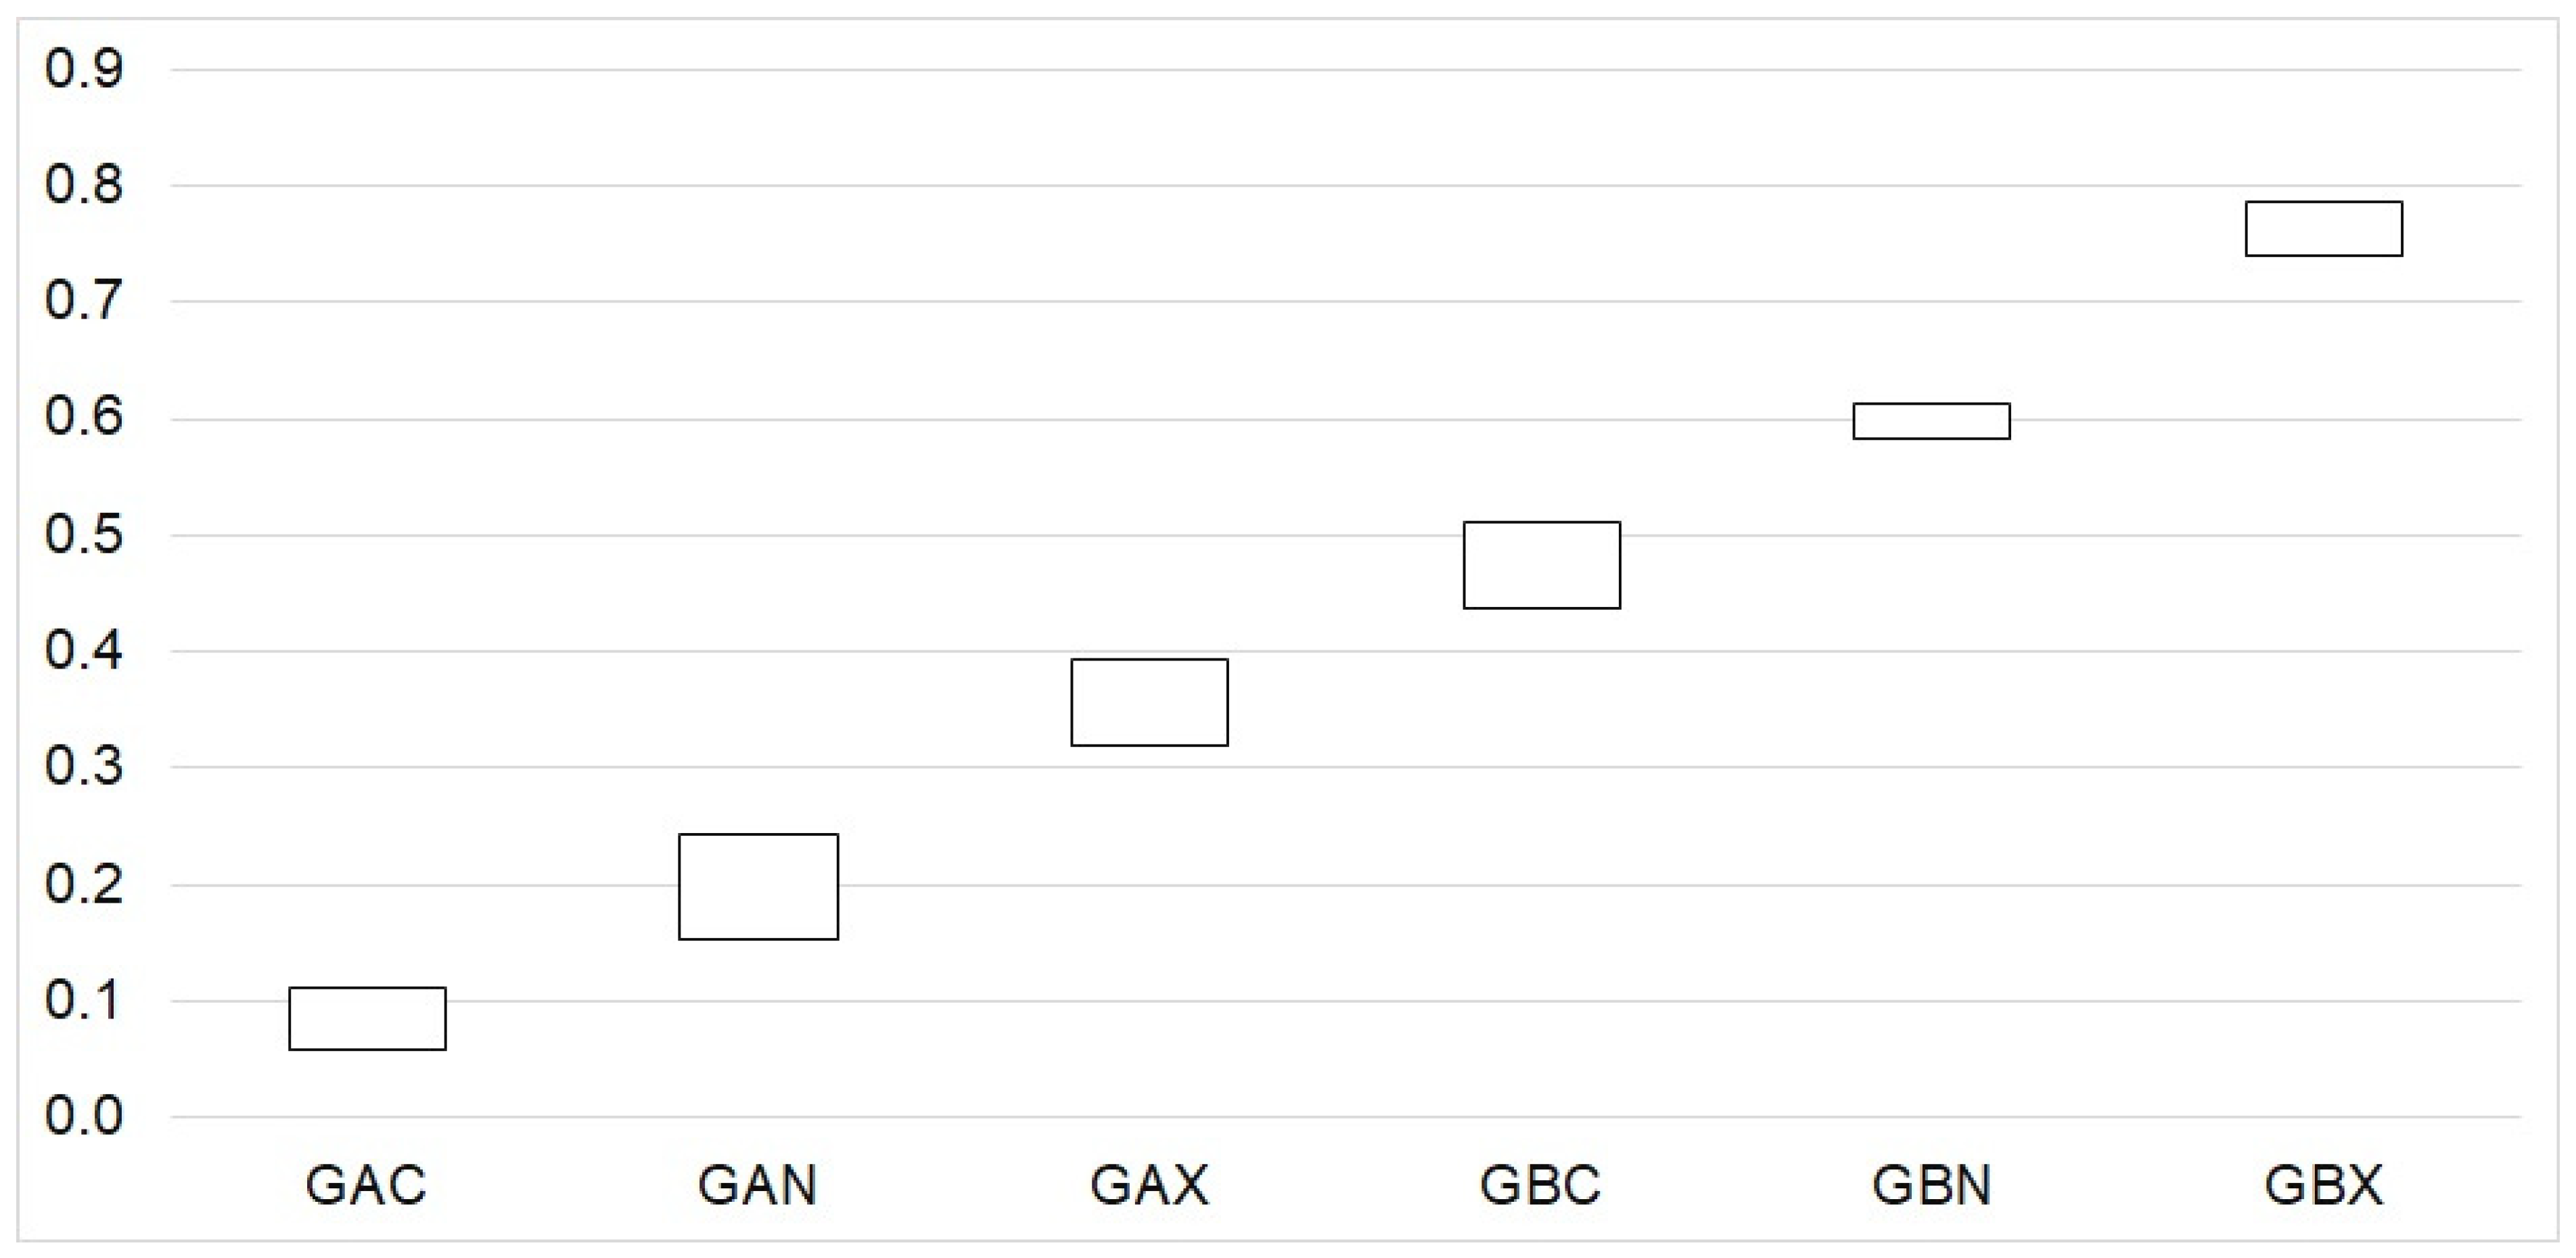
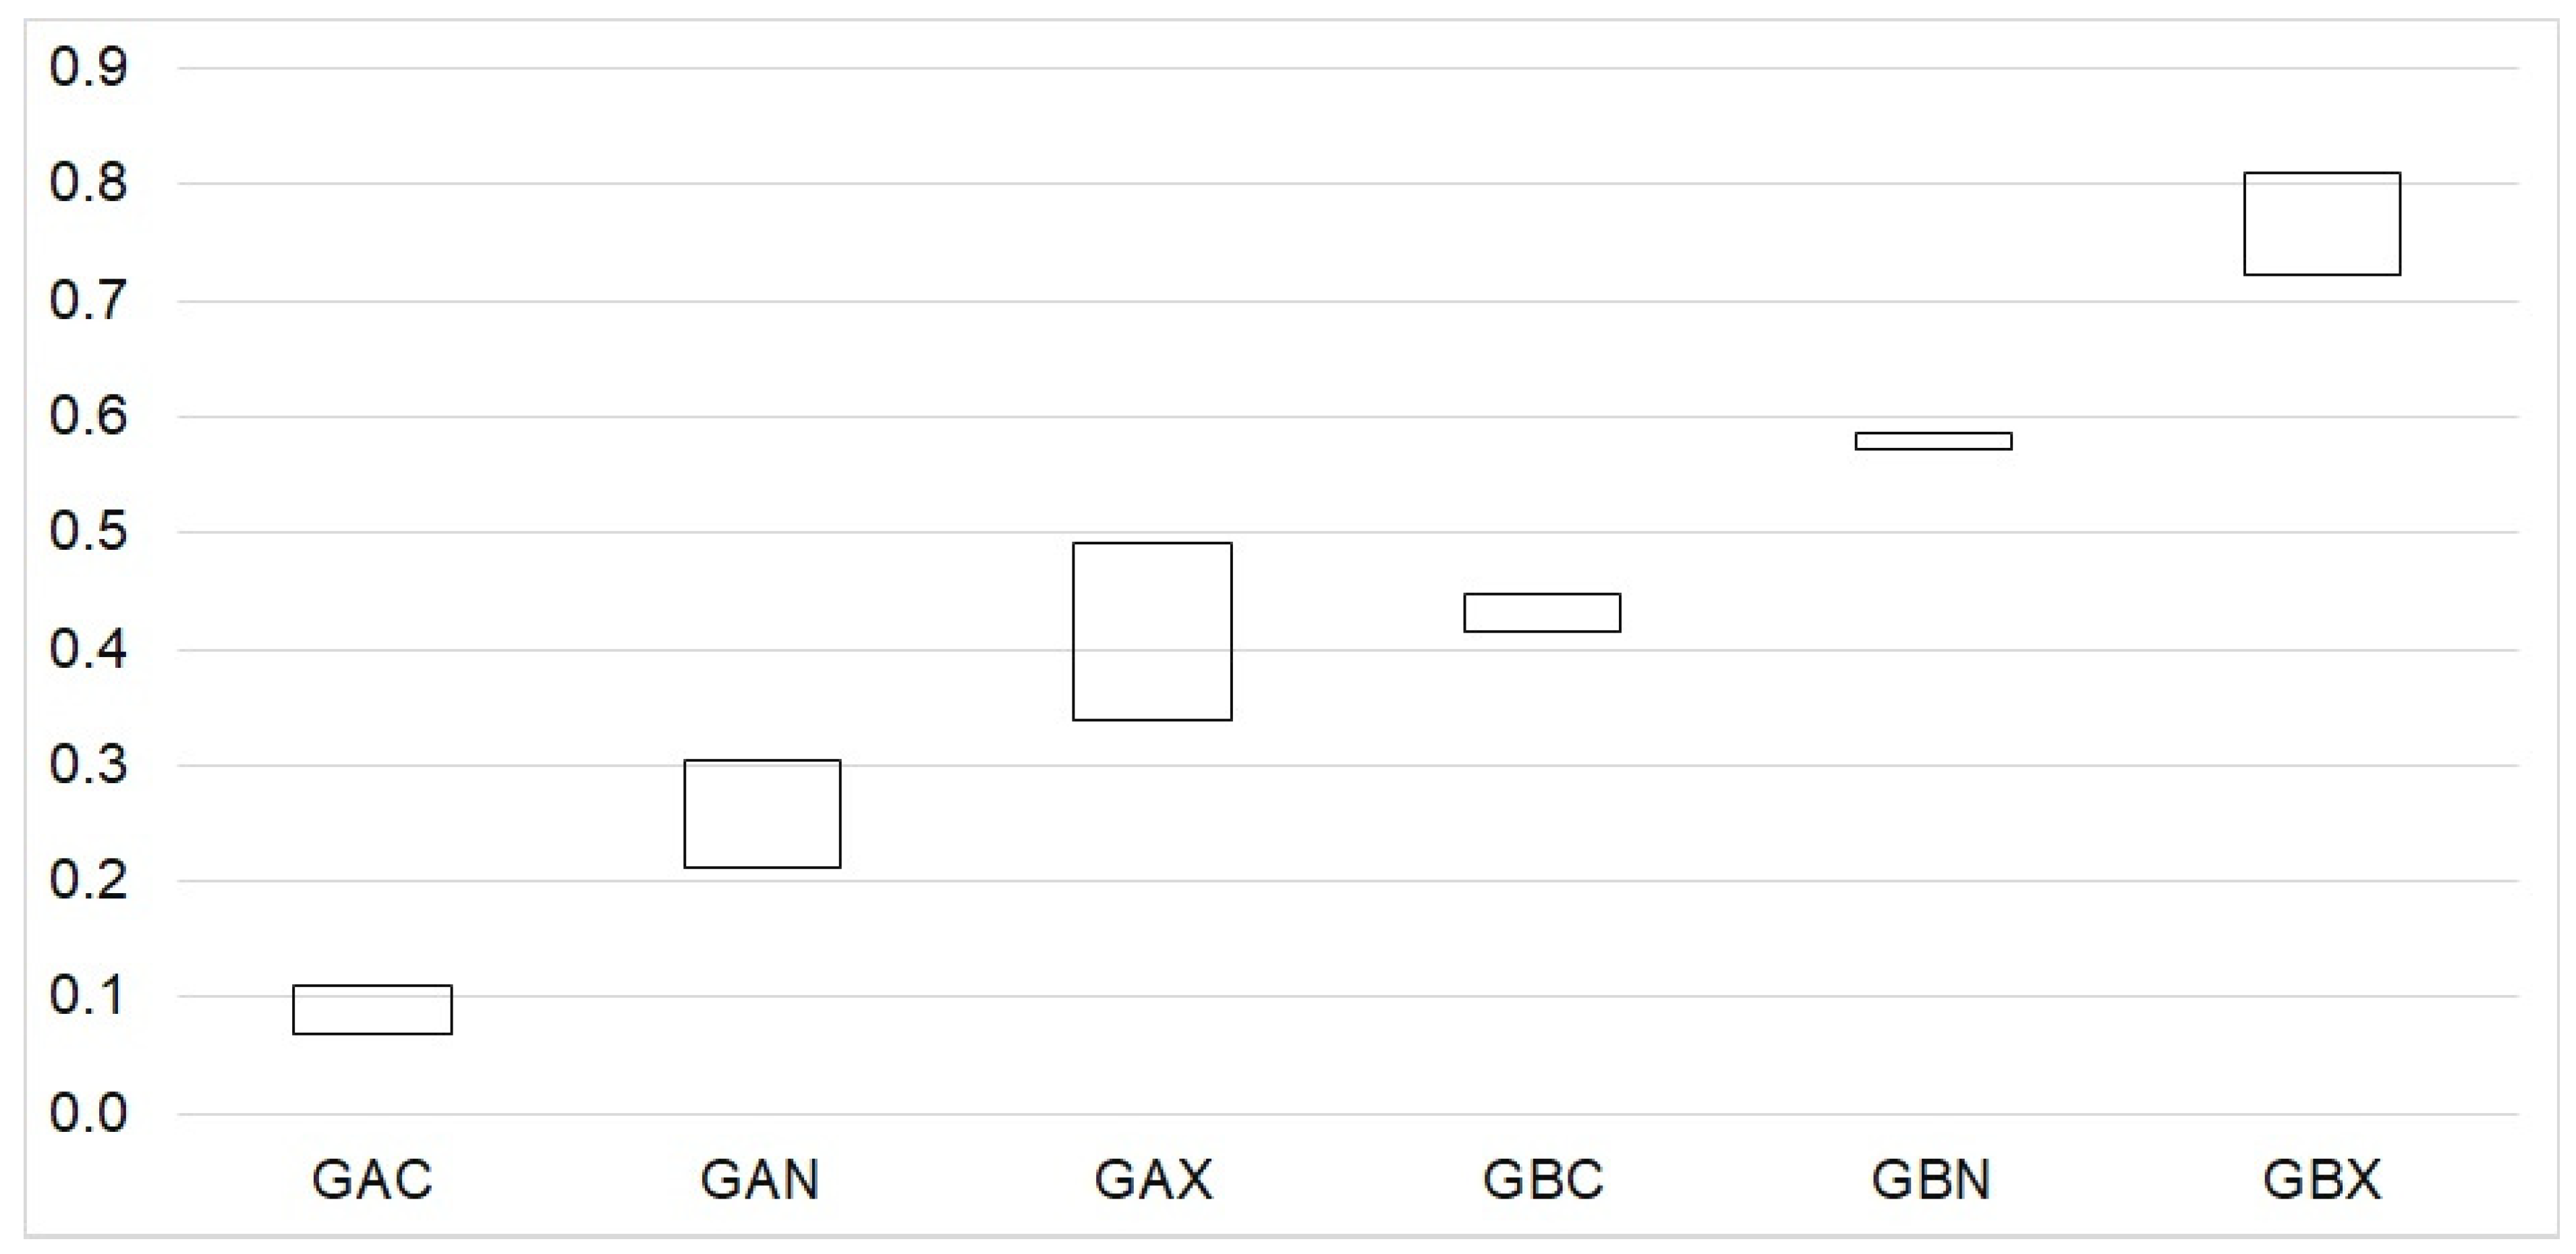
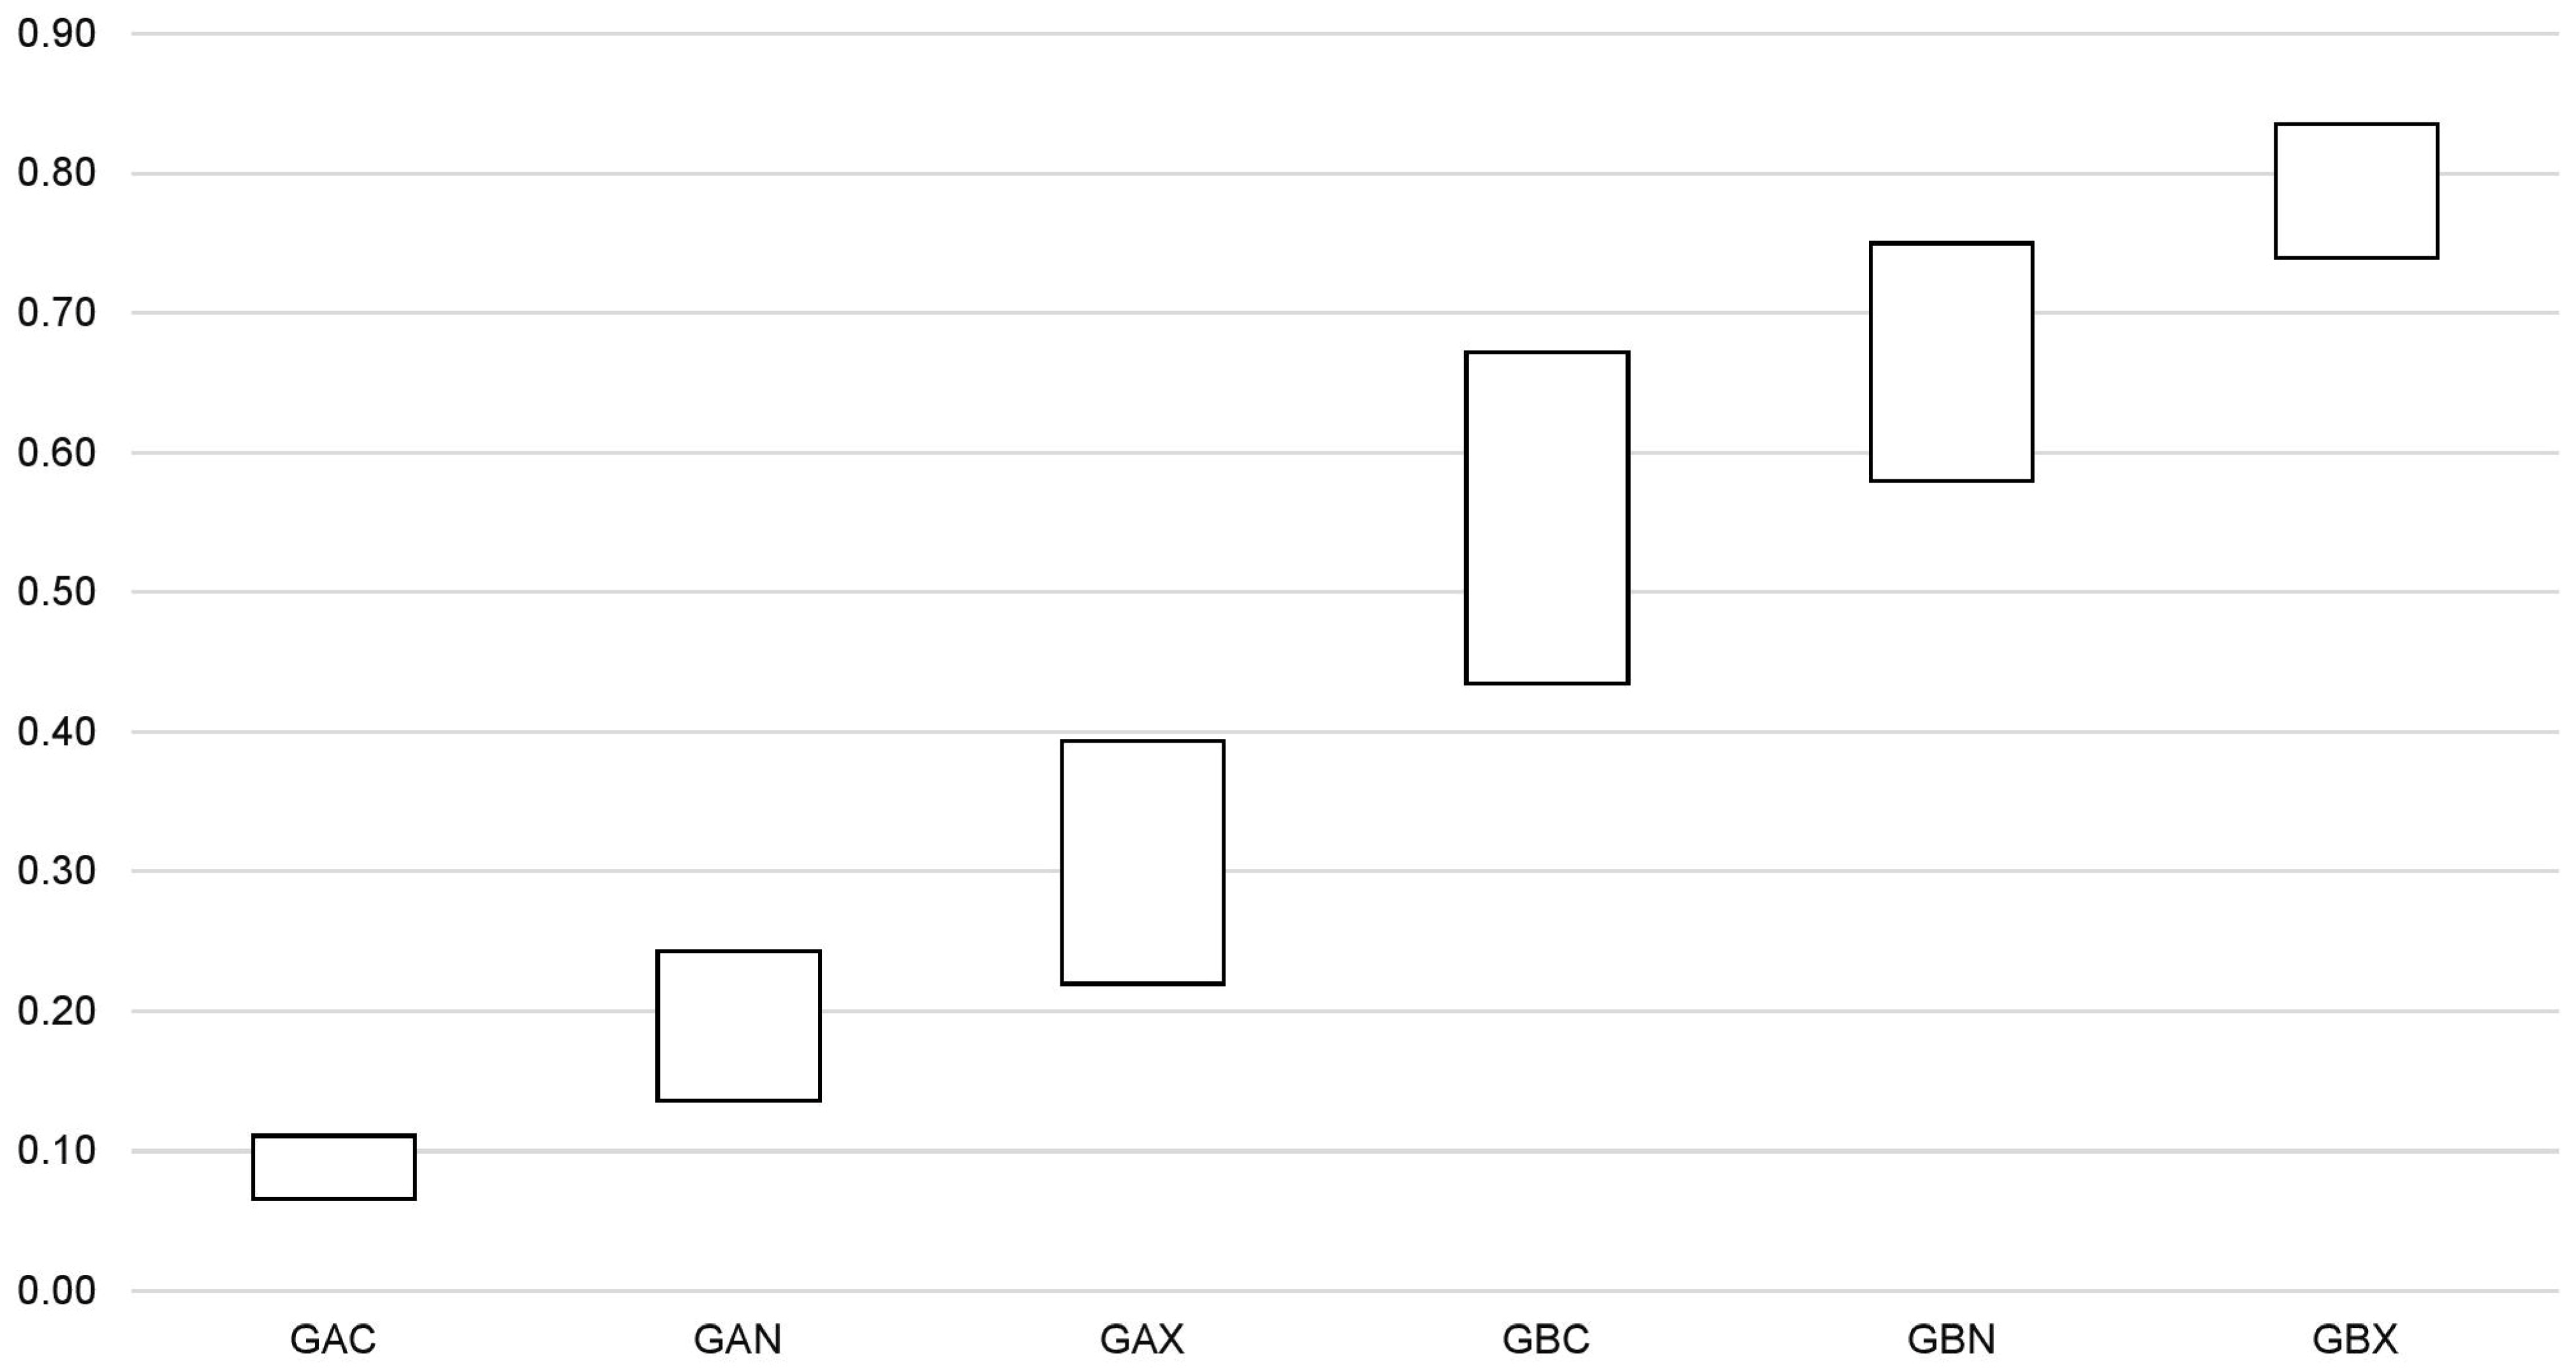
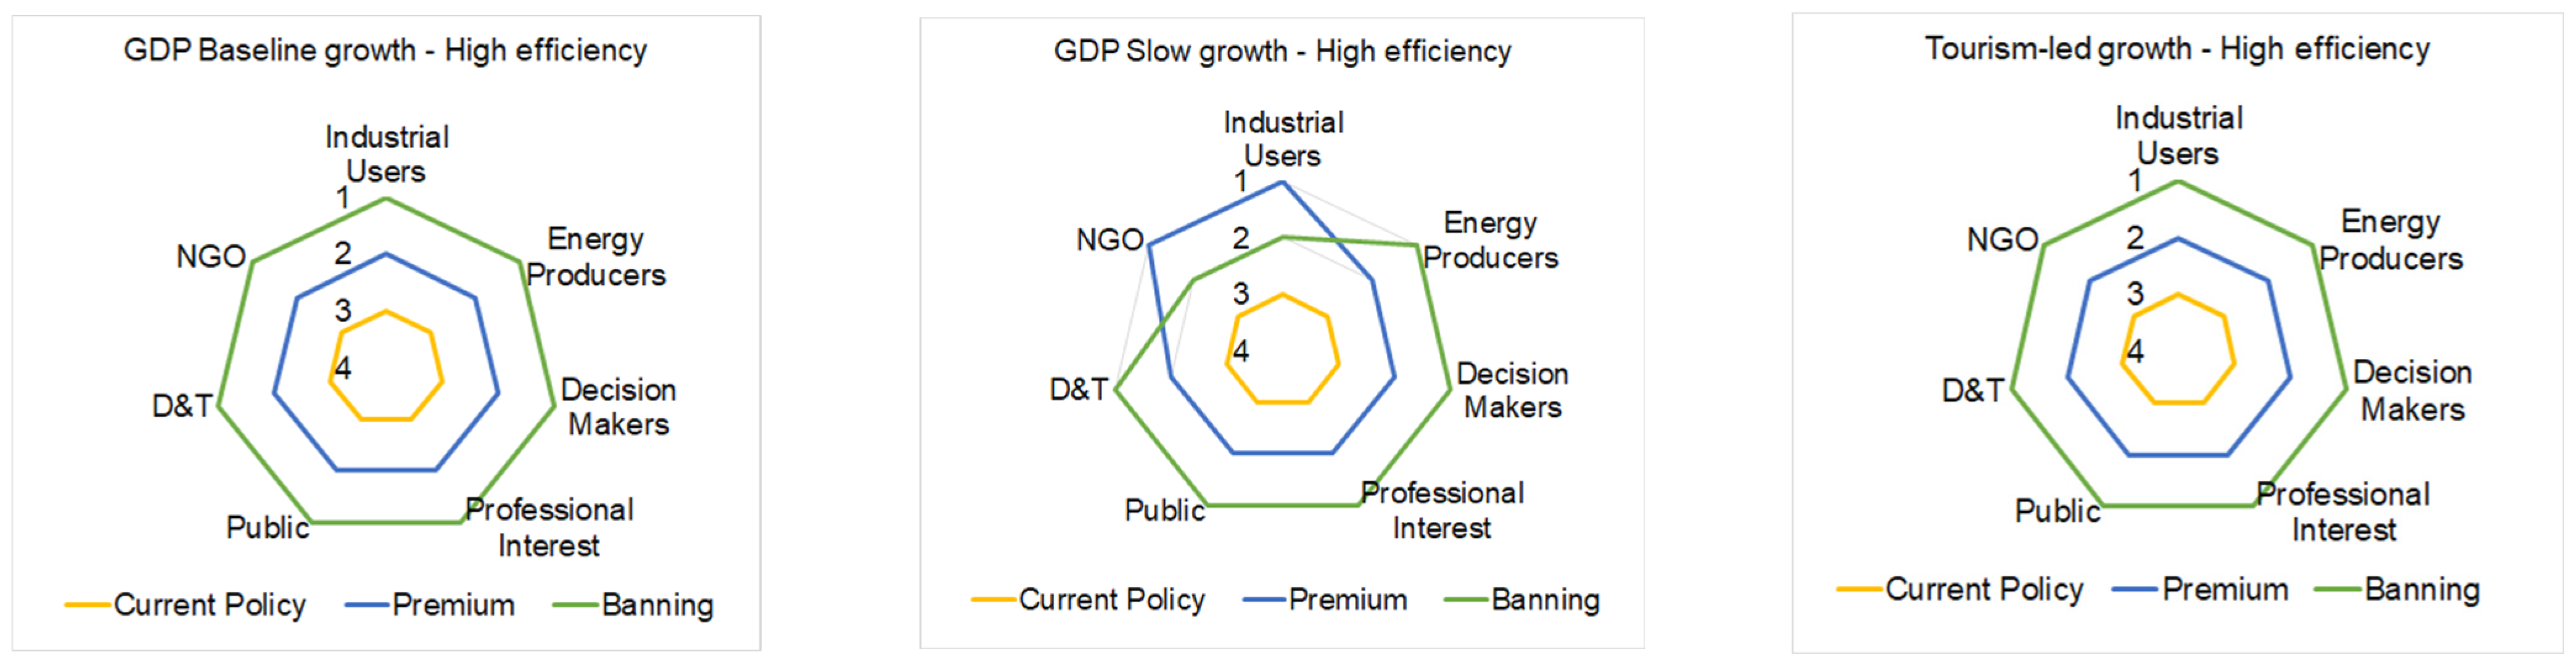
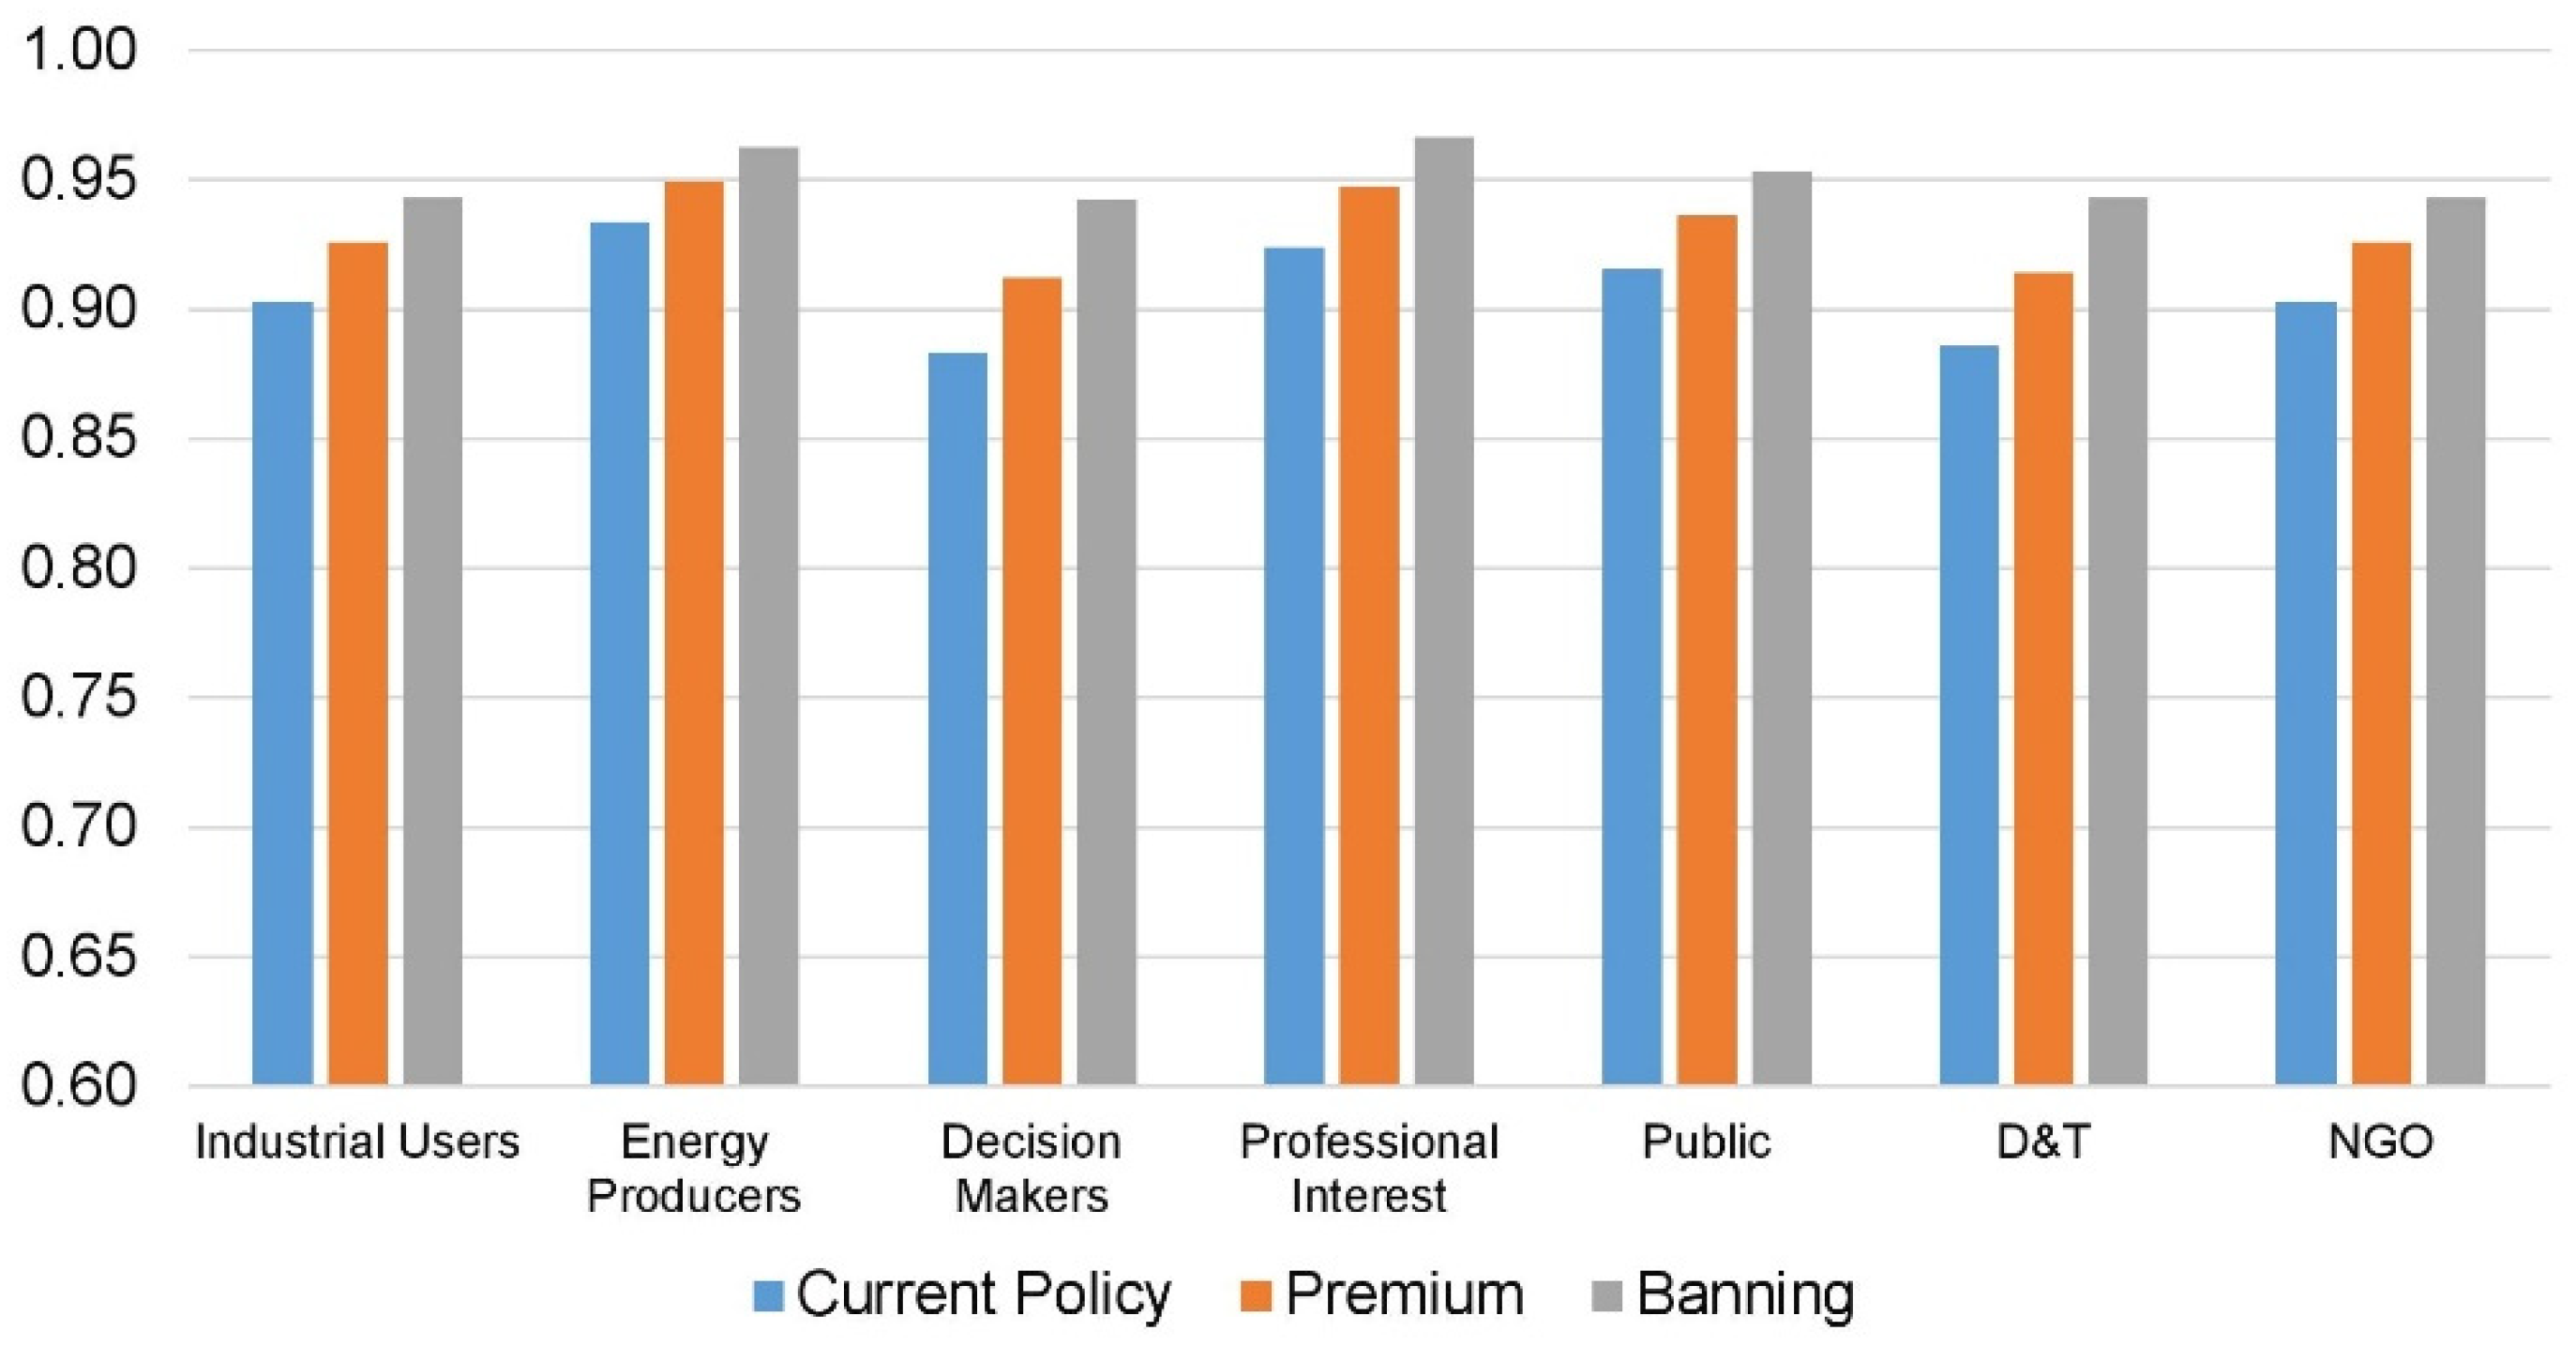
Each trajectory was compared with respect to sustainability themes, as listed in Table 1. Figure 11 depicts graphs for five selected indicators, with one for each sustainability theme, with each graph depicting the results of the 18 simulated trajectories. As before, the figures also include the 2019 value, as this was the last year before the enactment of the current Climate Action Plan. The selected indicators are as follows: total employment in the country (Figure 11a), energy intensity (Figure 11b), GHG emissions from road transport (Figure 11c), energy diversity (Figure 11d), and the share of alternative fuels in road transport (Figure 11e).
Figure 11a compares total employment, which was used to estimate the number of jobs created under different trajectories. As expected, with higher GDP growth, total employment will increase by 4% and 13% compared to the baseline in 2030 and 2050 (TAC compared to GAC), while the slow growth scenario shows a reduction in employment of 7% and 15% compared to the baseline (SAC compared to GAC).
Figure 11b illustrates the energy intensity of the economy according to the different trajectories. High improvement in energy efficiency has the most significant impact (between 30–33%), while the effect of climate policies is marginal (less than 1%) in 2050 compared to the Base case.
Figure 11c shows that the uptake patterns of EVs influence the GHG emissions from the road transport. If vehicle efficiencies are kept constant over time, the potential for GHG emissions reductions during 2019–2030 will be 16–18% in the Base case, 21–23% in the Premium case, and 23–24% under the Banning policy bundle. In 2050, the mitigation potential will be 35–38% in BAU, 45–48% in Premium, and 53–55% in Banning. Hence, the Banning policy bundle and associated trajectories in all cases shows the highest mitigation potential by 2030 and 2050. The impact of changes in energy efficiency on GHG mitigation would be minor, as the share of non-EVs would be higher, as shown in Figure 6. However, GHG emissions will slightly increase due to higher travel demand in the high growth scenario.
The impact of trajectories on the diversity in energy supply is illustrated in Figure 11d. New climate policies (Premium and Banning policy bundles) will slightly increase the HHI, which implies less diversity (0.5–1.1%), since they both promote the shift towards electrification and further utilization of domestic resources, including hydro and geothermal. On the other hand, the improvement in the energy efficiency will reduce the overall energy demand and diversification of the electricity system; therefore, the share of the dominant hydro and geothermal resources will increase, which could be a concern from an energy security perspective.
Figure 11e compares the share of alternative energy in road transport across energy trajectories. As expected, all climate policy bundles are effective in increasing the share of electricity in 2050 by 27–31% above the 2019 baseline. The improvement in efficiency does not have a considerable impact on the share of alternative energy, because we assumed similar trends in the energy efficiency of conventional and electric vehicles.
Based on these five indicators, the decision to select the best trajectory is not a trivial task, as the impact on some sustainability aspects is conflicting and in other cases not easily differentiable.

4.4. MCDA Results

The sustainability implications for each of the trajectories, as shown by the results from the energy system model, are complex, multi-dimensional, and provide challenges in identifying the preferred policy bundle.
Figure 12 begins to simplify the results and compares the scores of the eighteen alternative trajectories (normalized to 100) in the five sustainability themes (listed in Table 1), assuming all indicators have equal weights within each theme. While the range of scores of 100 to 108 for two themes; economic development and energy security, is relatively small, the scores for other themes show a much greater degree of variability between the trajectories. For instance, the scores for social impacts range from 89 to 123, and those for environmental impacts range from 99 to 123. Different levels of technological change are highlighted by scores ranging from 99 to 125. This variability in scores across the themes underscores the complexity and multi-faceted nature of the decision-making process.
To develop aggregate performance scores for each trajectory, the weighting of the five sustainability themes was estimated based on responses collected from seven stakeholder groups, assuming that all stakeholder groups have a similar influence on the decision-making process. The resulting weights are shown in Table 2.
The average weights across all stakeholder groups were used to create an aggregated performance score for each energy development trajectory. Figure 13 shows the aggregated performance score of the 18 trajectories, calculated using the TOPSIS method, based on the subjective weights for the sustainability themes. The set of trajectories with Banning Policy and High Efficiency (GBX, SBX and TBX), with different economic outlooks, received the highest scores. This outcome was consistent using different normalization methods (See Table A1 in Appendix B for the results). The Banning policy also received the highest scores when efficiency was low, and across all economic growth scenarios. Figure A3 (Appendix C) illustrates the performance scores when the five sustainability themes were given equal weighting. In this case, the performance scores are very similar, making it difficult to select the best policy bundle. The weighting of sustainability themes has little effect on the rankings shown in Figure A4, Figure A5, Figure A6, Figure A7 and Figure A8 (Appendix D).
Instead of using average weights for each sustainability theme, weights obtained for each stakeholder group (Table 2), were also used to rank the policy bundles across the three economic development cases and the two efficiency cases (Figure 14). While differences in weighting can change the overall ranking of trajectories, Figure 14 confirms that the Banning policy bundle, in almost all cases, is the preferred choice, irrespective of which stakeholder group assigns the weights for the criteria. The sole exception is the GDP slow growth–high efficiency case for industrial users and NGOs. However, in that case, the difference between the scores of the Premium and Banning policy bundles was less than 0.1%. Thus, the choice of the Banning policy bundle as the preferred option is robust across different criteria weightings.
Figure 15 provides the performance scores of the policy bundles based on different criteria weighting for various stakeholder groups, estimated by averaging the scores for different economic development projections and efficiency improvements. While different weightings can affect the scores, the Banning policy is the preferred choice, with the highest score for all stakeholder groups.

5. Discussion

The international adoption of the Sustainable Development Goals has reinforced the need to apply multidimensional impact assessments when choosing between different policy options or development pathways. The importance of embedding diverse implications into decision-making increases if the policy in question, and the resulting development pathways, have widespread and multi-faceted impacts. This is the case for both climate and energy policies. As a result, the selection of robust energy and climate policy bundles becomes a challenging task because of the diverse sustainability implications, system complexity, uncertainty associated with new technologies and societal and economic conditions, and diverse stakeholder views and preferences.
Climate policies in Iceland aim to significantly reduce GHG emissions and reach climate neutrality by 2040. Over 52% of all fossil fuels currently used domestically in Iceland are consumed within the road transport sector [69], and the sector is also a source of 20% of the country’s GHG emissions, if emissions from land use, land-use change, and forestry (LULUCF) are excluded [70]. As a result, both climate and energy policies are targeting a shift in the transport sector towards low-carbon energy sources. The current energy policy, “A sustainable energy future; an energy policy to the year 2050”, states that developing the energy system is a central feature in reaching carbon neutrality [50]. In that context, the key aim of the policy is to fully transition away from the use of fossil fuels, and at the same time, ensure progress across four additional themes, as follows: energy security; energy efficiency and conservation; environment and society/economy; and fulfilling the Sustainable Development Goals. This implies that any policy bundle that aims to facilitate a transition away from fossil fuels and reduce GHG emissions should be subject to MCDA. The integrated assessment framework applied in this paper demonstrates an appropriate methodology.
The integrated assessment framework compared three policy bundles (base, premium, and banning) with the aim of reducing GHG emissions from transport in Iceland across three different cases of economic growth and two energy efficiency cases, resulting in eighteen transition trajectories. Derived from the framework, the performance scores of transition trajectories were compared across five sustainability themes. The results show that adding subsidies, such as VAT, carbon, and vehicle tax exemptions (premium bundle), is a preferred policy bundle over relying solely on taxes (base bundle). The results also show that policies which in addition to economic instruments ban, as soon as possible, new registrations of ICE/HEV (banning bundle) offer the most preferred outcome across all sustainability themes and stakeholder groups. This suggests that the Icelandic authorities should choose economic instruments, including both taxes and subsidies, and a ban, as part of their decarbonization strategy to simultaneously approach climate and energy policy goals. The results, however, also indicate that Iceland is unlikely to reach the goals of being independent of fossil fuels or reaching climate neutrality in the road transport sector by 2040, reaffirming the results of Shafiei et al. [66]. Policies in 2024 based both on the Icelandic Climate Action Plan [68] and on decisions from the government and relevant regional authorities will likely result in an end of subsidies to BEVs, and no ban of new registrations of ICE/HEV.
The framework development process and its implementation revealed important insights regarding the integrated assessment approach. The iterative stakeholder engagement approach (Section 3.1.1), including in-depth interviews, was shown to adequately capture the energy development related sustainability themes. Five sustainability themes and eight priority areas were defined by stakeholder engagement and represented by the context-specific sustainability indicators. Stakeholder engagement highlighted the importance of context-specific analysis, as some of the sub-themes that emerged, such as wilderness protection and visual pollution, are specific concerns in Iceland and not adequately captured by other sustainability indicator systems focused on energy systems [14,52]. This confirms observations by others of the importance of including localized information and not engaging only experts [36,42]. Rountree et al. [71] also highlighted that engaging stakeholders through an MCDA framework can greatly enhance our understanding of challenges and opportunities in energy planning projects, and that stakeholder engagement was also central to the development of the MCDA framework, including revealing the weights for each sustainability theme.
An examination of the stakeholder-specific weights for individual themes (Table 2), demonstrates that priorities differ somewhat between different stakeholder groups. For example, the public and policymakers prioritize environmental issues, whereas NGOs and industrial users accord the greatest weight to social issues. Stakeholder groups prioritized energy security. It was the most important theme for three groups and the second most important theme for another two groups (Section 4.4, Appendix D). The sensitivity of the results was assessed against the subjective weights for energy security. The results show that the prioritization of the policy bundles is unaffected either by the weight of the energy security criteria or by the sustainability themes (Appendix B and Appendix D).
Many have started to recognize the value or even the necessity of engaging stakeholders in decision-making to improve governance and increase public acceptance of government actions [72]. However, engaging stakeholders can be time-consuming and translating qualitative interviews into information for quantitative assessment is not a trivial task. While the analysis benefited from multiple stakeholder engagement methods, there are limitations associated with each method. For example, questionnaires may have low response rates, and stakeholders may be unable to provide clear responses or reach a consensus with other stakeholders. The Delphi method requires considerable time commitment, which can preclude some participants from participating in every round [54]. The iterative nature of the stakeholder engagement process applied in this study, where the same stakeholders are engaged multiple times, increases the likelihood of stakeholder fatigue, and thus to a decrease in response rates. Furthermore, there is always the risk that researcher bias may influence the stakeholders and/or how the results are interpreted.
Although an inclusive scenario analysis was conducted in this study, each scenario assumed a point estimate of the most likely value of other parameters not included in the scenario definition (e.g., demand elasticities, technology cost data). An interval estimation using a range of parameter values could provide more insights on the level of confidence and overlaps, depending on the specific research question posed in a future study.

6. Conclusions

This paper formulates an integrated assessment framework that combines dynamic energy systems simulation modeling with the selection of sustainability indicators and multi-criteria decision analysis (MCDA) directly reflecting stakeholder preferences. The embedding of multi-dimensional sustainability indicators with energy systems modeling enables the indicators to become forward looking, enabling comparisons of future transition trajectories in the context of sustainable energy development. The outputs from the energy systems model feed directly and indirectly towards populating the indicators with data, which are then fed to the MCDA framework to synthesize and simplify the results, such that they can become a foundation for robust decision-making.
Previous energy systems modeling studies in Iceland have argued that the long-term consumer benefit could reflect the overall energy and transport benefits as it is composed of the overall cost of fuel supply chains and end-use sector costs [55]. However, the economic costs/benefits do not necessarily reflect the priority or advantage of each policy, as they are generally estimated at different states of energy system development such as different levels of EV promotion or GHG mitigation. As Shafiei et al. [73] highlighted, if the same targets, such as those for GHG mitigation, are set for all the policies under investigation, then the least-cost strategy satisfying the targets can be considered as the preferred one. Otherwise, there would be conflicts between the efficiency and effectiveness of measures as both criteria could not be fully satisfied. To resolve the conflicts between efficiency and effectiveness, and to incorporate a broader range of socio-economic factors, this study linked sustainability indicators into the energy systems model and fed them into an MCDA framework. The implementation of the framework was shown to be an effective way to generate the information needed to prioritize different policy options based on a diverse set of sustainability themes.
The approach described in this paper is applicable to a wide range of decisions faced by policymakers in diverse fields. The approach is flexible and can be easily adjusted for different applications based on the inputs obtained from stakeholders. Policymakers are frequently left in the position of making decisions based on complex data that may be difficult to interpret. The integrated framework presented here can be used to better understand societal preferences and provide clarity in data interpretation, thus providing valuable decision support.

Author Contributions

Conceptualization, B.D., E.I.Á., R.F., E.S., I.G. and H.S.; methodology, B.D., E.I.Á., R.F., E.S., I.G., J.L. and H.S.; validation, B.D., E.I.Á., R.F., E.S., I.G., J.L. and H.S.; formal analysis, R.F., E.S. and I.G.; writing—original draft preparation, B.D., E.I.Á., R.F., E.S. and H.S.; writing—review and editing, B.D., E.I.Á., R.F., E.S., I.G., J.L. and H.S.; visualization, B.D., R.F., E.S. and I.G.; supervision, B.D.; project administration, B.D.; funding acquisition, B.D., E.I.Á. and H.S. All authors have read and agreed to the published version of the manuscript.

Funding

This research was funded by the Icelandic Centre for Research, grant number: 163464-051.

Data Availability Statement

The raw data supporting the conclusions of this article will be made available by the authors on request.

Conflicts of Interest

Ingunn Gunnarsdottir was employed by the Landsvirkjun—The National Power Company of Iceland. The remaining authors declare that the research was conducted in the absence of any commercial or financial relationships that could be construed as a potential conflict of interest.

Appendix A

Figure A1. Total household energy expenditure (million US$).
Energies 17 04266 g0a1
Figure A2. Annual government tax revenue from the road transport sector (million US$).
Energies 17 04266 g0a2

Appendix B

Table A1. Performance score for 18 energy trajectories using different normalization methods.
Norm 1: Vector NormalizationNorm 2: Linear Scale Transformation Norm 3: Linear Scale TransformationNorm 4: Linear Scale Transformation
GAC0.260.130.970.11
SAC0.260.310.980.33
TAC0.290.150.970.13
GAN0.410.270.000.24
SAN0.430.470.980.47
TAN0.440.280.970.25
GAX0.620.430.980.39
SAX0.650.620.990.61
TAX0.640.430.980.39
GBC0.390.430.980.44
SBC0.400.590.990.63
TBC0.390.400.980.41
GBN0.570.580.980.58
SBN0.540.720.990.74
TBN0.570.560.980.56
GBX0.840.760.990.74
SBX0.740.871.000.89
TBX0.830.740.990.72

Appendix C

Figure A3. The performance score of energy trajectories assuming equal weights for five sustainability themes.
Energies 17 04266 g0a3

Appendix D

To obtain a better understanding of the MCDA outcome, the sensitivity of findings to the weighting of the sustainability themes was assessed. Figure A4, Figure A5, Figure A6, Figure A7 and Figure A8 capture the sensitivity of performance scores for six trajectories to changes in the weighting of all five sustainable themes. The upper and lower bounds of the performance scores are estimated by varying the weight of the energy security theme between 5% and 95%. It is clear that the ranking of trajectories is resilient to changes in the weight of other sustainability themes.
Figure A4. Sensitivity of performance scores for six trajectories to changes in the weight of the social impacts criteria (0.05 ≤ w1 ≤ 0.95).
Energies 17 04266 g0a4
Figure A5. Sensitivity of performance scores for six trajectories to changes in the weight of the economic development criteria (0.05 ≤ w2 ≤ 0.95).
Energies 17 04266 g0a5
Figure A6. Sensitivity of performance scores for six trajectories to changes in the weight of the social impacts criteria (0.05 ≤ w3 ≤ 0.95).
Energies 17 04266 g0a6
Figure A7. Sensitivity of performance scores for six trajectories to changes in the weight of the energy security criteria (0.05 ≤ w4 ≤ 0.95).
Energies 17 04266 g0a7
Figure A8. Sensitivity of performance scores for six trajectories to changes in the weight of the technical aspects criteria (0.05 ≤ w5 ≤ 0.95).
Energies 17 04266 g0a8

References

  1. United Framework Convention on Climate Change; Paris Agreement, United Nations Framework Convention on Climate Change: Paris, France, 2015.
  2. IPCC. Climate Change 2023: Synthesis Report. In Contribution of Working Groups I, II and III to the Sixth Assessment Report of the Intergovernmental Panel on Climate Change; Lee, H., Romero, J., Eds.; IPCC: Geneva, Switzerland, 2023; p. 184. [Google Scholar] [CrossRef]
  3. United Nations Environment Programme. Emissions Gap Report 2023: Broken Record—Temperatures Hit New Highs, Yet World Fails to Cut Emissions (Again); UNEP: Nairobi, Kenya, 2023; p. 80. [Google Scholar] [CrossRef]
  4. Rogelj, J.; Luderer, G.; Pietzcker, R.C.; Kriegler, E.; Schaeffer, M.; Krey, V.; Riahi, K. Energy system transformations for limiting end-of-century warming to below 1.5 °C. Nat. Clim. Chang. 2015, 5, 519–527. [Google Scholar] [CrossRef]
  5. International Atomic Energy Agency and International Energy Agency (IAEA/IEA). Indicators for Sustainable Energy Development: Report presented at the Ninth Session of the Commission on Sustainable Development; IAEA/IEA: New York, NY, USA, 2001; p. 5. [Google Scholar]
  6. Nerini, F.; Hughes, N.; Cozzi, L.; Cosgrave, E.; Howells, M.; Tavoni, M.; Tomei, J.; Zerriffi, H.; Milligan, B. Shore up support for climate action using SDGs. Nature 2018, 557, 31. [Google Scholar] [CrossRef]
  7. Brutschin, E.; Pianta, S.; Tavoni, M.; Riahi, K.; Bosetti, V.; Marangoni, G.; van Ruijven, B.J. A multidimensional feasibility evaluation of low-carbon scenarios. Environ. Res. Lett. 2021, 16, 064069. [Google Scholar] [CrossRef]
  8. Akpan, J.; Olanrewaju, O. Sustainable Energy Development: History and Recent Advances. Energies 2023, 16, 7049. [Google Scholar] [CrossRef]
  9. World Bank and International Energy Agency. Sustainable Energy for All 2015: Progress toward Sustainable Energy; World Bank: Washington, DC, USA, 2015; p. 80. [Google Scholar]
  10. Gladkykh, G.; Spittler, N.; Diemer, A. Energy Modelling for Reaching SDG7. In Affordable and Clean Energy; Filho, W.L., Azul, A.M., Brandli, L., Salvia, A.L., Wall, T., Eds.; Springer Nature: Cham, Switzerland, 2021; pp. 448–459. [Google Scholar] [CrossRef]
  11. Wang, J.; Chen, H.; Cao, Y.; Wang, C.; Li, J. An integrated optimization framework for regional energy planning with a sustainability assessment model. Sustain. Prod. Consum. 2023, 36, 526–539. [Google Scholar] [CrossRef]
  12. Gunnarsdottir, I.; Davidsdottir, B.; Worrell, E.; Sigurgeirsdottir, S. Review of indicators for sustainable energy development. Renew. Sustain. Energy Rev. 2020, 133, 110294. [Google Scholar] [CrossRef]
  13. Narula, K.; Reddy, B.S. Three blind men and an elephant: The case of energy indices to measure energy security and energy sustainability. Energy 2015, 80, 148–158. [Google Scholar] [CrossRef]
  14. Gunnarsdóttir, I.; Davíðsdóttir, B.; Worrell, E.; Sigurgeirsdottir, S. It is best to ask: Designing a stakeholder-centric approach to selecting sustainable energy development indicators. Energy Res. Soc. Sci. 2021, 74, 101968. [Google Scholar] [CrossRef]
  15. Loftus, P.J.; Cohen, A.M.; Long, J.C.S.; Jenkins, J.D. A critical review of global decarbonization scenarios: What do they tell us about feasibility? A critical review of global decarbonization scenarios. Wiley Interdiscip. Rev. Clim. Chang. 2014, 6, 93–112. [Google Scholar] [CrossRef]
  16. Diemer, A.; Gladkykh, G.; Spittler, N.; Collste, D.; Ndiaye, A.; Dierickx, F. Integrated Assessment Models (IAM) How to integrate Economics, Energy and Climate? In Integrated Assessment Models and Other Climate Policy Tools; Diemer, A., Gladkykh, G., Spittler, N., Collste, D., Ndiaye, A., Dierickx, F., Eds.; Oeconomia: Paris, France, 2019; pp. 20–48. [Google Scholar]
  17. van Soest, H.L.; van Vuuren, D.P.; Hilaire, J.; Minx, J.C.; Harmsen, M.J.; Krey, V.; Popp, A.; Riahi, K.; Luderer, G. Analysing interactions among Sustainable Development Goals with Integrated Assessment Models. Glob. Transit. 2019, 1, 210–225. [Google Scholar] [CrossRef]
  18. Moreno, J.; Campagnolo, L.; Boitier, B.; Nikas, A.; Koasidis, K.; Gambhir, A.; Gonzalez-Eguino, M.; Perdana, S.; Van de Ven, D.-J.; Chiodi, A.; et al. The impacts of decarbonization pathways on Sustainable Development Goals in the European Union. Commun. Earth Environ. 2024, 5, 136. [Google Scholar] [CrossRef]
  19. Keyßer, L.T.; Lenzen, M. 1.5 °C degrowth scenarios suggest the need for new mitigation pathways. Nat. Commun. 2021, 12, 2676. [Google Scholar] [CrossRef] [PubMed]
  20. Capros, P.; Tasios, N.; De Vita, A.; Mantzos, L.; Paroussos, L. Model-based analysis of decarbonising the EU economy in the time horizon to 2050. Energy Strat. Rev. 2012, 1, 76–84. [Google Scholar] [CrossRef]
  21. Siskos, P.; Zazias, G.; Petropoulos, A.; Evangelopoulou, S.; Capros, P. Implications of delaying transport decarbonisation in the EU: A systems analysis using the PRIMES model. Energy Policy 2018, 121, 48–60. [Google Scholar] [CrossRef]
  22. Gardumi, F.; Keppo, I.; Howells, M.; Pye, S.; Avgerinopoulos, G.; Lekavičius, V.; Galinis, A.; Martišauskas, L.; Fahl, U.; Korkmaz, P.; et al. Carrying out a multi-model integrated assessment of European energy transition pathways: Challenges and benefits. Energy 2022, 258, 124329. [Google Scholar] [CrossRef]
  23. Korkmaz, P.; Montenegro, R.C.; Schmid, D.; Blesl, M.; Fahl, U. On the Way to a Sustainable European Energy System: Setting Up an Integrated Assessment Toolbox with TIMES PanEU as the Key Component. Energies 2020, 13, 707. [Google Scholar] [CrossRef]
  24. Sverdrup, H.; Koca, D. The WORLD Model Development and the Integrated Assessment of the Global Natural Resources Supply; FKZ 3712 93 102; Umweltbundesamt: Berlin, Germany, 2018; p. 444. Available online: https://www.umweltbundesamt.de/publikationen/the-world-model-development-the-integrated (accessed on 20 May 2024).
  25. Randers, J.; Rockström, J.; Stoknes, P.-E.; Goluke, U.; Collste, D.; Cornell, S.E.; Donges, J. Achieving the 17 Sustainable Development Goals within 9 planetary boundaries. Glob. Sustain. 2019, 2, e24. [Google Scholar] [CrossRef]
  26. Qu, W.; Barney, G.O.; Symalla, D.; Martin, L. The Threshold 21: National Sustainable Development Model. In Integrated Global Models of Sustainable Development—Volume 2; Onishi, A., Ed.; UNESCO-EOLSS: Paris, France, 2002; p. 235. [Google Scholar]
  27. Collste, D.; Cornell, S.E.; Randers, J.; Rockström, J.; Stoknes, P.E. Human well-being in the Anthropocene: Limits to growth. Glob. Sustain. 2021, 4, e30. [Google Scholar] [CrossRef]
  28. Collste, D.; Pedercini, M.; Cornell, S.E. Policy coherence to achieve the SDGs: Using integrated simulation models to assess effective policies. Sustain. Sci. 2017, 12, 921–931. [Google Scholar] [CrossRef]
  29. Sverdrup, H.U.; Olafsdottir, A.H.; Ragnarsdottir, K.V.; Koca, D. A System Dynamics Assessment of the Supply of Molybdenum and Rhenium Used for Super-alloys and Specialty Steels, Using the WORLD6 Model. Biophys. Econ. Resour. Qual. 2018, 3, 7. [Google Scholar] [CrossRef]
  30. Sverdrup, H.U.; Olafsdottir, A.H. Dynamical Modelling of the Global Cement Production and Supply System, Assessing Climate Impacts of Different Future Scenarios. Water Air Soil Pollut. 2023, 234, 191. [Google Scholar] [CrossRef]
  31. Alharthi, S.; Alharthi, A.; Alharthi, M. Sustainable development goals in the kingdom of Saudi Arabia’s 2030 vision. WIT Trans. Ecol. Environ 2019, 238, 455–467. [Google Scholar] [CrossRef]
  32. Allen, C.; Metternicht, G.; Wiedmann, T. Initial progress in implementing the Sustainable Development Goals (SDGs): A review of evidence from countries. Sustain. Sci. 2018, 13, 1453–1467. [Google Scholar] [CrossRef]
  33. Qu, W.; Shi, W.; Zhang, J.; Liu, T. T21 China 2050: A Tool for National Sustainable Development Planning. Geogr. Sustain. 2020, 1, 33–46. [Google Scholar] [CrossRef]
  34. Witt, T.; Dumeier, M.; Geldermann, J. Combining scenario planning, energy system analysis, and multi-criteria analysis to develop and evaluate energy scenarios. J. Clean. Prod. 2020, 242, 118414. [Google Scholar] [CrossRef]
  35. Ketter, W.; Collins, J.; Reddy, P. Sustainable energy planning and multi-criteria decision-making: A review of the state of the art. Energy 2016, 115 Pt 1, 485–495. [Google Scholar] [CrossRef]
  36. Mertzanakis, C.; Vlachokostas, C.; Toufexis, C.; Michailidou, A.V. Closing the Loop between Waste-to-Energy Technologies: A Holistic Assessment Based on Multiple Criteria. Energies 2024, 17, 2971. [Google Scholar] [CrossRef]
  37. Ezbakhe, F.; Pérez-Foguet, A. Decision analysis for sustainable development: The case of renewable energy planning under uncertainty. Eur. J. Oper. Res. 2021, 291, 601–613. [Google Scholar] [CrossRef]
  38. Sadiq, M.; Kokchang, P.; Kittipongvises, S. Sustainability assessment of renewable power generation systems for scale enactment in off-grid communities. Renew. Energy Focus 2023, 46, 323–337. [Google Scholar] [CrossRef]
  39. Gouraizim, M.; Makan, A.; El Ouarghi, H. A CAR-PROMETHEE-based multi-criteria decision-making framework for sustainability assessment of renewable energy technologies in Morocco. Oper. Manag. Res. 2023, 16, 1343–1358. [Google Scholar] [CrossRef]
  40. Solano-Olivares, K.; Santoyo, E.; Santoyo-Castelazo, E. Integrated sustainability assessment framework for geothermal energy technologies: A literature review and a new proposal of sustainability indicators for Mexico. Renew. Sustain. Energy Rev. 2024, 192, 114231. [Google Scholar] [CrossRef]
  41. Alghassab, M. A Computational Case Study on Sustainable Energy Transition in the Kingdom of Saudi Arabia. Energies 2023, 16, 5133. [Google Scholar] [CrossRef]
  42. Schmidt-Scheele, R.; Hauser, W.; Scheel, O.; Minn, F.; Becker, L.; Buchgeister, J.; Hottenroth, H.; Junne, T.; Lehr, U.; Naegler, T.; et al. Sustainability assessments of energy scenarios: Citizens’ preferences for and assessments of sustainability indicators. Energy Sustain. Soc. 2022, 12, 41. [Google Scholar] [CrossRef]
  43. Naegler, T.; Becker, L.; Buchgeister, J.; Hauser, W.; Hottenroth, H.; Junne, T.; Lehr, U.; Scheel, O.; Schmidt-Scheele, R.; Simon, S.; et al. Integrated Multidimensional Sustainability Assessment of Energy System Transformation Pathways. Sustainability 2021, 13, 5217. [Google Scholar] [CrossRef]
  44. National Energy Authority. Primary Energy Use in Iceland 1940–2022; OS-2023-T011; National Energy Authority: Reykjavik, Iceland, 2023.
  45. National Energy Authority. Report on the Status of Renewable Fuels in Road Transport 2022; OS-2023-T007-01; National Energy Authority: Reykjavik, Iceland, 2023.
  46. Cabinet of Iceland: Ministry for Environment, Energy and Climate. Staða og Áskoranir í Orkumálum (e: The State and Challenges in Energy Affairs); Government of Iceland: Reykjavik, Iceland, 2022; p. 166.
  47. National Energy Authority. Orkuspá (e: Energy Forecast); National Energy Authority: Reykjavik, Iceland, 2024. Available online: https://orkustofnun.is/en/orkuskipti/orkuspa_2024 (accessed on 16 May 2024).
  48. Icelandic Ministry for the Environment and Natural Resources. Update of the Nationally Determined Contribution of Iceland; Government of Iceland: Reykjavik, Iceland, 2021; p. 14.
  49. Government of Iceland. On Path to Climate Neutrality; Government of Iceland: Reykjavik, Iceland, 2021; p. 14.
  50. Cabinet of Iceland and Ministry of Industries and Innovation. A Sustainable Energy Future; An Energy Policy to the Year 2050; Government of Iceland: Reykjavik, Iceland, 2020; p. 30.
  51. Shafiei, E.; Davidsdottir, B.; Leaver, J.; Stefansson, H.; Asgeirsson, E.I. Potential impact of transition to a low-carbon transport system in Iceland. Energy Policy 2014, 69, 127–142. [Google Scholar] [CrossRef]
  52. Gunnarsdottir, I.; Davidsdottir, B.; Worrell, E.; Sigurgeirsdottir, S. Indicators for sustainable energy development: An Icelandic case study. Energy Policy 2022, 164, 112926. [Google Scholar] [CrossRef]
  53. Energy and Water Industries (BDEW). Deutsche Gesellschaft fur Internationale Zusammenarbeit (GIZ) GmbH, PricewaterhouseCoopers AG WPG (PwC). In Delphi Energy Future 2040: Delphi-Study on the Future of Energy Systems in Germany, Europe, and the World by the Year 2040; BDEW, GmbH, PwC: Berlin, Germany, 2016; Available online: www.delphi-energy-future.com (accessed on 19 March 2019).
  54. Loë, R.C.; Melnychuk, N.; Murray, D.; Plummer, R. Advancing the State of Policy Delphi Practice: A Systematic Review Evaluating Methodological Evolution, Innovation, and Opportunities. Technol. Forecast. Soc. Chang. 2016, 104, 78–88. [Google Scholar] [CrossRef]
  55. Shafiei, E.; Davidsdottir, B.; Leaver, J.; Stefansson, H.; Asgeirsson, E.I. Comparative analysis of hydrogen, biofuels and electricity transitional pathways to sustainable transport in a renewable-based energy system. Energy 2015, 83, 614–627. [Google Scholar] [CrossRef]
  56. Trainor, A.M.; McDonald, R.I.; Fargione, J. Energy Sprawl Is the Largest Driver of Land Use Change in United States. PLoS ONE 2016, 11, e0162269. [Google Scholar] [CrossRef]
  57. Herfindahl, O.C. Concentration in the U.S. Steel Industry. Ph.D. Dissertation, Columbia University, New York, NY, USA, 1950. [Google Scholar]
  58. Hirschman, A.O. National Power and the Structure of Foreign Trade; University of California Press: Berkeley, CA, USA, 1945; p. 194. [Google Scholar]
  59. Belton, V.; Stewart, T. Multiple Criteria Decision Analysis: An Integrated Approach; Springer: New York, NY, USA, 2002; p. 372. [Google Scholar]
  60. Guðlaugsson, B.; Fazeli, R.; Gunnarsdóttir, I.; Davidsdottir, B.; Stefansson, G. Classification of stakeholders of sustainable energy development in Iceland: Utilizing a power-interest matrix and fuzzy logic theory. Energy Sustain. Dev. 2020, 57, 168–188. [Google Scholar] [CrossRef]
  61. Marttunen, M.; Lienert, J.; Belton, V. Structuring problems for Multi-Criteria Decision Analysis in practice: A literature review of method combinations. Eur. J. Oper. Res. 2017, 263, 963–973. [Google Scholar] [CrossRef]
  62. Deng, H.; Yeh, C.-H.; Willis, R.J. Inter-company comparison using modified objective weights. Comput. Oper. Res. 2000, 27, 963–973. [Google Scholar] [CrossRef]
  63. Fazeli, R.; Davidsdottir, B.; Shafiei, E.; Stefansson, H.; Asgeirsson, E.I. Multi-criteria decision analysis of fiscal policies promoting the adoption of electric vehicles. Energy Procedia 2017, 142, 2511–2516. [Google Scholar] [CrossRef]
  64. Ahn, B.S.; Park, K.S. Comparing methods for multiattribute decision making with ordinal weights. Comput. Oper. Res. 2008, 35, 1660–1670. [Google Scholar] [CrossRef]
  65. National Energy Authority. Almennar forsendur orkuspáa 2021. In Samantekt Fyrir Vinnuhópa Orkuspárnefndar (e: General Assumptions for Energy Forecasts 2021); National Energy Authority: Reykjavik, Iceland, 2021; p. 84. [Google Scholar]
  66. Shafiei, E.; Davidsdottir, B.; Stefansson, H.; Asgeirsson, E.I.; Fazeli, R.; Gestsson, M.H.; Leaver, J. Simulation-based appraisal of tax-induced electro-mobility promotion in Iceland and prospects for energy-economic development. Energy Policy 2019, 133, 110894. [Google Scholar] [CrossRef]
  67. Ministry of Environment and Natural Resources. Climate Action Plan, 1st ed.; Government of Iceland: Reykjavik, Iceland, 2018; p. 44.
  68. Ministry of Environment and Natural Resources. Iceland’s 2020 Climate Action Plan, 2nd ed.; Government of Iceland: Reykjavik, Iceland, 2020; p. 6.
  69. National Energy Authority. General Assumptions for Energy Forecasts 2023–50; OS-2024-06; National Energy Authority: Reykjavik, Iceland, 2024. Available online: https://orkustofnun.is/upplysingar/talnaefni/orka (accessed on 5 June 2024).
  70. The Environmental Agency of Iceland. National Inventory Document 2024; The Environmental Agency of Iceland: Reykjavik, Iceland, 2024. Available online: https://www.ust.is/library/sida/Loft/NID%202024_submitted%20to%20EU_30APR_corrected.pdf (accessed on 24 May 2024).
  71. Rountree, V.; Baldwin, E.; Hanlon, J. A review of stakeholder participation studies in renewable electricity and water: Does the resource context matter? J. Environ. Stud. Sci. 2021, 12, 232–247. [Google Scholar] [CrossRef]
  72. Gerlak, A.K.; Guido, Z.; Owen, G.; McGoffin, M.S.R.; Louder, E.; Davies, J.; Smith, K.J.; Zimmer, A.; Murveit, A.M.; Meadow, A.; et al. Stakeholder engagement in the co-production of knowledge for environmental decision-making. World Dev. 2023, 170, 106336. [Google Scholar] [CrossRef]
  73. Shafiei, E.; Davidsdottir, B.; Fazeli, R.; Leaver, J.; Stefansson, H.; Asgeirsson, E.I. Macroeconomic effects of fiscal incentives to promote electric vehicles in Iceland: Implications for government and consumer costs. Energy Policy 2018, 114, 431–443. [Google Scholar] [CrossRef]
Figure 1. Key components of the integrated assessment framework.
Energies 17 04266 g001
Figure 2. The seven steps of the indicator development process (adjusted based on [14]).
Energies 17 04266 g002
Figure 3. The participatory MCDA framework adjusted based on [59].
Energies 17 04266 g003
Figure 4. Overall structure of the integrated framework and flow of information between main components.
Energies 17 04266 g004
Figure 5. The scenario tree for energy trajectories.
Energies 17 04266 g005
Figure 6. Share of EVs (BEV + PHEV) in total vehicle fleets (% share).
Energies 17 04266 g006
Figure 7. Total energy demand (in petajoules, PJ).
Energies 17 04266 g007
Figure 8. Share of fossil fuels in primary energy supply, excluding geothermal energy for house heating (%).
Energies 17 04266 g008
Figure 9. Cumulative new capacity of renewable electricity technologies (hydro, geothermal and wind).
Energies 17 04266 g009
Figure 10. Average levelized cost of electricity generation (cent per kWh).
Energies 17 04266 g010
Figure 11. (a) total employment; (b) energy intensity of the economy; (c) GHG emissions from the road transport sector; (d) diversity in energy supply; and (e) share of alternative fuels in road transportation.
Energies 17 04266 g011
Figure 12. Performance of energy trajectories across the five sustainability themes.
Energies 17 04266 g012
Figure 13. The performance scores for 18 trajectories, using the TOPSIS method and vector normalization.
Energies 17 04266 g013
Figure 14. Ranking of trajectories under three economic growth projections and two efficiency improvements.
Energies 17 04266 g014aEnergies 17 04266 g014b
Figure 15. The average score of policies based on preferences of different stakeholder groups.
Energies 17 04266 g015
Table 1. List of selected themes, sustainability themes, and indicators to compare eighteen energy trajectories.
Sustainability ThemeSub-ThemeIndicators
Social ImpactsSocial benefitTotal employment
Consumer behaviorThe share of alternative fuel vehicles
Economic DevelopmentGovernment expenditure/revenueGovernment tax revenue–expenditure (subsidies, investment, …)
Affordable energy priceHousehold expenditure on electricity and transport
Economically efficient energy systemEnergy intensity of the economy
Environmental ImpactsWilderness protection and visual pollutionTotal impact area of power plants
Net emissionsGHG emissions from the transport sector
Energy SecurityEnergy reserveDynamic reserve/production ratio
Diversity of energy sourcesDiversity in energy supply
Energy independenceProportion of domestic energy sources in total primary energy supply
Transition related technical aspectsFuel switchingShare of alternative fuels in road transportation
Infrastructure DevelopmentTotal number of fast-charging spots and other eco-friendly multi-fuel stations
Energy efficiencyTotal final energy consumption in transportation per capita
Table 2. Ranking-based weighting of sustainability themes for seven stakeholder groups and the average weighting.
Social
Impacts
Economic
Development
Environmental ImpactsEnergy
Security
Technical
Aspect
Industrial Users36%18%24%10%13%
Energy Producers13%24%18%36%10%
Decision Makers13%18%36%24%10%
Professional Interest Groups18%10%24%36%13%
Public13%18%36%24%10%
Distribution and transmission10%18%13%36%24%
NGOs36%18%24%13%10%
Average20%18%25%25%13%
Disclaimer/Publisher’s Note: The statements, opinions and data contained in all publications are solely those of the individual author(s) and contributor(s) and not of MDPI and/or the editor(s). MDPI and/or the editor(s) disclaim responsibility for any injury to people or property resulting from any ideas, methods, instructions or products referred to in the content.

