
Process Model and Life Cycle Assessment of Biorefinery Concept Using Agricultural and Industrial Residues for Biohydrogen Production


Abstract
1. Introduction
2. Goal
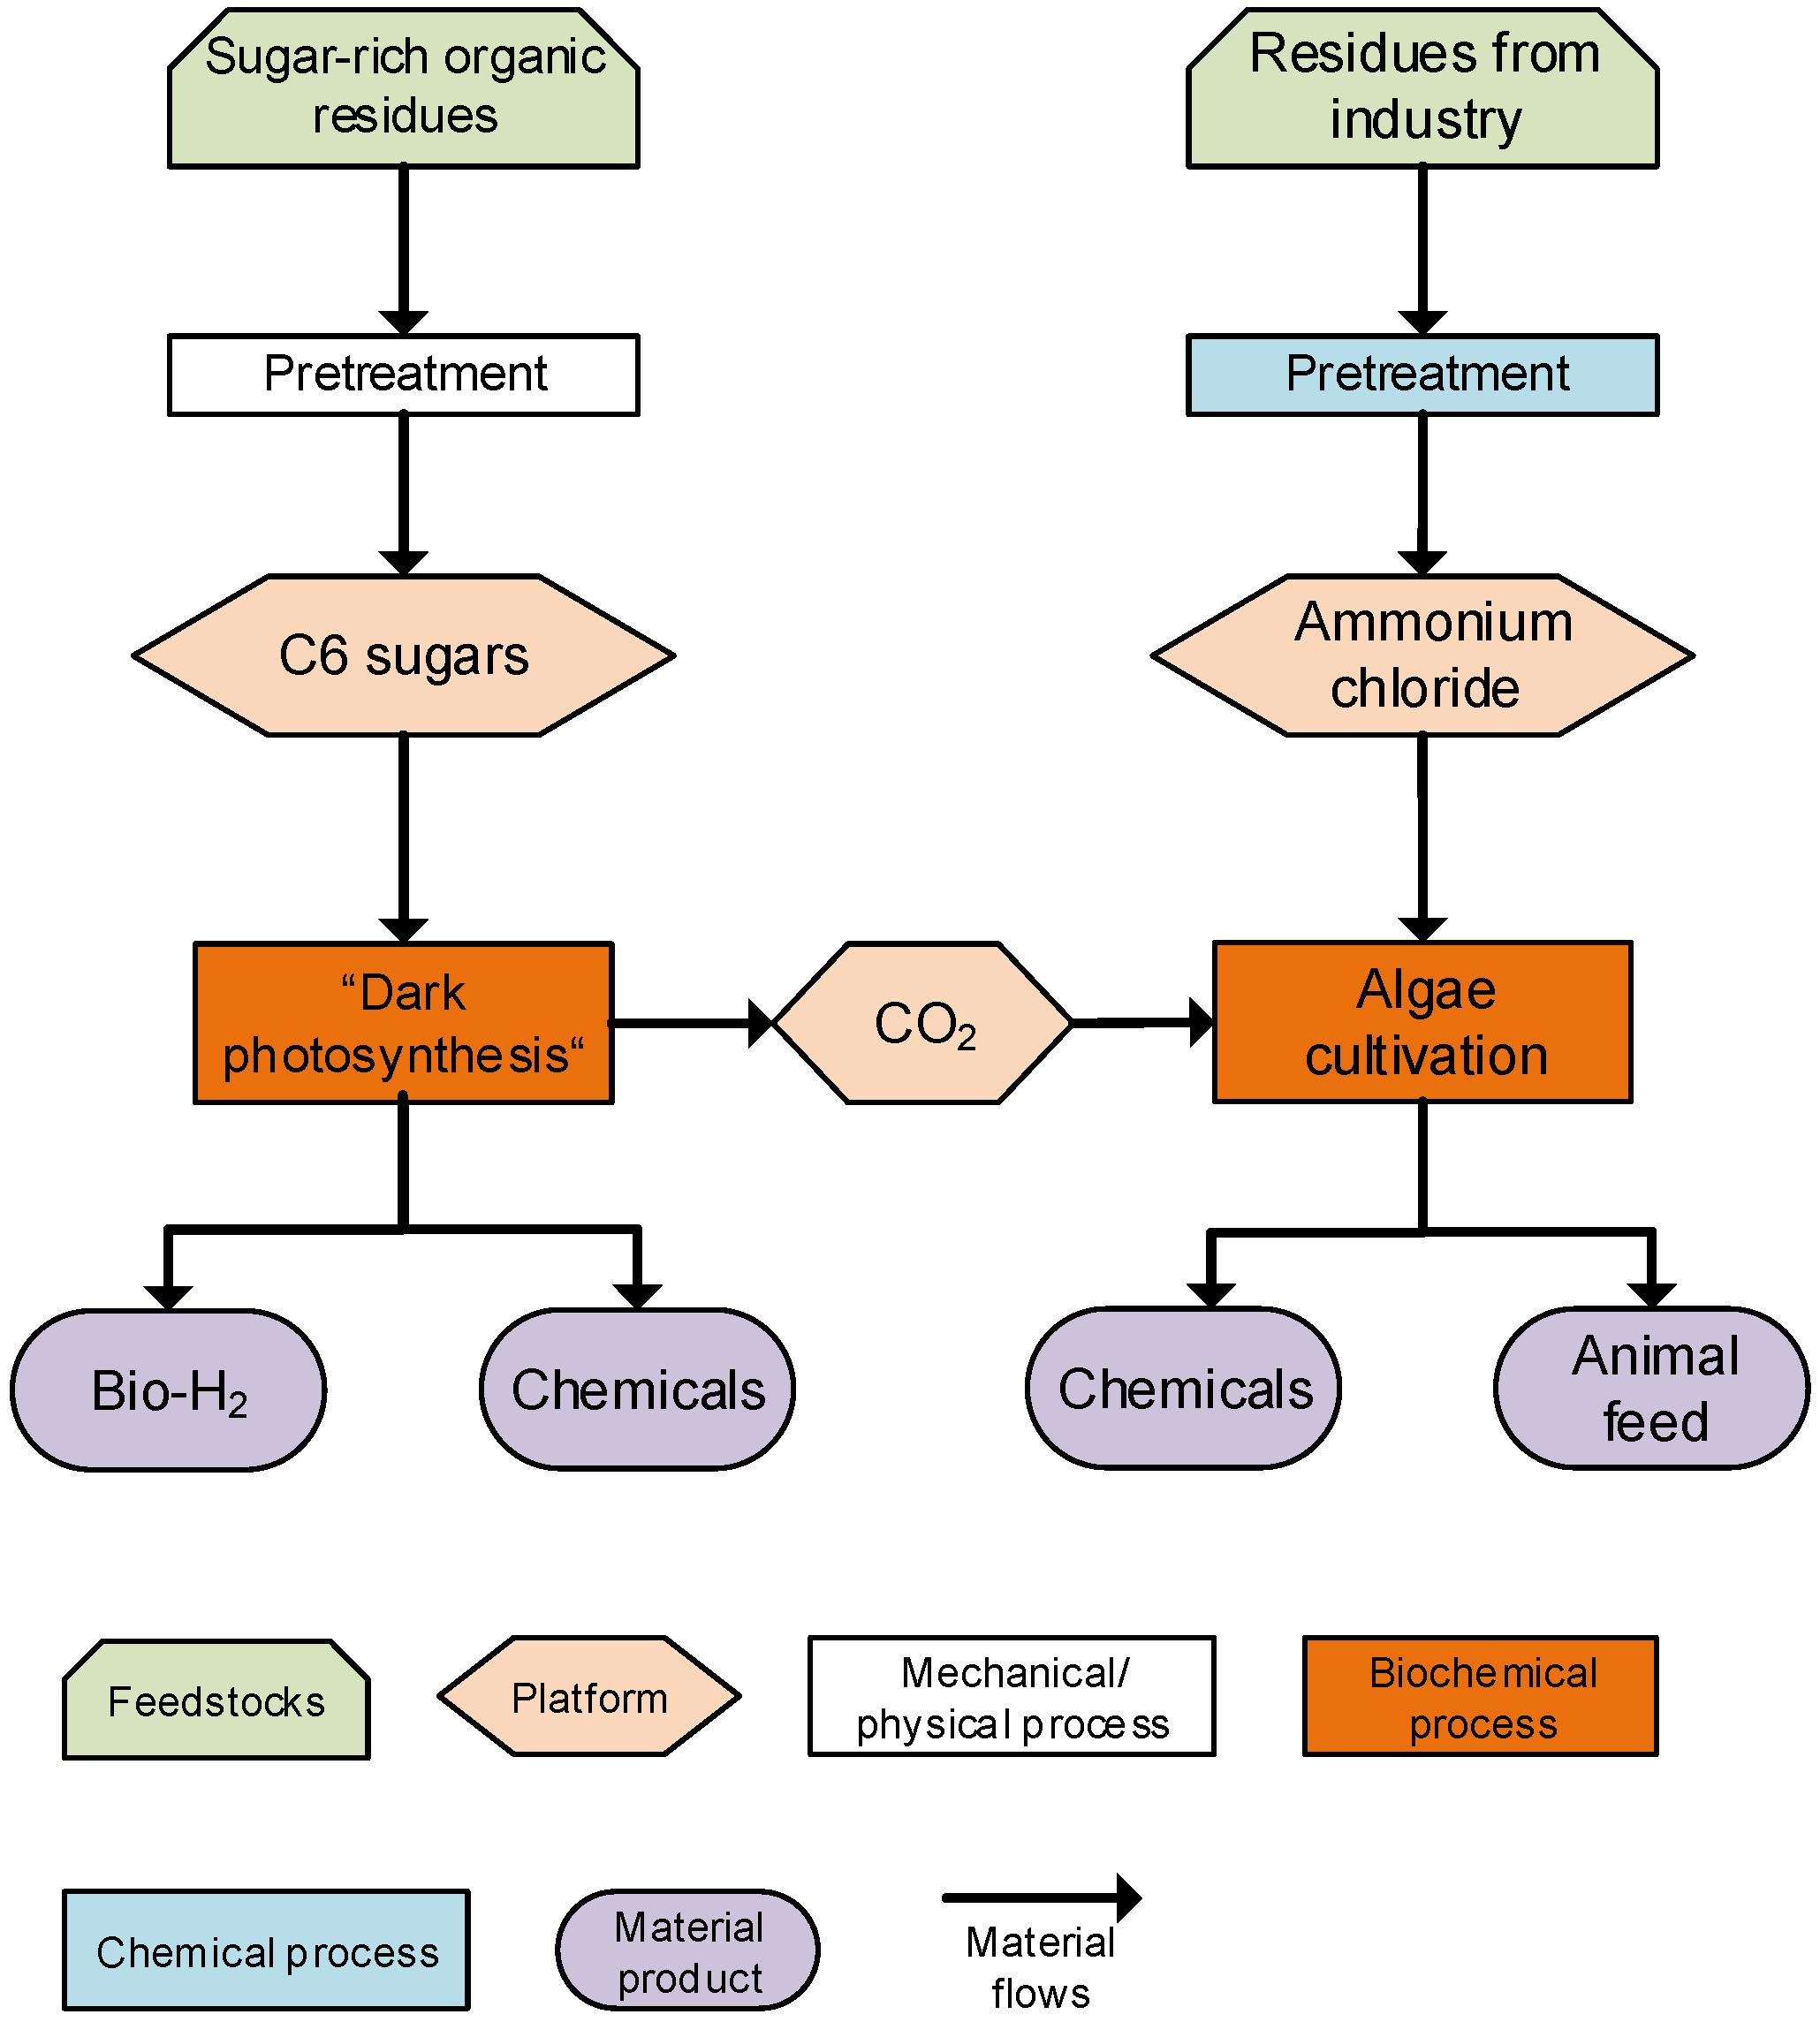
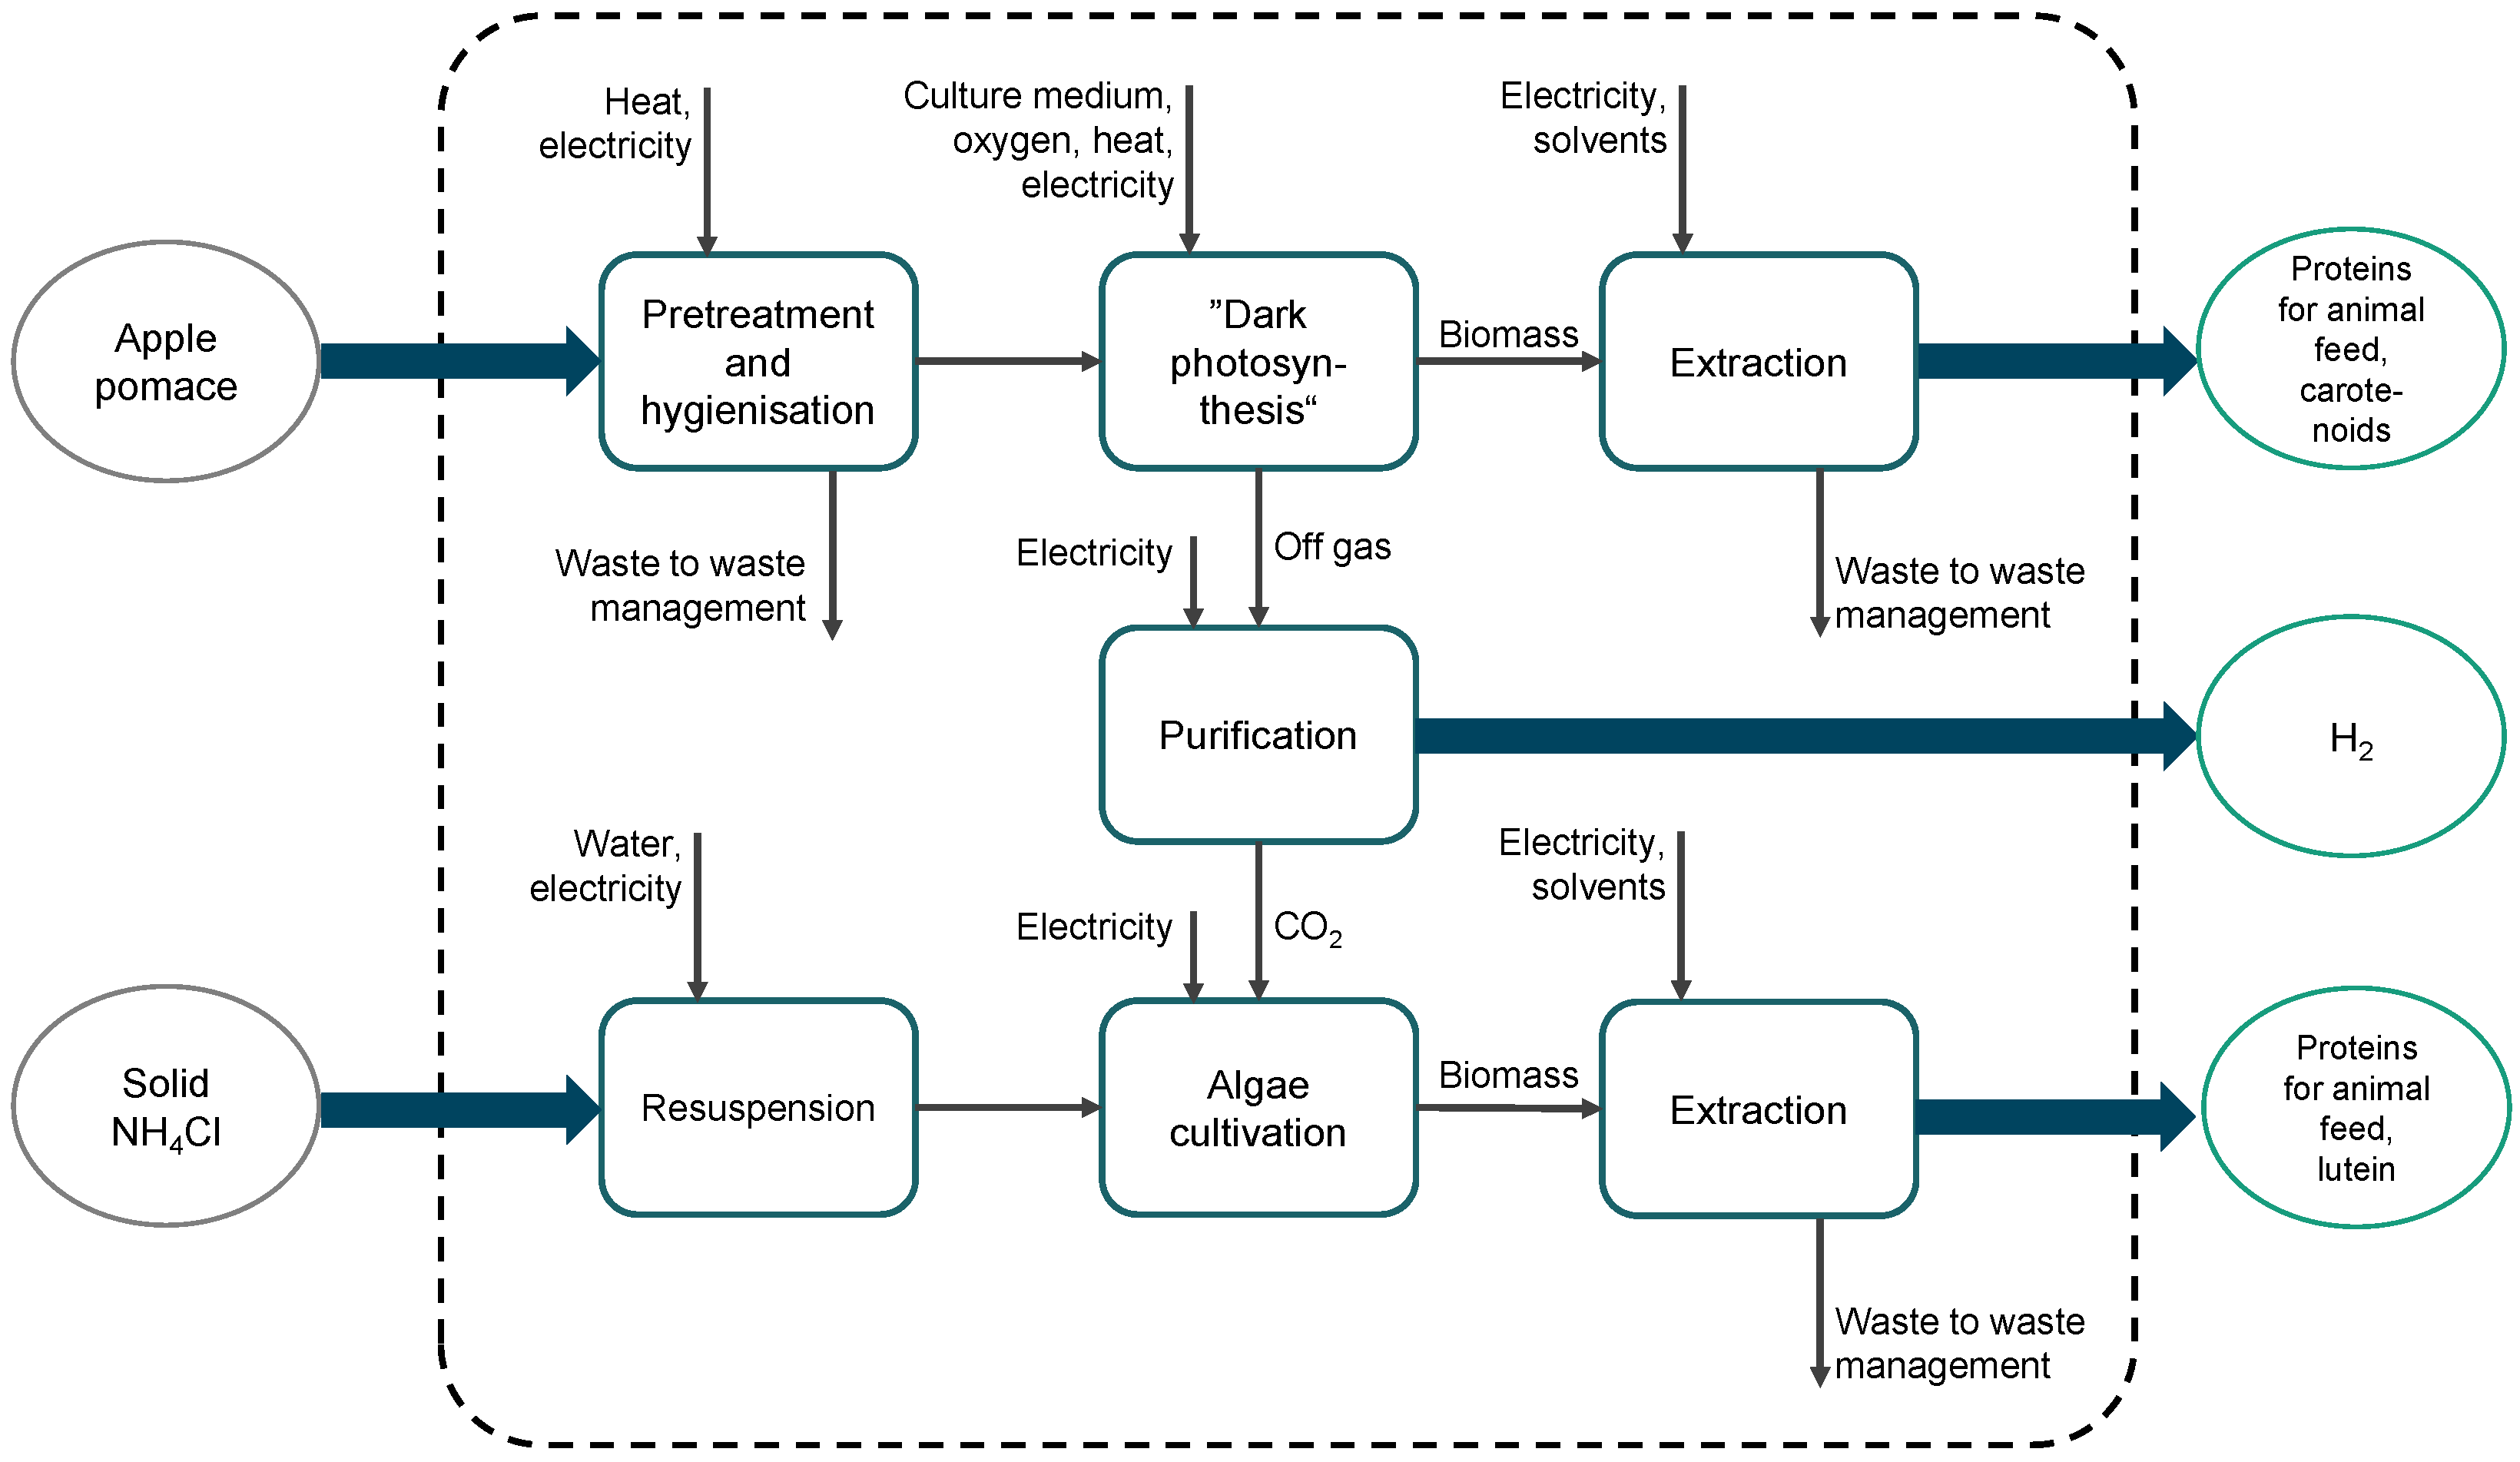
3. Overview of Biorefinery Concept
4. Methods
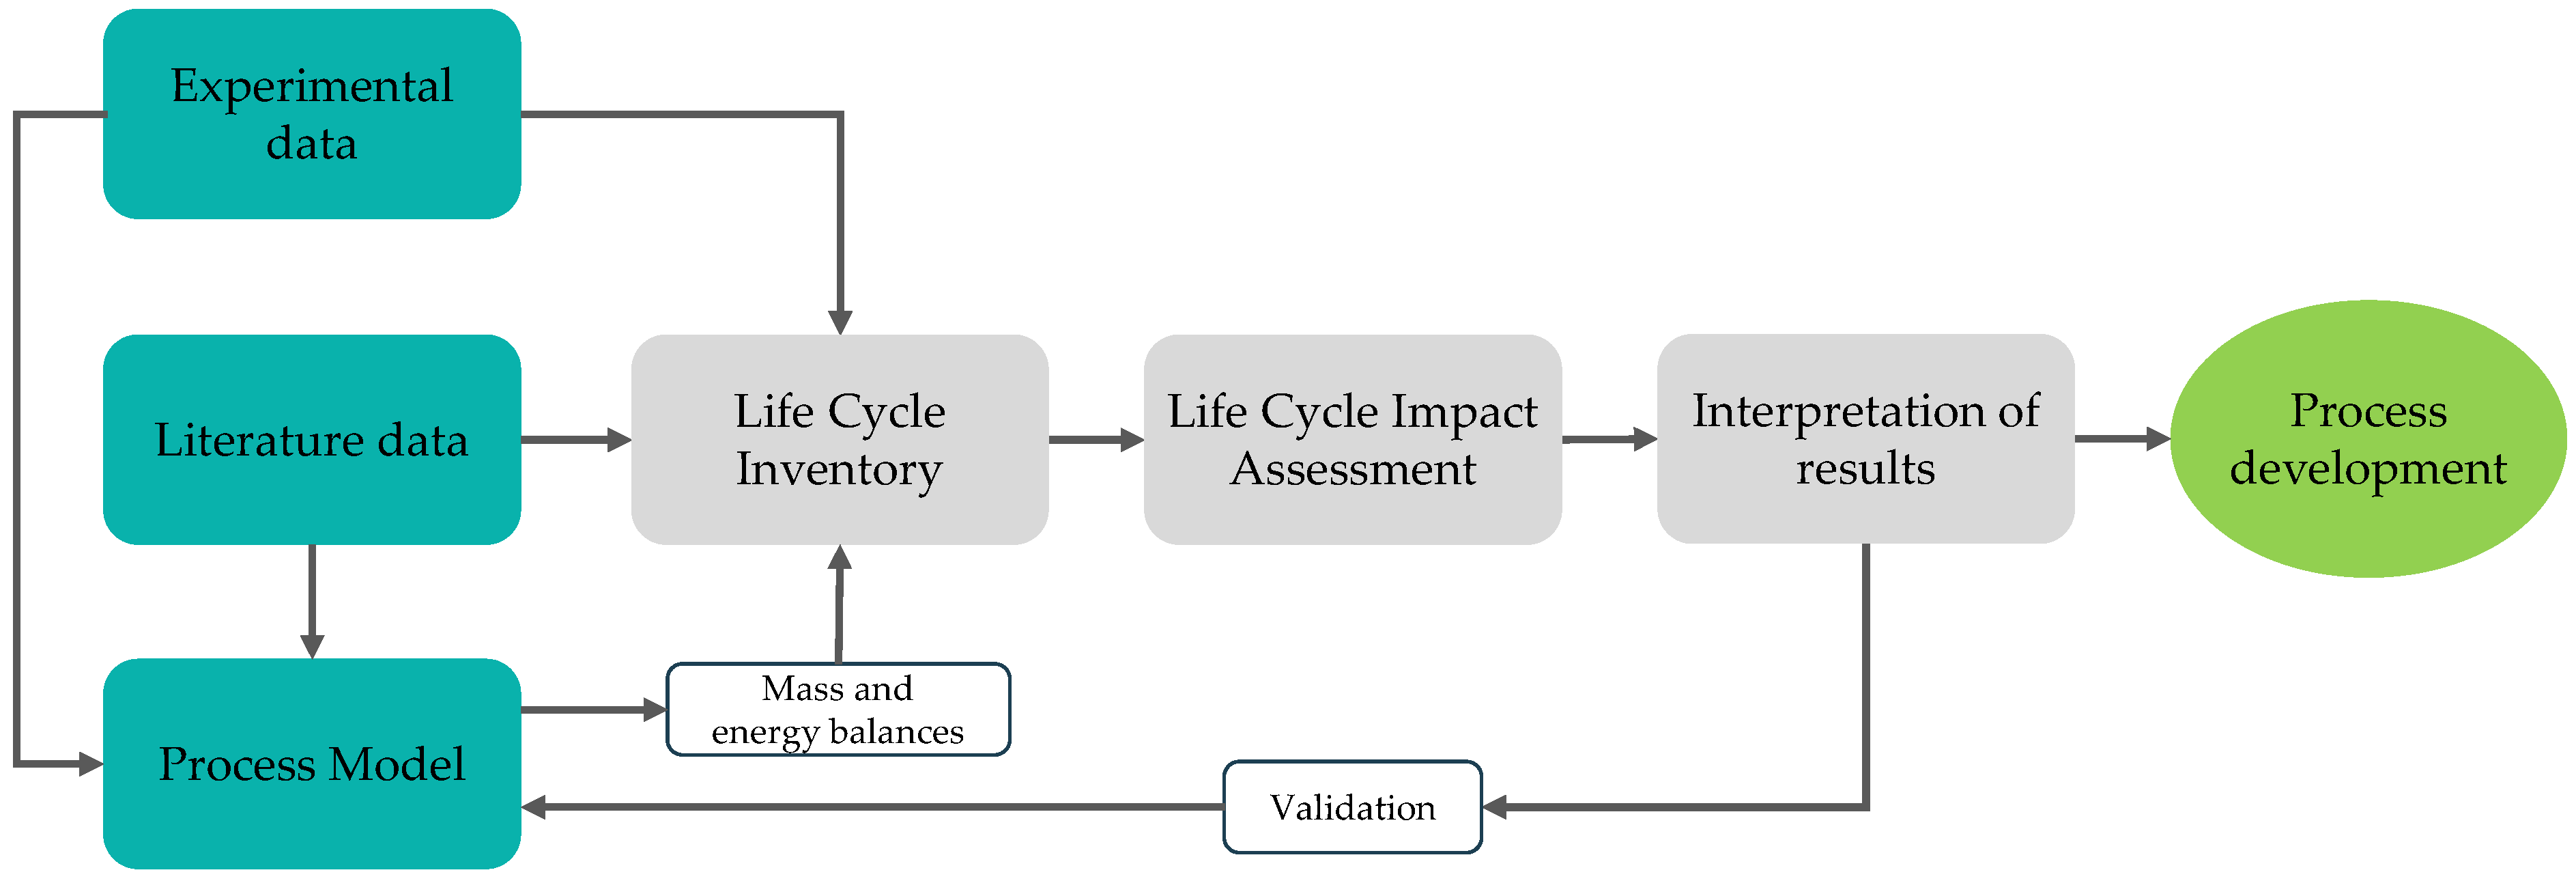
4.1. Process Model
4.2. Environmental Assessment
4.2.1. Goal and Scope Definition
4.2.2. System Boundary and Functional Unit
4.2.3. LCA Impact Categories
4.2.4. Life Cycle Impact Assessment (LCIA)
4.2.5. Other Assessment Criteria
4.2.6. Allocation
5. Results and Discussion
5.1. Process Model
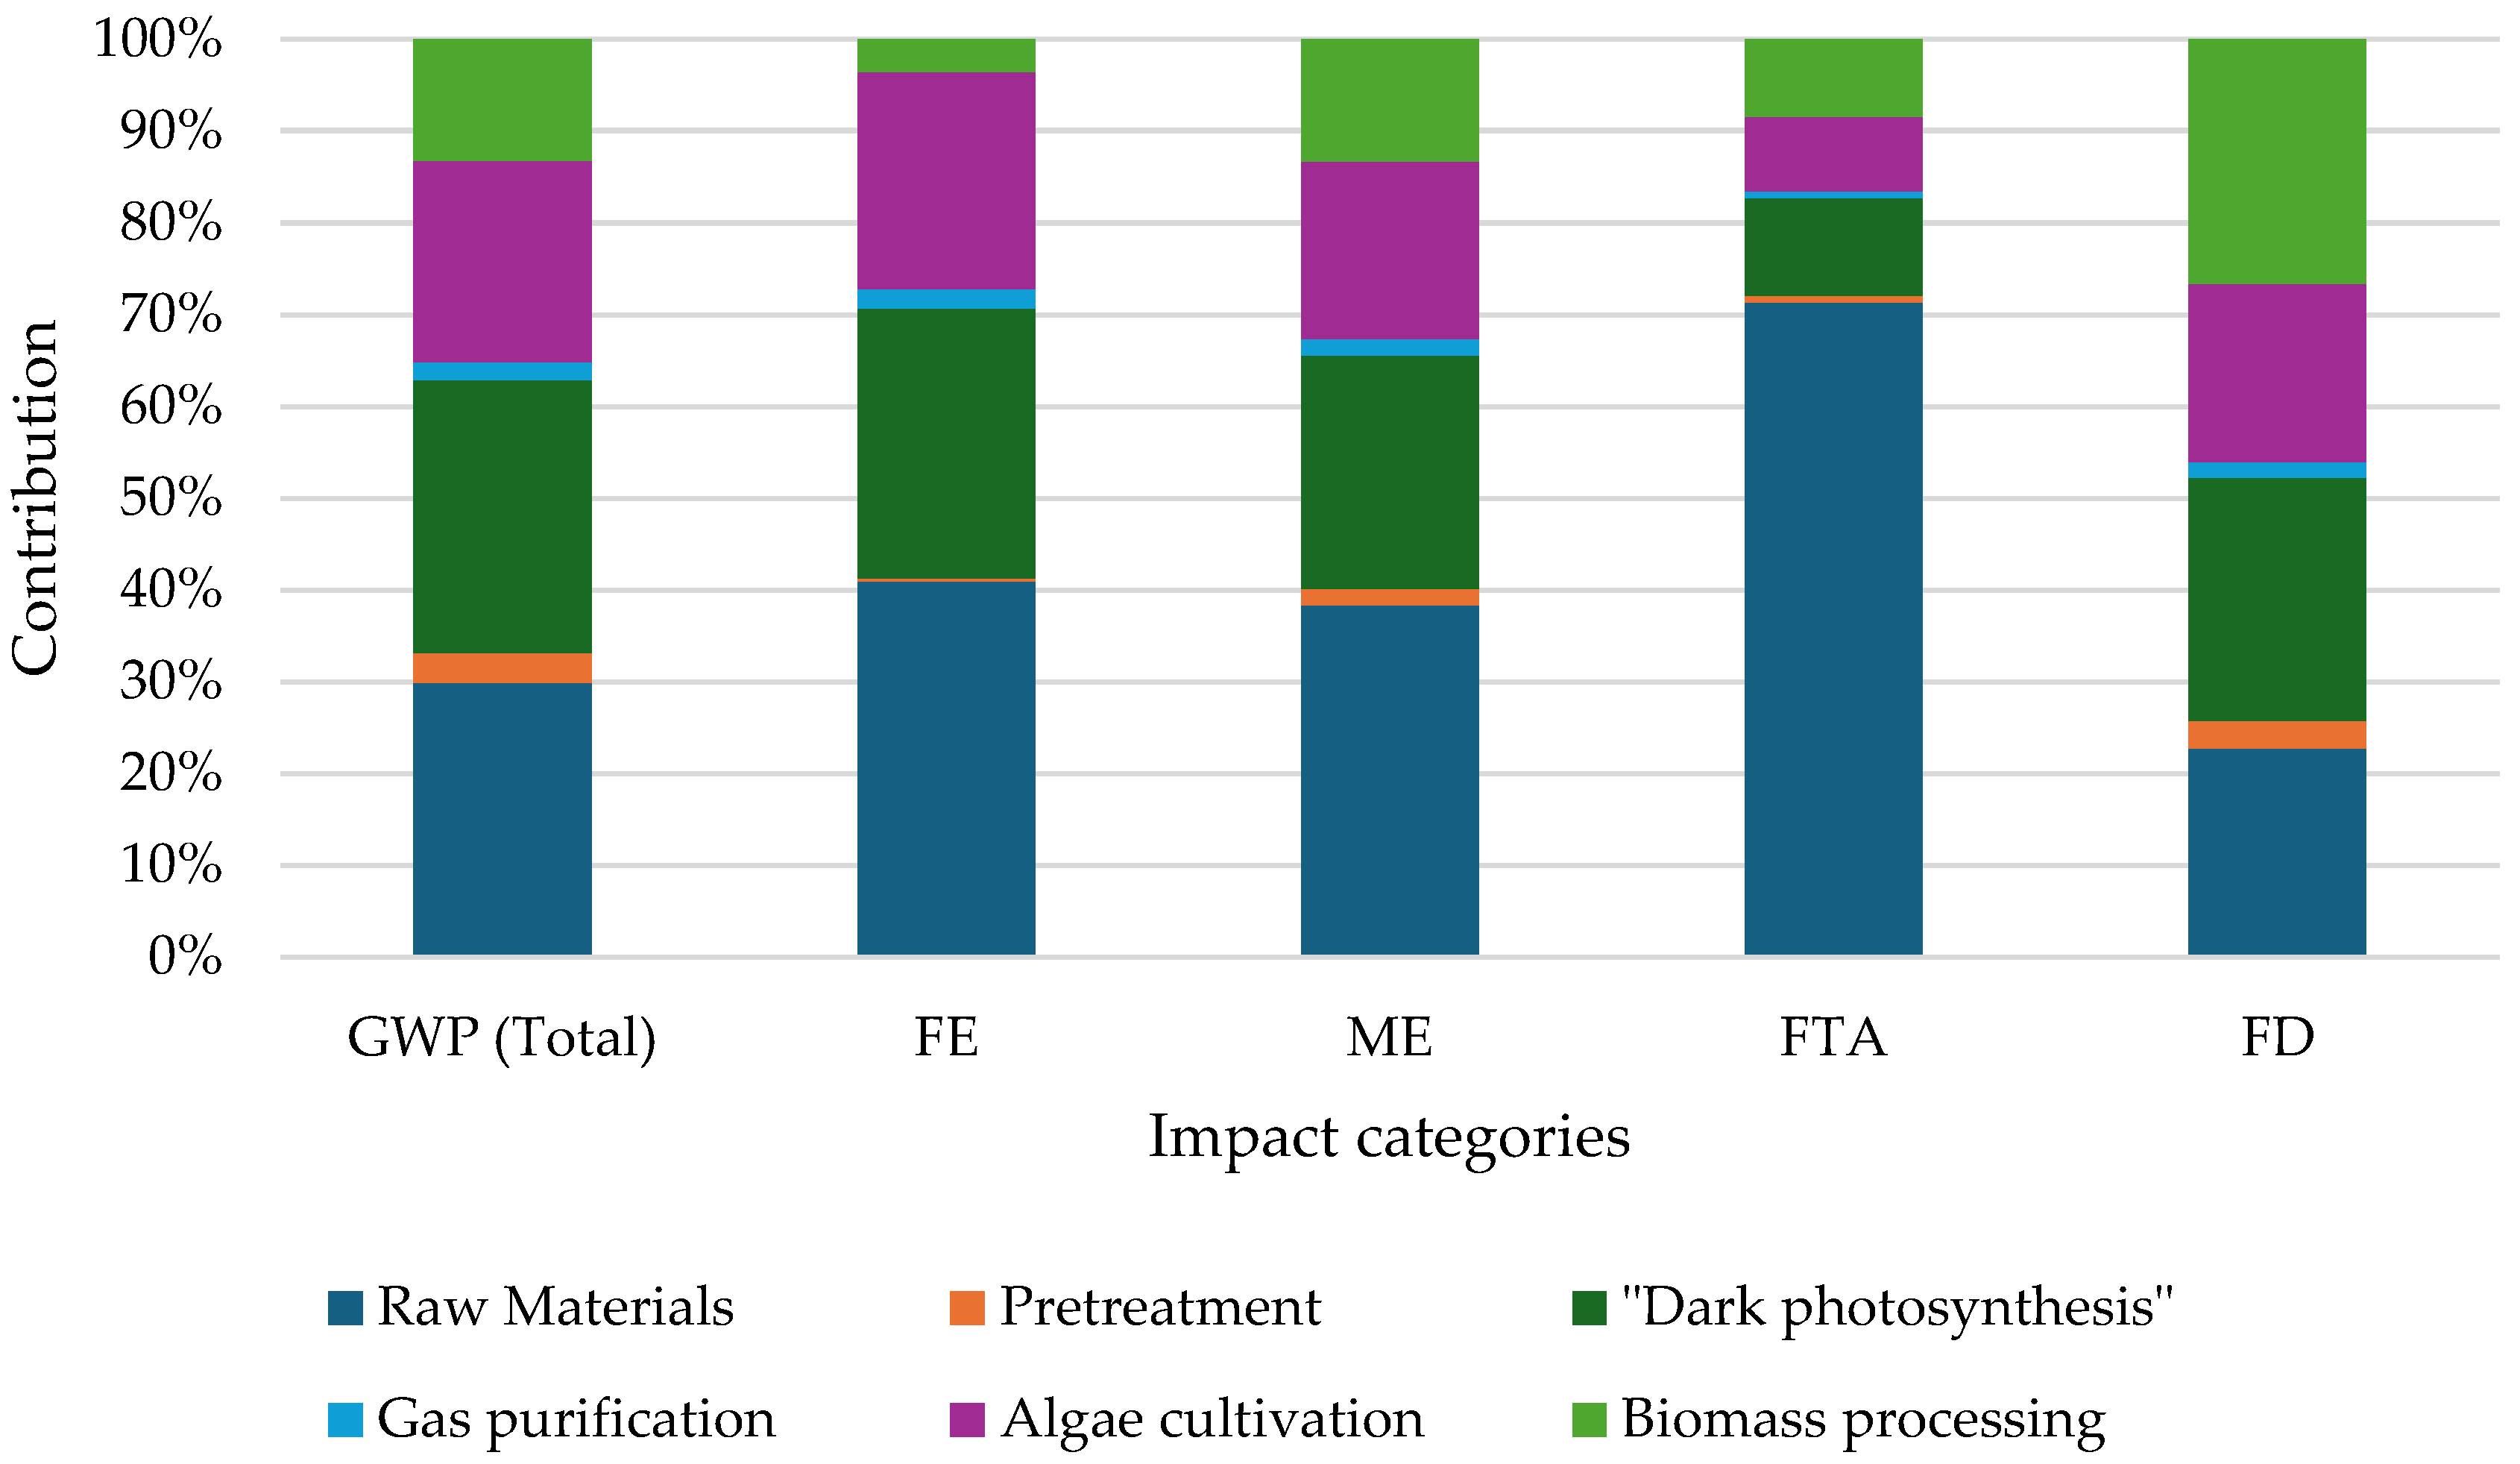
5.2. Life Cycle Assessment
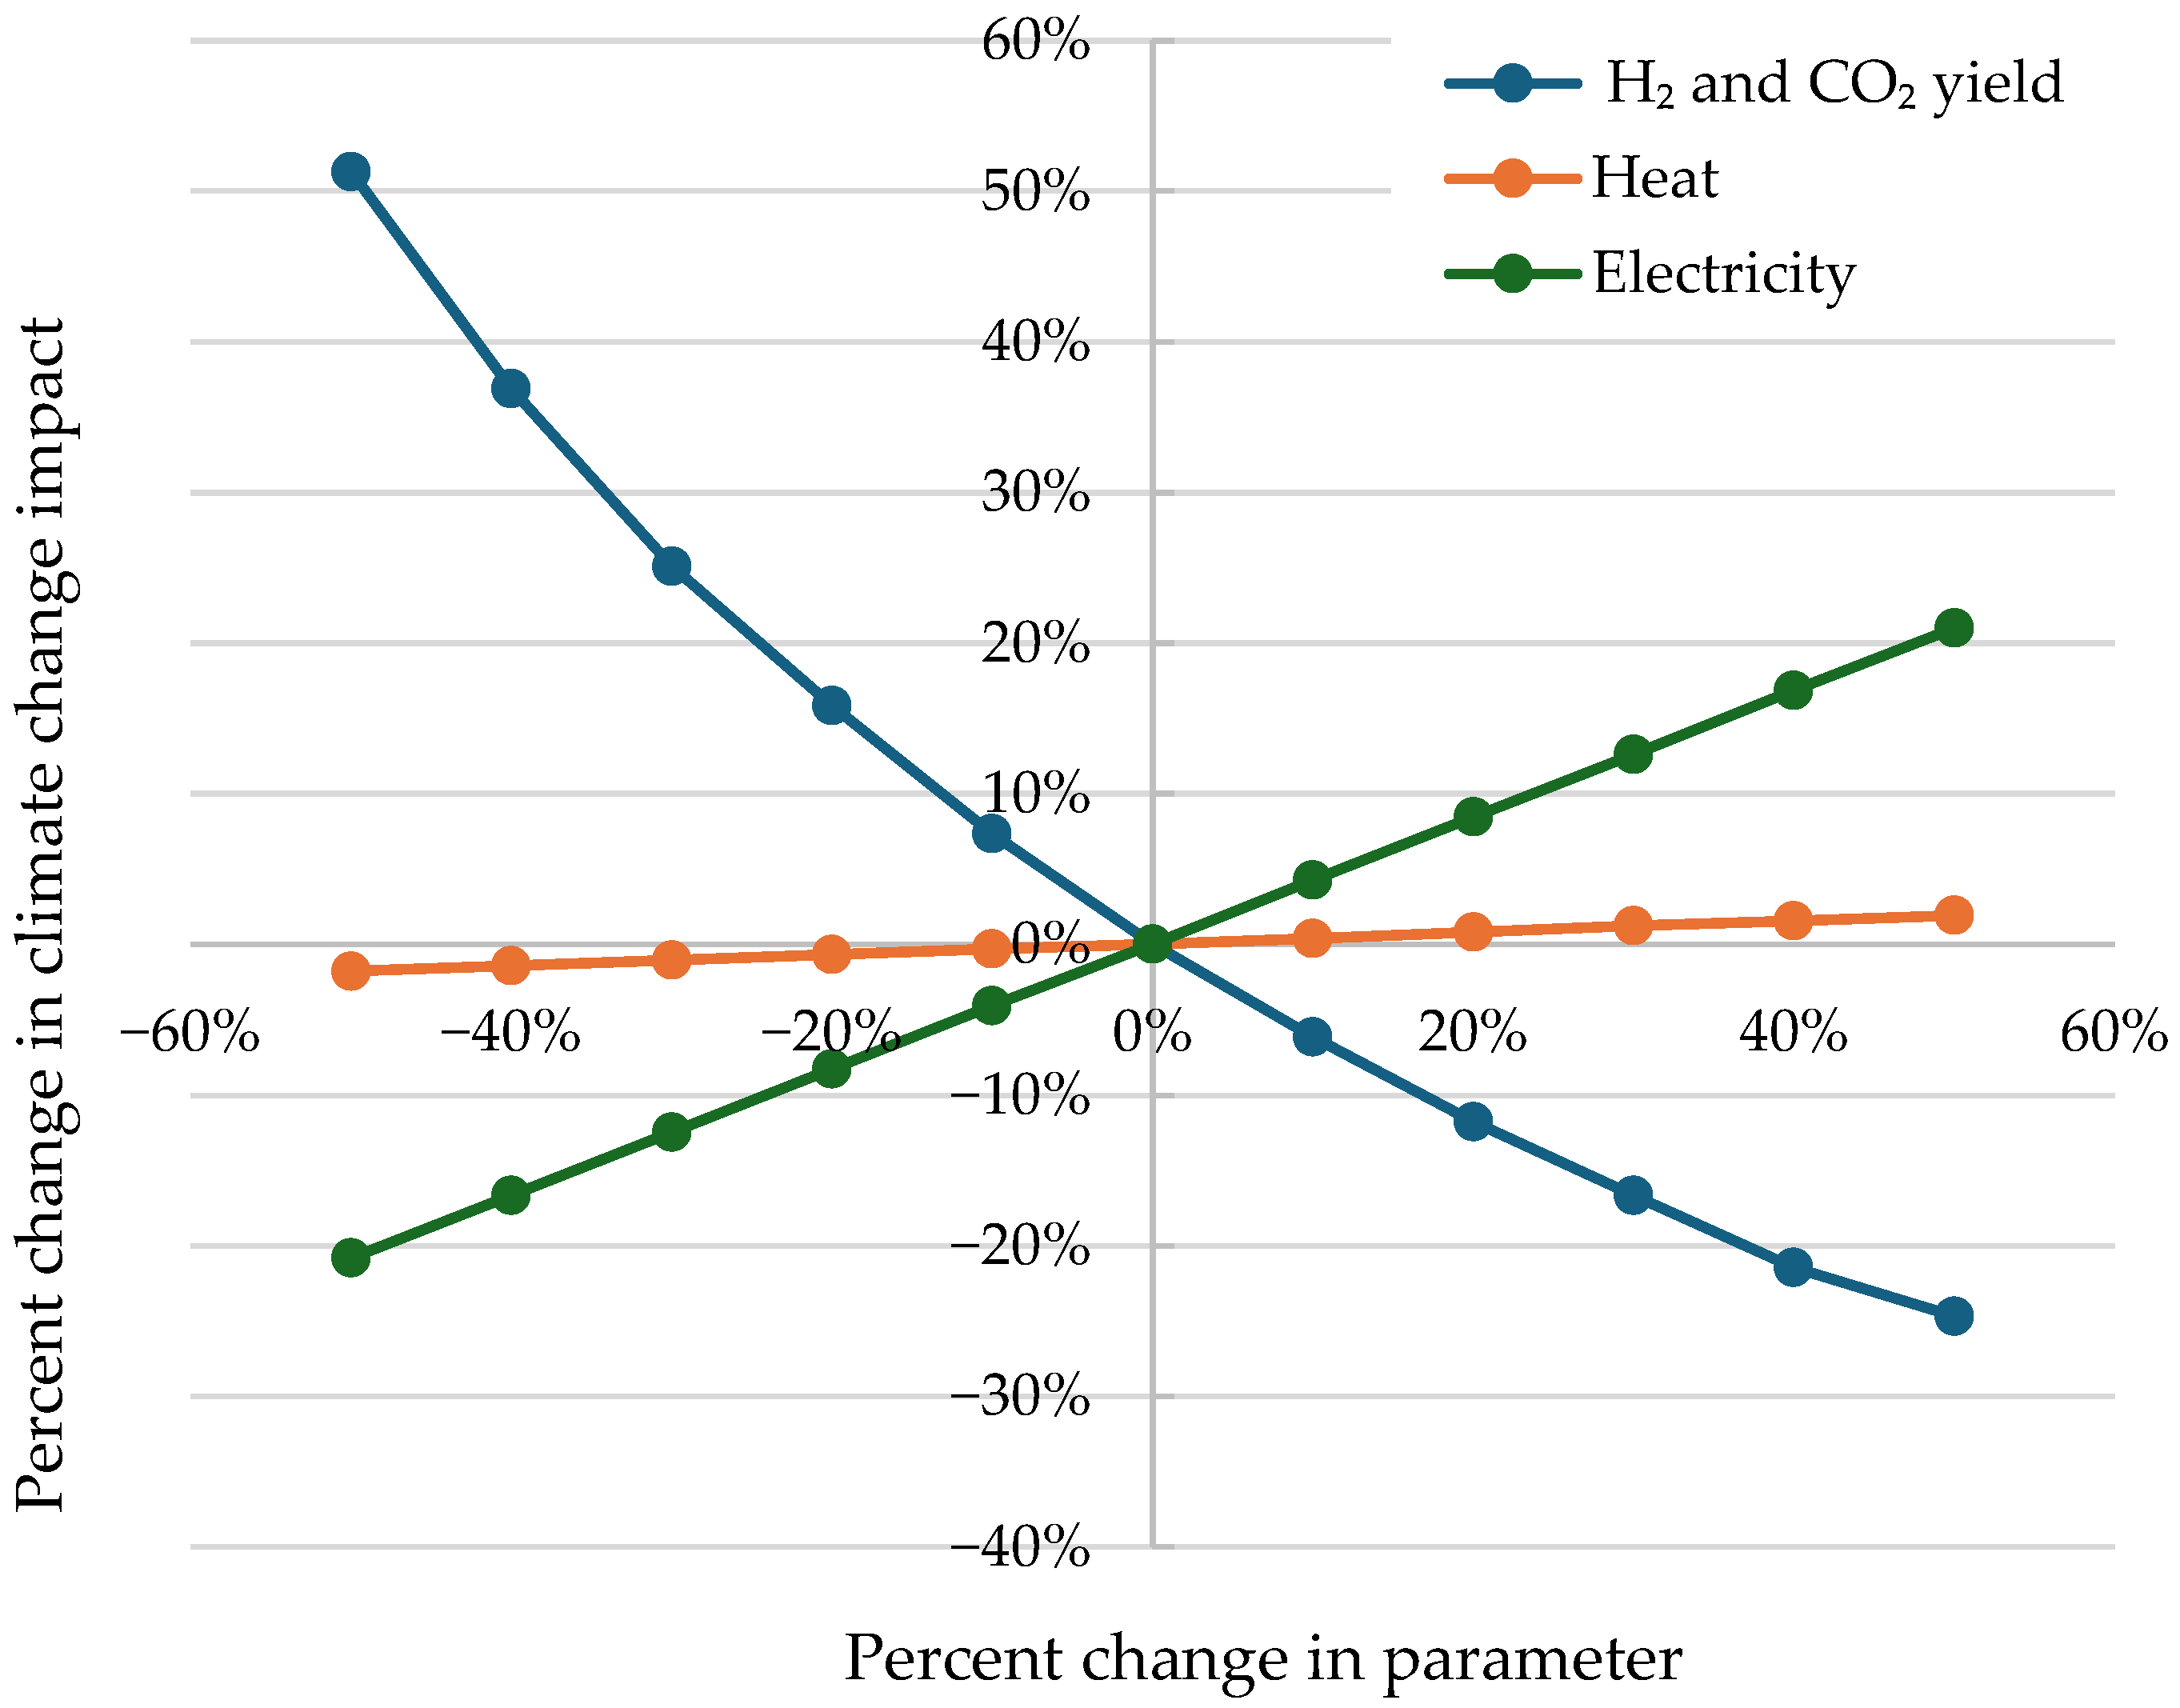
5.3. Sensitivity Analysis
5.4. Other Assessment Criteria
6. Conclusions and Outlook
Author Contributions
Funding
Data Availability Statement
Conflicts of Interest
References
- Our World in Data. Energy: Key Charts. Available online: https://ourworldindata.org/energy-key-charts (accessed on 17 February 2023).
- EIA. International Energy Outlook 2021: With projections to 2050/2021. Available online: https://www.eia.gov/outlooks/ieo/pdf/IEO2021_Narrative.pdf (accessed on 12 August 2024).
- IEA. International Energy Agency. Net Zero by 2050—A Roadmap for the Global Energy Sector. Available online: https://iea.blob.core.windows.net/assets/deebef5d-0c34-4539-9d0c-10b13d840027/NetZeroby2050-ARoadmapfortheGlobalEnergySector_CORR.pdf (accessed on 21 November 2022).
- Masson-Delmotte, V.; Zhai, P.; Pirani, A.; Connors, S.L.; Péan, C.; Berger, S.; Caud, N.; Chen, Y.; Goldfarb, L.; Gomis, M.I. Climate change 2021: The physical science basis. In Contribution of Working Group I to the Sixth Assessment Report of the Intergovernmental Panel on Climate Change; 2021; Volume 2. Available online: https://www.ipcc.ch/report/ar6/wg1/ (accessed on 4 March 2023).
- Lou, Y.; Fan, Z.; Friedmann, J.; Corbeau, A.S.; Agrawal, M.; Khatri, A. The Potential Role of Biohydrogen in Creating a Net-Zero World: The Production and Applications of Carbon-Negative Hydrogen. Available online: https://www.energypolicy.columbia.edu/publications/the-potential-role-of-biohydrogen-in-creating-a-net-zero-world/ (accessed on 11 January 2023).
- Pandey, A.; Chang, J.-S.; Hallenbeck, P.C.; Larroche, C. Biohydrogen; Elsevier: Oxford, UK, 2013; ISBN 9780444595485. [Google Scholar]
- Levin, D.B.; Pitt, L.; Love, M. Biohydrogen production: Prospects and limitations to practical application. Int. J. Hydrogen Energy 2004, 29, 173–185. [Google Scholar] [CrossRef]
- Kaza, S.; Yao, L.C.; Bhada-Tata, P.; van Woerden, F. What a Waste 2.0: Aglobal Snapshot of Solid Waste Management to 2050; Urban Development Series; 2018; Available online: http://hdl.handle.net/10986/30317 (accessed on 11 March 2023).
- World Energy Council. World Energy Resources. 2016. Available online: https://www.worldenergy.org/publications/entry/world-energy-resources-2016 (accessed on 28 January 2023).
- Lui, J.; Chen, W.-H.; Tsang, D.C.; You, S. A critical review on the principles, applications, and challenges of waste-to-hydrogen technologies. Renew. Sustain. Energy Rev. 2020, 134, 110365. [Google Scholar] [CrossRef]
- Lam, K.F.; Leung, C.C.J.; Lei, H.M.; Lin, C.S.K. Economic feasibility of a pilot-scale fermentative succinic acid production from bakery wastes. Food Bioprod. Process. 2014, 92, 282–290. [Google Scholar] [CrossRef]
- Saveyn, H.; Eder, P.; Ramsay, M.; Thonier, G.; Warren, K.; Hestin, M. Towards a Better Exploitation of the Technical Potential of Waste-to-Energy. Seville Eur. Comm. 2016. Available online: https://publications.jrc.ec.europa.eu/repository/handle/JRC104013 (accessed on 3 February 2023).
- Pariatamby, A.; Cheah, W.Y.; Shrizal, R.; Thamlarson, N.; Lim, B.T.; Barasarathi, J. Enhancement of landfill methane oxidation using different types of organic wastes. Environ. Earth Sci. 2015, 73, 2489–2496. [Google Scholar] [CrossRef]
- González, R.; Peña, D.C.; Gómez, X. Anaerobic Co-Digestion of Wastes: Reviewing Current Status and Approaches for Enhancing Biogas Production. Appl. Sci. 2022, 12, 8884. [Google Scholar] [CrossRef]
- Liu, C.; Ren, L.; Yan, B.; Luo, L.; Zhang, J.; Awasthi, M.K. Electron transfer and mechanism of energy production among syntrophic bacteria during acidogenic fermentation: A review. Bioresour. Technol. 2021, 323, 124637. [Google Scholar] [CrossRef]
- Hosseinzadeh, A.; Zhou, J.L.; Li, X.; Afsari, M.; Altaee, A. Techno-economic and environmental impact assessment of hydrogen production processes using bio-waste as renewable energy resource. Renew. Sustain. Energy Rev. 2022, 156, 111991. [Google Scholar] [CrossRef]
- Handreichung Biogasgewinnung und -Nutzung; FNR; Fachagentur Nachwachsende Rohstoffe: Gülzow, Germany, 2016; ISBN 3000143335.
- Wang, S.; Xu, C.; Song, L.; Zhang, J. Anaerobic Digestion of Food Waste and Its Microbial Consortia: A Historical Review and Future Perspectives. Int. J. Environ. Res. Public Health 2022, 19, 9519. [Google Scholar] [CrossRef]
- Harirchi, S.; Wainaina, S.; Sar, T.; Nojoumi, S.A.; Parchami, M.; Parchami, M.; Varjani, S.; Khanal, S.K.; Wong, J.; Awasthi, M.K.; et al. Microbiological insights into anaerobic digestion for biogas, hydrogen or volatile fatty acids (VFAs): A review. Bioengineered 2022, 13, 6521–6557. [Google Scholar] [CrossRef]
- Khan, M.A.; Ngo, H.H.; Guo, W.; Liu, Y.; Zhang, X.; Guo, J.; Chang, S.W.; Nguyen, D.D.; Wang, J. Biohydrogen production from anaerobic digestion and its potential as renewable energy. Renew. Energy 2018, 129, 754–768. [Google Scholar] [CrossRef]
- Cherubini, F. The biorefinery concept: Using biomass instead of oil for producing energy and chemicals. Energy Convers. Manag. 2010, 51, 1412–1421. [Google Scholar] [CrossRef]
- Full, J.; Miehe, R.; Kiemel, S.; Bauernhansl, T.; Sauer, A. The Biological Transformation of Energy Supply and Storage–Technologies and Scenarios for Biointelligent Value Creation. Procedia Manuf. 2019, 39, 1204–1214. [Google Scholar] [CrossRef]
- Cherubini, F.; Jungmeier, G.; Wellisch, M.; Willke, T.; Skiadas, I.; van Ree, R.; de Jong, E. Toward a common classification approach for biorefinery systems. Biofuels Bioprod. Bioref. 2009, 3, 534–546. [Google Scholar] [CrossRef]
- Ahmed, S.F.; Kabir, M.; Mehjabin, A.; Oishi, F.T.Z.; Ahmed, S.; Mannan, S.; Mofijur, M.; Almomani, F.; Badruddin, I.A.; Kamangar, S. Waste biorefinery to produce renewable energy: Bioconversion process and circular bioeconomy. Energy Rep. 2023, 10, 3073–3091. [Google Scholar] [CrossRef]
- Pandey, A.; Bhaskar, T.; Mohan, S.V.; Lee, D.-J.; Khanal, S.K. (Eds.) Waste Biorefinery: Potential and Perspectives; Elsevier: San Diego, CA, USA, 2018; ISBN 978-0-444-63992-9. [Google Scholar]
- Sbarciog, M.; de Buck, V.; Akkermans, S.; Bhonsale, S.; Polanska, M.; van Impe, J.F.M. Design, Implementation and Simulation of a Small-Scale Biorefinery Model. Processes 2022, 10, 829. [Google Scholar] [CrossRef]
- Sarkar, O.; Katakojwala, R.; Venkata Mohan, S. Low carbon hydrogen production from a waste-based biorefinery system and environmental sustainability assessment. Green Chem. 2021, 23, 561–574. [Google Scholar] [CrossRef]
- Götz, M.; Lask, J.; Lewandowski, I.; Kruse, A. Comparative LCA studies of simulated HMF biorefineries from maize and miscanthus as an example of first- and second-generation biomass as a tool for process development. Glob. Change Biol. Bioenergy 2023, 15, 1011–1029. [Google Scholar] [CrossRef]
- Gonzalez-Garcia, S.; Gullón, B.; Moreira, M.T. Environmental assessment of biorefinery processes for the valorization of lignocellulosic wastes into oligosaccharides. J. Clean. Prod. 2018, 172, 4066–4073. [Google Scholar] [CrossRef]
- Eixenberger, D.; Carballo-Arce, A.-F.; Vega-Baudrit, J.-R.; Trimino-Vazquez, H.; Villegas-Peñaranda, L.R.; Stöbener, A.; Aguilar, F.; Mora-Villalobos, J.-A.; Sandoval-Barrantes, M.; Bubenheim, P.; et al. Tropical agroindustrial biowaste revalorization through integrative biorefineries—Review part II: Pineapple, sugarcane and banana by-products in Costa Rica. Biomass Conv. Bioref. 2022, 14, 4391–4418. [Google Scholar] [CrossRef]
- Parajuli, R.; Knudsen, M.T.; Djomo, S.N.; Corona, A.; Birkved, M.; Dalgaard, T. Environmental life cycle assessment of producing willow, alfalfa and straw from spring barley as feedstocks for bioenergy or biorefinery systems. Sci. Total Environ. 2017, 586, 226–240. [Google Scholar] [CrossRef]
- Morakile, T.; Mandegari, M.; Farzad, S.; Görgens, J. Comparative techno-economic assessment of sugarcane biorefineries producing glutamic acid, levulinic acid and xylitol from sugarcane. Ind. Crops Prod. 2022, 184, 115053. [Google Scholar] [CrossRef]
- Albarelli, J.Q.; Santos, D.T.; Cocero, M.J.; Meireles, M.A.A. Economic Analysis of an Integrated Annatto Seeds-Sugarcane Biorefinery Using Supercritical CO2 Extraction as a First Step. Materials 2016, 9, 494. [Google Scholar] [CrossRef] [PubMed]
- Full, J.; Geller, M.; Ziehn, S.; Schließ, T.; Miehe, R.; Sauer, A. Carbon-negative hydrogen production (HyBECCS): An exemplary techno-economic and environmental assessment. Int. J. Hydrogen Energy 2023, 52, 594–609. [Google Scholar] [CrossRef]
- Pérez-Almada, D.; Galán-Martín, Á.; Del Contreras, M.M.; Castro, E. Integrated techno-economic and environmental assessment of biorefineries: Review and future research directions. Sustain. Energy Fuels 2023, 7, 4031–4050. [Google Scholar] [CrossRef]
- Buchner, G.A.; Zimmermann, A.W.; Hohgräve, A.E.; Schomäcker, R. Techno-economic Assessment Framework for the Chemical Industry—Based on Technology Readiness Levels. Ind. Eng. Chem. Res. 2018, 57, 8502–8517. [Google Scholar] [CrossRef]
- Moussa, R.N.; Moussa, N.; Dionisi, D. Hydrogen Production from Biomass and Organic Waste Using Dark Fermentation: An Analysis of Literature Data on the Effect of Operating Parameters on Process Performance. Processes 2022, 10, 156. [Google Scholar] [CrossRef]
- Lyu, F.; Luiz, S.F.; Azeredo, D.R.P.; Cruz, A.G.; Ajlouni, S.; Ranadheera, C.S. Apple Pomace as a Functional and Healthy Ingredient in Food Products: A Review. Processes 2020, 8, 319. [Google Scholar] [CrossRef]
- Kaiser, D.; Bertau, M. Enzymatic Hydrolysis and Fermentation of Apple Pomace. Chem. Ing. Tech. 2020, 92, 1772–1779. [Google Scholar] [CrossRef]
- Ahlborn, J.; Stephan, A.; Meckel, T.; Maheshwari, G.; Rühl, M.; Zorn, H. Upcycling of food industry side streams by basidiomycetes for production of a vegan protein source. Int. J. Recycl. Org. Waste Agric. 2019, 8, 447–455. [Google Scholar] [CrossRef]
- Autenrieth, C.; Shaw, S.; Ghosh, R. New Approach for the Construction and Calibration of Gas-Tight Setups for Biohydrogen Production at the Small Laboratory Scale. Metabolites 2021, 11, 667. [Google Scholar] [CrossRef]
- Ghosh, R.; Hardmeyer, A.; Thoenen, I.; Bachofen, R. Optimization of the Sistrom Culture Medium for Large-Scale Batch Cultivation of Rhodospirillum rubrum under Semiaerobic Conditions with Maximal Yield of Photosynthetic Membranes. Appl. Environ. Microbiol. 1994, 60, 1698–1700. [Google Scholar] [CrossRef]
- Dögnitz, N.; Hauschild, S.; Cyffka, K.F.; Meisel, K.; Dietrich, S.; Müller-Langer, F.; Majer, S.; Kretzschmar, J.; Schmidt, C.; Reinholz, T.; et al. Wasserstoff aus Biomasse: Kurzstudie im Auftrag des Bundesministeriums für Ernährung und Landwirtschaft; No. 46; DBFZ: Leipzig, Germany, 2022. [Google Scholar]
- Ghosh, R. Prof. Dr. Culture Medium for Microorganisms, 28 January 2000. Available online: https://worldwide.espacenet.com/publicationDetails/biblio?FT=D&date=20010807&DB=EPODOC&locale=&CC=AU&NR=4235501A&KC=A&ND=1# (accessed on 9 June 2022).
- Aganovic, K.; Smetana, S.; Grauwet, T.; Toepfl, S.; Mathys, A.; van Loey, A.; Heinz, V. Pilot scale thermal and alternative pasteurization of tomato and watermelon juice: An energy comparison and life cycle assessment. J. Clean. Prod. 2017, 141, 514–525. [Google Scholar] [CrossRef]
- Zeiger, L.; Grammel, H. Model-based high cell density cultivation of Rhodospirillum rubrum under respiratory dark conditions. Biotechnol. Bioeng. 2010, 105, 729–739. [Google Scholar] [CrossRef] [PubMed]
- Favier-Teodorescu, L.; Cornet, J.F.; Dussap, C.G. Modelling continuous culture of Rhodospirillum rubrum in photobioreactor under light limited conditions. Biotechnol. Lett. 2003, 25, 359–364. [Google Scholar] [CrossRef]
- Bóna-Lovász, J.; Bóna, A.; Ederer, M.; Sawodny, O.; Ghosh, R. A rapid method for the extraction and analysis of carotenoids and other hydrophobic substances suitable for systems biology studies with photosynthetic bacteria. Metabolites 2013, 3, 912–930. [Google Scholar] [CrossRef] [PubMed]
- Ahiahonu, E.K.; Anku, W.W.; Roopnarain, A.; Green, E.; Govender, P.P.; Serepa-Dlamini, M.H. Bioprospecting wild South African microalgae as a potential third-generation biofuel feedstock, biological carbon-capture agent and for nutraceutical applications. Biomass Conv. Bioref. 2021, 13, 6897–6912. [Google Scholar] [CrossRef]
- Gowen, D. Technical, Economic and Environmental Assessment of Biorefinery Concepts: Developing a Practical approach for Characterisation. 2019. Available online: https://www.ieabioenergy.com/wp-content/uploads/2019/07/TEE_assessment_report_final_20190704-1.pdf (accessed on 26 April 2022).
- Angouria-Tsorochidou, E.; Teigiserova, D.A.; Thomsen, M. Environmental and economic assessment of decentralized bioenergy and biorefinery networks treating urban biowaste. Resour. Conserv. Recycl. 2022, 176, 105898. [Google Scholar] [CrossRef]
- Lokesh, K.; Clark, J.; Mathuru, A. Downstream Environmental Assessment. Transit. Towards A Sustain. Biobased Econ. 2020, 64, 44. [Google Scholar]
- DIN EN ISO 14044; ISO. Umweltmanagement—Ökobilanz—Anforderungen und Anleitungen. Available online: https://www.dinmedia.de/de/norm/din-en-iso-14044/279938986 (accessed on 14 April 2022).
- Gnansounou, E. Chapter 2—Fundamentals of Life Cycle Assessment and Specificity of Biorefineries. In Life-Cycle Assessment of Biorefineries; Gnansounou, E., Pandey, A., Eds.; Elsevier: Amsterdam, The Netherlands, 2017; pp. 41–75. ISBN 978-0-444-63585-3. [Google Scholar]
- Patel, G.H.; Havukainen, J.; Horttanainen, M.; Soukka, R.; Tuomaala, M. Climate change performance of hydrogen production based on life cycle assessment. Green Chem. 2024, 26, 992–1006. [Google Scholar] [CrossRef]
- Heijungs, R.; Guinée, J.B. Allocation and ‘what-if’ scenarios in life cycle assessment of waste management systems. Waste Manag. 2007, 27, 997–1005. [Google Scholar] [CrossRef]
- Manish, S.; Banerjee, R. Comparison of biohydrogen production processes. Int. J. Hydrogen Energy 2008, 33, 279–286. [Google Scholar] [CrossRef]
- Djomo, S.N.; Humbert, S.; Blumberga, D. Life cycle assessment of hydrogen produced from potato steam peels. Int. J. Hydrogen Energy 2008, 33, 3067–3072. [Google Scholar] [CrossRef]
- Zech, K.; Oehmichen, K.; Grasemann, E.; Michaelis, J.; Funke, S.; Seiffert, M. Technical, economic and environmental assessment of technologies for the production of biohydrogen and its distribution. Int. J. Hydrogen Energy 2015, 40, 5487–5495. [Google Scholar] [CrossRef]
- Reaño, R.L. Assessment of environmental impact and energy performance of rice husk utilization in various biohydrogen production pathways. Bioresour. Technol. 2020, 299, 122590. [Google Scholar] [CrossRef] [PubMed]
- Djomo, S.N.; Blumberga, D. Comparative life cycle assessment of three biohydrogen pathways. Bioresour. Technol. 2011, 102, 2684–2694. [Google Scholar] [CrossRef] [PubMed]
- Hajjaji, N.; Martinez, S.; Trably, E.; Steyer, J.-P.; Helias, A. Life cycle assessment of hydrogen production from biogas reforming. Int. J. Hydrogen Energy 2016, 41, 6064–6075. [Google Scholar] [CrossRef]
- Chen, Y.; Ho, S.-H.; Nagarajan, D.; Ren, N.-Q.; Chang, J.-S. Waste biorefineries—Integrating anaerobic digestion and microalgae cultivation for bioenergy production. Curr. Opin. Biotechnol. 2018, 50, 101–110. [Google Scholar] [CrossRef]
- Camacho, C.I.; Estévez, S.; Conde, J.J.; Feijoo, G.; Moreira, M.T. Dark fermentation as an environmentally sustainable WIN-WIN solution for bioenergy production. J. Clean. Prod. 2022, 374, 134026. [Google Scholar] [CrossRef]
- Ramírez-Díaz, R.C.; Prato-Garcia, D.; Vasquez-Medrano, R. How sustainable is the biohydrogen produced from sugarcane vinasse? An approach based on life cycle assessment. Biomass Conv. Bioref. 2023, 13, 14755–14775. [Google Scholar] [CrossRef]
- Aristizábal-Marulanda, V.; Cardona Alzate, C.A. Methods for designing and assessing biorefineries: Review. Biofuels Bioprod. Bioref. 2019, 13, 789–808. [Google Scholar] [CrossRef]
- Modahl, I.S.; Brekke, A.; Valente, C. Environmental assessment of chemical products from a Norwegian biorefinery. J. Clean. Prod. 2015, 94, 247–259. [Google Scholar] [CrossRef]
- Madabhushi, S.R.; Pinto, N.D.S.; Lin, H. Comparison of process mass intensity (PMI) of continuous and batch manufacturing processes for biologics. New Biotechnol. 2022, 72, 122–127. [Google Scholar] [CrossRef] [PubMed]


| Component | Value | Unit |
|---|---|---|
| NH4Cl feed rate | 3.11 | g/h |
| NH4Cl conversion fraction | 0.756 | - |
| CO2 feed rate | 47.04 | g/h |
| CO2 conversion fraction | 0.249 | - |
| Algal biomass mass yield fraction | 0.13 | - |
| NH4Cl mass yield fraction | 0.015 | - |
| CO2 mass yield fraction | 0.704 | - |
| Indicator | Description | Unit |
| Waste factor | Amount of waste produced for all products and co-products | kg waste/kg product |
| Feedstock intensity | Mass of feedstock needed to produce all products and co-products | kg of feedstock/kg product |
| Energy intensity | Energy needed to produce all products and co-products | kWh/kg product |
| Hazardous chemical use | Qualitative indicator for the use of hazardous chemicals in the production process | Good/Bad |
| Component | Value | Unit |
|---|---|---|
| H2 | 0.25 | mol/mol fructose |
| 2.80 × 10⁻³ | g/g fructose | |
| Biomass | 0.33 | g/g fructose |
| Protein for animal feed | 0.18 | g/g fructose |
| β-carotene | 6.64 × 10⁻³ | g/g fructose |
| Component | Value | Unit |
|---|---|---|
| CO2 fixed | 1.13 | kg |
| NH4Cl used | 85.1 | g |
| Algal biomass | 737 | g |
| Lutein | 3.69 | g |
| Protein for animal feed | 295 | g |
| Impact Category | Value | Unit |
|---|---|---|
| GWP (fossil) | 24.4 | kg CO2-eq |
| Freshwater eutrophication | 0.036 | kg P-eq |
| Marine eutrophication | 0.020 | kg N-eq |
| Freshwater and terrestrial acidification | 0.180 | mol H+-eq |
| Fossil depletion | 351.2 | MJ |
| Cumulative energy demand | 419.4 | MJ |
| Reference | Feedstock | Conversion Platform | GWP (kg CO2-eq/kg H2) | Remarks |
|---|---|---|---|---|
| This study | Apple pomace | DP + PF | 24.4 | Gate-to-gate scope. No credits assigned for co-products |
| Zech et al. [59] | Biomass (not specified) | DF | 5.28 | Considered hydrogen distribution |
| Reaño [60] | Rice husk | DF | 10.92 | Gate-to-gate scope |
| Djomo et al. [61] | Steam potato peels | DF + PF | 5.18 | Considered use phase of hydrogen in transport sector. Results do not consider co-products (animal feed) |
| Djomo et al. [61] | Sweet sorghum stalk | DF + PF | 5.32 | Considered use phase of hydrogen in transport sector. Results do not consider co-products (animal feed) |
| Djomo et al. [61] | Wheat straw | DF + PF | 5.6 | Considered use phase of hydrogen in transport sector. Results do not consider co-products (animal feed) |
| Hajjaji et al. [62] | Organic waste (not specified) | AD + SMR | 5.59 | Accounted for avoided emissions from fertilizer production (co-product) |
| Chen et al. [63] | Lignocellulosic waste | Gasification | 4.41 | Cradle-to-grave scope. The concept uses solar energy to cover electricity demand |
| Reaño [60] | Rice husk | Gasification | 20.1 | Gate-to-gate scope |
| Zech et al. [59] | Biomass (not specified) | Gasification | 4.08 | Considered hydrogen distribution |
| Indicator | Value | Unit |
|---|---|---|
| Waste factor | 2.13 | kg waste/kg product |
| Feedstock intensity | 36.9 | kg feedstock/kg product |
| Energy intensity | 176.0 | kWh/kg product |
| Use of hazardous chemicals | Potentially bad, depending on extraction method used 1 | |
Disclaimer/Publisher’s Note: The statements, opinions and data contained in all publications are solely those of the individual author(s) and contributor(s) and not of MDPI and/or the editor(s). MDPI and/or the editor(s) disclaim responsibility for any injury to people or property resulting from any ideas, methods, instructions or products referred to in the content. |
© 2024 by the authors. Licensee MDPI, Basel, Switzerland. This article is an open access article distributed under the terms and conditions of the Creative Commons Attribution (CC BY) license (https://creativecommons.org/licenses/by/4.0/).
Share and Cite
Gamero, E.; Ruppert, S.; Miehe, R.; Sauer, A. Process Model and Life Cycle Assessment of Biorefinery Concept Using Agricultural and Industrial Residues for Biohydrogen Production. Energies 2024, 17, 4282. https://doi.org/10.3390/en17174282
Gamero E, Ruppert S, Miehe R, Sauer A. Process Model and Life Cycle Assessment of Biorefinery Concept Using Agricultural and Industrial Residues for Biohydrogen Production. Energies. 2024; 17(17):4282. https://doi.org/10.3390/en17174282
Chicago/Turabian StyleGamero, Edgar, Sophia Ruppert, Robert Miehe, and Alexander Sauer. 2024. "Process Model and Life Cycle Assessment of Biorefinery Concept Using Agricultural and Industrial Residues for Biohydrogen Production" Energies 17, no. 17: 4282. https://doi.org/10.3390/en17174282
APA StyleGamero, E., Ruppert, S., Miehe, R., & Sauer, A. (2024). Process Model and Life Cycle Assessment of Biorefinery Concept Using Agricultural and Industrial Residues for Biohydrogen Production. Energies, 17(17), 4282. https://doi.org/10.3390/en17174282