Article

A Photovoltaic and Wind-Powered Electric Vehicle with a Charge Equalizer

by
Darwin-Alexander Angamarca-Avendaño
*,
Carlos Flores-Vázquez
and
Juan-Carlos Cobos-Torres
*
Unidad Académica de Posgrado, Universidad Católica de Cuenca, Cuenca 010101, Ecuador
*
Authors to whom correspondence should be addressed.
Energies 2024, 17(18), 4665; https://doi.org/10.3390/en17184665
Submission received: 1 August 2024 / Revised: 7 September 2024 / Accepted: 11 September 2024 / Published: 19 September 2024
(This article belongs to the Special Issue New Trends in Hybrid Electric Vehicles)

Abstract

:
This research aims at proposing an alternative to improve the efficiency of electric vehicles (EVs) and reduce greenhouse gas (GHG) emissions in the context of electric mobility. A photovoltaic and wind hybrid energy system was installed in a Chok S2 electric vehicle. In addition, a charge equalization system was included to balance and maximize the performance of each of the EV’s five batteries connected in series. The results show a 20% improvement in vehicle efficiency after conducting tests on a 17 km Andean route. The photovoltaic system generated 535 W, while the wind system generated 135 W/s at a speed of 45 km/h. These findings highlight the potential of hybrid renewable energy systems to improve the efficiency and range of electric vehicles.

1. Introduction

The transition to electric vehicles (EVs) represents a revolutionary concept aimed at achieving a sustainable and environmentally friendly future, which becomes crucial considering the global concern regarding the accelerated growth of environmental pollution. For this reason, the Paris agreement was adopted. One of its objectives is to limit the global temperature rise to 2% by 2050 [1]. Considering that the global transportation system is responsible for 25% of greenhouse gas (GHG) emissions and 35% of global energy consumption [2], electric mobility plays a key role in reducing greenhouse gases (GHGs) and dependency on fossil fuels. Therefore, it is important to highlight that EVs and hybrids depend fully or partially on electric energy, and their contribution to reducing GHGs is directly related to the exclusive or partial use of the electric energy sources derived from renewable energies [3]. In 2023, Ecuador marked an important milestone on its path toward energy sustainability: 79.73% of its electricity was generated from renewable sources. However, 16.21% was generated from non-renewable sources, according to the annual statistics from Ecuador’s energy sector [4]. Despite progress, there is still a need to strengthen clean energy sources and promote electric mobility as an integral part of a complete transition toward a sustainable energy system. A data-based analysis, conducted in 2017 by Maks Davis [5], showed the transition to EVs in the three main cities of Ecuador, showing significant figures. In that year, there were 242,598 fossil-fuel sport utility vehicles (SUVs) in Quito, 97,011 in Guayaquil, and 44,050 in Cuenca. Replacing fossil-fuel vehicles with electric versions would reduce energy demands to 1.51 GWh per year in Quito, 0.57 GWh per year in Guayaquil, and 0.27 GWh per year in Cuenca. After assessing the high impact of EV transition on the main cities of Ecuador, it is essential to consider the global context of the electric mobility industry. A global prediction research study on EVs [6] estimated a significant EV increase by 2030, reaching 270 million units worldwide. This prediction was equivalent to approximately 14% of the total number of vehicles in circulation. However, the challenges arising from the increasing energy demand for electrical distribution systems are expected to be addressed through coordinated planning with fast charging stations [7]. In fact, several studies have explored how EVs could influence the current distribution grid. For example, McKinney et al. [8] conducted a study that assessed the impact of transitioning to EVs in a rural village in the Pink District, UK. After analyzing eight charging scenarios, they found that electrical power requirements are influenced by how EVs are charged, resulting in peak demands due to their daily charge. Similarly, Yang et al. [7] realized a study integrating fast charging station planning and electric distribution systems in Guangzhou, China. The costs and traffic for 3193 EVs were optimized. Several chargers were installed (9, 12, and 17 in 3 stages), with new 110 kV substations. This covered and balanced the additional electrical demand of the EVs.
It is important to emphasize that EVs cannot be considered a solution for reducing GHGs if the energy source used to charge them comes from non-renewable sources. In fact, Reddy et al. [9] described CO2 emission ranges for different types of vehicles. According to their research, biofuel vehicles release 30% to 150% more CO2 than gasoline vehicles (depending on the feedstock and production). On the other hand, EVs release between 30–300 g CO2/km (depending on the grid mix and manufacturing), solar vehicles release between 20–120 g CO2 /km (manufacturing-focused emissions), and fuel cell vehicles release 0–200 g CO2/km (depending on the hydrogen source). Due to this, different alternatives have been considered for providing sustainable solutions for EV charging. Such is the case of Pasetti et al. [10], who researched how distributed photovoltaic (PV) systems can reduce the indirect environmental impact of EVs and promote sustainable charging. In their study, they discovered that these systems can reduce the GHG emissions associated with EV charging by up to 84.5%. Similarly, EV charging stations have also been studied as in the case of Singh et al. [11], where they analyzed the performance of a solar-powered EV charging station in Chennai, India, using different PV capacities. The results showed that the optimal capacity was 15 kWp, efficiently balancing energy and cost per km.
The current research related to improving efficiency in electric mobility focuses on different methods: fast and ultra-fast charging systems [12,13], battery swapping systems [14], wireless charging systems [15], and bidirectional power transfer systems, i.e., G2V (grid to vehicle) or V2G (vehicle to grid) [16]. In addition, there are integrated renewable energy charging systems (IRCS) for EVs that use solar energy, wind energy, and hydrogen cells. Similarly, Lee and Park [17] assessed the effectiveness of integrated PV modules on light electric vehicles (LEVs). They used data from previous trips and solar irradiance measurements to investigate the energy consumption and PV energy generation of an LEV over the course of one month. Results showed that PV modules allow LEVs to generate up to 45% of the energy consumed. Similarly, Shpak et al. [18] described a photovoltaic system for charging an EV with wireless power transfer, resulting in a maximum power of 2.1 kW and 58% efficiency and estimating an annual electricity output of 2,033 GWh. A study by Schuss et al. [19] evaluated the impact of available solar radiation on the energy efficiency of routes of different driving distances using photovoltaic installations on top on EVs. They compared two routes between a sports hall and a botanical garden, measuring driving duration and average solar radiation level. The results showed that, although the shortest route was generally preferred, the longer route would be preferable if 30% to 40% more solar irradiation were obtained. In addition, they proposed vehicle-to-vehicle (V2V) communication, which could help share data on solar irradiation levels and traffic conditions. Likewise, Lee et al. [20] evaluated the power generated by integrated PV panels on LEVs. It was found that, in Berlin, the daily power generation varied between 40.8 Wh and 615 Wh, while, in New Delhi, it varied between 307.9 Wh and 811.4 Wh. In July, power generation could exceed 100% of power consumption in New Delhi. Similarly, Kutter et al. [21] showed that vehicle-integrated photovoltaics (VIPV) on commercial electric vehicles can cover up to 60% of their energy consumption in European cities. It can take between 3 to 4 years to recover the cost of the investment in Seville and up to 7 years in Stockholm, with a production cost of 1 EUR/Wp. Similarly, Diahovchenko et al. [22] evaluated how PV systems mounted on the roof of EVs could increase their range. Their results show that, during the sunniest summer months in Kyiv, Ukraine, this system could provide up to a 6.32% range but only up to 1.16% during the least sunny winter months. Similarly, Centeno Brito et al. [23] conducted a study using data from Lisbon, finding that, despite the shadows on urban roads and parking lots, EVs could extend their driving range between 10 and 18 km/day/kWh, thus reducing charging needs.
On the other hand, there is not enough research on integrated wind turbines for EVs. Most research focuses on charging stations designed to harness the flow of vehicle-generated wind, using software simulation for analyzing airflow, on roadways [24,25,26,27]. Likewise, Morgin et al. [28] evaluated the aerodynamic parameters of an electric sedan vehicle equipped with wind turbines. Their results show that the vehicle’s drag coefficient was only 0.314, while the results with roof turbines increased the coefficient, reaching 0.461 with straight generators and 0.477 with linear generators. Similarly, Andias et al. [29] designed a wind turbine system for an electric pickup truck using Autodesk CFD Ultimate simulation software. They implemented two Savonius wind turbines, which are a type of three-bladed vertical-axis wind turbine (VAWT) arranged in sequence. Their results show that Turbine 1 had a higher power, velocity, and angular speed compared to Turbine 2. However, Turbine 2 exhibited a higher torque value due to the increased air force exerted on it, and this was caused by the compression of air from Turbine 1.
There is little research on electric vehicles that integrate both photovoltaic and wind energy systems simultaneously. Sahani et al. [30] developed and simulated a self-charging EV model using MATLAB, integrating advanced technologies such as PV and wind turbines. The system included fast chargers ranging from 300 to 600 kW, capable of fully charging the vehicle within 30 to 50 min, and the PVs increased the vehicle’s range by 60 miles per day. The wind system used was capable of generating up to 20 times more energy than the EV consumed. The average vehicle speed was 40 m/s with a turbine size of 55 cm × 350 cm. Similarly, Gopinath [31] conducted a study using a solar charging unit, where the voltage ranged from 12.5 to 13.1 V, and a wind charging unit, with which the state of charge (SOC) gradually increased due to wind energy. Additionally, through using Ansys Fluent, it was demonstrated that the vehicle’s aerodynamic force was 400 N and its drag force was approximately 700 N at a wind speed of 16 m/s. Similarly, [32] designed and evaluated a solar–wind hybrid system for hybrid electric vehicles (HEVs). The integration of a PV on the roof of the HEV was simulated. This PV had a generation power of 500 W under solar irradiation conditions of 1000 W/m2. The wind turbine was located on the bumper and produced 300 W (at a wind speed of 8 m/s). It should be noted that the type of turbine simulated was not detailed.
After conducting a thorough analysis of previous studies on improving EV efficiency, the objective was set to integrate a hybrid (photovoltaic–wind) charging system into an EV. Section 2 describes the methodology of the proposed system, a 3D design of the wind turbine, simulations of the aerodynamics of the EV with and without PV, the hardware used, and control algorithms. In addition, the charge equalization system, explained in detail, was responsible for distributing the energy generated by both systems (photovoltaic–wind) to each of the vehicle’s five sealed lead-acid (SLA) batteries connected in series. Section 3 presents the results, detailing the system’s performance in different scenarios: charging an EV with the PV system while parked, and charging an EV while driving on an Andean route both with and without the charging system for comparative analysis.
The contribution of this research project was to offer an innovative solution for improving the efficiency and range of EVs, in a sustainable way, by integrating a PV–wind energy system with a charge equalizer that distributes the generated electrical electricity to the batteries, which was controlled by a decision tree algorithm. Its feasibility was demonstrated based on the results obtained in different scenarios. The installed sensors (voltmeters and ammeters) allowed for a subsequent analysis of the system’s performance, contributing to a more sustainable and energy-efficient transportation system.

2. Materials and Methods

In this applied experimental research, a hybrid PV–wind energy system was integrated into an EV. To achieve this, the project was developed in different stages: Initially, the vehicle model, the wind turbine, and the support structure for both electrical generation systems were designed in 3D using Autodesk Inventor Professional. With the final design, a wind flow analysis was conducted using Autodesk CFD. In parallel, the control and power printed circuit boards (PCBs) were designed, and one charge equalization system was assembled for both energy systems. Figure 1 illustrates the operation of the hybrid system, where renewable solar and wind energy sources were integrated. In addition to the charge equalization of a bank of five batteries (12 V each), the energy generated by both systems was regulated with dedicated controllers (solar and wind controllers). Additionally, the current and voltage from both regulators were measured (the RPMs were recorded in the wind system). These data were sent to the control system, which monitored the EV parameters (current and voltage battery, speed, geographic location, and altitude). The control system distributed the energy evenly through a charge equalizer, ensuring a continuous and balanced power supply. The prototype was built and mounted on the EV, and, finally, the results were analyzed. The equipment used for this study is described in Table 1.

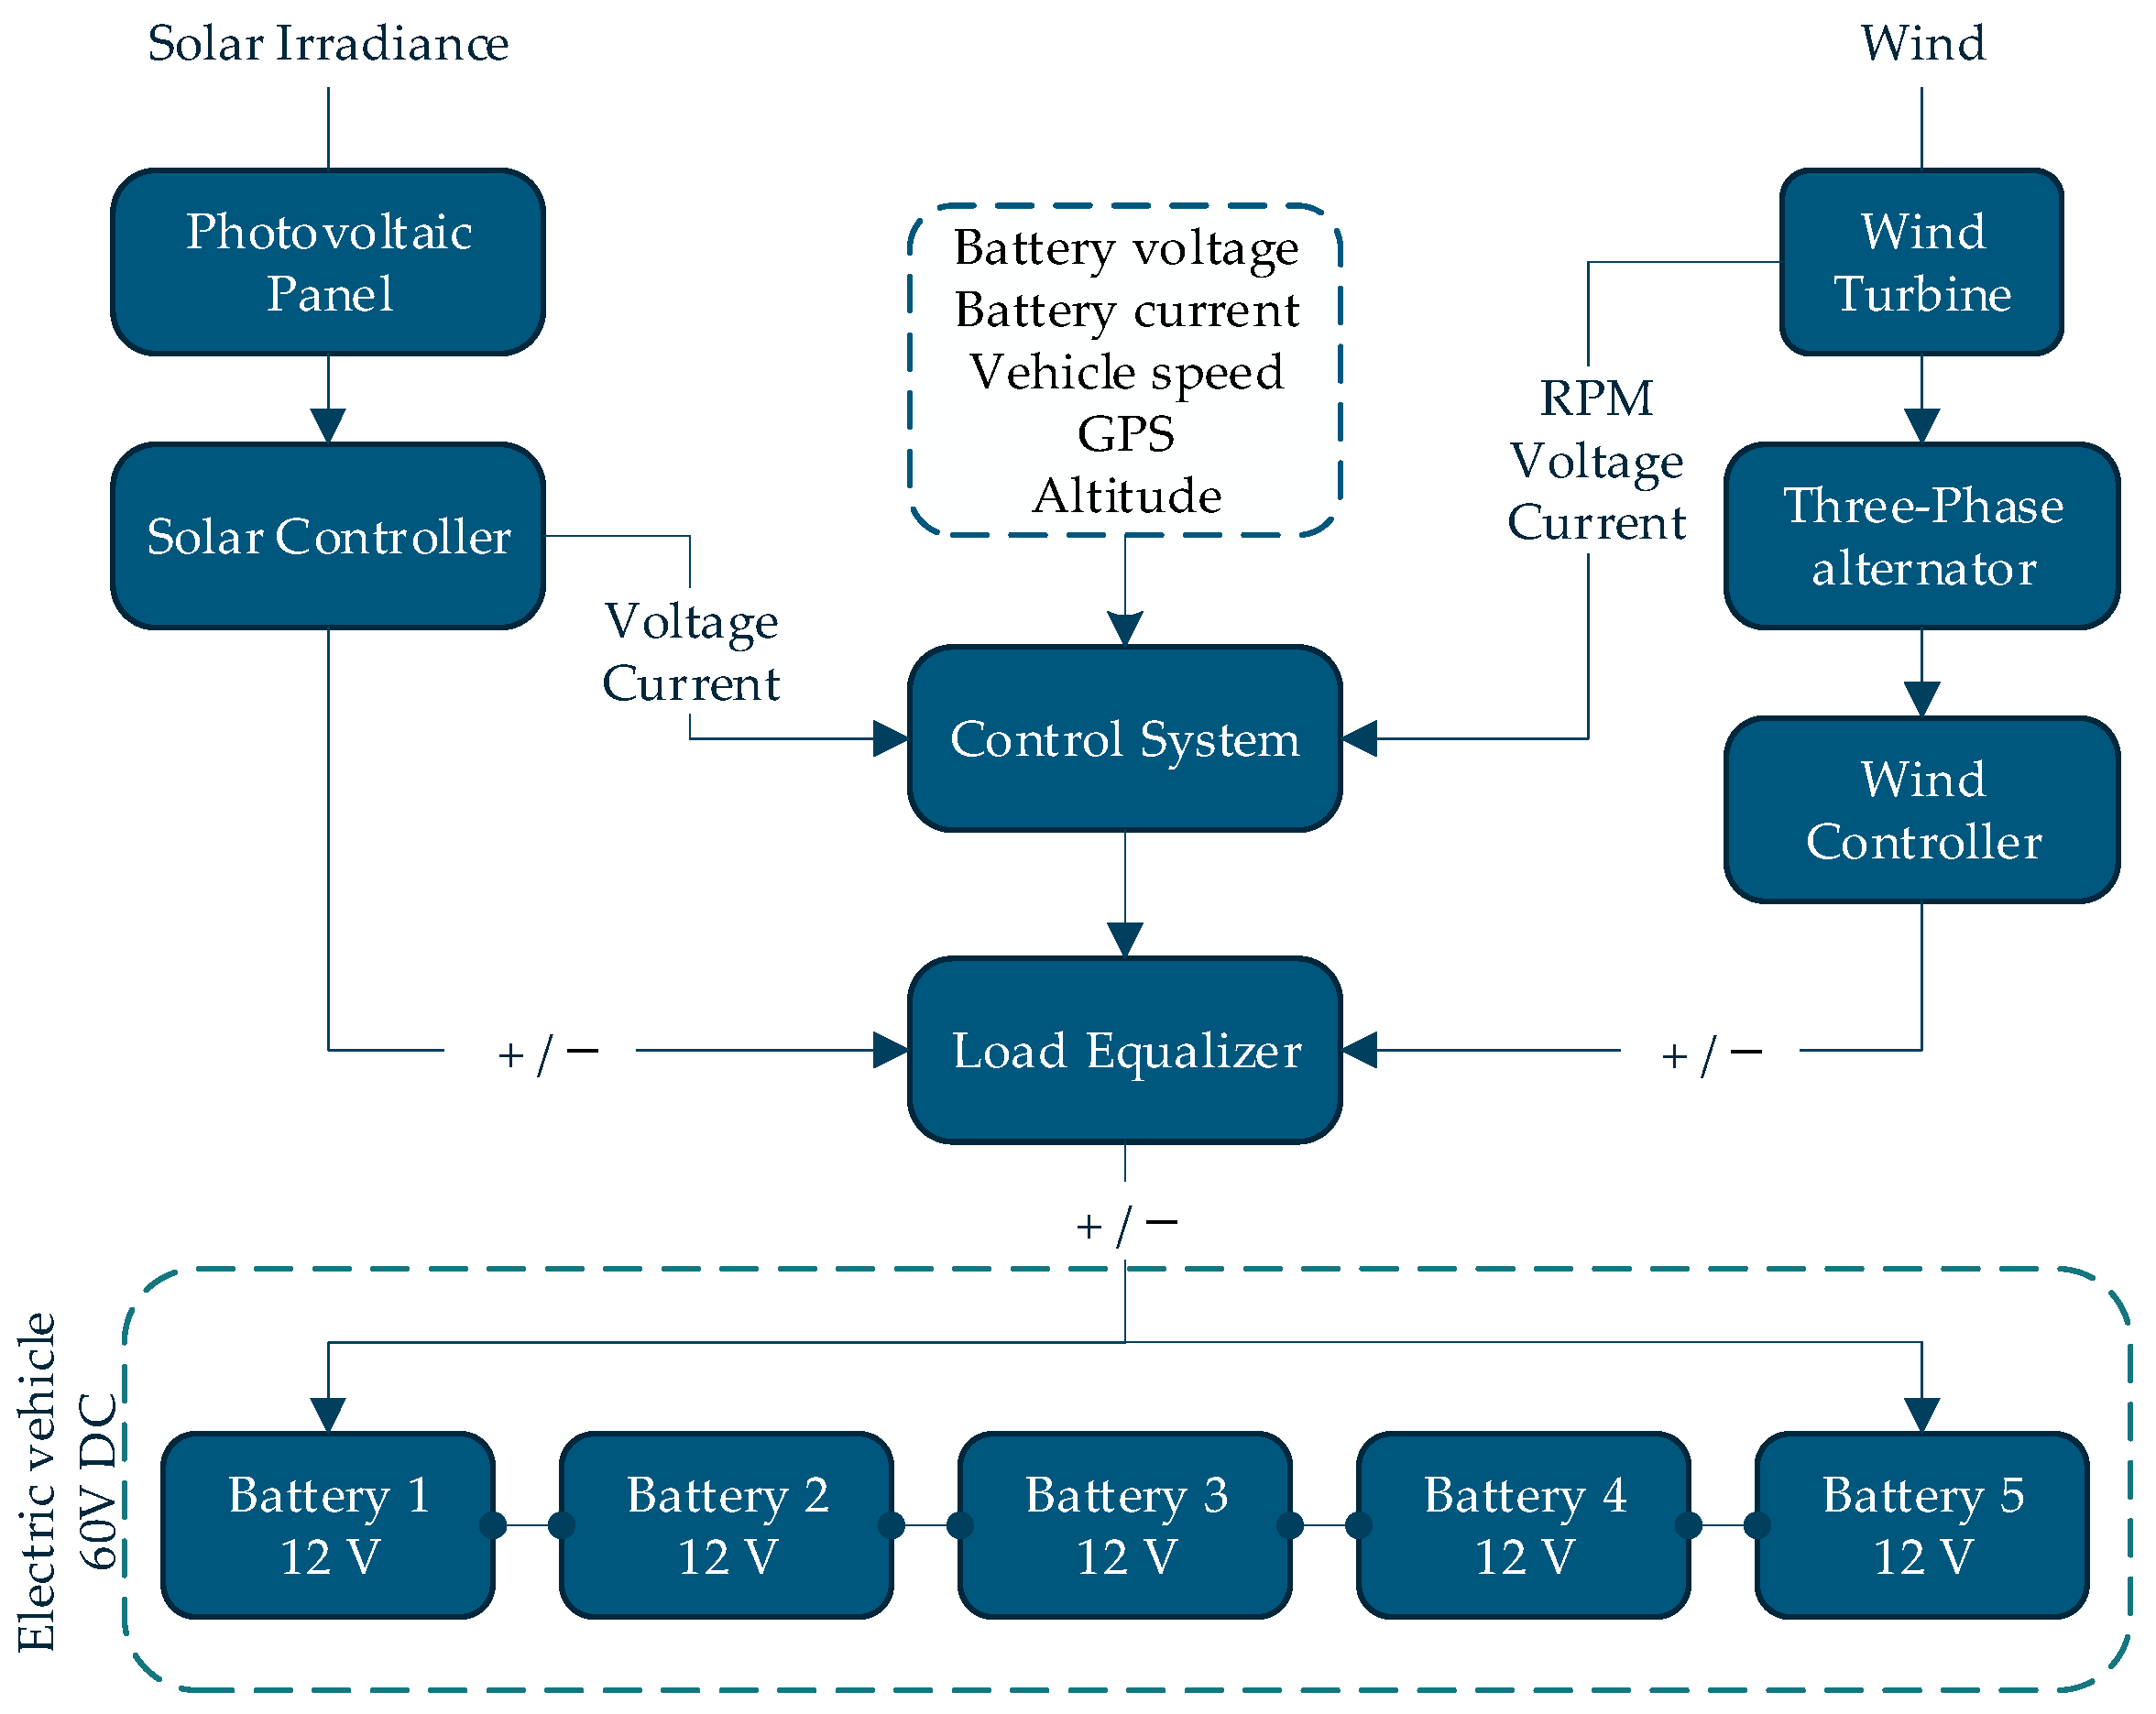
2.1. Three-Dimensional Design of the Charge Equalization System

Initially, a 3D model of the charge equalization system was designed to accurately understand and visualize every aspect of the system before manufacturing it and integrating it into the EV. This allowed for a detailed representation of all components, including the integration of the PV–wind energy system along with the structural support, as shown in Figure 2a. A helical Savonius wind turbine, known for its simple and robust design, was used in this project. This model captures wind from any direction, making it suitable for scenarios with frequent wind changes. The average efficiency of this turbine ranges from 15% to 25%, and it has a starting speed of 2 to 3 m/s. These characteristics make this turbine suitable for generating energy in variable wind conditions and at low wind speeds. The design of the turbine is shown in Figure 2b.
An integrated charge equalization system was developed, comprising essential components such as a control section and a power section. The control section was composed of a PCB (motherboard) with microcontrollers and sensors, while the power section contained MOSFET transistors. In addition, it included a set of 20 actuators (contact relays) to deliver energy to the corresponding battery. The system also contained two charge controllers: one for each energy system (photovoltaic and wind). Additionally, they were designed according to the space available in the EV, as shown in Figure 3.

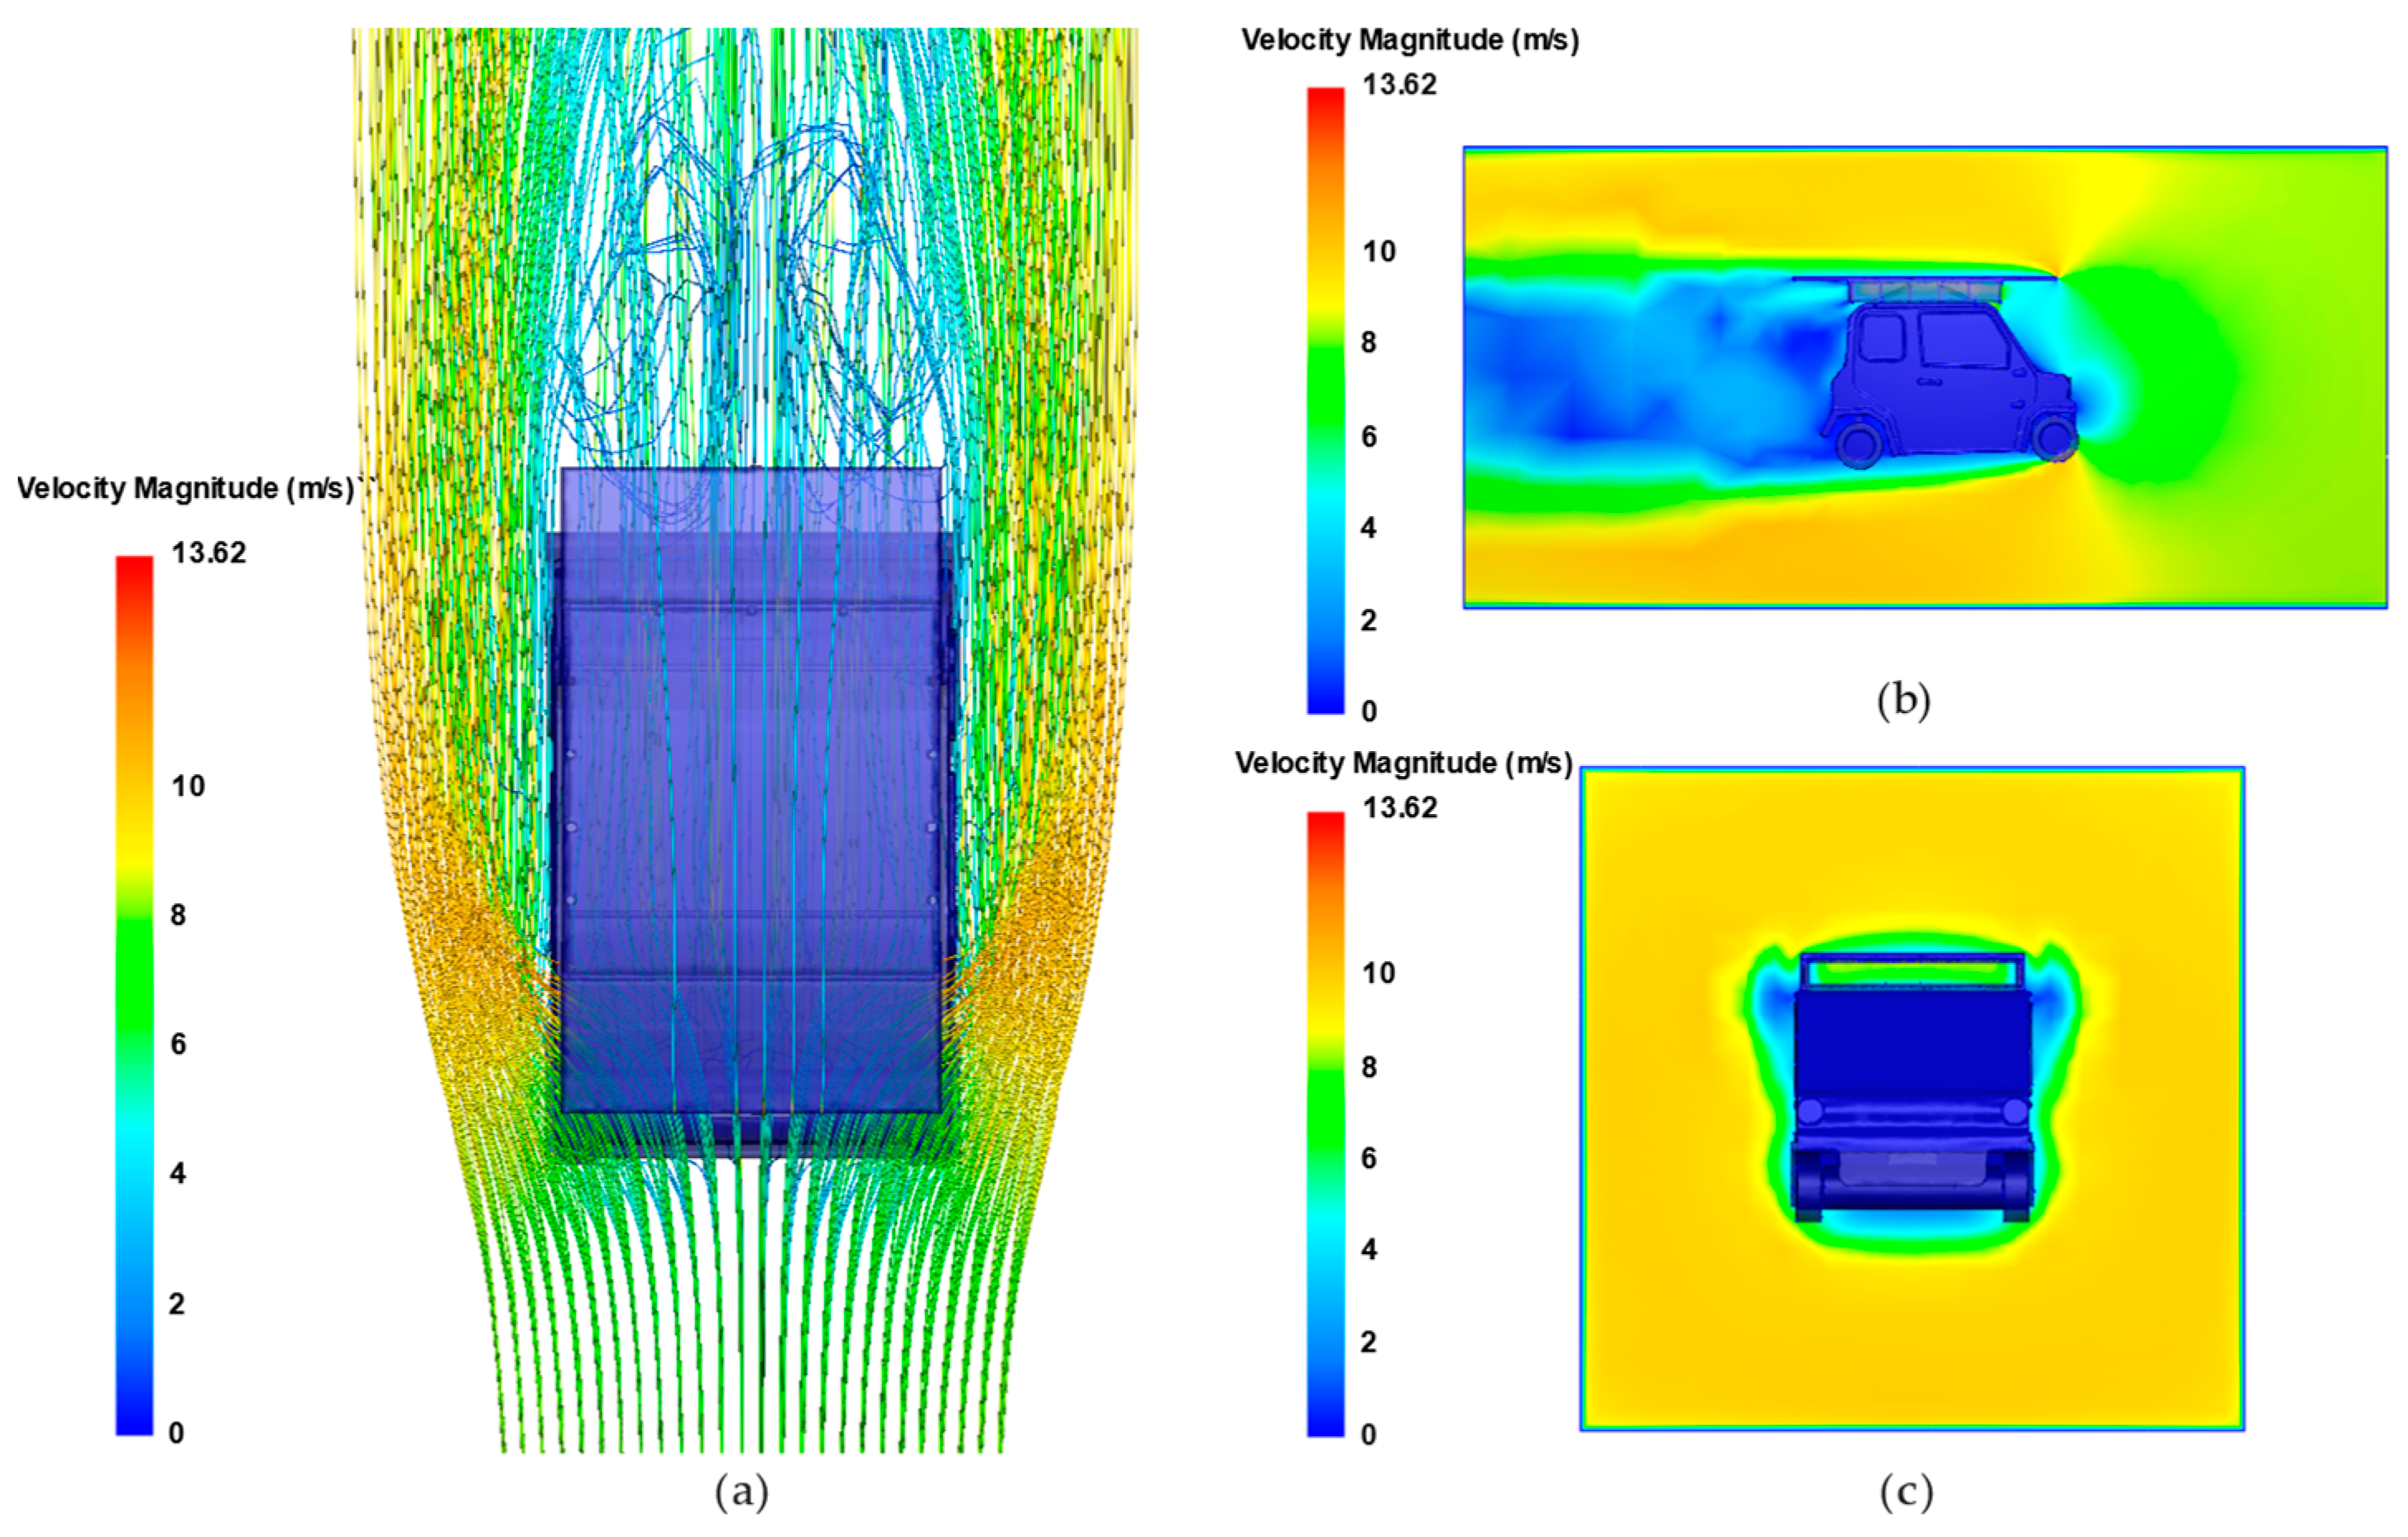
2.2. Aerodynamic Analysis
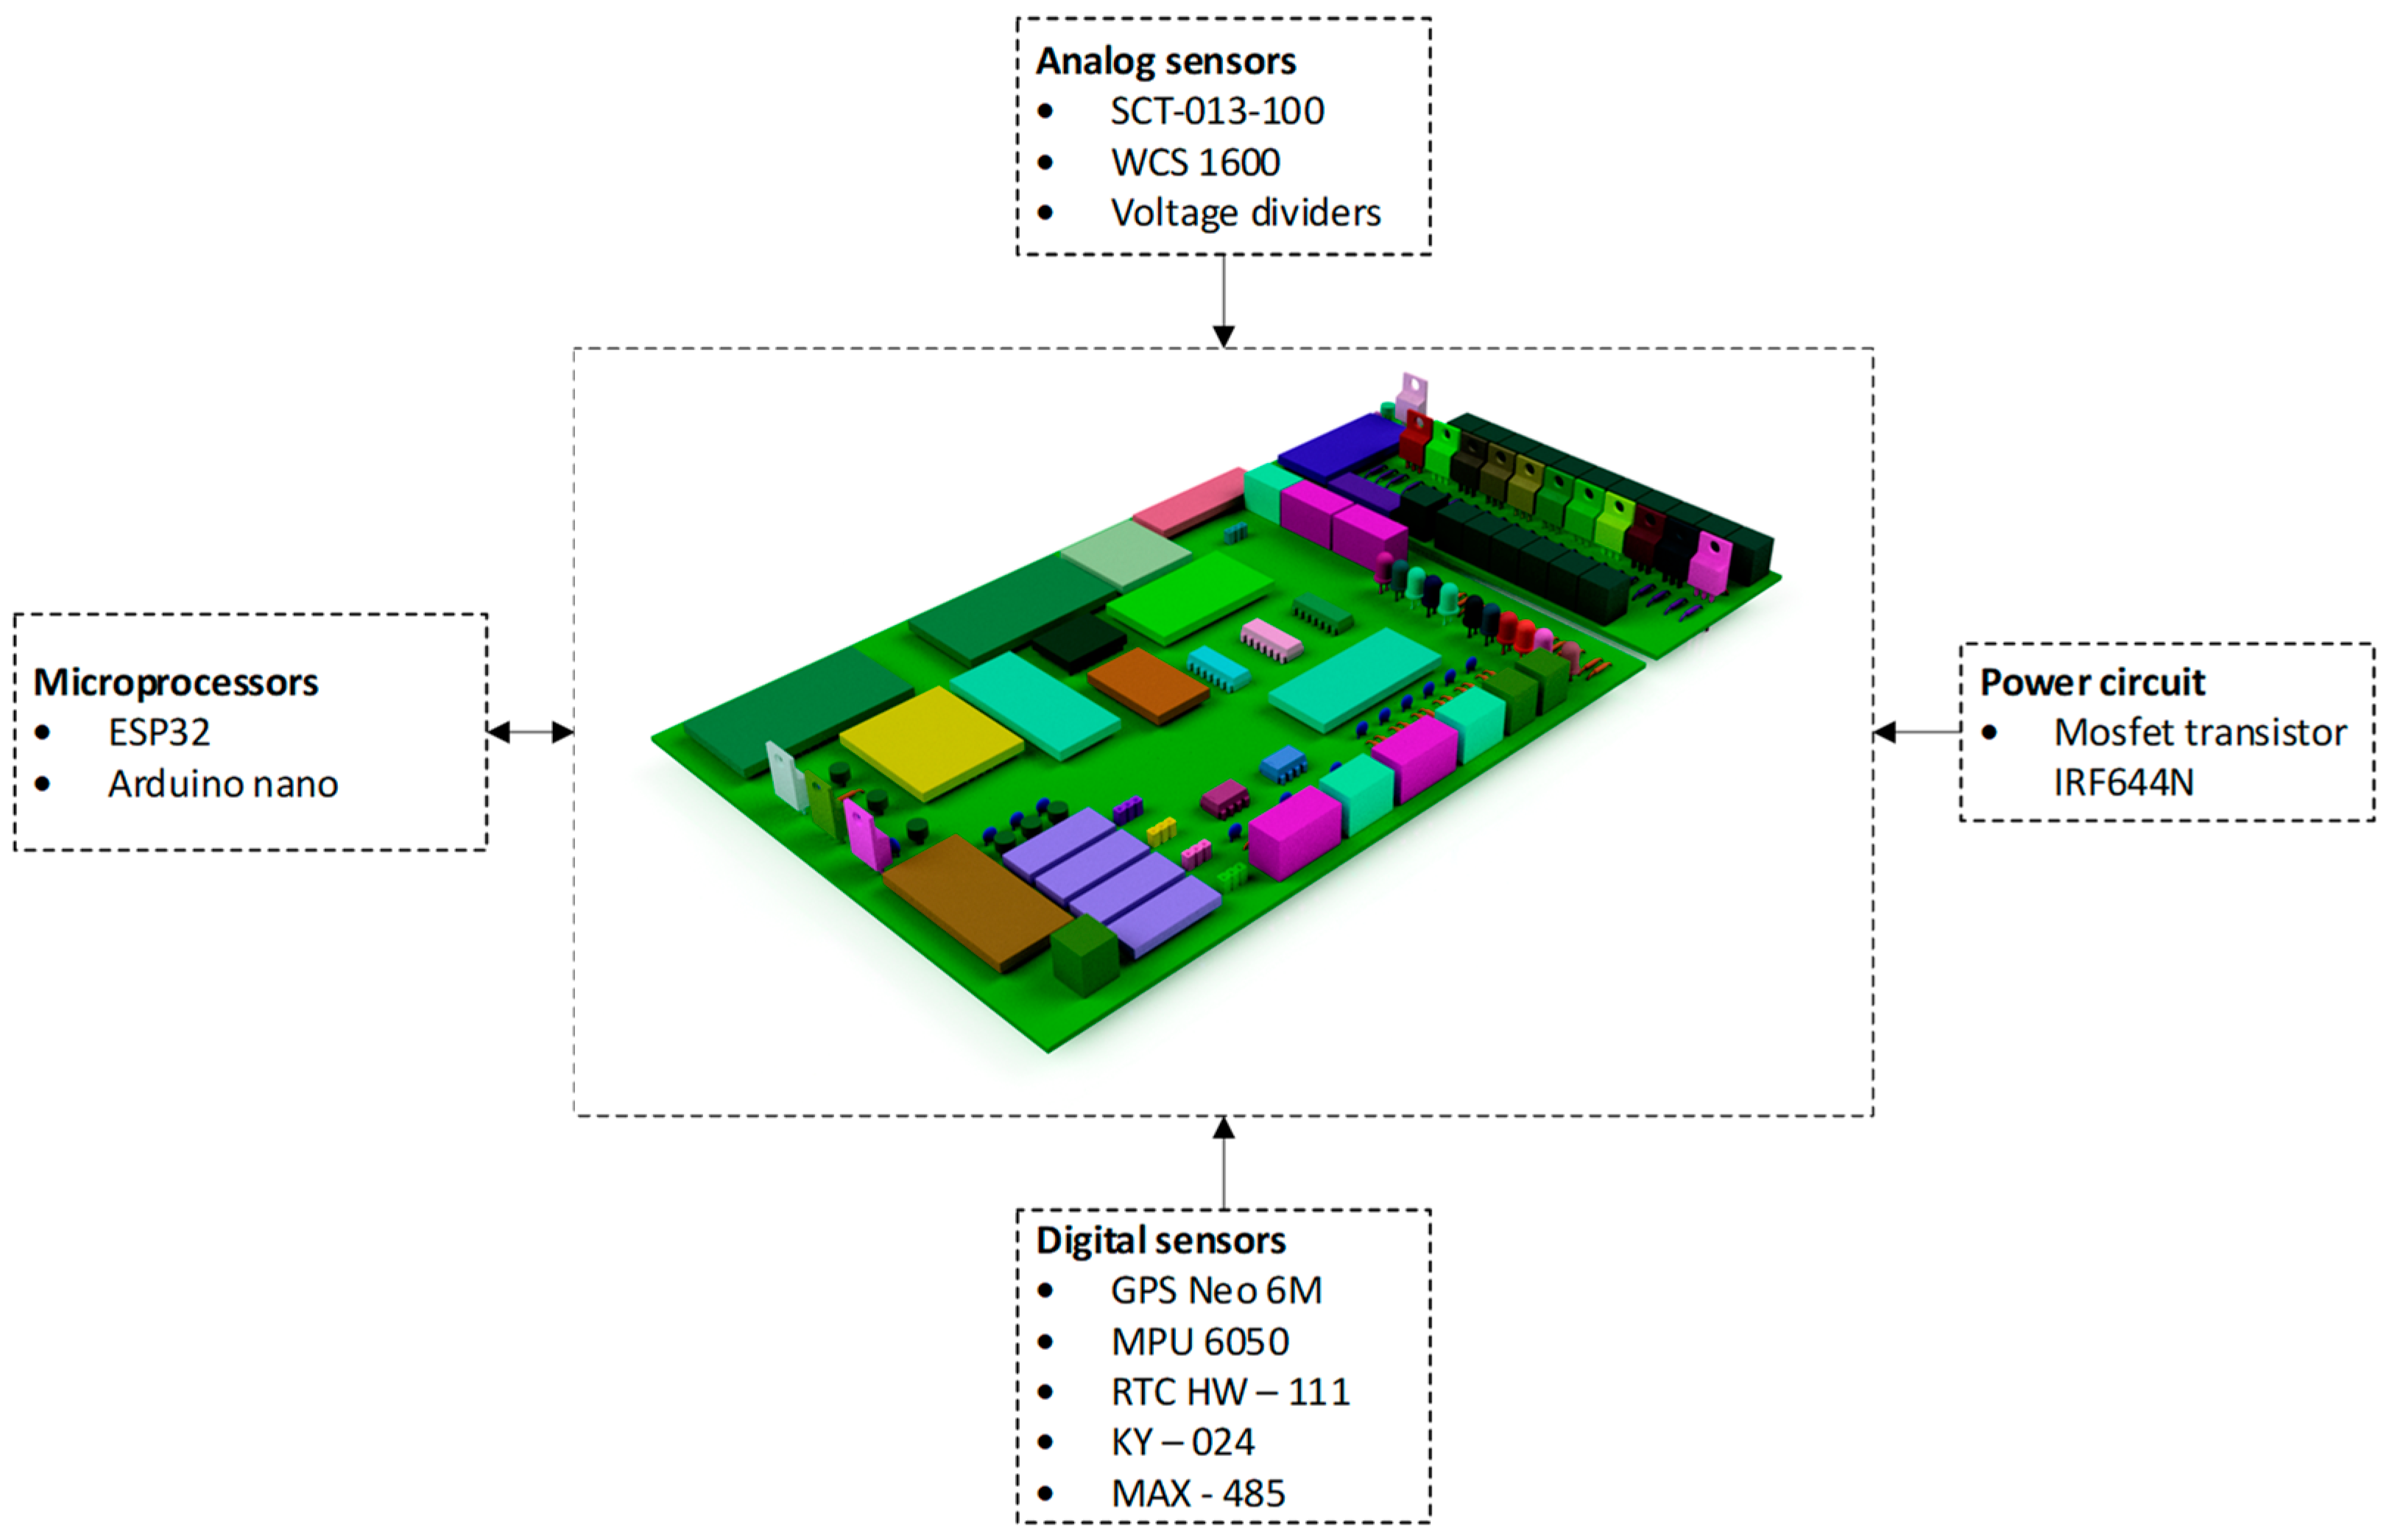
Once various models were designed in 3D, wind flow analyses were conducted for each one using Autodesk CFD, with the VE at 30 km/h. After evaluating each model, the best final design was selected based on the obtained results. The results, as shown in Figure 4a, reveal a direct wind flow entering the wind tunnel and an indirect flow coming from the EV’s windshield. As seen in Figure 4c,b, the wind speed in the wind tunnel ranged from 5.5 to 7 m/s, exceeding the minimum of 3 m/s required for the helical Savonius wind turbine to spin. This result confirms that the wind tunnel design is effective for generating electricity through wind energy, even at low speeds. The vehicle’s aerodynamics are crucial for optimizing the wind energy system, highlighting the importance of taking into account the interaction between the design of the EV and the wind energy system.

2.3. Hardware

The hardware architecture design was developed in a structured manner. A PCB was designed to centralize all electronic components, such as microcontrollers, sensors, and actuators. The PCB consisted of two independent parts, i.e., the control section and the power section, to ensure the stable and safe operation of the entire system. The control section used an ESP32 microcontroller to process data from the analog and digital sensors. In addition, it managed the control logic and allowed communication between microprocessors and sensors through its various communication protocols (I2C, SPI, UART, and ESP-Now). Two Arduino Nano microcontrollers were used in this section: the first one controlled the charge equalization system, measured individual battery voltages, and controlled the actuators; the second one measured current, latitude and longitude, vehicle inclination, turbine revolutions per minute (RPM), and time. Additionally, two ESP32 microcontrollers were implemented: The first one centralizes information from both the Arduino Nanos and the Epever PV charge controller, arranges all the data, stores it on an SD card, and sends all the information to the second ESP32, which is solely responsible for sending data to the IoT platform. Moreover, the power section consists of IRF644N MOSFET transistors that act as switches to activate the actuators, which, in this case, are contact relays. Since this is an online measurement system, a balance was sought between the hardware limitations (GPS) and the signal accuracy analyzed. The sampling time set was 1 s, so all the measured variables were synchronized with their geographical position. In addition, a digital moving average filter with a moderate smoothing value was implemented. This was performed to reduce noise, without altering the natural signal of the variables. The layout of the abovementioned components is illustrated in Figure 5, as well as the integration between the control and the power sections.

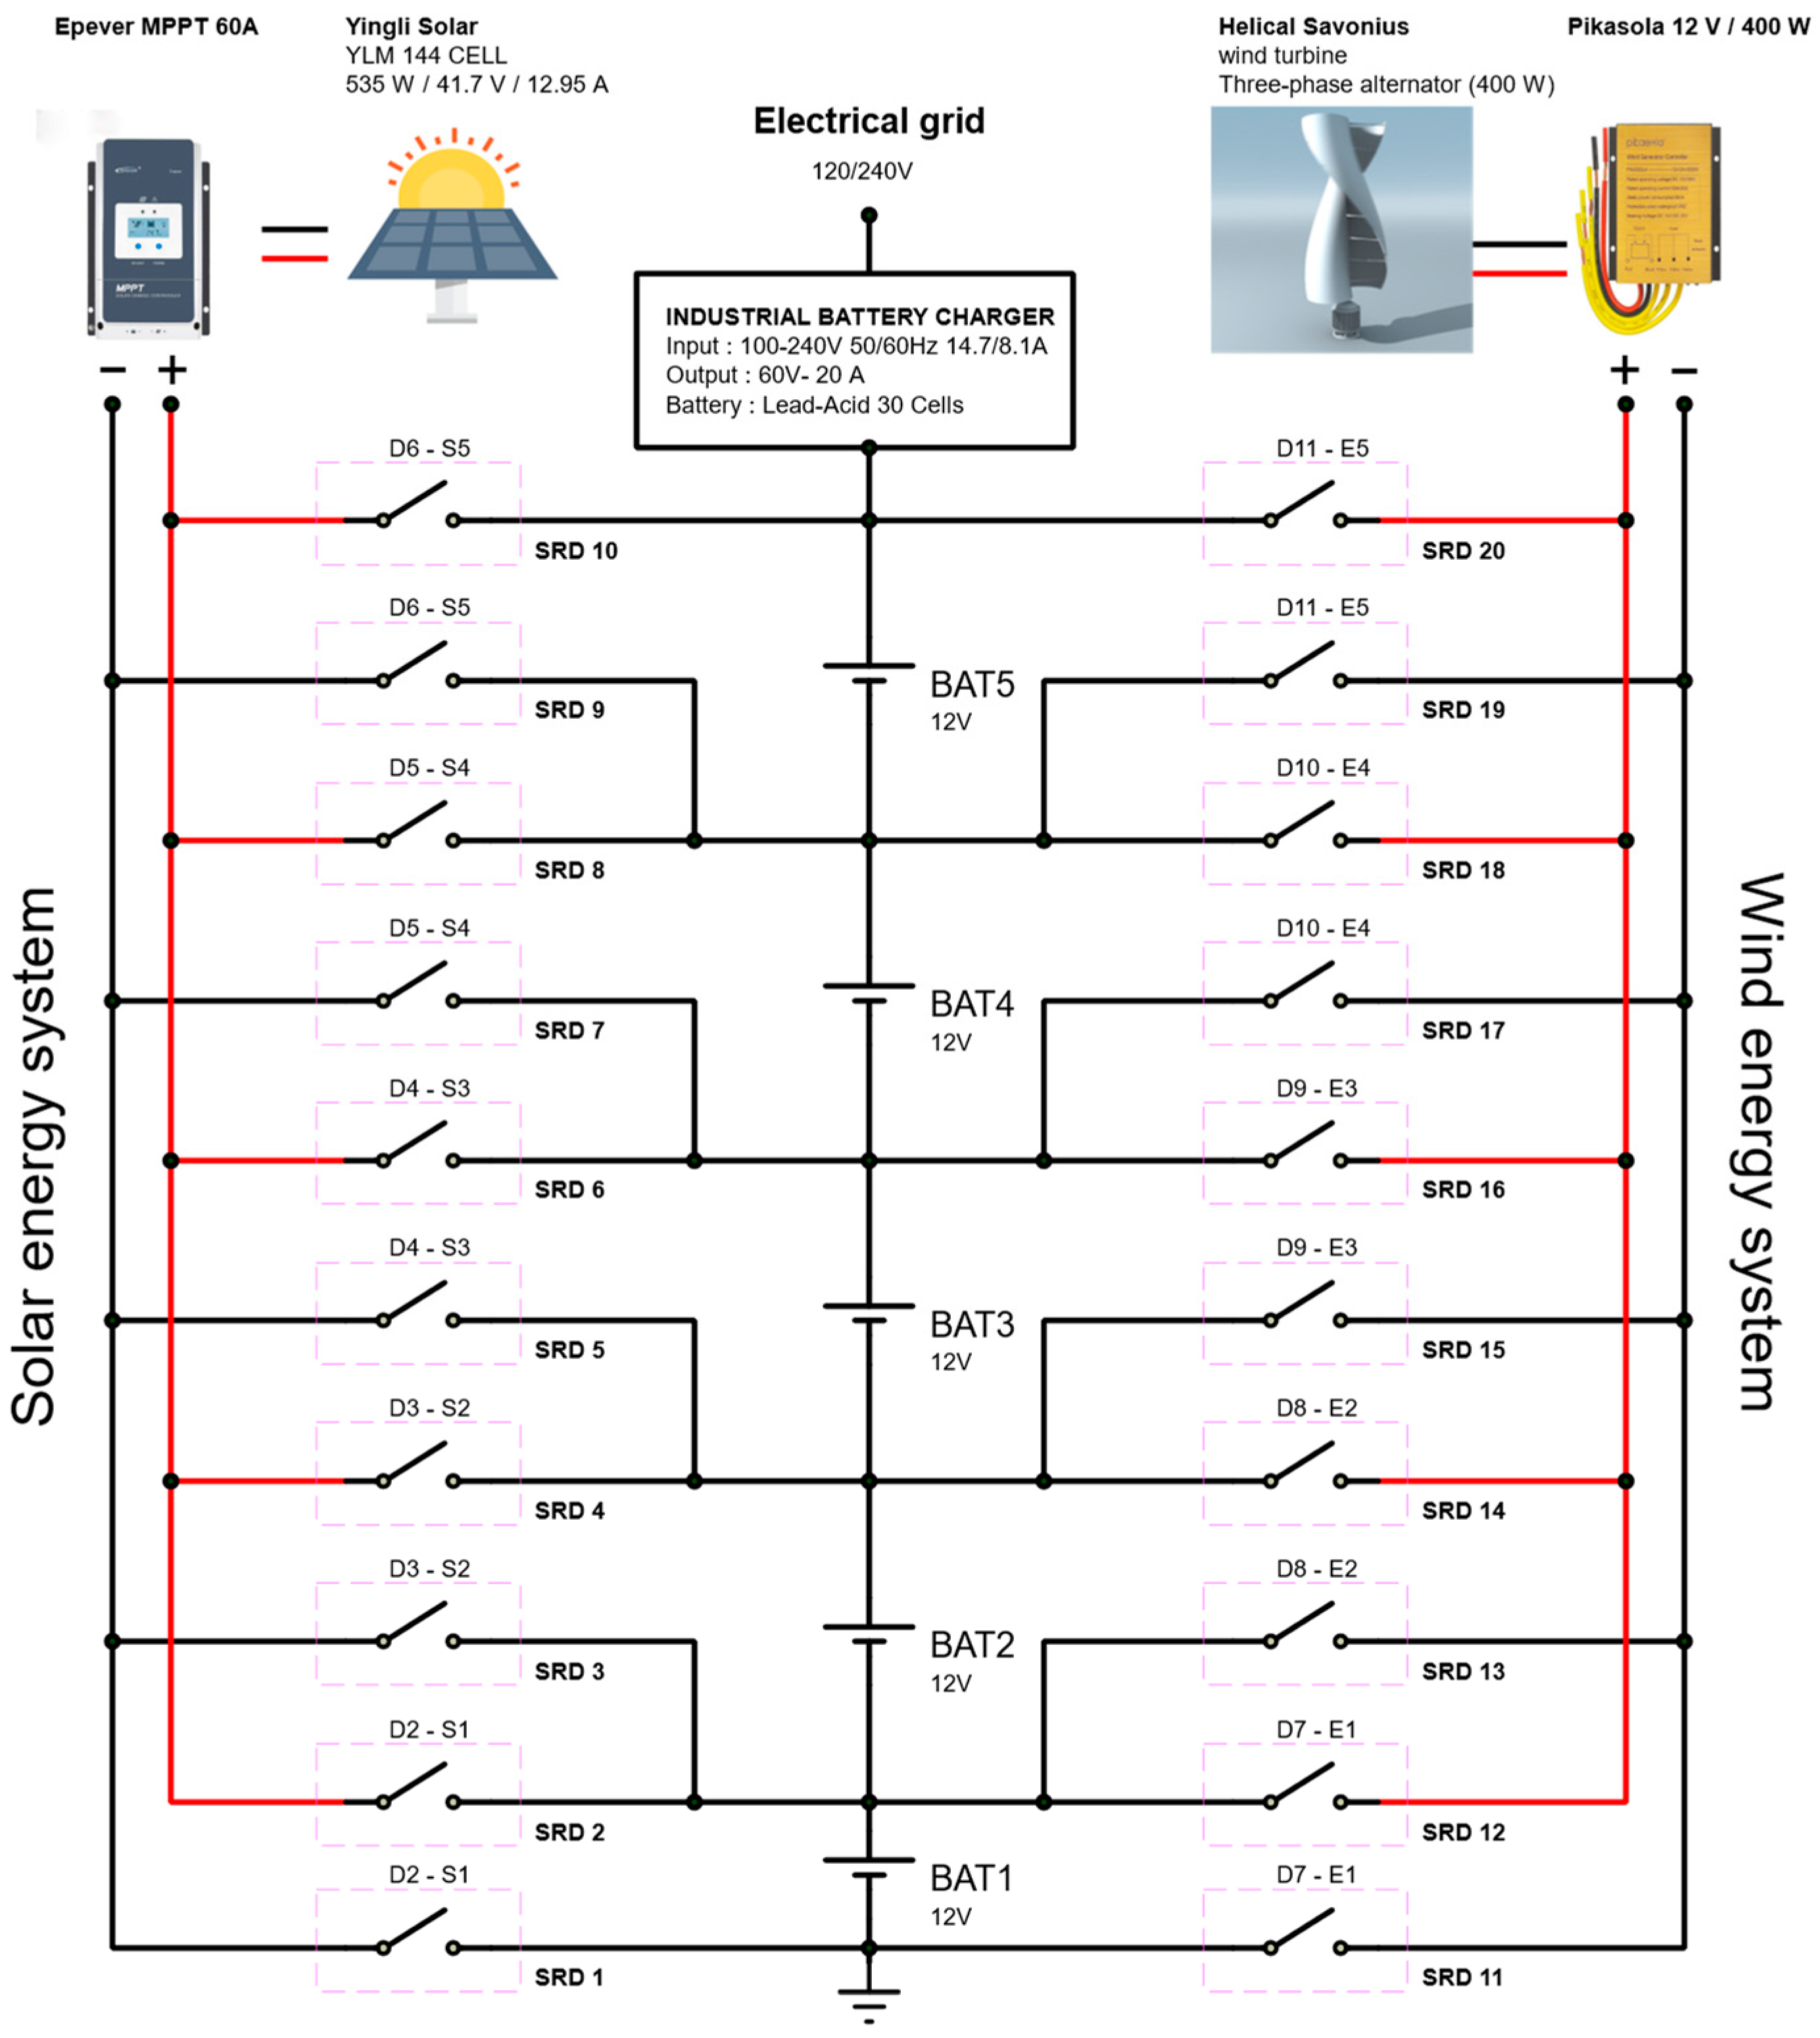
2.4. Charge Equalizer

The charge equalizer plays a crucial role in distributing the electrical energy generated by the PV and the wind systems to each of the vehicle’s batteries. This is essential due to the imbalances that can arise over time, which are caused by variations in battery internal resistance, temperature differences, and uneven usage patterns. Since the EV has five batteries connected in series and the energy system consists of two sources (photovoltaic and wind), the optimal configuration was sought to efficiently distribute the generated energy to each battery. As a result, a configuration of 20 relays was established, ensuring correct performance in a variety of configurable scenarios, as shown in Figure 6. Since both systems operate independently, different operating states can be set up: if neither system is generating energy, the equalizer remains idle; if only one system is active, the equalizer activates the set of relays of that particular system. Lastly, if both systems are generating energy, both can operate simultaneously.
In addition, the charge equalization system consists of three fundamental elements for its operation: the individual measurement of each battery’s voltage, the control algorithm, and the actuators. This system operates continuously, meaning that the charging cycles are repeated as needed to evenly distribute the energy produced by both systems.

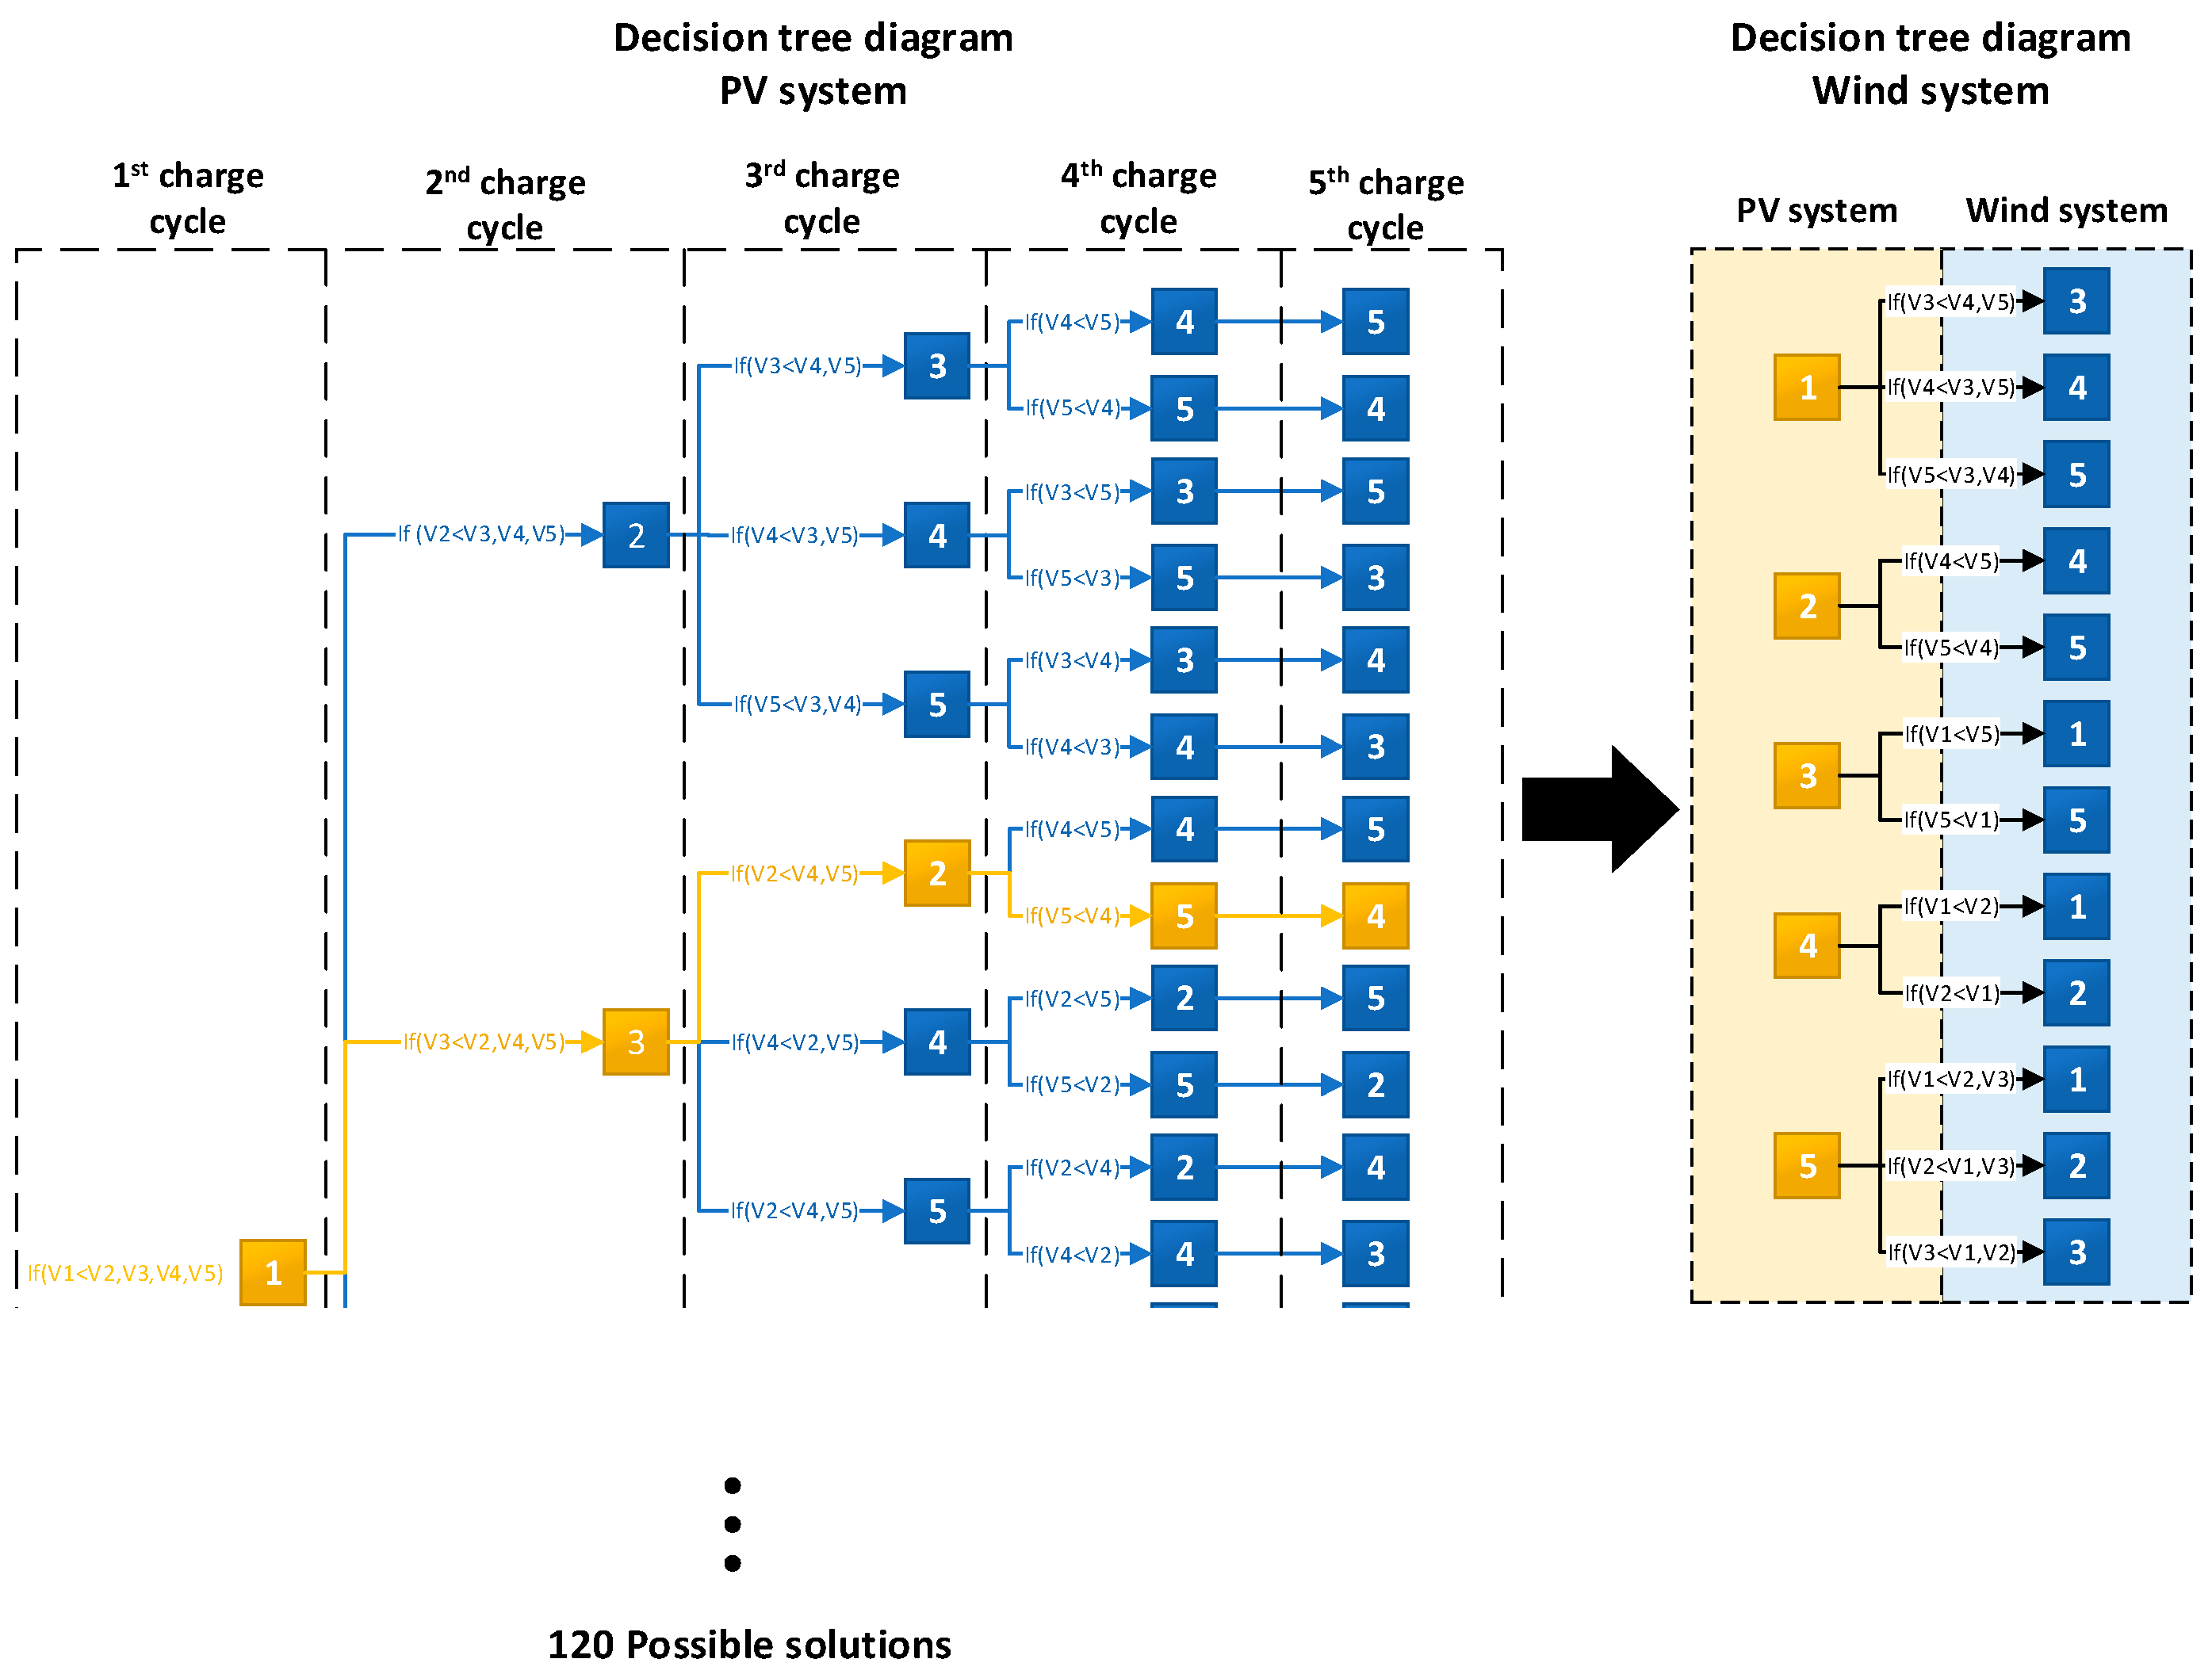
2.5. Algorithm Design for the Charge Equalization System

The charge equalization system requires specific conditions to avoid damage due to malfunction, while prioritizing and ensuring energy supply for batteries with the lowest voltage. The complete charging process requires five cycles, with each cycle dedicated to charging a different battery. Furthermore, there is a specific charging time for each battery. Likewise, the PV system activates when suitable irradiance levels are detected, and the wind system activates when the wind speed is adequate. Finally, the integration of the hybrid charge equalization system is based on Table 2, ensuring that the battery that is being charged with the PV system is not adjacent to the one that is being charged with the wind system (thus avoiding short circuits and meeting charging prioritization), as shown in Figure 7.
The decision tree diagram was utilized in the PV system due to its capability to systematically organize all possible battery charging scenarios in accordance with pre-established conditions. This diagram facilitates battery selection management, ensuring balance within the system. It encompasses a total of 120 possible combinations to complete the charging cycle for five batteries. Figure 8 illustrates a complete charging cycle, assuming the individual voltage of each battery and always prioritizing the battery with the lowest voltage. Beginning with Battery 1 as the one with the lowest voltage, it is charged for a specific period before advancing to the subsequent cycle. This process is regulated by the activation and deactivation of relays, as specified by the control algorithm. At each stage, the algorithm selects the battery with the lowest voltage from the remaining ones: First Battery 3, then Battery 2, followed by Battery 5, and finally Battery 4, thus completing the cycle before restarting the process.
The charging algorithm of the wind system is less complex than of the PV system, maintaining the condition of charging the battery with the lowest voltage. Furthermore, when selecting a battery for charging, it must not be adjacent to a battery being charged by the PV system, as detailed in Table 2. Batteries to be charged by the wind system are selected based on the location of the battery currently being charged by the PV system, thereby preventing potential short circuits between the two systems.

3. Results

In this section, the results and implementation process of the charge equalization system installed in the electric vehicle (EV) are detailed, along with an analysis of the data collected during the tests conducted with the EV under different conditions. Figure 9a shows the physical structure of the EV, with the PV system mounted on the roof and the wind turbine positioned in the center, securely clamping both devices. Figure 9b depicts the key electronic components, such as the PV charge controller, the PCBs, and the relays, which were located inside the vehicle to manage the electrical energy generated by both systems.

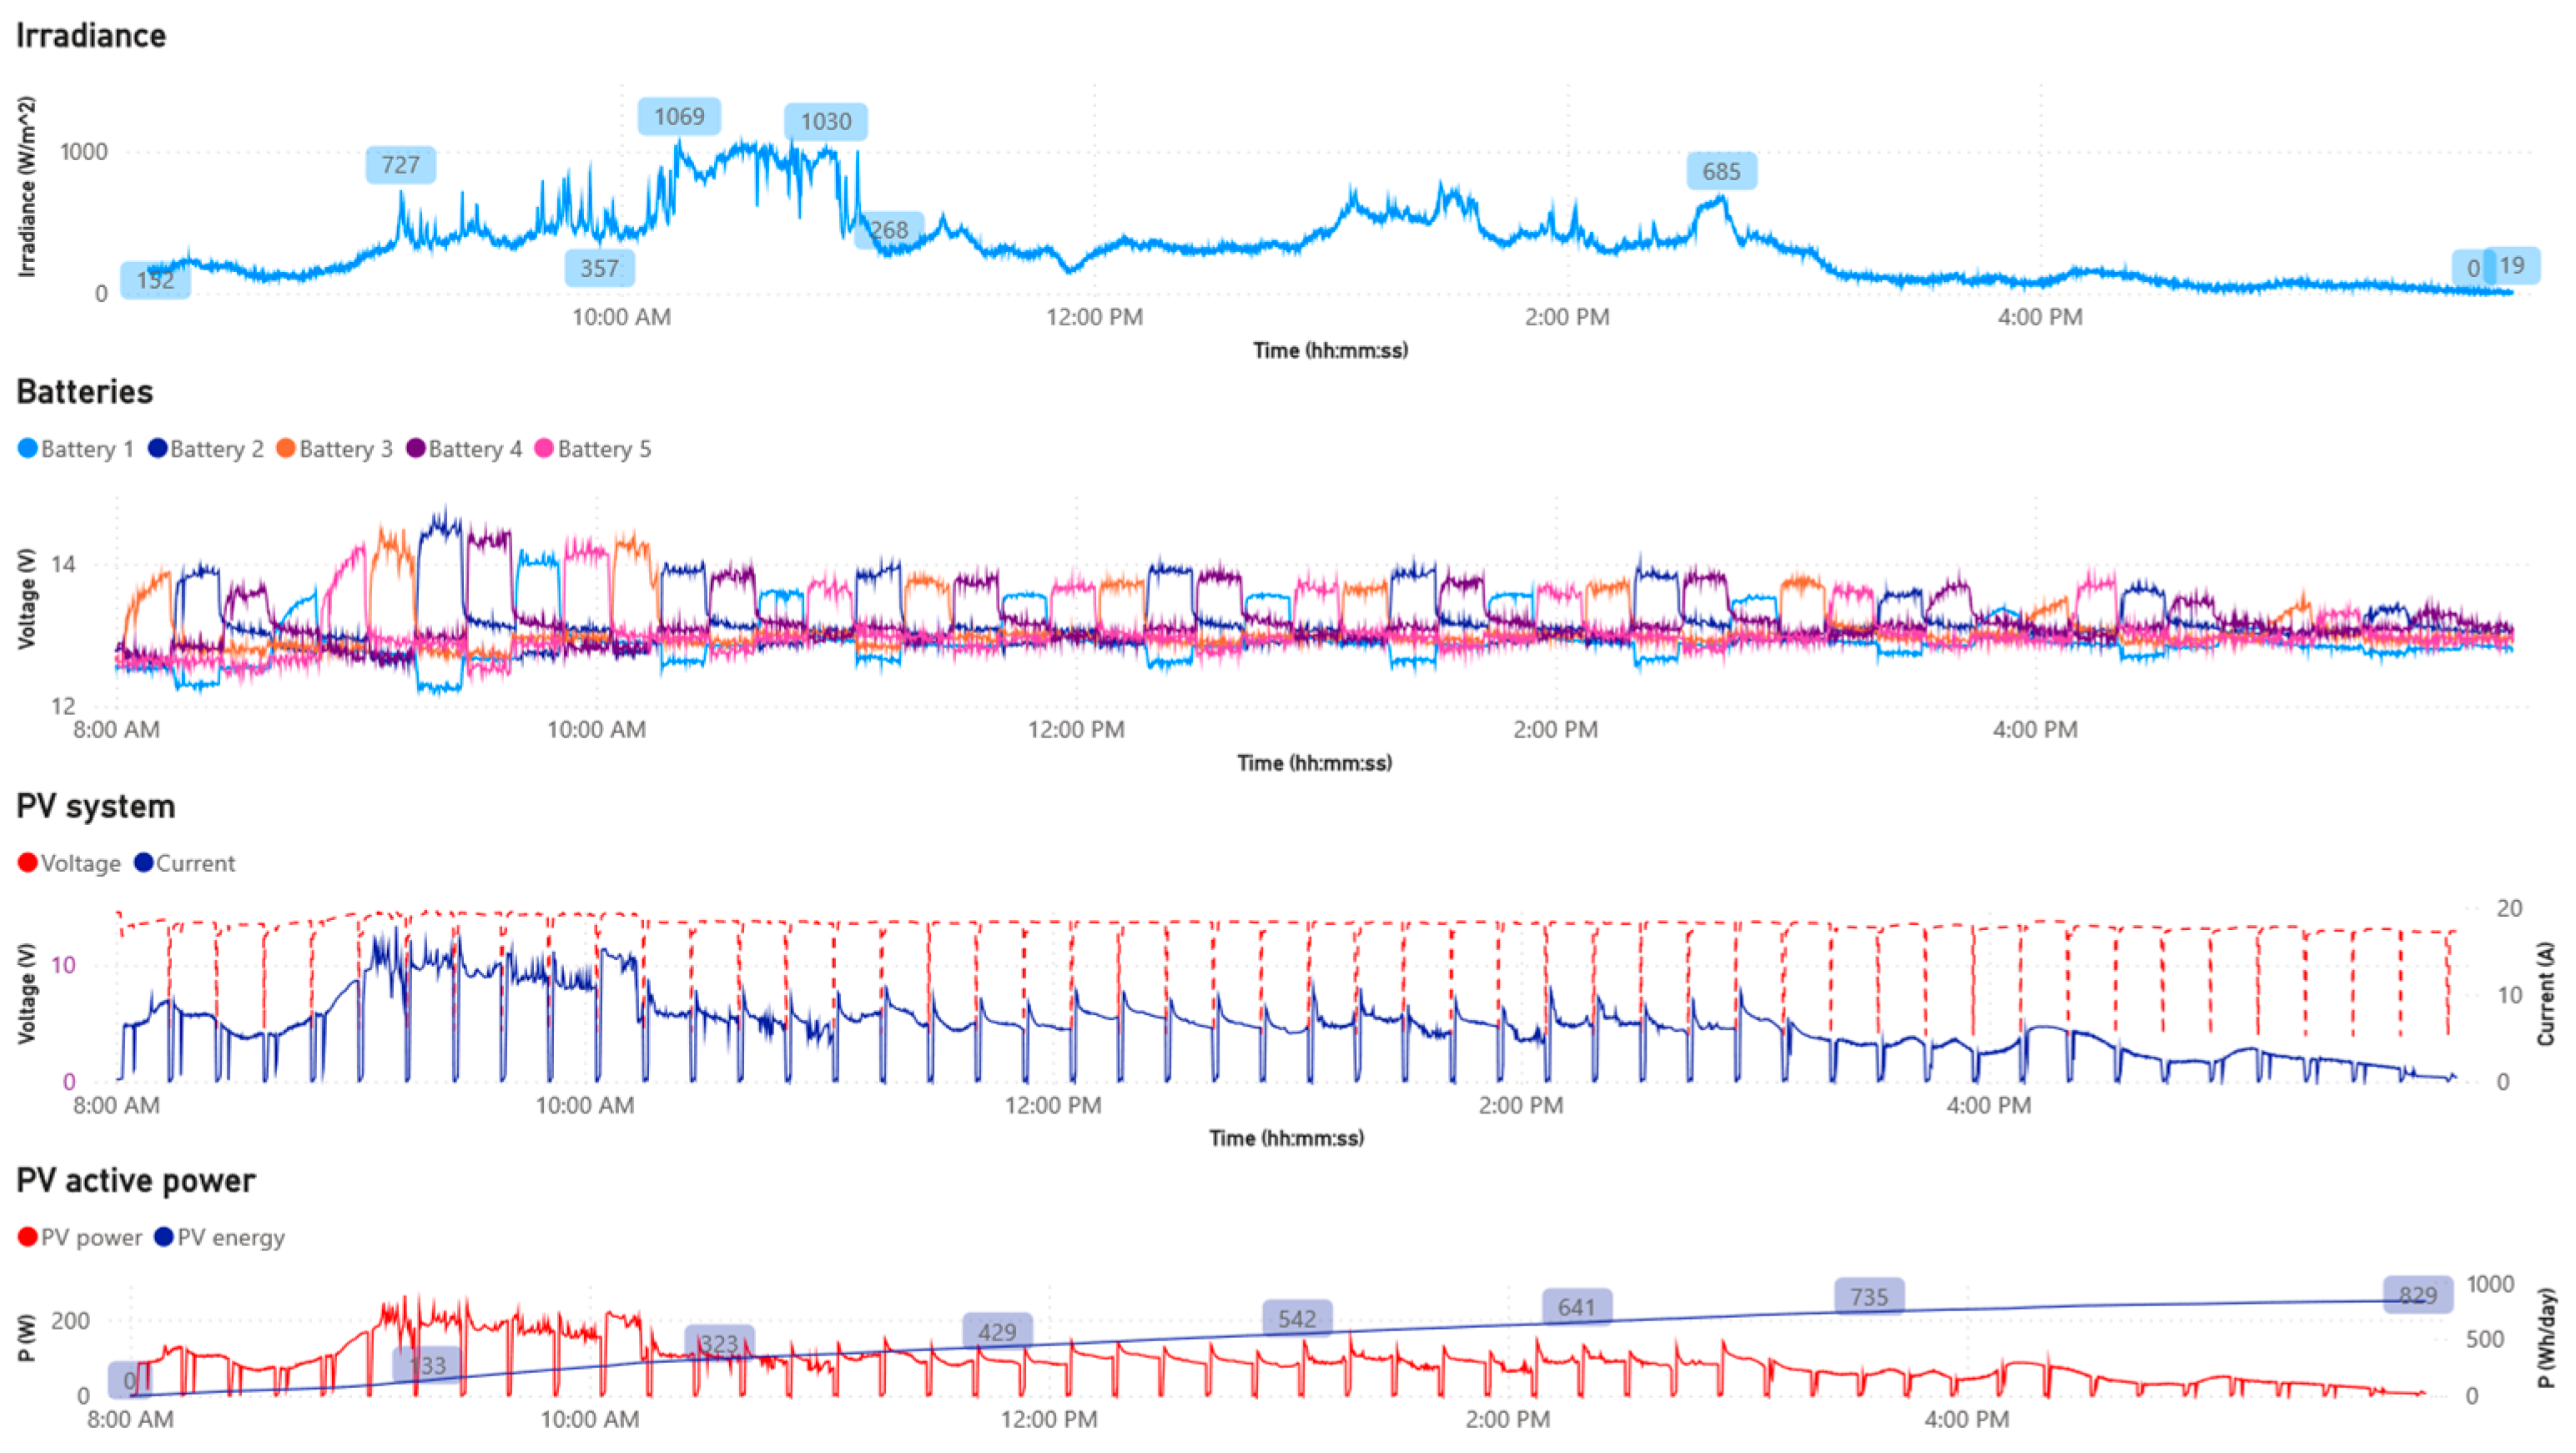
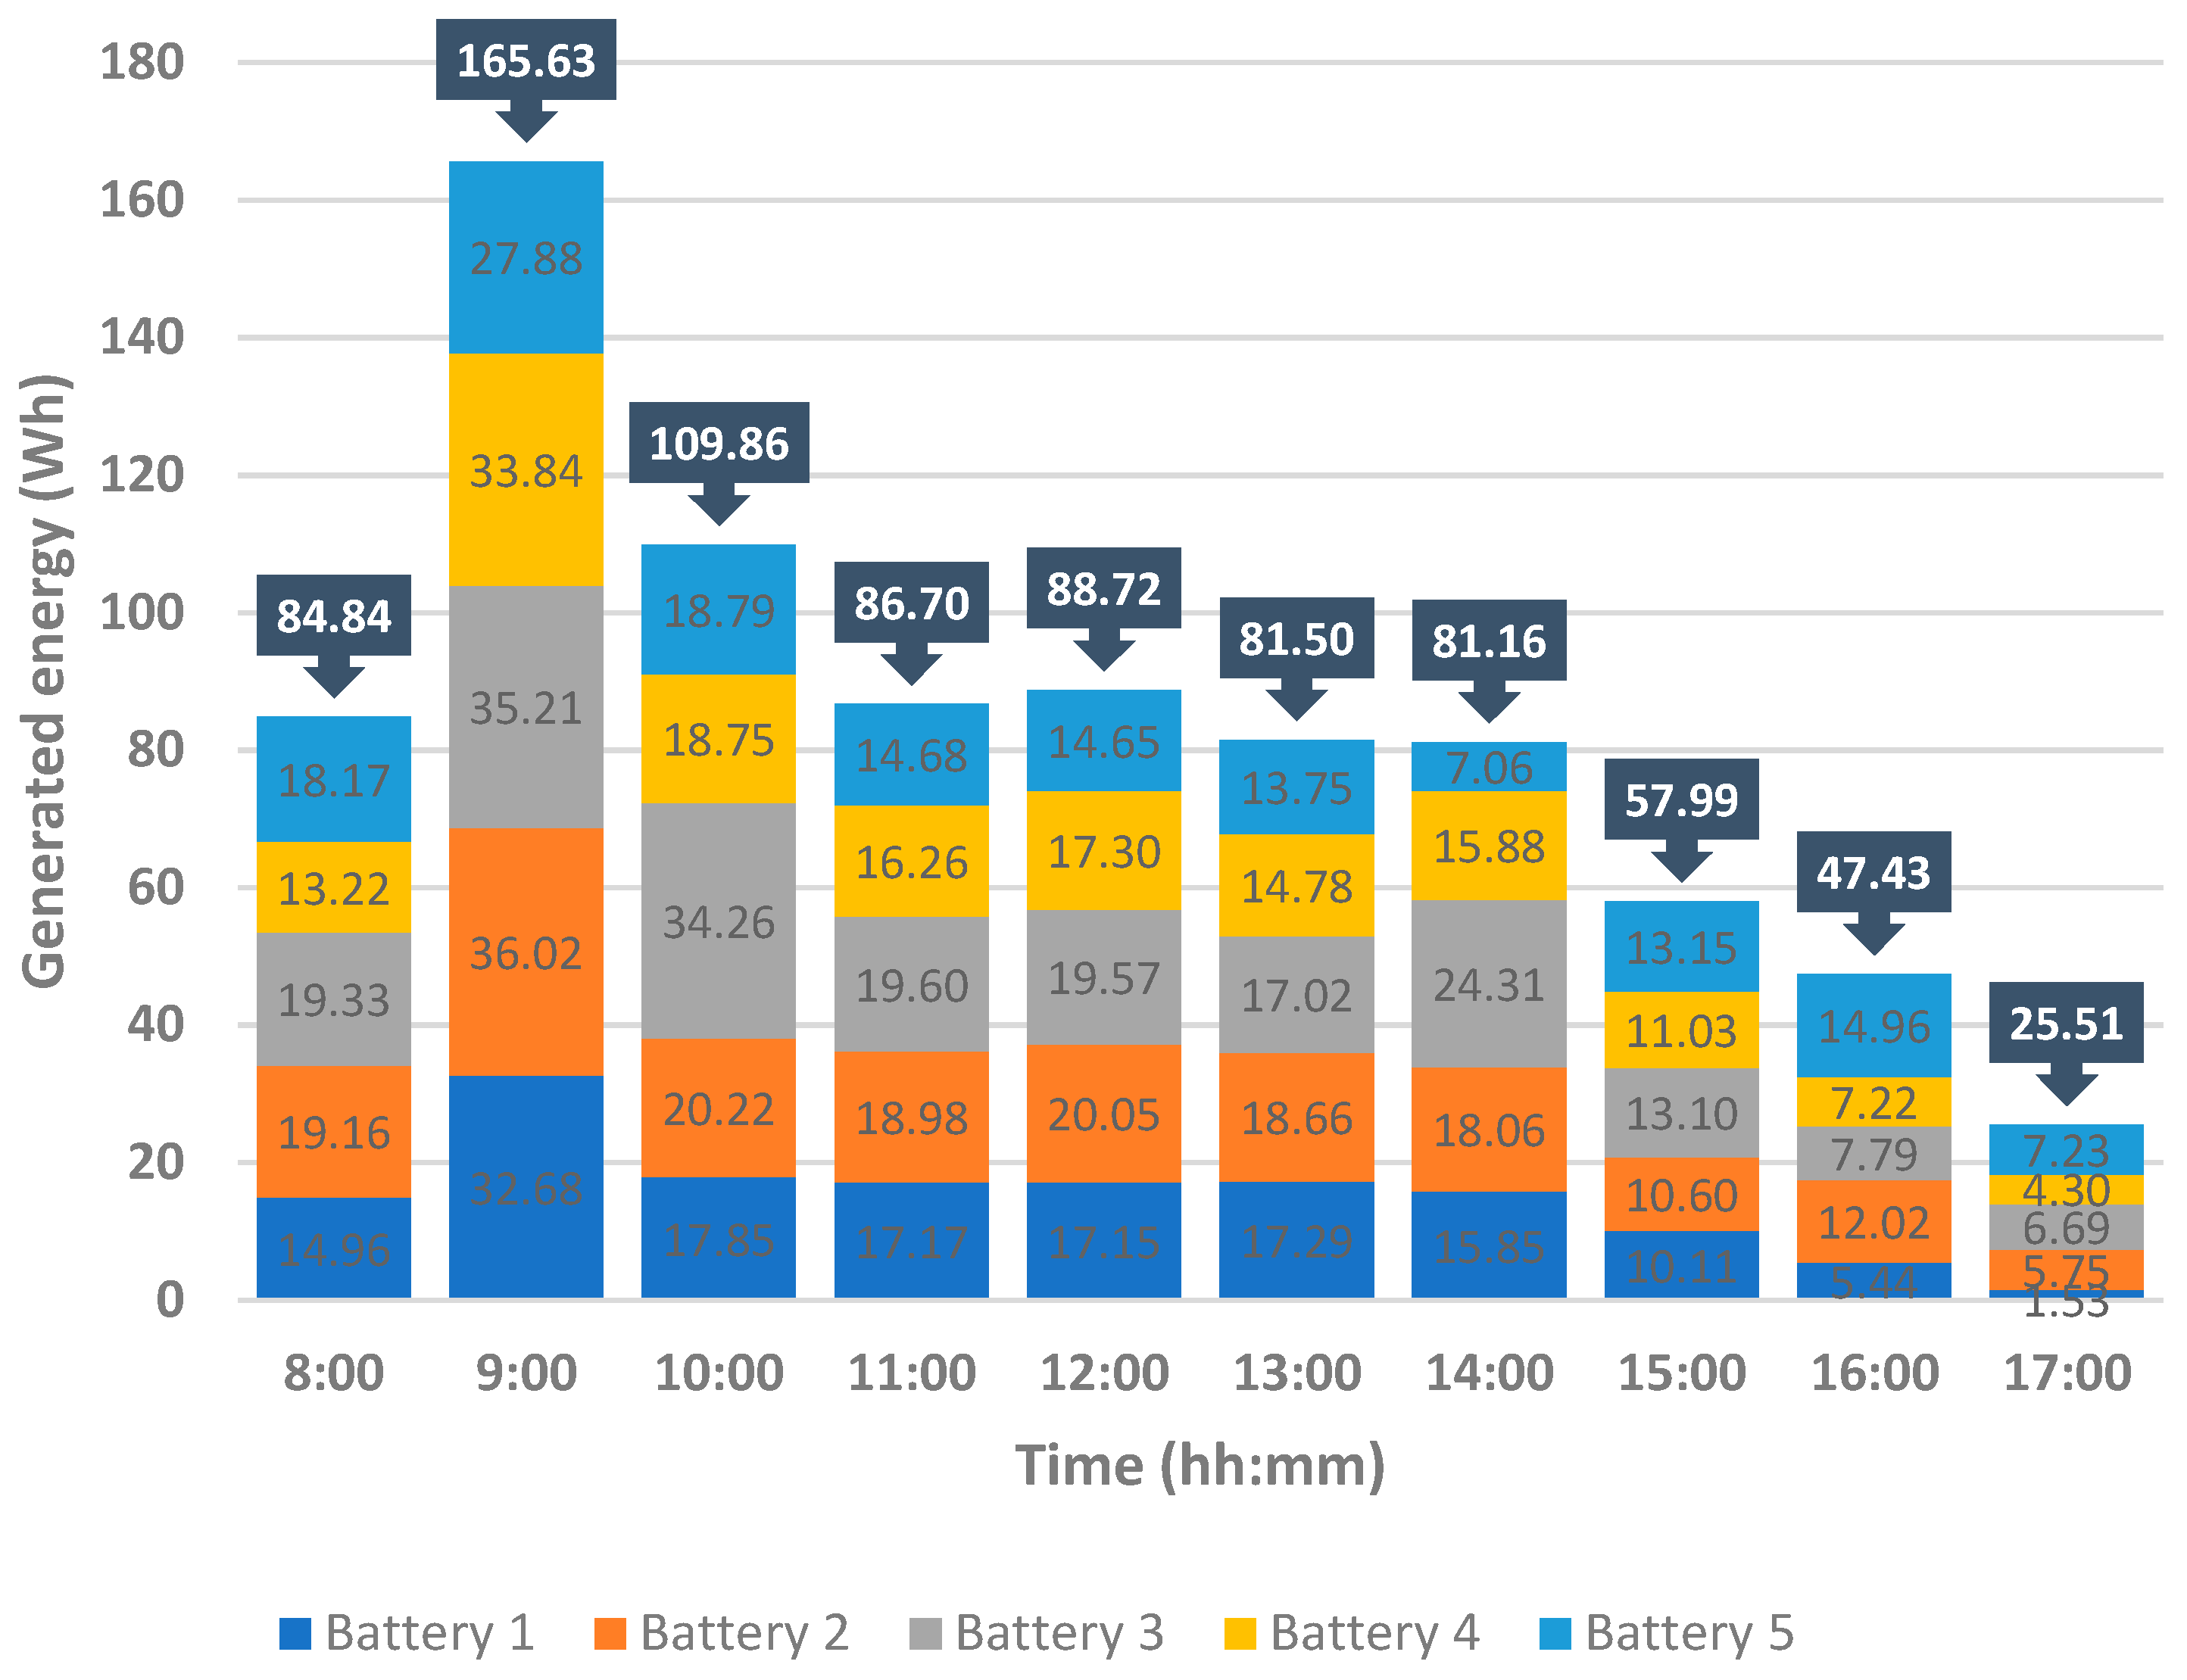
3.1. Performance Analysis of the Photovoltaic System While the EV Was Parked

The test was conducted in the parking lot of the Academic Unit of Postgraduate Studies at Universidad Católica de Cuenca (Latitude: −2.8708536, Longitude: −78.9815086). The charging system was programmed to charge the batteries using the PV system from 08:00 to 18:00, with a charging period of 12 min per battery and a 10-s interval for equalization (the test with the EV parked was carried out with the batteries at 50% charge). This setup was implemented to analyze the energy being supplied to the five batteries per hour at different times of the day. Figure 10 shows an average irradiance of 326.09 W/m2 throughout the day and an irradiation of 3261 Wh/m2/day. Additionally, it illustrates the individual voltage of each battery, the voltage and current levels during charging, and the power generated by the PV system. It can be evidenced that the power generated by the PV system is directly proportional to solar irradiance, reaching its peak in the early hours of the day and gradually decreasing as the irradiance decreases in the afternoon.
A violin plot was used to individually analyze the distribution of data for each battery, as shown in Figure 11. In each violin plot, the data were concentrated in two areas. This concentration reflects the voltage levels of the batteries when they were not being charged by the PV system, with data points clustered around Points A, B, C, D, and E. The data density increased progressively due to the charging throughout the day. Conversely, the data density at Points a, b, c, d, and e represents the voltage levels while the solar controller was charging each battery. The data density in this area was lower as it corresponded to only two hours of charge per battery during the day compared to the eight hours during which the batteries remained idle.
The data presented in Table 3 were gathered from the previous graph, detailing the quartiles of each violin plot. After analyzing the quartiles and comparing the voltages of all batteries, it was observed that Battery 1 received the least energy charge (even when the solar controller charged it with a lower voltage compared to the others). Batteries 5 and 3 exhibited similar results, whereas Batteries 2 and 4 received the highest charge throughout the day.
Figure 12 illustrates the power supplied by the PV system to each battery on an hourly basis for a full day of charge while the EV was parked. During the first hour of charging, there was no significant energy input to the batteries due to the low irradiance at that time. However, peak power was recorded between 09:00 and 10:00, coinciding with an increase in the irradiance levels. Although the peak irradiance of the day usually occurred between 10:00 and 11:00, the peak power did not occur during this period. This can be explained by the fact that the photovoltaic controller charged the batteries based on the voltage level of each battery. As the battery voltage increased due to the supplied energy, the solar controller adjusted the charging power to prevent overcharging. Therefore, between 11:00 and 14:00, the power generation remained consistent. Subsequently, the generated power began to decrease due to the low irradiance levels at that time.
Figure 13 shows the total power generated throughout the day (829.33 Wh/day), as well as the power generated individually for each battery. This graph confirms what was observed in the previous violin plot: Batteries 1 and 5 received the least energy charge during the day, followed closely by Battery 4. On the other hand, Batteries 2 and 3 received the highest energy charge throughout the day.

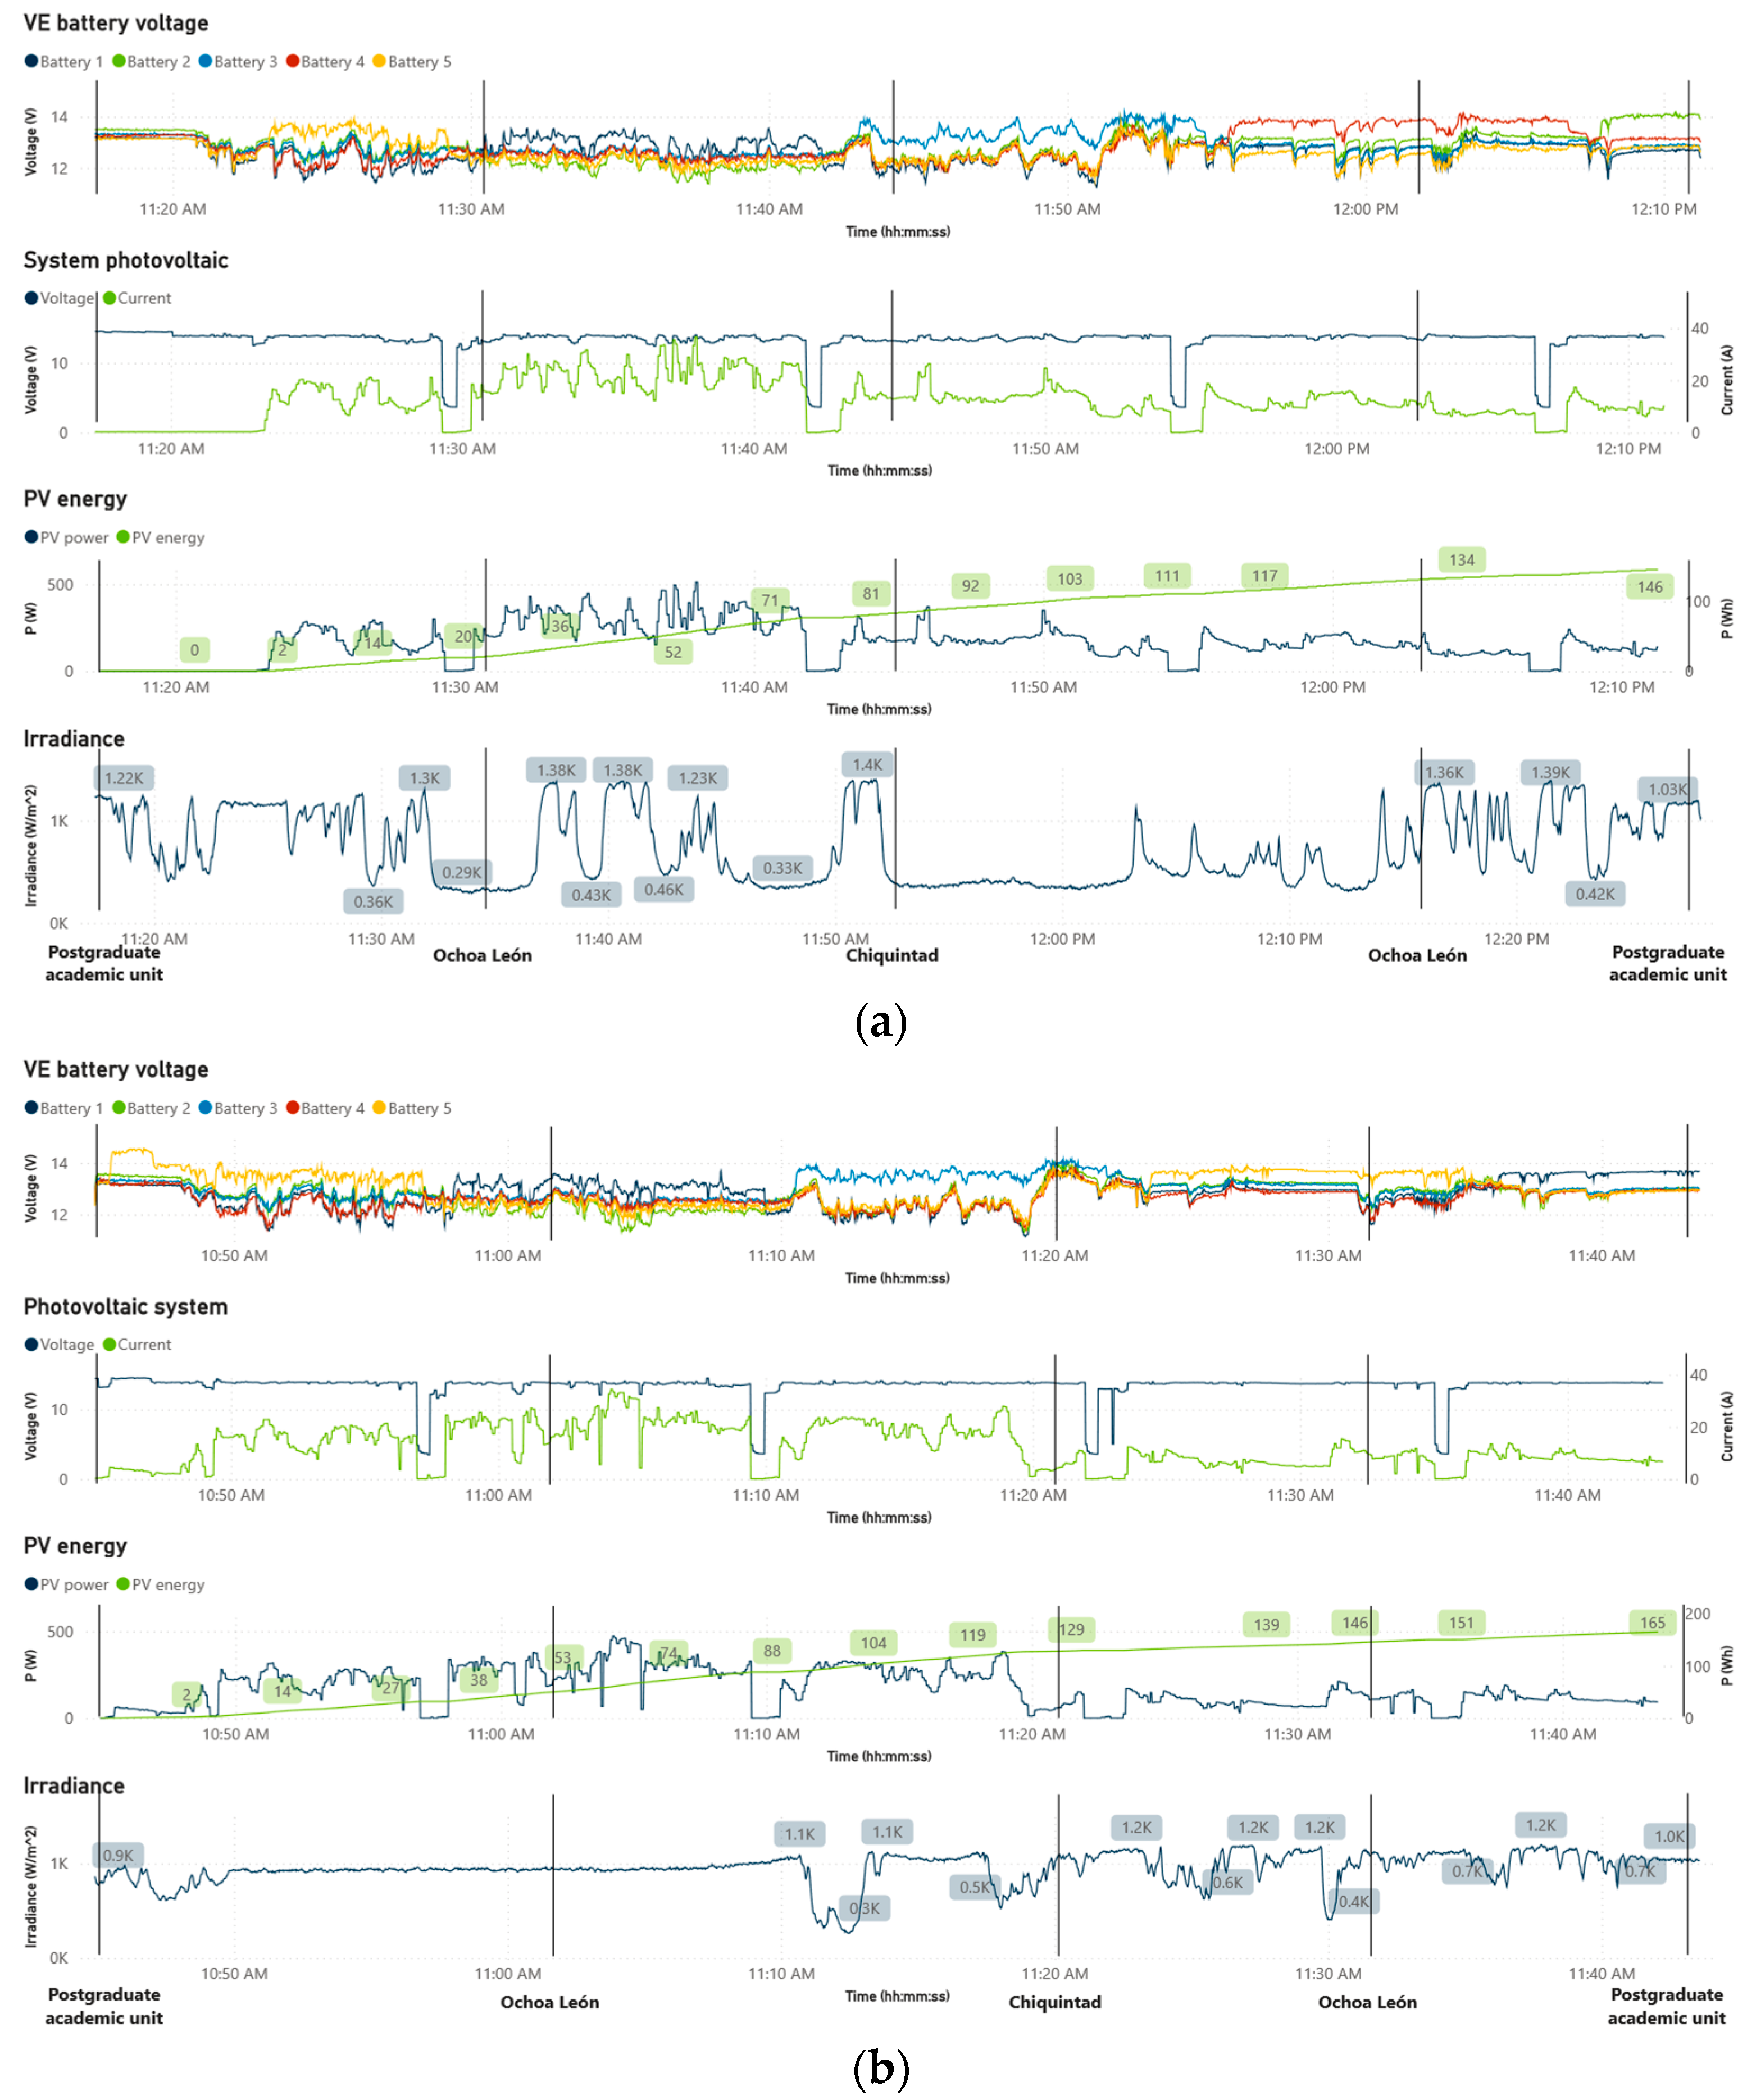
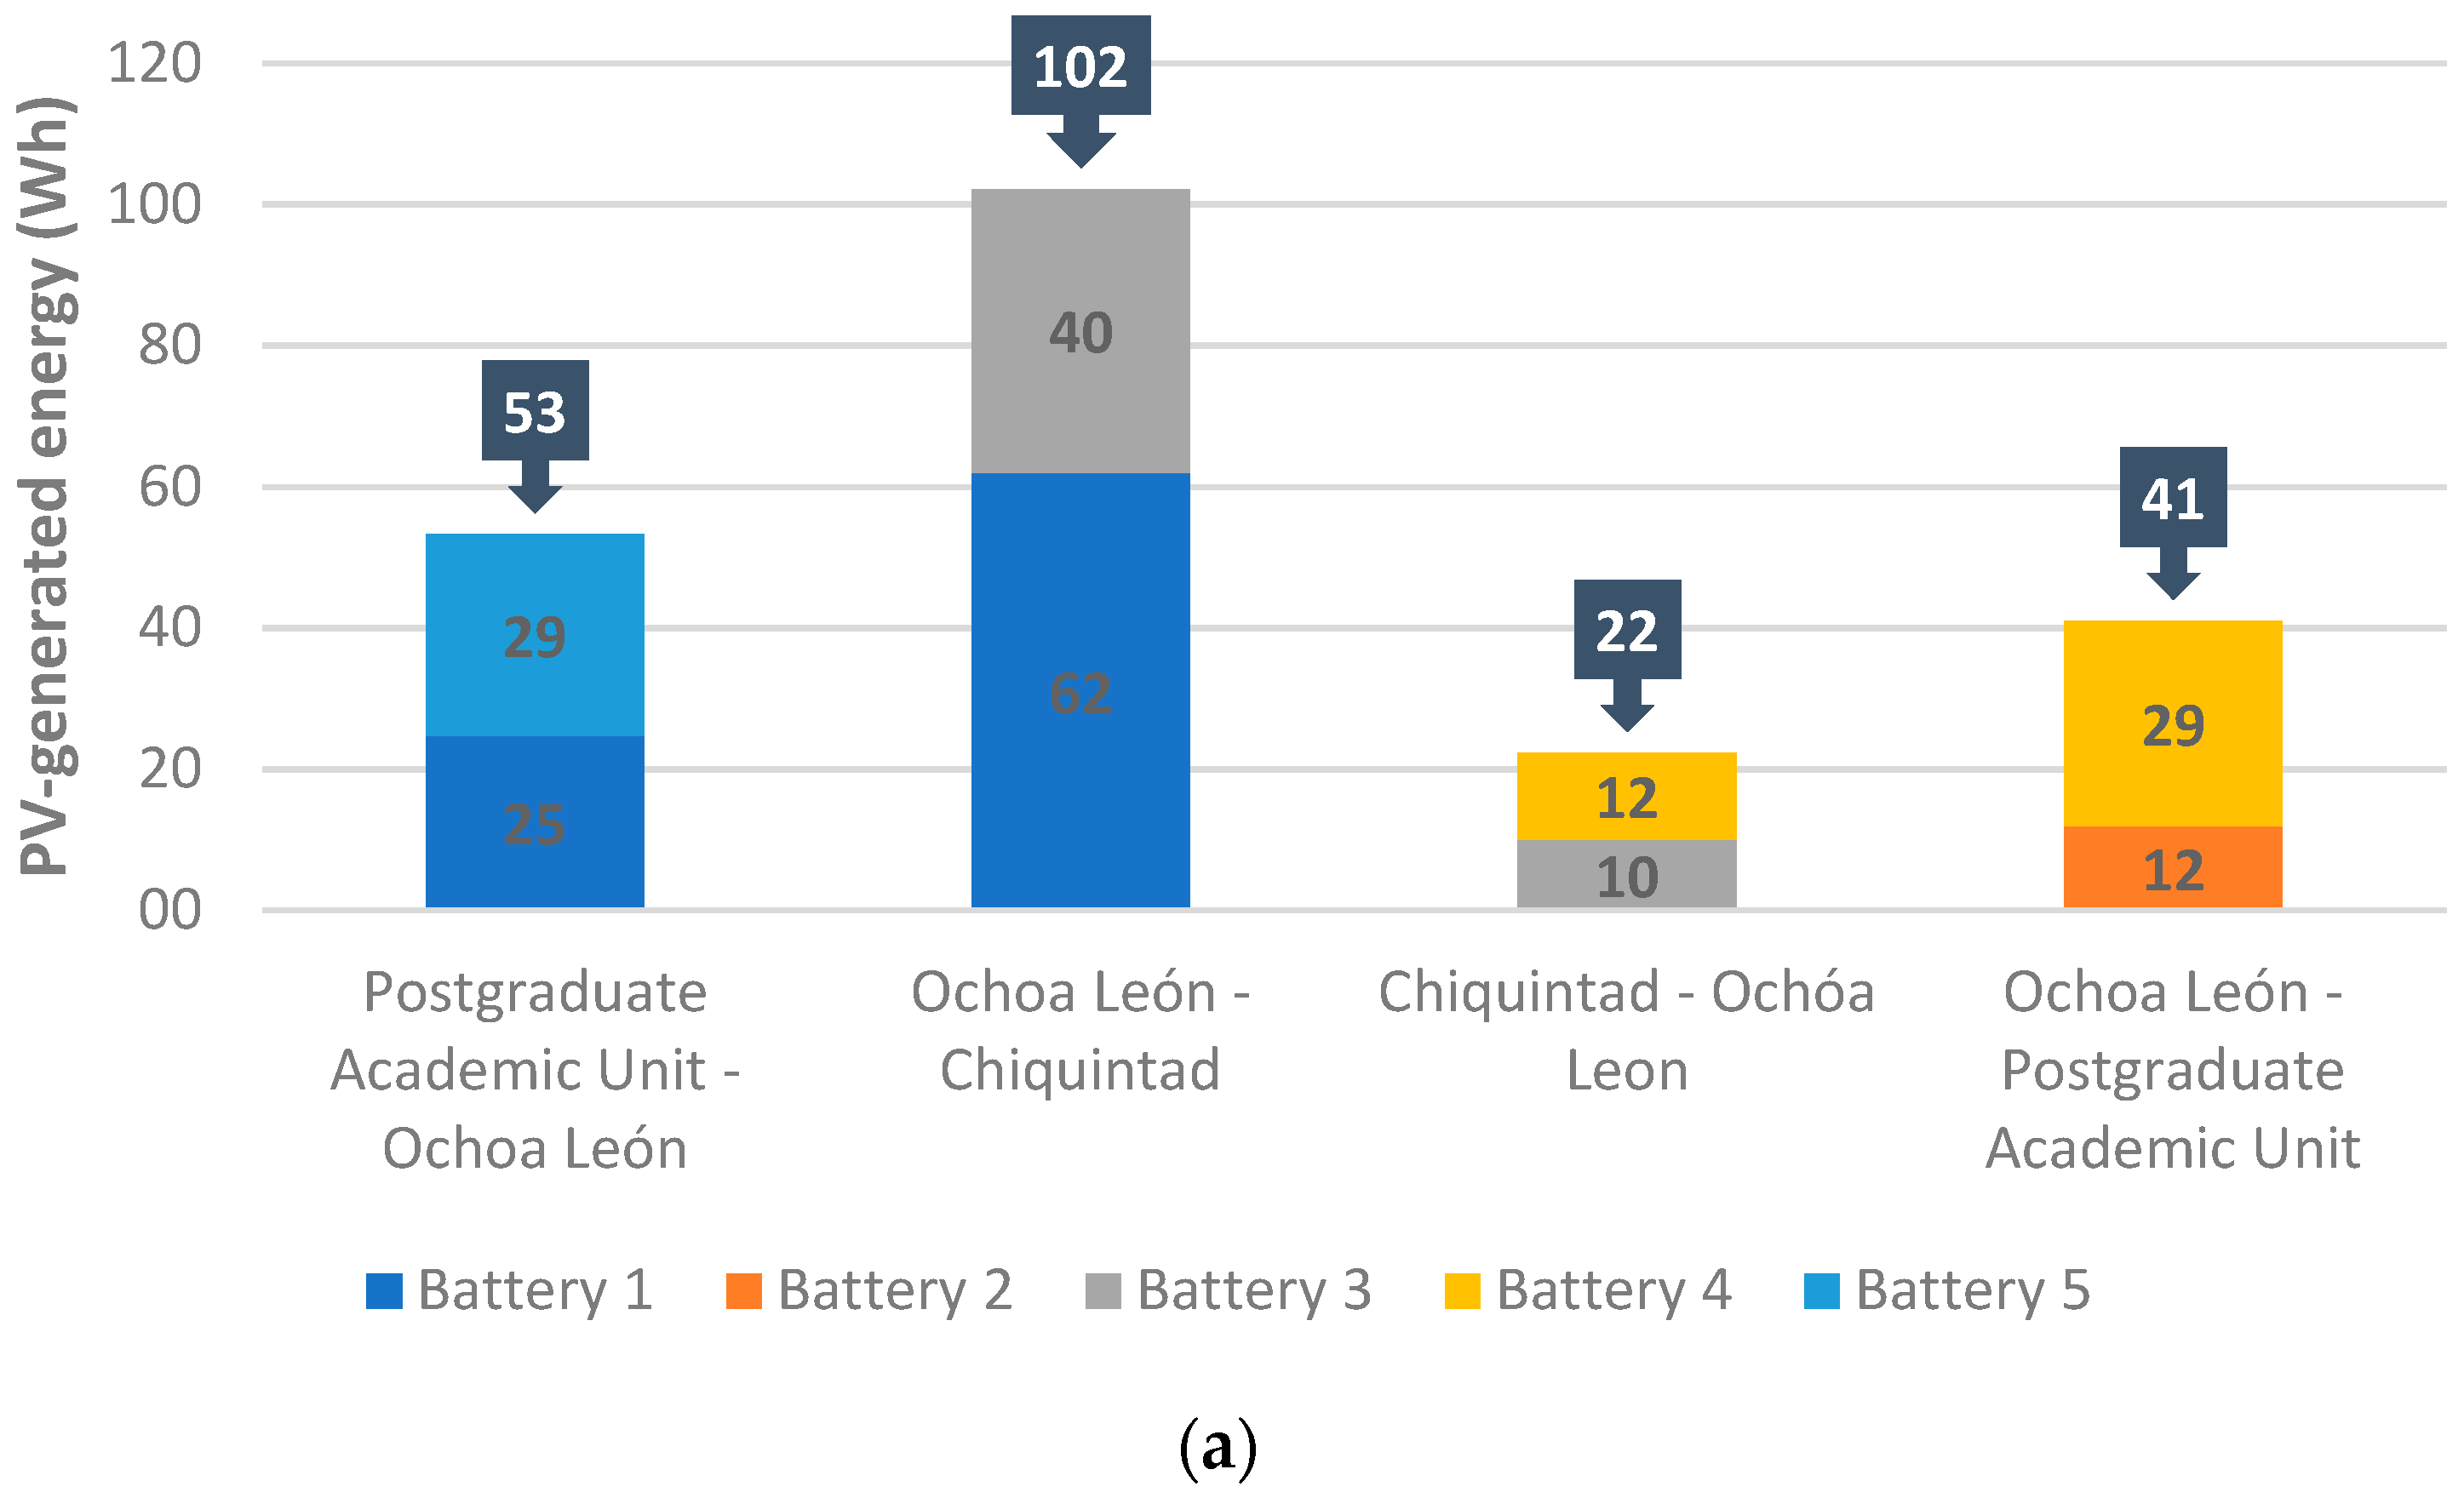
3.2. Performance Analysis of the Photovoltaic System during the EV’s Route

The tests of the EV in motion were carried out on an Andean road in two stages: the first one, as a baseline, without the charging system (Test 1); and the second one (Tests 2 and 3) using the integrated charging system (the tests with the EV’s road were carried out with the batteries charged to 95%). A comparative analysis between both stages was performed to highlight the energy improvements in the EV. The selected route had a length of 16.8 km and exhibited significant variations on a slope along the way. Some segments had an average slope of 2.1%, while others reached an average slope of 4%. Therefore, to perform a more detailed analysis of the results, four segments with similar slope characteristics were defined. Segment 1 covered the distance from the School of Postgraduate Studies of Universidad Católica de Cuenca to Ochoa León; Segment 2 covered the distance from Ochoa León to Chinquintad; Segment 3 covered the distance of an alternate route from Chiquintad to Ochoa León; and, finally, Segment 4 covered the distance from Ochoa León back to the School of Postgraduate Studies of Universidad Católica de Cuenca. These data are shown in the slope profile in Figure 14a. Additionally, the slope along the road, reaching peaks of up to 15%, is shown in Figure 14b.

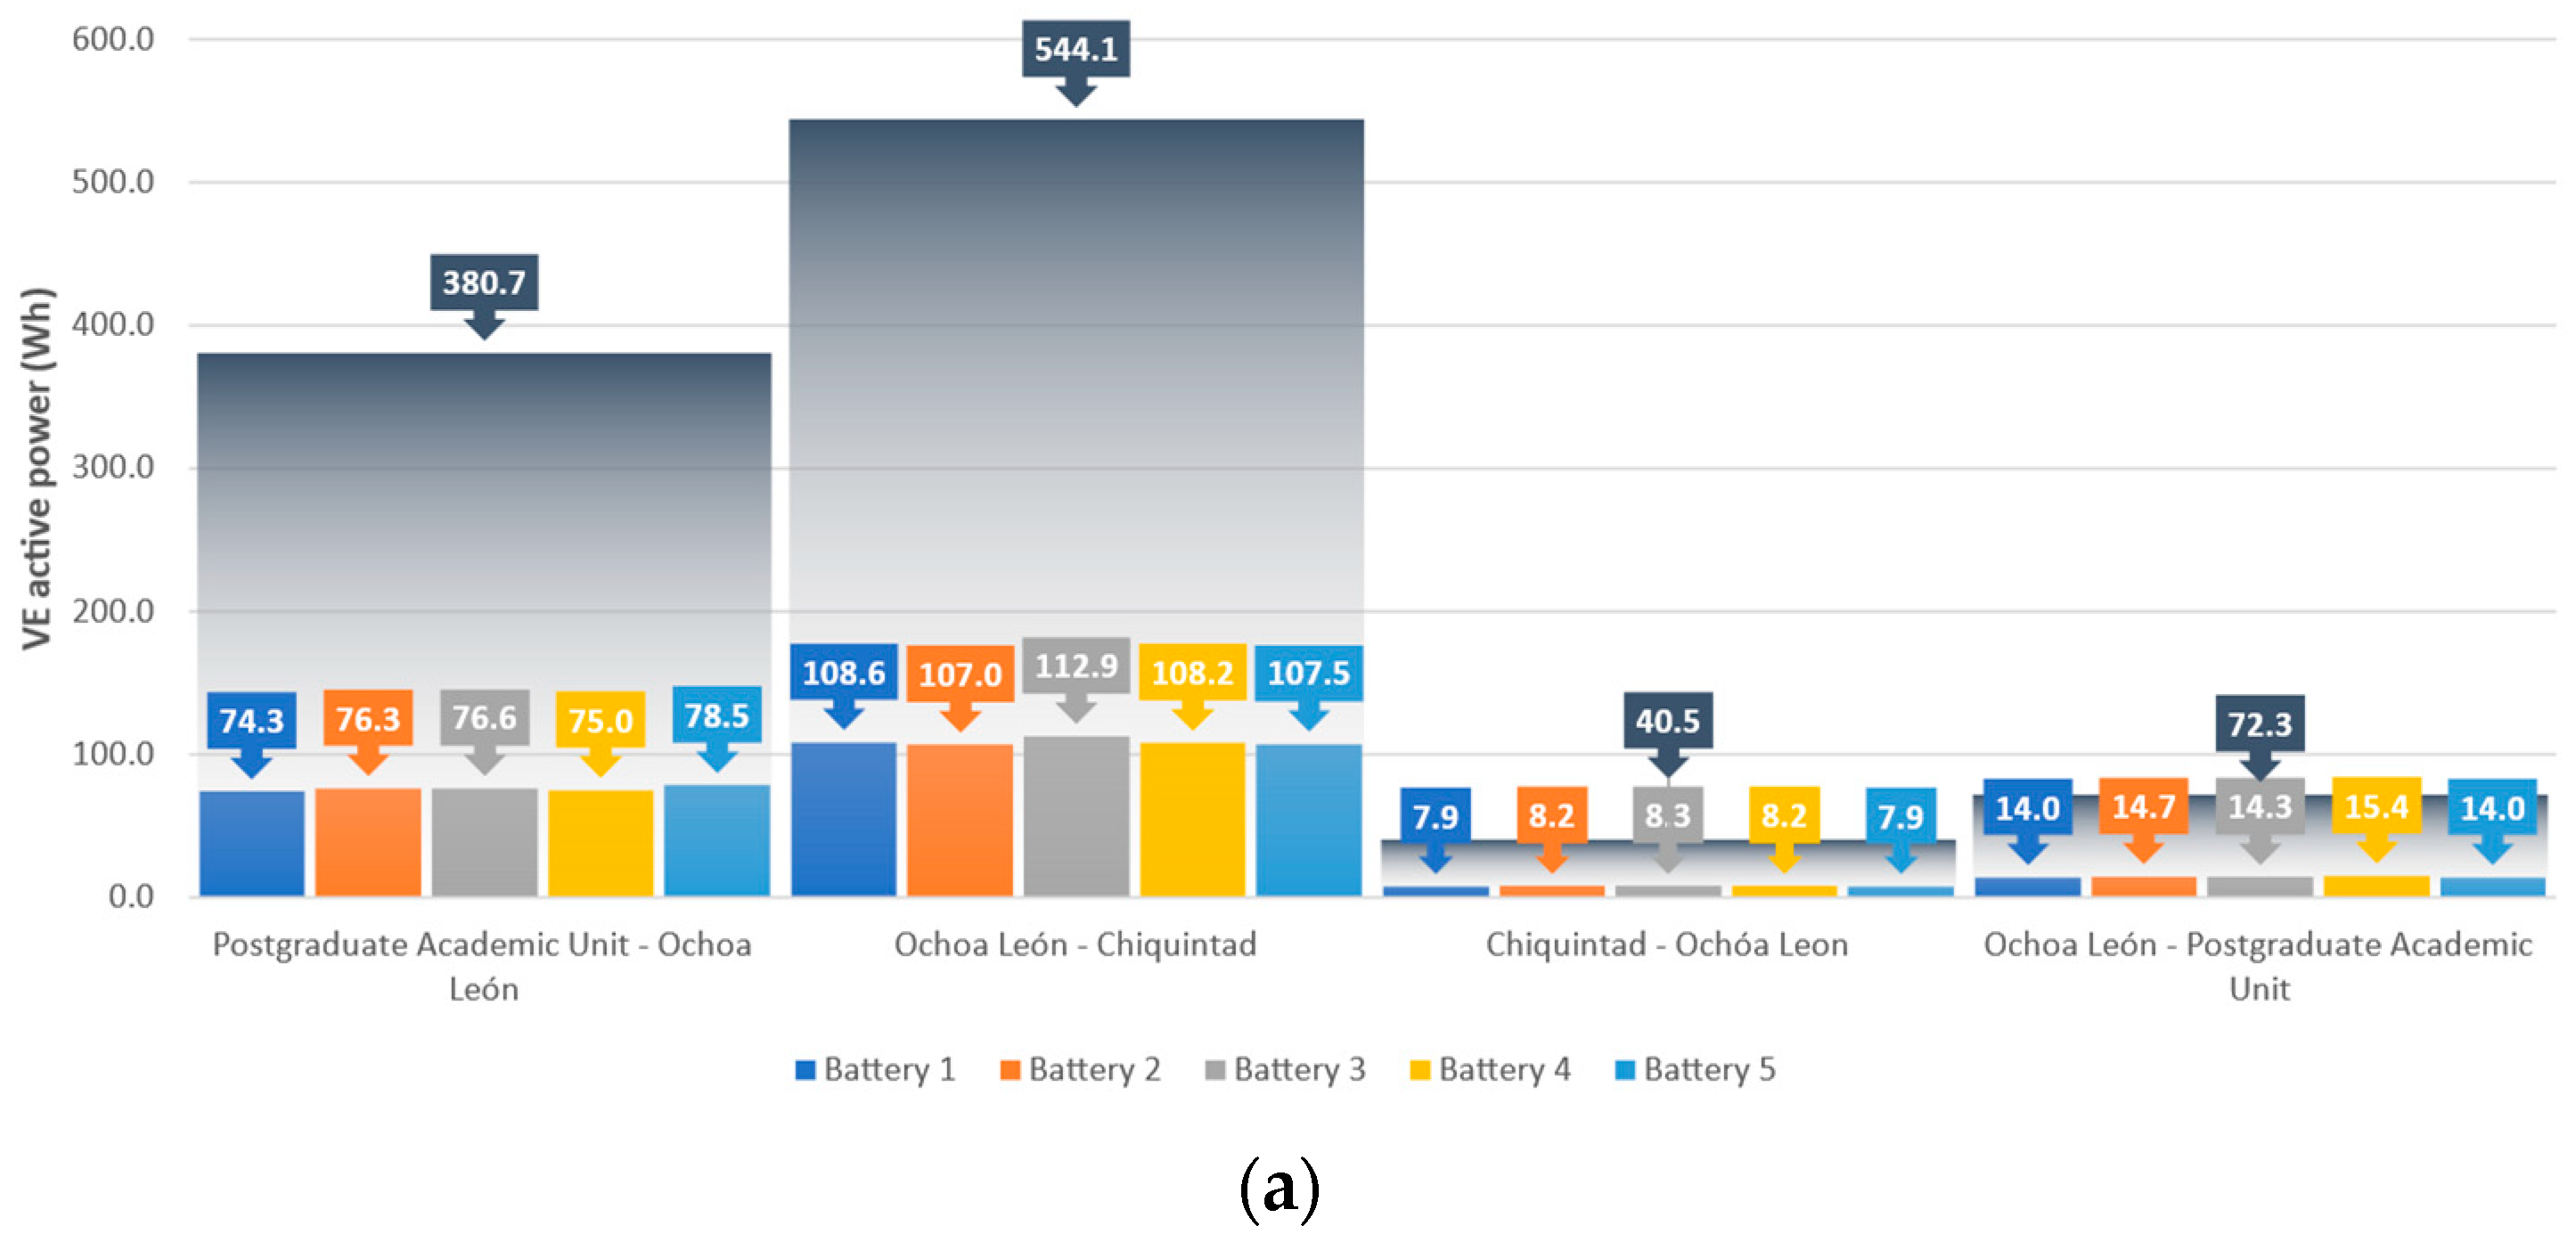
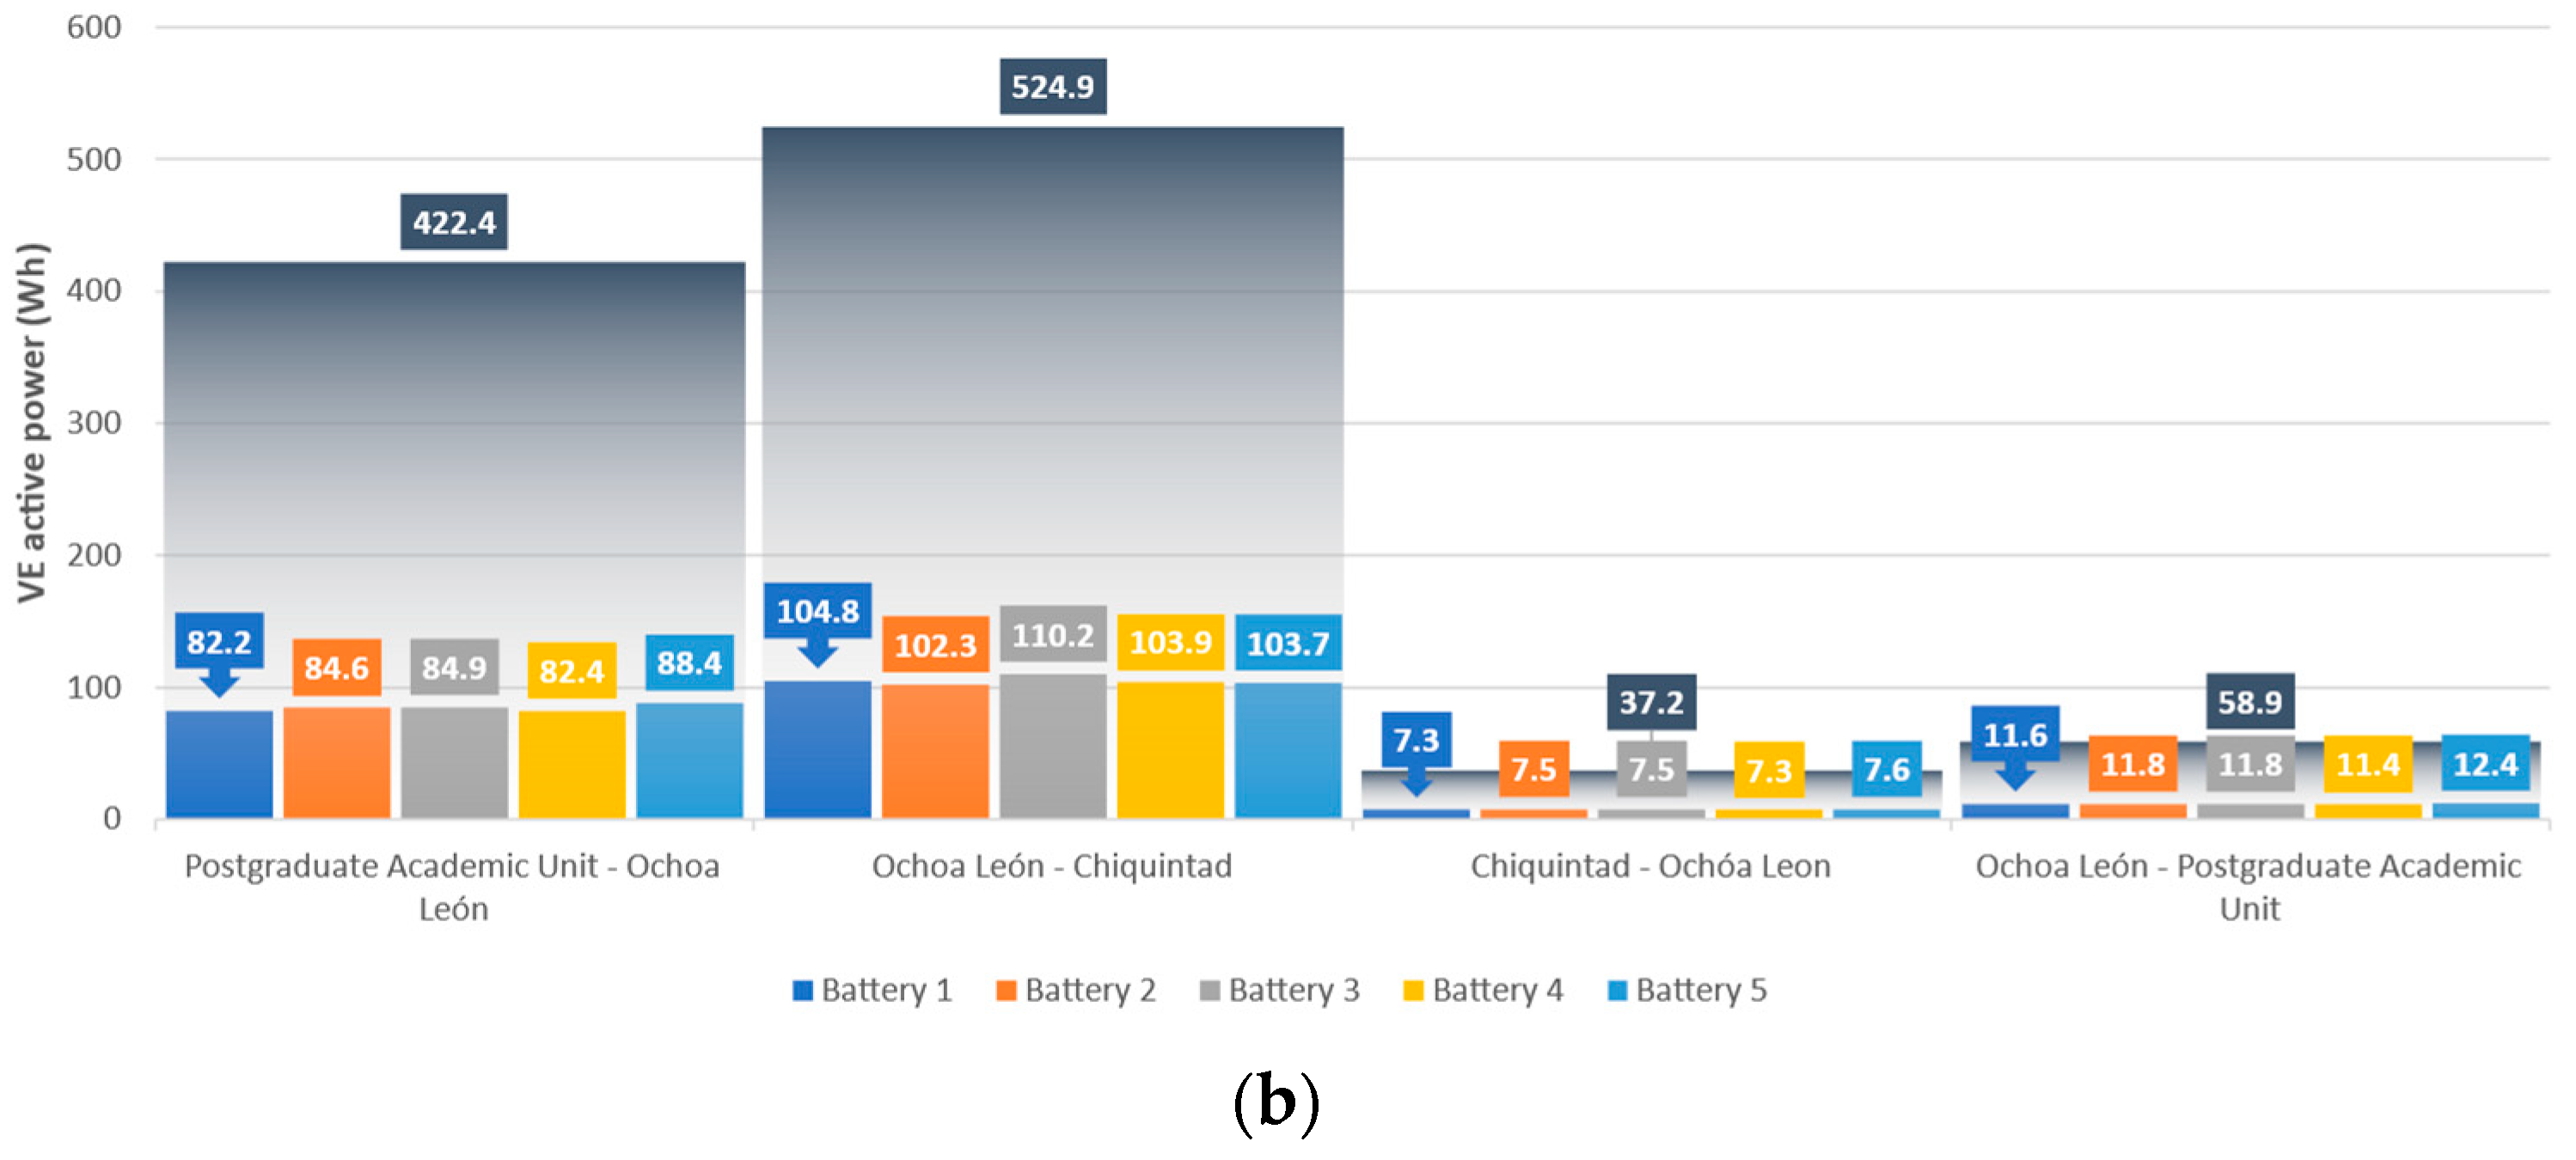
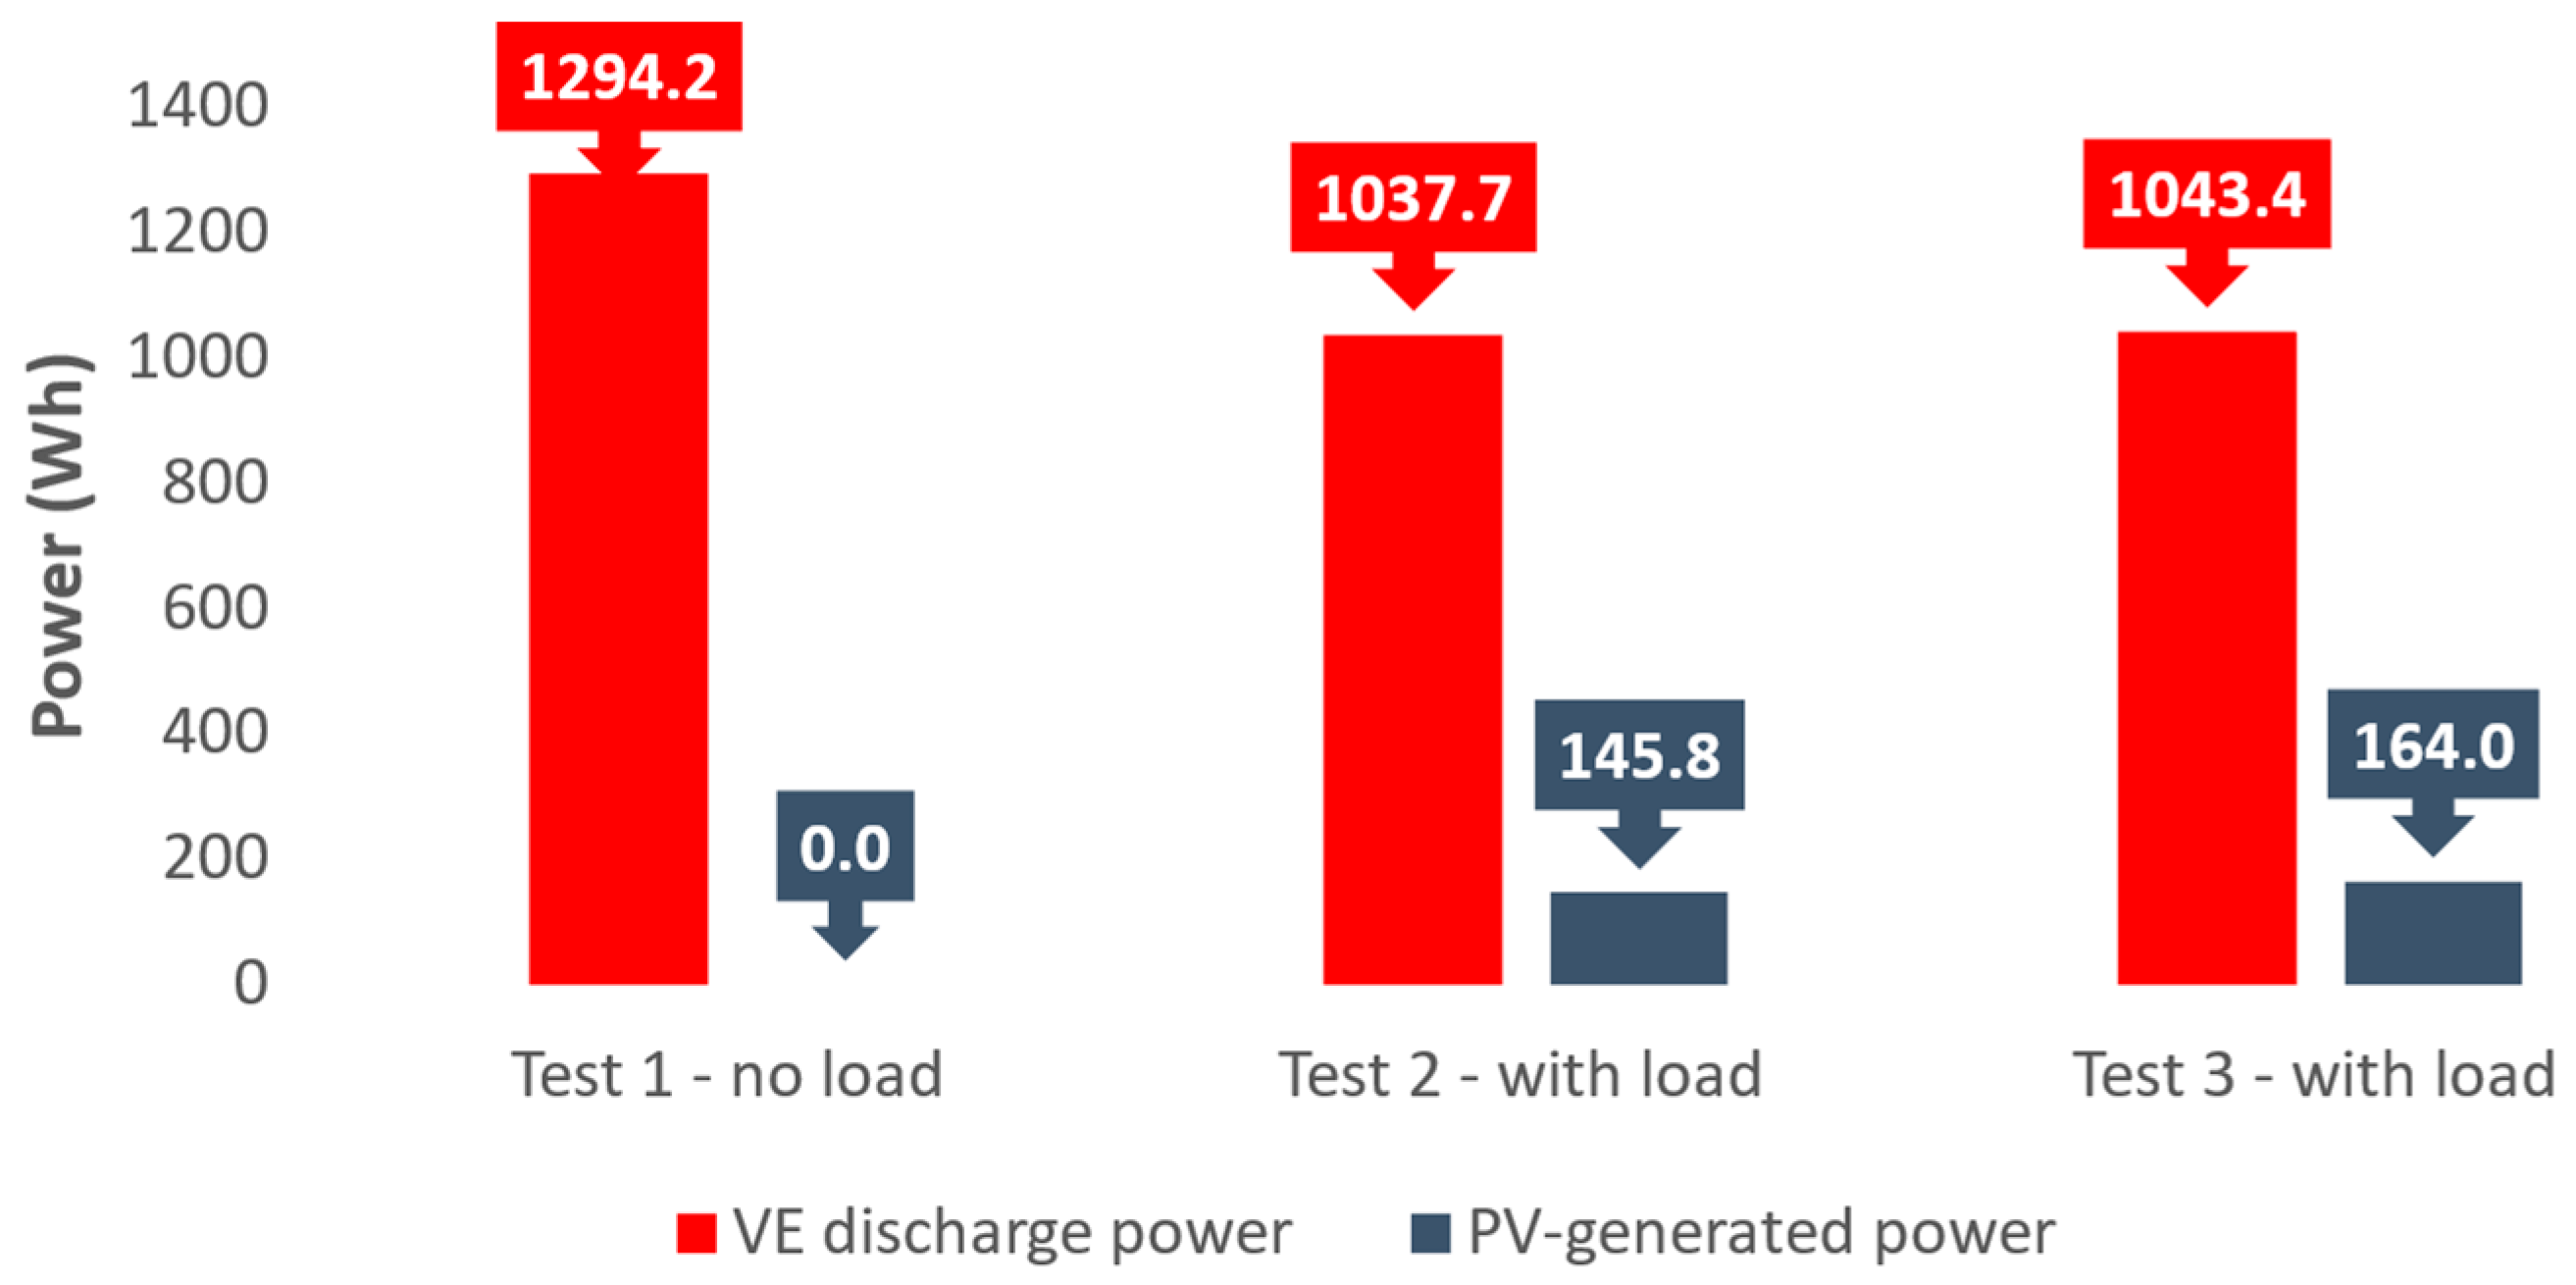
3.2.1. Analysis of the Energy Consumption of the EV in Motion without Additional Energy Input

During the first trip (Test 1), the PV–wind energy system was not active. This setup allowed for the collection of baseline data to be compared later with the second trip. Figure 15 shows the data obtained during the first trip, and it details the electrical magnitudes of the EV, such as voltage and current, observing high levels of current in certain segments with steep slopes. Additionally, it exhibits the instantaneous active power of the EV and the total energy consumed during the trip (1294.2 Wh).
A detailed analysis is presented in Figure 16, showing the active discharge energy of each battery in different segments of the trip. During the first segment, which was 4.4 km long and had an uphill slope of 2.1%, a discharge of 379 Wh was recorded. A discharge of 631.9 Wh was observed in the second segment, which was 4.68 km long and had a steeper uphill slope (4.08%). The highest energy consumption was experienced in this segment due to its greater slope and distance. The third segment was 3.26 km long and had a downhill slope of 3.6%; therefore, the energy consumption was lower (124.7 Wh). Finally, the vehicle’s discharge was 158.5 Wh during the last sector, which was 4.4 km long and had a downhill slope of 2.1%. It is important to note that Batteries 1 and 5 supplied less power during the trip compared to Batteries 2, 3, and 4, which exhibited very similar power levels.

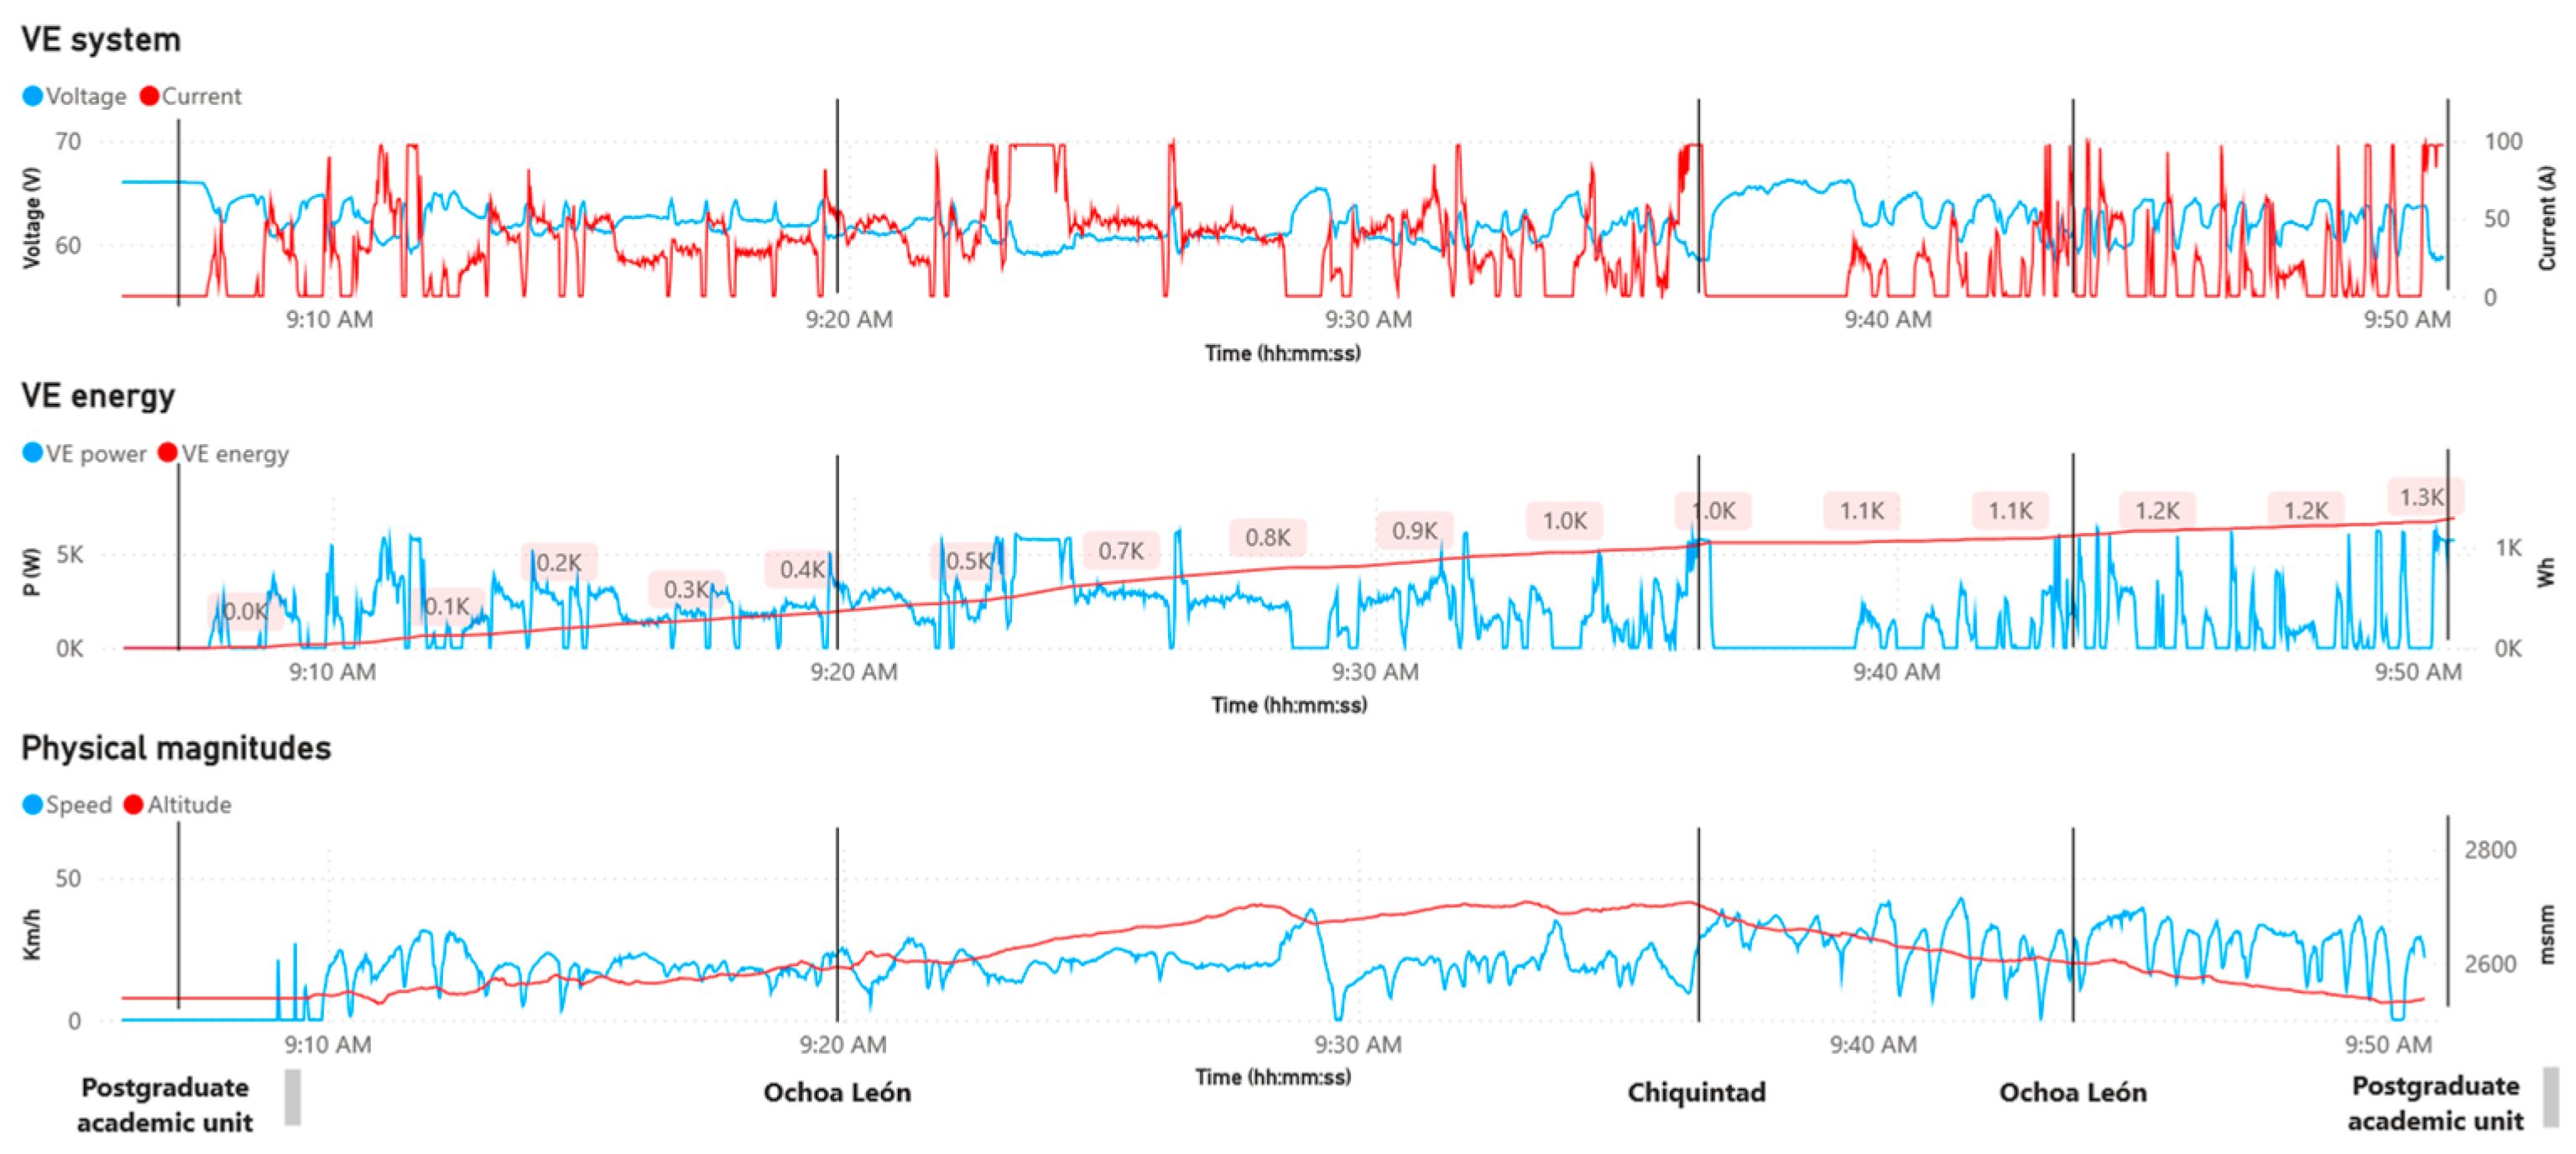
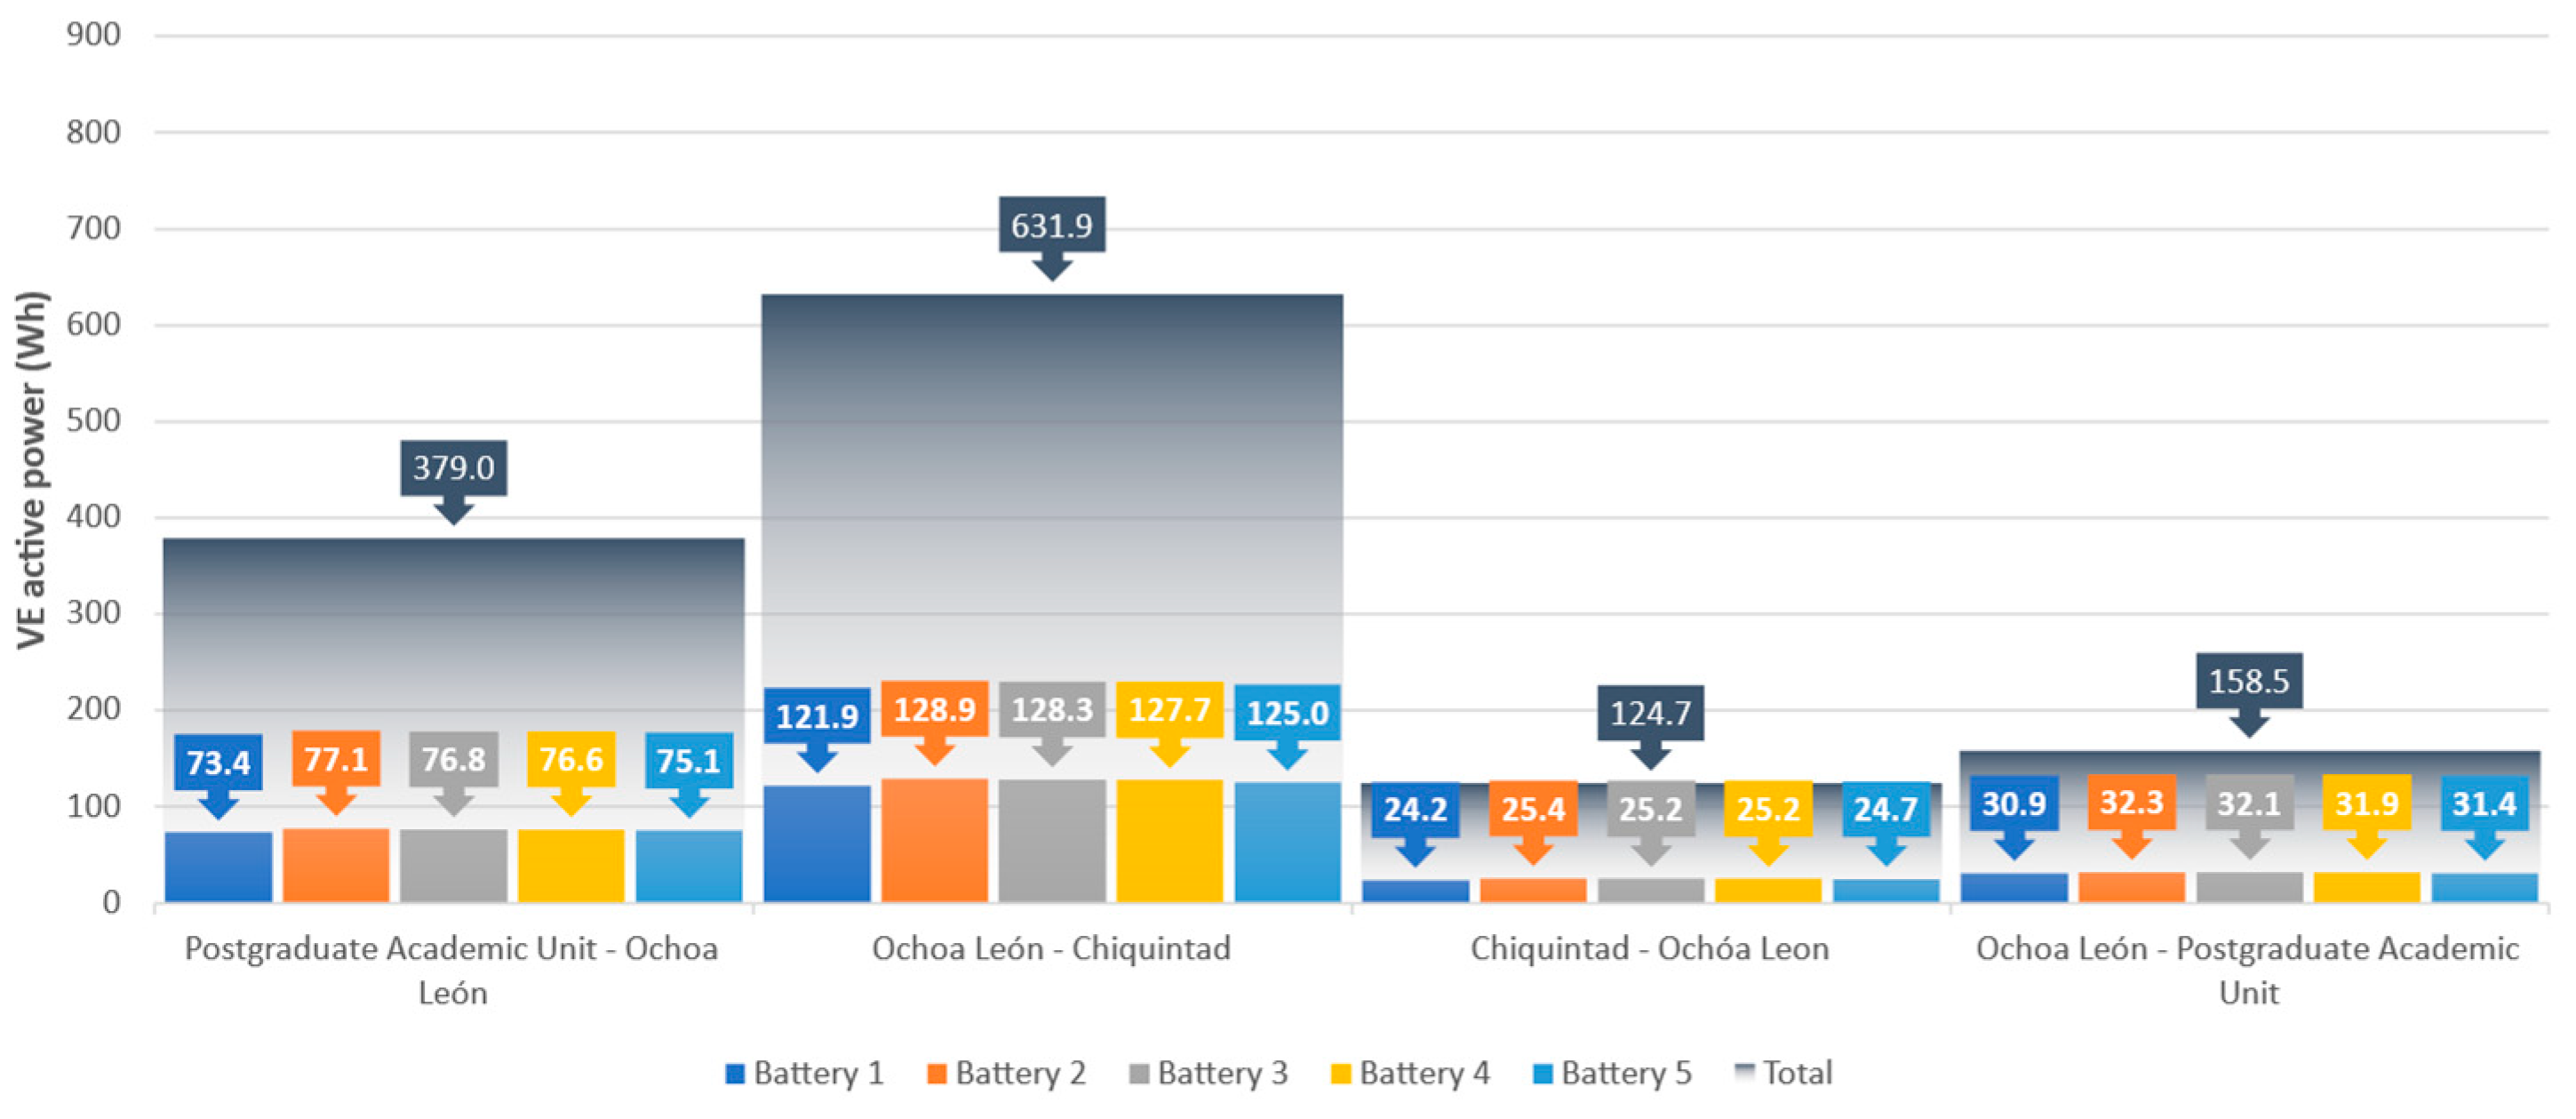
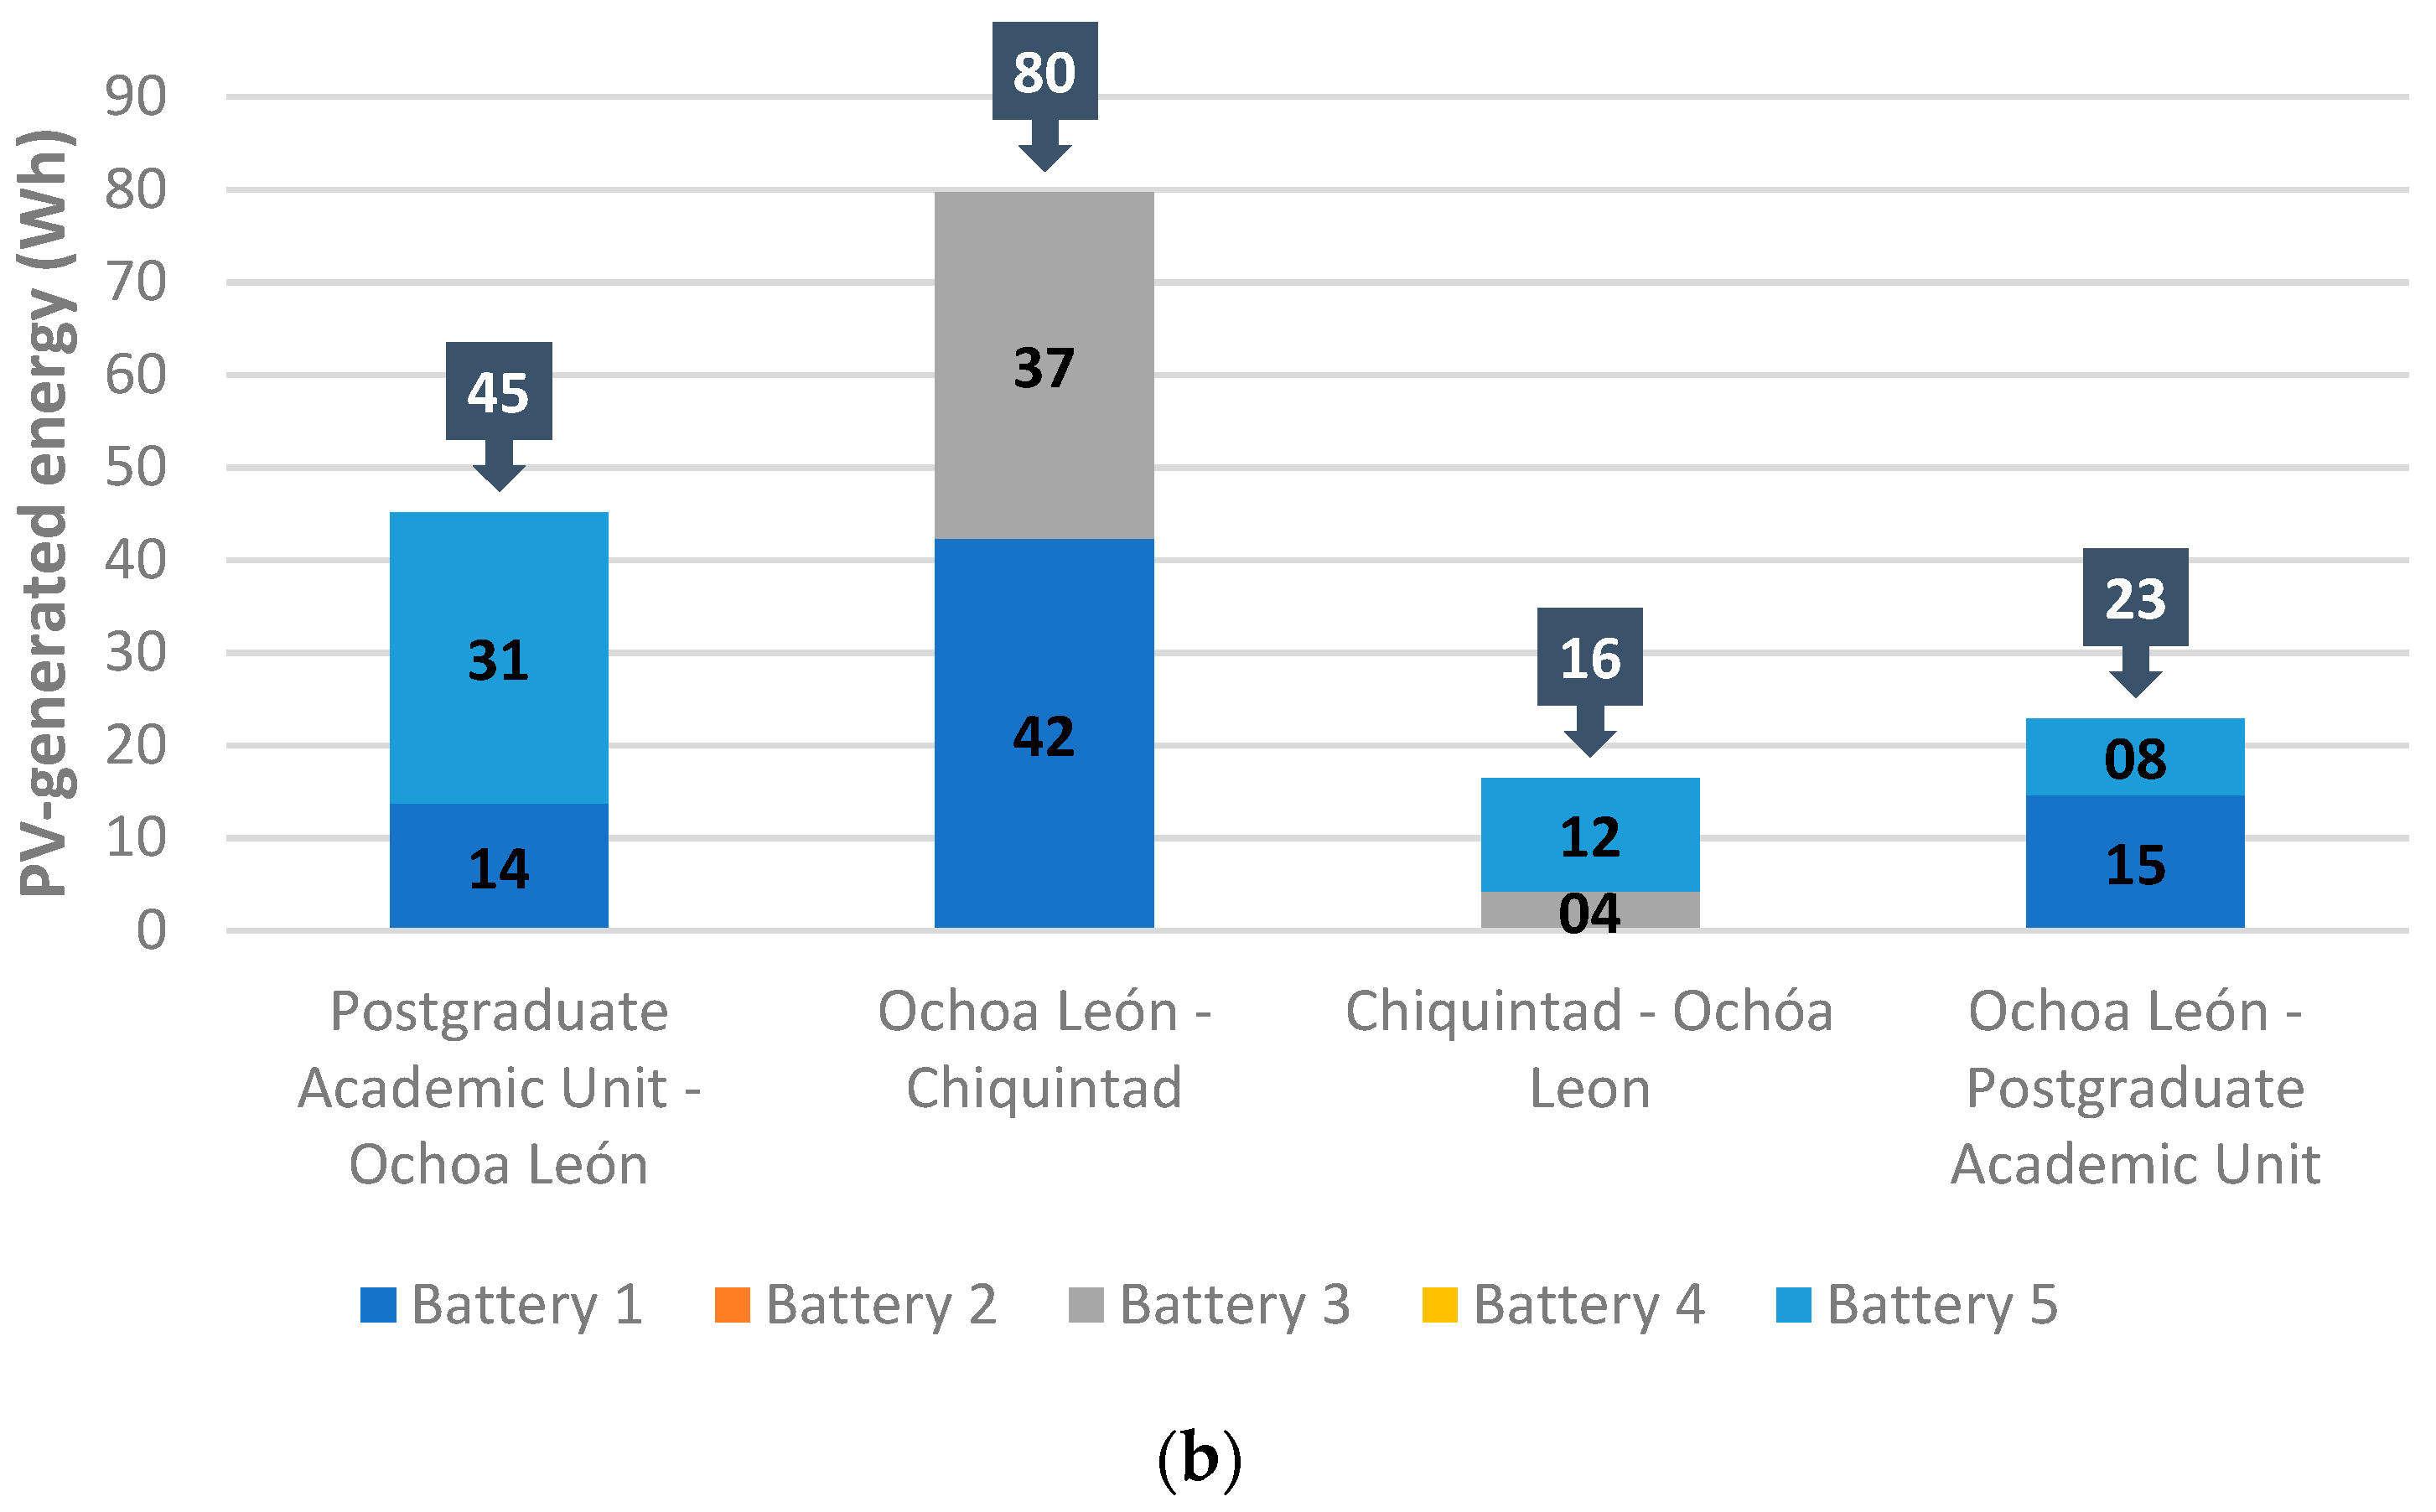
3.2.2. Analysis of the Energy Consumption of the EV in Motion with Additional Energy Input

Two tests (Test 2 and 3) were conducted on the moving EV while the PV system was active to validate the data obtained. Both tests measured the physical and electrical magnitudes of the EV (voltage, current, energy, and EV speed) to evaluate the energy discharge of the EV. The total active energy used during both tests reflected the energy consumed of the EV, which was 1037.7 Wh during Test 2 and 1043.4 Wh during Test 3, as shown in Figure 17a and Figure 17b, respectively.
Individual battery voltages were measured during tests where the PV system was active. At any given moment, these measurements enabled the identification of the battery being charged. In Test 2, Batteries 5, 1, 3, and 4 were charged by the PV system for 12 min each, except for battery 5, which was only charged for 3.5 min due to the completion of the route, resulting in 145.8 Wh generated by the PV system, as shown in Figure 18a. Similarly, in Test 3, Batteries 1, 3, 4, and 5 were charged by the PV system, generating 164 Wh, as illustrated in Figure 18b.
The data obtained during each segment were analyzed, where the slope of the road was considered to determine the energy consumption in each case. In Segment 1, with a slope of 2.1%, Test 2 showed an energy consumption of 380.7 Wh, while Test 3 showed a similar result (382.5 Wh). In Segment 2, with an ascending slope of 4.08%, the energy consumed was 544.1 Wh during Test 2 and 545.7 Wh during Test 3. In Test 2, Battery 5 was the main energy supplier during Segment 1, as it was the only one charged. Similarly, in Test 3, the results show that Battery 5 delivered the highest amount of energy. As for Segment 2 of Test 2, Battery 3 delivered the most energy (112.9 Wh) despite it not being charged. Similar results were observed in Test 3. On the other hand, Segments 3 and 4, which had descending slopes, showed lower energy consumption during Tests 2 and 3 due to the reduced traction needed by the EV. Detailed results are illustrated in Figure 19a for Test 2 and Figure 19b for Test 3.
A detailed analysis of the data generated by the PV system was conducted for each segment and for each battery of the EV. The energy delivered to each battery was studied based on the slope of the road. The data of the energy produced by the PV system during Test 2 is shown in Figure 20a. It was observed that the PV system charged Batteries 1 and 5 with 35 Wh during Segment 1, with 68.1 Wh during Segment 2, and then decreased to 14.9 Wh during Segment 3 due to its descending slope of 4.08%. During Segment 4, the charge increased due to the use of the EV’s traction. It should be noted that the photovoltaic controller adjusted the charge according to the battery voltage levels, thus explaining the variation in the higher charge levels of Segments 1 and 2 where there was greater energy consumption during the EV’s movement. The results of Test 3, presented in Figure 20b, show a similar trend with Battery 2 being the only uncharged battery. After analyzing the battery voltages and the behavior of the photovoltaic charge controller, it was concluded that Battery 2 consumed the most energy during Segments 1 and 2.
Lastly, Figure 21 exhibits the final results of the three tests performed: the first one without the PV system and the other two with the PV system. There is a notable disparity in the energy consumed by the EV between the test conducted without the charging system and the two tests conducted with the charging system. In Test 1, the EV consumed was around 1294.2 Wh. Using these data as a reference point, it was compared with the energy consumed in Tests 2 and 3, where the PV charging system was active. The data collected from the last two tests indicate a lower energy consumption, and this was attributable to the energy generated by the PV system. In fact, adding the energy consumed and the energy generated by the PV system resulted in a total amount close to the energy consumed by the EV in Test 1. It is important to note that the discrepancies between the tests may be due to various factors such as traffic and driving style, making it difficult to replicate the same conditions for all trips.

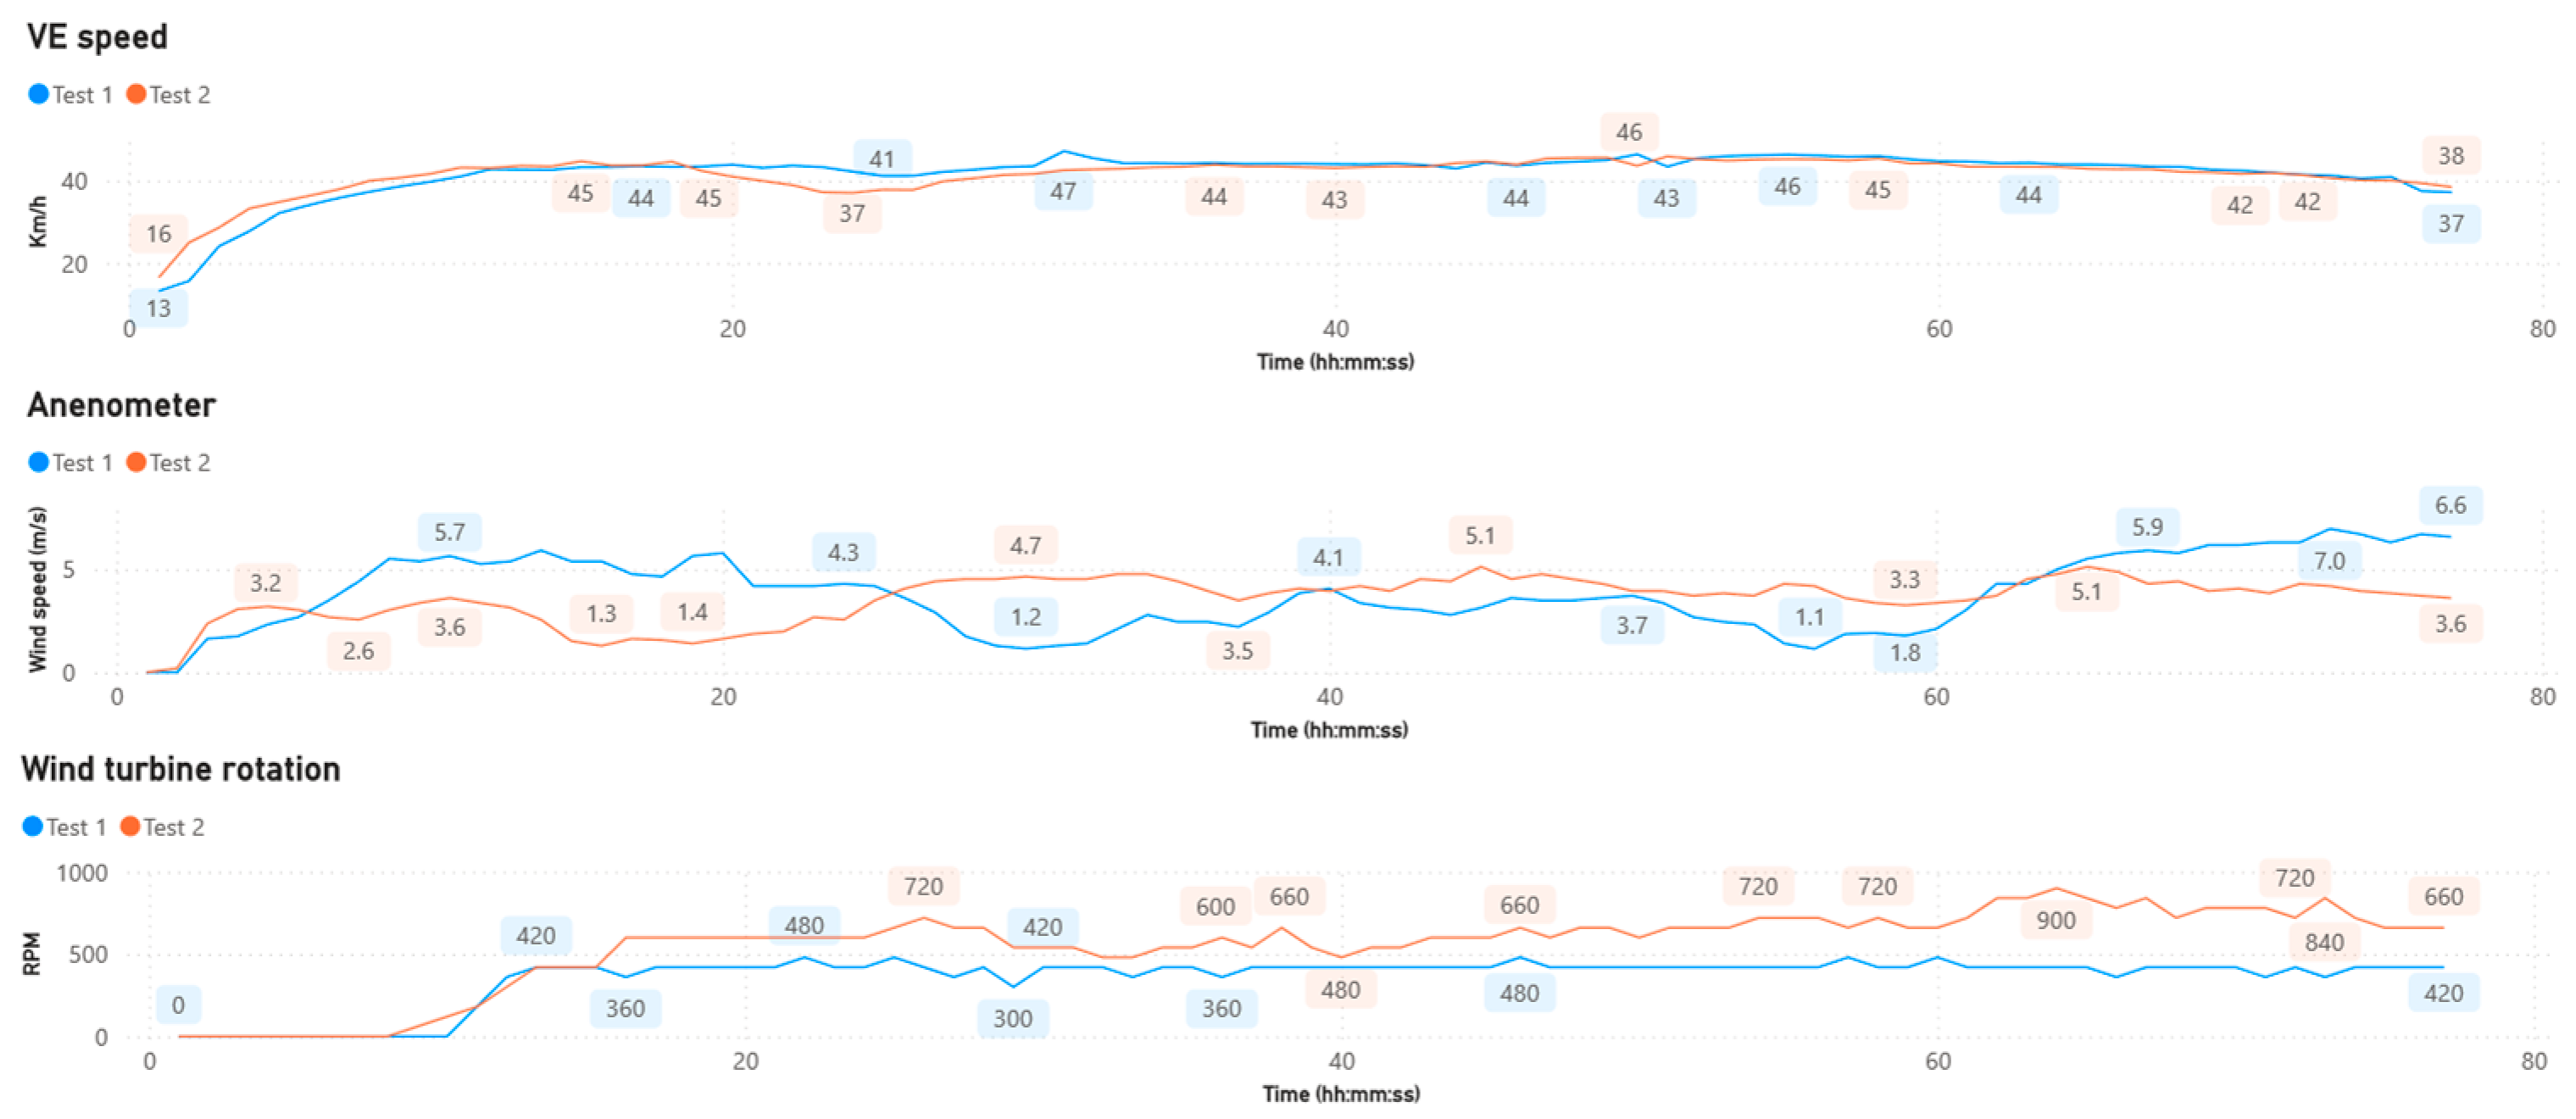
3.3. Wind Turbine Performance Data Analysis

Regarding the wind turbine system, the wind tunnel was tested using an anemometer installed at the front of the wind tunnel structure. Data obtained with and without side panels were compared to determine the most efficient configuration. Figure 22 shows that, with side panels (Test 2), the wind speed remained more constant, which generated greater stability in the wind turbine’s RPM and higher efficiency in energy generation. These results coincide with the wind flow analysis performed in Autodesk CFD, confirming that the optimal option was to use side panels. Additionally, it was determined that the speed the EV must reach for the wind turbine to start spinning was 30 km/h. However, this may vary depending on the wind direction at that moment.
Due to the need for the EV to reach a minimum speed of 30 km/h for the wind turbine to spin, wind system tests were conducted on a different road, De los Migrantes Ave. (located in Ricaurte), which is a traffic-free 1.3 km route with an ascending slope of 1.96%. The following results were obtained from the wind system, as shown in Figure 23, where three tests were performed. The first test was carried out with an average EV speed of 47.64 km/h and the wind turbine at 553 RPM, an average voltage of 14.19 V, and an energy output of 130 W/s. In the second test, the average speed was 43.7 km/h and 540 RPM, with a voltage of 14.11 V and an energy output of 129.36 W/s. During the third test, the average speed was 46 km/h and 549 RPM, the voltage was 14.33 V, and the energy output was 146.9 W/s. The maximum speed of the EV was 50 km/h.

3.4. Data Visualization on an IoT Platform

It is essential to have a real-time control of the system and to analyze its behavior. Therefore, the use of IoT (Internet of Things) platforms is indispensable for this purpose; as such, the Thinger.io platform was used as it offers excellent features in its free version. A dynamic dashboard was created with various types of widgets for data visualization. Figure 24a shows the graphical data for the individual battery voltages; the PV voltage and current; the solar charge controller voltage and current; and the GPS. Figure 24b shows the textual data for the individual voltage of each battery, the voltage and current with which the battery was being charged by the PV system, the identifier of the battery being charged by the PV system and wind system, the RPM of the wind turbine, and the vehicle speed. Additionally, this platform allows for data storage in a data bucket, which is necessary for analyzing the history of the charge equalization system. In Figure 24a, the charge equalization process can be graphically observed. It shows that one battery has a higher voltage than the others, specifically the red line, which corresponds to Battery 5. This high voltage is explained by it being charged by the PV system. Then, Figure 24b confirms that Battery 5 is indeed being charged at a voltage of 14.45 V and a charging current of 4.18 A at that moment.

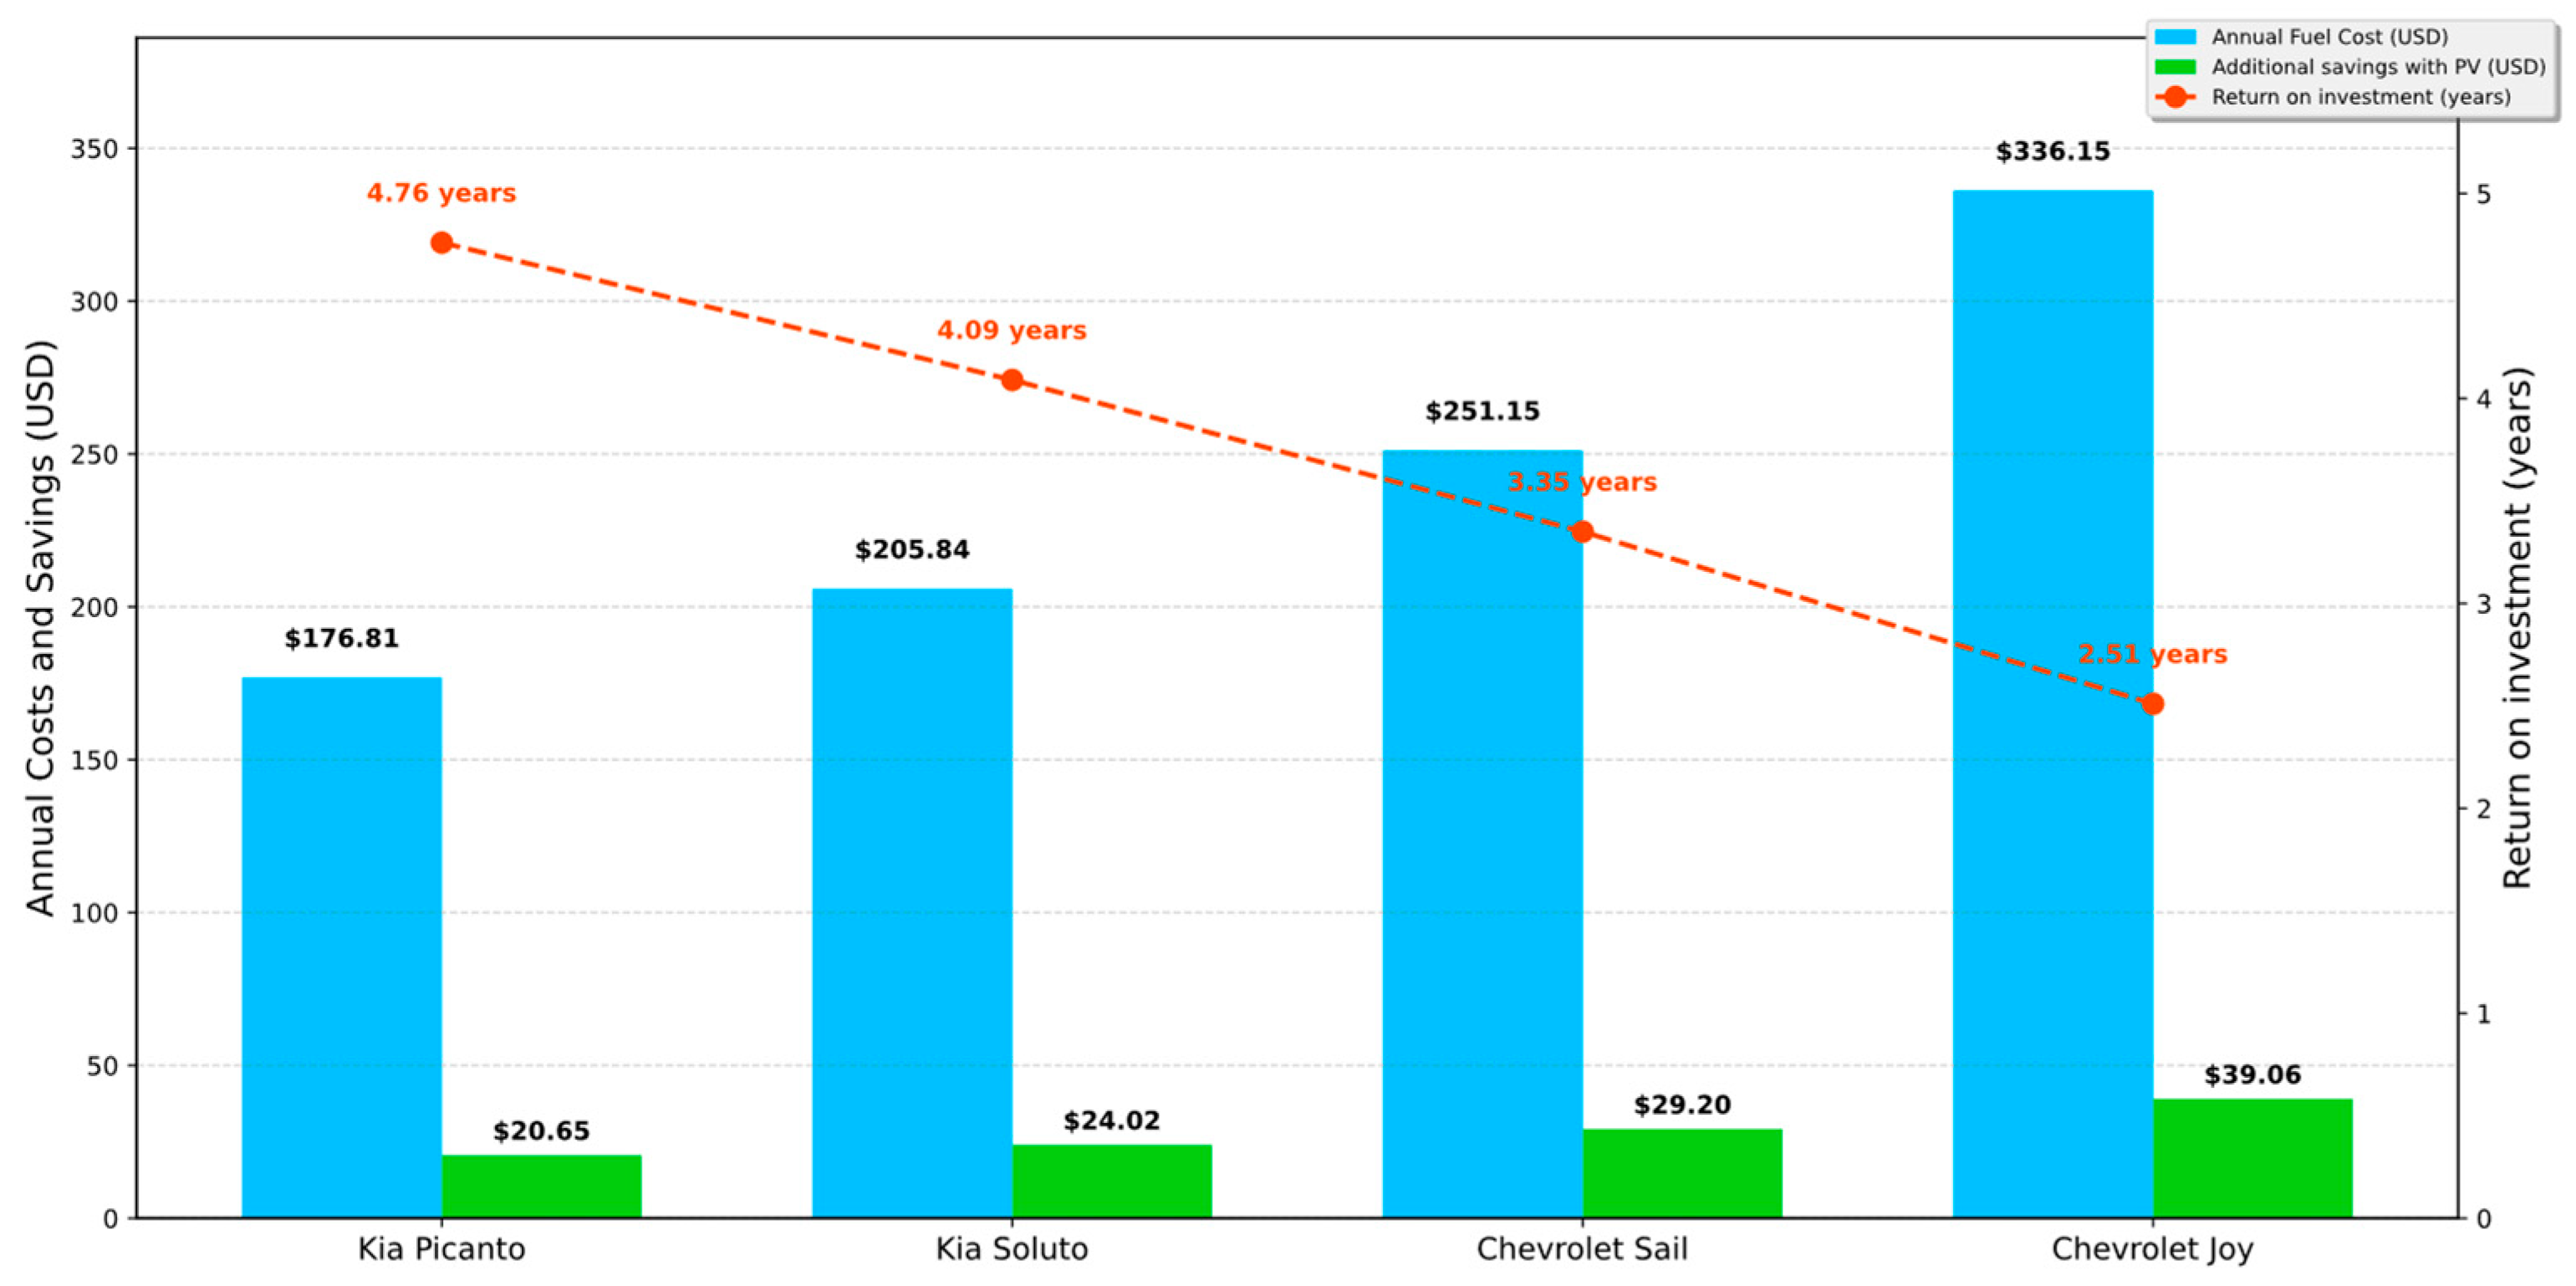
3.5. Cost Evaluation and Return on Investment

An economic analysis of the hybrid photovoltaic–wind system for EVs is detailed. Analysis showed the system viability improved the autonomy of EVs by 20% and how this reduced operating costs. An initial investment of USD 940.00 provides significant savings compared to internal combustion vehicles, improving performance and reducing dependence on the electrical grid. Table 4 details the estimated project cost and specifies the costs of the components.
The analysis compared the fuel costs of four popular vehicles in Ecuador with similar characteristics to the EVs studied: Kia Picanto, Kia Soluto, Chevrolet Sail, and Chevrolet Joy. In Ecuador, gasoline costs 4 USD per gallon (95 octane) and the fuel consumption indicated by each manufacturer, which is where the cost per kilometer is calculated. Considering a vehicle route of 10.38 km per day, equivalent to a daily EV autonomy of 800 Wh (with the generation system), annual fuel costs vary between USD 176.81 (Kia Picanto) and USD 336.15 (Chevrolet Joy). The payback period of USD 940.00 investment in the hybrid generation system was estimated between 2.51 and 4.76 years, depending on the vehicle compared, as shown in Figure 25. This analysis did not include maintenance costs such as oil and filter changes, which could extend the advantages of electric alternatives, as shown in Figure 25. This analysis did not include maintenance costs such as oil and filter changes, which could extend the advantages of electric alternatives.

4. Discussion

This research focused on the installation of a hybrid photovoltaic–wind charging system in a Chok S2 electric vehicle (EV). The PV system generated 535 W, achieving a 20% improvement in EV efficiency on a 17 km route. Given the stochastic nature of the wind system (400 W), which prevents predicting turbine RPM or replicating the same conditions on different trips, the general results were defined: The turbine started spinning at approximately 30 km/h (at an average speed of 45 km/h), reached 550 RPM, and generated an average of 135 W. However, due to the uncertainty of the wind system, it was difficult to determine an exact improvement percentage in the EV efficiency on a specific route.
However, after analyzing the implemented system, it was determined that the results could be improved. This is because the city of Cuenca, Ecuador, where tests were conducted, experiences its lowest solar radiation in July, which is an average of 3.77 peak sun hours (PSH) per day [33]. If the PV system provides 535 W, it would total 2017 Wh/day. However, upon reviewing the system’s energy generation during a day of charging, the parked EV was found to only use 830 Wh/day, which implies that the PV system only provided 41.15% of its total capacity. To reach 100% of the PV system’s generation capacity (2017 Wh/day), it might be necessary to increase the number of batteries charged in series or parallel by adding an additional backup battery. This change, however, would require reprogramming the control algorithm. In this context, the energy produced by the PV system of the parked EV (an average generation of 830 Wh/day) would provide, based on the PV generation capacity of 41.15%, an average range of 10.38 km. If the aforementioned changes were implemented, the PV system could achieve 100% of its generation capacity (2017 Wh/day), resulting in a range of approximately 26.17 km under similar route conditions, solely relying on one day of PV charge. Additionally, it must be considered that when a vehicle is in motion, there will always be multiple shadows generated by signs, buildings, and, in the case of an Andean route, vegetation. For this reason, a tertiary road was selected, where its width varied in several segments. The route can be seen in Figure 26, which analyzes the vegetation and buildings along the route. Categories have been defined to classify the density of buildings and the presence of vegetation. Three categories were established: high density—where buildings are predominant, continuous, and compact; moderate density—where buildings are more spaced-out but there are still a considerable amount; and low density—where buildings are scarce. Four categories were established for vegetation: high—significant vegetation coverage; moderate—still noticeable vegetation; low—sparse vegetation coverage; and none—no vegetation. This classification scheme allowed for the evaluation of how urban and natural conditions influence the efficiency and feasibility of installing PV systems in EVs.
On the other hand, through analyzing the aerodynamics of the EV, Figure 27 shows that the installation of the generation system in the EV increased the drag force (Fd) and, consequently, the drag coefficient (Cd), with a significant increase starting at 25 km/h. At moderate speeds (between 5 and 25 km/h), a difference in Cd was observed with and without the system installed. With the system, the Cd indicated that the additional structure was causing an increase in aerodynamic drag even at moderate speeds. This behavior suggests that the airflow around the system was not completely stable, which could be generating turbulence.
After 25 km/h, the Cd with the system installed was still higher but the difference to the VE without the system was reduced, as seen in Figure 27. This suggests that, at higher speeds, the airflow stabilizes, and the turbine starts to rotate effectively after 30 km/h. Before reaching this speed, the turbine reacts as a barrier, increasing the aerodynamic drag. However, as the turbine started to spin, it facilitated a greater airflow. This reduced the drag and explained the smaller difference in Cd at higher speeds.
The installed system was a first experience. Its installation allowed us to see that it is feasible to install a hybrid system in an EV, in which the wind system can generate energy at speeds above 30 km/h. However, the propeller design and aerodynamic structure design need improvement.
With respect to previous research conducted on the same EV, the work by Angamarca-Avendaño et al. [34] is a highlight, where a 350 W PV system, with a charge equalizer and a solar controller, was used to charge the batteries on a 22.5 km route with conditions that posed no significant difficulty, i.e., with a slope of less than 1%, and the EV achieved an efficiency improvement of up to 27%. Another research, conducted by Reinoso and Ortega [35], applied the same 350 W PV system and connected it directly to the batteries through a boost converter to charge all five batteries simultaneously, which is not recommended due to the various issues caused such as overcharging, irreversible damage to the batteries, lack of voltage balance between batteries, etc. In this case, a 16 to 33% improvement in EV efficiency was evidenced. However, tests with deep battery discharge were conducted, which is also not recommended for any battery, especially lead-acid batteries, as it shortens their lifespan.
Compared to similar research, Sugimoto [36] examined the feasibility of directly coupling flexible tandem solar cells with solid-state film batteries in PV vehicles, achieving an energy coupling efficiency of over 96% throughout the day (provided that the state of charge of the batteries was below 75%). The idea of capturing photovoltaic energy to supply an electric vehicle was found to be similar, with the difference being that flexible solar cells were used in their research. However, their analysis was based on simulations, with the data being obtained from the solar radiation database (METPV-20) of Japan. In contrast, the present study presents a real electric vehicle with the implementation of a PV and a charge equalizer, and it performed an actual journey on an Andean route. Sinuraya et al. [37] designed a charging system for EVs with four 100 Wp photovoltaic panels in series, and these were connected to a 40 A maximum power point tracking (MPPT) and 12 V 50 Ah valve-regulated lead-acid (VRLA) batteries in series, supplying energy to the engine for 1.2 h. Despite using four batteries in series in their EV design, they did not implement charge equalization. Even with four 100 W PV panels, simultaneous charging of more than one battery was able to optimize the energy storage. Mil’shtein et al. [38] created a lightweight solar vehicle with all-wheel drive that could reach 30 mph, carrying four passengers and up to 500 kg of load, using 6 kW LiFePO4 batteries for four 1.5 kW engines. The EV was equipped with four 150 W PV panels, which, according to the authors, could store 2.4 kWh of energy per day (based on an average of 4 PSH in Massachusetts), representing 40% of energy storage. The battery model was not detailed, but it was expected to have a battery management system (BMS) module for charge equalization and an MPPT charge controller suitable for these batteries. In any case, LiFePO4 batteries are a more efficient alternative compared to lead-acid batteries due to their higher energy density; however, they are more expensive, making them less suitable for low-cost EVs. Rahman et al. [39] developed an organic solar supercapacitor, producing 561 Wh/m2, with a 15% energy efficiency savings and a 7.5% reduction in battery weight, highlighting the importance of advanced energy storage systems for improving EV efficiency and range. This would be a viable alternative to be implemented in the EV of this research as it optimally stores the generated energy within the system itself, allowing it to be transferred to the EV’s storage system when needed.
Regarding charge equalization, Suyal and Saxena [40] proposed an innovative charge equalization technique for EV batteries in an “m × n” configuration, ensuring voltage and current balance during charging, discharging, and idling. It used a fourth-order bidirectional DC-DC converter to manage these conditions This innovation represents a crucial advancement in energy management for EVs, offering greater flexibility and efficiency, and it should be considered for future research performed on real EVs (similar to the current study).

5. Conclusions

The hybrid charging system was successfully implemented in the Chok S2 EV. By integrating both solar and wind energy, renewable energy sources were harnessed to power the EV, reducing the dependence on non-renewable energy sources and contributing to environmental sustainability. A 20% range of improvement was achieved on a 17 km Andean route, demonstrating the viability and effectiveness of this research.
Although the wind system provided an additional source of energy, its unpredictable nature presented many challenges. The variability in wind conditions made it difficult to precisely determine its contribution to the EV’s efficiency. Despite this, certain general parameters of its operation were established, such as the turbine’s start-up speed at 30 km/h. Future research should aim at improving micro-distributed wind generation as urban conditions may not always reach this speed. Nevertheless, this research provides general insights into performance.
Increasing the number of lower-power PV panels instead of using a single high-power panel to charge multiple batteries simultaneously would be beneficial. This approach distributes generation capacity among several panels, improving the reliability in variable conditions such as shading or weather changes and allowing for more precise adaptation to the EV’s energy needs (charging two or more batteries independently and simultaneously). In addition, this configuration provides greater operational security as the failure of one panel would not affect the operation of the others.
Additionally, it is shown that with an investment of USD 940.00, the EV can complete a route of 10.38 km autonomously with the generation system. Considering that EVs have an economic cost compared to other internal combustion vehicles (with similar performance), it is a viable alternative to sustainable mobility. For the same reason, future work on net zero mobility is proposed for routes within the historic center of the city of Cuenca. On the other hand, through the analysis of the aerodynamics of the EV, it was possible to demonstrate that its integration is viable when considering speeds higher than 30 km/h. The need to improve the design of the propeller was also shown, which is currently being conducted. A wind system integration with an Archimedes spiral propeller is being modeled whose efficiency is better at lower speeds. In addition, the wind tunnel has been improved and an air access control door has been designed.
Battery charge equalization is crucial as it maintains the balance of voltage and current generated by the PV and wind systems across each battery. This system ensures that all batteries receive an equitable charge, optimizing their performance and extending their lifespan. Regarding the actuators used for the equalization system, choosing mechanical relays over solid-state relays (SSRs) was beneficial as it addressed current isolation issues, thereby enhancing the safety and stability of the charging system. This adaptation demonstrated the equipment’s responsiveness to technical challenges and its ability to make effective decisions in project implementation.

Author Contributions

Conceptualization, D.-A.A.-A., C.F.-V. and J.-C.C.-T.; Data curation, D.-A.A.-A.; Formal analysis, D.-A.A.-A., C.F.-V. and J.-C.C.-T.; Funding acquisition, J.-C.C.-T.; Investigation, D.-A.A.-A., C.F.-V. and J.-C.C.-T.; Methodology, D.-A.A.-A., C.F.-V. and J.-C.C.-T.; Project administration, C.F.-V. and J.-C.C.-T.; Software, D.-A.A.-A.; Supervision, C.F.-V. and J.-C.C.-T.; Validation, D.-A.A.-A. and Carlos Flores-Vázquez; Visualization, D.-A.A.-A. and J.-C.C.-T.; Writing – original draft, D.-A.A.-A.; Writing – review & editing, J.-C.C.-T. All authors have read and agreed to the published version of the manuscript.

Funding

This research received no external funding.

Data Availability Statement

The raw data supporting the conclusions of this article will be made available by the authors on request.

Acknowledgments

This research was undertaken as part of the work of the research group “Sistemas Embebidos y Visión Artificial en Ciencias Arquitectónicas, Agropuecuarias, Ambientales y Automática (SEVA4CA)” and Laboratory "Robótica, Automatización, Sistemas Inteligentes y Embebidos (RobLab)" under a project entitled “Mapeo de la Calidad del aire a nivel paranasal mediante IoT (Fase II)”.

Conflicts of Interest

The authors declare no conflicts of interest.

References

  1. UNFCCC. Paris Agreement; United Nations Bonn: Bonn, Germany, 2015. [Google Scholar]
  2. IEA. World Energy Balances. Available online: https://www.iea.org/data-and-statistics/data-product/world-energy-balances (accessed on 5 November 2023).
  3. Sheng, M.S.; Sreenivasan, A.V.; Sharp, B.; Du, B. Well-to-Wheel Analysis of Greenhouse Gas Emissions and Energy Consumption for Electric Vehicles: A Comparative Study in Oceania. Energy Policy 2021, 158, 112552. [Google Scholar] [CrossRef]
  4. ARCERNN. Estadística Anual y Multianual Del Sector Electrico Ecuatoriano 2023; 2023. Available online: https://www.controlrecursosyenergia.gob.ec/wp-content/uploads/downloads/2024/04/EstadisticaAnual2023-WEB-2.pdf (accessed on 10 May 2023).
  5. Maks Davis, M. Beyond Petroleum: A Look at the Impact of Electric Cars in the Three Main Cities of Ecuador. Estoa 2017, 6, 151–158. [Google Scholar] [CrossRef]
  6. IEA. Global EV Outlook 2022; IEA: Paris, France, 2022. [Google Scholar]
  7. Yang, W.; Liu, W.; Chung, C.Y.; Wen, F. Joint Planning of EV Fast Charging Stations and Power Distribution Systems with Balanced Traffic Flow Assignment. IEEE Trans. Industr. Inform. 2020, 17, 1795–1809. [Google Scholar] [CrossRef]
  8. McKinney, T.R.; Ballantyne, E.E.F.; Stone, D.A. Rural EV Charging: The Effects of Charging Behaviour and Electricity Tariffs. Energy Rep. 2023, 9, 2321–2334. [Google Scholar] [CrossRef]
  9. Reddy, V.J.; Hariram, N.P.; Maity, R.; Ghazali, M.F.; Kumarasamy, S. Sustainable Vehicles for Decarbonizing the Transport Sector: A Comparison of Biofuel, Electric, Fuel Cell and Solar-Powered Vehicles. World Electr. Veh. J. 2024, 15, 93. [Google Scholar] [CrossRef]
  10. Pasetti, M.; Longo, M.; Rinaldi, S.; Ferrari, P.; Sisinni, E.; Flammini, A. On the Sustainable Charging of Electric Vehicles in the Presence of Distributed Photovoltaic Generation. In Proceedings of the 2022 IEEE Sustainable Power and Energy Conference (iSPEC), Perth, Australia, 4–7 December 2022; IEEE: Piscataway, NJ, USA, 2022; pp. 1–5. [Google Scholar]
  11. Singh, A.; Nikhil, P.G.; Prakash Singh, J. Techno-Commercial Analysis of a Solar Powered Electric Vehicle Charging Station for Chennai, India. In Proceedings of the 2021 Fourth International Conference on Electrical, Computer and Communication Technologies (ICECCT), Erode, India, 15–17 September 2021; IEEE: Piscataway, NJ, USA, 2021; pp. 1–5. [Google Scholar]
  12. Sankar Rao, B.U.; Sumanth Prapulla, S.; Srinivasa Varma, P.; Ahammad, S.H. Development Of Fast Charging Technology For Electric Vehicles. In Proceedings of the 2022 IEEE 2nd Mysore Sub Section International Conference (MysuruCon), Mysuru, India, 16–17 October 2022; IEEE: Piscataway, NJ, USA, 2022; pp. 1–6. [Google Scholar]
  13. Diaz-Londono, C.; Motta, M.; Pareschi, D.; Gruosso, G. Utilization Analysis of Rapid and Ultra-Rapid Electric Vehicle Chargers in Europe. In Proceedings of the 2023 IEEE Vehicle Power and Propulsion Conference (VPPC), Milan, Italy, 23–27 October 2023; IEEE: Piscataway, NJ, USA, 2023; pp. 1–6. [Google Scholar]
  14. Cai, X.; Chen, L.; Wang, M. Current Status and Development Trend of Battery Changing Technology for Electric Passenger Vehicles. In Proceedings of the 2022 2nd International Conference on Electrical Engineering and Control Science (IC2ECS), Nanjing, China, 16–18 December 2022; IEEE: Piscataway, NJ, USA, 2022; pp. 215–221. [Google Scholar]
  15. Xiao, J.; Quan, X.; Chen, S.; Gong, W.; Wu, X.; Mo, Y. Overview of Wireless Charging Positioning Guidance Technology for Electric Vehicles. In Proceedings of the 2023 International Conference on Electronics and Devices, Computational Science (ICEDCS), Marseille, France, 22–24 September 2023; IEEE: Piscataway, NJ, USA, 2023; pp. 82–87. [Google Scholar]
  16. Ganne, A.; Sahu, L.K. Performance of Single-Stage and Dual-Stage EV Battery Chargers for G2V and V2G Operation. In Proceedings of the 2024 Third International Conference on Power, Control and Computing Technologies (ICPC2T), Raipur, India, 18–29 January 2024; IEEE: Piscataway, NJ, USA, 2024; pp. 486–491. [Google Scholar]
  17. Lee, K.Y.; Park, S. Reducing Charging Burden of Light Electric Vehicles by Integrated Photovoltaic Modules. In Proceedings of the 2022 IEEE Vehicle Power and Propulsion Conference (VPPC), Merced, CA, USA, 1–4 November 2022; IEEE: Piscataway, NJ, USA, 2022; pp. 1–6. [Google Scholar]
  18. Shpak, O.; Samotyy, V.; Dzelendzyak, U. Development of a Portable Charger for Electric Vehicles. In Proceedings of the 2023 IEEE 12th International Conference on Intelligent Data Acquisition and Advanced Computing Systems: Technology and Applications (IDAACS), Dortmund, Germany, 7–9 September 2023; IEEE: Piscataway, NJ, USA, 2023; pp. 568–572. [Google Scholar]
  19. Schuss, C.; Fabritius, T.; Eichberger, B.; Rahkonen, T. Energy-Efficient Routing of Electric Vehicles with Integrated Photovoltaic Installations. In Proceedings of the 2020 IEEE International Instrumentation and Measurement Technology Conference (I2MTC), Dubrovnik, Croatia, 25–28 May 2020; IEEE: Piscataway, NJ, USA, 2020; pp. 1–6. [Google Scholar]
  20. Lee, K.Y.; Kremer, P.; Prinz, A.; Park, S.; Göhlich, D.; Park, S. Assessing Effectiveness of Integrated Photovoltaic Panels on Light Electric Vehicles. IEEE Trans. Veh. Technol. 2024, 73, 4589–4598. [Google Scholar] [CrossRef]
  21. Kutter, C.; Alanis, L.E.; Neuhaus, D.H.; Heinrich, M. Yield Potential of Vehicle Integrated Photovoltaics on Commercial Trucks and Vans. In Proceedings of the 38th European PV Solar Energy Conference and Exhibition, Online, 6–10 September 2021. [Google Scholar]
  22. Diahovchenko, I.; Petrichenko, L.; Borzenkov, I.; Kolcun, M. Application of Photovoltaic Panels in Electric Vehicles to Enhance the Range. Heliyon 2022, 8, e12425. [Google Scholar] [CrossRef] [PubMed]
  23. Centeno Brito, M.; Santos, T.; Moura, F.; Pera, D.; Rocha, J. Urban Solar Potential for Vehicle Integrated Photovoltaics. Transp. Res. D Transp. Environ. 2021, 94, 102810. [Google Scholar] [CrossRef]
  24. Srinivas, T.A.; Mohamed, M.J.S.; Saravanan, A.; Sukania, P.; Pathani, A.; Sekar, K. Smart Highway Technique Using Wind Turbine with Vertical Axis (VAWT). In Proceedings of the 2022 International Conference on Power, Energy, Control and Transmission Systems (ICPECTS), Chennai, India, 8–9 December 2022; IEEE: Piscataway, NJ, USA, 2022; pp. 1–5. [Google Scholar]
  25. Al-Aqel, A.A.; Lim, B.K.; Mohd Noor, E.E.; Yap, T.C.; Alkaff, S.A. Potentiality of Small Wind Turbines along Highway in Malaysia. In Proceedings of the 2016 International Conference on Robotics, Automation and Sciences (ICORAS), Melaka, Malaysia, 5–6 November 2016; IEEE: Piscataway, NJ, USA, 2016; pp. 1–6. [Google Scholar]
  26. Yang, Q.; Yan, F.; Zhang, S.; Li, S.; Yin, C.; Wang, Y. Vertical Axis Wind Power Generation System Based on Wind Energy Characteristics of Highway Vehicle Bypass Flow. In Proceedings of the 2022 International Conference on Knowledge Engineering and Communication Systems (ICKES), Chickballapur, India, 8–9 December 2022; IEEE: Piscataway, NJ, USA, 2022; pp. 1–5. [Google Scholar]
  27. Kunkel, L.C.; Hall, D.M. Improving Site Assessment Tools in Emerging Technologies: The Case of Highway Vertical-Axis Wind Turbines in the United States. Energy Res. Soc. Sci. 2020, 64, 101456. [Google Scholar] [CrossRef]
  28. Morgin, F.N.; Fotso, B.M.; Talawo, R.C.; Fogue, M. AERODYNAMIC ANALYSIS OF AN ELECTRIC VEHICLE EQUIPPED WITH HORIZONTAL AXIS SAVONIUS WIND TURBINES. Int. J. Recent. Trends Eng. Res. 2019, 5, 17–26. [Google Scholar] [CrossRef]
  29. Andias, R.; Mohd, S.; Zulkafli, F.; Didane, D.H. Simulation Study of Wind Turbine System for Electric Powered Vehicle. Int. J. Integr. Eng. 2020, 12, 76–81. [Google Scholar] [CrossRef]
  30. Sahani, R.; Daga, M.; Jamatia, I.; Kumar, P.; Tripathi, S.L. Design of a Self-Charging Electric Vehicle with Embedded Multiple Natural Energy Sources. In Proceedings of the 2023 IEEE Devices for Integrated Circuit (DevIC), Kalyani, India, 7–8 April 2023; IEEE: Piscataway, NJ, USA, 2023; pp. 296–301. [Google Scholar]
  31. Gopinath, C.; Karthikeyan, P.; Srihari, R.; Yuvaraj, M. Integrated Renewable Energy Charging System for Electric Vehicles. In Proceedings of the 2023 9th International Conference on Electrical Energy Systems (ICEES), Chennai, India, 23–25 March 2023; IEEE: Piscataway, NJ, USA, 2023; pp. 58–63. [Google Scholar]
  32. Khan, D.; Khan, S.; Amir Ayaz, M.; Khan, A. Analysis of Hybrid Electric Vehicle Operated by Wind and Solar Energy. Int. J. Adv. Nat. Sci. Eng. Res. 2023, 11, 20–26. [Google Scholar]
  33. Sotamba-Chimbo, E.A.; Cobos-Torres, J.C.; Andrade-Mena, G.I. Proyecto académico de electromovilidad neta cero para docentes de la Universidad Católica de Cuenca, a través de ABP. Conrado 2023, 19, 109–124. [Google Scholar]
  34. Angamarca-Avendaño, D.-A.; Saquicela-Moncayo, J.-F.; Capa-Carrillo, B.-H.; Cobos-Torres, J.-C. Charge Equalization System for an Electric Vehicle with a Solar Panel. Energies 2023, 16, 3360. [Google Scholar] [CrossRef]
  35. Reinoso, L.; Ortega, J. Incremento de La Autonomía de Un Vehículo Eléctrico Dayang CHOK-S a Través de La Utilización de Paneles Solares. Novasinergia Rev. Digit. Cienc. Ing. Tecnol. 2020, 3, 40–46. [Google Scholar] [CrossRef]
  36. Sugimoto, H. Feasibility Study of Rechargeable Flexible Tandem Solar Cells for VIPV Applications Under Realistic Environments. In Proceedings of the 2023 Middle East and North Africa Solar Conference (MENA-SC), Dubai, United Arab Emirates, 15–18 November 2023; IEEE: Piscataway, NJ, USA, 2023; pp. 1–4. [Google Scholar]
  37. Sinuraya, A.; Sinaga, D.H.; Simamora, Y.; Wahyudi, R. Solar Photovoltaic Application for Electric Vehicle Battery Charging. J. Phys. Conf. Ser. 2022, 2193, 012075. [Google Scholar] [CrossRef]
  38. Mil’shtein, S.; Zinaddinov, M.; Asthana, D.N.; Scheminger, J. Design and Testing of Solar/Electric Cart. J. Phys. Conf. Ser. 2021, 1921, 012021. [Google Scholar] [CrossRef]
  39. Rahman, A.; Myo Aung, K.; Ihsan, S.; Raja Ahsan Shah, R.M.; Al Qubeissi, M.; Aljarrah, M.T. Solar Energy Dependent Supercapacitor System with ANFIS Controller for Auxiliary Load of Electric Vehicles. Energies 2023, 16, 2690. [Google Scholar] [CrossRef]
  40. Suyal, S.; Saxena, A.R. Active Charge Equalization of an ‘M × n’ Battery Stack in Electric Vehicles during Charging, Discharging, or Isolated Condition. In Proceedings of the 2022 IEEE 10th Power India International Conference (PIICON), Delhi, India, 25–27 November 2022; IEEE: Piscataway, NJ, USA, 2022; pp. 1–6. [Google Scholar]
Figure 1. Energy management for an EV with a solar–wind hybrid system.
Energies 17 04665 g001
Figure 2. A 3D model of the integrated photovoltaic–wind hybrid energy system: (a) the general exterior view, structure, and photovoltaic–wind energy system; and (b) a helical Savonius wind turbine divided into two sections for 3D printing.
Energies 17 04665 g002
Figure 3. Integrated charge equalization system. Blocks of 10 contact relays on the right and left; a charge controller in the center; and a control and power section in the upper right.
Energies 17 04665 g003
Figure 4. Wind flow analysis of the EV: (a) top view and the overall wind flow path in the EV; (b) right side view and areas of interest such as high-pressure zones or regions with high wind flow; and (c) front view and the wind flow speed between 5–7 m/s.
Energies 17 04665 g004
Figure 5. Hardware architecture: the integration of microcontrollers and the power section into the PCB.
Energies 17 04665 g005
Figure 6. Schematic of the hybrid photovoltaic–wind charge equalization system. The system contains a set of 20 relays: 10 for the wind system (left) and 10 for the PV system (right). They were configured to individually supply energy to each battery from either generation system.
Energies 17 04665 g006
Figure 7. The prioritization and conditions of the charge equalization system.
Energies 17 04665 g007
Figure 8. Control algorithm for the charge equalization system based on a decision tree. Decision tree for the PV system (left), and decision tree for the wind system (right).
Energies 17 04665 g008
Figure 9. Final result of the implementation of the charge equalization system: (a) exterior view of the photovoltaic–wind system; and (b) interior view of the integrated charge equalization system.
Energies 17 04665 g009
Figure 10. Data analysis during the EV’s parking period: Section 1—irradiance throughout the day; Section 2—individual battery voltage; Section 3—charging voltage and current as provided by the PV charge controller; and Section 4—instantaneous and accumulated power generated by the PV system.
Energies 17 04665 g010
Figure 11. Analysis of the data distribution of the five batteries (each represented by a letter) using a violin plot.
Energies 17 04665 g011
Figure 12. Analysis of the energy supplied by the PV system to each battery during the day (08:00–17:00).
Energies 17 04665 g012
Figure 13. Analysis of the energy supplied by the PV system to the parked EV.
Energies 17 04665 g013
Figure 14. Profiles along the Andean route. (a) Elevation; (b) Slope.
Energies 17 04665 g014
Figure 15. Data analysis of the trip without activating the charging system (Test 1). Section 1: the voltage and current of the VE; Section 2: the instantaneous and cumulative discharge power of the VE; and Section 3: the speed of the VE and altitude.
Energies 17 04665 g015
Figure 16. The active discharge power of each battery by segment.
Energies 17 04665 g016
Figure 17. The physical and electrical EV quantities. Section 1: the current and voltage of the EV; Section 2: the instantaneous and cumulative discharge power of the EV; and Section 3: the EV speed and road altitude profile. (a) Test 2. (b) Test 3.
Energies 17 04665 g017
Figure 18. Charging system data. Section 1: the individual battery voltages; Section 2: the voltage and current of the PV system; Section 3: the instantaneous and cumulative active power generated by the PV system; and Section 4: the daytime irradiance. (a) Trip 1. (b) Trip 2.
Energies 17 04665 g018
Figure 19. The active discharge energy per battery per segment: (a) Test 2. (b) Test 3.
Energies 17 04665 g019aEnergies 17 04665 g019b
Figure 20. Active energy supplied by the PV system per segment: (a) Test 2; and (b) Test 3.
Energies 17 04665 g020aEnergies 17 04665 g020b
Figure 21. Final test results.
Energies 17 04665 g021
Figure 22. Wind system data analysis.
Energies 17 04665 g022
Figure 23. Data analysis of the active wind system (Section 1: voltage and current; Section 2: instantaneous energy generated by the wind system; and Section 3: EV speed and wind turbine revolutions per minute): Test 1; Test 2; and Test 3.
Energies 17 04665 g023
Figure 24. Dashboard designed on an IoT platform: (a) the graphical presentation; and (b) quantitative presentation.
Energies 17 04665 g024
Figure 25. Analysis of the operating costs, return on investment, and generation savings during the route.
Energies 17 04665 g025
Figure 26. Analysis of the vegetation and urban coverage on the selected route: (a) urban cover; and (b) vegetation cover.
Energies 17 04665 g026
Figure 27. Aerodynamic impact analysis of the installation of a hybrid generation system in an EV.
Energies 17 04665 g027
Table 1. Equipment description.
ComponentDescription
Electric vehicleDayang Chok S2.
Dimensions: 2.54 × 1.39 × 1.59 mts.
Battery: Five 6-EVF-150 12 V/150 Ah.
Photovoltaic panelYingli Solar.
YLM 144 CELL-535 W/41.7 V/12.95 A
Solar charge controllerEpever MPPT 60 A/48 V–36 V–24 V–12 V Auto/4500 W.
Three-phase alternator Hyuduo/AVAN 400 W.
Wind charge controllerPikasola 12 V–24 V/400 W.
Table 2. Basic conditions for developing the charging algorithm.
Solar Energy SystemWind Energy System
Battery 1Battery 3
Battery 4
Battery 5
Battery 2Battery 4
Battery 5
Battery 3Battery 1
Battery 5
Battery 4Battery 1
Battery 2
Battery 5Battery 1
Battery 2
Battery 3
Table 3. Data analysis of each battery, including the maximum, minimum, median, and the 25 and 75 percentile voltage values.
Battery No.Minimum Value
(V)
Percentile 25
(V)
Median
(V)
Percentile 75
(V)
Maximum Value
(V)
Battery 112.18 12.7512.8612.9414.2
Battery 212.5412.9413.0713.1714.65
Battery 312.6212.9212.9713.0514.48
Battery 412.5812.9813.0913.214.45
Battery 512.4212.8912.9613.0314.3
Table 4. Estimated project cost breakdown.
ItemCost (USD)
VE aluminum structure40.00
Wind system (Savonius turbine, three-phase alternator, wind load controller)200.00
Photovoltaic system (photovoltaic panel, solar charge controller)400.00
Microcontrollers and sensors100.00
Control and power PCB50.00
Other (relays, connectors, wiring, etc.)150.00
Total (USD)940.00
Disclaimer/Publisher’s Note: The statements, opinions and data contained in all publications are solely those of the individual author(s) and contributor(s) and not of MDPI and/or the editor(s). MDPI and/or the editor(s) disclaim responsibility for any injury to people or property resulting from any ideas, methods, instructions or products referred to in the content.

