Article

The Slow Pace of Green Transformation: Underlying Factors and Implications

1
Center for Interdisciplinary Research and Education on Technological and Economic Problems of Energy Transition, Peter the Great St. Petersburg Polytechnic University, Ulitsa Politechnicheskaya 29, St. Petersburg 195251, Russia
2
Engineering Department, Atlantica Universitary Institute, 2730-036 Barcarena, Portugal
3
Keleti Károly Faculty of Business and Management, Obuda University, 1084 Budapest, Hungary
*
Author to whom correspondence should be addressed.
Energies 2024, 17(19), 4789; https://doi.org/10.3390/en17194789
Submission received: 8 August 2024 / Revised: 7 September 2024 / Accepted: 19 September 2024 / Published: 25 September 2024
(This article belongs to the Section C: Energy Economics and Policy)

Abstract

:
Concerns about climate change are a hot topic in the current debate about a sustainable future, and despite more than 30 years of international conferences, including the Intergovernmental Panel on Climate Change (IPCC) and the United Nations Climate Change Conference (COP), the annual usage amount of fossil fuel-based energy sources has remained largely unchanged, and the green transition to a carbon-free energy system is progressing at a much slower pace than anticipated. This paper presents an original approach that consists in addressing the green transition’s dilemmas by analyzing the complex interplay of strongly interwoven forces hindering the rapid adoption of so-called green energy sources scrutinized from a three-fold perspective: socio-psychological; political–strategic and territorial; and technological. Moreover, these forces are ranked according to the magnitude of their impact on the anticipated transition to green, and it is estimated by logistic fit extrapolation that the total share of the contribution of low-carbon sources might reach a maximum of about 25% among all energy sources in 2050. A final original picture is presented, summarizing how all the involved forces are acting upon the expected transition as well as their consequences.

1. Introduction

The present research identified a gap in the current available analysis of the pace of energy transition, namely, the application of a holistic view to the whole worldwide energy transition scenario. A few studies can be found trying to offer a broad view about the complexity of the factors involved in the ‘energy transition’, such as, for instance, the excellent pieces of Seto et al. [1] and Stoddart et al. [2], as well as the assessment report by the IPCC [3] and the Global Change Analysis Model (GCAM) [4], which highlight the dangers of climate change, and all their recommendations are based on this. Seto et al. [1], based on a systematic analysis of 137 literary sources, developed the key concept of “carbon lock-in” that is seen as a negative trend that has unfolded as a result of the interaction of three main components: technology and infrastructure, institutional isolation, and established behavioral norms and habits. The combined effect of these three elements, according to the authors of the study, does not allow us to overcome the widespread usage of technologies and goods and services with a significant carbon footprint. The paper by Stoddart et al. [2] resulted from the effort of a team of 23 scientists from 20 different institutions, in which the authors offer a vision about the rise in carbon emissions during the last three decades analyzed under nine very different thematic lenses, covering issues like climate governance, fossil fuel industry, geopolitics, economics, energy systems, inequity, lifestyle, and social imaginaries, and conclude that the main reason for why the failure in ‘not bending the emissions curve’ (title of their work) lies in the entrenched geopolitical, industrial, military power, and the associated mindsets that work as fundamental barriers to the effective mitigation of CO2 emissions. According to the authors, these central tenets have evolved to form a wider global reductionist worldview whereby development and progress are reduced to economic growth and defined by increasingly narrow financial metrics and indexes.
In this work, an alternative approach is presented, interpreting the slow pace of the adoption of renewable energy sources as a result of the action of a complex set of interconnected forces that act as an ‘energy barrier’ to overcome. Such an interconnection of forces does not arise from the application of assessment models such as the mentioned GCAM [4].
Some authors have already pointed out that the rhythm of the adoption of alternative energy sources has been exceptionally slow. Mistry [5], for instance, in an interesting piece titled “The (annoyingly) slow pace of energy transition”, observed that the pace of the transition to new carbon-free technologies across the globe has been excessively slow as a consequence of political-related problems delaying the establishment of effective measures to promote the circular economy and the development of more efficient technologies to mitigate carbon emissions. In the same vein, Stefes and Hager [6] and Schreurs [7] attribute the slow pace of change to political problems that protect the status quo and seem to encourage or favor incremental rather than more radical sustainability measures.
Hess [8], in a publication from 2014, pointed out that “even in the countries with a strong political consensus in favor of a transition, the pace has been slow in comparison with the need to reduce greenhouse gases” and stated that the main cause for the slowness of the transition is political resistance from the incumbent industrial regime. Writing almost a decade later, Hess [9] hit the same note and stated that factors that cause the slow pace of energy transition policy throughout the world include economic advantages from the extraction and sale of fossil fuel resources, geopolitical rivalry, and political polarization.
Overall, most of the previous published work discussing the slowness of the energy transition mainly attributes its cause to political-related problems and the clear resistance of the established global industrial structure. Some authors [10] even attribute this phenomenon to the structure of capitalism itself, its inherent form, and the pace of capital accumulation that dictates its current directional pattern. As Alami et al. state, [10] ‘Capitalism’s directional pattern of historical development poses unique challenges for green state projects.’ (p. 1). These unique challenges are caused by the interlinked crises (environmental degradation, economic stagnation, and the multiplication of surplus populations) of ‘late’ capitalist society, as they argue.
The aggregate view presented in this article integrates the forces acting upon the pace of the adoption of alternative energies under a three-fold perspective: a (1) socio-psychological, (2) political–strategic–territorial, and (3) technical perspective. A partial analysis of the technical perspective was presented and discussed in a previous publication by Devezas et al. [11], to which some new data and tables were added, as well as consideration about the action of another force, technological optimism, which, differently from the former, can favor the speed of the green transition.
This paper adds the following novelty to the research field: an original approach that includes and integrates an inquiry into a wide range of causes, not just political, technological, or economic, which act in an intensely interconnected way in the pace of energy transition. By examining these complex and interrelated factors, this research seeks to shed light on the green transition’s dilemmas. A ranking is proposed and interpreted according to the possible intensity with which the respective forces have contributed to the low rate of change.
The structure of this paper justifies the presentation of the three perspectives by discussing firstly the slow pace of the energy transition in Section 2, followed by a description of the research methodology in Section 3. Section 4 details the social–psychological, political–strategic, and technological perspectives. Section 5 discusses the complex power field and its effects and presents some policy implications, which are summarized in Section 6.

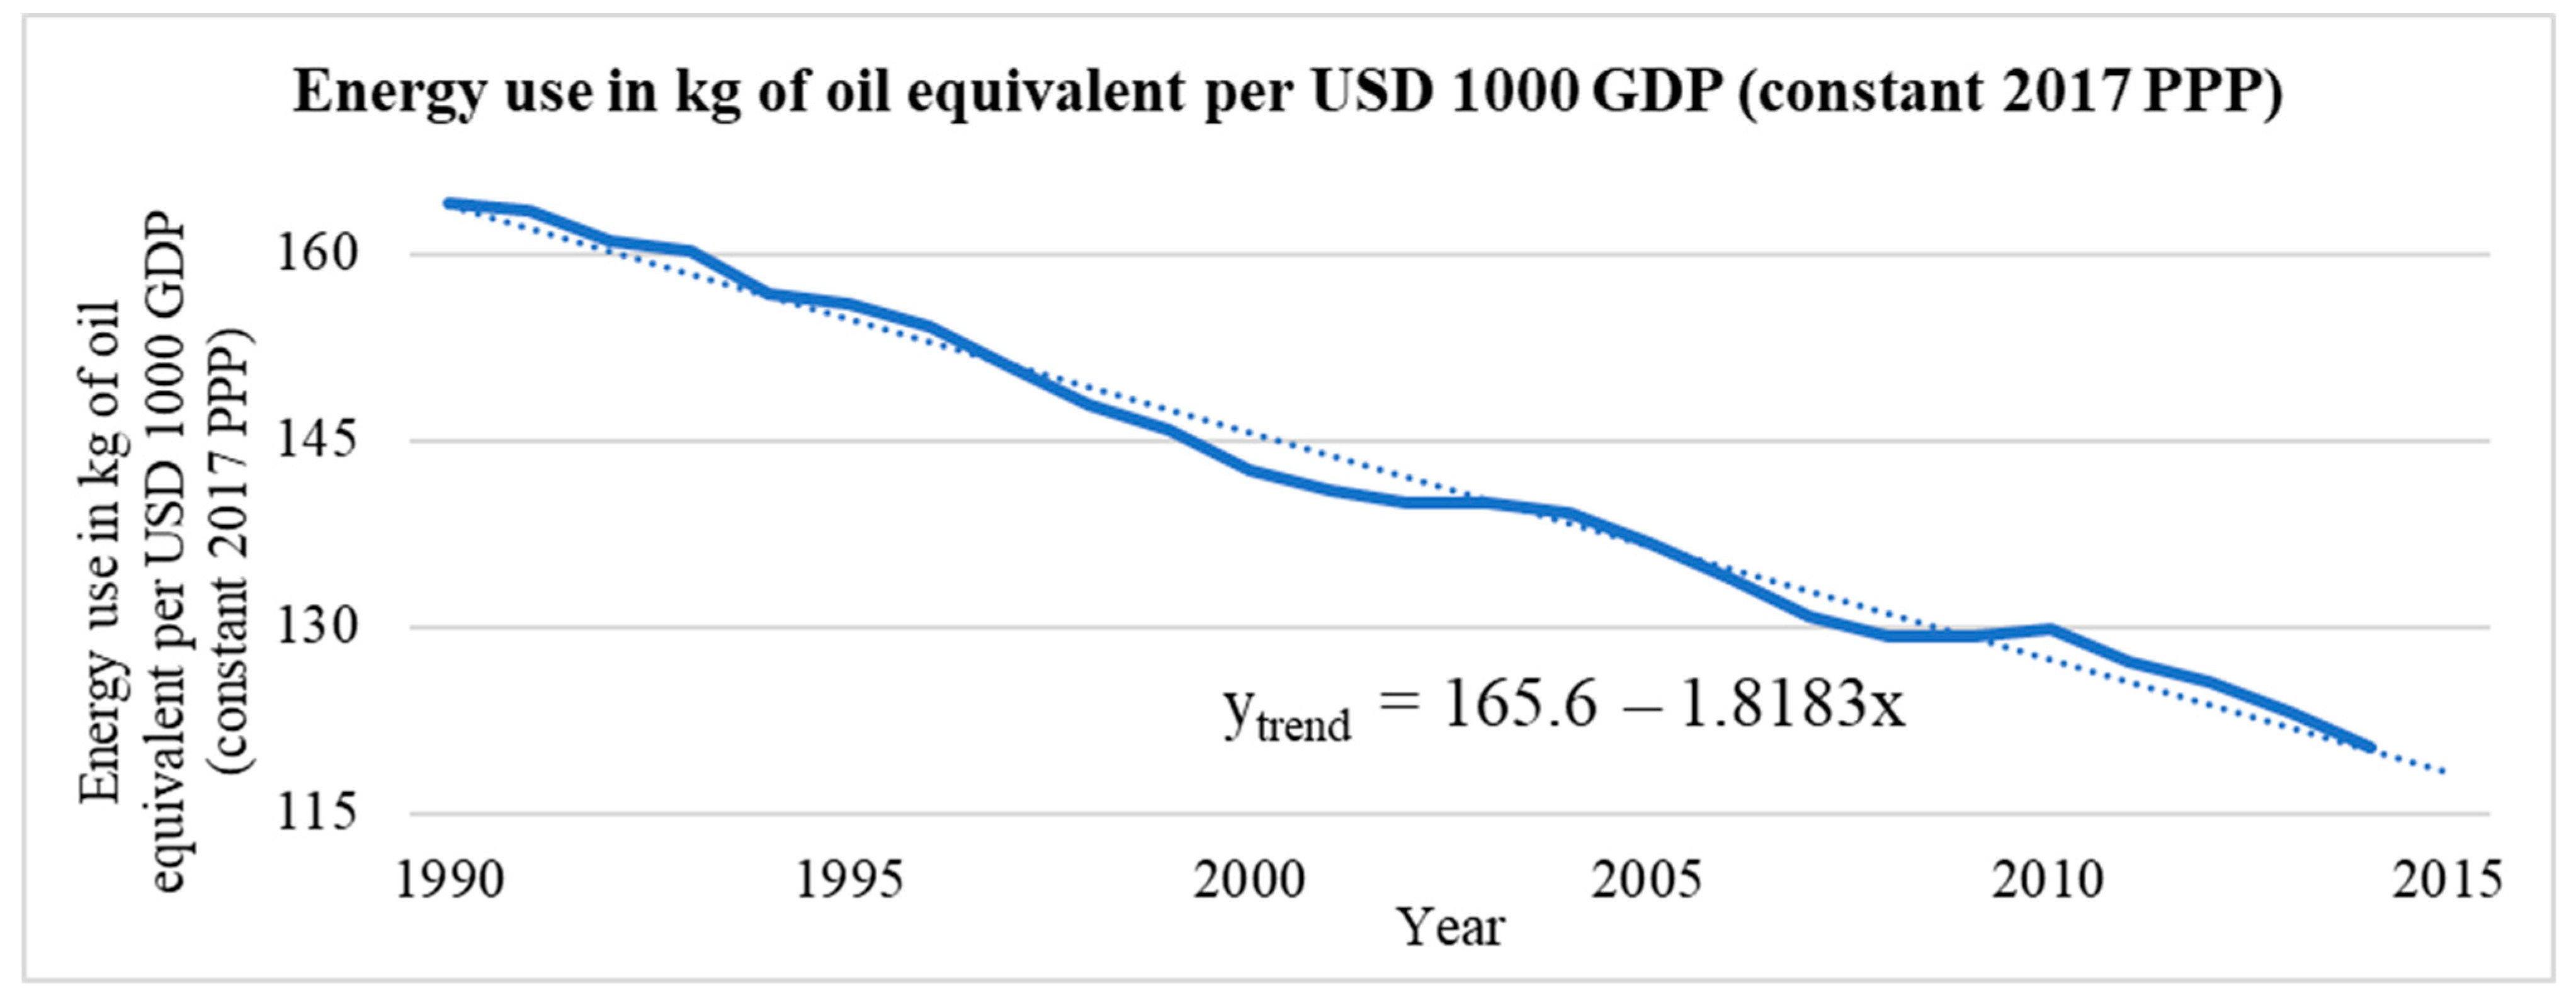
2. The Slower-than-Expected Pace of Adoption

First, let us look at the global trends in the use of the complete set of energy sources over the past 30 years since the first IPCC (Intergovernmental Panel on Climate Change) meeting in Sundsvall (Sweden) in August 1990.
Figure 1 shows global energy consumption in TWh, considering all fossil and non-fossil/renewable energy sources, and Figure 2 shows their respective shares. Figure 3 shows the share of primary energy sources, usually referred to as “low-carbon energy sources”, which include renewable energy and nuclear power. Renewable energy includes hydro, solar, wind, and wave and tidal power; geothermal energy; and bioenergy (conventional biofuels are not included).
As can be inferred from Figure 1, global energy production has not stagnated but has grown substantially over the past 30 years: from 1990 to 2013, oil consumption grew by 42%, gas consumption doubled, and coal consumption grew by 73%, but then coal production remained relatively constant and declined by 2020 (as did oil and gas). This tremendous growth was too fast for renewables to catch up.
Figure 2 also reveals an important conclusion. The most prominent information in this graph is that from 1990 to 2020, the share of oil in global energy consumption decreased from 40% to about 31%, a decrease of about 22%. It is important to observe that this decrease is not a case of energy substitution. Coal’s contribution has remained almost constant, fluctuating up and down, while gas’s contribution has increased from 20% to 25% over the same period. The contribution of wind and solar energy to the global share has only increased significantly since 2010, and by 2020, the contribution of both did not reach 10% of the global share. The main reason for the decrease in oil consumption is the “efficiency paradigm” discussed in Section 4.3.1 of this paper.
The graph in Figure 3 shows the share of low-carbon sources in primary energy consumption. As noted earlier, low-carbon sources are the sum of nuclear and renewable energy sources. It should be noted that the double-digit shares seen in this graph are primarily due to the contributions of hydro and nuclear power, both of which are much larger than the shares of other renewables combined. A detailed view of the contribution of each major low-carbon source is discussed in Section 4.3.2.
Thus, progress since the 1990s has been less than impressive: by 1994, about 14% was coming from low-carbon energy sources; today, almost 30 years later, that share has increased by only 4 percentage points (18%). In other words, the upward movement is indeed occurring but relatively too slowly: since 1990, it has increased by about 28%, which translates into an annual growth rate of about 0.93%, which means that the share of low-carbon energy sources might reach 25% by 2030. If the same trend is maintained, the share is expected to reach about 43% in 2050, which is still below the projected green transition, when the share of low-carbon sources is expected to exceed 50%. However, as will be discussed in the remainder of this paper, this figure may not materialize given the realities of the global energy supply chain and the other circumstances of the three perspectives we will discuss.
As some sources show, significant costs of subsidizing the sector remain in the global energy sector. Total direct subsidies to the energy sector in the world, including fossil fuels, renewable energy sources, and nuclear energy in 2017, amounted to about USD 634 billion. Among them, subsidies for fossil fuels predominated, accounting for about 70% (USD 447 billion) of the total. Subsidies for renewable energy production technologies accounted for about 20% of the total energy sector subsidies (USD 128 billion), biofuels accounted for about 6% (USD 38 billion), and nuclear energy—at least 3% (USD 21 billion). Of the USD 128 billion in subsidies for renewable energy sources, the largest share—USD 90 billion—came from the European Union [13]. If we look again at the world energy balance for 2018, it becomes obvious that 2.01% of renewable energy sources (RESs) account for 20% of all subsidies, which is disproportionately large. It is obvious that economically poor countries cannot afford to develop RESs as a real alternative to fossil fuels.
The complexity of energy transition processes, including such components as the dynamics of investments in RESs, the growth of RES capacities, the imbalance in the provision of critical materials, and different energy strategies in countries responsible for significant CO2 emissions, is shown in the recently published work of the authors [14].
Although the above estimates for the growth of the share of renewable energy sources are based on pure extrapolation, the results are consistent with predictions based on other historical models, such as those presented by Devezas et al. [15] and Akaev and Davydova [16], for example. Using data since 1850, the former authors used a ternary diagram (coal–oil/gas–renewables/nuclear) and a logistic substitution model to demonstrate that the share of renewables plus nuclear could reach 50% only by 2075 and surpass the share of fossil resources. According to the authors, this share could eventually be much higher if the “efficiency” factor discussed in Section 4.3.1 is taken into account; Akaev and Davydova [16], considering historical trends in energy consumption dynamics, used a scenario-writing mathematical model to estimate the goals of the Paris Agreement [17]. They demonstrated that a “great energy transition” (in the words of the authors) with the achievement of the goals is possible only by 2060, when the share of renewable energy in the total energy balance reaches 40%.

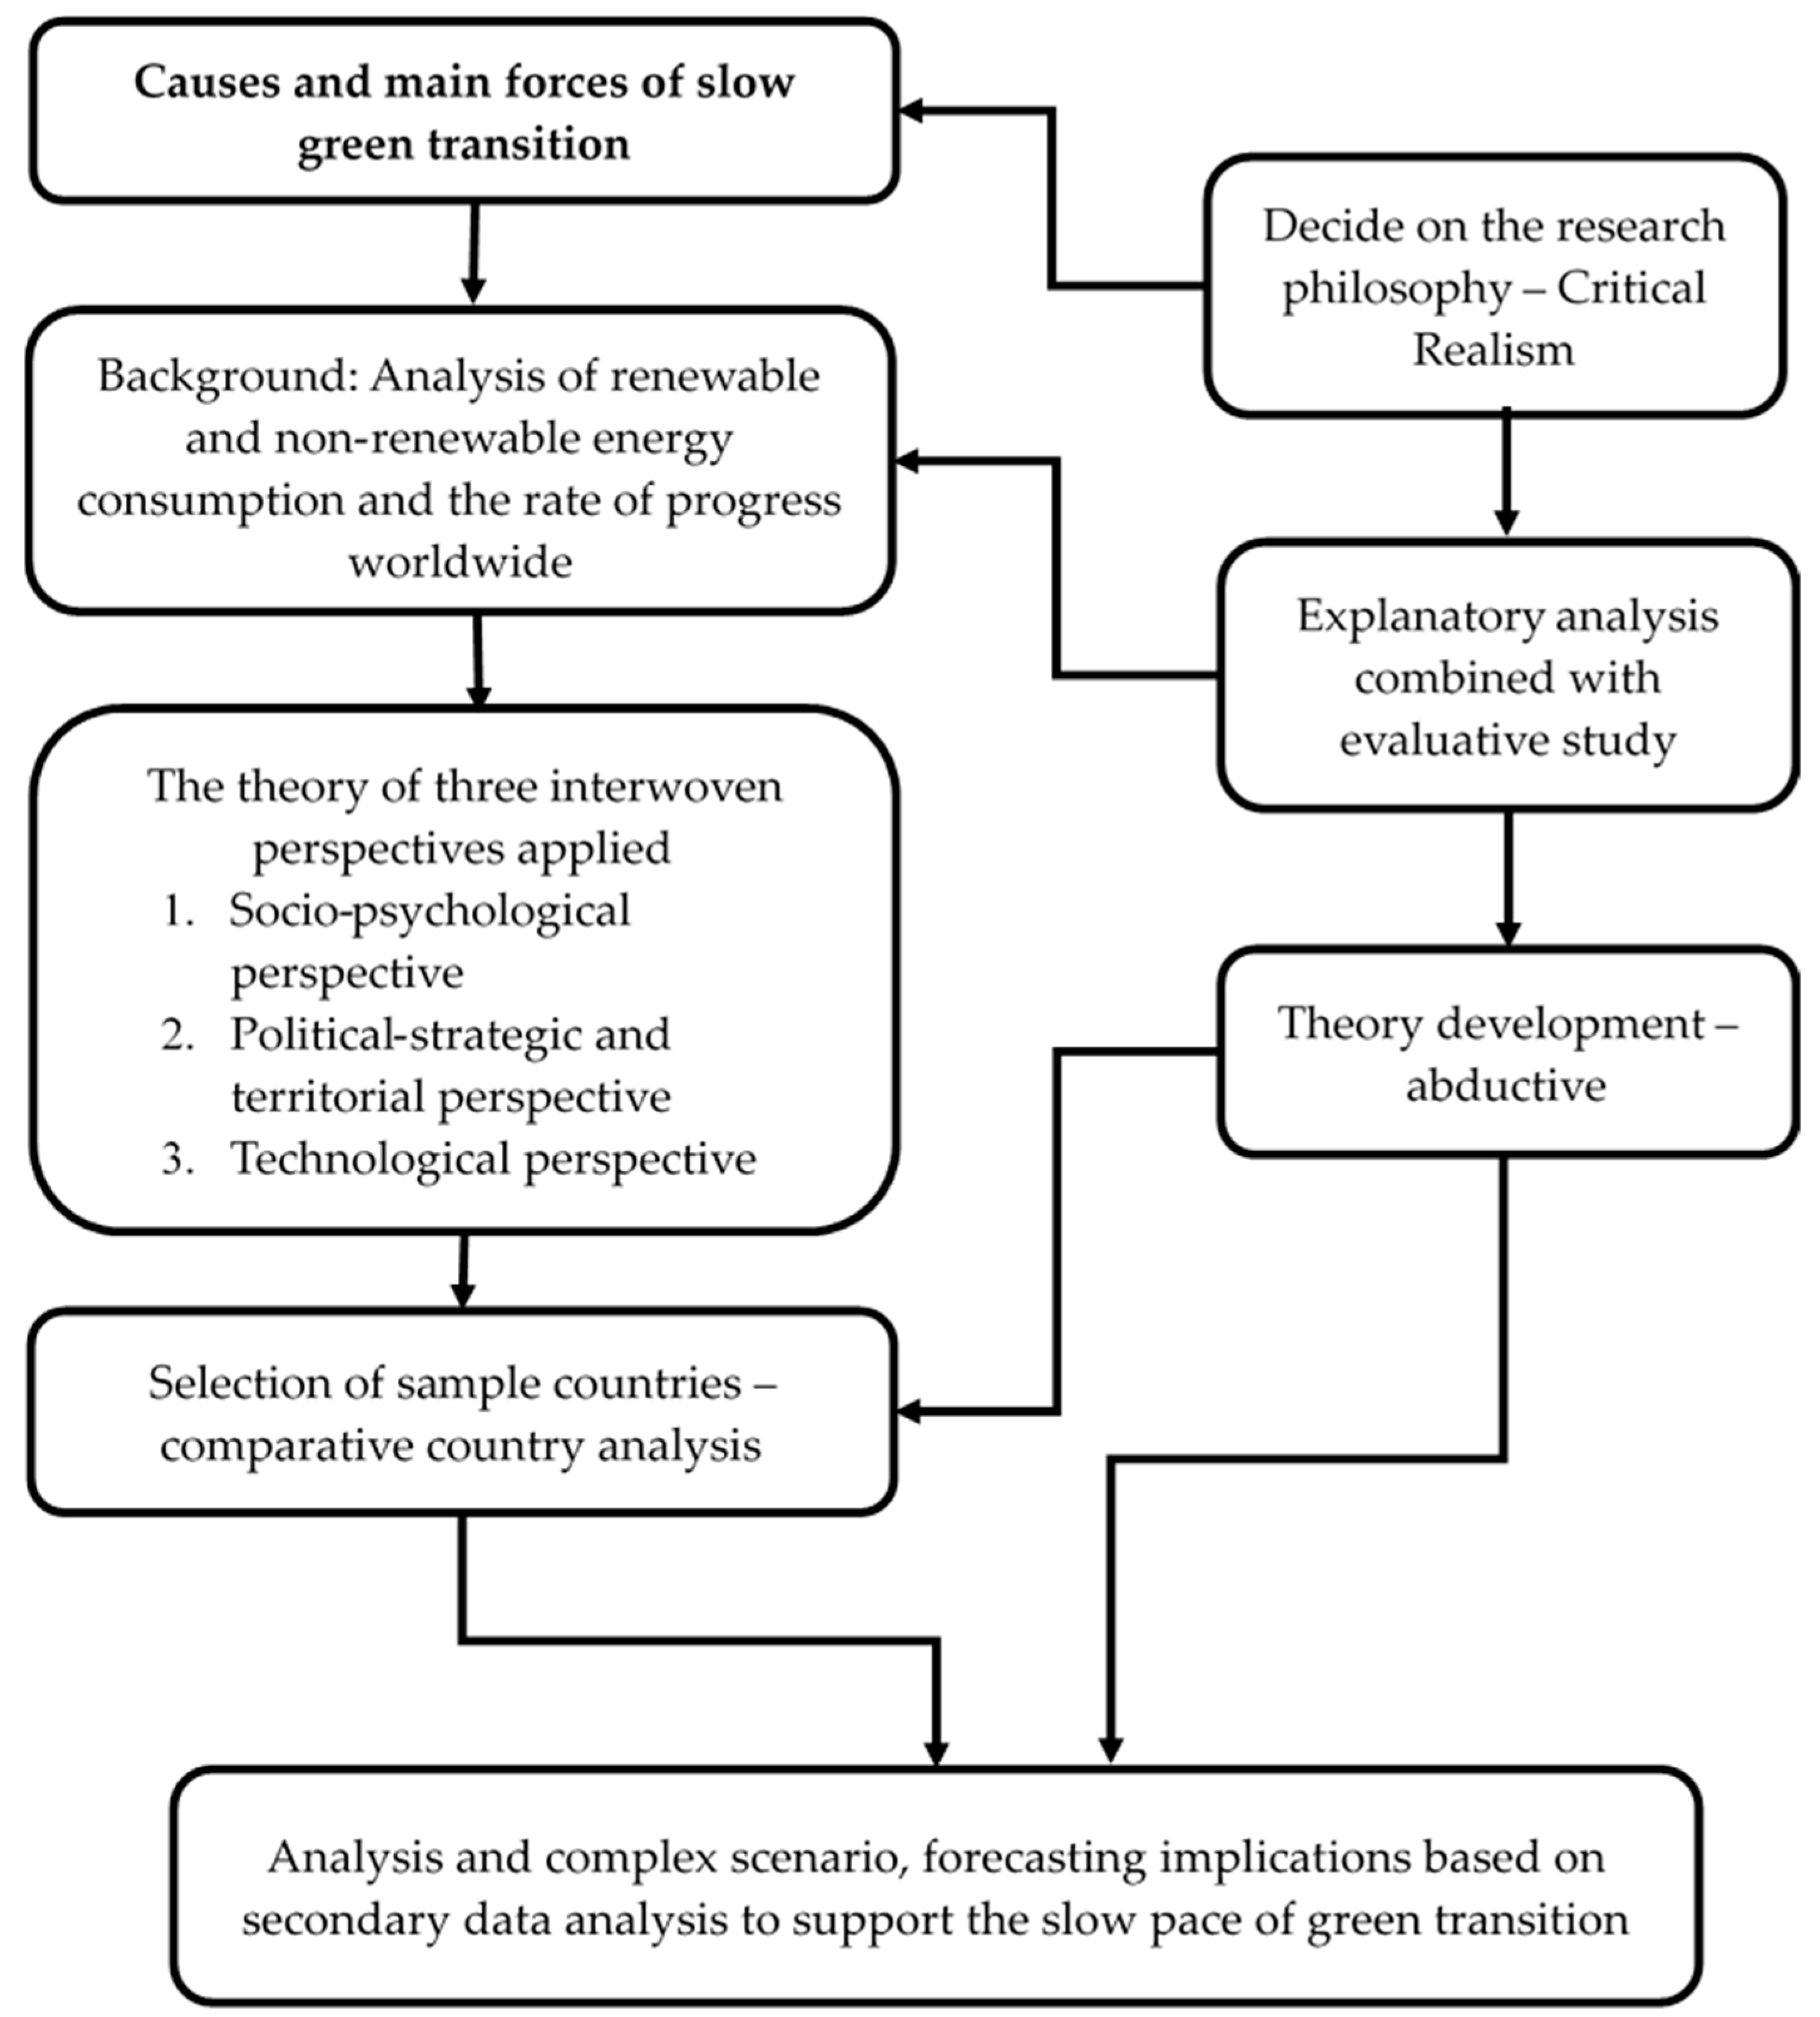
3. Research Design and Methodology

For the authors, who take a radical change perspective, the main aim of this paper is to provide a broad description of the complex set of factors, which contributes to the slower-than-expected global green transition from a three-fold perspective, namely the social–psychological, political–strategic, and technological perspectives. It also aims to provide an objective view and propose some structural reforms.
This paper relied on data collected from official international reports and pursued a country-by-country comparative analysis. This study extrapolated the presented data by applying quantitative forecasting methods such as time series, trend analysis, and the use of logistic fit. Logistic fit was used to stay in accordance with a previous methodology used by Devezas [15] and Akaev and Davydova [16]. MS Excel (2019 MSO (16.0.10414.20002) 64-bit) was used for the calculations. Country comparative analysis and scenario planning were also utilized to explore the barriers and challenges faced and to identify the root causes of the slow energy transition/green transition being experienced around the world.
This study combines explanatory analysis with an evaluative one, as well as deductive and inductive methods. It draws conclusions based on the quantitative analysis presented on the one hand and predicts some outcomes based on facts and trends and outlines some policy implications on the other.
Figure 4 illustrates the research design and flow of this study.

4. The Three-Fold Perspective

It must be pointed out once again that the projections based on the curves in Figure 1, Figure 2 and Figure 3 are very simple extrapolations of trends, and such projections are doomed to fail. This is because such predictions assume that economic and business processes will continue as they are today (“ceteris paribus”); however, as we all know, things change, sometimes dramatically. Our intention in Section 2 was to show that despite three decades of debate, policy, and investment in the renewable energy sector, the global scenario has not changed significantly, with fossil energy sources still holding a share of over 80% of global energy production.
The forces that are influencing, and will influence, the pace of the transition to low-carbon energy sources constitute a complex system of interwoven factors, with feedback loops. Many of the most optimistic predictions we see are generally based on aspects of rapid technological progress that may accelerate the process of change (discussed in detail in Section 4.3.3). The intent of this paper is to present a broad description of this complex set of factors, some of which are entirely absent from discussions and publications on the subject.
The observed pace of alternative energy adoption can be viewed from three perspectives: (1) socio-psychological; (2) political, strategic, and regional; and (3) technological.

4.1. The Socio-Psychological Perspective

The first perspective addresses the evolutionary behavior of humans, brought to the authors’ attention by Hindin [18] and Harman [19]. In fact, we have evolved over 250,000 years as a species to develop the ability to sense, grasp, and react to danger in our immediate and local environment. Dangers that threaten our survival are easily perceived by our senses, and our brains are wired to react to threats coming from our extant surroundings. Our brains are not programmed to detect invisible or slowly evolving environmental hazards. Our ancestors did not move from place to place because the weather was unstable, hot, cold, or the air was unbreathable. They basically moved in search of better hunting opportunities or more abundant fruit crops.
Hindin [18] (p. 2) points out the following: … “In contrast, most of today’s greatest hazards develop over decades, require special monitoring and analysis to understand, and affect not only our communities and regions, but the entire planet”.…
Adaptation, which rewires our brains, is no longer an evolutionary issue but a behavioral development over several generations, and the entire climate change debate has developed primarily over the past 30 years or just one generation. The generation still managing this planet is unlikely to be motivated to prioritize overcoming serious environmental problems. Economic and political interests (much like hunting and gathering for our distant ancestors) are still the primary motivators of human behavior, as they always have been since the birth of great civilizations. Profit is the major motivation of individuals, companies, and even nations. In the modern industrial establishment, there is no way to turn around, in the space of just one or even two generations, to escape from the pragmatic vision of immediate profit, opting instead for more complex ways of using forms of energy to produce the same products that can be produced with the most readily available means.
This behavior, which stems from our mental structure, has also been analyzed by psychologists, who refer to it as climate change-related cognitive biases [20,21]. Psychologists often cite various types of cognitive biases or cognitive fallacies (i.e., automatic ways of thinking) that govern our behavior and thinking, but they focus on at least three main types that seem to significantly affect our responses to climate change.
For example, there is what is called the confirmation bias, in which we naturally seek out and pay attention to information that supports our existing ideas, even when there is little evidence in our minds to build a confirmation or biased view. Such a bias is the primary cause of many of the “conspiracy theories” we know today. In addition to this, there is something called loss aversion. This is the tendency for humans to prefer avoiding losses to gaining equivalent gains, to focus on maintaining their present lives and assets, and to avoid change despite the potential benefits that would result from changing their present path toward the future. Finally, and importantly, there is what is known as cognitive dissonance, a state of mind that develops when there is internal tension or disharmony arising from two or more internal beliefs (ideas, values) that are inherently contradictory [20].
The question remains whether substantial changes in human existential practice that can overcome such mental biases can be achieved in two or three generations.

4.2. The Political–Strategic and Territorial Perspective

As already noted, the forces influencing the pace of the transition to low-carbon energy sources constitute a complex system of interwoven factors. This argument is strongly valid at a time when the conflicting trends and interplay of political interests now being observed among the various nations and regions of the globe are under scrutiny, and even the struggle for global hegemony, which has historically led to global conflicts, is at stake. At this point, it is worth pointing out some aspects of the so-called energy transition that have not received due attention in much of the debate, as will be briefly discussed in Section 4.2.1 and Section 4.2.2.

4.2.1. Strategic Mistakes and Politicians’ Role

The first thing to emphasize here is the strategic mistake related to the West’s inconsistency in its energy strategy. Based on excessive optimism about the energy of the day after tomorrow, i.e., new renewables such as solar and wind, they underestimated their investments in the energy they are currently using, i.e., fossil fuels. As a result, Western countries remain heavily dependent on Russian oil and gas imports and are forced into the contradictory situation of imposing economic sanctions on Russia while continuing to import. According to a recent Goldman Sachs assessment [22], the gradual decline in investment in the oil and gas sector over the past seven to eight years will result in the world losing 10 million barrels of liquefied natural gas per day or 3 million barrels of oil equivalent per day by 2024–2025.
What we have seen in the last 30 years at various international conferences, such as the IPCC and COP, are politicians who do not have a good understanding of techno-economic reality and are more eager to persuade at any cost (supported by news and fake news) than to inform using scientific analysis and judgment. They are the ones who insist on the myth that technological progress will lead to endless increases in energy, material, and land consumption on a finite planet. However, as will be analyzed in Section 4.2.2, the problem is that instead of intensifying investments in nuclear power, carbon capture, biohydrogen, and increased efficiency in the use of fossil fuels (reducing their carbon footprint), their focus is on the intensive use and expansion of solar panels, wind turbines, and batteries, the use of which can have serious consequences with respect to raw material availability and adverse environmental effects [11].

4.2.2. Relationship of Space (Territory), Population, and Economy

Green energy derived from solar and wind energy has its greatest impact in small countries (small land area, small population) that do not have many energy-intensive industries and can make adequate use of the sun and wind. Not all countries have these favorable conditions, and their structure of energy production is different due to varieties in natural endowments [23]. Take, for example, the two tables below. Table 1 shows the top 10 countries in terms of the percentage of low-carbon energy sources used (bold in column 5), and Table 2 shows the top 10 countries in terms of energy production from low-carbon energy sources (bold in column 4). For comparison, Portugal, Greece, the United Kingdom, and Denmark are also included in Table 1.
Looking at the details of these two tables, several important conclusions can be inferred, clearly illustrating the problem of widely varying territorial and economic conditions in different countries. All of the countries listed in Table 1 (without exception) have low-carbon primary energy production other than wind and solar energy, primarily from hydropower and nuclear energy.
Let us first note from this list the countries that are members of the European Union (EU). In Table 1, there are nine countries; in Table 2, France and Germany are members. The overwhelming majority of EU member states in Table 1 indicates that the energy transition and green energy development are some of the cornerstones of the EU’s energy policy. It is to be noted that within the Union itself, each country has its own policy in implementing the energy transition policy.
Norway and Sweden have achieved excellent results in the use of wind energy, but they also have vast water resources (and in Sweden’s case, nuclear energy). France is an excellent example of a country that has made good strategic energy decisions in the past (as have Finland and Sweden to some extent); approximately 76% of its low-carbon energy sources come from nuclear units (approximately 32% in the case of Sweden and around 44% for Finland).
The 56 nuclear reactors managed by the state-owned Electricité de France account for about 70% of France’s domestic electricity demand. Compared to other major industrialized countries, France neglects renewables in favor of the nuclear option, as seen in Table 2.
Inspecting the four countries listed in Table 1 without ranking, for example, two countries with a similar population and economic conditions, Portugal and Greece, one in the extreme western part of Europe and the other in the extreme eastern part, have significant differences in accessibility to solar and wind energy. For wind energy, both countries show similar figures, but Greece outperforms Portugal in solar energy accessibility by about 2.5 times. On the other hand, Portugal outperforms Greece in the usage of generating hydropower by about two times.
In the same framework, Denmark, with half the population of Portugal and Greece, located in the center of Europe and at a higher latitude, shows higher performance in the use of wind energy (almost 80% of the use of low-carbon resources), and, without significant water resources, also shows higher performance in the use of other resources such as biomass.
Germany, having the largest economy in the European Union (EU), has several things in common with Japan, another industrialized country. Both geographically and economically advanced countries, Germany and Japan show some similarities in the use of low-carbon energy sources. On the one hand, the share of low-carbon energy sources in energy production is different (21.11% in Germany and 13.21% in Japan). On the other hand, the share of nuclear energy sources in energy production is almost the same, 24.39% in Germany and 24.02% in Japan in 2021. Germany uses nuclear energy for almost 25% of its energy production, despite its strategy to close all domestic nuclear power plants [14]. Japan is also reducing its reliance on nuclear energy as a non-fossil fuel energy source [14]. With similar average wind speeds (8.45 m/s in Germany and 7.78 m/s in Japan, the windiest 10% of the country [24]), the two countries are expected to use wind energy to a similar extent, but the share of wind energy in energy production in 2022 was 3.38% in Japan, while Germany used wind energy the most for low-carbon energy production at 43.36%, which indicates a significant increase in wind energy capacity in the country [14]. Furthermore, the average wind power density in Japan is higher than in Germany, 699 W/m2 compared to 595 W/m2 in Germany [24], which would suggest higher wind power usage in Japan than in Germany. In 2021, Japan instead used hydropower (31.75%) and solar energy (35.26%) in its energy production, while in Germany, solar power generation reached the third highest share (18.05%) among low-carbon energy sources in energy production.
Iceland, at the top of the list, is a country that cannot and does not need to use wind or solar energy because of its abundance of hydroelectric and geothermal energy. The United Kingdom (UK) is a highly industrialized country with the peculiarity of being an island nation geographically located in the northern part of Europe and facing the windy North Sea to the east. Then UK presents good performance in terms of the share of using low-carbon sources comparable to that of Germany (compared in Table 2) but with a higher percentage of wind energy (ca. 46% of total low-carbon sources), as expected.
The other countries listed in Table 1 and Table 2 are developing countries. China is an interesting example. With its huge population and vast land area, China is currently leading the world in the expansion rate of solar and wind energy, but coal is still the main source in the country’s energy mix. It also has enormous hydroelectric potential and continues to use and invest in nuclear energy. However, Yang et al. discuss the energy trilemma in China, namely energy security, equity, and environmental sustainability as a consequence of such huge investments [25].
On the other hand, Russia, despite its very large land area, does not show exemplary figures for the use of new renewable energies (solar + wind), with more than 95% of its low-carbon energy coming from hydro- and nuclear power.
Brazil is another interesting case. With its very large land area, abundant sunshine, and more than 8000 km of temperate and tropical coastline, Brazil occupies seventh place in the ranking of low-carbon energy users in Table 1 and third place in the ranking of total energy producers in Table 2. However, Brazil’s low-carbon energy sources are mainly hydropower (about 75%), with solar and wind energy utilization not being very high (18% for both low-carbon energy sources overall but only 7.5% of total energy production).
India is an extreme example, with the lowest share of low-carbon energy sources in energy production (9.47%) among the observed countries while ranking third among the observed countries in total primary energy consumption. According to the IEA [26], as India’s energy consumption is growing exponentially due to rapid economic development and population growth, the country plays a major role in the global energy economy. However, the country’s per capita energy use is not even half of the global average [26]. In the low-carbon energy mix of energy production, wind and solar energy account for about 20% and have recently shown impressive growth, but there is still room for improvement. India still heavily relies on coal as fossil fuel and on hydropower (45.49%) as a low-carbon energy source. In studies by Ma et al. [27] and Solaris et al. [28], the authors analyze the BRICS (Brazil, Russia, India, China, and South Africa) country-specific strategies regarding the optimal low-carbon transition and impact of technological innovation on energy production as these countries are facing increasing electricity demand.
Continuing, the intensity of the adoption of low-carbon energy sources, mainly solar and wind energy, is largely determined by a country’s geography, size (territory and population), and level of economic development.
At the end of this political, territorial, and economic country-by-country comparison, it is important to emphasize that in some regions of the world, fossil energy sources are still available in large quantities, which is also an important reason for the expected slow pace of energy conversion. Although not included in the tables, it is worth considering the case of Kazakhstan. Kazakhstan has a relatively large territory (more than four times the size of France), a small population (about 19 million), and huge coal reserves. Kazakhstani scientists have recently proposed an interesting hypothesis to exploit these reserves [29]. The hypothesis is the development of “underground combustion of coal”, a technology that burns coal underground to generate heat and electricity (a kind of ‘underground coal reactor’) in order to neutralize the carbon emitted from coal. Despite the high potential for a green transition, Central Asian countries have not seen significant changes toward a sustainable energy transition [14,30]. Similarly, it is worth mentioning that Beka et al. [31] and Ignjatović et al. [32] found contrasting results when comparing OECD and Western Balkan countries’ policies in green growth and highlighted the differences in region-specific strategies. The authors’ recent publication discussed the decarbonization approaches of different major economies, in which the unevenness of the energy transition is presented, implying that a uniform transition cannot be realized, and specific considerations are important for economies [14]. Hunt et al. [33] also highlighted that non-renewable energy potential, investment capacities, and electricity needs, i.e., geographical, political, and economic conditions, call for different strategies; no unified strategies can be followed by developed and developing countries.
These political, geographical, and economic conditions are the central theme of this paper and will undoubtedly act as a powerful force in the slow pace of the adoption of green energy sources, with the next section focusing on a third force, the technological background.

4.3. The Technological Perspective

Technological improvement can contribute to two opposite directions regarding the usage of energy sources: either by (1) delaying the adoption of new alternative energy sources and promoting the continued use of fossil-based energies or by (2) accelerating the development of new renewable energy sources. Let us consider the first case, starting with the contribution to the continued use of fossil-based energy sources in terms of energy and industrial production efficiency.

4.3.1. The Efficiency Paradigm

In the last quarter of the 20th century, a global consensus emerged that our planet is under unprecedented stress from the destruction of natural resources and the biosphere. We have witnessed the formation of a new ‘Weltanshaung’ (worldview), the entrenchment of a new global paradigm in which humanity has developed a myriad of new behavioral lifestyles, not only with respect to the environment but also with respect to the consumption of materials and energy. As a result, much more efficient industrial processes have been developed, and much more efficient appliances, cars, buildings, and airplanes have been produced. Devezas et al. [15] showed that the dynamics of the substitution of primary energy sources that were predicted in the 1970s and 1980s have changed significantly with the advent of the 21st century. Based on the observation of these changes, they proposed the concept of an “efficiency paradigm”.
A group of scientists from IIASA (International Institute for Applied Systems Analysis, Laxenburg, Austria) led by Marchetti [34] demonstrated a regular and continuous long-term trend in changes in primary energy sources: coal replaces firewood, oil replaces coal, and oil replaces natural gas with a frequency of about 50 years. There have been substitution trends for 50 years. The latter will give way in the 21st century to other energy sources, mainly solar power and hydrogen. According to Marchetti [34], the contribution of oil, coal, and gas to the world energy supply at the end of the 20th century should have been about 25%, 10%, and 52%, respectively. However, the actual observed shares were 37% for oil and 25% each for coal and gas.
However, the most important point that should be emphasized in connection with the discrepancies observed in these projections is related to the fact that the contribution share of individual energy sources has not changed much over the last 20 years. Devezas et al. [15] showed that in practice, the substitution scheme is maintained, but primary energy sources should be treated differently. Oil and gas should be considered as a single energy source (i.e., FFF [fluid fossil fuel]) followed by what the authors call efficiency, which will be a completely different new ‘commodity’. It makes sense to consider oil and natural gas as a single “fluid fossil fuel (FFF)” group. This is because they have similar geological origins and locations, are produced using the same set of technologies, are developed by essentially the same commercial entities, and are transported through pipelines in the same way. Some preliminary clarification is needed on the efficiency mentioned by the authors.
Ausubel [35] and Smil [36] pointed out that conservation and efficiency alternatives to actual fuel use played the most important role in energy consumption dynamics and practices. The process of the substitution of energy sources described above was mainly driven by direct market mechanisms and government policies: since the early 1990s, governments have widely supported energy efficiency policies not only for environmental reasons but also for economic reasons. Devezas et al. [15] argued that a unit of efficiency is not easily measured compared to a watt of electricity or a barrel of oil and proposed to construct a unit (a so-called coefficient) for calculating efficiency over a given period, considering the ratio of economic activity to the rate of energy use, which economists call ‘energy intensity’. To quantify the energy contribution to “efficiency”, the authors calculated the actual energy minus the energy that would have been produced by using the same amount of fuel if there had been no change in energy intensity. In practice, this is equivalent to dividing a previously determined fraction of energy use (energy intensity factor) by the efficiency gain from a certain starting point (e.g., 1960). For example, if energy intensity increased by a factor of 1.5 and fossil fuels make up 45% of the standard energy mix, this definition of efficiency suggests dividing the fossil fuel share by 1.5 to obtain 30% (the amount the fuel would have contributed if energy intensity had not changed), with the remaining 15% going to efficiency gains. Using this definition, Devezas et al. [15] applied a Fisher–Pry logistic substitution model (Figure 5) to show a peak in “efficiency” around 2020 (the dashed curve in Figure 5), when the share of renewables reaches 12%, a very realistic projection considering the numbers as shown in Figure 3. The presented Fisher–Pry substitution process presents that “efficiency” per se can be considered as an alternative energy source that emerged in between FFF (fluid fossil sources) and nuclear/renewables [15]. The authors’ projections for the rest of the century are given at the end of Section 5.
As Figure 5 shows, it will be a long time before renewables surpass fossil fuels, which should happen (f = 50%, so [f/{1 − f}] = 1) only around 2080. Until then, the consumption of fossil fuels (gas and oil) will remain significant, and coal consumption will become insignificant only by the end of the 21st century. However, it should be kept in mind that these calculations were made on the basis of data up to 2005 and are extrapolations; therefore, they may seem too conservative. Extrapolation calculations are known to implicitly contain an error due to the fact that boundary conditions are assumed to be constant over time.
Another way to estimate efficiency gains over the past few decades is to measure the intensity of energy use in the production of wealth, as illustrated in Figure 6. As can be observed, here, we show the energy use (1 kg of oil equivalent) in the production of USD 1000 GDP: over the 24 years from 1990 to 2014, energy use decreased by about 30% to produce the same income, which is equivalent to an increase in efficiency of about 30% in industry production in the time frame of 24 years (1990 to 2014).
This phenomenon, this remarkable increase in efficiency in the last few decades, often referred to as “decoupling” by economists, has undoubtedly led to a slowdown and delay in the uptake of new low-carbon energy sources.
Considering energy dynamics and energy intensity, countries such as Brazil, Germany, and Japan have seen a gradual slowdown in the rate of reduction in the energy intensity of GDP. These countries have reached a saturation point due to dominant technologies that are currently present in their economies, which means that they face difficulties in reducing energy intensity to new levels [14]. Investment in the installation of low-carbon energy sources peaked in the last decade of the 21st century in countries such as Brazil, China, Germany, and Japan and has since declined [38,39,40]. The above factors, on the one hand, contributed to the green transition in these countries, but on the other hand, they slowed it down at the same time.

4.3.2. Technological Drawbacks

Data indicate that countries have invested trillions of dollars in subsidies for solar and wind energy, while the share of fossil energy has remained virtually unchanged over the last 30 years, as discussed in Section 3. It is estimated that about USD 2.7 trillion has been invested over the last decade, but only about 1200 GW of new renewable energy generating capacity has been built [41].
At least four technical shortcomings can be identified that prevent the full deployment of new low-carbon energy sources. Why invest trillions of dollars in new and complex equipment when the carbon footprint can be significantly reduced by a more efficient use of existing energy sources, increasingly seeking to use them more efficiently and thus also reducing our energy needs? This may seem to be a very naive and negative view of a sustainable future, but it is probably the view that prevails in the minds of decision makers.
  • The first drawback—the focus on controlling the planet’s temperature
Looking back at the climate change debate over the past three decades, there has been an interesting shift from the scientific debate about developing mechanisms to limit greenhouse gas (GHG) emissions to the political debate about limiting the rise in the maximum global temperature. At COP15 in Copenhagen in 2009, a commitment to no more than 2 °C warming compared to pre-industrial times was made, but at COP21 in Paris in 2015, a more ambitious (albeit extravagant) temperature target of 1.5 °C came up. This came as a big surprise to many, given the lack of significant advances in so-called NETs (negative emission technologies) at the scale needed to meet such targets, and considering that between 2009 and 2015, there was an uninterrupted increase in CO2 emissions.
A flaw that should be emphasized is related to the non-scientific belief that global temperature can be controlled. It is as if there is a thermostat and it can be used to program the desired temperature as a set point [42]. As discussed in Section 4.2.1 above, the COP is as scientifically bankrupt as it was when it was created in 1995, but now, it is a negotiation exercise that is essentially political in nature, where climate scientists are rarely present. This combination of naivety and irresponsible politics is frightening, and in an area where consensus once prevailed, disagreement is now evident.
2.
Second drawback—seasonality, environmental considerations, and generation capacity
The discussion of renewable energy sources, mainly solar and wind energy, reveals several important objections, including seasonality, electricity generation capacity, high storage costs, and low efficiency levels, and the fact that they require a lot of space for installation. A recent publication by Devezas et al. [11] analyzes in detail many of the negative aspects associated with power generation from solar panels and wind turbines, for example, the fact that wind flows and sunlight streams are intermittent and hence highly dependent on local climatic conditions. Sunlight and wind cannot be stored and used to generate electricity when needed, as is the case with coal and gas. In addition to regional variations, wind and solar power are strongly influenced by seasonal cycles, so accounting for these variations is a challenge in planning electricity generation and calculating electricity prices in a given region or country.
Other authors, such as Orlov et al. [43], have also highlighted that the advantages of decarbonizing clean energy sources, such as solar and wind energy, compared to conventional fossil fuel-based energy sources are associated with significant challenges.
As already seen in Figure 2, the installed capacity of wind power in the global energy mix is almost the same (slightly higher) as that of solar power, but its growth rate in recent years is slightly lower. To distinguish between the two types of energy, Figure 7 shows the development of the most important low-carbon sources over the last 30 years in a form similar to the decomposition of Figure 2. The chart in Figure 7 shows significant growth in solar and wind energy over the last decade, but the total capacity to date (about 2500 TWh) represents only a drop in the ocean (about 2%) of the energy needed to fuel the planet, as shown in Figure 1.
In the already-mentioned publication by Devezas et al. [11], the authors discuss in detail the numerous criticisms of the huge areas required to install solar and wind power plants and of visual pollution caused by wind turbines. As an illustration, Table 3 and Table 4 provide a ranking of the ten largest solar and wind farms existing in the world today.
As shown in Table 3, the ten largest solar parks (three in India, four in China, two in UAE, and one in Egypt) range in size from 2.59 km2 to giant parks of more than 90 km2, and the generating capacity ranges from 1 to 2.8 GW. Four main points can be said about these power plants:
  • They are mostly located in desert climate areas, and such terrain is not found everywhere but only in a very limited number of places on the planet.
  • Solar parks cover very large areas, many of them comparable to medium-sized European cities (Solar Parks 6 and 9 in China cover half the total area of Brussels and Milan).
  • The largest solar park (Bhadla Solar Park) in the Indian desert state of Rajasthan, near the border of Pakistan, will power a population of about 800,000 people—a relatively low payback for such a large investment.
  • Energy production sites so far from urban centers are very complex and additionally costly in terms of transmission lines, distribution, energy storage, etc.
The question arises as to how to provide solar energy for at least a significant portion of the planet, given the ever-increasing energy needs of modern society. A simple estimate of the average capacity of an average solar park (typically around 1500 MW) would require around 5000 solar farms worldwide.
For wind energy, the same negative aspects can be highlighted as for solar energy exposed above (except point 1), but there are other challenges. According to some estimates [37], about 400,000 wind turbines, both onshore and offshore, are currently installed worldwide. Table 4 summarizes the 10 largest wind turbines currently installed (1 in China, 1 in Australia, 1 in Taiwan, 2 in India, 2 in the UK, and 3 in the US, of which 6 are onshore and 4 offshore). China is currently the world leader in installed capacity (~40% share), followed by the US (~18% share). Over 90% of current installed capacity is onshore, but offshore installations have been gaining momentum in recent years, mainly in the shallow coastal waters of the North Sea (UK and Scandinavian countries) as a result of the growing criticism of visual pollution and the vast area leading to environmental problems.
However, such offshore installations have other drawbacks:
  • They are substantially much more complex and expensive than land-based, onshore installations and are currently the most expensive type of energy to consider for large-scale installations. For more details, see Devezas et al. [11] and Lazard’s LCOE (levelized cost of electricity) [48], who demonstrate that the ratio of investment–payback is simply unbalanced.
  • The availability of coastal lines with shallow depths (up to 60 m) is very limited anywhere on the planet.
  • Environmentalists also object that offshore wind farms will interfere with marine life and wildlife near the coast.
The same question as the one pointed out above regarding solar energy can be raised also regarding wind energy, namely how the world electricity demand can be met by wind turbines. Garfield [49] gives a very interesting estimate. Considering the global energy demand, if we divide the world electricity demand by the average generating capacity of wind turbines, more than four million wind turbines would be necessary, or in other words, ten times the number currently available should be installed.
All the discussed disadvantages associated with wind and solar energy undoubtedly contribute significantly to the slow pace of the implementation and adoption of these so-called green energy sources.
3.
Third drawback—transport electrification
To achieve all the goals of the Paris Agreement (2015–2016), namely limiting global warming to 1.5 °C, greenhouse gas emissions must peak by 2025 and be reduced by at least 43% by 2030. It is therefore essential to think about the decarbonization process applied to the electrification of all land, air, and sea transport, in other words, all vehicles on the planet: cars, buses, trucks, trains, ships, and planes. The goal is for zero-carbon solutions in all these transportation systems to be competitive and less than 30% of the current level of emissions by 2030.
We are currently seeing rapid growth in electric car ownership, which is leaving behind other forms of land transportation, namely buses, trucks, and vans. Due to the rapid growth in electric vehicle sales, there is some difficulty in finding reliable statistics, and for this reason, Figure 8 below shows the growth in electric vehicle ownership over the last decade, averaging statistics from at least three different sources. As can be observed, more than 40 million electric cars of all types (full electric, plug-in hybrid, etc.) were on the road in 2023, which corresponds to only about 3% of the mammoth-like fleet of passengers cars all over the world. The left axis displays the total number of all types of electric vehicles, while the right axis shows the % share of the total fleet.
However, the problem of the global electric vehicle fleet does not end there. Most electric vehicles need to be recharged on a daily basis [53], and currently, this recharging is mainly conducted by electricity derived from fossil fuels. Modis [54] in a recent study provided preliminary projections of the energy consumption of this global fleet of electric vehicles, showing that in 2037, the energy required by the world’s electric vehicles will be 22.5% of all energy consumed, which is very close to the projected share of global green energy production of about 22.7%. In other words, electric vehicles operating after 2037 will have to be charged with electricity produced by burning fossil fuels.
However, if we consider that there are just about a billion cars in circulation in the world today [55,56] and that electric vehicles account for about 3% of the global car fleet, it is clear that we are still a long way from the goal of the Paris Agreement. A rough estimate suggests that to achieve the ambitious goal of zero emissions from cars by 2050, we need to maintain a growth rate of around 100% per year. What about buses and trucks?
It is well known that the need for electrification does not only concern road transport but also two other very important transportation sectors: the aviation and maritime sectors. Paulikas et al. [57] estimated that currently, road transport is the biggest contributor to carbon emissions (72%), while airplanes contribute a share of about 11%, and ships appear to contribute 9.5%. According to projections up to 2050 made in several studies [58], emissions from these sectors could be between 17% and 20%.
Let us now consider which aspects of transport decarbonization are the worst:
-
Shipping is the only transportation sector that is not subject to international regulations and policies to reduce GHG emissions. Assuming that 90% of world trade is now carried by some 90,000 very large transport ships, how can we predict that carbon dioxide emissions will be significantly reduced over the next few decades? Can we envision that within the next 20 or 30 years we will be able to convert this entire huge fleet to electric propulsion?
-
As for aviation, the picture is somewhat different: as discussed in Section 4.3.1 (The Efficiency Paradigm), since the oil shocks of the last century, aircraft designers and manufacturers have worked hard to reduce fuel consumption by using more efficient engines and lighter materials (composites). As Devezas et al. [59] demonstrate, these objectives have been reasonably met: fuel consumption per seat has been reduced by about 70% since the 1970s. Moreover, the two main aviation policy regulators, IATA (International Air Transport Association) and ICAO (International Civil Aviation Organization), have developed some very restrictive measures to reduce carbon dioxide emissions in order to meet the IPCC’s targets.
-
However, it should be pointed out that all these restrictions imposed by IATA and ICAO are aimed at reducing emissions through efficiency improvements, rather than the serious goal of completely eliminating the use of fossil fuels. There are several innovative projects, from small ones to giants of aviation technology and aeronautical engineering, but there is no clear scenario for the next 20 years (see [11] for more details).
-
Last but not least, it is worth emphasizing the fact that aircraft and ships are designed and produced with a life cycle of at least 30 years: as of 2021, Airbus has produced and delivered 663 aircraft, Boeing has produced and delivered 450 aircraft, and about 150 ships were produced in the same year [60]. In 2050, all of them will still be flying and traveling on developed fossil fuels. The same can be said for all diesel- or gasoline-powered ground vehicles produced today (although their life cycles may be somewhat shorter). So, what will happen to all these modes of transportation that remain in production over the next decade? Could the production of all these vehicles suddenly cease? This scenario is not expected to change significantly in the near future.
4.
Fourth drawback––material exploration and availability
Completing the picture of the most important technical obstacles to reach the goal of net-zero emissions in the near future, Devezas et al. [11] also raise the important issues of the sourcing and availability of materials (some rare metals with very specific functions in current technologies), issues that have not been discussed in any of the several meetings of the IPCC. However, in recent years, several works have appeared in which these issues are raised not only due to the limited resources but also due to their geopolitical aspects and environmental aggressiveness, as well as the fact that energy resources from fossil fuels are used for their production and extraction [61,62,63,64,65].
It is worth noting that the slow adoption of new renewable energy sources, which is the main topic of this article, cannot be blamed on material exploration and development issues as the main reasons for the slow progress at the moment. However, there is no doubt that in the near future, this issue will become an important bottleneck to be considered in the overall scenario of the energy transition and viability of modern digital society.

4.3.3. Technological Optimism

So far, the focus has been on factors that have slowed down the transition to so-called green energy from a technological point of view. In this section the focus will be on one of the forces acting on the energy transition that might counter all other forces analyzed so far and, to some extent, stimulate the transition process. This chapter is about the steady technological and logical improvement observed in the diffusion of renewable energies.
Solar and wind power generation technologies have improved significantly and will continue to improve while the costs of producing these types of energy are falling sharply as well. The technology for generating electricity from solar cells with semiconductor junctions has improved significantly over the last few decades, but their efficiency is relatively low and depends on the semiconductor used and the latitude, longitude, and intensity of solar radiation. The theoretical limit of efficiency for classical p-n junctions is 33.16%, the so-called Shockley–Queisser limit [66], but this limit has been overcome by the use of multi-junction concentrator solar cells, allowing for efficiencies close to 50% [67]. However, the most important factor affecting the efficiency of solar panels used in PV systems is the location dependence, i.e., the dispersion and intensity of solar radiation, which determines the annual system performance. As already mentioned in Section 4.3.2 (second drawback), the intensity of solar radiation varies greatly from country to country and region to region. Regions with high year-round solar radiation intensity include the Middle East, North Africa (Sahara Desert), northern Chile, Australia, China, and the southwestern United States. For example, in a region with high electricity generation such as central Algeria, where solar radiation is 2400 kWh/m2/year, a good PV system can deliver 480 kWh of energy per year, while in Lisbon, where solar radiation is only 1900 kWh/m2/year, the delivered energy drops to 380 kWh for the same panel type. However, for example, in Scotland (550 kWh/m2/year,) and other similar locations in Northern Europe, the same system can provide only 110 kWh per year [68] as solar yields are far lower.
In the first sentence of Section 4.3, we wrote that technological improvements are a valid force that might counteract the identified shortcomings and stimulate the rapid deployment of new renewable energy sources. This assertion is based on recent optimistic projections [69,70] based on the rapid reduction in the so-called levelized cost of electricity (LCOE). The LCOE consists in a suitable measure for planning the installation and/or expansion of electricity grids. For generation costs, the LCOE, which is the ratio [total lifetime costs/total lifetime energy production], is particularly favorable because it takes into account historical changes including interest rates, capital costs, and learning curves and can be used for investment planning and is suitable for consistent comparisons of different power generation methods.
Figure 9 shows the progression of LCOE reductions for solar thermal, onshore wind, offshore wind, and hydroelectric systems from 2010 to 2020 (the latter LCOE is shown for comparison). As can be seen, the most significant cost reductions have been achieved in solar PV, which is now lower than offshore wind and approaching the same cost as onshore wind and hydropower.
Way et al. [70] argue that most energy–economy models create energy transition scenarios that overestimate costs because they underestimate cost increases and renewable energy penetration. According to the authors, they construct three different energy transition scenarios based on probabilistic cost projections of energy technologies using back-testing techniques, statistically validated with data for more than 50 technologies: (1) a conservative one, assuming the continuation of fossil fuel-based systems; another one (2) assuming a slow transition, and (3) the most optimistic one, assuming a rapid transition to green energy sources. Thus, they concluded that “compared to maintaining a fossil fuel-based system, a rapid transition to green energy would likely result in trillions in net savings, even without accounting for the damage from climate change and the benefits of climate policy.” And they concluded that it is likely to be beneficial to transition to a net-zero energy system by 2050 [70] (p. 2057).
This is undoubtedly good news for those who want to accelerate the transition to a green and sustainable future. Indeed, the use of solar and wind energy systems has expanded significantly over the past few decades as they have moved from niche applications to the mass market, at a rate of increase similar to that of nuclear energy in the 1970s. Unlike nuclear power, however, solar and wind power have experienced impressive cost reductions, making them potential candidates to challenge the dominance of fossil fuels over the next decade.
However, care must be taken not to overestimate these results. First, in using the Monte Carlo method to estimate future costs, the authors use historical weighted global average costs considering very different technologies. This can lead to modeling unrealistic future cost trajectories given geographic differences in energy costs and raises questions about the validity of this method. Second, the curves in Figure 9 clearly show that the LCOE of renewable energy has already leveled off to a near constant level and is not expected to decline significantly in the next few years. In addition, energy transition models must take into account the huge differences between countries; therefore, the cost–benefit of trillions of dollars will not really be beneficial, and it cannot be distributed equitably among all concerned.
Such optimism also does not take into account the global flow of matter, which was already discussed in Section 4.3.2 (the fourth drawback). To add to this point as we know, many developing countries are the main suppliers of raw materials to the world market, and the end consumers of these raw materials are technologically advanced countries (mostly developed OECD countries). Since developing countries do not have the opportunity to use green energy on a large scale for raw material extraction, most of today’s global material wealth is created on the basis of old technologies with large carbon footprints.

5. Discussion and Policy Implications

Way et al. [70], when closing their conclusions, write the following: …“The belief that the green energy transition will be expensive has been a major driver of the ineffective response to climate change for the past 40 years. This pessimism is at odds with past technological cost improvement trends and risks locking humanity into an expensive and dangerous energy future”.
However, as we have tried to demonstrate in this paper, cost is not a factor (or a driving force) which is so important and relevant that acts upon the expected pace and rhythm of the green transition. In fact, we are dealing with a complex interplay of forces with very different characteristics and/or nature, which were analyzed from a three-fold perspective: socio-psychological, political–strategic–territorial, and technological. While the costs are evidently significant, they are thinly spread across complex and broad spheres of influence and the wide field of forces involved.
The following Table 5 provides a summary of this complex force field and its effects, as presented in the text.
This summary table shows that most of the forces that influenced the definitive entrenchment of renewable energy sources support a slow pace of transition (delayed transition), which can be pointed out as the main reason. On the other hand, we also face significant forces associated with technological progress, which counteract all other factors contributing to a slow transition. But the main problem that arises is to what extent technological performance improvement can offset (or is offsetting?) the currently observed slow rhythm of change.
As mentioned earlier, the forces represent a complex sphere of power that are closely interconnected, so assigning them a rank or highlighting the most important of them is not an easy task. But if we try to put the signed ratings into perspective, then the order of forces in the list from the most powerful and strategic to the least powerful and strong, taking into account the interaction of forces, may be as follows:
  • The political–strategic and territorial perspective;
  • The efficiency paradigm;
  • Technological drawbacks;
  • Socio-psychological forces.
The interrelationship of forces is shown in Figure 10. The first force is due to the political interests of countries, the inconsistency of the energy strategy of the most influential countries [14], territorial potential, the level of economic development, and the appearance of political–strategic and territorial prospects, which largely determine the initiative for the transition to a green economy of a particular country. However, such initiatives, which are influenced by the unique characteristics of the phenomenon of energy intensity and efficiency, give impetus to various strategic initiatives that oppose the intensive introduction of low-carbon sources and therefore find themselves in second place. As a minor third force, we face technical disadvantages such as high cost, the scarcity and criticality of raw materials, etc., which is also an obstacle for the green initiative. However, a sudden turning point or breakthrough through technological innovation can overcome technical shortcomings. Finally, the least powerful driving force is the socio-psychological background, since human behavior and its confirmation bias, loss aversion, and cognitive dissonance all confirm the status quo and maintain the comfort zone of the population.
Several cells in the last column of Table 5 reflect the concept of the “necessity to explore other alternatives”. This is an important topic of discussion, a detailed analysis of which goes beyond the scope of this work and consists in identifying the main forces influencing the long-awaited and necessary transition.
Indeed, the massive use of nuclear energy and hydrogen as carbon-free energy sources will play a key role in the debate about zero emissions and a sustainable future. In other words, most future discussions about energy transition should focus on finding the ideal mix of primary energy sources. The latest generation of small- and medium-power reactors in nuclear power plants, working in symbiosis with renewable energy sources, will ensure a partial replacement of hydrocarbons and achieve climate security without a negative impact on the economy. According to Akaev and Davydova [71], “…without the dynamic development of nuclear power as a low-carbon source of generation that meets the basic and peak needs required to create a stable and sustainable energy system, the Great Energy Transition is impossible” [71] (p. 598).
An important point that should be raised in this discussion concerns possible scenarios for the next few years regarding the speed of the transition to a “green” economy, which have been discussed so far. How do you assess the potential for changes in this scenario with accelerated migration, or will it continue at the same slow pace that has been observed so far?
In search of an answer to this question about possible future scenarios, logistic fit was used to extrapolate the data presented in Figure 3, and the results are shown in Figure 11. Based on data from 1990 to 2022, the share of primary energy from low-carbon sources is likely to reach about 24% by 2050—in line with the results obtained by Devezas et al. [15], Tick et al. [14], and Akaev and Davydova [16] and briefly explained at the end of Section 3. A similar result is also forecast by the consulting group EIU [72] (Economist Intelligence Unit), which states that “despite the need to tackle climate change, the energy transition will proceed at a snail’s pace over the next decades”. In particular, higher shares of RESs (renewable energy sources) are unlikely; given that the world needs a “reality check” in the transition from fossil fuels to renewable energy sources, it may take “generations” to achieve the net zero goal [73].

6. Conclusions

This paper discusses the slow pace of the adoption of so-called green energy sources from a three-fold perspective, arguing that these forces are interrelated and that technological enablement and effectiveness and development cannot compensate for the slow pace of future growth. By analyzing the complex interplay of these factors, this paper contributes to a deeper understanding of the green transition’s dilemmas. The authors delved into the issue with a critical realistic approach from a radical change perspective. We need to emphasize that we set the objective of this paper to discuss the reason of the slow rate of change in the energy transition, and we did not focus on the causes of climate change.
In summary, Figure 12 presents the current complex scenario of the green energy transition with a comprehensive view of the interwoven and interrelated forces discussed in this paper. The size of the gears around the main gear reflects their inertia-related relevance (forces) that prevents or impedes the smooth movement of the main gears, i.e., the full deployment and unfolding of the desired energy conversion.
Although this study takes as examples the countries ranked in the top 10 in the utilization of low-carbon energy sources and energy production from low-carbon energy sources, as well as the countries with the largest wind and solar power parks, there is future room for countries outside the top 10 in the ranking to be investigated in terms of the three perspectives presented. Although the countries covered in this study are limited, this is not finite and could be expanded in future studies.
This study examines how the problems of material sourcing and development are some of the bottlenecks in the slow pace of green transformation. These challenges highlight some of the pressing green transition’s dilemmas, particularly in the realm of resource availability. However, it does not consider the implications of material shortage for modern society in the near future, which will be the subject of future research and forthcoming publications.
Unfortunately, the current international political climate is unstable and has contributed to delaying the anticipated transition. Therefore, it is difficult at this time to make reasonable predictions regarding the timing of a significant reduction in the use of fossil fuel-based energy systems.

Author Contributions

Conceptualization, T.D. and A.S.; methodology, T.D., A.S. and A.T.; software, A.S., P.R. and A.T.; validation, T.D. and A.S.; formal analysis, T.D., A.S. and A.T.; investigation, T.D., A.S. and P.R.; resources, T.D., A.S. and P.R.; writing—original draft preparation, T.D., A.S. and A.T.; writing—review and editing, T.D., A.S. and A.T.; visualization, A.S. and A.T.; funding acquisition, T.D. and A.S. All authors have read and agreed to the published version of the manuscript.

Funding

This research was partly funded by the Ministry of Science and Higher Education of the Russian Federation (Grant Agreement No. 075-15-2022-1136 dated 1 July 2022).

Data Availability Statement

The original data contributions presented in this study are included in this article; further inquiries can be directed to the corresponding author.

Acknowledgments

The researcher T. Devezas thanks the Portuguese Science and Technology Foundation (FCT), under the unit C-MAST (Center for Mechanical and Aerospace Science and Technologies), Projects UIDB/00151/2020 (https://doi.org/10.54499/UIDB/00151/2020) and UIDP/00151/2020 (https://doi.org/10.54499/UIDP/00151/2020).

Conflicts of Interest

The authors declare no conflicts of interest. The funders had no role in the design of the study; in the collection, analyses, or interpretation of data; in the writing of the manuscript; or in the decision to publish the results.

References

  1. Seto, K.C.; Davis, S.J.; Mitchell, R.B.; Stokes, E.C.; Unruh, G.; Ürge-Vorsatz, D. Carbon Lock-In: Types, Causes, and Policy Implications. Annu. Rev. Environ. Resour. 2016, 41, 425–452. [Google Scholar] [CrossRef]
  2. Stoddard, I.; Anderson, K.; Capstick, S.; Carton, W.; Depledge, J.; Facer, K.; Gough, C.; Hache, F.; Hoolohan, C.; Hultman, M.; et al. Three Decades of Climate Mitigation: Why Haven’t We Bent the Global Emissions Curve? Annu. Rev. Environ. Resour. 2021, 46, 653–689. [Google Scholar] [CrossRef]
  3. Shukla, P.R.; Skea, J.; Slade, R.; Al Khourdaije, A.; Van Diemen, R.; McCollum, D.; Pathak, M.; Some, S.; Vyas, P.; Fradera, R.; et al. (Eds.) IPCC. In IPCC, 2022: Climate Change 2022: Mitigation of Climate Change. Contribution of Working Group III to the Sixth Assessment Report of the Intergovernmental Panel on Climate Change, 1st ed.; Cambridge University Press: Cambridge, UK; New York, NY, USA, 2023; ISBN 978-1-00-915792-6. [Google Scholar]
  4. GCAM Global Change Analysis Model (GCAM); JGCRI/Gcam-Core 2018. Available online: https://gcims.pnnl.gov/modeling/gcam-global-change-analysis-model (accessed on 20 June 2024).
  5. Mistry, A. The (Annoyingly) Slow Pace of Energy Transition. MRS Bull. 2023, 48, 688–689. [Google Scholar] [CrossRef]
  6. Stefes, C.H.; Hager, C. Resistance to Energy Transitions. Rev. Policy Res. 2020, 37, 286–291. [Google Scholar] [CrossRef]
  7. Schreurs, M.A. Competing Perspectives on Energy Transitions: A Global Comparison. Z. Polit. 2020, 30, 113–121. [Google Scholar] [CrossRef]
  8. Hess, D.J. Sustainability Transitions: A Political Coalition Perspective. Res. Policy 2014, 43, 278–283. [Google Scholar] [CrossRef]
  9. Hess, D.J. Energy Transitions in a World of Polarized Politics. In Climate, Science and Society; Routledge: Oxfordshire, UK, 2023; ISBN 978-1-00-340974-8. [Google Scholar]
  10. Alami, I.; Copley, J.; Moraitis, A. The ‘Wicked Trinity’ of Late Capitalism: Governing in an Era of Stagnation, Surplus Humanity, and Environmental Breakdown. Geoforum 2023, 153, 103691. [Google Scholar] [CrossRef]
  11. Devezas, T.; Ruão, H.; Gonçalves, J.; Bento, B.; Liana, H. How Green Is the Green Energy Transition? On the Road to Decarbonization. In Global Challenges of Climate Change; Devezas, T.C., Leitão, J.C.C., Yegorov, Y., Chistilin, D., Eds.; World-Systems Evolution and Global Futures; Springer: Cham, The Netherlands, 2022; Volume 1, pp. 9–28. ISBN 978-3-031-16469-9. [Google Scholar]
  12. BP Statistical Review of World Energy 2022; Whitehouse Associates: London, UK, 2022.
  13. Taylor, M. Energy Subsidies: Evolution in the Global Energy Transformation to 2050; International Renewable Energy Agency: Abu Dhabi, UAE, 2020; p. 64. [Google Scholar]
  14. Tick, A.; Akaev, A.; Devezas, T.C.; Sarygulov, A.; Petryakov, A.; Evgenevich, A.I. Assessing Decarbonization Approaches across Major Economies. Energies 2024, 17, 4381. [Google Scholar] [CrossRef]
  15. Devezas, T.; LePoire, D.; Matias, J.C.O.; Silva, A.M.P. Energy Scenarios: Toward a New Energy Paradigm. Futures 2008, 40, 1–16. [Google Scholar] [CrossRef]
  16. Akaev, A.A.; Davydova, O.I. A Mathematical Description of Selected Energy Transition Scenarios in the 21st Century, Intended to Realize the Main Goals of the Paris Climate Agreement. Energies 2021, 14, 2558. [Google Scholar] [CrossRef]
  17. UN The Paris Agreement. UNFCCC. Available online: https://unfccc.int/process-and-meetings/the-paris-agreement (accessed on 30 August 2023).
  18. Hindin, D.A. The Root Causes of Our Environmental Crises We Ignore. In Global Challenges of Climate Change; Devezas, T.C., Leitão, J.C.C., Yegorov, Y., Chistilin, D., Eds.; World-Systems Evolution and Global Futures; Springer: Cham, The Netherlands, 2023; Volume 2, pp. 1–16. ISBN 978-3-031-16476-7. [Google Scholar]
  19. Harman, C. A People’s History of the World; From the Stone Age to the New Millennium; Verso: London, UK; New York, NY, USA, 2008; ISBN 978-1-84467-238-7. [Google Scholar]
  20. Ashton, A. Climate Change and Cognitive Biases. Psychologist Gold Coast—CBT Professionals 2020. Available online: https://cbtprofessionals.com.au/climate-change-cognitive-biases/ (accessed on 30 January 2022).
  21. Bénard, C.; Blanchette-Sarrasin, A.; Pozzi, A.; Vachon, F. Biais Cognitifs Face Aux Changements Climatiques. Psycause 2019, 9, 7–8. [Google Scholar] [CrossRef]
  22. Vigna, M.D.; Clarke, Z.; Shahab, B.; Gandolfi, A.; Costa, D.; Mehta, N. Carbonomics Security of Supply and the Return of Energy Capex; The Goldman Sachs Group, Inc.: New York, NY, USA, 2022; p. 34. [Google Scholar]
  23. Bozsik, N.; Magda, R.; Bozsik, N. Analysis of Primary Energy Consumption, for the European Union Member States. Acta Polytech Hung 2023, 20, 89–108. [Google Scholar] [CrossRef]
  24. Global Wind Atlas Global Wind Atlas. Available online: https://globalwindatlas.info/en (accessed on 3 December 2023).
  25. Yang, Z.; Liu, H.; Yuan, Y.; Li, M. Can Renewable Energy Development Facilitate China’s Sustainable Energy Transition? Perspective from Energy Trilemma. Energy 2024, 304, 132160. [Google Scholar] [CrossRef]
  26. IEA Energy in India Today—India Energy Outlook 2021—Analysis. Available online: https://www.iea.org/reports/india-energy-outlook-2021/energy-in-india-today (accessed on 3 December 2023).
  27. Ma, X.; Song, C.; Zhao, C.; Zhao, Z.; Deng, B.; Liu, Z. The Role of BRICS Countries in the Optimal Low-Carbon Transition Path for Sustainable Development. J. Clean. Prod. 2024, 460, 142583. [Google Scholar] [CrossRef]
  28. Solarin, S.A.; Bello, M.O.; Tiwari, A.K. The Impact of Technological Innovation on Renewable Energy Production: Accounting for the Roles of Economic and Environmental Factors Using a Method of Moments Quantile Regression. Heliyon 2022, 8, e09913. [Google Scholar] [CrossRef]
  29. Buktukov, N.S.; Gumennikov, E.S. Alternative energy in solving the problems of achieving carbon neutrality (review on the example of Kazakhstani conditions). In Proceedings of the International Conference “Innovations in Alternative Energy: Production and Accumulation”, Dubna, Russia, 22–23 November 2022; pp. 4–7. [Google Scholar]
  30. Filipović, S.; Orlov, A.; Panić, A.A. Key Forecasts and Prospects for Green Transition in the Region of Central Asia beyond 2022. Energy Sustain. Soc. 2024, 14, 25. [Google Scholar] [CrossRef]
  31. Beka, A.; Abazi Alili, H.; Noveski, V. Relationship between Renewable Energy, Technological Innovation, and Economic Indicators of Green Growth: Comparative Analysis of the OECD and Western Balkan Regions. Multidiscip. Sci. J. 2024, 6, 2024265. [Google Scholar] [CrossRef]
  32. Ignjatović, J.; Filipović, S.; Radovanović, M. Challenges of the Green Transition for the Recovery of the Western Balkans. Energy Sustain. Soc. 2024, 14, 2. [Google Scholar] [CrossRef]
  33. Hunt, L.C.; Kipouros, P.; Lamprakis, Z. The Drivers of Renewable Energy: A Global Empirical Analysis of Developed and Developing Countries. Energies 2024, 17, 2902. [Google Scholar] [CrossRef]
  34. Marchetti, C. Primary Energy Substitution Models: On the Interaction between Energy and Society. Technol. Forecast. Soc. Chang. 1977, 10, 345–356. [Google Scholar] [CrossRef]
  35. Ausubel, J.H. The Environment for Future Business: Efficiency Will Win. Pollut. Prev. Rev. 1998, 8, 39–53. [Google Scholar] [CrossRef]
  36. Smil, V. Perils of Long-Range Energy Forecasting. Technol. Forecast. Soc. Chang. 2000, 65, 251–264. [Google Scholar] [CrossRef]
  37. IEA. World Energy Investment 2023; IEA: Paris, France, 2023. [Google Scholar]
  38. Bloomberg NEF Clean Energy Investment Exceeded $300 Billion Once Again in 2018. BloombergNEF, 2019. Available online: https://data.bloomberglp.com/professional/sites/24/BNEF-Clean-Energy-Investment-Trends-2018.pdf (accessed on 24 June 2023).
  39. Fernández, L. Clean Energy Investment Worldwide by Major Country 2019. Available online: https://www.statista.com/statistics/799098/global-clean-energy-investment-by-country/ (accessed on 10 March 2023).
  40. Louw, A. Clean Energy Investment Trends. Bloomberg NEF. 2018, p. 76. Available online: https://ubrabio.com.br/wp-content/uploads/2018/05/BNEF-Clean-Energy-Investment-Investment-Trends-2017.pdf (accessed on 20 June 2023).
  41. Frankfurt School—UNEP/BNEF 2020 Global Trends in Renewable Energy Investments 2020. Available online: https://www.fs-unep-centre.org/wp-content/uploads/2020/06/GTR_2020.pdf (accessed on 10 January 2023).
  42. Koonin, S.E. Unsettled: What Climate Science Tells Us, What It Doesn’t, and Why It Matters; BenBella Books: Dallas, TX, USA, 2021; ISBN 978-1-950665-79-2. [Google Scholar]
  43. Orlov, A.; Sillmann, J.; Vigo, I. Better Seasonal Forecasts for the Renewable Energy Industry. Nat. Energy 2020, 5, 108–110. [Google Scholar] [CrossRef]
  44. Cathcart, R. 17 Largest Solar Farms in The World. Available online: https://solarfast.co.uk/blog/17-largest-solar-farms-in-the-world/ (accessed on 23 August 2023).
  45. GWEC China Installed Half of New Global Offshore Wind Capacity during 2020 in Record Year 2021. Available online: https://gwec.net/china-installed-half-of-new-global-offshore-wind-capacity-during-2020-in-record-year/ (accessed on 23 March 2023).
  46. Hansen, S.B. Ten Gigantic Wind Farms. Discover Cleantech. 2023. Available online: https://discovercleantech.com/ten-gigantic-wind-farms/ (accessed on 23 August 2023).
  47. Power Technology Roscoe Wind Farm, Texas, US. Power Technology. 2023. Available online: https://www.power-technology.com/projects/roscoe-wind-farm/ (accessed on 7 September 2023).
  48. Ray, D. Lazard’s Levelized Cost of Energy Analysis—Version 15.0 2021. Available online: https://www.lazard.com/media/sptlfats/lazards-levelized-cost-of-energy-version-150-vf.pdf (accessed on 10 April 2023).
  49. Garfield, L. Here’s How Much of the World Would Need to Be Covered in Wind Turbines to Power the Planet. Available online: https://www.businessinsider.com/how-many-wind-turbines-would-it-take-to-power-the-world-2016-10 (accessed on 23 August 2023).
  50. IEA. Global EV Outlook 2024; IEA: Paris, France, 2024; p. 174. [Google Scholar]
  51. Statista Electric Vehicles Worldwide—Statistics & Facts. Available online: https://www.statista.com/topics/1010/electric-mobility/ (accessed on 9 July 2024).
  52. Ritchie, H.; Roser, M. Tracking Global Data on Electric Vehicles. Available online: https://ourworldindata.org/electric-car-sales (accessed on 9 July 2024).
  53. Koltsaklis, N.; Knápek, J. The Role of Flexibility Resources in the Energy Transition. Acta Polytech. Hung. 2023, 20, 137–158. [Google Scholar] [CrossRef]
  54. Moodis, T. The Preponderance of Electric Vehicles and the Availability of “Green” Electricity. In Global Energy Transition and Sustainable Development Challenges: Models, Regions, Scenarios, Materials and Technologies; Devezas, T., Leitão, J.C.C., Sarygulov, A., LePoire, D., Khusainov, B., Eds.; Springer Nature: Cham, The Netherlands, 2024; Volume 2, to be published. [Google Scholar]
  55. Rodrigue, J.-P. The Geography of Transport Systems, 5th ed.; Routledge: Oxfordshire, UK, 2020; ISBN 978-0-429-34632-3. [Google Scholar]
  56. Rodrigue, J.-P. World Automobile Production and Fleet, 1965–2021. The Geography of Transport Systems World Automobile Production and Fleet. 2022. Available online: https://transportgeography.org/contents/chapter5/road-transportation/automobile-production-fleet-world/ (accessed on 30 August 2023).
  57. Paulikas, D.; Katona, D.S.; Ilves, E.; Stone, D.G.; O’Sullivan, A. Where Should Metals for the Green Transition Come from? 2020, p. 172. Available online: https://www.autoevolution.com/pdf/news_attachements/ocean-floor-could-be-the-next-el-dorado-for-ev-battery-raw-materials-142915.pdf (accessed on 23 August 2023).
  58. S&P Global. S&P Global Platts Analytics Releases Its 2022 Energy Outlook. Available online: https://press.spglobal.com/2021-12-13-S-P-Global-Platts-Analytics-Releases-its-2022-Energy-Outlook (accessed on 24 August 2023).
  59. Devezas, T. The Struggle SARS-CoV-2 vs. Homo Sapiens–Why the Earth Stood Still, and How Will It Keep Moving On? Technol. Forecast. Soc. Chang. 2020, 160, 120264. [Google Scholar] [CrossRef] [PubMed]
  60. Placek, M. Size of the Global Shipbuilding Market in 2020 and 2021, with a Forecast through 2030. Available online: https://www.statista.com/statistics/1102252/size-of-the-global-shipbuilding-market/ (accessed on 24 August 2023).
  61. Graedel, T.E.; Harper, E.M.; Nassar, N.T.; Nuss, P.; Reck, B.K. Criticality of Metals and Metalloids. Proc. Natl. Acad. Sci. USA 2015, 112, 4257–4262. [Google Scholar] [CrossRef]
  62. The Role of Critical Minerals in Clean Energy Transitions. 2022. Available online: https://iea.blob.core.windows.net/assets/ffd2a83b-8c30-4e9d-980a-52b6d9a86fdc/TheRoleofCriticalMineralsinCleanEnergyTransitions.pdf (accessed on 29 January 2024).
  63. Nassar, N.T.; Graedel, T.E.; Harper, E.M. By-Product Metals Are Technologically Essential but Have Problematic Supply. Sci. Adv. 2015, 1, e1400180. [Google Scholar] [CrossRef]
  64. Pitron, G. The Rare Metals War: The Dark Side of Clean Energy and Digital Technologies; Scribe Publications: Melbourne, VIC, Australia, 2020; ISBN 978-1-912854-26-4. [Google Scholar]
  65. Erdei-Gally, S.; Valisoylu, V. Natural Resources: Can the Oil and Gas Industry Continue to Support Further Economic Development? Acta Polytech. Hung. 2023, 20, 33–51. [Google Scholar] [CrossRef]
  66. Shockley, W.; Queisser, H.J. Detailed Balance Limit of Efficiency of p-n Junction Solar Cells. J. Appl. Phys. 1961, 32, 510–519. [Google Scholar] [CrossRef]
  67. Geisz, J.F.; France, R.M.; Schulte, K.L.; Steiner, M.A.; Norman, A.G.; Guthrey, H.L.; Young, M.R.; Song, T.; Moriarty, T. Six-Junction III–V Solar Cells with 47.1% Conversion Efficiency under 143 Suns Concentration. Nat. Energy 2020, 5, 326–335. [Google Scholar] [CrossRef]
  68. Solargis Global Solar Atlas. Available online: https://globalsolaratlas.info/map?c=11.523088,8.4375,3 (accessed on 12 April 2023).
  69. IRENA. Renewable Power Generation Costs in 2021; International Renewable Energy Agency: Abu Dabhi, United Arab Emirates, 2022; ISBN 978-92-9260-452-3. [Google Scholar]
  70. Way, R.; Ives, M.C.; Mealy, P.; Farmer, J.D. Empirically Grounded Technology Forecasts and the Energy Transition. Joule 2022, 6, 2057–2082. [Google Scholar] [CrossRef]
  71. Akaev, A.A.; Davydova, O.I. The Paris Agreement on Climate Is Coming into Force: Will the Great Energy Transition Take Place? Her. Russ. Acad. Sci. 2020, 90, 588–599. [Google Scholar] [CrossRef]
  72. Clarke, S. Energy Transition Will Move Slowly Over the Next Decade. Available online: https://www.eiu.com/n/energy-transition-will-move-slowly-over-the-next-decade/ (accessed on 9 July 2024).
  73. Cembalest, M. Electravision. In Eye on the Market. 14th Annual Energy Paper; J.P. Morgan: New York, NY, USA, 2024; p. 57. [Google Scholar]
  74. OWD. Share of Primary Energy Consumption from Low-Carbon Sources. Available online: https://ourworldindata.org/grapher/low-carbon-share-energy?tab=chart (accessed on 18 August 2024).
Figure 1. Worldwide energy consumption in TWh by source since 1990 [12].
Energies 17 04789 g001
Figure 2. Worldwide share of energy consumption by source since 1990 [12].
Energies 17 04789 g002
Figure 3. Share of primary energy from low-carbon sources [12].
Energies 17 04789 g003
Figure 4. Research design.
Energies 17 04789 g004
Figure 5. Energy usage trends resulting from the application of the Fisher–Pry logistic substitution model to historical data considering “energy efficiency” as measured by the world’s energy intensity [15] (p. 6).
Energies 17 04789 g005
Figure 6. Energy use expressed in kg of oil equivalent per USD 1000 GDP (in constant 2017 PPP) from 1990 to 2014, according to data from IEA Statistics [37].
Energies 17 04789 g006
Figure 7. An enlarged view of Figure 1 exhibiting the unfolding of the production in TWh of low-carbon energy sources in the last 30 years [12].
Energies 17 04789 g007
Figure 8. The growth of the global fleet of electric cars from 2010 to 2023 (averaging data from [50,51,52]).
Energies 17 04789 g008
Figure 9. Levelized cost of electricity for solar, onshore, and offshore energy systems (data from [69]).
Energies 17 04789 g009
Figure 10. The ranking of the interrelation of the forces (developed by authors).
Energies 17 04789 g010
Figure 11. Logistic fit extrapolation and forecast for the share of primary energy from low-carbon sources up until 2040 (developed by the authors) [12,74].
Energies 17 04789 g011
Figure 12. Forces acting upon slow rhythm of green transition (developed by authors).
Energies 17 04789 g012
Table 1. A list of the top 10 countries using low-carbon energy sources (in the share), source: [12].
#CountryTotal Primary Energy
TWh
Low-Carbon Energy
TWh
Low-Carbon Energy
%
Solar
TWh
Wind TWhHydro TWhNuclear TWhOther RS
TWh
1Iceland49.442.085.020036.205.8
2Norway563.0406.072.110.530.8374.400.3
3Sweden586.9408.969.673.871.5187.0133.313.3
4Switzerland292.3151.851.937.90.495.146.51.9
5France2553.41250.448.9738.296.7151.7952.611.2
6Finland287.5136.947.620.821.541.159.913.6
7Brazil3114.51274.240.9143.8189.1949.436.955.0
8Slovenia73.127.737.890.8012.314.30.3
9New Zealand219.579.836.360.56.963.409.0
10Austria397.2139.935.225.617.7112.104.4
Denmark164.153.932.853.341.9008.7
Portugal253.975.129.585.839.631.003.7
UK1890.6369.419.5432.4168.713.1115.240
Greece289.956.319.4213.527.415.200.2
Table 2. A list of the top 10 countries using low-carbon energy sources (in energy production—TWh). Source: [12].
#CountryTotal Primary Energy
TWh
Low-Carbon Energy
TWh
Low-Carbon Energy
%
Solar TWhWind TWhHydro TWhNuclear TWhOther RS
TWh
1China43,388.67166.016.52855.71715.53401.71023.2169.9
2USA25,259.74243.016.8432.71003.8674.32056.775.5
3Canada3825.81342.635.0913.591.9996.6230.99.7
4Brazil3114.51274.240.9143.8189.1949.436.955.0
5France2553.41250.448.9738.296.7151.7952.611.2
6Russia8690.01133.213.046.16.8561.4558.40.52
7India9736.8922.29.47178.7178.2419.5110.335.5
8Germany3365.6710.421.11128.2308.050.0173.350.9
9Japan4845.6640.013.21225.721.6203.2153.735.8
10South Korea3451.7485.414.0657.18.38.0396.815.2
Table 3. The 10 largest solar farms (solar parks) in the world, source: [44].
No.NameLocationCapacity (GW)Area (km2)
1Golmud Solar ParkChina2.82.59
2Bhadla Solar ParkIndia2.356
3Pavagada Solar ParkIndia2.0552.6
4Mohammed bin Rashid Al Maktoum Solar ParkUAE2.0877
5Benban Solar ParkEgypt1.837.2
6The Tengger Desert Solar ParkChina1.5143
7Noor Abu Dhabi Solar Power ProjectAbu Dhabi (UAE)1.28
8Datong Solar Power Top Runner BaseChina1.710.2
9Jinchuan Solar ParkChina190
10Kurnool Ultra Mega Solar ParkIndia124
Table 4. The 10 largest wind farms/wind parks (onshore and offshore). Source: [45,46,47].
No.NameLocationTypeCapacity (GW)No. of Units
1Gansu Wind FarmJiuquan, western Gansu Province, ChinaOnshore207000
2Dogger Bank Wind FarmNE coast of England, UKOffshore3.6277
3The Jaisalmer wind parkJaisalmer district, Rajasthan, IndiaOnshore1.611,000
4Wind PrimeIowa, USAOnshore/solarWind—2.042
Solar—0.05
5Alta Wind Energy Center/Mojave Wind FarmTehachapi Pass of the Tehachapi Mountains, California, USAOnshore1.55600
6Hornsea 2Yorkshire Coast, UKOffshore1.3165
7The Muppandal Wind FarmKanyakumari district, Tamil Nadu, IndiaOffshore1.53000
8The MacIntyre complexQueensland, AustraliaOnshore1.02180
9Greater Changhua 1 and 2aWest Coast, TaiwanOffshore0.9111
10Roscoe Wind FarmRoscoe, Texas, USAOnshore0.782627
Table 5. The three-fold perspective analysis on the forces acting upon the green transition.
PerspectiveCharacter/NatureImmediate EffectConsequence
Socio-psychologicalHuman evolutionary behaviorDifficulty in perceiving planetary threatsUnconscious disregard for efforts in decarbonization

Delayed transition
Cognitive biasesContempt for climate change
Political–Strategic–TerritorialStrategic mistakeStill large dependence of fossil fuelsArguments about need to take advantage of immense reserves of fossil fuels

Delayed transition
Politicians’ roleAbsence of scientific attitude
Relationship of space/territory/populationInequality among nations
TechnicalEfficiency paradigmSignificantly improving fossil fuel-based energy systems and industrial processesLess energy consumption per capita and per $ GDP
(decoupling)
Delayed transition
Technological drawback #1
Controlling planet’s temperature
Difficulty in meeting objectives of Paris Agreement (Where is set point button?)Chimera difficult to achieve

Delayed transition
Technological drawback #2
Seasonality, environmental considerations, generation capacity
Non-reliability of solar and wind energy, both insufficient to supply whole planetNecessity to explore other alternatives

Delayed transition
Technological drawback #3Transport electrificationVery debatable, perhaps impossible achievement in near futureNecessity to explore other alternatives
Delayed transition
Technological drawback #4
Material availability
Material shortage
Most important bottleneckNecessity to explore other alternatives
Possible
Delayed transition
Technological optimism (based on technological improvement)Possible reduced costs for new renewable energy sources
Net savings accompanying a fast energy transition
Possible achievement stimulating fast transition

Accelerated transition
Disclaimer/Publisher’s Note: The statements, opinions and data contained in all publications are solely those of the individual author(s) and contributor(s) and not of MDPI and/or the editor(s). MDPI and/or the editor(s) disclaim responsibility for any injury to people or property resulting from any ideas, methods, instructions or products referred to in the content.

