Article

Enhanced Solubility and Miscibility of CO2-Oil Mixture in the Presence of Propane under Reservoir Conditions to Improve Recovery Efficiency

1
Department of Petroleum Engineering, Cullen College of Engineering, University of Houston, Houston, TX 77204, USA
2
Department of Chemical and Petroleum Engineering, School of Engineering, University of Kansas, Lawrence, KS 66045, USA
*
Author to whom correspondence should be addressed.
Energies 2024, 17(19), 4790; https://doi.org/10.3390/en17194790
Submission received: 21 July 2024 / Revised: 13 September 2024 / Accepted: 23 September 2024 / Published: 25 September 2024
(This article belongs to the Section H: Geo-Energy)

Abstract

:
The existence of propane (C3H8) in a CO2-oil mixture has great potential for increasing CO2 solubility and decreasing minimum miscibility pressure (MMP). In this study, the enhanced solubility, reduced viscosity, and lowered MMP of CO2-saturated crude oil in the presence of various amounts of C3H8 have been systematically examined at the reservoir conditions. Experimentally, a piston-equipped pressure/volume/temperature (PVT) cell is first validated by accurately reproducing the bubble-point pressures of the pure component of C3H8 at temperatures of 30, 40, and 50 °C with both continuous and stepwise depressurization methods. The validated cell is well utilized to measure the saturation pressures of the CO2-C3H8-oil systems by identifying the turning point on a P-V diagram at a given temperature. Accordingly, the gas solubilities of a CO2, C3H8, and CO2-C3H8 mixture in crude oil at pressures up to 1600 psi and a temperature range of 25–50 °C are measured. In addition, the viscosity of gas-saturated crude oil in a single liquid phase is measured using an in-line viscometer, where the pressure is maintained to be higher than its saturation pressure. Theoretically, a modified Peng–Robinson equation of state (PR EOS) is utilized as the primary thermodynamic model in this work. The crude oil is characterized as both a single and multiple pseudo-component(s). An exponential distribution function, together with a logarithm-type lumping method, is applied to characterize the crude oil. Two linear binary interaction parameters (BIP) correlations have been developed for CO2-oil binaries and C3H8-oil binaries to accurately reproduce the measured saturation pressures. Moreover, the MMPs of the CO2-oil mixture in the presence and absence of C3H8 have been determined with the assistance of the tie-line method. It has been found that the developed mathematical model can accurately calculate the saturation pressures of C3H8 and/or CO2-oil systems with an absolute average relative deviation (AARD) of 2.39% for 12 feed experiments. Compared to CO2, it is demonstrated that C3H8 is more soluble in the crude oil at the given pressure and temperature. The viscosity of gas-saturated crude oil can decrease from 9.50 cP to 1.89 cP and the averaged MMP from 1490 psi to 1160 psi at 50 °C with the addition of an average 16.02 mol% C3H8 in the CO2-oil mixture.

1. Introduction

The injection of CO2 into petroleum reservoirs can increase the oil-recovery factor by reducing the oil viscosity and interfacial tension, swelling the oil volume, extracting light hydrocarbons, and reaching miscibility with in situ crudes [1,2,3], which has been proven to be one of the most promising enhanced oil-recovery (EOR) techniques. The total CO2-enhanced oil production was 273,000 barrels per day and approximately 142 CO2 EOR projects were undertaken in the United States by 2020 [4]. In addition, it can substantially improve oil recovery, reduce greenhouse gas (GHG) emissions, and improve economic benefits because oil reservoirs with sealed cap rocks are ideal spaces for CO2 sequestration. Gozalpour et al. [5] have claimed that up to 60% of the injected CO2 could be stored in a depleted oil reservoir if the produced CO2 was not re-injected in U.S. field projects. The application of CO2 EOR technology not only improves oil recovery but also contributes to reducing greenhouse gas emissions and provides economic benefits by utilizing CO2 sequestration in depleted reservoirs
Previous studies have proven that adding a certain amount of alkane solvents into the CO2 stream is a practical approach to not only further improve the oil-recovery performance but also maintain an acceptable cost. Such an idea has been implemented in heavy crudes and bitumen EOR research. Talbi and Maini [6] have investigated the performance of CH4-C3H8 and CO2-C3H8 as solvents for the vapor extraction (VAPEX) process for the in situ recovery of heavy oil with a viscosity of 4500 cP. It has been found that the CO2-C3H8 mixture provided approximately 45% of the original oil-in-place (OOIP) while the CH4-C3H8 mixture is only 32% OOIP at 600 psig and 21 °C. Moreover, the viscosity of Athabasca bitumen can be significantly reduced from over 1000 cP to 28.8 cP by saturating 11.0 wt% of CO2 and 13.5 wt% of C3H8 at a pressure of 4000 kPa and temperature of 20.2 °C [7]. Li et al. [8] have claimed that adding C3H8 and/or n-C4H10 into the CO2 stream leads to a significant reduction of interfacial tension (IFT) between Lloydminster heavy oil and CO2, which is from 19.92 mN/m to 10.18 mN/m by adding 24.0 mol% C3H8 at 3101 kPa and 21.0 °C and a decrease from 28.31 mN/m to 16.07 mN/m by adding 18.5 mol% n-C4H10 at 1101 kPa and 21.0 °C, respectively. Luo et al. [9] have claimed that a significantly increased solubility from 40.9 sm3/m3 to 52.4 sm3/m3 and an enhanced viscosity reduction from 412 cP to 195 cP of a CO2/heavy oil system can be reached when C3H8 exists at about 4 MPa. Shen et al. [10] showed that the CO2-C3H8 mixture solvent system achieved higher oil-recovery factors compared to pure CO2. They claimed that, compared to a 19.4% recovery factor with pure CO2, the 72% CO2 and 28% C3H8 system achieved up to 23.44% recovery for heavy oil systems. Therefore, the investigation of C3H8’s effects on reservoir fluid phase behavior during CO2-assisted EOR processes is crucial, both from a theoretical standpoint and for practical applications in the field.
The Peng–Robinson equation of state [11,12], i.e., PR EOS, is a common practice widely used for describing the phase behavior of hydrocarbon fluids. Though the Soave–Redlich–Kwong (SRK) Equation of State is also widely used in phased behavior, PR EOS shows better performance for liquid-phase prediction, especially for hydrocarbons or systems involving CO2. SRK EOS is more suitable for predicting gas-phase properties [13,14]. Jaubert and Mutelet [15] have predicted the bubble point pressures of methane-n-decane-n-paraffins ranging from n-C18 to n-C30. They reported an average deviation of 1.4% in 54 bubble point pressures using PR EOS, which is three times better than the deviations obtained by the LCVM model (a linear combination of the Vidal and Michelsen rules) and 28 times better than by MHV2 (a group contribution equation of state based on the modified Huron–Vidal mixing rule) [16]. Li and Yang [17] proposed a new alpha (α) function for the PR EOS and compared it with three other α functions, i.e., the original Soave-type α function [18], and the α functions proposed by Gasem et al. [19] and Nji et al. [20], respectively. They concluded that their new modified α function for the PR EOS is capable of providing a more accurate prediction of vapor pressures with a percentage average absolute deviation of 1.90% for 59 non-hydrocarbon and hydrocarbon compounds. Later on, Li et al. [21,22,23,24] have utilized the aforementioned modified PR EOS to predict the saturation pressure and three phase boundaries of C3H8/n-C4H10-CO2-heavy oil, with an absolute average relative deviation (AARD) of 5.07% and 4.58%, respectively. Additionally, they have found that the AARD decreases with the number of the pseudo-component, indicating treating crude oil as a single pseudo-component may cause erroneous results. Therefore, treating oil as multiple pseudo-components is desirable in phase behavior evaluation for reservoir fluids.
A number of phase behavior studies [25] have been conducted for the mixture of various gases and heavy oil/bitumen where the viscosity of crudes can be as high as 7700 cP. Nevertheless, few attempts have been made to quantify the solubility of CO2, C3H8, and their mixture in the light oils. This is because the miscibility between CO2 and light oil can be easily achieved when the reservoir pressure is higher than its minimum miscibility pressure (MMP). Studies [26,27] have shown that adding alkane solvents into the CO2 stream could remarkably decrease the MMP of CO2-rich oil as well. It is worthwhile noting that the gas solubility can be infinite at miscible conditions. As such, the MMP, instead of the solubility of gas, has commonly been the main focus for CO2 application in light oil reservoirs. However, as for certain shallow light oil reservoirs, the formation pressures are too low to reach the MMP where the immiscible CO2 EOR may occur, e.g., the Arbuckle reservoir in Kansas [28]. Under the immiscible condition, the solubility of the injected gas(es) in oil is a crucial parameter of the EOR performance. Moreover, in reservoirs with higher oil viscosity, lower oil gravity, low permeability, and severe heterogeneity, CO2 miscibility can be achieved at lower pressures by adding C3H8. The increase in miscibility by adding C3H8 can effectively delay gas breakthrough and store more CO2 in the reservoir. Compared to the immiscible case, creating near-miscible or completely miscible conditions by adding C3H8 can increase incremental oil recovery and minimize CO2 breakthrough [29,30]. In addition, sparse viscosity data have been reported for gas–oil mixtures at high pressures and reservoir temperatures due to the restriction of the conventional viscometer.
In this paper, a systematic but very practical study has been conducted to both experimentally and theoretically determine the enhanced solubility, reduced viscosity, and lowered MMP of CO2-saturated light oil in the presence of C3H8 at elevated temperatures. More specifically, the solubilities of 12 feeds of a CO2-C3H8 mixture in the crude oil system are measured by the constant composition expansion method at a temperature range of 25–50 °C. The viscosities of the gas-saturated oil at high pressures are measured using an inline viscometer. An exponential distribution function together with a logarithm-type lumping method is applied to characterize the crude oil into 1–6 pseudo-component s). The exponents in the binary interaction parameter (BIP) correlations from PR EOS [11] for the C3H8-oil and CO2-oil pair are, respectively, tuned to fit the experimentally measured saturation pressures. As a result, three pseudo-components of oil together with a modified PR EOS yield the most accurate computation of the saturation pressures. The validated PR EOS is then applied to predict the MMPs with the assistance of the tie-line method. It is found that the reduction of MMP and viscosity, as well as the improvement of gas solubility in CO2 EOR, can be achieved significantly in the presence of C3H8.

2. Experimental

2.1. Materials

The crude-oil sample was collected from the Trembley area in Kansas, USA. It has a molecular weight of 234.667 g/mol measured by using the freezing-point depression method (Cryette WR, Natick, MA, USA). The Tertiary Oil Recovery Program (TORP), using gas chromatography simulated distillation method, measures the compositional analysis result of Trembley oil. It can be seen that there is no C1–C5, and the heaviest carbon number is C42+. The solvents of CO2 and C3H8 used in this work have purities of 99.999% and 99.99% (Matheson, Las Colinas Irving, TX, USA), respectively.

2.1.1. Viscosity of Trembley Oil

A cone plate viscometer (DV2T, Brookfield Engineering Laboratories, Middleborough, MA, USA) with a measurement accuracy of 1.0% of the full-scale range is used to measure the viscosity of Trembley oil at the temperature range of 25–70 °C. The temperature is controlled by a heated circulating water bath (TC-650, Brookfield Corporation, Middleborough, MA, USA) with an accuracy of ±0.01 °C. At a given shear rate, the viscous drag of the fluid against the spindle that is immersed in the test fluid through a calibrated spring is measured by the spring deflection. The measured and calculated viscosities are plotted in Figure 1. It can be seen that the viscosity of the Trembley oil used in this work is 9.49 cP at 25 °C. The following equation fits the measured viscosity data well, with R2 = 0.9996:
l o g 10 μ = 1.207 l o g 10 T + 2.665
where μ is the oil viscosity in cP, and T is the temperature in °C.

2.1.2. Density of Trembley Oil

The density of Trembley oil is measured at a temperature range of 25–75 °C by using a densitometer (DMA4100M, Anton Paar, Graz, Austria) with an accuracy of ±0.0001 g/cm3. The measured and calculated densities are plotted in Figure 1. The Trembley oil has a density from 0.8552–0.8200 g/cm3 and an API gravity from 32.50–32.33 at a temperature range of 25–75 °C, indicating that a light oil sample is used in this work. The following equation fits the measured density data well, with R2 = 1.0:
ρ = 0.0007 T + 0.8727
where ρ is the oil density in g/cm3, and T is the temperature in °C.

2.2. Experimental Setup

All of the pressure–volume–temperature (PVT) measurements for the C3H8-CO2-oil systems are performed using a PVT cylinder (100ML100MPA, Haian Corporation, Nantong, China), as shown in Figure 2. The PVT cell has an inner diameter of 3.643 cm and a total length of 17.51 cm, while it can sustain pressures up to 100.0 MPa over the temperature range of 10 °C to 150 °C. A floating piston in the PVT cell isolates the test fluid from the hydraulic oil, and a mixer is equipped at the bottom of the PVT cell to stir the mixture by making it rotate. A high-pressure syringe pump (500D, Teledyne ISCO Inc., Lincoln, NE, USA) with an accuracy of ±0.5% is employed to compress the mixture by moving the isolation piston downward/upward in the PVT cell. Two digital pressure gauges (MG1-3000-A-9V-R, SSI Technologies, Inc., Janesville, WI, USA) with an accuracy of ±1.0% are set up at the inlet and outlet of the PVT cell. A vacuum pump (DV-200N, JB Industries, Inc., Aurora, IL, USA) is utilized to put all of the apparatuses into a vacuum state. An in-line viscometer (VISCOpro 2000, PAC Corporation, Boston, MA, USA) equipped inside the air bath is used to measure the viscosity of the oil saturated with a CO2, C3H8, and CO2-C3H8 mixture at high pressures, respectively. It has an accuracy of 1.0% of full scale and has a measurement range of 0.2–20,000 cP. The temperature of the air bath is controlled by a fan heater (AF20-600-120-xx-10-4.7, Farnam Custom Products, Arden, NC, USA), which can maintain a temperature from 25–50 °C. A house-made Labview installed on the computer is used to record the flow rate, time, and pressure of the syringe pump.

2.3. Experimental Procedure

For the PVT system validation, prior to the phase behavior measurement for the gas–oil system, the PVT system is first validated by reproducing the vapor pressure of the pure substance of C3H8. In this work, two experimental procedures have been compared, namely stepwise and continuous depressurization methods. The stepwise method is considered to be more accurate because the equilibrium state should be reached at each pressure stage. However, it is a time-consuming process with the procedure as follows. The fluid is compressed into a single liquid phase with a pressure above its vapor pressure. The pressure in the PVT cylinder is reduced to the desired pressure by withdrawing the hydraulic oil and 5–6 h is sufficient to reach the equilibrium state. The corresponding pressure and volume are recorded. Subsequently, the pressure is further reduced to the next pressure stage by following the same procedure until the vapor pressure can be identified on the measured pressure–volume diagram. A more efficient approach is the continuous depressurization method, where the pressure is continuously reduced by expanding the cell volume at a constant flow rate. In this work, the rate of 3 cm3/h is adopted, since it has been verified in a number of sources in the literature [8,21,22,23,24,31]. Such a method is able to significantly reduce the experimental time.
For the saturation pressure measurement, the saturation pressures of 12 feeds of C3H8-CO2-oil systems are measured. The compositions of 12 feeds and the measuring temperatures are listed in Table 1. It can be seen that three types of fluids are prepared. Feeds #1–4 are the binary systems composed of C3H8 and Trembley oil, while Feeds #5–8 are also the binary systems made up of CO2 and Trembley oil. Feeds #9–12 are ternary systems containing C3H8, CO2, and Trembley oil. Such an experimental design allows us to determine the solubilities of CO2, C3H8, and their mixture in Trembley oil. The measurements of saturation pressure, volume, and temperature have uncertainties of ±5.28 psi, ±0.3 cm3, and ±0.2 °C, respectively. The entire apparatus is first evacuated by a vacuum pump and the temperature of the air bath is set to the desired value at least 12 h prior to the experimental measurement. Then, C3H8 or CO2 gas is charged into the PVT cell. The molar number of the injected gas can be determined based on the gas volume, pressure, and temperature. Subsequently, Trembley oil is pumped from the transfer vessel into the cell to be mixed with the gas. The amount of oil can be read from the syringe pump. The mixture is compressed into a single liquid phase by moving the piston downward. The single liquid phase in the cell can be confirmed by the pressure response when the pressure rapidly increases with a slight decrease in volume due to the extremely small compressibility of liquid. The equilibrium is considered to be achieved when the pressure is stabilized. Subsequently, the mixture is depressurized at the withdrawal rate of 3 cm3/h. Both pressure and cell volume are automatically recorded by the LabView program in real time. The bubble point pressure can be located by the intersection of two distinct linear lines from the pressure–volume diagram. Finally, the PVT cell is cleaned with toluene followed by acetone to be ready for the next feed.
For high-pressure in-line viscosity measurement, the in-line viscometer (VISCOpro 2000, PAC Corporation, MA, USA) is placed inside the air bath. It contains two magnetic coils inside the stainless-steel sensor. A low-mass stainless piston inside the measurement chamber is surrounded by the fluid sample and magnetically forced back and forth. The time required for the piston to move a fixed distance (about 0.2 inches) between two sensors is accurately related to the viscosity of the fluid in the chamber. An increase in viscosity is sensed as a slowed piston travel time. Since the viscosity of a fluid varies significantly with temperature, a platinum resistance temperature detector (RTD) mounted at the base of the measurement chamber is used to continuously measure the temperature. In this work, the viscosities of Feeds #1, 8, and 12 are measured at 25 °C and 1600 psi, which is higher than their saturation pressures. After the mixture is re-compressed into a liquid state and reaches equilibrium, the fluid sample is displaced from the PVT cell to the viscometer to measure the viscosity of the gas-saturated oil at high pressure. The viscosity measurement has an uncertainty of ±0.016 cP.

3. Mathematical Formulations

3.1. Oil Characterization

The properties of critical temperature, critical pressure, molecular weight, specific gravity, and acentric factor are required for each component in the vapor–liquid equilibrium calculations. Trembley oil is a light oil with 0.8485 mol% of the heaviest component C42+, as listed in Table 2. It indicates that splitting the plus fraction is unnecessary for this oil sample. The properties of each single carbon number (SCN) can be calculated from empirical correlations as follows.
  • A constant Watson factor Kw [32] is assumed based on the molecular weight and specific gravity of the oil sample:
    K w 4.5579 M 0.1578 γ 0.84573
    where M and γ are the molecular weight and specific gravity of the oil sample, respectively;
  • Specific gravity for each SCN [33] can be calculated according to the Kw:
    γ i = 6.0108 M i 0.17947 K w 1.18241
    for γ C 42 + ,
    γ C 42 + = z C 42 + M C 42 + i = 1 N z i M i / γ i
    where γ i , M i and z i are the specific gravity, molecular weight, and mole fraction of the ith SCN;
  • The boiling temperature T b R is calculated by using the Soreide [34] correlation, which is a function of γ i and M i
    T b R = 1928.3 1.695 × 10 5 M i 0.03522 γ i 3.266 × e x p 4.922 × 10 3 M i 4.7685 γ i + 3.462 × 10 3 M i γ i
    where T b R is the boiling point temperature in °R;
  • Then, the critical properties and acentric factor of SCN are estimated by the Kesler [35] correlations, which are the function of T b R .
    T c R = 341.7 + 811 γ i + 0.4244 + 0.1174 γ i T b R + 0.4669 3.2623 γ i × 10 5 T b R 1
    P c p s i = e x p { 8.3634 0.0566 γ i 1 0.24244 + 2.898 γ i 1 + 0.118857 γ i 2 × 10 3 T b R + 1.4685 + 3.648 γ i 1 + 0.47227 γ i 2 × 10 7 T b R 2 0.42019 + 1.6977 γ i 2 × 10 10 T b R 3 }
    where T c R is the critical temperature in °R and P c p s i is the critical pressure in psi;
  • Acentric factor ω [36] can be calculated from T b R as well:
    ω = ln P c p s i 14.7 + A 1 + A 2 T b R 1 + A 3 l n T b R + A 4 l n T b R 6 A 5 + A 6 T b R 1 + A 7 l n T b R + A 8 l n T b R 6
    If T b R = T b R / T c R < 0.8 ,
    ω = 7.904 + 0.1352 K w 0.007456 K w 2 + 8.359 T b R + 1.408 0.01063 K w T b R 1
    If T b R = T b R / T c R > 0.8 ,
    where A 1 = 5.92714 , A 2 = 6.09648 , A 3 = 1.28862 , A 4 = 0.169347 , A 5 = 15.2518 , A 6 = 15.6875 , A 7 = 13.4721 , A 8 = 0.43577 .
  • Molecular weight of C42+ can be estimated from its known mass fraction and the number of moles:
    M W C 42 + = w i × m n
    where w i , m, and n are the sample mass fraction, sample mass, and the number of moles of C42+, respectively.

3.2. Lumping

The crude oil may contain hundreds and thousands of components. The iteration of phase equilibrium calculations and computing time will dramatically increase if each component is treated individually. Therefore, it is indispensable to lump the SCNs and represent the oil as multiple pseudo-components (PCs). Appropriate lumping can decrease the simulation time by reducing the number of components and making the fluid properties of the grouped system similar to those from the original system at the same time [37]. Considering the influence of both the molecular weight and the mole fraction of each component, the lumping rule, which states that the summation of the mole fraction times the logarithm of the molecular weight z i l n M i and should be the same for each pseudo-component, has been widely used [38].
The mixing rule [39] employed to assign properties to the lumped pseudo-component is:
η j = i = l u z i M i η i i = l u z i M i
where η j can be any property (e.g., T b , T c , and P c ) for the jth lumped pseudo-component-consisted SCNs from l to u.

3.3. PR EOS Model

PR EOS

Because of its wide application in the petroleum and chemical industries, the PR EOS model is chosen to quantify the phase behavior of C3H8-CO2-oil systems in this work. It is expressed as:
P = R T V b a V V + b + b V b
with
a = a c α
α = 1 + 0.37464 + 1.54226 ω 0.26992 ω 2 1 T r 2
a c = 0.457235 R 2 T c 2 P c
b = 0.0777969 R T c P c
where T r is the reduced temperature, ω is the acentric factor, R is the universal gas constant, P is the pressure, V is the molar volume, and T is the temperature.
Despite the high prediction accuracy of the PR EOS, it shows significant deviations in the α function, especially for compounds with high and low ω values, because a change in saturation pressure can incur an exponential increase error in α [40]. Therefore, many modifications to the α function have been made. Among these modifications, the modified α function proposed by Li and Yang [17] shows great success in describing the phase behavior of both nonhydrocarbon and hydrocarbon compounds:
α = e x p 0.13280 0.05052 ω + 0.25948 ω 2 1 T r + 0.81769 l n 1 + 0.313355 + 1.86745 ω 0.52604 ω 2 1 T r 2
For a mixture system, the following van der Waals mixing rule is used:
a = i = 1 n c j = 1 n c x i x j 1 δ i j a i a j
b = i = 1 n c x j b j
where nc is the number of components in the mixture; x i and x j are the mole fraction of the ith and jth component in the mixture; a and b are calculated from Equations (19) and (20) for the ith and jth components respectively; and δ i j is the binary interaction parameter (BIP) between the ith and jth components. The program used in this work is written by using MATLAB R2023a, where the stability algorithm proposed by Michelsen [41] is applied.
The BIPs between the pseudo-components of the Trembley oil are set to zero due to their similar properties, and the BIP for the CO2-C3H8 pair is set as 0.125 (CMG Winprop 2024). The BIPs between pseudo-components and CO2/C3H8 can be calculated from:
δ i j = 1 2 V c i 1 / 3 V c j 1 / 3 V c i 1 / 3 + V c j 1 / 3 β
where δ i j is the BIP between the ith and jth component, V c is the critical molar volume in m3/kmol, and β is an adjustable parameter.
In this work, β has been tuned to find the optimal BIP to match the experimental data. Based on the optimized BIPs, we propose the following two new BIP correlations for C3H8-pseudo-components and CO2-pseudo-components pairs, respectively.
δ C 3 H 8 P C i = 0.0583 T T C i 0.0109 ω i + 0.3422 γ i 0.2523
δ C O 2 P C i = 0.0096 T T C i 0.0198 ω i + 0.0021 γ i 0.0145
where δ C 3 H 8 P C i is the BIP between C3H8, and PCi, PCi is the ith pseudo-component. T C i , ω i and γ i are the critical temperature in °C, acentric factor, and specific gravity of ith pseudo-component. The standard errors of the coefficients in Equation (22) are 0.0272, 0.0137, 0.0413, and 0.0314, respectively. δ C O 2 P C i is the BIP between CO2 and PCi. The standard errors of the coefficients in Equation (23) are 0.0119, 0.0181, 0.0061, and 0.0137. Note that the proposed correlations (i.e., Equations (22) and (23)) are valid when three or more pseudo-components’ lumping schemes are applied.
According to the measured and calculated saturation pressures, the absolute average relative deviation (AARD) is used in this study to evaluate the prediction accuracy,
A A R D = 1 n i = 1 n P i c a l P i e x p P i e x p
where n is the number of data points, P c a l is the calculated saturation pressure, and P e x p is the measured saturation pressure.

3.4. MMP

The minimum miscibility pressure (MMP) is a significant parameter during gas-assisted EOR processes. The maximum oil recovery can be achieved when the displacement pressure is higher than MMP. As aforementioned, although it may be difficult to achieve CO2-oil miscibility at low reservoir pressures, adding a certain amount of C3H8 in the CO2 stream can lower the MMP between gas and oil so that the miscibility may be reached at lower reservoir pressures. In this work, the MMP is calculated by using the tie line method [42,43,44], which is adopted by CMG:
  • Start with initial equations at the initial pressure and given temperature:
    1 σ 1 x i 1 + σ 1 y i 1 = z i o i l ; i = 1 , 2 , , N
    1 σ N 1 x i N 1 + σ N 1 y i N 1 = z i i n j ; i = 1 , 2 , , N
    where z i o i l is the mole fraction of component i in the original reservoir oil, z i i n j is the mole fraction of component i in injection gas, N is the number of components, x i and y i are the mole fractions of component i in the equilibrium liquid phase and gas phase, respectively, and σ is a parameter that can be anywhere in the interval from to + . In this work, the first guesses of xi and yi are the mole fraction of C3H8 or CO2 or their mixture and Trembley oil;
  • To obtain a set of intersecting tie lines, the following equations are applied:
    1 σ j x i j + σ j y i j = 1 σ j + 1 x i j + 1 + σ j + 1 y i j + 1 ; i = 1 , 2 , , N , j = 1 , 2 , N 1
    x i j φ i L , j = y i j φ i V , j ; i = 1 , 2 , , N , j = 1 , 2 , N 1
    i = 1 N y i j x i j = 0 ; j = 1 , 2 , N 1
    where φ i is the fugacity coefficient of component i in the gas (V) or liquid (L) phase;
  • Increase the pressure slightly. Equations (28) and (29) are solved again using the solution for the previous pressure;
  • Repeat Step #c until one of the tie lines shrinks to a point at which condition is fulfilled for the nth tie line if
    L n = i = 1 N y i n x i n 2 0
    where Ln is the length of one of the tie lines between the injected fluid and oil. The pressure where this happens is the MMP. When the length is zero, the tie line connects two identical critical compositions. Finally, the MMP can be calculated by using the PR EOS with the determined gas fraction (xi) and liquid fraction (yi).

4. Results and Discussions

4.1. PVT Equipment Validation

Table 3 summarizes the measured vapor pressures of pure substance C3H8 by using both continuous and stepwise depressurization methods, respectively. The well-accepted referential value from CMG is used as the true vapor pressure of C3H8, which are 158.4, 190.3, and 226.8 psi at 30, 40, and 50 °C, respectively. As can be seen, the vapor pressures measured by using both continuous and stepwise methods are close to the referential value. It indicates that the PVT equipment is valid for performing the experiments in this work. The errors of the continuous depressurization method are 3.03%, 2.67%, and 2.56%, respectively. Meanwhile, the stepwise depressurization method yields errors of 2.02%, 1.26%, and 1.45%, respectively. In terms of accuracy, as we expected, the time-consuming stepwise method can provide a more accurate measurement, since there is sufficient time for the mixture to reach equilibrium at each pressure stage. However, the errors of the continuous method are slightly higher than that of the stepwise method. Compared with 48 h for the stepwise method, it only takes 3–4 h to measure a vapor pressure point using a continuous method. Therefore, the continuous depressurization method is applied in this work.

4.2. Characterization of Trembley Oil

For the physical and critical properties, the constant Watson factor K w is calculated to be 11.824 by using Equation (3). The Trembley oil is characterized into one to six pseudo-component(s). The physical and critical properties of each pseudo-component in different lumping schemes are tabulated in Table 4. It can be seen that the physical properties of each pseudo-component change with the different lumping schemes.
For the optimum lumping scheme, even though the oil can be lumped as either a single or as multiple pseudo-component(s), as listed in Table 4, an optimum lumping scheme is preferred for determining Trembley oil. The BIPs are tuned to best match the bubble point pressures of Feeds #1–12 by applying each of the six lumping schemes. The optimized exponent β in the BIP formula (see Equation (21)) can be found in Table 5. Subsequently, the AARDs in predicting saturation pressures of all feeds are quantified by using the optimized BIPs. Thus, Figure 3 plots the AARDs as a function of the number of pseudo-components. It is found that the AARDs decrease with the number of pseudo-components for all three systems. Although the minimum AARD is achieved when the six pseudo-components lumping scheme is employed, three pseudo-components are finally selected to perform further calculations in this work because the AARD is only improved slightly, but the computing time increases greatly when more than three pseudo-components are applied. With the lumping scheme of three pseudo-components, the overall AARDs of the C3H8-oil, CO2-oil, and C3H8-CO2-oil systems are 2.88%, 1.34%, and 3.28%, respectively.

4.3. Validation of the Developed BIP Correlations

For BIP optimization, for each lumping scheme, the exponent β in Equation (21) is tuned for C3H8-oi, CO2-oil, and C3H8-CO2-oil mixture, respectively. As for the ternary systems of Feeds #9–12, the BIP between C3H8 and the pseudo-component and the BIP between CO2 and the pseudo-component are tuned separately. As a result, the optimal exponents in each lumping scheme are listed in Table 5. It shows that the BIP is affected by both the temperature and the lumping scheme.
For the validation of the BIP correlations, with the assistance of the optimum exponents in Table 5, two new BIP correlations, i.e., Equations (22) and (23), are, respectively, developed for the C3H8-PC pair and CO2-PC pair when the oil is characterized as three or more PCs. Figure 3 exhibits the overall AARD for C3H8-oil, CO2-oil, and C3H8-CO2-oil systems as a function of the number of pseudo-components. As shown, the largest value of AARD is when applying four pseudo-component lumping schemes for C3H8-oil systems, which is about 4.4%. The rest of the AARDs are all less than 4.0%, implying that these two new correlations are capable of calculating BIP in the phase behavior evaluation. It is noteworthy that these two correlations are applicable for three or more pseudo-component lumping schemes, whereas they are not suitable for single or two pseudo-component(s) lumping schemes, which have an overall AARD greater than 30%. In general, Equations (22) and (23) are able to estimate the BIP between CO2-oil and C3H8-oil for more than three pseudo-components with acceptable AARDs.

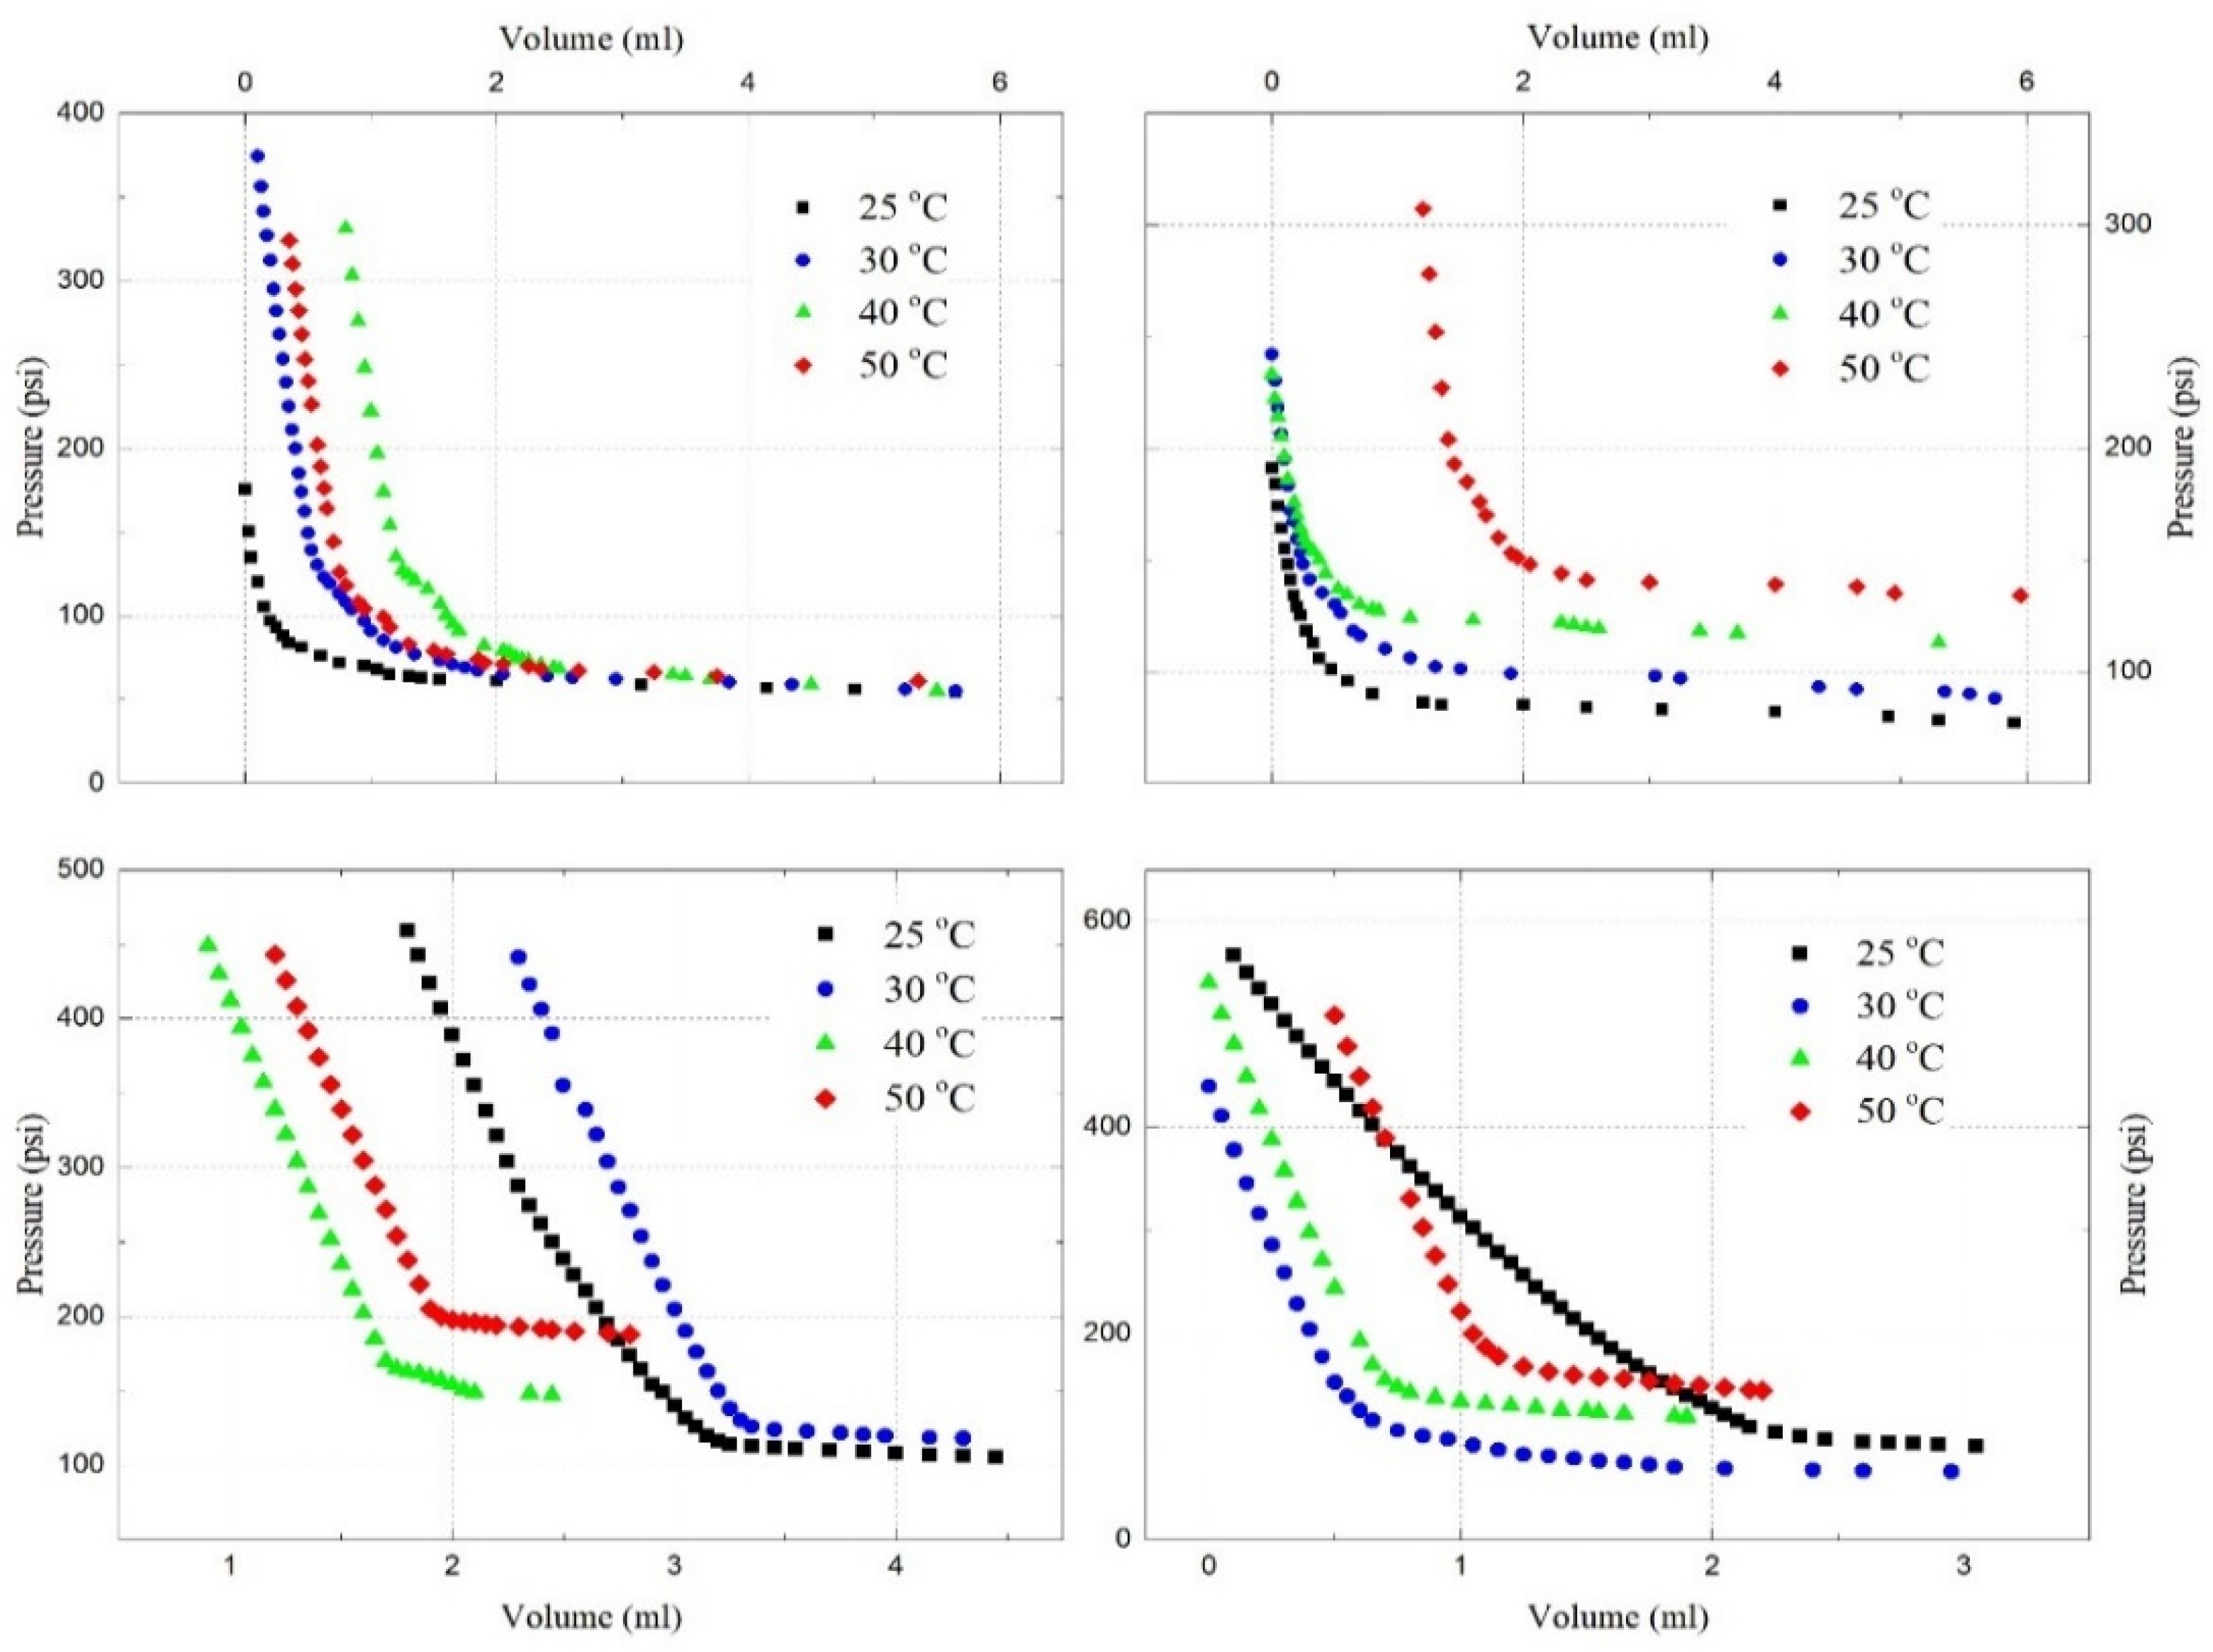
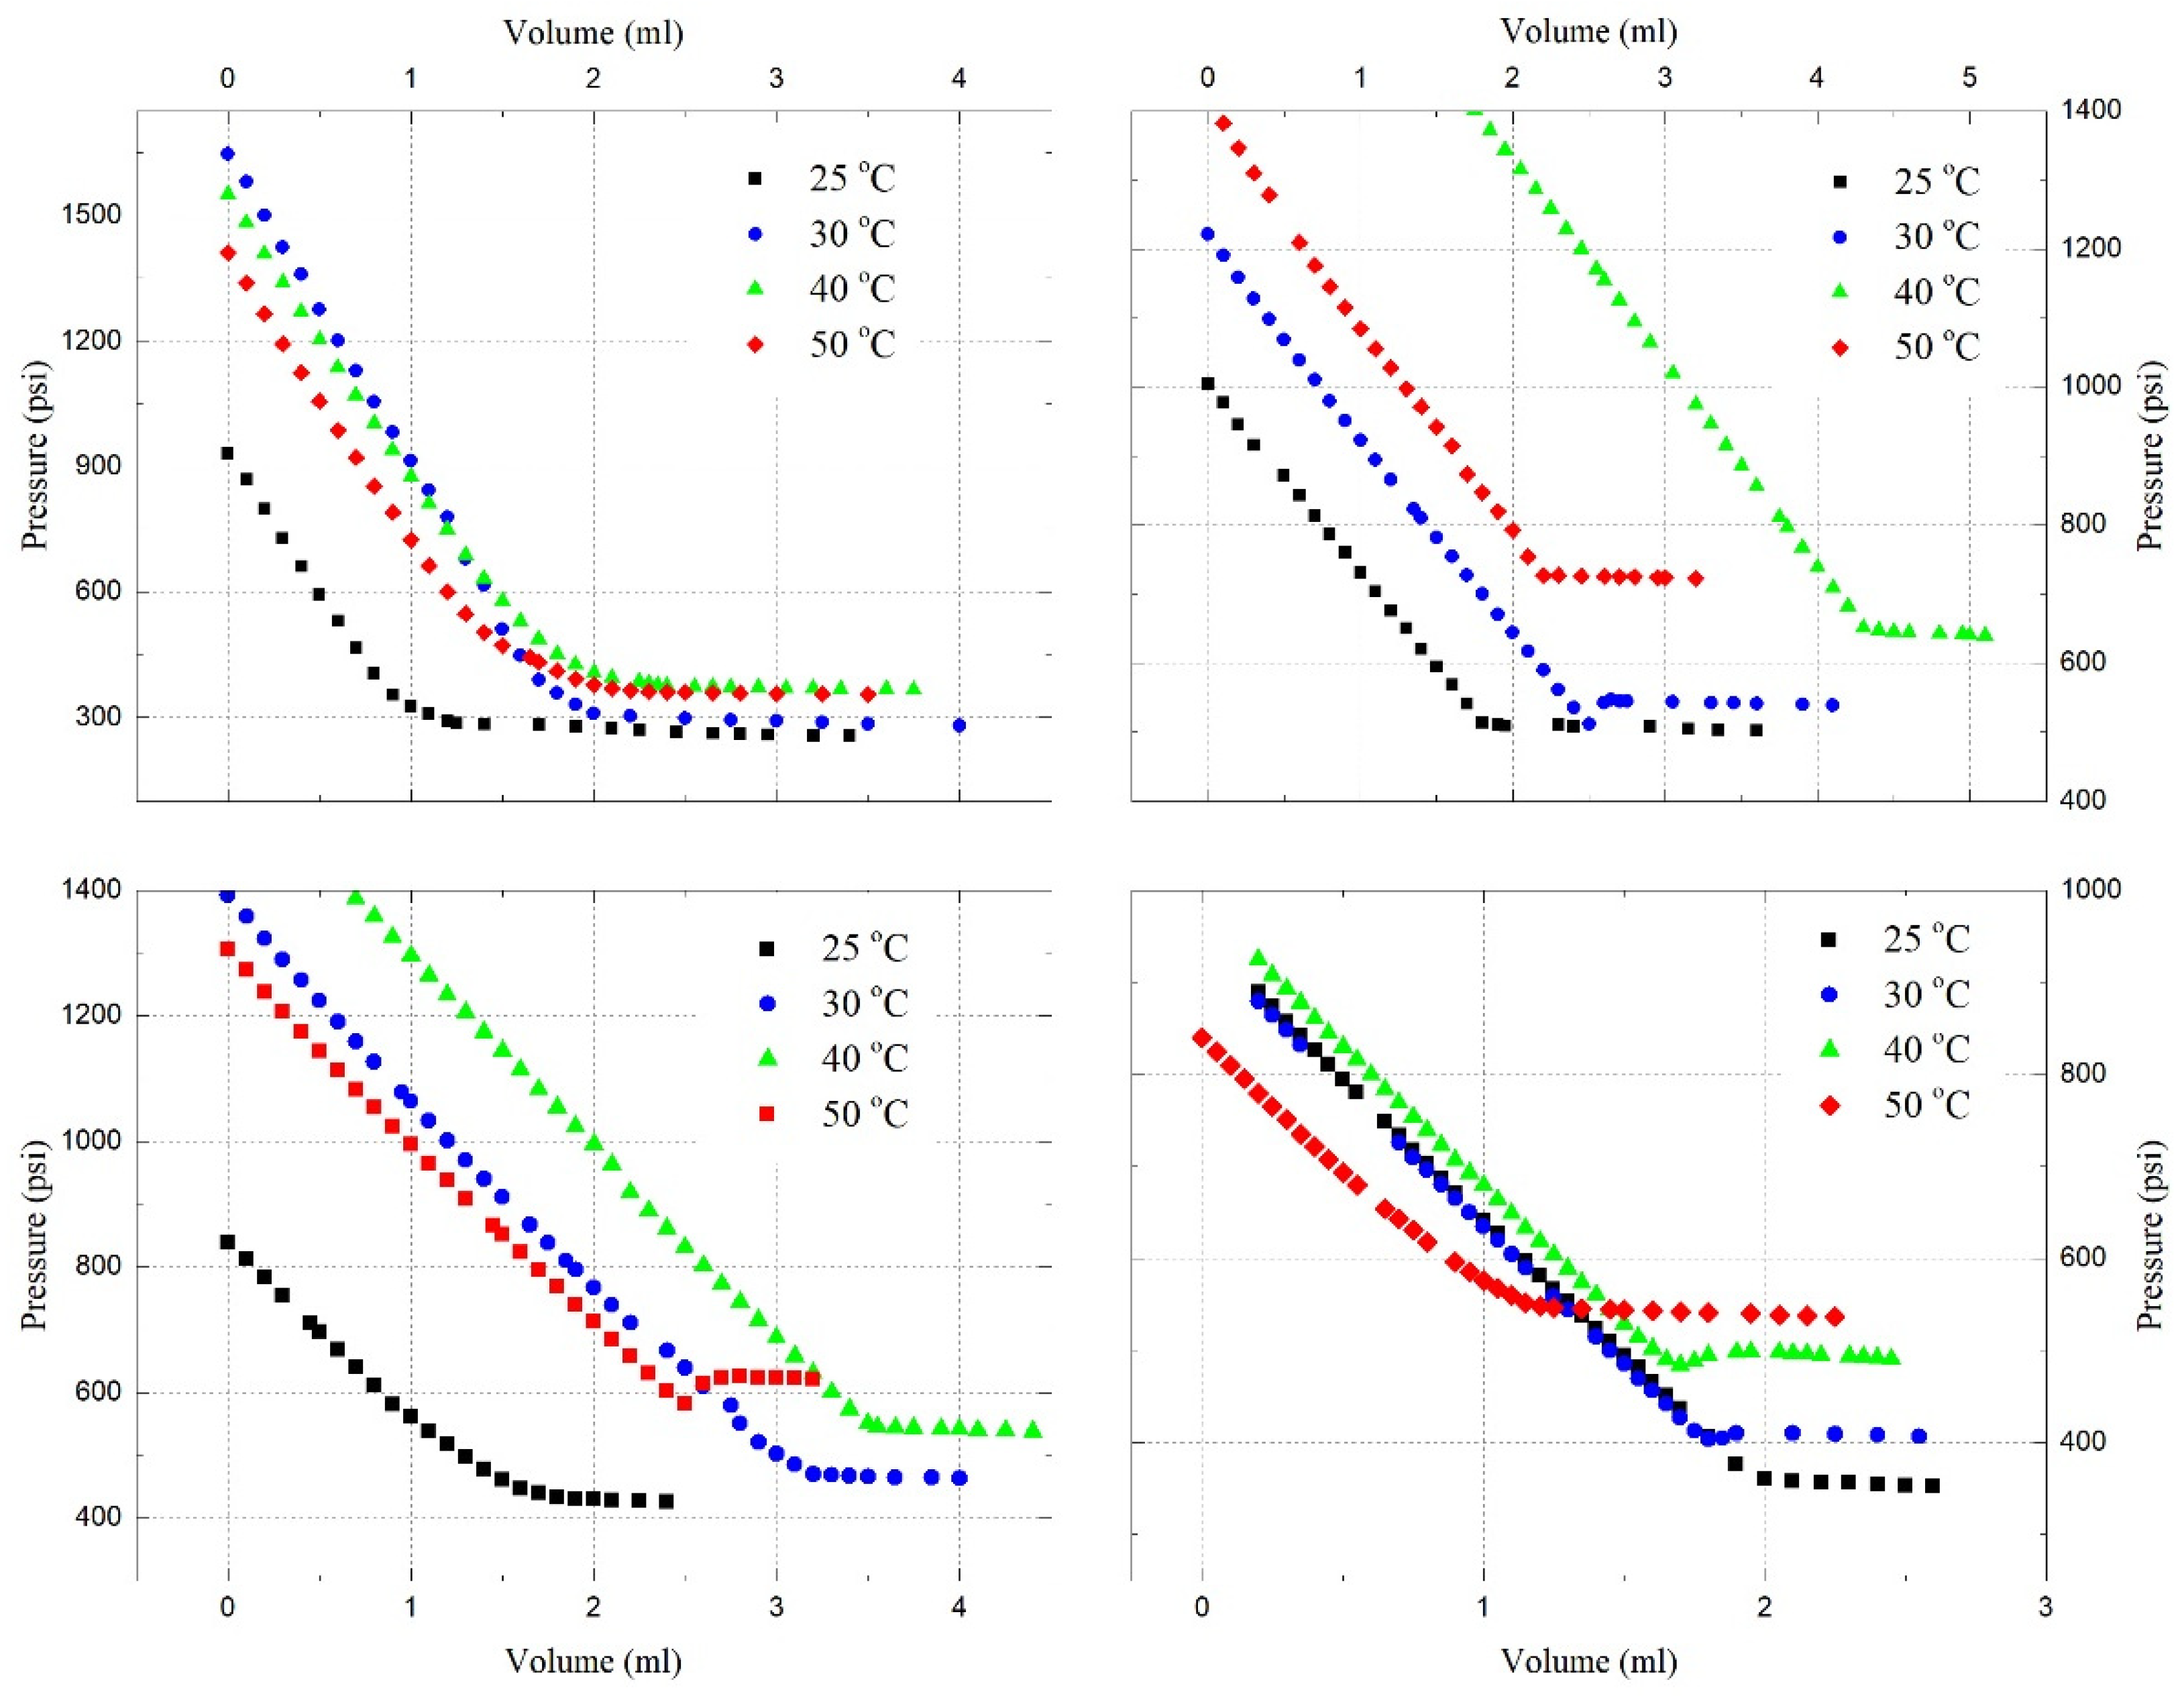
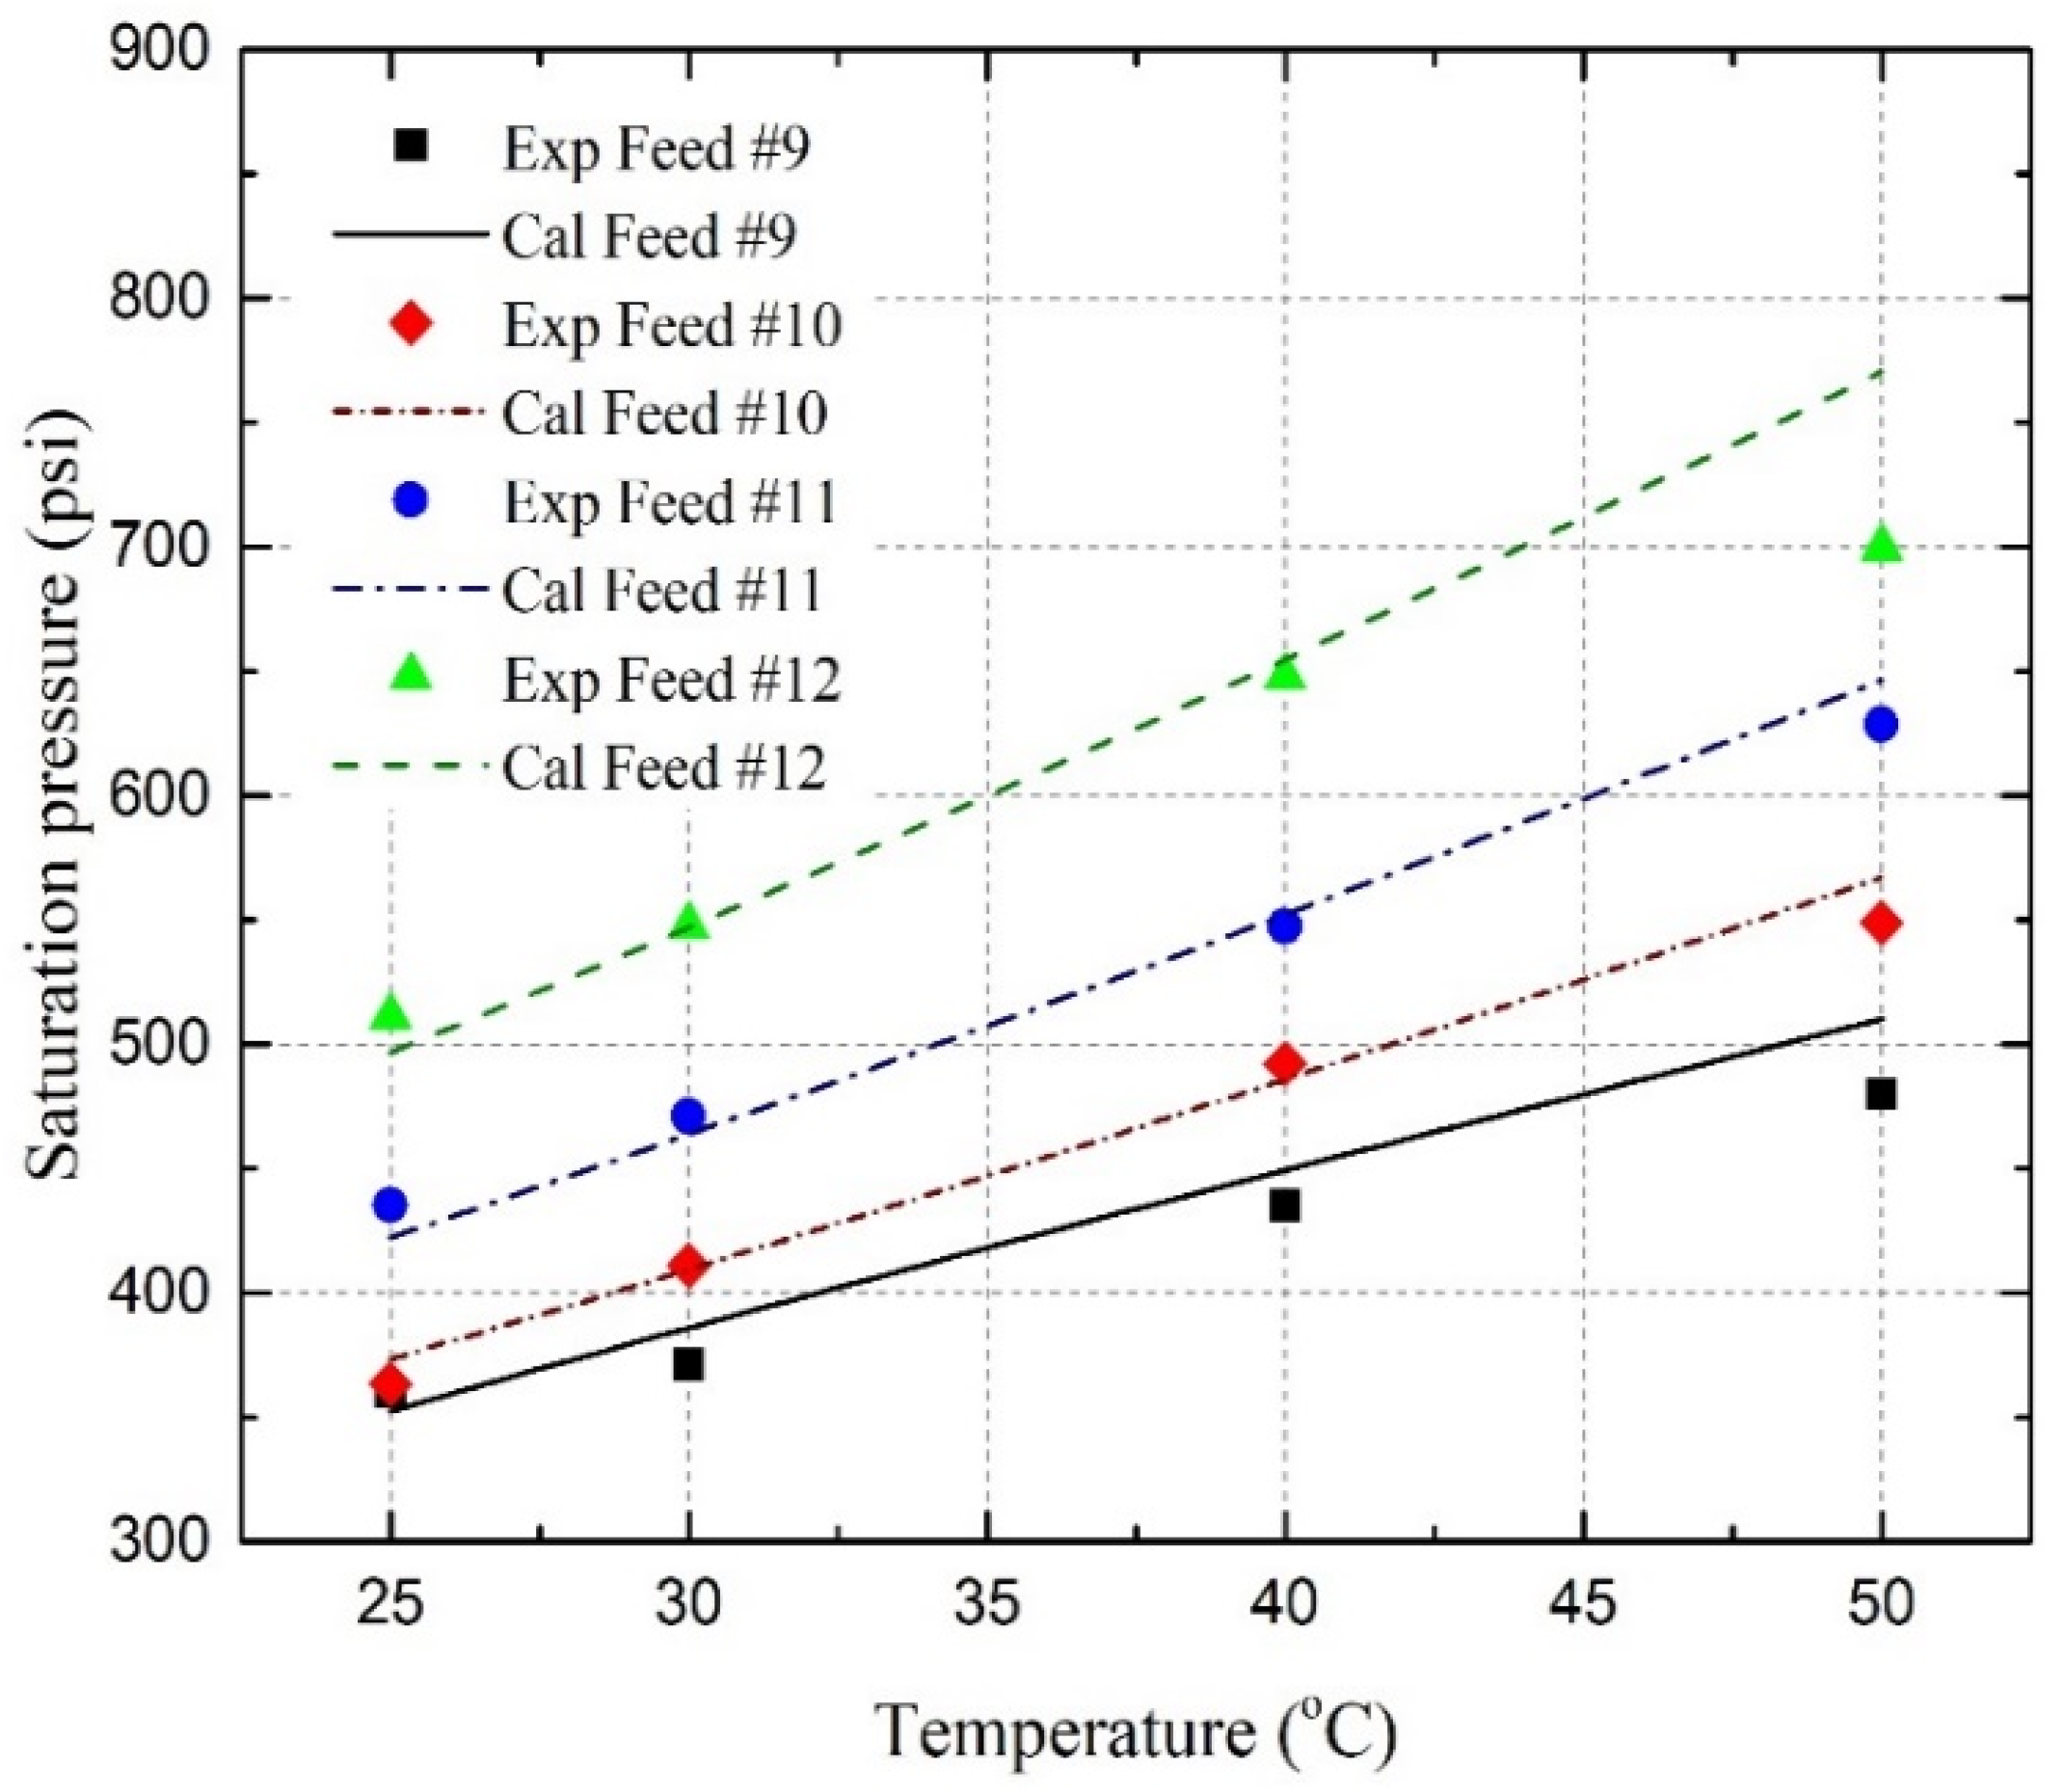
4.4. Saturation Pressure and Solubility

As aforementioned, the intersection of two trend linear lines on a P-V diagram represents the bubble point. Figure 4 plots the measured pressure versus volume for Feed #4 (72.21 mol% C3H8, 27.79 mol% oil) at 50 °C, indicating the bubble point is 199.9 psi. It is noted that the abscissa of the P-V diagram is the withdrawal volume of hydraulic oil. Figure 4 also indicates that the solubility of C3H8 gas in Trembley oil is 60.08 mol% at 199.9 psi and 25 °C. Figure 5, Figure 6 and Figure 7 exhibit the measured P-V diagrams for 12 feeds at 25, 30, 40, and 50 °C, respectively, where both the saturation pressures and solubilities of gas and a gas mixture can be quantified.
For the C3H8-oil binary system, Figure 8 exhibits the measured and calculated saturation pressures for Feeds #1–4 over the temperature range of 25–50 °C. It can be seen that the saturation pressure increases with the temperature. When the C3H8 solubility is 60.08 mol% (Feed #3), for instance, the saturation pressure is raised from 106 psi to 177 psi if the temperature is increased from 25 °C to 50 °C. It indicates that temperature is an important impact factor for saturation pressure. Also, the solubility of C3H8 in Trembley oil can be significantly improved by raising pressure. For example, at a given temperature of 50 °C, the C3H8 solubility changes from 34.62 mol% (Feed #1) to 72.21 mol% (Feed #4) when the pressure increases from 117 psi to 200 psi. In addition, the saturation pressure of the C3H8-oil system increases with the amount of C3H8 for a given temperature. For instance, when the temperature is 25 °C, the saturation pressure for Feed #1 (34.62 mol%) is around 65 psi, while Feed #3 (60.08%) is 118 psi. Overall, the calculated saturation pressures, by using the developed PR EOS model, can reach a good agreement with the measured one, yielding an overall AARD of 2.30% for the 16 data points in Figure 8.
For the CO2-oil binary system, when compared with the C3H8-oil mixture, much higher saturation pressures can be found for the CO2-oil mixture as can be seen in Figure 9. Although Feed #3 and Feed #7 contain similar gas mole fractions in the mixtures (60.08 mol% C3H8 in Feed #3 and 60.39 mol% CO2 in Feed #7), the saturation pressures are measured to be 177 psi and 670 psi at 50 °C for Feed #3 and Feed #7, respectively. It implies that high pressure is required during CO2-assistant EOR processes to reach the maximum swelling effect. At a given temperature of 50 °C, the CO2 solubility is 29.29 mol% at 290 psi (see Feed #5), whereas 73.74 mol% of solubility can be reached when the pressure is up to 920 psi (see Feed #8). Similar to the C3H8-oil system, the saturation pressure increases with the temperature. Taking Feed #8 as an example, an approximate 57% increase in saturation pressure (from 584 to 920 psi) is obtained when the temperature changes from 25 °C to 50 °C. Similar to the C3H8-oil system, the saturation pressure increases with the amount of CO2 in oil for a given temperature. Additionally, the developed BIP correlation (i.e., Equation (23)) incorporated in the PR EOS exhibits excellent performance in the prediction of the saturation pressure, with an overall AARD of 1.62% for the 16 data points in Figure 9.
For the C3H8-CO2-oil ternary system, when compared with CO2-oil binary systems, the saturation pressures of the ternary system are greatly reduced by introducing C3H8 in the system, as presented in Figure 10. Feed #12 consists of 16.16 mol% C3H8 and 57.57 mol% CO2, resulting in a total of 73.73 mol% CO2-C3H8 gas mixture. The saturation pressure of Feed #12 is measured to be 505 psi, which is much lower than the 790 psi of Feed #8, which includes 73.74 mol% pure CO2 gas at the same temperature of 40 °C. Such a finding indicates that adding C3H8 into the CO2 stream can increase the gas solubility in oil and decrease the saturation pressure of the reservoir fluids. It also can be seen that temperature is an important impact factor for the ternary system as well. The saturation pressure increases from 350 psi to 500 psi when the temperature is elevated from 25 °C to 50 °C for Feed #9. Moreover, the pressure has a great impact on gas solubility for Feeds #9–12 at a given temperature. For instance, the solubility of the gas mixture increases from 59.07 mol% (Feed #9) to 73.73 mol% (Feed #12) with the pressure changing from 435 psi to 648 psi at 40 °C. It is noteworthy that the measured saturation pressure for Feed #12 at 50 °C is abnormal, which may be caused by the non-equilibrium state of the system. However, the overall AARD for the four feeds in Figure 10 is 3.26%, yielding an acceptable prediction result. Finally, the overall AARD for all 12 feeds is found to be 2.39%, which illustrates the capability of two newly developed BIP correlations.
In addition, Figure 11 plots the measured data in terms of the solubility of CO2, C3H8, and their mixture as a function of saturation pressure at 25 °C. The dashed lines representing the regressions of solubility show an excellent agreement with the measured data points, with R2 of 0.9855, 0.9352, and 0.9986 for C3H8, the C3H8-CO2 mixture, and CO2, respectively. It can be seen that the gas solubility increases with pressure at a given temperature for all three systems. Furthermore, C3H8 has the highest solubility, while CO2 has the lowest one at the same pressure and temperature. For example, at 400 psi, the solubility of CO2 is 65 mol%, and C3H8 has a solubility far greater than 100 mol% according to the regression equation, indicating the MMP between C3H8 and Trembley oil might have already been reached at this given pressure of 400 psi. The solubility of their mixture, however, exhibits a value of 75 mol%, higher than that of CO2 (65 mol%) at the same pressure. Such results reconfirm that C3H8 has a higher solubility than CO2 in Trembley oil. Therefore, adding a certain amount of C3H8 in CO2 can improve the CO2 EOR performance at an acceptable cost.

4.5. Viscosity of the Gas-Saturated Oil at High Pressures

After the saturation pressure measurements, the viscosities of Feeds #1, 8, and 12 have been measured above their saturation pressures using an in-line viscometer at 25 °C. The viscosity results are listed in Table 6. In this study, a pressure of 1600 psi is selected to measure the viscosities, since all three mixtures are in a single liquid phase at such a high pressure. The viscosity of dead oil at 1600 psi and room pressure are 9.50 cP and 9.49 cP, respectively. The viscosities of gas-saturation oil mixtures are measured to be 2.33 cP (Feed #1), 3.03 cP (Feed #8), and 1.89 cP (Feed #12) at 1600 psi, respectively. Compared with the Trembley oil without solution gas, it is found that the viscosities of gas-saturation mixtures are reduced by adding C3H8 or CO2 or their mixture.

4.6. Miscibility between Gas and Oil

The MMPs are also computed using the tie-line method in CMG with three pseudo-components lumping scheme. Figure 12 exhibits the average simulated MMPs under temperature ranges from 25 °C to 50 °C. The y-axis is the average simulated MMP of C3H8-oil for Feeds #1–4 (average C3H8 of 53.36 mol%), CO2-oil for Feeds #5–8 (average CO2 of 52.69 mol%), and C3H8-CO2-oil for Feeds #9–12 (average C3H8 of 16.02 mol% and CO2 of 48.96 mol%). Generally, C3H8-oil systems indicate the smallest MMPs, while CO2-oil systems show the largest MMPs. The average MMPs for C3H8-oil systems are predicted from 150 psi to 250 psi at a temperature range of 25–50 °C, whereas the MMPs for CO2-oil systems can be as high as 950–1500 psi. The presence of C3H8 (average C3H8 of 16.02 mol%) in the CO2-oil system can lower the MMP from 1490 psi to 1160 psi at 50 °C. It means that it is easier to achieve the miscible condition with the assistance of C3H8 during CO2 EOR processes. Hence, it is feasible to implement the miscible gas EOR, even in shallow reservoirs with low reservoir pressures.
When C3H8 is added to a CO2-oil mixture, it lowers the MMP by altering the structure and interactions of the crude-oil components. C3H8 is highly soluble in oil and mixes well with hydrocarbons, especially lighter fractions, which reduces phase segregation and improves the uniformity of the oil phase. This enhanced mixing allows CO2 to dissolve more easily into the oil, aided by the reduction in interfacial tension between CO2 and the oil. Additionally, C3H8 causes the oil to swell, increasing its volume and providing more space for CO2 to diffuse, further facilitating miscibility at lower pressures. C3H8 also modifies the critical properties and phase behavior of the CO2-oil system, making the oil phase less dense and altering the phase boundaries, which shifts the conditions needed for miscibility. These changes lead to a lower MMP because the fluid system can achieve a single miscible phase more easily, making propane a valuable additive for EOR processes using CO2 injection.

5. Conclusions

By systematically investigating the effects of C3H8 on CO2-saturated crude oil, this study provides crucial insights into optimizing CO2 EOR processes, demonstrating the practical benefits of using C3H8 to enhance recovery efficiency under various reservoir conditions. The important highlights of this work are summarized by the following key points.
(1)
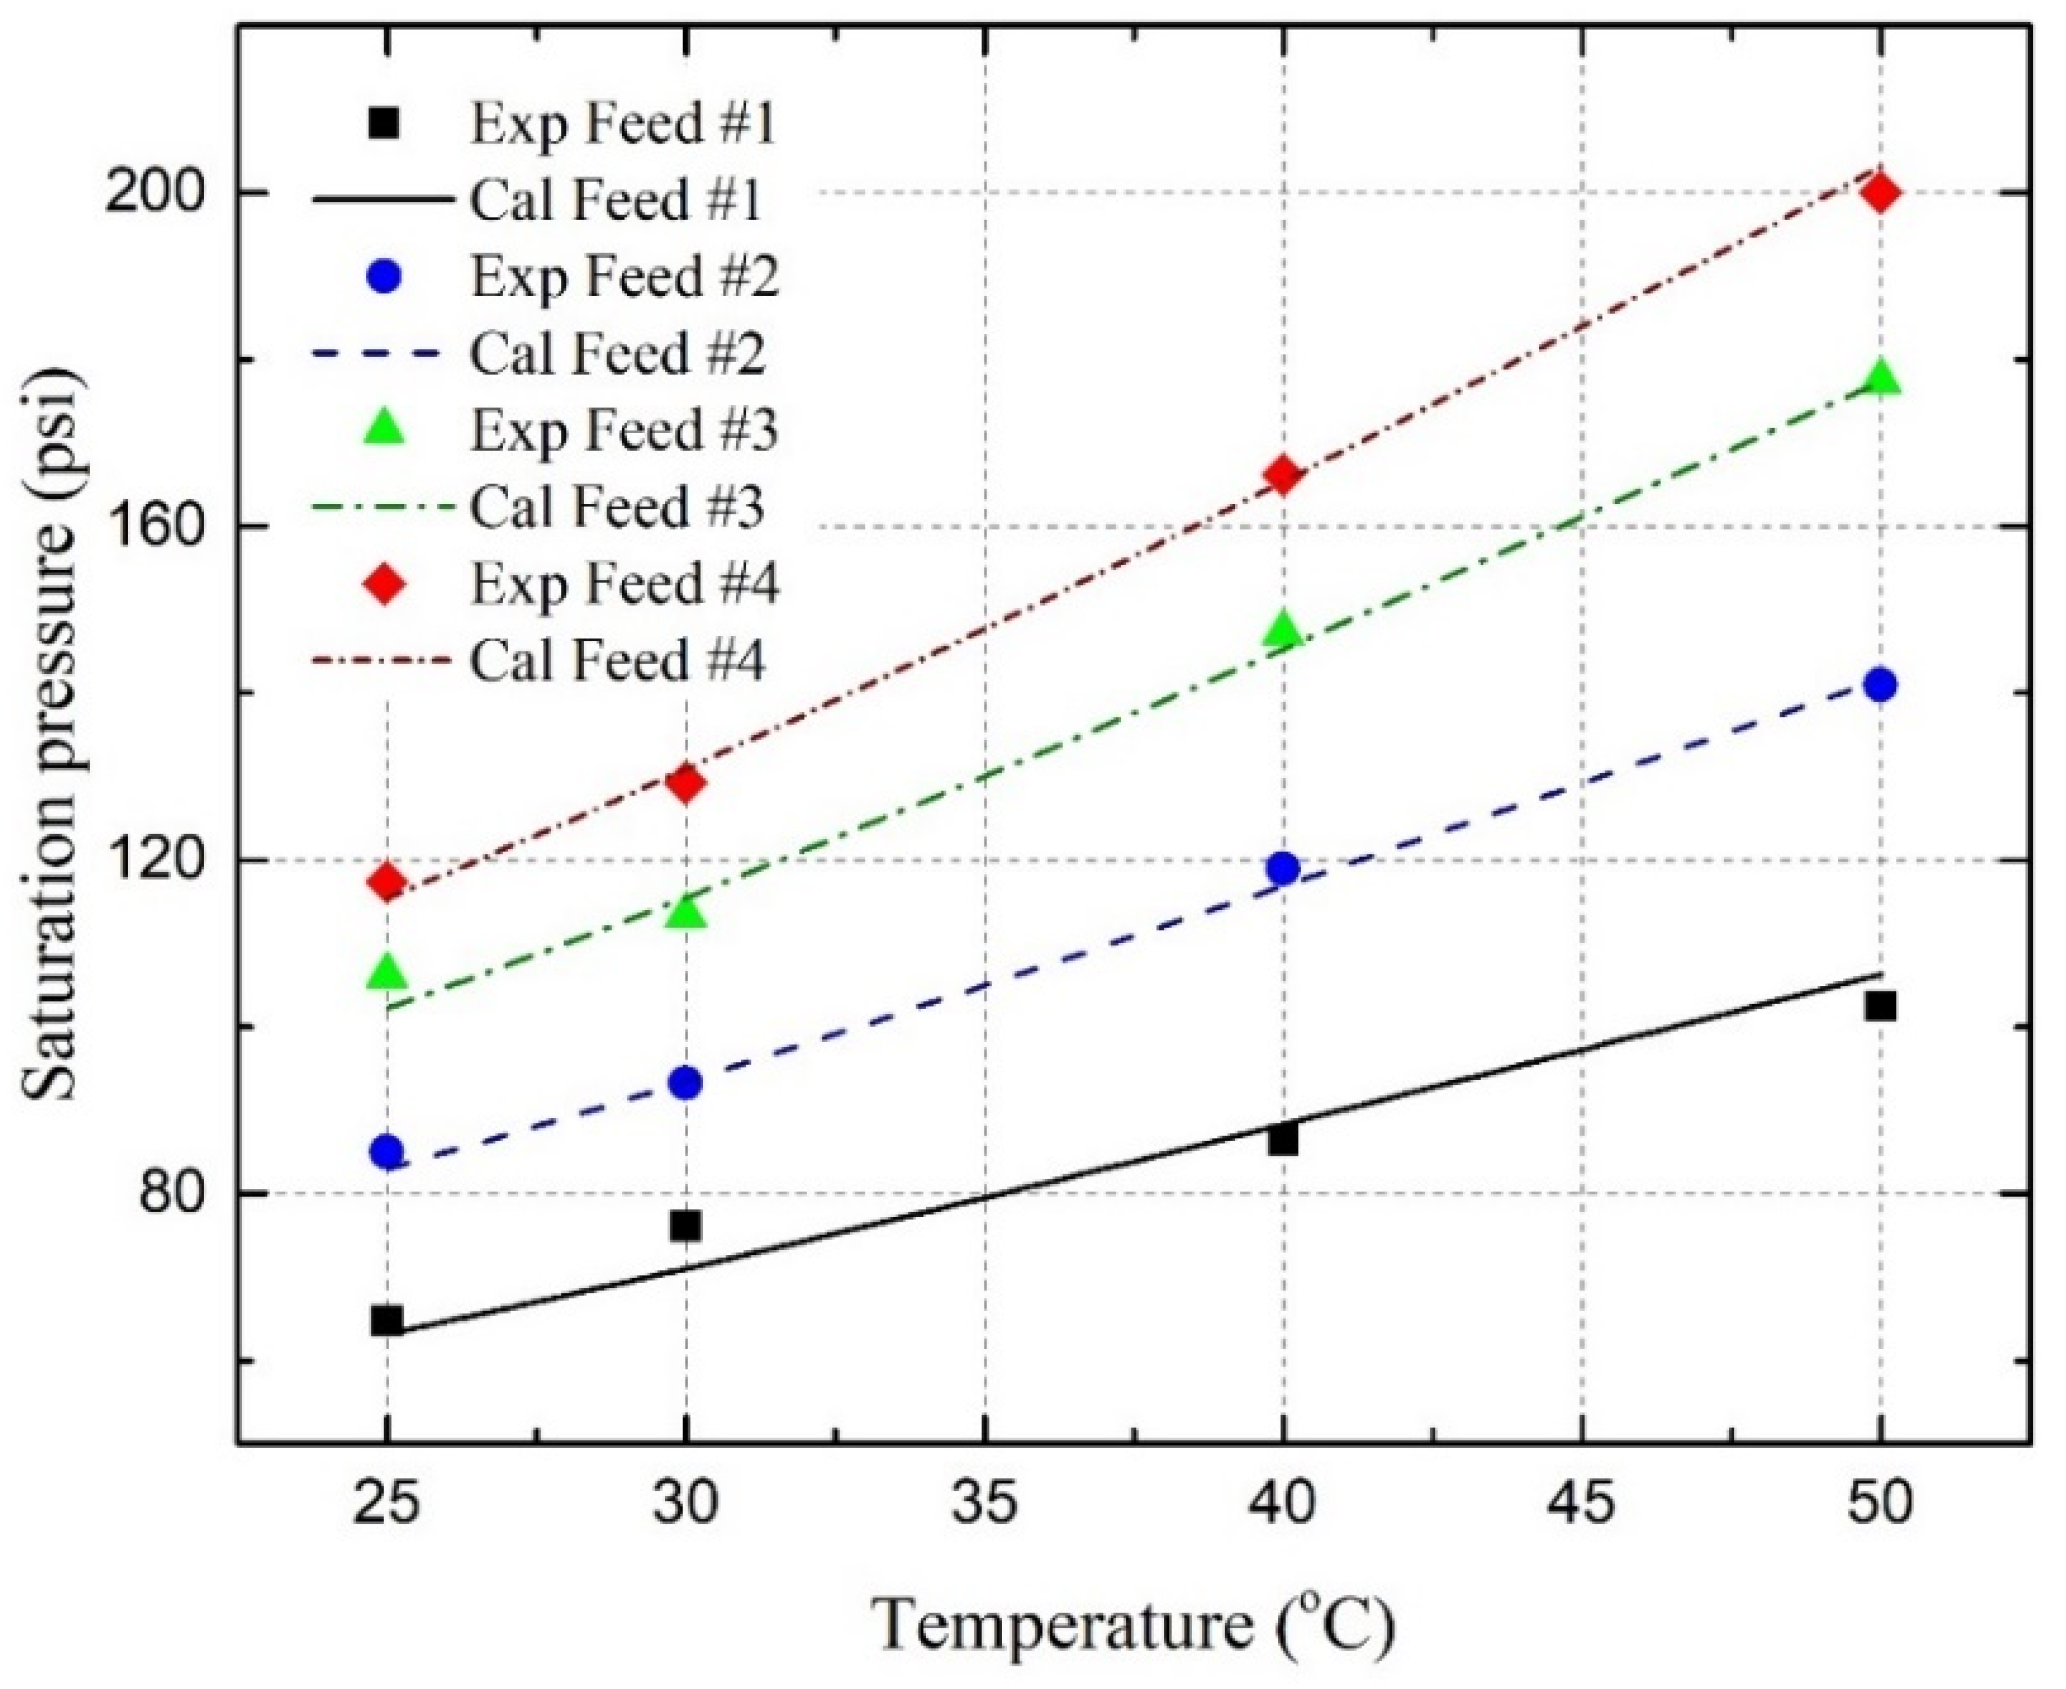
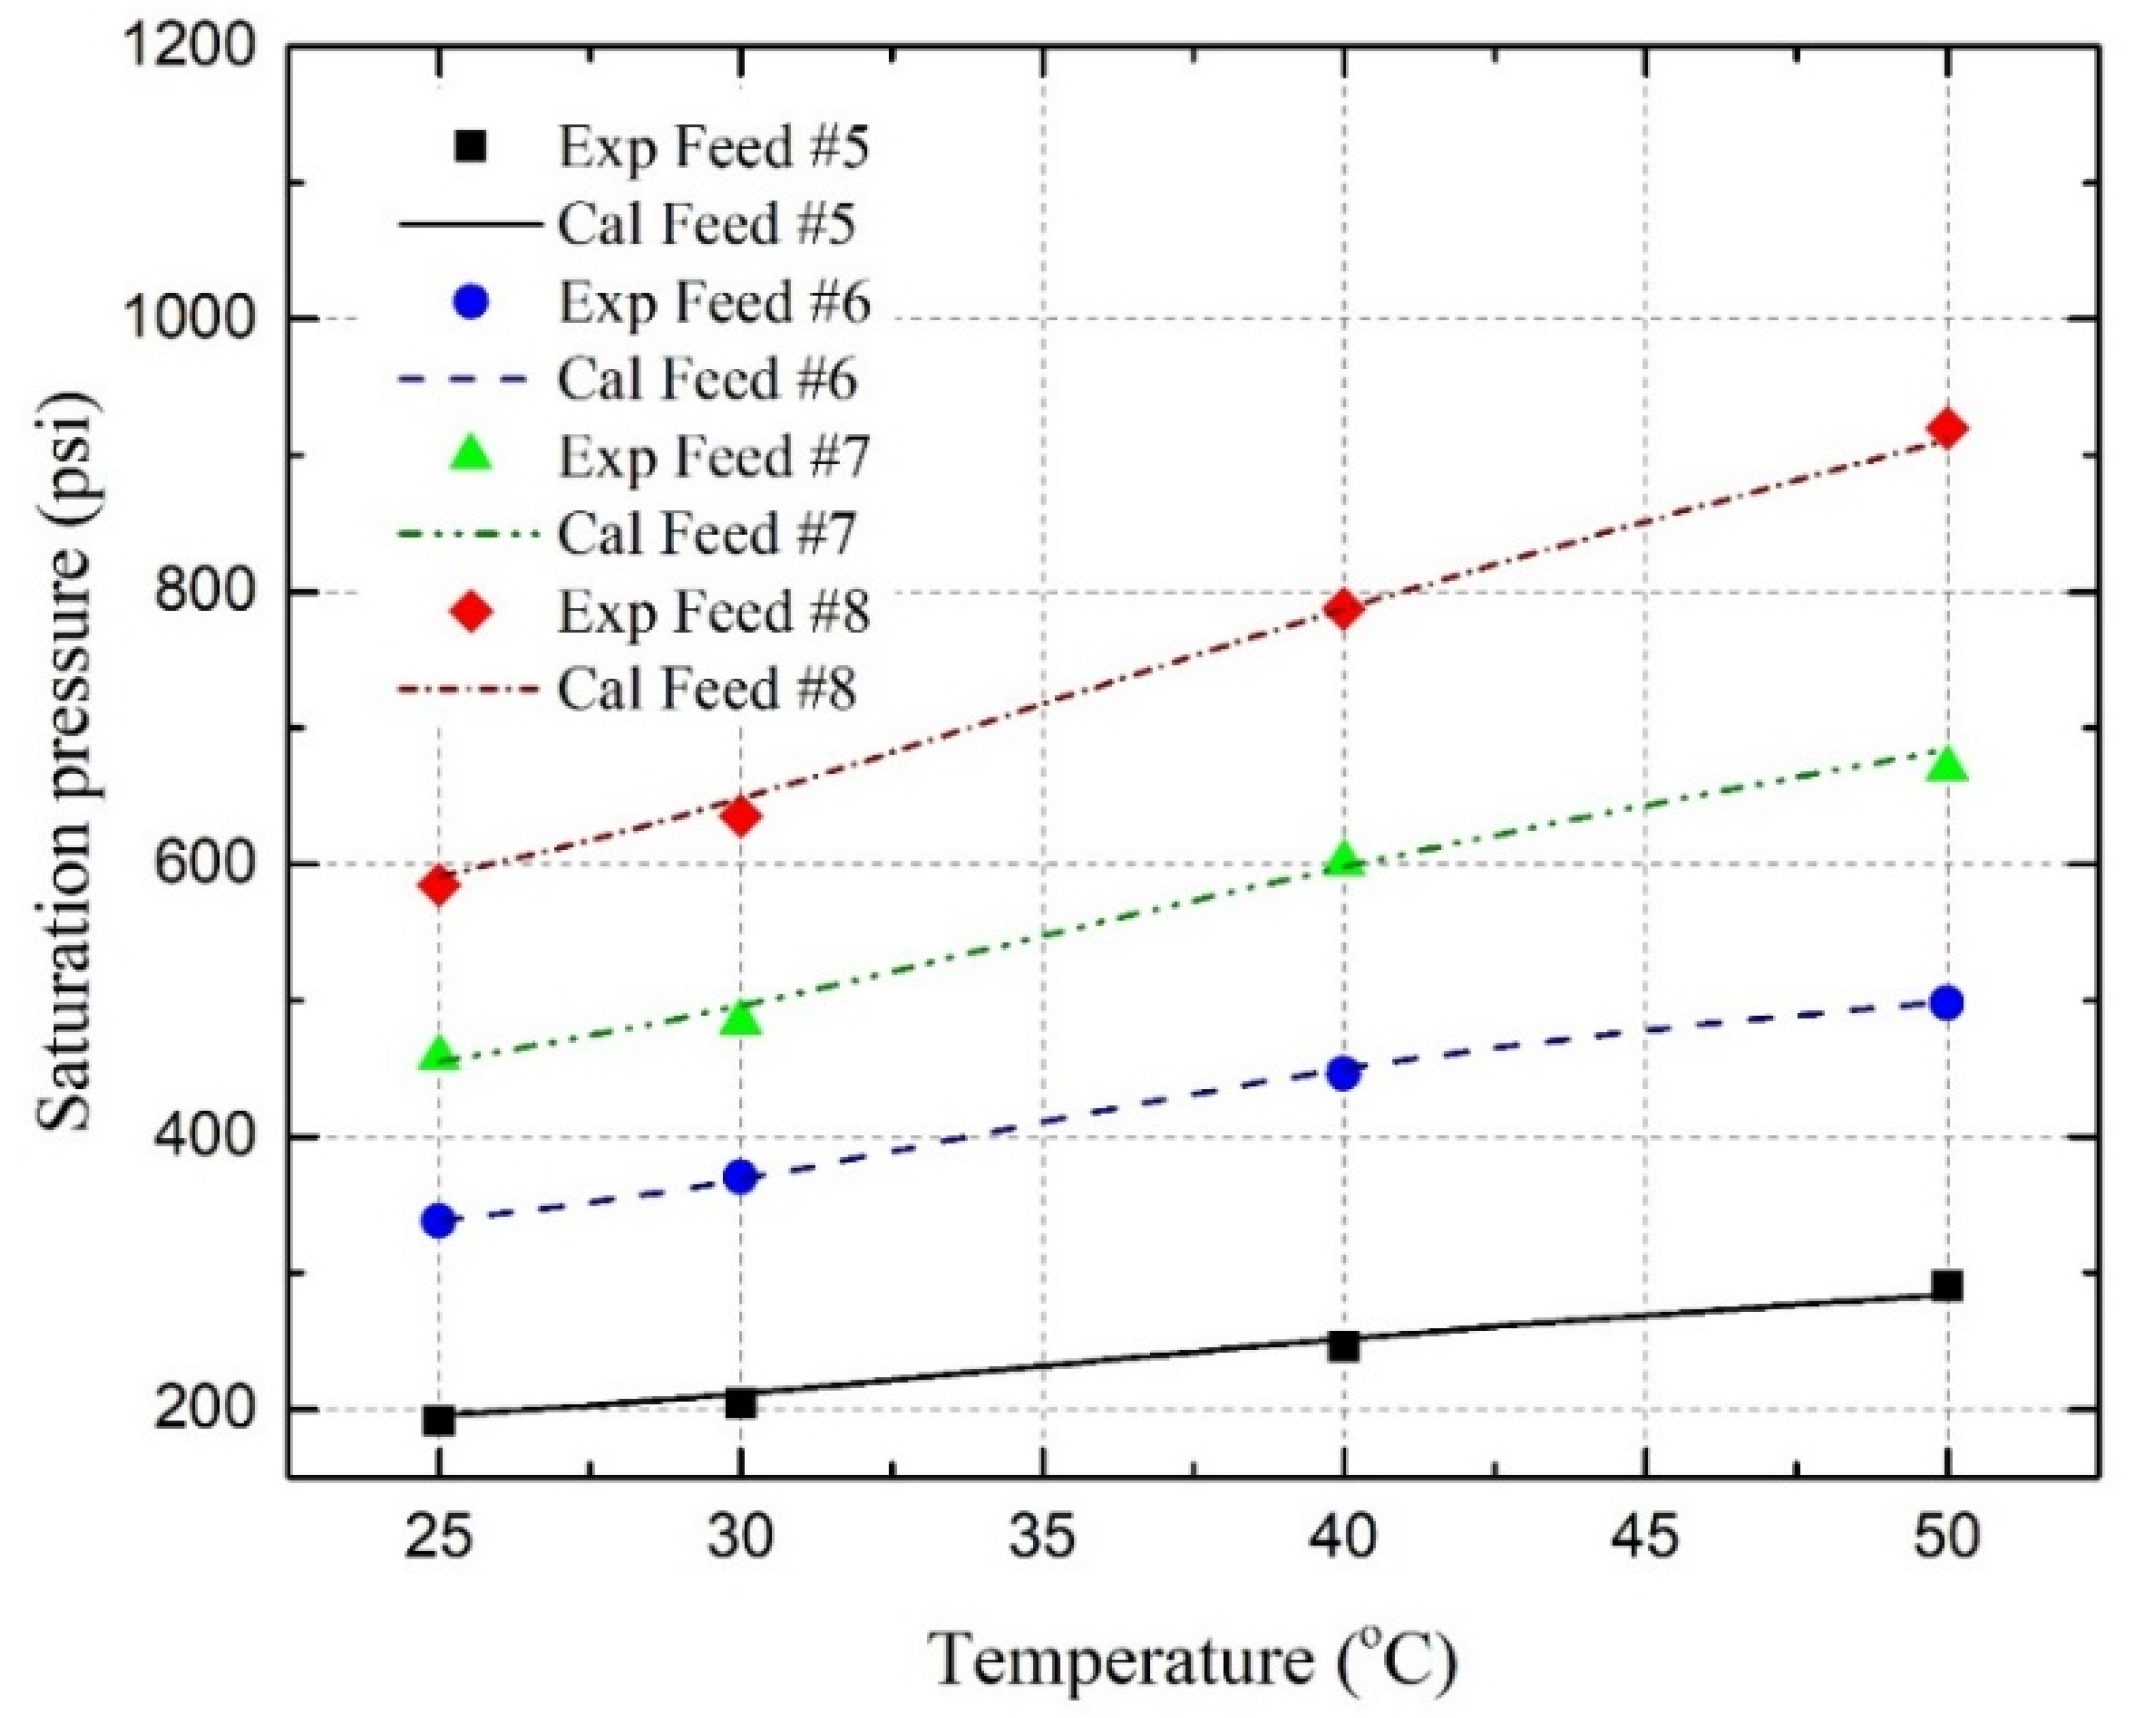
Under reservoir conditions, the saturation pressures of the C3H8-oil mixture, CO2-oil mixture, and C3H8-CO2-oil mixture have been experimentally and theoretically determined. It has been found that the saturation pressure increases with the temperature, as well as with the amount of C3H8, CO2, or CO2-C3H8 gas mixture in the oil;
(2)
The saturation pressures are successfully predicted by using the well-developed PR EOS model, together with two newly developed BIP correlations with an overall AARD of 2.39%, where three pseudo-component lumping schemes are applied;
(3)
The correlations of Trembley oil’s viscosity and density have been successfully generated for temperatures ranging from 20 °C to 75 °C. The measured viscosity and saturation pressure data confirm that the presence of C3H8 in the CO2 stream can enhance oil-recovery performance by achieving miscibility at lower pressures and delaying gas-breakthrough time, ultimately leading to more CO2 being stored in the reservoir;
(4)
The enhancement in miscibility through C3H8 addition can effectively delay gas breakthrough and increase incremental oil recovery compared to immiscible or near-miscible CO2 flooding, thus minimizing CO2 breakthrough and improving the overall EOR efficiency.

Author Contributions

Writing—original draft, X.D.; Writing—review & editing, G.C.T.; Project administration, X.L. All authors have read and agreed to the published version of the manuscript.

Funding

This research received no external funding.

Data Availability Statement

The original contributions presented in the study are included in the article, further inquiries can be directed to the corresponding author.

Conflicts of Interest

The authors declare no conflict of interest.

Nomenclature

aAttraction parameter in the PR-EOS
acConstant in the PR EOS
bVan der Waals volume, m3/kmol
KwWatson factor, dimensionless
TTemperature, °C
TbRNormal boiling point at 1 atm, °R
TCCritical temperature, K
MiMolecular weight of component i, g/mol
mSample mass
nNumber of moles
PPressure, psi
PCCritical pressure, psi
RUniversal gas constant
SGSpecific gravity, dimensionless
VOriginal molar volume calculated by the PR EOS, m3/kmol
VCCritical molar volume, m3/kmol
P i c a l Calculated saturation pressure
P i e x p Experimentally measured saturation pressure
wiMass fraction
xiMole fraction of component i in the equilibrium liquid phase
yiMole fraction of component i in the equilibrium gas phase
ziMole fraction of the component i
αα function in the PR EOS
βAdjustable exponent defined in Equation (21)
σAdjustable exponent defined in Equation (25)
ρDensity, g/cm3
μViscosity, cP
δ i j Binary interaction parameter (BIP) between ith and jth component.
ωAcentric factor, dimensionless
φ i Fugacity coefficient of component i, dimensionless
η Generic symbol for any property
γ Specific gravity, dimensionless
γ i Specific gravity of component i, dimensionless

References

  1. Green, D.W.; Willhite, P.G. Enhanced Oil Recovery; Henry, L., Ed.; Doherty Memorial Fund of AIME, Society of Petroleum Engineers: Richardson, TX, USA, 1998; Volume 6. [Google Scholar]
  2. Al-Abri, A.; Amin, R. Phase Behaviour, Fluid Properties and Recovery Efficiency of Immiscible and Miscible Condensate Displacements by SCCO2 Injection: Experimental Investigation. Transp. Porous Media 2010, 85, 743–756. [Google Scholar] [CrossRef]
  3. Du, X.; Salasakar, S.; Thakur, G. A Comprehensive Summary of the Application of Machine Learning Techniques for CO2-Enhanced Oil Recovery Projects. Mach. Learn. Knowl. Extr. 2024, 6, 917–943. [Google Scholar] [CrossRef]
  4. Wallace, M. The U.S. CO2 Enhanced Oil Recovery Survey An Interim Update of Enhanced Oil Production Totals and CO2 Supplies for Active CO2 EOR Projects in the U.S. as of End-of-Year 2020; Advanced Resources International, Inc.: Arlington, VA, USA, 2020. [Google Scholar]
  5. Gozalpour, F.; Ren, S.R.; Tohidi, B. CO2 EOR and Storage in Oil Reservoir. Oil Gas. Sci. Technol. 2005, 60, 537–546. [Google Scholar] [CrossRef]
  6. Talbi, K.; Kaiser, T.M.V.; Maini, B.B. Experimental Investigation of CO-Based VAPEX for Recovery of Heavy Oils and Bitumen. J. Can. Pet. Technol. 2008, 47. [Google Scholar] [CrossRef]
  7. Badamchi-Zadeh, A.; Yarranton, H.W.; Maini, B.B.; Satyro, M.A. Phase Behaviour and Physical Property Measurements for VAPEX Solvents: Part II. Propane, Carbon Dioxide and Athabasca Bitumen. J. Can. Pet. Technol. 2009, 48, 57–65. [Google Scholar] [CrossRef]
  8. Li, H.; Yang, D.; Tontiwachwuthikul, P. Experimental and Theoretical Determination of Equilibrium Interfacial Tension for the Solvent(s)–CO2–Heavy Oil Systems. Energy Fuels 2012, 26, 1776–1786. [Google Scholar] [CrossRef]
  9. Luo, P.; Zhang, Y.; Wang, X.; Huang, S. Propane-Enriched CO2 Immiscible Flooding for Improved Heavy Oil Recovery. Energy Fuels 2012, 26, 2124–2135. [Google Scholar] [CrossRef]
  10. Shen, C.; Zhou, X.; Zou, B.; Wang, B.; Zhang, K.; Zeng, F. Experimental Study on the Effect of Pressure Decline Rate on Foamy Oil Flow Characteristics in a Heavy Oil– CO2-C3H8 System. Can. J. Chem. Eng. 2022, 100, 2707–2717. [Google Scholar] [CrossRef]
  11. Peng, D.Y.; Robinson, D.B. A New Two-Constant Equation of State. Ind. Eng. Chem. Fundam. 1976, 15, 59–64. [Google Scholar] [CrossRef]
  12. Robinson, D.B.; Peng, D.Y. The Characterization of the Heptanes and Heavier Fractions for the GP Peng-Robinson Programs; Gas Processors Association: Tulsa, OK, USA, 1978. [Google Scholar]
  13. Perez, A.G.; Coquelet, C.; Paricaud, P.; Chapoy, A. Comparative Study of Vapour-Liquid Equilibrium and Density Modelling of Mixtures Related to Carbon Capture and Storage with the SRK, PR, PC-SAFT and SAFT-VR Mie Equations of State for Industrial Uses. Fluid. Phase Equilib. 2017, 440, 19–35. [Google Scholar] [CrossRef]
  14. Maghari, A.; Hosseinzadeh-Shahri, L. Evaluation of the Performance of Cubic Equations of State in Predicting the Regularities in Dense Fluids. Fluid. Phase Equilib. 2003, 206, 287–311. [Google Scholar] [CrossRef]
  15. Jaubert, J.-N.; Mutelet, F. VLE Predictions with the Peng–Robinson Equation of State and Temperature Dependent Kij Calculated through a Group Contribution Method. Fluid. Phase Equilib. 2004, 224, 285–304. [Google Scholar] [CrossRef]
  16. Boukouvalas, C.J.; Magoulas, K.G.; Stamataki, S.K.; Tassios, D.P. Prediction of Vapor−Liquid Equilibria with the LCVM Model: Systems Containing Light Gases with Medium and High Molecular Weight Compounds. Ind. Eng. Chem. Res. 1997, 36, 5454–5460. [Google Scholar] [CrossRef]
  17. Li, H.; Yang, D. Modified α Function for the Peng−Robinson Equation of State to Improve the Vapor Pressure Prediction of Non-Hydrocarbon and Hydrocarbon Compounds. Energy Fuels 2011, 25, 215–223. [Google Scholar] [CrossRef]
  18. Soave, G. Equilibrium Constants from a Modified Redlich-Kwong Equation of State. Chem. Eng. Sci. 1972, 27, 1197–1203. [Google Scholar] [CrossRef]
  19. Gasem, K.A.M.; Gao, W.; Pan, Z.; Robinson, R.L. A Modified Temperature Dependence for the Peng–Robinson Equation of State. Fluid. Phase Equilib. 2001, 181, 113–125. [Google Scholar] [CrossRef]
  20. Nji, G.N.; Svrcek, W.Y.; Yarranton, H.; Satyro, M.A. Characterization of Heavy Oils and Bitumens 2. Improving the Prediction of Vapor Pressures for Heavy Hydrocarbons at Low Reduced Temperatures Using the Peng−Robinson Equation of State. Energy Fuels 2009, 23, 366–373. [Google Scholar] [CrossRef]
  21. Li, H.; Zheng, S.; Yang, D. Enhanced Swelling Effect and Viscosity Reduction of Solvent(s)/CO2/Heavy-Oil Systems. SPE J. 2013, 18, 695–707. [Google Scholar] [CrossRef]
  22. Li, X.; Yang, D.; Fan, Z. Vapor-Liquid Phase Boundaries and Swelling Factors of C3H8-n-C4H10-CO2-Heavy Oil Systems under Reservoir Conditions. Fluid. Phase Equilib. 2017, 434, 211–221. [Google Scholar] [CrossRef]
  23. Li, X.; Li, H.; Yang, D. Determination of Multiphase Boundaries and Swelling Factors of Solvent(s)–CO2–Heavy Oil Systems at High Pressures and Elevated Temperatures. Energy Fuels 2013, 27, 1293–1306. [Google Scholar] [CrossRef]
  24. Li, X.; Han, H.; Yang, D.; Liu, X.; Qin, J. Phase Behavior of C3H8–CO2–Heavy Oil Systems in the Presence of Aqueous Phase under Reservoir Conditions. Fuel 2017, 209, 358–370. [Google Scholar] [CrossRef]
  25. Yarranton, H.W.; Badamchi-Zadeh, A.; Satyro, M.A.; Maini, B.B. Phase Behaviour and Physical Properties of Athabasca Bitumen, Propane and CO2. In Proceedings of the Canadian International Petroleum Conference, Calgary, AB, Canada, 17–19 June 2008. [Google Scholar]
  26. Eghbali, S.; Dehghanpour, H.; Dragani, J.; Zhang, X. Phase Behaviour and Viscosity of Bitumen-CO2/Light Hydrocarbon Mixtures at Elevated Temperatures: A Cold Lake Case Study. In Proceedings of the SPE Canada Heavy Oil Technical Conference, Calgary, AB, Canada, 13–14 March 2018. [Google Scholar]
  27. Eghbali, S.; Dehghanpour, H. An Experimental and Modeling Study of Solvent-Bitumen Phase Behavior at Elevated Temperatures Using Cold Lake Bitumen. In Proceedings of the SPE Annual Technical Conference and Exhibition, San Antonio, TX, USA, 9–11 October 2017. [Google Scholar]
  28. Nourozieh, H. Phase Partitioning and Thermo-Physical Properties of Athabasca Bitumen/Solvent Mixtures. Ph.D. Dissertation, University of Calgary, Calgary, AB, Canada, 2013. [Google Scholar]
  29. Luo, Y.; Yang, S.; Zhang, Y.; Kou, G.; Zhao, S.; Zhao, X.; Zhang, X.; Chen, H.; Wang, X.; Xiao, Z.; et al. Characteristics and Mechanisms of CO2 Flooding with Varying Degrees of Miscibility in Reservoirs Composed of Low-Permeability Conglomerate Formations. Processes 2024, 12, 1203. [Google Scholar] [CrossRef]
  30. Wang, P.; Li, X.; Tao, Z.; Wang, S.; Fan, J.; Feng, Q.; Xue, Q. The Miscible Behaviors and Mechanism of CO2/CH4/C3H8/N2 and Crude Oil in Nanoslits: A Molecular Dynamics Simulation Study. Fuel 2021, 304, 121461. [Google Scholar] [CrossRef]
  31. Huang, E.T.S.; Tracht, J.H. The Displacement of Residual Oil By Carbon Dioxide. In Proceedings of the Improved Oil Recovery Symposium of the Society of Petroleum Engineers of AIME, Tulsa, OK, USA, 22–24 April 1974. [Google Scholar]
  32. Whitson, C.H. Characterizing Hydrocarbon Plus Fractions. Soc. Pet. Eng. J. 1983, 23, 683–694. [Google Scholar] [CrossRef]
  33. Whitson, C.H.; Brule, M.R. Phase Behavior; Society of Petroleum Engineers: Houston, TX, USA, 2000; Volume 20. [Google Scholar]
  34. Soreide, I. Improved Phase Behavior Predictions of Petroleum Reservoir Fluids from a Cubic Equation of State. Ph.D. Dissertation, Norwegian Inst. of Technology, Trondheim, Norway, 1989. [Google Scholar]
  35. Kesler, M.G.; BI, L. Improve Prediction of Enthalpy of Fractions. Hydrocarb. Process. 1976, 153, 153–158. [Google Scholar]
  36. Lee, B.I.; Kesler, M.G. A Generalized Thermodynamic Correlation Based on Three-parameter Corresponding States. AIChE J. 1975, 21, 510–527. [Google Scholar] [CrossRef]
  37. Al-Meshari, A.A.; McCain, W.D. New Strategic Method to Tune Equation-of-State for Compositional Simulation. In Proceedings of the SPE Technical Symposium of Saudi Arabia Section, Dhahran, Saudi Arabia, 14–16 May 2005. [Google Scholar]
  38. Danesh, A.; Xu, D.; Todd, A.C. A Grouping Method To Optimize Oil Description for Compositional Simulation of Gas-Injection Processes. SPE Reserv. Eng. 1992, 7, 343–348. [Google Scholar] [CrossRef]
  39. Hong, K.C. Lumped-Component Characterization of Crude Oils for Compositional Simulation. In Proceedings of the SPE EOR Conference at Oil and Gas West Asia, Muscat, Oman, 4–7 April 1982. [Google Scholar]
  40. Zabaloy, M.S.; Vera, J.H. The Peng−Robinson Sequel. An Analysis of the Particulars of the Second and Third Generations. Ind. Eng. Chem. Res. 1998, 37, 1591–1597. [Google Scholar] [CrossRef]
  41. Michelsen, M.L. The Isothermal Flash Problem. Part I. Stability. Fluid. Phase Equilib. 1982, 9, 1–19. [Google Scholar] [CrossRef]
  42. Johns, R.T.; Orr, F.M. Miscible Gas Displacement of Multicomponent Oils. SPE J. 1996, 1, 39–50. [Google Scholar] [CrossRef]
  43. Wang, Y.; Orr, F.M. Analytical Calculation of Minimum Miscibility Pressure. Fluid. Phase Equilib. 1997, 139, 101–124. [Google Scholar] [CrossRef]
  44. Wang, Y.; Orr, F.M. Calculation of Minimum Miscibility Pressure. J. Pet. Sci. Eng. 2000, 27, 151–164. [Google Scholar] [CrossRef]
Figure 1. Density and viscosity of Trembley oil at various temperatures.
Energies 17 04790 g001
Figure 2. Schematic diagram of experimental setup for measuring bubble point pressures for C3H8-CO2-Oil systems.
Energies 17 04790 g002
Figure 3. Overall AARD versus the number of PCs for C3H8-oil, CO2-oil, and C3H8-CO2-oil systems by using the optimized (Table 5) and developed (Equations (22) and (23)) BIPs.
Energies 17 04790 g003
Figure 4. Measure pressure–volume diagram of Feed #4 (72.21 mol% C3H8 and 27.79 mol% oil) at 50 °C.
Energies 17 04790 g004
Figure 5. Measure pressure–volume diagram of Feeds #1–4.
Energies 17 04790 g005
Figure 6. Measure pressure–volume diagram of Feeds #5–8.
Energies 17 04790 g006
Figure 7. Measure pressure–volume diagram of Feeds #9–12.
Energies 17 04790 g007
Figure 8. Saturation pressures of C3H8-oil systems: Feed #1 (34.62 mol% C3H8), Feed #2 (46.55 mol% C3H8), Feed #3 (60.08 mol% C3H8), and Feed #4 (72.21 mol% C3H8).
Energies 17 04790 g008
Figure 9. Saturation pressures of CO2-oil systems: Feed #5 (29.29 mol% CO2), Feed #6 (47.35 mol% CO2), Feed #7 (60.39 mol% CO2), and Feed #8 (73.74 mol% CO2).
Energies 17 04790 g009
Figure 10. Saturation pressures of C3H8-CO2-oil systems: Feed #9 (13.03 mol% C3H8 and 46.04 mol% CO2), Feed #10 (20.54 mol% C3H8 and 41.18 mol% CO2), Feed #11 (14.34 mol% C3H8 and 51.05 mol% CO2), and Feed #12 (16.16 mol% C3H8 and 57.57 mol% CO2).
Energies 17 04790 g010
Figure 11. Solubility of C3H8, CO2, and C3H8-CO2 mixture as a function of saturation pressure at 25 °C (the dash lines represent the regressions of the data points).
Energies 17 04790 g011
Figure 12. Average MMPs of C3H8-Oil (Feed #1–4), CO2-Oil (Feeds #5–8), and C3H8-CO2-Oil mixture (Feeds #9–12).
Energies 17 04790 g012
Table 1. Compositions of C3H8-CO2-Trembley oil systems with 12 feeds at various temperatures.
Feed #Composition, mol%Temperature, °C
C3H8CO2Trembley Oil
134.620.065.3825, 30, 40, 50
246.650.053.3525, 30, 40, 50
360.080.039.9225, 30, 40, 50
472.210.027.7925, 30, 40, 50
50.029.2970.7125, 30, 40, 50
60.047.3552.6525, 30, 40, 50
70.060.3939.6125, 30, 40, 50
80.073.7426.2625, 30, 40, 50
913.0346.0440.5725, 30, 40, 50
1020.5441.1838.2825, 30, 40, 50
1114.3451.0534.6125, 30, 40, 50
1216.1657.5726.2725, 30, 40, 50
Table 2. Compositional analysis of the trembley oil.
Carbon No.wt %mol%Carbon No.wt%mol%
C10.00000.0000C232.46461.7589
C20.00000.0000C242.40591.6459
C30.00000.0000C252.18761.4370
C40.00000.0000C262.05411.2977
C50.00000.0000C272.02801.2340
C60.54501.4653C281.87241.0989
C73.22877.4656C291.83591.0405
C83.91447.9396C301.97151.0802
C95.800710.4787C311.80660.9581
C104.58227.4615C321.46990.7553
C113.84715.7023C331.44360.7194
C123.34814.5539C341.22180.5910
C134.75865.9800C351.38660.6517
C144.62925.4060C360.94970.4340
C153.96844.3283C371.31180.5833
C163.57513.6578C381.13270.4905
C175.12904.9415C390.66380.2801
C184.18333.8083C400.84320.3469
C193.38732.9225C410.74030.2972
C202.46592.0220C420.83180.3260
C213.01002.3514C42+6.80630.8485
C222.19891.6402Total100100
Table 3. Vapor pressure of C3H8 with two depressurization methods.
Temperature
(°C)
Reference Value
(psi)
Continuous MethodStepwise Method
Measured (psi)Error
(%)
Measured
(psi)
Error
(%)
30158.4163.23.03161.62.02
40190.3195.42.67192.71.26
50226.8232.62.56230.11.45
Table 4. Physical and critical properties of each pseudo-component in different lumping schemes.
No. of PCs *MW, g/molPC, atmTC, KγTb, Kω
1234.66717.008753.7150.863573.4790.114
2150.21223.711641.9370.794459.7510.212
490.84514.631869.3900.954687.9600.636
3129.24725.914610.0640.774427.9810.176
213.03718.350727.4320.846546.3760.312
580.62813.101910.5480.982728.6470.739
4116.78127.578588.5880.760407.1500.153
163.01221.979664.1930.807481.3390.236
231.87117.262748.7730.860568.5980.337
604.23912.911919.9910.990737.8280.766
5116.78227.579588.5890.761407.5170.153
163.01321.980664.1930.808481.7730.237
219.44817.853735.9170.852555.6090.322
296.82014.796808.8740.899632.3410.408
745.44112.270966.6421.030782.2850.933
6107.67228.999571.5330.750390.9980.136
134.17825.045619.9630.780437.2000.186
171.06721.184676.1080.814493.3280.250
219.44717.852735.9160.852555.1080.322
290.81814.952804.1970.896626.8560.403
718.79612.343958.8681.022774.4960.901
* Note: PC is the abbreviation of pseudo-component.
Table 5. Optimum BIP exponent (β) in each of six lumping schemes.
Binary and Ternary SystemsFeed
No.
No. of PCs
Temperature (°C)123456
C3H8-oil1251.991.211.321.471.221.31
2302.211.301.481.521.251.34
3402.441.541.551.571.291.39
4502.681.411.541.631.331.44
CO2-oil5250.190.270.040.050.030.05
6300.090.000.010.000.000.00
7400.920.060.100.110.080.12
8500.380.000.010.020.000.03
C3H8-CO2-oil
(β for C3H8-PC)
9251.601.361.361.361.221.36
10301.691.301.401.421.281.39
11402.681.361.361.361.291.34
12501.721.361.371.361.331.20
C3H8-CO2-oil
(β for CO2-PC)
9250.220.010.010.010.030.01
10300.310.010.020.040.030.06
11400.500.010.010.010.080.01
12500.340.010.020.010.000.01
Table 6. Viscosity of mixtures at 25 °C and high pressure.
Systemμ (cP)
C3H8-oil (Feed #1)2.33
CO2-oil (Feed #8)3.03
C3H8-CO2-oil (Feed #12)1.89
Dead oil at 1600 psi9.50
Dead oil at room pressure9.49
Disclaimer/Publisher’s Note: The statements, opinions and data contained in all publications are solely those of the individual author(s) and contributor(s) and not of MDPI and/or the editor(s). MDPI and/or the editor(s) disclaim responsibility for any injury to people or property resulting from any ideas, methods, instructions or products referred to in the content.

