Article

A New Method of Failure Mode and Severity Effects Analysis for Hydrogen-Fueled Combustion Systems

Faculty of Civil and Transport Engineering, Poznan University of Technology, pl. Marii Skłodowskiej-Curie 5, 60-965 Poznań, Poland
*
Author to whom correspondence should be addressed.
Energies 2024, 17(19), 4802; https://doi.org/10.3390/en17194802
Submission received: 29 June 2024 / Revised: 19 September 2024 / Accepted: 23 September 2024 / Published: 25 September 2024

Abstract

:
This article aims to align its content with current trends in hybrid risk analysis methods while utilizing experimental research. This paper presents a hybrid methodology for analyzing the failure severity of a two-stage hydrogen-powered combustion system and details its implementation. This methodology assumes the use of the original FMESA method (Failure Mode and Effects Severity Analysis) with dedicated tabular scales of the failure severity. Obtaining results under the FMESA using experimental research is intended to reduce epistemic uncertainty, which is an important component of hazard severity or risk models. Its essence is to change the way of obtaining the results of the basic components of known methods such as FMEA/FMECA (Failure Mode and Effect Analysis/Failure Mode, Effects and Criticality Analysis). Experimental research was also used to develop the original failure severity scales for a two-stage hydrogen-fueled combustion system. The article presents a review of the literature on methods for identifying and analyzing hazards in hydrogen systems, the FMESA method with its mathematical model, results in the form of tabular scales of the failure severity, results of selected experimental tests, and quantitative results of a severity analysis of eleven failure modes of a two-stage hydrogen-fueled combustion system for a selected engine operating point.

1. Introduction

Evolving the performance characteristics of an internal combustion engine’s fueling system components poses unique challenges for safety engineering. This is particularly true for hydrogen fueling systems, whose inherent properties can generate risks, leading to significant failure or losses. Studies of hydrogen fueling systems often highlight the consequences of fire or explosion incidents. This emphasis stems from both the intrinsic properties of hydrogen itself, such as its low ignition energy and wide flammability range, and the characteristics of hydrogen fires, which make them difficult to detect and extinguish (hydrogen flames are colorless or nearly colorless, and often the only effective approach is to cut off the fuel source [1]). Furthermore, burning hydrogen in an internal combustion engine with an excessively low air–fuel ratio can lead to knocking combustion [2,3]. This undesirable combustion process can ultimately lead to the failure of engine components [4]. However, despite being improper combustion, various methods exist for its control [5,6] or minimization [7,8].
The exploitation of hydrogen is becoming increasingly common. Environmental analyses indicate various possibilities for hydrogen extraction [9,10], and predictions for the cost of H2 production in the coming years appear to be decreasing. Forecasts suggest that within a few years, hydrogen production costs could be more than halved by 2025 [9]. Hydrogen may not be the safest option for fuel, but other fuels used today have also been seen as unsafe during different times of production and utilization [10].
While safety incidents like fire or explosion are major concerns in hydrogen-fueled systems, changes in the operating characteristics of mixture formation and combustion systems components also significantly impact combustion quality. In two-stage combustion systems, the use of passive or active pre-combustion chambers fundamentally alters the combustion process by enabling diverse control strategies [5,11,12]. Importantly, these changes in operating characteristics are much more likely to occur compared to safety events and can even be considered typical for such systems.
Safety engineering provides powerful tools to control hazards and rationally manage processes while considering their inherent risks. In the case of hydrogen-operated systems, methods like FMEA/FMECA (Failure Mode and Effect Analysis/Failure Mode, Effects and Criticality Analysis) or HAZOP (Hazard and Operability Study) are highly recommended. These methods are not only valuable in hydrogen sectors but are even included in quality management system standards for other sectors, such as IRIS (International Railway Industry Standard). As the authors of a paper [13] point out, “for the risk analysis of hydrogen fuel cell vehicles, the existing research mainly adopts the method of theoretical analysis, and the common methods are the FMECA, the FFMEA, the FTA (Fault Tree Analysis), and the HAZOP”.
HAZOP and FMEA/FMECA methods are particularly valuable during the system design stage, as the prevention of undesirable conditions, such as leaks, malfunctions, or component failures, offers the greatest safety benefits. While HAZOP focuses on identifying potential hazards and their operational causes, FMEA delves into the failure modes of each system component and qualitatively assesses the probability and severity of their consequences [13,14,15]. Correa-Jullian and Groth’s application of FMEA to a liquid hydrogen storage system [14] exemplifies this approach, identifying critical failure scenarios such as pressure relief valve malfunctions, air-operated valve failures, and evaporator ruptures. Their qualitative assessment of failure types and severity levels highlights the importance of preventive measures in mitigating hydrogen-related risks.
Cui et al. [13], by contrast, conducted a fire hazard analysis and explosion simulation for hydrogen leakage in fuel cell vehicles. They employed FMEA analysis in a traditional manner, focusing on identifying the potential types of failure. The authors of another study [16] addressed a similar analytical problem but utilized FTA and ETA (Event Tree Analysis) methods.
Another publication [15], a comprehensive study by the U.S. Department of Transportation’s National Highway Traffic Safety Administration (NHTSA), analyzes the causes and consequences of hydrogen fuel cell vehicle failures. This NHTSA report aimed to evaluate safety issues in hydrogen-powered vehicles and identify areas for developing federal safety standards. A key finding highlights the criticality of redundancy in high-pressure components. Without redundancy in the compressed-hydrogen fuel system (container, pressure relief device (PRD), or first valve), a single-point failure can cause large-scale hydrogen release or venting. Additionally, container failures may release mechanical energy. While smaller hydrogen releases and ruptures of other components can also be dangerous, they typically have less severe consequences compared to large leaks and tank ruptures, as noted in [15]. The study employed a qualitative scale to assess the potential severity of consequences.
The HAZOP method finds frequent application in the context of hydrogen systems, primarily for identifying scenarios that could lead to adverse events. This use of the method is well supported by publications such as [13,17,18,19]. A clear example is the work of [19], where HAZOP was employed to identify accident scenarios caused by internal factors during the evaluation of organic-hydride-hydrogen-refueling stations utilizing methylcyclohexane. Similarly, Ehrhart et al. [17] used HAZOP to assess risk and model ventilation performance for hydrogen releases within auto repair shops. Jung et al. [18] demonstrate a slightly different application of HAZOP, conducting an analysis of hydrogen behavior under cryogenic adsorption conditions.
FMEA’s application faces criticism due to shortcomings and, in some cases, even its debatable value for certain risk assessments [20]. To address these limitations, various authors have proposed extensions of FMEA or created hybrid methods incorporating FMEA or FMECA as a core component. Examples of extension methods are found in works by [20,21], while [14,22,23] showcase hybrid methods. These hybrid methods combine established safety engineering techniques, most commonly FMEA, HAZOP, and FTA [23].
FMEA/FMECA risk assessments, not only for hydrogen systems, typically focus on the most severe consequences of failure in terms of loss magnitude. The severity level is usually assigned subjectively based on worst-case scenarios [24]. However, such scenarios often have a very low probability of occurring. Impacts with lesser losses are much more likely, potentially leading to reduced system functionality. Therefore, neglecting the criticality (risk) of failure with average severity is unreasonable, especially since these events could still result in unacceptable risk levels. While numerous studies analyze criticality in hydrogen systems, there is a dearth of research focusing on this type of failure, particularly in two-stage combustion systems.
A literature review and the authors’ experience in this current article show that there is a lack of studies on the failure criticality associated with the quality of combustion processes in hydrogen-fueled systems. More so, such studies have not been conducted for two-stage hydrogen combustion systems. In addition, traditional methodologies (such as FMEA/FMECA) assessments of damage criticality do not include scales based on measurable parameters that characterize the systems. On the one hand, this is a welcome generalization, but, on the other hand, it is a simplification that introduces additional inaccuracy and subjectivity into the assessments. Based on the literature review, the areas of ignorance that are the subject of the article were identified. The purpose of this study is to present an original method of damage severity assessment—FMESA (Failure Mode and Effects Severity Analysis)—and to indicate the results of its application to a two-stage hydrogen combustion system. The method is part of the current trends in hybrid risk analysis, combining various well-known methods of this type of analysis. Its essence is a specific approach to identifying the components of the analysis, supported by an original tabular damage severity scale developed for a two-stage hydrogen combustion system at its typical operating point.
Section 2 details the method’s concept and describes the test stand. Section 3 presents the analysis’ results, including the developed failure severity scale for the selected engine operating point and experimental data for selected engine operation indicators, along with examples of critical failure to components (e.g., intake, combustion, and exhaust systems), as identified in [16]. Section 4 discusses the results and analyzes the proposed method’s applicability. Finally, Section 5 summarizes the entire work.

2. Materials and Methods

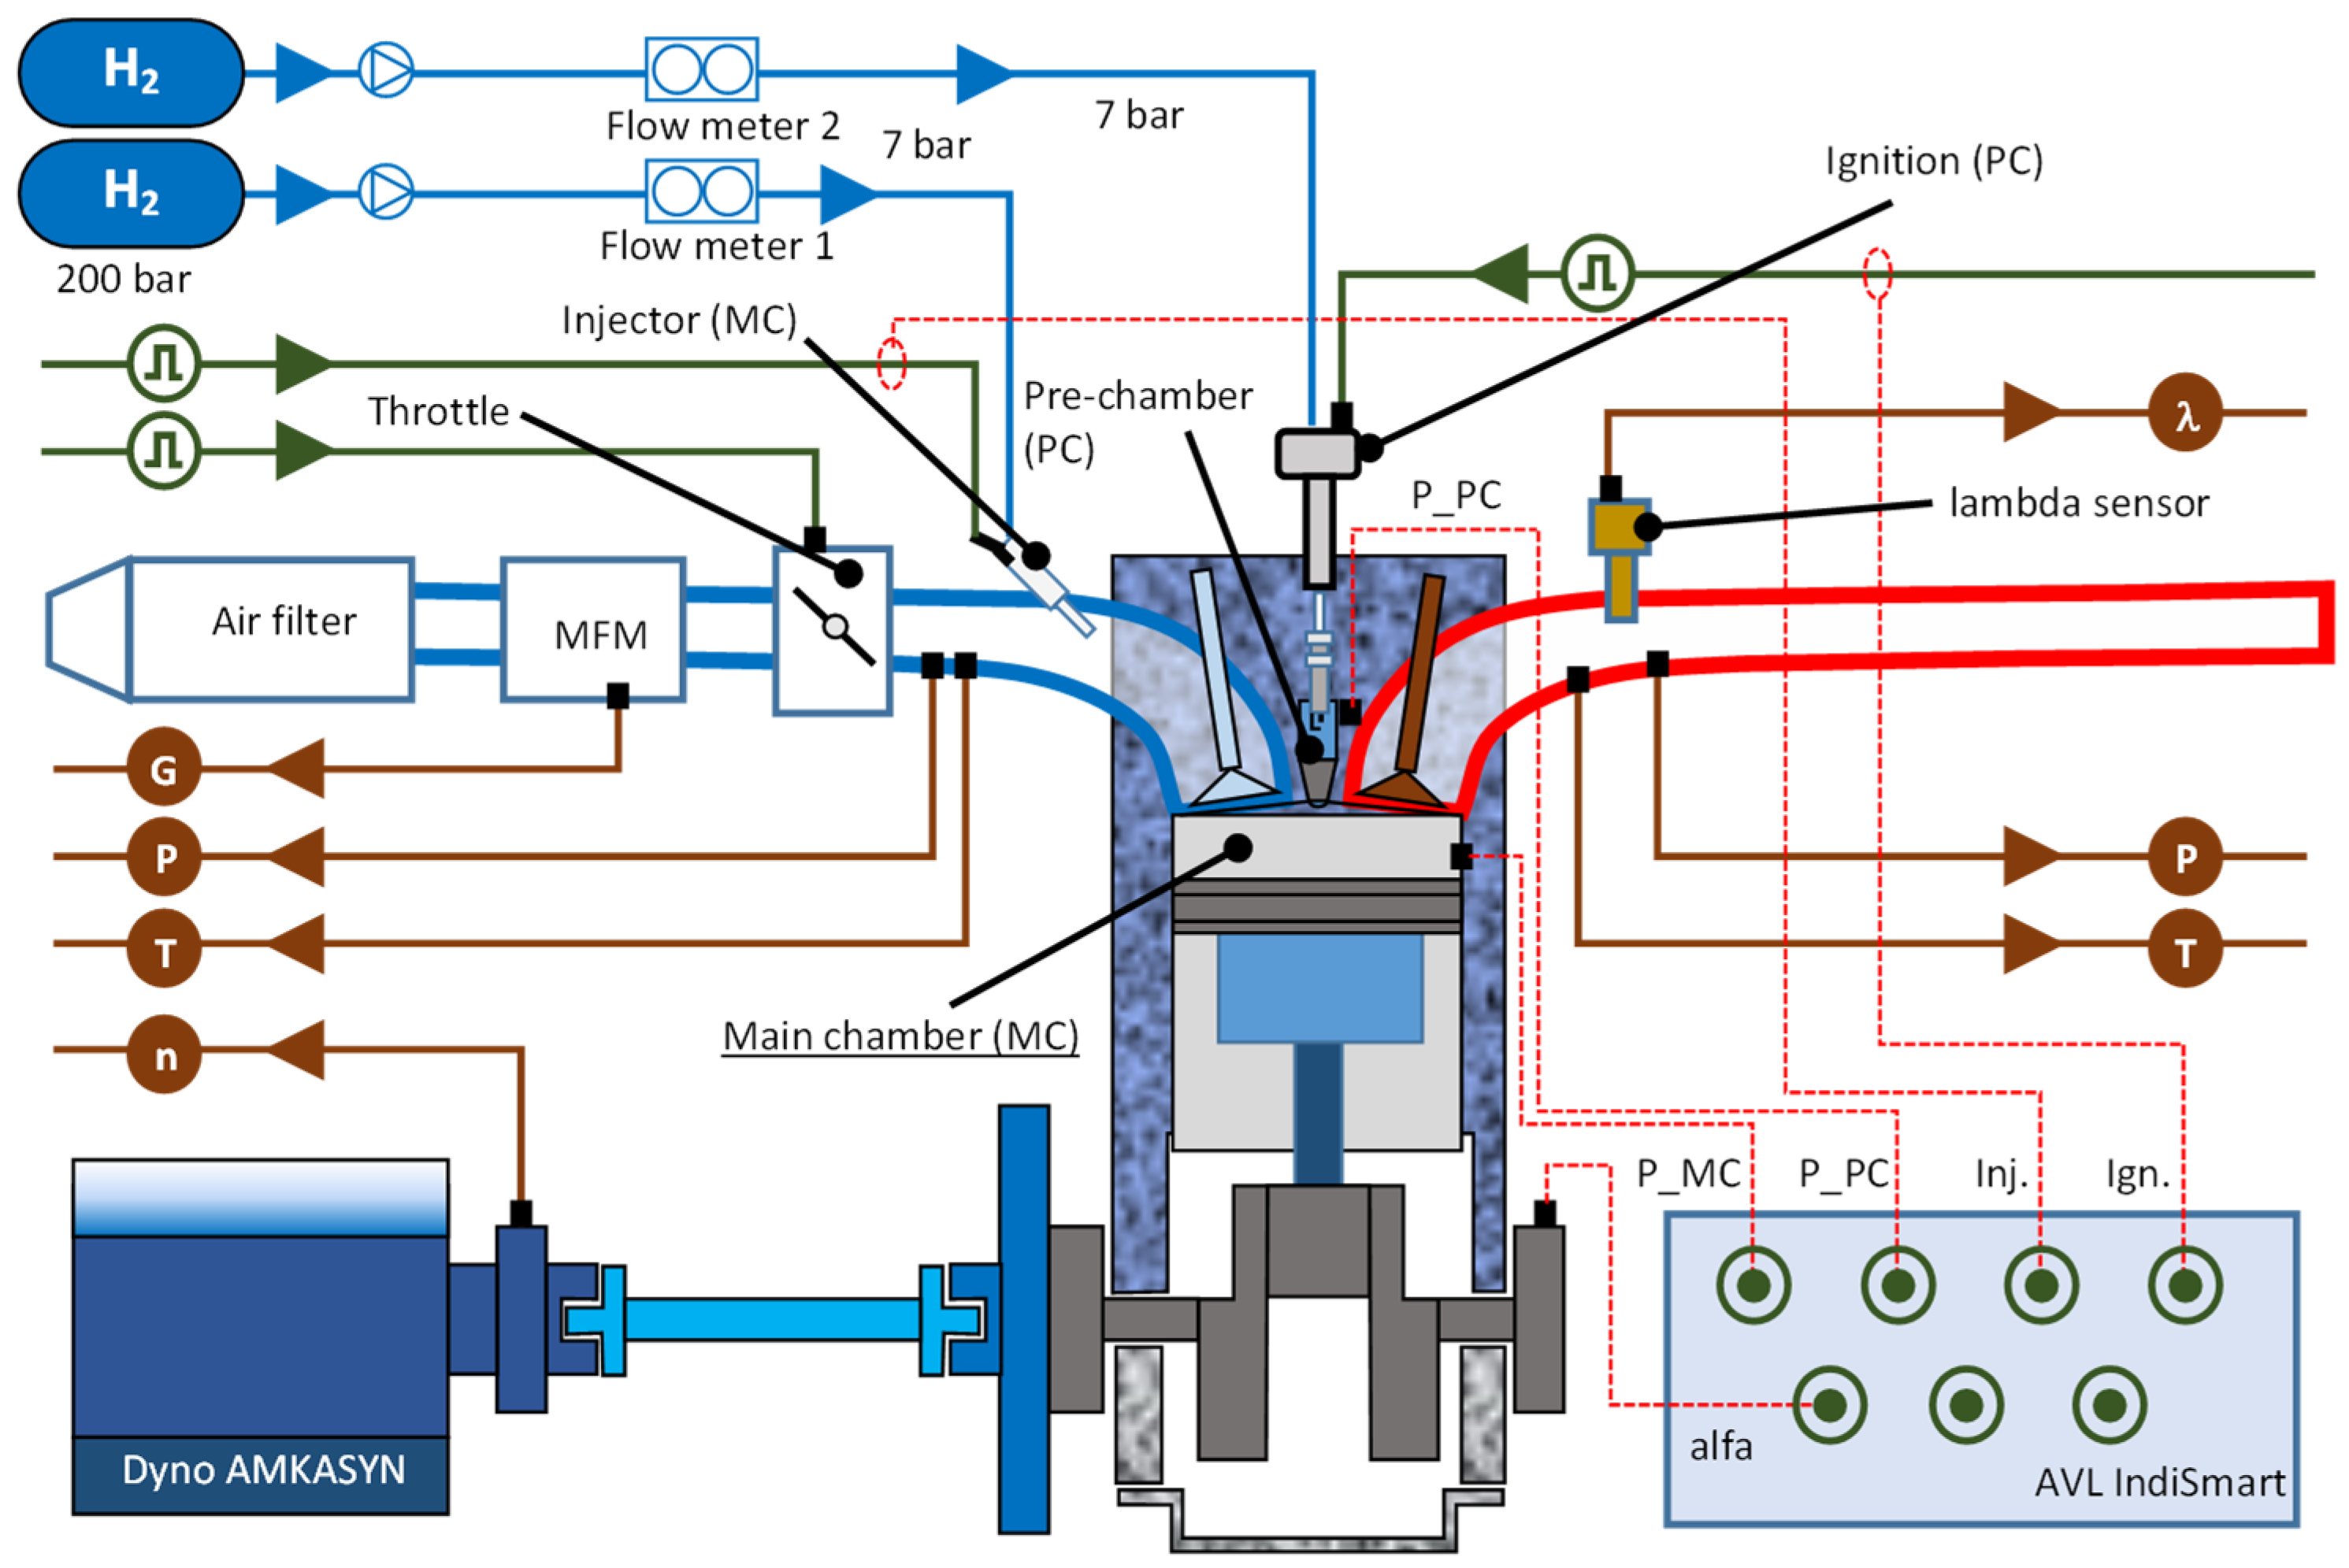
2.1. Description of the Test Stand

The combustion process analysis was conducted on a single-cylinder AVL 5804 engine (AVL factory, Graz, Austria) with a displacement of 0.5 dm3 and a TJI (turbulent jet ignition) combustion system. The study employed both passive and active combustion chambers. The engine was fueled with technical hydrogen (99.999% purity) at a pressure of 7 bar. The characteristics of the technical hydrogen fuel are provided in Table 1. An AMKASYN electrospinning asynchronous brake served as the engine load. A scheme of the test stand is shown in Figure 1.
The operation of an engine fueled by gaseous fuels makes it possible to use higher excess air ratio values (lean mixtures). This means that the efficiency of the engine can be increased. At the same time, higher compression ratios also can be applied (up to the limit of knock combustion). Using the TJI system makes it possible to take advantage of ultra-lean combustion, where a nearly stoichiometric mixture is aimed at the prechamber, and a very lean mixture is aimed at the main chamber. The escaping jets from the prechamber ignite the lean charge in the main chamber. Thus, combining gaseous fuel with a TJI system and a high compression ratio results in increased engine efficiency and effectiveness. With such solutions, the efficiency gap between internal combustion engines and fuel cells is reduced [10].
Hydrogen consumption was recorded using two independent mass flowmeters: a Micro Motion ELITE CMFS010M (Coriolis phenomenon, by Emerson) for the main chamber (MC) and a EL_FLOW flowmeter (by Bronkhorst, AK Ruurlo, The Netherlands) for the prechamber (PC). Air consumption was measured with a Sensycon Sensyflow thermal mass flowmeter from ABB (Zurich, Switzerland). An open-loop Engine Management Unit (EMU Black controller) from Ecumaster (Cracov, Poland) controlled the throttle and ignition. The active pre-chamber utilized a Beru pencil coil ignition system. This system allowed for setting both the coil charging time (fixed at 3 ms) and the ignition advance time using an M10 spark plug. Finally, the excess air ratio was determined with an LSU 4.9 broadband probe (by Bosch) interfaced with an LCP80 controller (by IMFsoft, Ostrava, Czech Republic).
The combustion chamber was equipped with a pre-chamber (6 holes—radially), whose volume was 2.29 cm3. This value accounted for 0.45% of the total engine stroke volume (at the BDC) and 6.6% of the capacity (at the TDC).

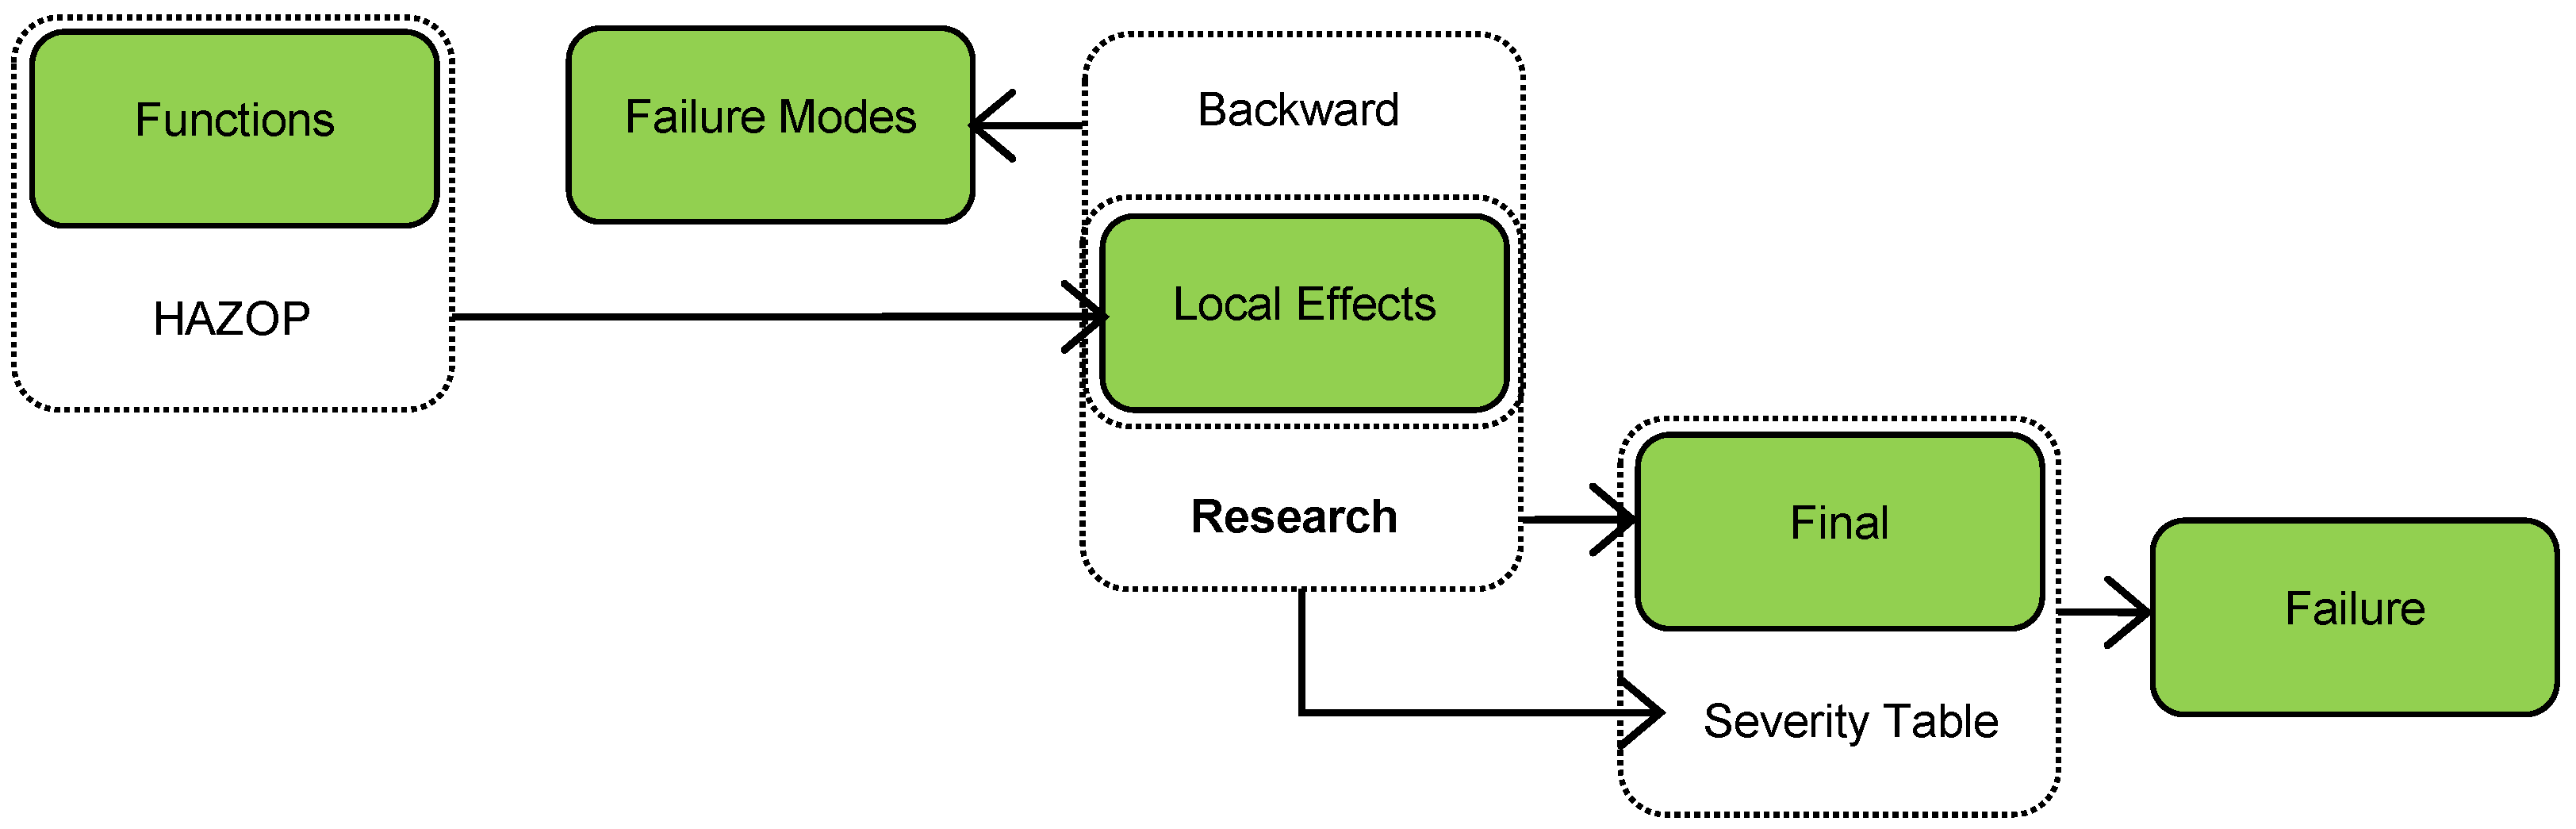
2.2. Description of Analysis Methodology and FMESA Analysis Method

The FMECA method, also known as E-FMECA (empirical FMECA), takes a different approach to identifying essential components compared to traditional FMECA. While traditional FMECA relies on inductive reasoning (forward identification) for this purpose [26], E-FMECA leverages experimental studies to determine these critical components.
FMESA, moreover, can be categorized as a hybrid risk analysis method, as it uses various methods and approaches to identify undesirable system states. Among other things, it assumes the use of the HAZOP methodology to conduct the process of identifying the so-called local effects of system failure (local effects). The idea and the individual steps of FMESA are shown in Figure 2.
The core of the FMESA (Figure 2) consists of FMEA/FMECA components, while their identification is realized with the support of HAZOP and experimental studies. These studies are used, on the one hand, to precisely formulate the core component of FMESA (i.e., final effects), and, on the other hand, they enable the realization of a quantitative procedure for indicating effects on the basis of measured values of key system/installation parameters (see Section 3.1). The individual components of the FMESA results sheet, with sample records, are shown in Table 2.
The first step in FMECA is to identify the functions performed by the system elements. This is in line with the types of FMEA analyses defined, for example, by [27] as PF-FMEA (Product Function Failure Modes and Effects Analysis) or PI-FMEA (Product Inter-face Failure Modes and Effects Analysis). PF-FMEA is used to evaluate the effects at the customer level following the failure of each of the top-level product functions. This is a powerful tool for understanding customer needs, as each function is examined with respect to its intended use [27].
Local effect (LE) analysis, a crucial component of FMECA, utilizes the HAZOP approach. This method employs guidewords to systematically question the achievement of design intentions and operational conditions for processes, procedures, or systems. By applying these guidewords, the goal is to identify deviations from the intended process flow, known as irregularities. Notably, this aligns perfectly with the objective of this article—analyzing combustion process quality. While a detailed description of HAZOP is available in [28], this work focuses on the key components relevant to achieving the article’s specific goals. Table 3 presents a set of guidewords tailored for the FMECA method, along with explanations and examples for their application.
In FMECA, deviations (Ds) encompass any departure from an element’s intended function. This includes negative fulfillment, qualitative or quantitative changes, substitutions with alternative actions, and disruptions in the timing or sequence of execution. Table 2 exemplifies a qualitative change in function realization.
The FMESA method defines local effects (LEs) as the consequences of a failure mode (FM) on the function, performance, or state of the analyzed component [24]. Identified deviations (Ds) are assumed to correspond to LEs. In the context of power systems, LEs typically manifest as changes in component functionality, leading to variations in the recorded operating parameters of the entire system or plant. An example of an LE is excessive pressure limitation caused by a malfunctioning reducing valve. Additionally, LEs can encompass observable events or operating states during experiments, such as the bending of a pipe in a hydrogen delivery system.
Leveraging the established definitions of local effects (LEs) and the principles of HAZOP methodology, FMECA employs a deductive approach, also known as backward reasoning or “worksback”. This approach analyzes the identified deviations (Ds) or formulated LEs and systematically reasons backward to identify the potential types of component failure (FMs) that could cause these deviations or LEs. In essence, we are working backward to understand how the component can fail and lead to the observed effects.
The FMESA methodology focuses on identifying measurable parameters (MPs) to quantify the final effects of a component malfunction in a power system. These MPs capture the changes in operating parameters caused by the malfunction. They are vital for both quantitative assessment of the effects (detailed in Section 2.3) and evaluation of the criticality of the failure (discussed in Section 3.1). Table 2 showcases examples of MPs (Measurable Parameters, e.g., lambda value and maximum pressure), while their specific values are presented in Section 2.3.
The FMESA method does not rely solely on theoretical analysis for final effects (FEs). Instead, it leverages controlled experiments on a test bench. Previously identified local effects (LEs) are simulated, and their actual impacts are measured and recorded using available equipment and sensors. This approach bridges the gap between theoretical predictions and real-world behavior.
The experimental findings culminated in the development of severity tables for a two-stage hydrogen-fueled combustion system. These tables are presented in Section 3, embodying the research objectives outlined in this article.
The severity tables developed in Section 3.1 rely on identifying operating parameters that reflect how failure impacts the system’s operation. For instance, excess air factor effectively captures the consequences of excessive pressure reduction by the control valve. By monitoring changes in this parameter within its designated limits (low parameter limit [LPL] and high parameter limit [HPL]), we can establish a spectrum of potential consequences, ranging from decreased power output and increased toxic emissions to engine failure.
Thus, if by FM we denote the set of possible failure forms of plant elements, i.e., FM = {FMi} (i = 1, 2, …, m), it is assumed that it is possible to assign to the i-th failure form a set of operating parameters characterizing it, i.e.,
i = 1 n F M i M P i = M P i j ; j = 1,2 , , n ,
where MPi = {MPij} (j = 1, 2, …, n) is a finite set of possible measurable parameters of system operation.
The measurable operating parameters of the system are the following:
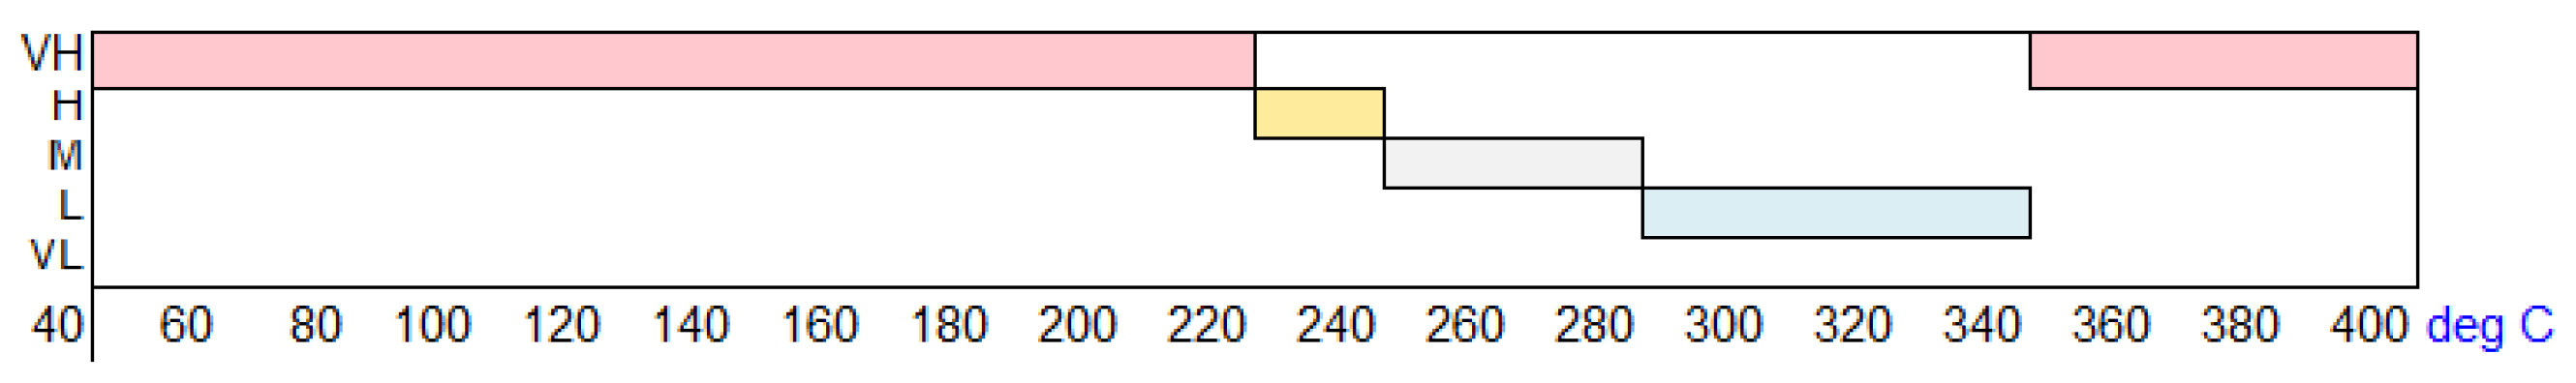
  • Exhaust temperature (Tex)//MPi1;
  • Shift in the center of combustion (CoC)//MPi2;
  • Exhaust outlet pressure (Psp)//MPi3;
  • Boost pressure (Pin)//MPi4;
  • Excess air ratio (λ)//MPi5;
  • Amount of nitrogen oxides in the exhaust gasses (NOx)//MPi6.
For example, the set of parameters for fault form FM1 formulated as “locked gate in closed position” takes the form MP1 = {Pex; NOx; Tex}.
Each final effect is characterized by a corresponding level of severity. Thus, let further FS be a finite set of ratings, FSk (k = 1, 2, …, l), such that l = 5 and that
i = 1 m j = 1 n F S = { V L , L , M , H , V H } ,
where VL, L, M, H, and VH are symbols of ratings/levels of severity in ascending order, understood as very low, low, medium, high, and very high, respectively.
The severity (level of “do-ness”) of xMPij values, representing the measurable parameter i for failure mode j, is determined using predefined scales. These scales are created by plotting the assigned severity levels against the corresponding parameter values. Examples of such scales can be found in Table 4, Table 5, Table 6, Table 7, Table 8 and Table 9.
For linear ascending severity scales taking values in the interval <0;1>, when any j-th parameter of plant operation takes values in the interval (LPLj; HPLj), the generalized form of the severity function can be expressed by the following formula:
φ ( x M P i j ) = V H w h e n f 1 ( 0.80 ) x M P i j H P L j H w h e n f 1 ( 0.60 ) x M P i j < f 1 ( 0.80 ) M w h e n f 1 ( 0.40 ) x M P i j < f 1 ( 0.60 ) L w h e n f 1 ( 0.20 ) x M P i j < f 1 ( 0.40 ) V L w h e n L P L j x M P i j < f 1 ( 0.20 )
where xMPij denotes the measured value of the j-th parameter associated with the i-th failure mode.
The function f(.) is a mapping of the beginnings and ends of the intervals of xMPij values (Table 4, Table 5, Table 6, Table 7, Table 8 and Table 9, col. 2) to the interval <0;1>, but it can be any other subset of the ordinal numbers. The essence, however, is the division of this subset resulting from severity levels. Suggesting typical risk matrices, five severity levels were assumed for the FMESA method, equally dividing the counter-domain of the f(.) function, i.e., the interval <0;1>. Successive beginnings and ends of severity levels thus correspond to the numbers <0;0.2), <0.2;0.4), <0.4;0.6), <0.6;0.8), and <0.8;1.0>. The function f(.) was introduced primarily to write down the procedure for obtaining grades or severity levels in the clearest (mathematical) way possible. These values, however, can also be used in the case of the need to determine numerical and non-linguistic severity values.
The effects of function (3) can be represented as severity matrices. An example of a failure severity matrix for a two-stage hydrogen-powered combustion system regarding exhaust gas temperature (Tex) is shown in Figure 3.
As can be seen, among other things, from the matrix (Figure 3), the form of the function f(.) is usually not linear; moreover, it can have a specific, empirical character. To create it, it is necessary to use expert knowledge of the system’s functioning at different values of measurable parameters.
Building on Equation (3), we can determine a severity rating from the set FS for each measured parameter MPij. However, Equation (1) establishes that each failure mode (FMi) is characterized by a set of parameters (MPi). Therefore, each failure mode also receives a set of severity ratings denoted by Ω. These ratings are derived from the individual severity scores calculated for each parameter within the set MPi.
i = 1 n F M i Ω i = ω i j :   ω i j = F S k M P i j .
The final level/estimation of FSi—severity for the i-th form of failure is determined as follows:
F S i = max j ω i j ; j = 1,2 , , n

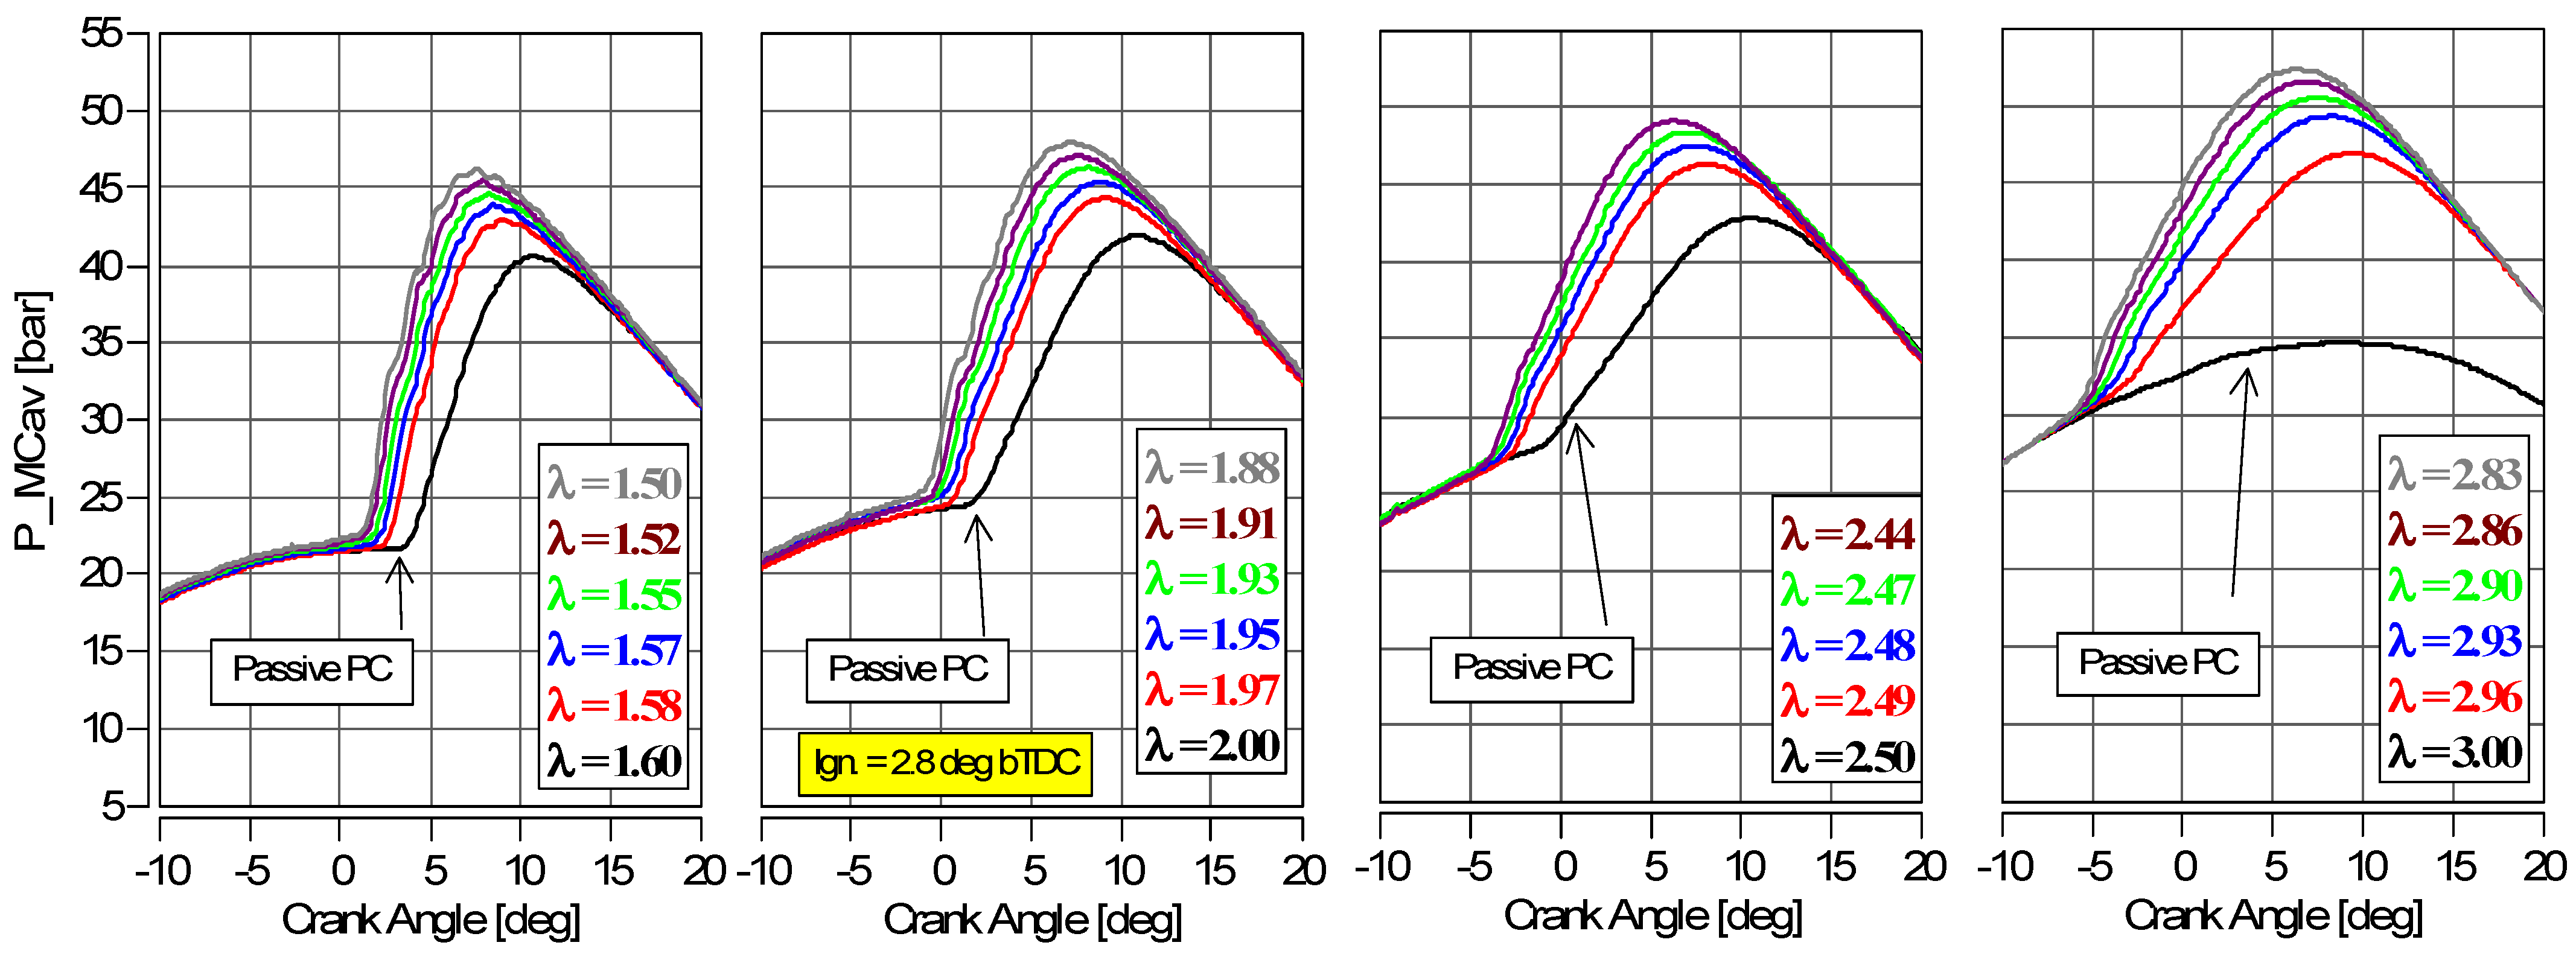
2.3. Analysis of the Internal Combustion Engine Operating Conditions

This failure analysis employed a single-cylinder research engine fueled by hydrogen and equipped with a two-stage TJI combustion system. To investigate various failure scenarios, different operating conditions were implemented. These conditions included combustion in both passive (no prechamber fuel supply) and active (fuel supplied to both prechamber and main chamber) TJI configurations. Additionally, varying excess air ratios were used to explore knocking combustion, which typically occurs at low air-to-fuel ratios (λ). Changes in λ also reflected varying engine loads, as the tests maintained a constant fuel dose to the main chamber. Finally, increasing the prechamber fuel dose was another control variable, demonstrating the possibility of full engine control. Collectively, these test conditions aimed to encompass a broad spectrum of potential failure modes in a hydrogen-fueled TJI engine.
Figure 4 presents pressure waveforms within the cylinder’s main chamber for various operating conditions. These conditions include using the passive or active chamber, along with varying excess air ratio (λ) and prechamber fuel dose. The data clearly demonstrate that increasing λ corresponds to a higher engine load. Additionally, the active chamber’s configuration exhibits a more significant influence on pressure waveforms. Notably, a high global excess air ratio negatively impacts combustion quality in the passive chamber. This is evident from the significant deviation of the combustion pressure line in the passive chamber case compared to the active chamber at high λ values, indicating a less optimal combustion process.
Thermodynamic analyses were performed using AVL Concerto V4.5 software (AVL, Graz, Austria). Analysis of cylinder pressure waveforms (Figure 4) revealed the impact of the prechamber fuel dose on thermodynamic indicators as excess air ratio (λ) changes. Regardless of the initial λ value (passive chamber), increasing the prechamber dose causes a slight decrease in λ (Figure 5a). Notably, the ignition angle remained constant throughout the tests (Figure 5b). This control method, however, led to a significant increase in the combustion center angle (CA) when using the passive chamber (no prechamber dose). This occurs because λ cannot be controlled within the prechamber, resulting in slow combustion and embers slowly flowing into the main chamber. Such a slow process is reflected in the rate and amount of heat release. Conversely, increasing the prechamber dose significantly stabilizes combustion, substantially shortening the initial combustion phase. The Center of Combustion (CoC) angle is accelerated by approximately 4 degrees. Interestingly, at λ = 3, this acceleration is doubled (8 degrees) compared to other λ values (Figure 5d). Overall, increasing the prechamber dose stabilizes CoC while shortening the combustion angle, indicating faster prechamber combustion. As expected, increasing λ generally leads to longer combustion times, with a significant increase in the combustion angle only observed at high λ-values (Figure 5c).
The subsequent section explores the engine’s operating ratios. Altering the excess air ratio (λ) necessitates a corresponding change in boost pressure (Figure 6a). The analysis revealed a linear relationship; increasing λ requires a higher engine boost pressure. Conversely, as λ increases, both the in-cylinder and exhaust gas temperatures decrease. This trend is confirmed by this study’s findings, which demonstrate a linear decrease in temperature with increasing λ (Figure 6b).
As shown in Figure 7a, increasing boost pressure alongside a rising excess air ratio (λ) leads to a corresponding increase in maximum cylinder pressure. Notably, the peak pressure in the main chamber is roughly 1 bar higher compared to the prechamber. This relationship appears independent of the specific λ value. However, it is important to acknowledge that a larger diameter for the channels connecting the prechamber to the main chamber could decrease this pressure differential.
Increasing the excess air ratio (λ) dilutes the air–fuel mixture, leading to a decrease in nitrogen oxide (NOx) concentration. This reduction is primarily driven by the lower combustion chamber temperatures associated with higher λ values. Notably, NOx concentration remains significant up to λ = 2. Beyond this point, minimum NOx values close to zero are observed (yellow points in Figure 7b). Consequently, for the purpose of this analysis, the relationship between λ and NOx is assumed to be linear up to λ = 2 (Figure 7b).

3. Results

3.1. Tabulated Severity Scale of Failure to Two-Stage Hydrogen-Fueled Combustion System

Severity is defined as “significance of grading of the failure-mode’s effect on item operation, on the item surrounding, or on the item operator” [30], to be estimated with respect to the defined boundaries of the system under analysis. Typically, the severity scale is presented in tabular form, including the names of the severity categories, their description, and rank numbers. A useful example of a severity scale was given, for example, by Crowe in his paper [27] and Dhillon in his paper [24]. Example notations they used to describe severity categories are “No real impact on system performance, and the customer may not even notice the failure”; “The failure affects safe item operation, involves non-compliance with government rules and regulations”; “High customer dissatisfaction due to the nature of the failure, such as a major system (e.g., automobile engine) function being inoperative”; and “The nature of failure causes only slight annoyance. The customer will probably only notice a slight deterioration of the performance”.
Building upon established severity assessment concepts, original severity scales were developed for one point of operation in a hydrogen-fueled two-stage combustion system. These scales not only provide qualitative descriptions of severity categories but also introduce quantification based on measured system/installation performance parameters (Table 4, Table 5, Table 6, Table 7, Table 8 and Table 9).
It should be added that the adopted ranges of measured parameters (MP value; Table 4, Table 5, Table 6, Table 7, Table 8 and Table 9, col. 2, for an example engine operating point) of a hydrogen-fueled engine (1500 rpm; IMEP = 0.36 MPa at λ = 1.6 and IMEP = 0.42 MPa at λ = 3.0). A more precise range can be obtained after analyzing varying engine speeds and loads.

3.2. FMESA: Selected Results of Failure Analysis by the FMESA Method

Table 10 presents the results of the failure analysis and severity assessment for the hydrogen-fueled two-stage combustion system. The selected failures represent those commonly encountered in hydrogen combustion systems and exhibit the highest FS (failure severity) scores. In cases where a wide range of measured parameter values indicated two severity levels, the more critical option was chosen.
Table 10 details the analysis of system elements and their potential failures. The first column identifies the analyzed elements. For each element, its failure form is determined based on its function (col. F) and a corresponding keyword (col. GW). This approach helps identify deviations or abnormalities in how the element fulfills its function (col. D). Notably, one element’s function can have multiple potential deviations (e.g., an ignition coil). These deviations or non-functions are considered local effects within FMESA (detailed in Section 2.2 of the methodology). Associated with these local effects are the damage characteristics, the root causes of the deviations, listed in the (FM) column. To assess damage severity following the FMESA methodology, measurable parameters (col. MP) are selected and recorded. These parameters reflect changes in system operation caused by the specific damage. Using these parameters and the criticality tables (Section 3.1), a severity level is assigned in the form of a “Classification No.” Since the FMESA method is hybrid (quantitative–qualitative) and severity is estimated based on measured parameters, we present the parameter value alongside the “Classification No.” (col. FS). Finally, this Table includes descriptions of the final effects (col. FE) for informational purposes; these do not impact the overall results of the method.

4. Discussion

The core of FMESA consists of FMEA/FMECA components, while their identification is realized with the support of HAZOP and experimental studies. The rationale for such an approach was primarily the desire to provide a methodical and comprehensive analysis of any system. This is because both FMEA and HAZOP assume a structured and systematic form of analysis (of both systems and designed or existing products, processes, procedures, organizational changes, or draft legal agreements [29]). However, the FMEA process begins with obtaining the results of identifying the types of defects (according to [30]), which, in our opinion, does not properly stimulate the analyst/expert’s reasoning in this identification (and which is often the assumption). Much better in this aspect is HAZOP, in which the identification of damage types is an intermediate step but obtained according to deductive reasoning (or so-called backward reasoning [26]). The team conducting the HAZOP analysis takes undesired results and deviations from the intended results and process conditions and looks backward for their possible causes and damage types [28]. This gives less uncertainty to the conclusion of the inference, the reason for which has been described in works [31,32], among others. On the other hand, it can be generally said that backward reasoning refers to the situation in which, for a known conclusion, one tries to find justifying premises. Understood in this way, reasoning involves finding (unknown) causes (expansions) for (known) effects (expansions). With regard to technical systems, it can be said to be applied in determining how a certain system condition occurred, usually involving the failure of system components. The specifics of the implementation of HAZOP presented here give the rationale for its use within FMESA.
Obtaining FMESA results using experimental studies is intended to reduce epistemic uncertainty, a crucial component of hazard and risk models (e.g., [33,34,35]). An essential part of the method is the implementation of experimental studies, which provide information on key FMESA elements and are used to develop damage severity scales. We propose presenting these scales in tabular form, a common and user-friendly approach. However, graphical representations (Figure 3) are also possible, showing severity changes as a function of measurable parameters. Since we propose developing such scales in a unified form for combustion systems (independent of individual parameter ranges), we call them “severity matrices of failure to hydrogen-fueled combustion systems”. However, it is important to remember that these scales and matrices were developed for a two-stage combustion system (for the selected engine operating point) and require calibration for different systems or installations (accurate classification metrics ranges can be obtained after analyzing varying engine speeds and loads).
The results for the final effect (FE) component and the final failure severity level are identified through controlled experimental studies, which avoid operating the plant to destruction. In this case, identification relies on expert prediction based on trends in system operation parameters. This aligns with the modern safety management approach, especially in high-risk domains like those addressed by resilience engineering [36], which emphasizes proactive decision making based on system behavior rather than waiting for a failure to analyze it retrospectively.
The method offers several promising extensions. Firstly, it can incorporate nonlinear function mappings or fuzzy sets within the classification metric, potentially expanding its applicability. These functions could belong to known classes, further enhancing universality. Ideally, identifying dedicated functions for specific plant types would eliminate the need for extensive research by the method’s user. Additionally, developing databases containing failure severity functions as characteristics of hydrogen plant components presents an interesting and valuable long-term goal.
When presenting the method’s results, we propose a slight modification to the typical notation for degrees of failure severity. Traditionally, verbal expressions or their acronyms are used. However, because our method is hybrid (severity is estimated based on measured parameter values), we believe it is more informative to present the parameter value alongside the assigned “Classification No.” (Table 5, column FS).
The method’s results directly contribute to risk assessment. One of the key components of risk models is the level of impact associated with events. Our method’s severity levels can be easily integrated into these models. Furthermore, by incorporating a probabilistic measure, such as failure mode frequency, the severity measure (FS) can be transformed into a criticality measure. The model’s future expansion could also involve estimating confidence intervals for measurable parameter values.
This method is particularly valuable during plant design or modification stages. Identifying critical installation elements and the most impactful failure modes is crucial for analyzing systems in general. Such analysis can significantly influence decisions about allowing a system to operate. Additionally, FMESA’s severity assessments can be used to rank plant variants, informing decisions like selection.
Our failure severity tables offer a unique two-dimensional approach. Firstly, severity levels are assigned quantitatively based on measured values of critical system parameters. Secondly, these tables codify the relationship between parameter values and specific, concrete failure effects within the installation.

5. Final Remarks

In application areas, evaluating systems from the perspective of their failure severity should become the cornerstone of systems management. This analysis can determine whether a system is authorized for operation.
Hydrogen’s unique properties necessitate a rigorous analysis of failure consequences (often addressed in FMEA-based risk assessments). While these assessments typically focus on worst-case scenarios like fire or explosion (which have a low probability), less severe, functionality-related effects are more likely to occur. Ignoring the criticality of these average-severity events is unreasonable, as they can significantly contribute to an unacceptable overall risk level. Existing studies on hydrogen plant severity assessment lack a focus on such moderate consequences, particularly for two-stage combustion systems.
This article aligns with current trends in hybrid risk analysis, which combine various analytical methods. It moves a step further by incorporating experimental studies to validate the results. The core objective is to present the methodology and implementation of a novel FMESA approach specifically tailored for two-stage hydrogen-fueled combustion systems. This includes the development of dedicated tabular scales to assess failure severity within this system type.
This method complements, rather than replaces, existing system management tools. The mathematical model is designed for flexibility, allowing for easy adaptation through different function forms or integration of fuzzy sets for linguistic variable mapping.
This work demonstrates the effectiveness of the FMESA method in quantitatively and qualitatively assessing failure severity for components in hydrogen-fueled combustion systems for an example engine operating point. FMESA evaluates the impact of failure on both system operation and overall combustion quality. We showcase this capability by presenting failure severity estimations for a two-stage hydrogen-fueled combustion system. The core contribution of this article lies in the introduction of the novel FMESA method for failure severity analysis. Furthermore, by applying FMESA to a two-stage combustion system, we address a critical gap in existing research.

Author Contributions

Conceptualization, A.G., I.P. and F.S.; methodology, A.G., I.P. and F.S.; software, A.G. and F.S.; validation, A.G. and I.P.; formal analysis, A.G., I.P. and F.S.; investigation, A.G., I.P. and F.S.; resources, I.P. and F.S.; data curation, A.G. and F.S.; writing—original draft preparation, A.G. and I.P.; writing—review and editing, A.G., I.P. and F.S.; visualization, I.P. and A.G.; supervision, A.G., I.P. and F.S.; project administration, A.G., I.P. and F.S.; funding acquisition, I.P. and F.S. All authors have read and agreed to the published version of the manuscript.

Funding

This work was supported by the Poznan University of Technology [interdisciplinary grant 0415/SIGR/7286].

Data Availability Statement

The original contributions presented in the study are included in the article, further inquiries can be directed to the corresponding author.

Conflicts of Interest

The authors declare no conflicts of interest.

Abbreviations

BDCbottom dead center
CoCcenter of combustion
E-FMECAempirical FMECA
ETAevent tree analysis
FEfinal effects
FMfailure mode
FMEA/FMECAfailure mode and effect analysis/failure mode, effects and criticality analysis
FMESAfailure mode and effects severity analysis
FSfailure severity
FTAfault tree analysis
HAZOPhazard and operability study
HPLhigh parameter limit
LElocal effect
LHVlower heat value
LPLlow parameter limit
MCmain chamber
MPsmeasurable parameters
NHTSAnational highway traffic safety administration
Ppressure
PCpre-chamber
PFIport fuel injection
PF-FMEAproduct function failure modes and effects analysis
PI-FMEAproduct inter-face failure modes and effects analysis
PRDpressure relief device
qofuel dose
SOIstart of combustion
TDCtop dead center
TJIturbulent jet ignition
λexcess air coefficient

References

  1. Safe Use of Hydrogen as a Fuel in Commercial Industrial Applications. Polish Register of Shipping S.A., Gdansk 2021. Available online: https://prs.pl/en/prs-en/ (accessed on 20 May 2024). (In Polish).
  2. Corrigan, D.J.; Di Blasio, G.; Ianniello, R.; Silvestri, N.; Breda, S.; Fontanesi, S.; Beatrice, C. Engine knock detection methods for spark ignition and prechamber combustion systems in a high-performance gasoline direct injection engine. SAE Int. J. Engines 2022, 15, 883–897. [Google Scholar] [CrossRef]
  3. Pielecha, I.; Szwajca, F. Combustion characteristics of a hydrogen-fueled TJI engine under knocking conditions. Energies 2024, 17, 1324. [Google Scholar] [CrossRef]
  4. Kalghatgi, G.; Algunaibet, I.; Morganti, K. On knock intensity and superknock in SI engines. SAE Int. J. Engines 2017, 10, 1051–1063. [Google Scholar] [CrossRef]
  5. Pielecha, I.; Szwajca, F.; Skobiej, K. Experimental investigation on knock characteristics from pre-chamber gas engine fueled by hydrogen. Energies 2024, 17, 937. [Google Scholar] [CrossRef]
  6. Aramburu, A.; Guido, C.; Bares, P.; Pla, B.; Napolitano, P.; Beatrice, C. Knock detection in spark ignited heavy duty engines: An application of machine learning techniques with various knock sensor locations. Measurement 2024, 224, 113860. [Google Scholar] [CrossRef]
  7. Pan, M.; Wei, H.; Feng, D. Effects of exhaust gas recirculation on knock intensity of a downsized gasoline spark ignition engine. J. Energy Res. Technol. 2019, 141, 011101. [Google Scholar] [CrossRef]
  8. Wang, K.; Zhang, Z.; Sun, B.; Zhang, S.; Lai, F.; Ma, N.; Ju, X.; Luo, Q.; Bao, L.-Z. Experimental investigation of the working boundary limited by abnormal combustion and the combustion characteristics of a turbocharged direct injection hydrogen engine. Energy Convers. Manag. 2024, 299, 117861. [Google Scholar] [CrossRef]
  9. Noor, W.B.; Amin, T. Towards sustainable energy: A comprehensive review on hydrogen integration in renewable energy systems. Future Energy 2024, 3, 1–17. [Google Scholar] [CrossRef]
  10. Locke, K. The urgency of hydrogen: Environmental issues and the need for change. Future Sustain. 2024, 2, 46–58. [Google Scholar] [CrossRef]
  11. Yip, H.L.; Srna, A.; Yuen, A.C.Y.; Kook, S.; Taylor, R.A.; Yeoh, G.H.; Medwell, P.R.; Chan, Q.N. A review of hydrogen direct injection for internal combustion engines: Towards carbon-free combustion. Appl. Sci. 2019, 9, 4842. [Google Scholar] [CrossRef]
  12. Liu, F.; Zhou, L.; Hua, J.; Liu, C.; Wei, H. Effects of pre-chamber jet ignition on knock and combustion characteristics in a spark ignition engine fueled with kerosene. Fuel 2021, 293, 120278. [Google Scholar] [CrossRef]
  13. Cui, S.; Zhu, G.; He, L.; Wang, X.; Zhang, X. Analysis of the fire hazard and leakage explosion simulation of hydrogen fuel cell vehicles. Therm. Sci. Eng. Prog. 2023, 4, 101754. [Google Scholar] [CrossRef]
  14. Correa-Jullian, C.; Groth, K.M. Liquid hydrogen storage system FMEA and data requirements for risk analysis. In Proceedings of the 30th European Safety and Reliability Conference and 15th Probabilistic Safety Assessment and Management Conference, Venice, Italy, 1–5 November 2020; pp. 973–980. [Google Scholar] [CrossRef]
  15. Stephens, D.R.; Rose, S.E.; Flamberg, S.A.; Ricci, S.M.; George, P.E. Failure Modes and Effects Analysis for Hydrogen Fuel Cell Vehicles—Subtask 1; National Highway Traffic Safety Administration: Washington, DC, USA, 2009; p. 170. Available online: https://www.nhtsa.gov/sites/nhtsa.dot.gov/files/811075_0.pdf (accessed on 20 June 2024).
  16. Rodionov, A.; Wilkening, H.; Moretto, P. Risk assessment of hydrogen explosion for private car with hydrogen-driven engine. Int. J. Hydrogen Energy 2011, 36, 2398–2406. [Google Scholar] [CrossRef]
  17. Ehrhart, B.D.; Harris, S.R.; Blaylock, M.L.; Muna, A.B.; Quong, S. Risk assessment and ventilation modeling for hydrogen releases in vehicle repair garages. Int. J. Hydrogen Energy 2021, 46, 12429–12438. [Google Scholar] [CrossRef]
  18. Jung, W.-C.; Jung, P.-K.; Moon, H.-M.; Chang, M.-H.; Yun, S.-H.; Lee, H.-G.; Hwang, M.-W.; Woo, I.S. Hydrogen breakthrough behaviors for cryogenic adsorption and HAZOP study. Fusion Eng. Des. 2018, 134, 123–127. [Google Scholar] [CrossRef]
  19. Suzuki, T.; Izato, Y.; Miyake, A. Identification of accident scenarios caused by internal factors using HAZOP to assess an organic hydride hydrogen refueling station involving methylcyclohexane. J. Loss Prevent. Proc. 2021, 71, 104479. [Google Scholar] [CrossRef]
  20. Fu, Y.; Qin, Y.; Wang, W.; Liu, X.; Jia, L. An extended FMEA model based on cumulative prospect theory and type-2 intuitionistic fuzzy VIKOR for the railway train risk prioritization. Entropy 2020, 22, 1418. [Google Scholar] [CrossRef]
  21. Macura, D.; Laketić, M.; Pamučar, D.; Marinković, D. Risk analysis model with interval type-2 fuzzy FMEA—Case study of railway infrastructure projects in the Republic of Serbia. Acta Polytech. Hung. 2022, 19, 103–118. [Google Scholar] [CrossRef]
  22. Appoh, F.; Yunusa-Kaltungo, A.; Sinha, J.K.; Kidd, M. Practical demonstration of a hybrid model for optimising the reliability, risk, and maintenance of rolling stock subsystem. Urban Rail Transit 2021, 7, 139–157. [Google Scholar] [CrossRef]
  23. Casamirra, M.; Castiglia, F.; Giardina, M.; Lombardo, C. Safety studies of a hydrogen refuelling station: Determination of the occurrence frequency of the accidental scenarios. Int. J Hydrogen Energy 2009, 34, 5846–5854. [Google Scholar] [CrossRef]
  24. Dhillon, B.S. Design Reliability: Fundamentals and Applications; CRC Press: Boca Raton, FL, USA; London, UK; New York, NY, USA; Washington, DC, USA, 1999. [Google Scholar]
  25. Jin, Y.; Luo, H.; Zhang, G.; Zhai, C.; Ogata, Y.; Matsumara, Y.; Ichikawa, T.; Nakashimada, Y.; Kim, W.; Nishida, K. Ignition timing effect on the combustion performance of hydrogen addition in methane fermentation gas in a local energy system. Fuel 2022, 324, 124714. [Google Scholar] [CrossRef]
  26. Gill, A. Layered Models of Safety Systems for Rail Transport Applications; Poznan University of Technology Publishing House: Poznan, Poland, 2018; ISBN 978-83-7775-517-4. [Google Scholar]
  27. Crowe, D.; Feinberg, A. Design for Reliability, 1st ed.; CRC Press LLC: Boca Raton, FL, USA, 2001. [Google Scholar] [CrossRef]
  28. International Electrotechnical Commission (IEC). Hazard and Operability Studies (HAZOP Studies)—Application Guide, 2nd ed.; IEC: Geneva, Switzerland, 2016. [Google Scholar]
  29. ISO 31010; Risk Management—Risk Assessment Techniques. ISO: Geneve, Switzerland, 2009.
  30. IEC 60812; Analysis Techniques for System Reliability—Procedure for Failure Mode and Effects Analysis (FMEA). International Electrotechnical Commission: Geneva, Switzerland, 2006.
  31. Gill, A.; Kadziński, A. Hazard identification model. In Proceedings of the 20th International Scientific Conference, Transport Means, Kaunas University of Technology, Juodkrante, Lithuania, 5–7 October 2016; pp. 885–890. [Google Scholar]
  32. Urbański, M. Abductive Reasoning. Models and Procedures; Adam Mickiewicz University Scientific Publishing House: Poznan, Poland, 2009. [Google Scholar]
  33. Aven, T. Risk Analysis, 2nd ed.; John Wiley & Sons: Hoboken, NJ, USA, 2015. [Google Scholar] [CrossRef]
  34. SRA. Society for Risk Analysis Glossary, Society for Risk Analysis (SRA). 2018. Available online: https://www.sra.org/wp-content/uploads/2020/04/SRA-Glossary-FINAL.pdf (accessed on 21 June 2024).
  35. Thekdi, S.; Aven, T. Characterization of biases and their impact on the integrity of a risk study. Saf. Sci. 2024, 170, 106376. [Google Scholar] [CrossRef]
  36. Azadeh, A.; Salehi, V.; Arvan, M.; Dolatkhah, M. Assessment of resilience engineering factors in high-risk environments by fuzzy cognitive maps: A petrochemical plant. Saf. Sci. 2014, 68, 99–107. [Google Scholar] [CrossRef]
Figure 1. Test stand diagram for a two-stage hydrogen combustion system.
Energies 17 04802 g001
Figure 2. FMESA steps with FMEA/FMECA components (green color).
Energies 17 04802 g002
Figure 3. An example of a severity matrix for the Tex parameter.
Energies 17 04802 g003
Figure 4. Cylinder pressure for varying values of excess air ratio (passive chamber—no fuel supply to the pre-chamber, n = 1500 rpm, qo_MC = 3 mg/inj).
Energies 17 04802 g004
Figure 5. Indicators of engine adjustments when changing the pre-chamber fuel dose: (a) change in excess air ratio (decrease of λ when increasing the pre-chamber dose); (b) constancy of ignition timing (no change in angle causes the center of combustion to change); (c) change in combustion duration (reduction in combustion duration as a result of increasing the pre-chamber fuel dose); and (d) change in combustion center (at a constant SOI value, acceleration of the combustion center is observed).
Energies 17 04802 g005aEnergies 17 04802 g005b
Figure 6. Change in engine adjustment indicators depending on the excess air ratio: (a) boost pressure; (b) exhaust gas temperature.
Energies 17 04802 g006
Figure 7. Change in engine performance indicators: (a) maximum cylinder pressure in relation to the passive and active pre-chamber system; (b) concentration of nitrogen oxides in the exhaust gasses.
Energies 17 04802 g007
Table 1. Typical physiochemical properties of hydrogen [25].
SpeciesHydrogen
Chemical formulaH2
LHV [MJ/kg]120
Laminar burning velocity at λ = 1 [m/s]3.51
Auto-ignition temperature [K]773–850
Research octane number>100
Flammability limit in air [vol %]4.7–75
Quench distance [mm]0.64
Absolute minimum ignition energy [mJ]0.02
Latent heat of vaporization [kJ/kg]461
Table 2. The column headings of the FMESA worksheet with their origin and labels.
FMESA Column Header NameSymbolDescription
ElementEPressure reducer
FunctionFMaintaining constant pressure behind the main valve
Guide WordGWmore
Deviation/Local EffectDFuel reduction
Failure ModeFMReducer pin jammed
Measurable ParametersMPLambda value = 1, 2… Pmx = …; Tex = …
Final EffectFEEngine power drop
Failure SeverityFSMax[FS(MP)] = FS(λ) = H1.2
Table 3. A set of guide words adopted for the E-FMECA method. Own compilation based on [19,28,29].
Guide WordInterpretationExamples
NONo part of intended result or intention is achieved; task not completedNo flow; no data or control signal passed; operator does not take action
MOREQuantitative increase in output or in the operating condition; do more than or more of the required actionLarger quantity handled; valves opened more than required; data are passed at a higher rate than intended
LESSQuantitative decrease, e.g., lower temperature; do less of the required actionSmaller quantity handled; not all valves opened in a step; data are passed at a lower rate than intended
AS WELL ASQuantitative increase, but, e.g., with additional material, impurities present; do something in addition to the required task; simultaneous execution of another operation/stepSome additional or spurious signal is present; additional material handled; open additional valve
PART OFQuantitative decrease (e.g., only one or two components in a mixture); not all task in an action carried out; only some of the intention is achieved, i.e., only part of intended fluid transfer takes placeThe data or control signal are incorrect; action within a step omitted
REVERSEOpposite (e.g., backflow); do the opposite of the required action; covers reverse flow in pipe Closes valves instead of opens; needs to reverse previous action; normally not relevant
OTHER THANNo part of the intention is achieved, something completely different happens (e.g., flow or wrong material); a result other than the original intention is achieved, i.e., transfer of wrong materialActs on wrong valve; incorrect material handled; the data or control signals are incorrect
EARLYSomething happens early relative to clock time, e.g., cooling or filtrationThe signals arrive too early with reference to clock time
LATESomething happens late relative to clock time, e.g., cooling or filtrationThe signals arrive too late with reference to clock time
BEFORESomething happens too early in a sequence, carry out the action after the time specifiedThe signals arrive earlier than intended within a sequence
AFTERSomething happens too late in a sequence, carry out the action after the time specifiedThe signals arrive later than intended within a sequence; changes order of steps; takes action too slowly
GW applied to parametersPhysical properties of a material or process; physical conditions (temperature, speed); specified intention of a component of a system or design (e.g., information transfer); operational aspectsIncrease in combustion temperature; increase in the λ-value; increasing CoC
Table 4. Severity scale of damage to a two-stage hydrogen-fueled combustion system for the exhaust gas temperature parameter.
Measurable
Parameter (MP)
MP Value
(xMPi1)
Classification Description/Final Effect (FE)Classification Term or NameClassification No. (FSk = φ(z))
MPi1—Exhaust temperature (Tsp)

(LPL;HPL)
= (40;400) deg C
40–220Misfiring; loss of power; lack of fuel delivery Very HighVH
220–240Large λ; power loss, chronic combustionHighH
240–280Lambda in the region of 2.0–3.0MediumM
280–340Slight increase in λLowL
340–400Knocking combustion, threatens to destroy the engineVery HighVH
Table 5. Severity scale of damage to a two-stage hydrogen-fueled combustion system for the center of the combustion change parameter.
Measurable
Parameter (MP)
MP Value
(xMPi2)
Classification Description/Final Effect (FE)Classification Term or NameClassification No. (FSk = φ(z))
MPi2—Changing the center of combustion (CoC)

(LPL;HPL)
= (0;20)
0–4Damage to the engine, decrease in mechanical efficiencyVery HighVH
4–7Proper engine operationHighH
7–10Reduction in NOx, decrease in engine efficiencyMediumM
10–14Increased Tex; lower NOxLowL
14–20Engine overheating, NOx decreaseHighH
Table 6. Severity scale of damage to a two-stage hydrogen-fueled combustion system for the parameter change in boost pressure.
Measurable
Parameter (MP)
MP Value
(xMPi3)
Classification Description/Final Effect (FE)Classification Term or NameClassification No. (FSk = φ(z))
MPi3—Changing boost pressure

(LPL;HPL)
= (0;2)
0.0–0.8Leak in intake system; turbo failure; no combustion; ignition lossVery HighVH
0.8–1.0Operation at low λ; knock combustion;HighH
1.0–1.2Specific work; λ in the range 0.95–3MediumM
1.2–1.6Overcharging; ignition loss; power lossLowL
1.6–2.0Lack of fuel pressure; faulty fuel supply line; frequent ignition lossVLVL
Table 7. Severity scale of damage to a two-stage hydrogen-fueled combustion system for the parameter change in cylinder pressure.
Measurable
Parameter (MP)
MP Value
(xMPi4)
Classification Description/Final Effect (FE)Classification Term or NameClassification No. (FSk = φ(z))
MPi4—Change in cylinder pressure

(LPL;HPL)
= (0;100 bar)
0.0–15No compression; defective engineVery HighVH
15–40Low load; proper working conditionsVery lowVL
40–60Increased loadLowL
60–80High engine load; possible knocking combustionHighH
80–100Knocking combustion; air intake damage, fuel supply jammed in excess position; possible engine damageVery highVH
Table 8. Severity scale of damage to a two-stage hydrogen-fueled combustion system for the lambda change parameter.
Measurable
Parameter (MP)
MP Value
(xMPi5)
Classification Description/Final Effect (FE)Classification Term or NameClassification No. (FSk = φ(z))
MPi5—Lambda value change

(LPL;HPL)
= (0;5 bar)
0.0–0.8No combustion; no fuel supply; collapsed fuel supplyHighH
0.8–1.0Knock combustion; very high NOx;Very HighVH
1.0–2.0Possible knock; large NOxMediumM
2.0–3.0Proper combustion; mid-range NOxLowL
3.0–5.0not enough fuel; ignition loss; low Tex; near zero NOxVery LowVL
Table 9. Severity scale of damage to a two-stage hydrogen-fueled combustion system for the parameter of the amount of nitrogen oxides in the exhaust gas.
Measurable
Parameter (MP)
MP Value
(xMPi6)
Classification Description/Final Effect (FE)Classification Term or NameClassification No. (FSk = φ(z))
MPi6—amount of nitrogen oxides in the exhaust gas (NOx)

(LPL;HPL)
= (0;500 ppm)
0–20Large lambda, ignition loss, power lossVery HighVH
20–50High lambda, proper combustionVery LowVL
50–100Lambda in the region of 1.5–2.0; normal operation; passive chamber operation possibleVery LowVL
100–300High load; low lambda; possible knocking combustionMediumM
300–500Knocking combustion; pre-empted ignition; possible engine damageVery HighVH
Table 10. Results of failure analysis of a two-stage hydrogen-fueled combustion system by FMESA for the selected engine operating point.
ElementFunctionGuide WordDeviation/Local EffectFailure ModeValues of Measurable ParametersFinal EffectFailure Severity
EFGWDFMMPFEFS
Fuel pressure regulatorPressure reduction after the main valvemoreReduction in fuel dosageReducer pin jamλ > 3 → VL
15 < Pcyl = <20 bar → VL
Tex < 220 deg C → VH
Decrease in engine powerVH
(Tex < 220)
Supply line (fuel lines)Fuel transportlessReduction in fuel dosageTube ruptureλ > 3.;→ VL
15 < Pcyl = <30 bar → VL
200 < Tex < 320 deg C → H
Decrease in engine powerH
(Tex 200–320)
Prechamber valveFuel deliverynoNo fuel dosage for prechamberPc valve jammingCoC > 10 deg → H
15 < Pcyl = Pcyl—5 bar → VL
λ unchanged
Decrease in engine powerH
(CoC > 10)
MC injectorFuel deliverynoDrastic reduction in the dose to the main chamberInjector mechanical damage λ > 3 → VL
15 < Pcyl = < 20 bar → VL
Tex < 220 deg C → VH
No engine operationVH
(Tex < 220)
Ignition coilEnergy generation to discharge on the spark plugnoMisfireContact corrosion15 < Pcyl = < 30 bar → VL
Tex < 220 deg C → VH
Uneven engine operationVH
(Tex < 220)
Air intake in front of the cylinderLimited airflow into the cylinder Power limitationLeakage, for example, at the throttleCoC = 3–5 deg → VH
λ = 1–2 or less → VH
Decrease in engine power; knocking combustionVH
(CoC = 5)
Exhaust systemFlue gas discharge in the installationother thanEscape of exhaust fumes into the environmentLeakage/breakageTex < 220 deg C → VH
0 < NOx < 50 ppm → VL(>2 0)
A significant amount of fumes in the environmentVH
(Tex < 220)
Exhaust systemExhaust to the installationnoNo exhaustLocked slider in closed positionTex = 300 deg C → LLimited engine powerL
(Tex = 300)
Hydrogen inlet lineFuel transportationlessLimited hydrogen flowCable bendλ > 2 → L
15 < Pcyl = < 30 bar → VL
Decrease in engine powerL
(λ > 2)
Ignition coilEnergy generation to discharge on the spark pluglessToo large an ignition advanceIntake pressure too low, map sensorCoC < 2–3 deg → VH
Tex > 300 → VH
NOx > 300 ppm → VH
Knock combustionVH
(CoC = 2–3)
Ignition coilEnergy generation to discharge on the spark plugmoreToo large an ignition delayIntake pressure too high, map sensorCoC > 15 deg → H
Tex average →H level → H
50 < NOx < 150 ppm → M
Chronic combustionH
(CoC = 15)
Disclaimer/Publisher’s Note: The statements, opinions and data contained in all publications are solely those of the individual author(s) and contributor(s) and not of MDPI and/or the editor(s). MDPI and/or the editor(s) disclaim responsibility for any injury to people or property resulting from any ideas, methods, instructions or products referred to in the content.

