Article

Advancements on Lumped Modelling of Membrane Water Content for Real-Time Prognostics and Control of PEMFC

by
Massimo Sicilia
,
Davide Cervone
,
Pierpaolo Polverino
* and
Cesare Pianese
Department of Industrial Engineering, University of Salerno, Via Giovanni Paolo II 132, 84084 Fisciano (SA), Italy
*
Author to whom correspondence should be addressed.
Energies 2024, 17(19), 4841; https://doi.org/10.3390/en17194841
Submission received: 29 August 2024 / Revised: 23 September 2024 / Accepted: 24 September 2024 / Published: 27 September 2024
(This article belongs to the Special Issue Current Advances in Fuel Cell and Batteries)

Abstract

:
PEMFCs play a key role in the energy transition scenarios thanks to the zero emissions, versatility, and power density. PEMFC performances are improved optimizing water management to ensure proper ion transport: it is well known that a well-balanced water content avoids either electrodes flooding or membrane drying, causing gas starvation at the active sites or low proton conductivity, respectively. In this paper, an analytical formulation for water transport dynamics within the membrane, derived from membrane water balance, is proposed to overcome the limitations of PEM dynamics model largely adopted in the literature. The dynamics is simulated thanks to the introduction of a characteristic time with a closed analytical form, which is general and easily implementable for any application where both low computational time and high accuracy are required. Furthermore, the net water molar fluxes at the membrane boundaries can be easily computed as well for a cell’s simulation. The analytical formulation has a strong dependency on the operative conditions, as well as physical parameters of the membrane itself. From the proposed formulation, for a 200 µm membrane, the characteristic time can vary from 5 s up to 50 s; this example shows how control strategies must consider PEM dynamic behavior.

1. Introduction

Proton Exchange Membrane Fuel Cells (PEMFCs) are a promising technological solution to promote the decarbonization of both automotive and energy production sectors, thanks to their fast transient response, easiness of use, zero environmental impact, and high efficiencies. Their versatility allows them to be applied to many uses, such as stationary and automotive sectors [1]. PEMFCs are electrochemical devices that exploit the redox reaction of hydrogen and oxygen to produce electrical and thermal energy, with water as the only byproduct, typically in the liquid phase (considering the operating temperature lower than 100 °C). Ensuring proper cell water content guarantees optimal performances and low hydrogen consumption; hence, optimal water management represents a key control objective fundamental to improve cell durability and performance [2].
The Proton Exchange Membrane (PEM) is the main cell component, and it serves to three different functions [3]: (i) guarantee the movement of proton charges from anode to cathode, (ii) physically separate reactants, and (iii) electrically insulate the electrodes. Its structure is composed by polymeric chains with three main elements [4]: (i) a polytetrafluoroethylene (PTFE) backbone, to ensure chemical and thermal stability, (ii) sulfonic acid groups S O 3 , to allow the proton flow across the membrane, and (iii) side chains, to link backbone and sulfonic groups. The PTFE backbone is hydrophobic to avoid that water molecules adhere on its surface, whereas sulfonic groups are hydrophilic to guarantee that water molecules and protons can be absorbed, thus promoting protons transport with a high water content. It is worth recalling that water and proton form the hydronium H3O+ ion, which acts as a proton carrier within the membrane. As a result, the membrane is permeable to water. The movement of protons across the membrane is based on two main ions transport mechanisms, namely Grotthus hopping, according to which, protons jump from one sulfonic group to another, and vehicular diffusion, where protons are carried by water molecules that spread through the membrane [5]. Grotthus hopping is typically predominant at low water contents, while vehicular diffusion occurs only in the presence of water. Figure 1 provides a schematic representation of the membrane structure, along with the two mentioned ions transport mechanisms.
Even if the Grotthus hopping mechanism allows ions to flow through the membrane due to the electrodes potential difference, the predominant ion transport mechanism is vehicular diffusion. Hence, to promote the protons flow, water permeation inside the membrane shall be enhanced, e.g., by feeding the cell with humidified reactants. Moreover, the water produced by the oxygen reduction reaction (ORR) taking place at the cathode can contribute to the humidification of the air/oxygen that reaches the Catalyst Layer (CL) at the interface between the membrane and the Gas Diffusion Layer (GDL), through which the gases reach the CL. It is worth nothing that an increase in the current generates more protons at the anode, leading to major water production at the cathode. However, the amount of water should not be too much, to avoid electrodes flooding. Therefore, it is then evident how a proper control of water content in the different cell sections is crucial to avoid detrimental phenomena and ensure optimal operation. This comment justifies the need for a thorough investigation of all water transport mechanisms occurring within the fuel cell, especially with particular attention to the membrane and the electrodes.
With respect to the membrane volume, the three main water transport mechanisms are [6] (i) electro-osmotic drag, in which water is dragged by the ions flow through the membrane; (ii) hydraulic permeation, where the water flux is driven by pressure gradient across the membrane; and (iii) diffusion, through which water flows thanks to concentration gradient across the membrane. The three aforementioned mechanisms may occur in parallel, contributing to the overall water flow. However, to identify the net flux direction (i.e., from anode to cathode or vice versa), the magnitude and direction of each mechanism shall be properly identified. Electro-osmotic drag always follows the potential difference direction; hence, the flux direction is always from anode to cathode, whereas both convection and diffusion are gradient-driven (pressure and concentration, respectively), so water can move in either direction. The concentration gradient depends on the amount of water present in each electrode, specifically at CL sides at membrane boundaries. Hence, due to the water production occurring at the cathode side, there is an intrinsic unevenness, which can be compensated through the humidification of the gases fed to the electrodes. From this physical description, the role of proper balance of the water transport mechanisms across the membrane and the humidification of the electrodes emerges. Moreover, it is evident that the complexity of the several transport mechanisms can be described through nonlinear equations, which require an accurate modelling analysis to achieve effective water management strategies to ensure the best water membrane content.
It is worth considering that water management shall ensure that no membrane drying or electrodes flooding occurs, or at least, they happen limitedly throughout the entire fuel cell lifetime. In the case of drying conditions, irreversible membrane degradation usually occurs, leading to cracks formation and gas crossover [7,8]. On the other hand, flooding happens at GDLs due to poor water removal, causing a physical barrier to gas diffusion at the CL [9] and thus leading to reactants starvation. Typically, flooding involves the cathode due to the water generation [10]; from a manufacturing point of view, this can be avoided, modifying the gas flow channel’s shape [11] or GDL material’s [12,13]; from a management point of view, flooding can be avoided, increasing cell temperature, to enhance water evaporation by feeding the stack with hot reactants or by a proper cell cooling management or adopting purging strategies to rapidly evacuate excess water. However, in the literature, it is possible to find cases in which the anode flooding is critical due to the vapor condensation when feeding the stack with humidified hydrogen [14,15]. The flooding process can be monitored in real time with fast computational models, such as those published by the authors [16,17], capable of simulating water emersion for capillarity from the GDL and air–water interaction in the Gas Flow Channel (GFC), estimating the water removal rate. When the membrane is hydrated, it is subject to volume expansion (i.e., swelling) due to the presence of water [18,19].
While the water membrane content can be directly measured offline adopting standard techniques, e.g., neutron magnetic resonance [20] and neutron imaging [21], it is not possible to directly measure the water membrane content while the cell is running in a real environment; therefore, virtual sensors or observers based on physical models should be implemented. Most literature works stand on that of Springer et al. [22], in which a direct steady-state algebraic relationship (i.e., black box model) between water activity and water membrane content was defined. Afterwards, it was observed from the literature review of Dickinson and Smith [23] that many subsequent works extended the formulation with different regressions. Notably, the work of Mazumder [24] proposed a comprehensive one-dimensional model of membrane water balance considering the three main transport mechanisms (i.e., electro-osmotic drag, convection, and diffusion). The model was solved numerically in steady-state operation with parametric boundary conditions, leading to the formulation of a four-dimensional maps database. In a previous authors’ work [25], an analytical steady-state solution to the problem posed in the work of Mazumder [24] was conceived under simplified assumptions, leading to a fast and accurate calculation of an average net water membrane content. Wang et al. [26] implemented molecular dynamics simulations to predict the value of an electro-osmotic drag coefficient in different operative conditions, resulting in good agreement with experimental literature data at a low water membrane content; however, this approach is not suitable for real-time applications. Wang et al. [27] performed molecular dynamics simulations to deepen the diffusion transport mechanism, finding how the diffusion coefficient for hydronium ions is positively related to cell temperature, in agreement with the literature. In this case, for the purpose of on-board prognostics and control uses, it is preferred to adopt reasonable simplification assumptions to maintain a fast computational time.
Simulating the membrane dynamics requires specific approaches: for the purposes of prognosis and control, a mean value modelling of the membrane water content based on simple membrane water balance is the preferred choice, typically neglecting convection and nonlinearities [28,29]; another possibility is to represent the dynamic effects with equivalent electrical circuits representations [30,31]. In any case, these approaches tended to oversimplify the problem, leading to good results only in a limited operative range, without good generalizability. To deepen the analysis, a multi-dimensional modelling approach should be adopted: Chan Lee et al. [32] introduced a one-dimensional membrane model in an integrated PEMFC stack model; a nonlinear membrane water balance is defined and solved with a finite difference method. The number of nodes is established to balance convergence and computational burden, strongly limiting the adopted number. This type of formulation is suitable for membrane dynamics, but the solution accuracy is too affected by the computational burden. In the work of Li et al. [33], a nonlinear one-dimensional single-phase water balance considering a transition region between membrane and the electrodes’ Catalyst Layer was developed, and adsorption/desorption processes were modelled too. Once again, the strong nonlinearity of the physical equation forced the authors to solve the problem with numerical methods, losing in computational performances, accuracy, and generalizability. Two-dimensional dynamic models can be also developed, but the computational burden required for these cases makes this approach not suitable at all for real-time control and prognosis purposes [34,35].
From the reviewed literature, it emerged that two different approaches can be followed to estimate the water membrane content. The first approach considers high physical details and involves complex experimental procedures or numerical simulation techniques to represent the occurring phenomena with great accuracy but with high computational burdens. This last drawback hinders the possibility to apply the first approach to fast on-board prognostic and control uses. A second approach involves simplifying assumptions to gain computational speed, but they are usually valid for narrow operating ranges where nonlinearities can be neglected, thus losing in generalizability. The presented approaches lack a proper simulation method for membrane dynamics in real-time applications.
Within the above context and research framework, the objective of this work is to improve the simplified model already presented by the authors in their previous work [25] by defining the characteristic response time for any type of electrolyte membrane by means of a rigorous analytical definition. In this way, further physical adherence and generality of the proposed membrane model will be attained to guarantee a better accuracy within prognostic and control algorithms. The response time will be computed by analytically solving the water balance across the membrane and then applying an integral method to find the approximate solution of the water transport equation. The characteristic time can be implemented in PEMFC fast simulation models to properly simulate dynamic responses, and it can be also used to predict membrane dynamics based on physical features and operating conditions for cell design purposes.
As said, the proposed approach maintains a good physical fidelity and generalizability, together with low computational burdens; these features overcome the limitations highlighted with the literature overview and can be easily applied in more comprehensive algorithms, such as those developed by the authors for diagnostics [36], prognostics [37], and control [38] purposes. Having a good prediction of the water membrane content during PEMFC operations leads the path to more sophisticated control strategies in main PEMFC automotive applications [39], with particular attention on the stack’s state of health [40]. In the following, the analytical solution of the membrane dynamics is discussed in Section 2, whereas Section 3 depicts the application of the integral method to find the analytical solution and the dynamic response time.

2. Analytical Solution of Membrane Dynamics Related to Water Transport

2.1. Water Mass Balance Problem Formulation

The water mass balance across the electrolyte membrane of a PEMFC can be expressed in vectorial form as
c w t + J E O D + J c o n v + J d i f f = 0 ,
where cw is the water molar concentration, JEOD is the water molar flux due to electro-osmotic drag, Jconv is the water molar flux due to convection, and Jdiff is the water molar flux due to diffusion. A first simplifying assumption is made by neglecting all transport mechanisms occurring within the membrane area plane. Hence, only the flow orthogonal to the membrane area is accounted for, assumed with a positive sign from anode to cathode. Thus, the scalar form of Equation (1) is then
c w t + x J E O D + J c o n v + J d i f f = 0 ,
where x represents the through-plane direction. Each term can be specified as a function of the membrane water content λ, being the variable state of the problem. The water molar concentration can be rewritten in terms of the membrane water content as follows:
c w = λ 1 + δ c m e m d r y ,
where δ is the membrane thickness relative change due to swelling, while c m e m d r y is the dry membrane molar concentration. The electro-osmotic drag flux can be calculated applying the definition introduced in [25]:
J E O D = c m e m d r y u E O D λ ,
where uEOD is the electro-osmotic drag speed defined as
u E O D = 0.02 T 3.86 i 22.5 c m e m d r y F ,
In Equation (5), T is the cell temperature, i is the current density, and F is the Faraday’s constant (96,485 C·mol−1). The convective transport can be calculated by applying Darcy’s law:
J c o n v = c w u c o n v ,
where uconv is the fluid bulk speed due to the pressure gradient across the membrane:
u c o n v = k μ w d p d x k μ w Δ p L m e m ,
In Equation (7), k is the membrane permeability, μw is the water viscosity, and dp/dx is the pressure gradient. Since the membrane is thin, the pressure gradient can be approximated as the finite difference between cathode and anode pressures Δp over the membrane thickness Lmem. The diffusive transport mechanism can be calculated by applying the definition reported in [25]:
J d i f f = c m e m d r y D T c h e m Γ 1 + δ λ x ,
where D T c h e m is the temperature-dependent chemical diffusion coefficient, while Γ is a nondimensional function of λ introduced by [25]. Combining Equation (3) through Equation (8) into Equation (2) and simplifying the common terms, the following one-dimensional nonlinear Partial Differential Equation (PDE) is achieved:
t λ 1 + δ + x u E O D λ + u c o n v λ 1 + δ D T c h e m Γ 1 + δ λ x = 0 ,
The PDE can be rewritten decomposing the swelling effect in the same way of [25]:
d x = 1 + δ d x d r y ,
where the term xdry stands for the non-swelled through-plane coordinate. Implementing Equation (10), expanding the time derivative term of Equation (9) and simplifying the common terms, a comprehensive non-swelled nonlinear PDE can be written as
λ t λ t ln 1 + δ + x d r y u E O D λ + u c o n v λ 1 + δ D T c h e m Γ λ x d r y = 0 ,
The problem formulation is completed by introducing boundary and initial conditions:
λ 0 , t = λ a λ L m e m d r y , t = λ c λ x d r y , 0 = λ 0 x d r y ,
where λa and λc are the water content at the anode and cathode sides, respectively, while λ0(xdry) is the initial water content profile through the membrane over the dry coordinate.

2.2. Further Simplifying Hypotheses

The PDE defined in the previous section is strongly nonlinear, so it can be solved only with numerical techniques. However, to achieve an analytical solution, a linearization of the PDE is proposed. The first simplification is applied to the time derivative. The term ln(1 + δ) can be rewritten, considering that the thickness fractional change is a small number, so it can be expanded in a Taylor series (truncated at the first term):
ln 1 + δ δ ,
Considering the hypothesis of Springer et al. [22], the thickness fractional change is directly proportional to the water membrane content:
δ = s λ ,
where s is the swelling factor (equal to 0.0126). Hence, Equation (13) can be rewritten as
ln 1 + δ s λ ,
but, since s ≪ 1, the entire term can be neglected.
The second simplification applies to the convection term. Recalling Equation (7), the membrane thickness can be decoupled from membrane swelling:
u c o n v = k μ w Δ p L m e m = k μ w Δ p L m e m d r y 1 1 + δ = u c o n v d r y 1 1 + δ ,
In this case, the new bulk speed u c o n v d r y refers to the dry membrane only. Combining the new definition with the convection term, the following formulation is achieved:
u c o n v λ 1 + δ = u c o n v d r y λ 1 1 + δ 2 ,
Recalling Equation (14) and that s ≪ 1, the quadratic term at the denominator of Equation (17) can be approximated to 1.
The last simplification is related to the diffusion term. The water membrane content function Γ is almost constant for λ > 5 [25], so it can be considered fixed:
Γ Γ = 1 5 ,
Combining Equations (15), (17), and (18) into the problem stated in Equation (11), the final linear PDE is defined:
λ t + x d r y u E O D + u c o n v d r y λ D T c h e m Γ * λ x d r y = 0 ,
This PDE can be solved with analytical mathematical techniques. To uniformly represent physics, the diffusive speed udiff is introduced:
u d i f f = D T c h e m Γ L m e m d r y ,
Combining Equation (20) with Equation (19), the final form of the linear PDE is achieved:
λ t + x d r y u E O D + u c o n v d r y λ L m e m d r y u d i f f λ x d r y = 0 ,

2.3. Nondimensionalization

The linear PDE of Equation (21) can be nondimensionalized for the sake of generalizability by adopting the following nondimensional coordinates:
d τ = u d i f f L m e m d r y d t ,
d ξ = 1 L m e m d r y d x d r y ,
Furthermore, the water membrane content can be normalized between boundary conditions as follows:
a = λ λ a λ c λ a ,
Finally, the nondimensional Peclet number is defined as
P e = u E O D + u c o n v d r y u d i f f ,
The Peclet number expresses the ratio between advection mechanisms (i.e., electro-osmotic drag and convection) over a diffusion mechanism. The definition proposed with Equation (25) stands on the same simplification hypotheses of [25], with the introduction of a convection mechanism as in [24]. Substituting Equation (22) through Equation (24) into Equation (21) and simplifying the common terms, the following linear normalized nondimensional PDE is obtained:
a τ + ξ a P e a ξ = 0 ,
The problem can be completed with the following normalized boundary and initial conditions:
a 0 , τ = 0 a 1 , τ = 1 a ξ , 0 = a 0 ξ ,
where a0(ξ) is the normalized initial profile over the nondimensional coordinate.

2.4. Analytical Solution of the Problem

The nondimensional problem designed in the previous section can be solved applying analytical mathematical techniques, leading to the following solution:
a ξ , τ = a s ξ + a u ξ , τ ,
where as(ξ) is the steady-state solution with the exact same form calculated in [25]:
a s ξ = e P e ξ 1 e P e 1 ,
The membrane water distribution of Equation (29) is highly nonlinear; this is further enhanced, especially at high Peclet numbers. The unsteady solution au(ξ,τ) is calculated as
a u ξ , τ = n = 1 k n X n ξ T n τ ,
The coefficients kn are derived from the initial condition as follows:
k n = 2 0 1 e P e 2 ξ a 0 ξ a s ξ sin n π ξ d ξ ,
Considering a pure diffusive initial condition, the initial profile is linear:
a 0 ξ = ξ ,
and the time functions Tn(τ) are:
T n τ = e c n 2 τ ,
As expected, the time functions exponentially decay towards zero, with extinction times depending on the eigenvalues cn:
c n = P e 2 4 + n 2 π 2 ,
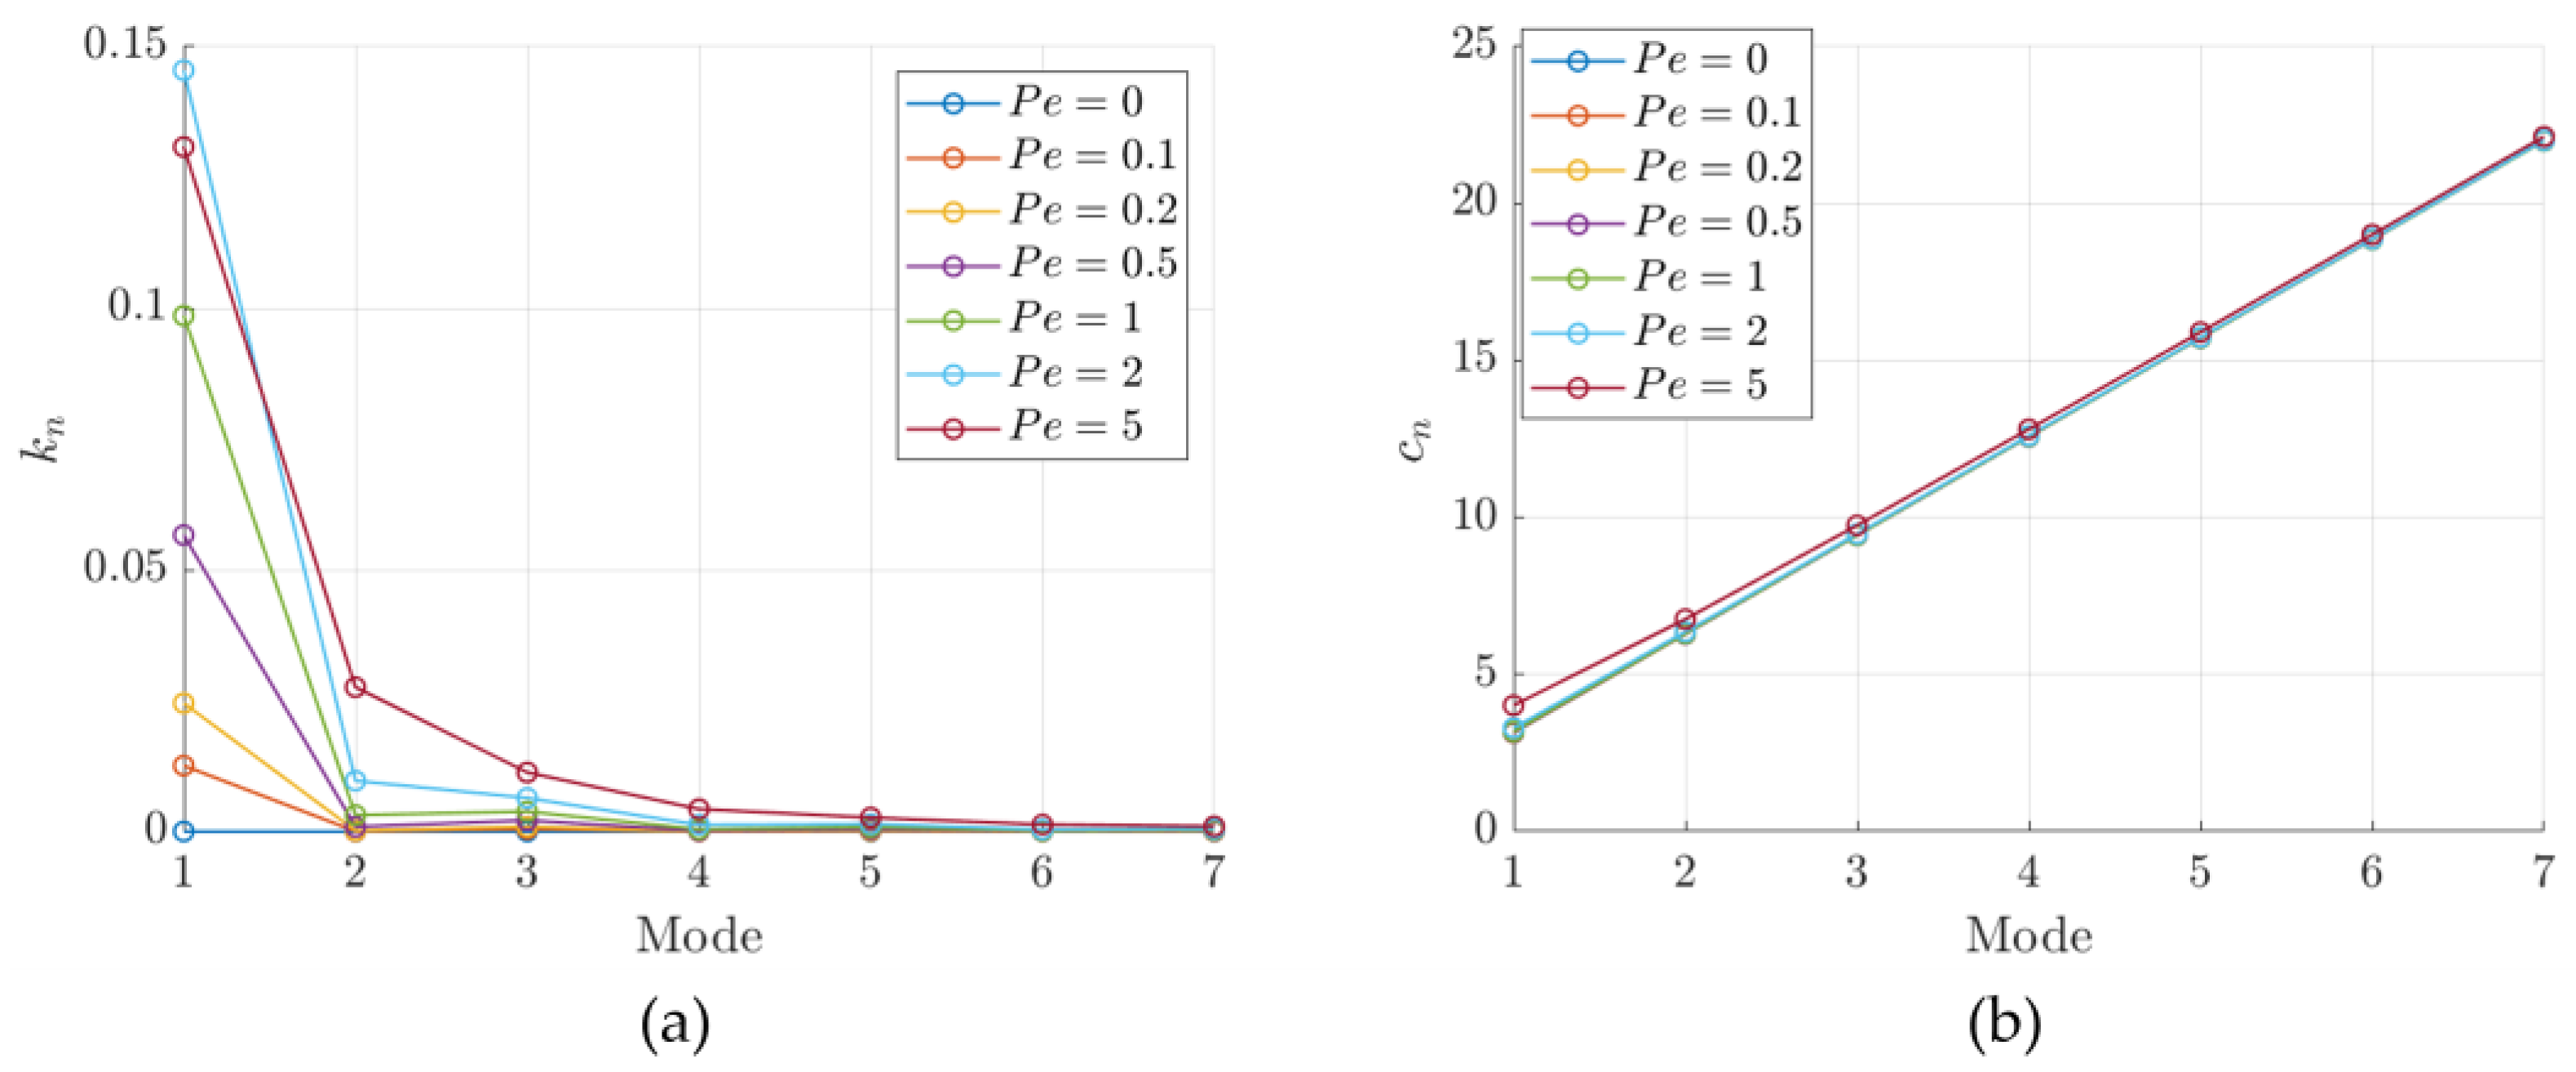
A visual representation of the coefficients and eigenvalues for different Peclet numbers is given in Figure 2a,b, respectively.
It can be seen that the first mode coefficient is always higher independently from the Peclet number. The coefficients of the second mode are always lower in magnitude, with increasing differences as the Peclet increases. Furthermore, the eigenvalues increase linearly with the mode number, meaning that higher modes have faster extinction transients. Finally, there is no appreciable differences with the Peclet variations, even if the first mode tends to be slightly faster for a high Peclet.
Since only the first mode is relevant, the first characteristic time derivable from the first eigenvalue is introduced with Equation (35). This characteristic time is chosen as the reference time for transient extinction:
τ 1 = 1 c 1 2 = 1 P e 2 4 + π 2 ,
The eigenfunctions Xn(ξ) are then calculated as
X n ξ = e P e 2 ξ sin n π ξ ,
The eigenfunctions are limited between e P e 2 ξ and e P e 2 ξ , and they have increasing stationary points with the increasing mode. Finally, combining unsteady and steady-state solutions, the complete normalized solution is represented in Figure 3 for different time values in each plot and different Peclet numbers in every subplot.
As expected, the solution starts from the initial condition, and it bends to the steady-state one with sufficient time; furthermore, the steady-state solution is increasingly nonlinear with the Peclet number, and the dynamics are faster with the increasing Peclet number. These analyses are the starting point for the development of the characteristic time formulation in the next section.

3. Application of the Integral Method

3.1. Integral Solution Definition and Calculation

Recalling the PDE in Equation (26), together with the boundary and initial conditions defined in Equation (27), it is possible to apply the integral method in order to achieve an approximated solution along the ξ coordinate. The proposed solution must be coherent with the initial and boundary conditions, so it must contain initial and steady-state solutions in its formulation. Hence, it is possible to define this solution as a transition from the initial condition a0(ξ) to the steady-state solution as(ξ) through a suitable time function f(τ) with the following form:
a ξ , τ = a 0 ξ f τ + 1 f τ a s ξ ,
It shall be f(0) = 1 and f(τ → ∞) → 0 to cope with the initial and boundary conditions. To choose the proper shape of the time function, it is imposed that the proposed solution must also be compliant with the integral defined from 0 to 1 of the PDE in Equation (26):
d d τ 0 1 a ξ , τ d ξ + a 1 , τ a 0 , τ P e a ξ 1 , τ + a ξ 0 , τ = 0 ,
Applying a linear initial condition (as in Equation (32)) and simplifying the common terms, the following Ordinary Differential Equation (ODE) in the unknown f(τ) function is defined:
d f d τ 2 P e 2 e P e 1 e P e P e 2 e P e + P e + 2 f = 0 ,
Recalling that f(0) = 1, then the final form of the time function is
f τ = e τ 2 P e 2 e P e 1 e P e P e 2 e P e + P e + 2 = e τ τ d ,
in which the characteristic time τd is
τ d = e P e P e 2 e P e + P e + 2 2 P e 2 e P e 1 ,
As expected, the time function starts from unity, and it tends to zero with exponential decay. To compare integral and analytical solutions, the error function between the two solutions is introduced:
e r r ξ , τ = a ξ , τ a ξ , τ ,
The evolution over time of the integral solution is represented, together with that of the analytical one under the same Peclet number in Figure 4a; the analytical solution is represented with a solid line, whereas the integral solution is represented with a dashed line. As it can be seen from the figure, the solutions are comparable in terms of shape at every time step; of course, the integral solution is not an exact solution, but it matches the analytical solution at the initial and steady-state conditions. In Figure 4b, the error distribution over normalized space and time is shown. It can be observed that, initially in time, there is an underestimation of the analytical solution by the integral one at the cathode side, while there is an overestimation at the anode side. This non-uniformity tends to disappear as time passes by, leading to zero errors all over the membrane thickness after about three times the extinction time τ1.
The trend is also confirmed looking at the integral average of the analytical solution:
a ¯ τ = a ¯ s + a ¯ u τ ,
where a ¯ s and a ¯ u τ are the integral average of the steady-state and unsteady solutions, respectively:
a ¯ s = 1 P e 1 e P e 1 ,
a ¯ u τ = n = 1 k n X ¯ n T n τ ,
For the sake of clarity, X ¯ n is not reported in its extended form but can be easily defined computing the definite integral in Equation (36). The integral average of the integral solution can be computed as
a ¯ τ = f τ a ¯ 0 + 1 f τ a ¯ s ,
It is interesting to note that, in both cases, the superposition effect principle can be applied thanks to linearity.
A comparison between average analytical and integral solutions varying the Peclet number is shown in Figure 5, with a black solid line for the analytical solution, black dashed line for the integral solution, and red dotted line for the percentage error, the latter defined as
e r ¯ r % τ = a ¯ τ a ¯ τ a ¯ τ 100 ,
As it can be seen, the integral solution is always lower than the analytical one, with the percent error reaching a minimum value around τ = τ1 and then tending to zero over time. The maximum absolute percentage error increases with the Peclet number, but it is still lower than 2.5% for Pe = 2.

3.2. Time Constant Analysis

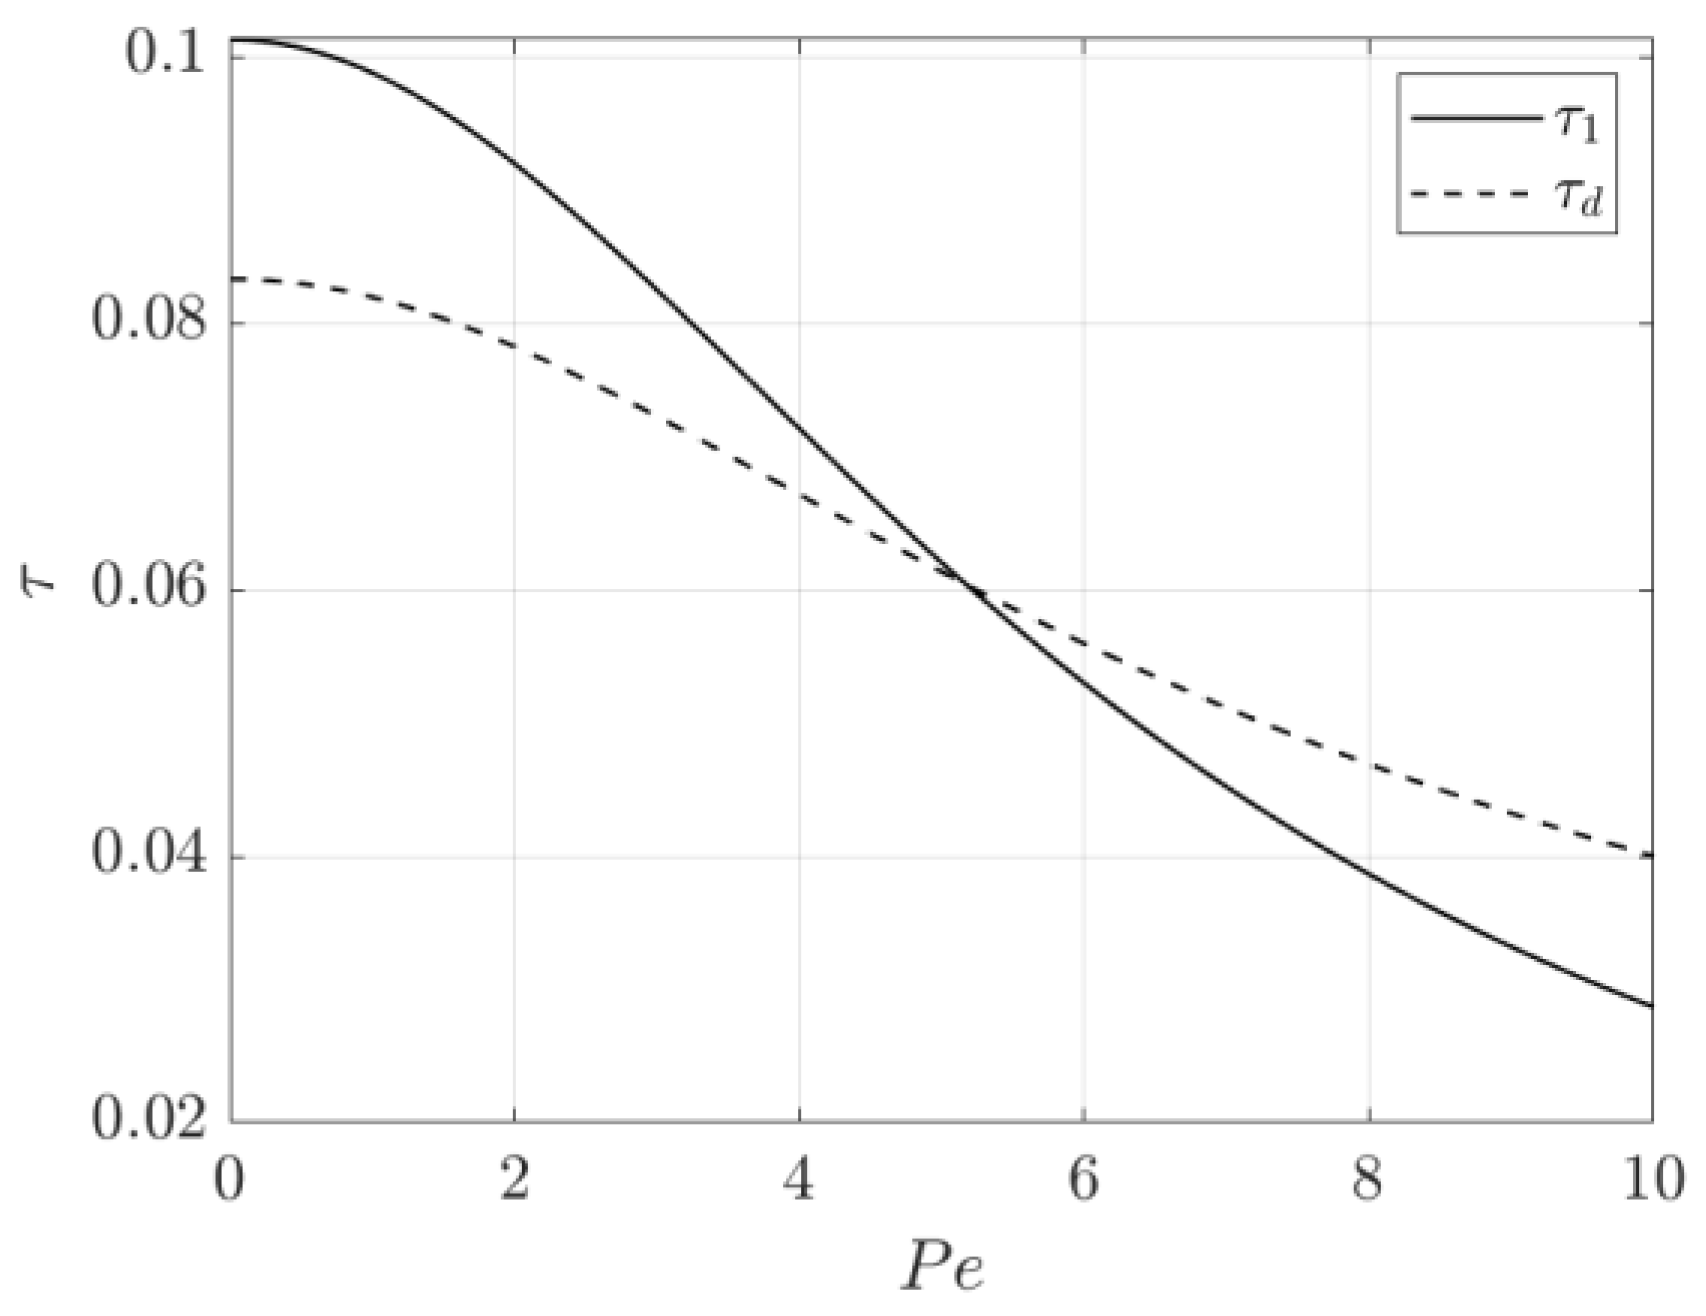
The nondimensional time constant can be compared with the first eigenvalue of the analytical solution calculated with Equation (35); the first time constant is representative of the analytical solution dynamic behavior as demonstrated in the previous section. The two time constants with respect to the Peclet number are compared and collected in Figure 6, with a solid line for τ1 and dashed line for τd.
Analyzing Figure 6, it is interesting to note that both time constants monotonically decrease with the Peclet number, meaning that, for higher Peclet numbers, the transient extinguishes faster. Both the time constants tend to zero for Peclet tending to infinity from Equations (35) and (41), confirming the faster dynamics increasing the Peclet number. The time constants are different at Pe = 0 with a percent residual of −17.75%; however, the zero Peclet condition corresponds to a perfect balance between electro-osmotic drag and convection, while diffusion has no direct impact on the membrane dynamics, so it can be considered as a non-feasible condition.
The dimensional time constant can be defined recalling Equation (22), leading to the following formulation:
t d = L m e m d r y u d i f f e P e P e 2 e P e + P e + 2 2 P e 2 e P e 1 ,
which shows the functional links of the membrane response time with respect to its features and operative conditions through the Peclet number (i.e., dry thickness, molar concentration, temperature, pressure gradient, and current density) and udiff, which, in turn, depends on the membrane features and temperature as well. It is worth remarking that the characteristic time is not constant because of its dependency from membrane characteristics and operative conditions. The simple formulation in Equation (48) paves the way towards useful applications of the proposed approach for cell design and control strategies development thanks to the shorter computational time compared to other, more complex modelling approaches.

3.2.1. Example of Time Constant Use for Cell Design

An example of the use of the time constant formulation for a single cell design is proposed. Considering a fuel cell operating at the working point described in Table 1, with a membrane permeability of 10−18 m2 and a water viscosity of 10−3 Pa·s, two different parametric analyses were made by varying the membrane thickness and molar concentration.
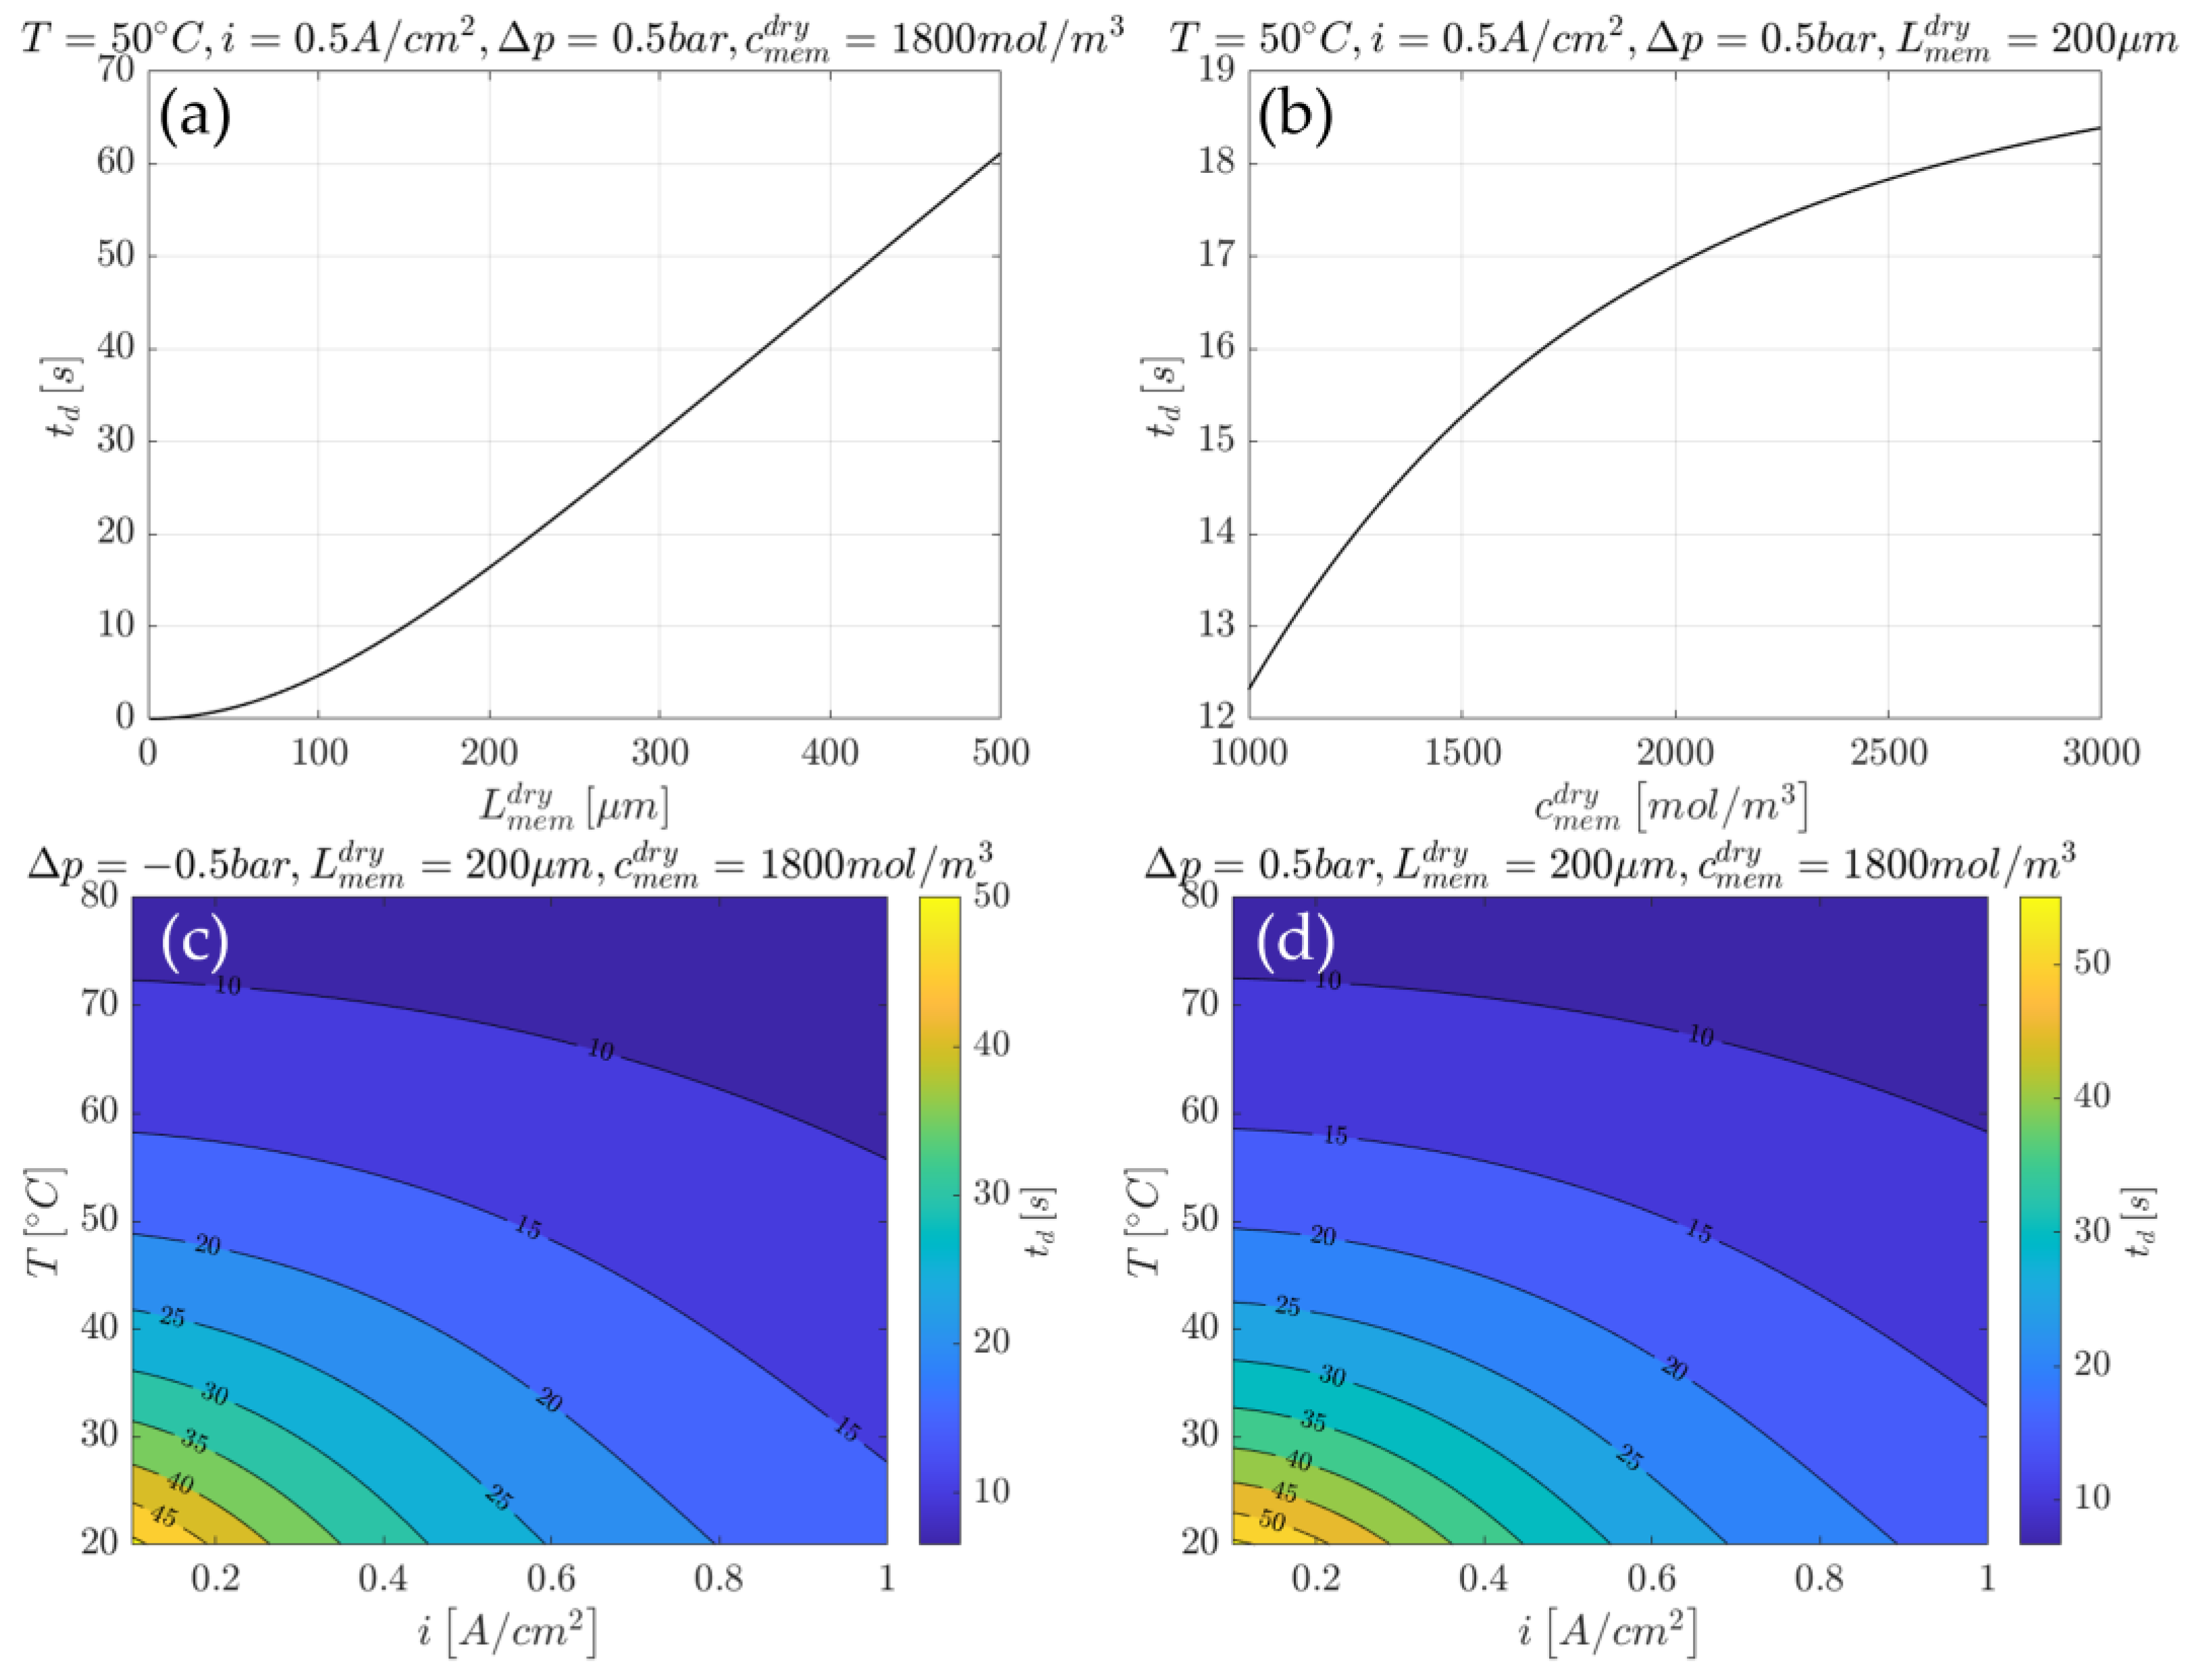
For a given molar concentration of 1800 mol·m−3, in Figure 7a, the curve of td as a function of the membrane dry thickness is represented. As it can be seen, the time delay is monotonically increasing with the membrane dry thickness, leading to longer transient extinction times; for fast applications, it is needed to have short response times, so thin membranes should be preferred. For a given membrane dry thickness of 200 μm, in Figure 7b, the curve of td as function of the membrane dry molar concentration is represented. As it can be seen, the time delay is monotonically increasing with the membrane dry molar concentration with a reducing slope over time; however, the variation is very limited, so the influence of molar concentration on time response can be neglected.

3.2.2. Example of Time Constant Use for Cell Control

Another example, this time related to cell control, is now proposed. In this case, considering a fuel cell with the given physical characteristics listed in Table 2, two different parametric analyses are performed for negative and positive pressure gradients, varying the current density and temperature.
In Figure 7c, the contour plot of td is reported varying the temperature and current density in the case of a 0.5 bar pressure gradient from anode to cathode. As it can be seen, the predicted response time decreases with the increase in temperature and current density, going from roughly 50 s down to lower than 10 s. Furthermore, the electrodes pressure gradient induces water to move faster from anode to cathode, favoring the electro-osmotic drag mechanism. In Figure 7d, the contour plot of td is reported varying the temperature and current density in the case of a 0.5 bar pressure gradient from cathode to anode. Once again, the predicted response time decreases with the increase in temperature and current density, going from roughly 55 s down to lower than 10 s. Differently from the previous case, the electrode pressure gradient slows down water transport, leading to a longer time response and favoring the diffusion mechanism.

3.3. ODE Formulation for On-Board Implementation

It can be noted that the solution reported in Equation (46) is the analytical solution of the following ODE problem:
d a ¯ d τ = a ¯ s a ¯ τ d a ¯ 0 = a ¯ 0 ,
This formulation is independent from the initial condition, so it is generalizable. The relative dimensional general problem is stated as:
d λ ¯ d t = λ ¯ s λ ¯ t d ,
with the initial conditions being of any type and with λ ¯ s being the steady-state solution obtained combining Equations (24) and (44):
λ ¯ s t = λ a t + λ c t λ a t 1 P e t 1 e P e t 1 ,
This formulation can be easily implemented in on-board dynamic simulation models.

3.4. Net Water Molar Flux Estimation

Another key modelling parameter is the net water molar flux through the membrane, accounting for the three transport mechanisms discussed in the previous sections. Applying the same assumptions discussed in Section 2 and simplifying the common terms, the analytical form of the net water molar flux is
J w ξ , t = c m e m d r y u d i f f λ ξ , t P e t λ ξ ξ , t ,
and thus, the specific net water molar fluxes at the anode and cathode sides can be computed as follows:
J a t = c m e m d r y u d i f f λ a ( t ) P e t λ ξ 0 , t ,
J c t = c m e m d r y u d i f f λ c ( t ) P e t λ ξ 1 , t ,
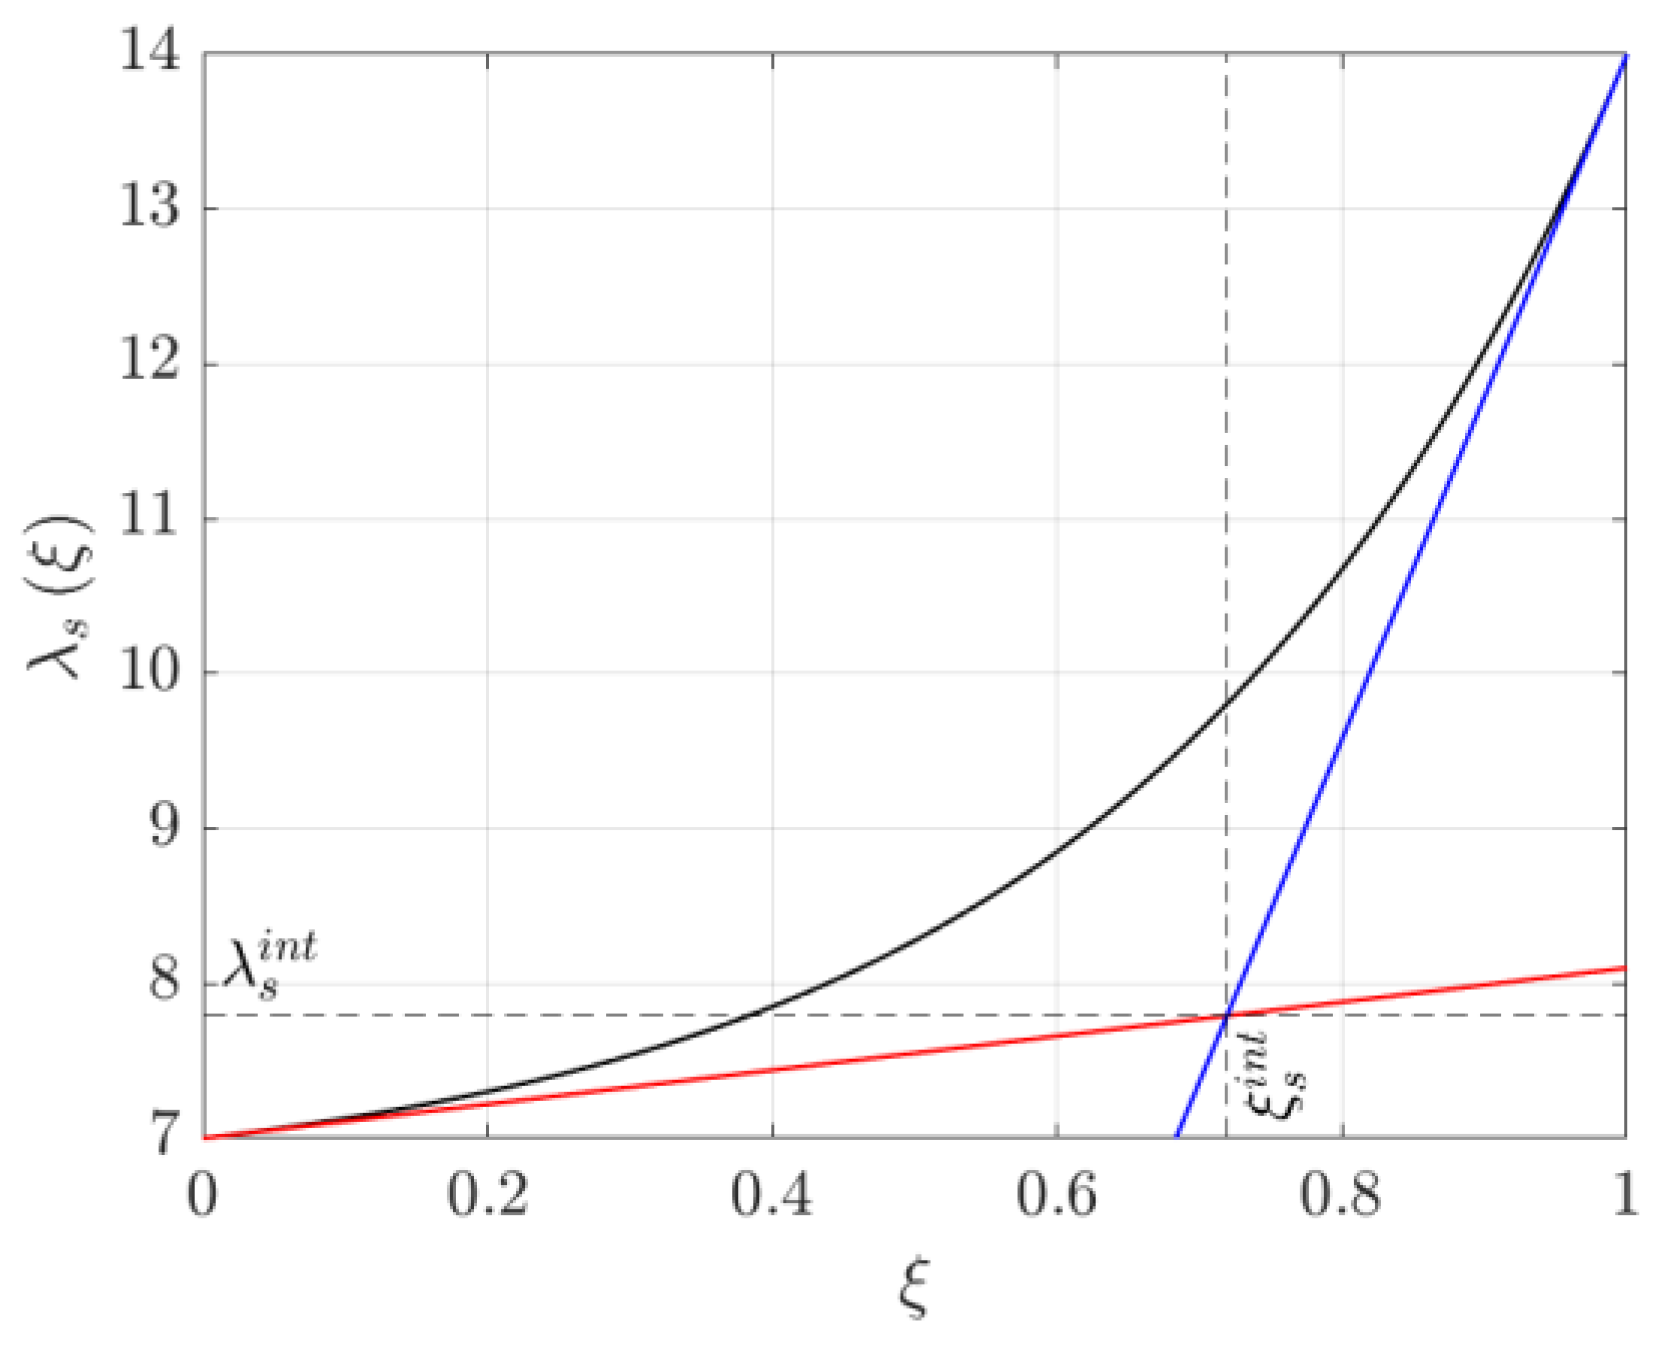
It is worth remarking that the anodic and cathodic fluxes at the steady state are equal to one another and match the formulation reported in [25]. However, in transient conditions, the derivative terms ∂λ/∂ξ(0,t) and ∂λ/∂ξ(1,t) shall be characterized. Since direct analytical computation is not possible without knowing the water content gradient profile itself, to find the required values, the two gradients have been geometrically computed as the tangent at the gradient profile at the boundaries, approximated as the finite difference between the boundary points and the intersection point; this assumption is intrinsically true in steady-state conditions, while it can also be applied for transient operations assuming the same dynamic for every point of the profile. The geometric construction in the steady-state conditions is represented in Figure 8. From this figure, it can be seen that the steady-state derivative terms dλs/dξ(0) and dλs/dξ(1) can be geometrically calculated if the coordinates of the intersection point ( ξ s i n t , λ s i n t ) are known:
d λ s d ξ 0 = λ s i n t λ a ξ s i n t ,
d λ s d ξ 1 = λ c λ s i n t 1 ξ s i n t ,
Assuming that the generic steady-state solution λs(ξ) can be obtained combining Equations (24) and (29):
λ s ξ = λ a + λ c λ a e P e ξ 1 e P e 1 ,
Deriving it over the spatial coordinate and substituting it into the above derivatives, it is possible to calculate the intersection point coordinates as
ξ s i n t = e P e P e e P e + 1 e P e 1 P e ,
λ s i n t = λ a + λ c λ a e P e P e e P e + 1 e P e 1 2 ,
It is safe to assume that the intersection has the same dynamic behavior of the integral solution calculated by Equation (50). Thanks to this assumption, the intersection point coordinates can be easily integrated in time:
d ξ i n t d t = ξ s i n t ξ i n t t d ,
d λ i n t d t = λ s i n t λ i n t t d ,
The net water molar fluxes for the anode and cathode applying the integral solution are then calculated as
J a t = c m e m d r y u d i f f t λ a t P e t λ i n t t λ a t ξ i n t t ,
J c t = c m e m d r y u d i f f t λ c t P e t λ c t λ i n t t 1 ξ i n t t ,

3.5. On-Board Implementation Procedure

To simulate any time transient with the proposed modelling framework, the following steps should be performed at each time interval:
  • Compute the Pe number through Equation (25);
  • compute the average steady-state solution λ ¯ s through Equation (51);
  • compute the characteristic time td through Equation (48);
  • integrate the ODE of Equation (50) to obtain the solution λ ¯ ;
  • compute the average net water molar flux for the anode J a t and cathode J c t through Equations (62) and (63), respectively.
The proposed procedure can be implemented for every time step in a simple numerical solver. Once the average water membrane content is known, it is easy to calculate the membrane’s Ohmic resistance by applying the model proposed by Springer et al. [22], whereas the net water molar fluxes can be implemented into any mass transport model to compute the water transport between electrodes.
In the following, the proposed dynamic membrane model is implemented into a PEMFC mass transport model previously published by the authors [36]. The cell’s parameters are obtained from the work of Maggio et al. [41], and they are reported in Table 3.
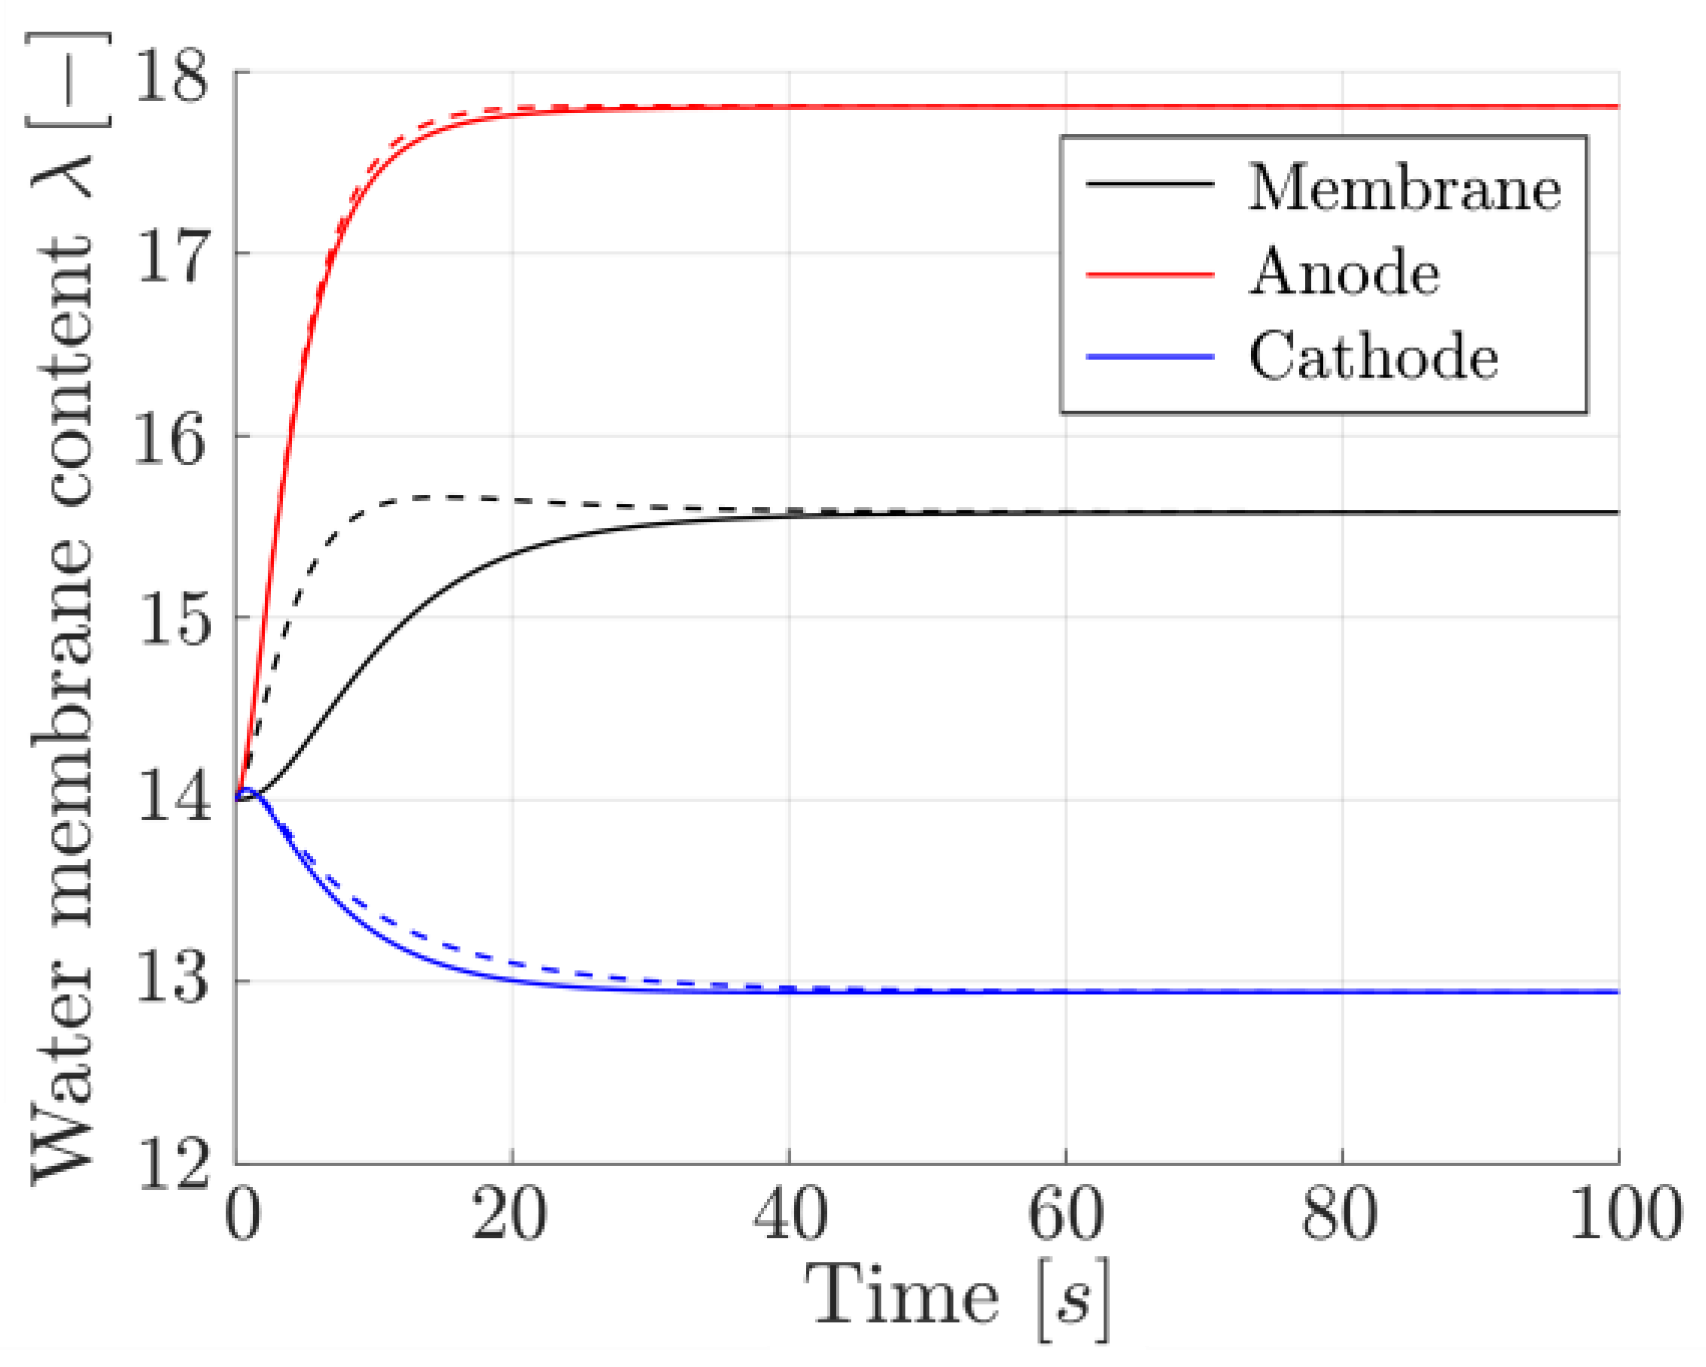
The simulation is performed considering a current step increase from 0 to 0.2 A·cm−2 at the steady-state temperature indicated in Table 3; the membrane is initially considered optimally hydrated with λ = 14 as the water membrane content, together with the anode and cathode at equilibrium. It is worth noticing the humidification boundary conditions of this simulation: the anode is fully humidified at 85 °C, while the cathode is fully humidified at 75 °C. The different humidification temperatures lead to vapor water saturation pressures of 57.81 kPa and 38.56 kPa, respectively, for the anode and cathode: the higher vapor water pressure at the anode allows for more water molecules injected at the anode side. Considering operative conditions and membrane physical parameters, applying Equation (48), a delay time of about 8 s with a consequent transient extinction time of 24 s is expected. The following results shall be interpreted, keeping in mind that there are also other dynamics together with that of the membrane.
The resulting water contents are reported in Figure 9; the black line is for the water membrane content, the red line is for the anode, the blue line is for the cathode, and the distinction between the membrane static and dynamic model is reported with solid and dashed lines, respectively. From the results, an evident difference can be appreciated in the first seconds of the simulation: the steady-state solution rapidly rises to steady-state conditions in roughly 20 s, while the dynamic model reaches steady-state conditions after 40 s. The difference is roughly 20 s, confirming the prediction made on the transient extinction time. The boundary conditions are only slightly affected by the membrane dynamics. This delayed behavior can be critical when the fuel cell is operating at low temperatures, because the response time increases even more.

4. Conclusions

In this work, an analytical formulation of the transient characteristic time of the membrane for PEMFC dynamic models is proposed. Focusing on dynamic behavior is critical to correctly manage and control PEMFC systems, since predicting the response delay of the PEMFC allows the implementation of compensative actions.
In the literature, the problem is typically approached from a steady-state point of view, implementing well-known black box relationships or predeveloped maps; alternatively, a constant time delay with first-order dynamic is assumed. In this paper, the mathematical formulation of water transport inside the membrane is defined and simplified under reasonable assumptions in order to obtain a problem that can be solved analytically. The analytical solution shows approximately a first-order transient extinction from the initial to steady-state profile; this behavior paves the way to the formulation of an integral solution. The integral method is applied to define a possible solution that well approximates the analytical solution on the integral average. Applying the method, a characteristic time constant that lumps dynamic phenomena is obtained and analyzed; the time constant proposed is then compared to the first eigenvalue of the analytical solution correlated to its principal time decay. The mentioned time constant is applicable for design and implementation analyses; its closed form allows to test different conditions, varying membrane properties or operating points.
From the performed analyses, it was observed that membranes with longer thickness or higher molar concentration have a longer transient response time; furthermore, the response time decreases when the current density and temperature increase, while the response dynamics are slower when the gradient pressure increases. For a fixed membrane of 200 µm thickness, the time constant can vary from 5 up to 50 s, varying the operative conditions in reasonable ranges. The net water molar fluxes at the membrane boundaries can be also calculated with the proposed approach in an analytical closed form. Finally, the time constant can be applied in a simple ODE formulation to calculate the integral average water membrane content and, consequently, the integral net water molar fluxes for the anode and cathode; this model is easily implementable in on-board models for prognostics and control applications.
The proposed model is then implemented in an algorithm for on-board applications, showing how the membrane dynamics cannot be neglected due to the slower response. For the proposed case in this paper, the membrane dynamics further delay the water content response for roughly 20 s; this behavior emphasizes the need for proper actions with a control strategy that must be taken into account to compensate for the delayed effect. Future developments will account for the implementation of the proposed formulation into a comprehensive PEMFC stack model to couple the water membrane content to mass transport and electro-chemical phenomena, so as to develop a more detailed (although simple) dynamic model for on-board applications, such as a control strategy design for water monitoring.

Author Contributions

Conceptualization, M.S.; methodology, M.S. and D.C.; formal analysis, M.S., D.C. and P.P.; investigation, M.S.; data curation, M.S. and D.C.; writing—original draft preparation, M.S.; writing—review and editing, M.S., D.C., P.P. and C.P.; supervision, P.P. and C.P. All authors have read and agreed to the published version of the manuscript.

Funding

This research received no external funding.

Data Availability Statement

Data is contained within the article.

Conflicts of Interest

The authors declare no conflicts of interest.

Nomenclature

Acronyms
CLCatalyst Layer
GDLGas Diffusion Layer
GFCGas Flow Channel
PDEPartial Differential Equation
PEMProton Exchange Membrane
PEMFProton Exchange Membrane Fuel Cell
PTFEPolytetrafluoroethylene
ODEOrdinary Differential Equation
ORROxygen Reduction Reaction
Roman Letters
anormalized membrane water content [-]
cmolar concentration [mol⋅m−3]
cneigenvalue [-]
Ddiffusion coefficient [m2⋅s−1]
errerror function [-]
Ffaraday’s constant [C⋅mol−1]
ftime function [-]
icurrent density [A⋅m−2]
Jmolar flux [mol⋅m−2⋅s−1]
kpermeability [m2]
knunsteady solution mode coefficient [-]
Lthickness [m]
nmode number [-]
PePeclet number [-]
ppressure [Pa]
sswelling factor [-]
Ttemperature [K]
Tntemporal eigenfunction [-]
ttime coordinate [s]
uvelocity [m⋅s−1]
Xnspatial eigenfunction [-]
xspatial coordinate [m]
Greek Letters
ΔDifference [-]
δThickness fractional change [-]
Γnondimensional water membrane content function [-]
λWater content [-]
μwWater viscosity [Pa⋅s]
τnondimensional time [-]
ξnondimensional spatial coordinate [-]
Subscripts
0initial condition
aanode
ccathode
convconvection
ddelay
diffdiffusion
EODelectro-osmotic drag
memmembrane
nmode
ssteady state
Ttemperature
uunsteady
wwater
%percentage
Superscripts
*integral or approximated
chemchemical related
drydry reference condition
intintersection

References

  1. Wee, J.-H. Applications of proton exchange membrane fuel cell systems. Renew. Sustain. Energy Rev. 2007, 11, 1720–1738. [Google Scholar] [CrossRef]
  2. Larminie, J.; Dicks, A.; McDonald, M.S. Fuel Cells Systems Explained; J. Wiley: Chichester, UK, 2003; ISBN 0-470-84857-X. [Google Scholar]
  3. Peighambardoust, S.; Rowshanzamir, S.; Amjadi, M. Review of the proton exchange membranes for fuel cell applications. Int. J. Hydrog. Energy 2009, 35, 9349–9384. [Google Scholar] [CrossRef]
  4. Valenzuela, E.; Gamboa, S.; Sebastian, P.; Moreira, J.; Pantoja, J.; Ibañez, G.; Reyes, A.; Campillo, B.; Serna, S. Proton Charge Transport in Nafion Nanochannels. J. Nano Res. 2009, 5, 31–36. [Google Scholar] [CrossRef]
  5. Pan, M.; Pan, C.; Li, C.; Zhao, J. A review of membranes in proton exchange membrane fuel cells: Transport phenomena, performance and durability. Renew. Sustain. Energy Rev. 2021, 141, 110771. [Google Scholar] [CrossRef]
  6. Jiao, K.; Li, X. Water transport in polymer electrolyte membrane fuel cells. Prog. Energy Combust. Sci. 2011, 37, 221–291. [Google Scholar] [CrossRef]
  7. Ji, M.; Wei, Z. A Review of Water Management in Polymer Electrolyte Membrane Fuel Cells. Energies 2009, 2, 1057–1106. [Google Scholar] [CrossRef]
  8. Canut, J.-M.L.; Abouatallah, R.M.; Harrington, D.A. Detection of Membrane Drying, Fuel Cell Flooding, and Anode Catalyst Poisoning on PEMFC Stacks by Electrochemical Impedance Spectroscopy. J. Electrochem. Soc. 2006, 153, A857. [Google Scholar] [CrossRef]
  9. Ijaodola, O.S.; Hassan, Z.E.; Ogungbemi, E.; Khatib, F.; Wilberforce, T.; Thompson, J.; Olabi, A. Energy efficiency improvements by investigating the water flooding management on proton exchange membrane fuel cell (PEMFC). Energy 2019, 179, 246–267. [Google Scholar] [CrossRef]
  10. Li, H.; Tang, Y.; Wang, Z.; Shi, Z.; Wu, S.; Song, D.; Zhang, J.; Fatih, K.; Zhang, J.; Wang, H.; et al. A review of water flooding issues in the proton exchange membrane fuel cell. J. Power Sources 2008, 178, 103–117. [Google Scholar] [CrossRef]
  11. Lim, B.H.; Majlan, E.H.; Daud, W.R.W.; Husaini, T.; Rosli, M.I. Effects of flow field design on water management and reactant distribution in PEMFC: A review. Ionics 2016, 22, 301–316. [Google Scholar] [CrossRef]
  12. Okonkwo, P.C.; Otor, C. A review of gas diffusion layer properties and water management in proton exchange membrane fuel cell system. Int. J. Energy Res. 2021, 45, 3780–3800. [Google Scholar] [CrossRef]
  13. Pourrahmani, H.; van Herle, J. Water management of the proton exchange membrane fuel cells: Optimizing the effect of microstructural properties on the gas diffusion layer liquid removal. Energy 2022, 256, 124712. [Google Scholar] [CrossRef]
  14. Lee, D.; Bae, J. Visualization of flooding in a single cell and stacks by using a newly-designed transparent PEMFC. Int. J. Hydrog. Energy 2021, 37, 422–435. [Google Scholar] [CrossRef]
  15. Kim, M.; Jung, N.; Eom, K.; Yoo, S.J.; Kim, J.Y.; Jang, J.H.; Kim, H.-J.; Hong, B.K.; Cho, E. Effects of anode flooding on the performance degradation of polymer electrolyte membrane fuel cells. J. Power Sources 2014, 266, 332–340. [Google Scholar] [CrossRef]
  16. Esposito, A.; Pianese, C.; Guezennec, Y.G. Coupled modeling of water transport and air–droplet interaction in the electrode of a proton exchange membrane fuel cell. J. Power Sources 2010, 195, 4149–4159. [Google Scholar] [CrossRef]
  17. Polverino, P.; Esposito, A.; Pianese, C. Experimental validation of a lumped model of single droplet deformation, oscillation and detachment on the GDL surface of a PEM fuel cell. J. Power Sources 2013, 38, 8934–8953. [Google Scholar] [CrossRef]
  18. Parrondo, J.; Ortueta, M.; Mijangos, F. Swelling behavior of PEMFC during conditioning. Braz. J. Chem. Eng. 2007, 24, 411–419. [Google Scholar] [CrossRef]
  19. Tiss, F.; Chouikh, R.; Guizani, A. A numerical investigation of the effects of membrane swelling in polymer electrolyte fuel cells. Energy Convers. Manag. 2013, 67, 318–324. [Google Scholar] [CrossRef]
  20. Hwang, R.Y.; Moon, Y.; Kim, H.M.; Kim, E.; Park, S.; Han, O.H. Measuring the water content of polymer electrolyte membranes using double points of proton magic angle spinning nuclear magnetic resonance data. Polymer 2024, 309, 127431. [Google Scholar] [CrossRef]
  21. Wu, Y.; Xu, L.; Zhou, S.; Yang, J.; Kockelmann, W.; Han, Y.; Li, Q.; Chen, W.; Coppens, M.O.; Shearing, P.R.; et al. Water management and mass transport of a fractal metal foam flow-field based polymer electrolyte fuel cell using operando neutron imaging. Appl. Energy 2024, 364, 123204. [Google Scholar] [CrossRef]
  22. Springer, T.E.; Zawodzinski, T.A.; Gottesfeld, S. Polymer Electrolyte Fuel Cell Model. J. Electrochem. Soc. 1991, 138, 2334. [Google Scholar] [CrossRef]
  23. Dickinson, E.J.F.; Smith, G. Modelling the Proton-Conductive Membrane in Practical Polymer Electrolyte Membrane Fuel Cell (PEMFC) Simulation: A Review. Membranes 2020, 10, 310. [Google Scholar] [CrossRef] [PubMed]
  24. Mazumder, S. A Generalized Phenomenological Model and Database for the Transport of Water and Current in Polymer Electrolyte Membranes. J. Electrochem. Soc. 2005, 152, A1633–A1644. [Google Scholar] [CrossRef]
  25. Ferrara, A.; Polverino, P.; Pianese, C. Analytical calculation of electrolyte water content of a Proton Exchange Membrane Fuel Cell for on-board modelling applications. J. Power Sources 2018, 390, 197–207. [Google Scholar] [CrossRef]
  26. Wang, Y.; Si, C.; Zhang, X.; Wang, X.; He, W. Electro-osmotic drag coefficient of Nafion membrane with low water Content for Proton exchange membrane fuel cells. Energy Rep. 2022, 8, 598–612. [Google Scholar] [CrossRef]
  27. Wang, G.; Liu, Z.; Liu, C. Molecular Study of Nonequilibrium Transport Mechanism for Proton and Water in Porous Proton Exchange Membranes. Int. J. Energy Res. 2023, 3, 1138198. [Google Scholar] [CrossRef]
  28. Chen, F.; Zhang, L.; Jiao, J. Modelling of Humidity Dynamics for Open-Cathode Proton Exchange Membrane Fuel Cell. World Electr. Veh. J. 2021, 12, 106. [Google Scholar] [CrossRef]
  29. Real, A.J.D.; Arce, A.; Bordons, C. Development and experimental validation of a PEM fuel cell dynamic model. J. Power Sources 2007, 173, 310–324. [Google Scholar] [CrossRef]
  30. Pathapati, P.; Xue, X.; Tang, J. A new dynamic model for predicting transient phenomena in a PEM fuel cell system. Renew. Energy 2005, 30, 1–22. [Google Scholar] [CrossRef]
  31. Lechartier, E.; Gouriveau, R.; Pera, M.-C.; Hissel, D.; Zerhouni, N. Static and Dynamic Modeling of a PEMFC for Prognostics Purpose. In Proceedings of the Vehicle Power and Propulsion Conference (VPPC’14), Coimbra, Portugal, 27–30 October 2014. [Google Scholar] [CrossRef]
  32. Lee, C.; Choi, Y.; Kim, Y.; Yu, S. Nonlinear Water Transport Through a Polymer Electrolyte Membrane Under Transient Operation of a Proton Exchange Membrane Fuel Cell. Int. J. Automot. Technol. 2024, 25, 1183–1200. [Google Scholar] [CrossRef]
  33. Li, X.; Han, K.; Song, Y. Dynamic behaviors of PEM fuel cells under load changes. Int. J. Hydrog. Energy 2020, 45, 20312–20320. [Google Scholar] [CrossRef]
  34. Goshtasbi, A.; García-Salaberri, P.; Chen, J.; Talukdar, K.; Sanchez, D.G.; Ersal, T. Through-the-membrane transient phenomena in PEM fuel cells: A modeling study. J. Electrochem. Soc. 2019, 166, F3154. [Google Scholar] [CrossRef]
  35. Dadda, B.; Abboudi, S.; Ghezal, A. Transient two-dimensional model of heat and mass transfer in a PEM fuel cell membrane. Int. J. Hydrog. Energy 2013, 38, 7092–7101. [Google Scholar] [CrossRef]
  36. Sicilia, M.; Cervone, D.; Polverino, P.; Pianese, C. Model-Based Algorithm for Water Management Diagnosis and Control for PEMFC Systems for Motive Applications. SAE Tech. Pap. 2024, 1–14. [Google Scholar] [CrossRef]
  37. Polverino, P.; Pianese, C. Model-based prognostic algorithm for online RUL estimation of PEMFCs. In Proceedings of the 3rd Conference on Control and Fault-Tolerant Systems (SysTol16), Barcelona, Spain, 7–9 September 2016; Volume 7739814, pp. 599–604. [Google Scholar] [CrossRef]
  38. Polverino, P.; Pianese, C. Control algorithm design for degradation mitigation and lifetime improvement of Polymer Electrolyte Membrane Fuel Cells. Energy Procedia 2017, 142, 1706–1713. [Google Scholar] [CrossRef]
  39. Jia, C.; Zhou, J.; He, H.; Li, J.; Wei, Z.; Li, K. Health-conscious deep reinforcement learning energy management for fuel cell buses integrating environmental and look-ahead road information. Energy 2024, 290, 130146. [Google Scholar] [CrossRef]
  40. Jia, C.; Zhou, J.; He, H.; Li, J.; Wei, Z.; Li, K. Learning-based model predictive energy management for fuel cell hybrid electric bus with health-aware control. Appl. Energy 2024, 355, 122228. [Google Scholar] [CrossRef]
  41. Maggio, G.; Recupero, V.; Pino, L. Modeling polymer electrolyte fuel cells: An innovative approach. J. Power Sources 2001, 101, 275–286. [Google Scholar] [CrossRef]
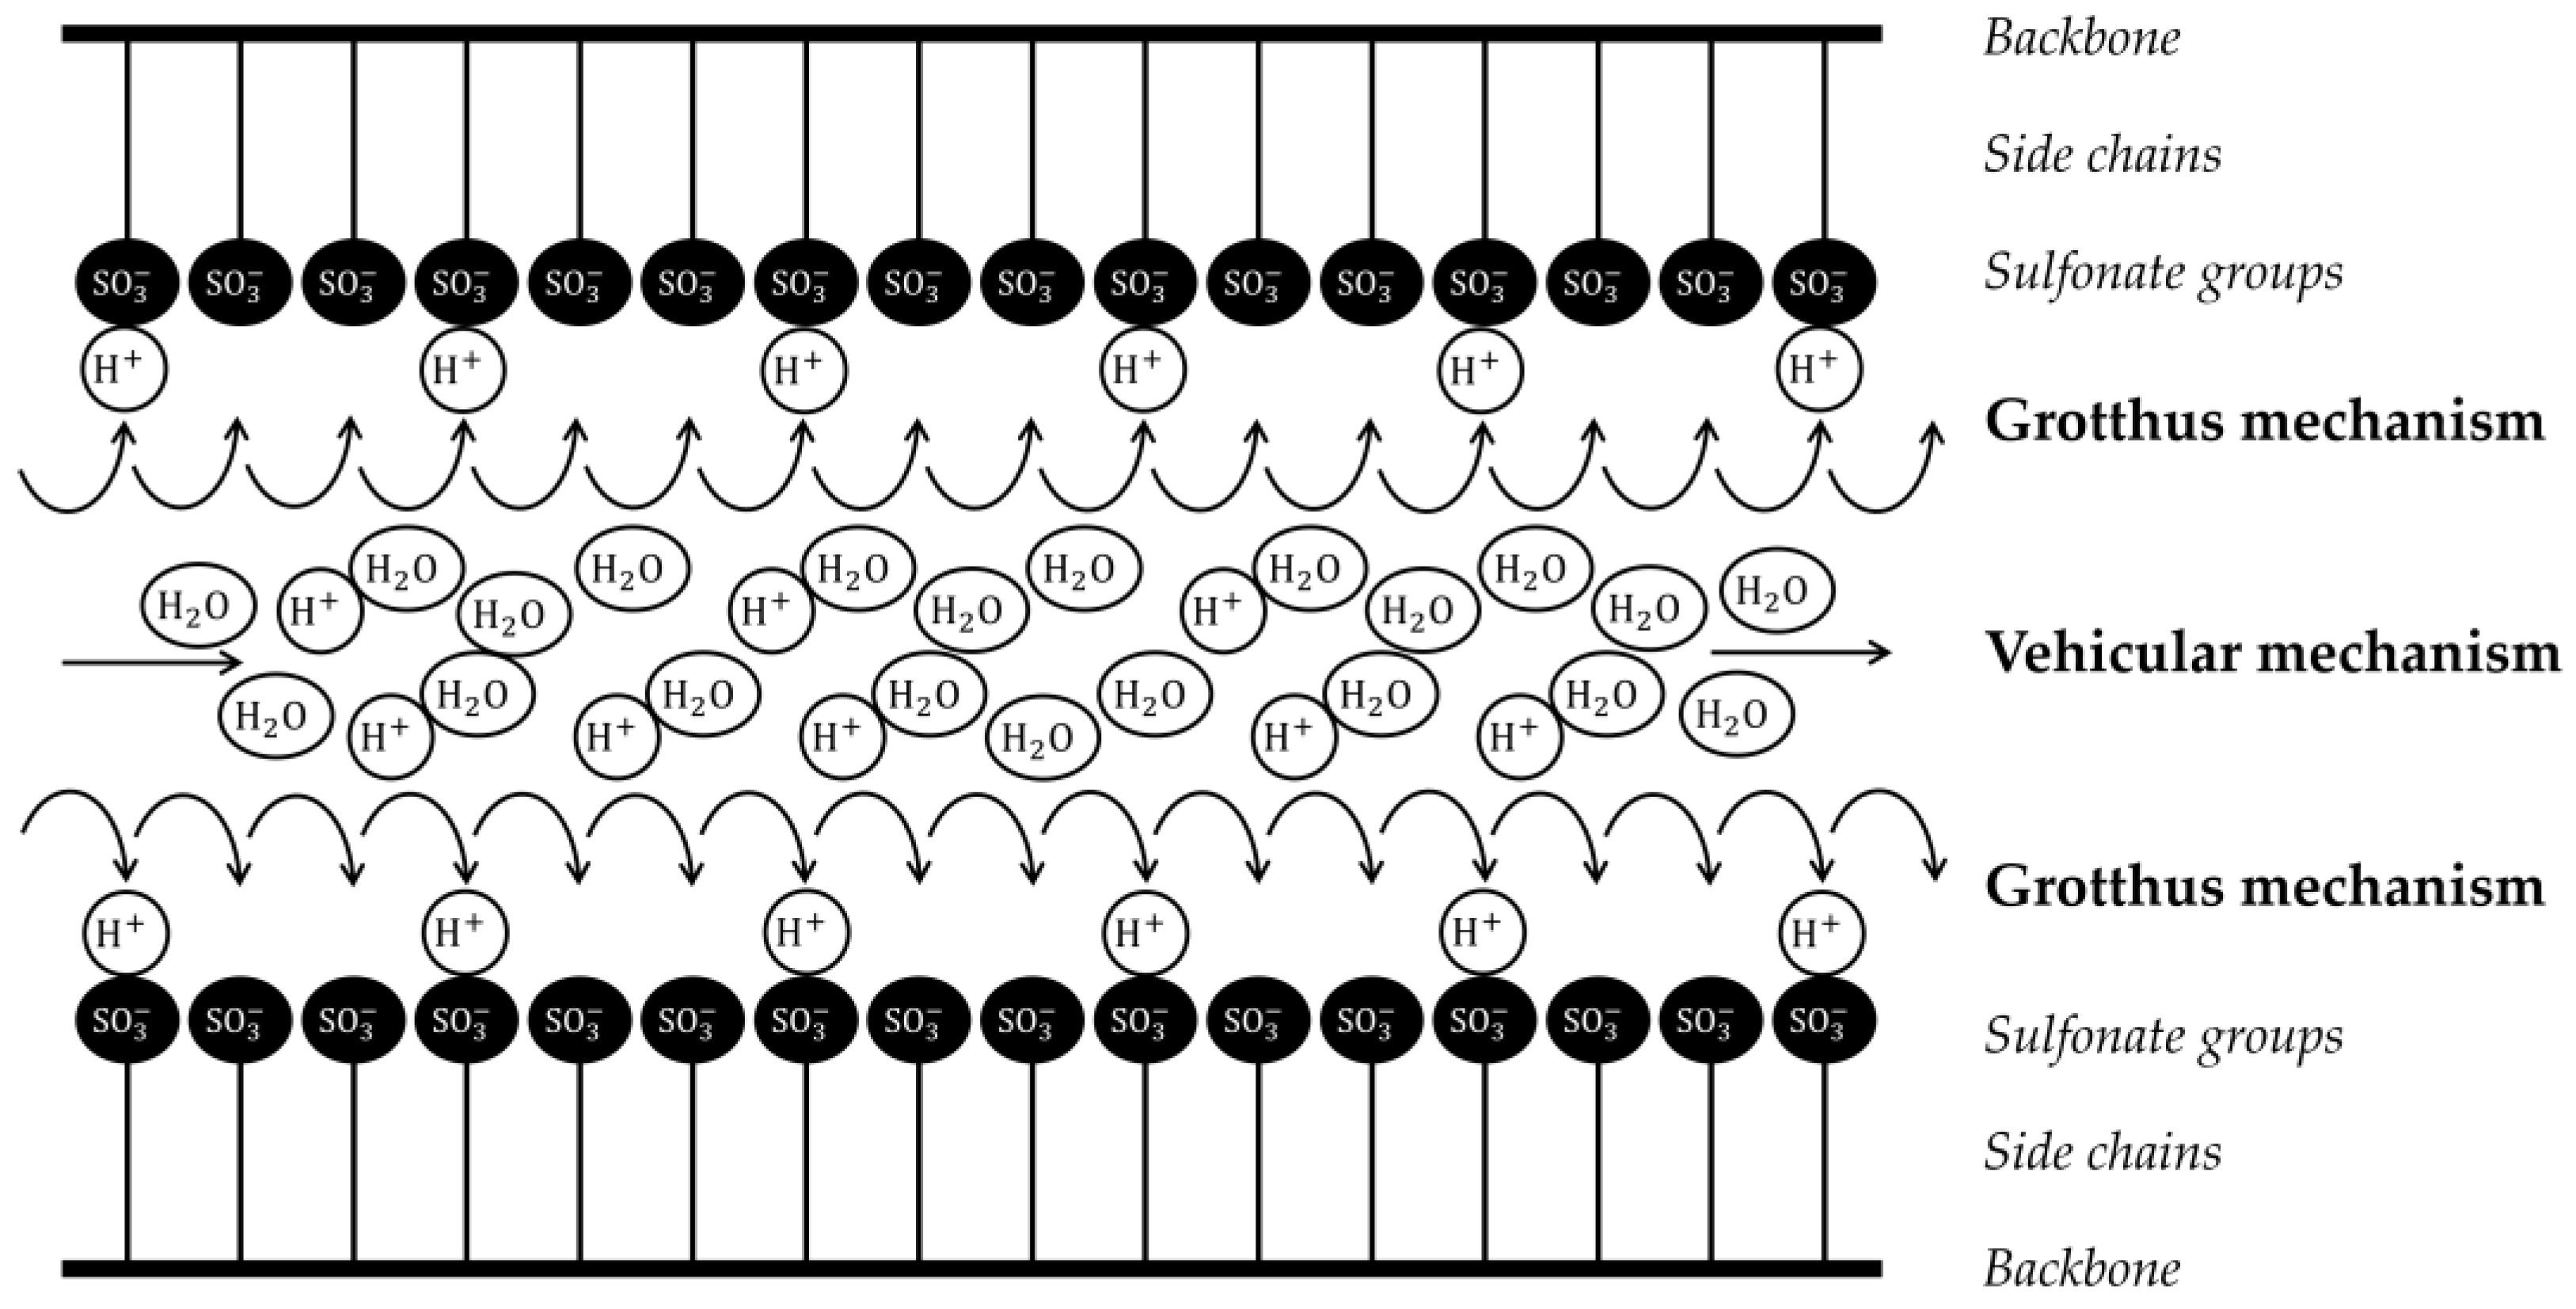
Figure 1. Schematic representation of PEM electrolyte structure and main protons transport mechanisms.
Energies 17 04841 g001
Figure 2. First seven coefficients (a) and eigenvalues (b) for different Peclet numbers.
Energies 17 04841 g002
Figure 3. Representation of the time evolution of the normalized solution for different Peclet numbers: Pe = 0.2 (a), Pe = 0.5 (b), Pe = 1 (c), and Pe = 2 (d).
Energies 17 04841 g003
Figure 4. Comparison between analytical and integral solutions (a) and error distribution (b) for Pe = 3.
Energies 17 04841 g004
Figure 5. Sensitivity analysis of average solutions’ varying Pe numbers: Pe = 0.2 (a), Pe = 0.5 (b), Pe = 1 (c), and Pe = 2 (d).
Energies 17 04841 g005
Figure 6. Comparison between τ1 and τd varying Pe from 0 to 10.
Energies 17 04841 g006
Figure 7. Representation of td variation with the membrane thickness (a) and molar concentration (b), as well as electrodes’ negative (c) and positive (d) pressure gradients.
Energies 17 04841 g007
Figure 8. Steady-state solution (black) and its tangent lines (red for anode, blue for cathode) at boundaries with an intersection for Pe = 3, λa = 7, and λc = 14.
Energies 17 04841 g008
Figure 9. Water content with a steady-state (dashed lines) and dynamic (solid lines) membrane.
Energies 17 04841 g009
Table 1. Operative conditions set for design analysis.
NameValueUnit
Temperature50°C
Current density0.5A·cm−2
Pressure gradient0.5bar
Table 2. Physical parameters set for the control analysis.
NameValueUnit
Dry thickness200μm
Molar concentration1800mol·m−3
Permeability10−18m2
Table 3. Reference data for the simulation (Maggio et al. [41]).
NameValueUnit
Cell temperature70°C
Electrode surface50cm2
Anode gas pressure2.5atm
Anode inlet gas flow rate0.53Nl·min−1
Anode humidifying temperature85°C
Cathode gas pressure3atm
Cathode inlet gas flow rate3Nl·min−1
Cathode humidifying temperature75°C
Membrane dry thickness175µm
Membrane dry density1.84g·cm−3
Membrane molar mass1100g·mol−1
Disclaimer/Publisher’s Note: The statements, opinions and data contained in all publications are solely those of the individual author(s) and contributor(s) and not of MDPI and/or the editor(s). MDPI and/or the editor(s) disclaim responsibility for any injury to people or property resulting from any ideas, methods, instructions or products referred to in the content.