Abstract
This study proposes novel and modified conventional flow fields for a high-temperature PEM fuel cell, and predicts the fluid dynamic behavior with a 3D, computational fluid dynamics model. Five base flow field patterns (FFPs) are selected: a 4-channel serpentine, a hybrid design, a 2-channel spiral, a dual-triangle sandwich, and a parallel pin-type flow field. For each base FFP, sub-patterns are developed through modification of the channels and ribs. The 4-channel serpentine is taken as the state-of-the-art reference flow field. Simulations are carried out at two different mass flow rates. The result shows that the incorporation of a dead end in flow channels or the merging of channels into a single channel before connecting to the outlet enhances the average and maximum GDL mass flux, but it also increases the pressure drop. The parallel pin-type design-3 and dual-triangle sandwich design-1 exhibit a more even distribution but yield a lower average GDL mass flux than the 4-channel serpentine, which could be beneficial for reducing MEA degradation and thus used at low load conditions where a high mass flux is not needed. In contrast, the uniform hybrid design and 2-channel spiral design-2 provide a higher average and maximum mass flux with a more non-uniform distribution and greater pressure drop. The high average GDL mass flux would be beneficial during high load conditions to ensure enough reactants reach the catalyst.
1. Introduction
Energy demand around the world is increasing. Most of this energy is generated from fossil fuels, which produce greenhouse gases [1,2]. It is important to generate power from systems that emit less greenhouse gasses. The proton exchange membrane (PEM) fuel cell is one of the most promising types of power-generating system, which offers a high power density, high modularity, durability, excellent reliability, quick response, and nearly zero device-level emission [3,4,5,6]. The PEM fuel cell typically uses hydrogen as a fuel. The hydrogen can be produced from fossil fuels, water, biomass, etc. [7]. Ideally, to limit greenhouse gas emissions, the energy to produce the hydrogen should come from a renewable source, for example using electricity from solar or wind sources for water electrolysis. PEM fuel cells can be operated at a low (<100 °C) or high temperature (120–200 °C). At low-temperature (LT) operation, a Nafion-type membrane is typically used in the membrane electrode assembly (MEA), and water is required to transport protons from the anode to the cathode side. If the membrane dehydrates due to excess heat generation or the presence of low water in the MEA, the membrane proton conductivity drops significantly [8,9,10]. Excess liquid water content in the membrane also reduces performance because this hinders gas transport towards the catalyst active site [8]. At high-temperature (HT) operation, a phosphoric acid (PA)-doped PBI (poly-benzimidazole)-based MEA is used, and the proton conduction is carried out by phosphoric acid. As such, it does not require active water management because the water is not the proton carrier, and liquid water is not formed.
In the PEM fuel cell, the flow field is one of the main components responsible for providing mechanical support, collecting produced electrons, and supplying fuel and air uniformly to the membrane electrode assembly (MEA) [11]. An effective flow field configuration must have the following characteristics [11]: a uniform distribution of dispersed gas at the anode and cathode catalyst layers, a sufficient rib area to ensure high electronic conductivity, and a small pressure drop across the flow pattern. Conducting flow field experiments can be costly and time-consuming. Thus, it is sensible to first conduct a computational analysis to predict key parameters such as the pressure drop and velocity around the flow field, as well as the distribution of temperature, mass flux, and current density around the flow field pattern (FFP) [3,12,13,14,15].
Numerous studies have been performed to design efficient flow field patterns using computational techniques for low temperature (<80 °C) operation [12,13,14,15,16,17,18,19,20]. However, studies at high-temperature (HT) operation (>120 °C) are more limited [8]. A flow field exhibits a different heat and mass distribution around the MEA active area depending on the fuel cell operating temperature. At low-temperature operation, liquid water accumulates in the flow channels of certain flow fields (e.g., the single-channel spiral flow field), leading to water flooding at high current density, particularly near the cathode outlet [4,21]. This water flooding negatively impacts the oxygen distribution and its diffusion through the gas diffusion layer (GDL), and the temperature distribution, which in turn decrease the cell performance [21,22,23]. These issues are resolved by high-temperature operation since water is in vapor form in the flow channels [8]. Since water management is not a major concern for high-temperature operation, high-temperature specific research is needed.
Conventional and modified serpentine patterns are recognized as leading designs at both low- and high-temperature operation [4,13,18,24,25,26]. The serpentine pattern ensures uniform gas distribution around the GDL, promotes good under-rib convection in the GDL, and facilitates smooth temperature distribution [11]. The uniform gas distribution and good convection flow under the rib enhance reactant supply to the catalyst layer [11]. The uniform temperature distribution improves MEA stability and lifetime because it prevents the formation of hot spots at the MEA active area due to the variation in reaction at different places of the MEA, particularly for the LT-PEM fuel cell [6,27]. As such, the serpentine flow field is considered a reference pattern to assess new or improved designs [11,28,29]. Modifications to the conventional serpentine pattern include using multiple channels, altering the channel geometries (tapered, constricted, waved form, etc.) and dimensions, and adding a baffle into the channels [11,30,31]. The studies at both low and high temperatures showed that increasing the number of channels in the serpentine design improves the power output [16,32]. However, Taccani et al. found from their high-temperature experimental study that increasing the channel number from four to five in the serpentine flow field causes a significant increase in pressure drop, and so the 4-channel serpentine design provides better performance in terms of power output and pressure drop compared to a 5-channel design [32].
However, the serpentine design has a high resistivity to flow through the channel, water accumulation in the channel (for low-temperature operation), and reactant depletion along the channel compared to the parallel and pin-type flow fields [11,33]. Therefore, researchers have conducted computational studies to design new flow field patterns. New patterns include an open pore pattern using cellular foam material [12], a blocked gas flow field with a rectangular and semi-cylindrical form [34], and lung-shaped [35] patterns. However, these new designs were evaluated for low-temperature operation, where water management poses a significant challenge in the design of flow field patterns, as discussed.
The computational studies on flow field designs for the HT-PEM fuel cell mostly focused on conventional designs and their modifications. Conventional designs include serpentine, pin-type, interdigitated, and parallel [11]. Falcucci et al. [36] performed a computational fluid dynamic (CFD) study on four different flow field patterns (pin, parallel, combo, and serpentine-type) and found that the serpentine flow field exhibits a uniform velocity distribution compared to other flow fields. The pin-type and parallel-type have the highest flow rate close to the upper-left and lower-right corners of the MEA active area, while, in the combo-type, the velocity is higher at the boundaries of the flow channels. It was also found that a reduction in hydraulic diameter from 1.5 to 1.1 mm in the serpentine flow field improves the average flow velocity in the channel. Lan et al. [37] introduced a novel flow field design method using a combined topology and surrogate model. Their study revealed that the new flow field, termed the leaf-like flow field, with its diagonal inlet–outlet, exhibits better oxygen distribution with a significantly lower pressure drop than the 2-channel serpentine flow field. Wu et al. [38] conducted an experimental and computational flow field study to examine the effect of incorporating wall-mounted cuboid rows in the interdigitated flow field pattern on the electrochemical and fluid dynamic performance. It was found that incorporating wall-mounted cuboid rows in the conventional design improves the uniformity in temperature distribution, generates vortices, reduces the average oxygen distribution, and increases the pressure drop. Although the average oxygen distribution range is slightly lower than the conventional design, the generated vortices force gases to flow through the GDL, which in turn improves the overall performance. Li et al. [26] developed a 3D steady-state and non-isothermal model to investigate the effect of parallel (small and large inlet–outlet manifolds) and single serpentine flow field designs on local transport characteristics. It was noticed that the single-channel serpentine flow field exhibits a high pressure drop, but with a more even distribution of oxygen, temperature, and local current density compared to the parallel design. Agarwal et al. [39] also performed a computational study using conventional parallel and interdigitated flow field designs; they found that the interdigitated pattern exhibits a higher pressure drop compared to the parallel design, resulting in an increase in oxygen concentration in the flow field and convective mass transport between two consecutive channels through the GDL. Xia et al. [40] developed a 3D non-isothermal model to investigate the effect of rib size on oxygen distribution at the catalyst active area. It was noticed that increasing the channel–rib width ratio (CRWR) enhances the oxygen distribution around the catalyst active area, which in turn increases the oxygen concentration. Perng et al. [41] developed a 3D model for the HT-PEM fuel cell to investigate the effect of baffles numbers (n = 0, 1, 3, 4, 7) on oxygen concentration at the channel. It was found that the presence of baffles at the bottom of the channel increases the oxygen flow towards the MEA active area. However, it creates larger regions of lower oxygen concentration downstream of the baffles. It was also noticed that increasing the baffle numbers from one to seven raises the oxygen concentration within the channel, leading to an increase in fuel supply towards the MEA, but it also increases the pressure drop. These studies mostly focused on analyzing modifications to conventional designs (serpentine, parallel, and interdigitated) for the HT-PEM fuel cell; the lack of liquid water formation at high-temperature operation allows for the investigation of other designs.
Therefore, the purpose of this study is to computationally investigate novel and modified conventional flow fields for high-temperature PEM fuel cell operation by evaluating their fluid dynamic performance through qualitative and quantitative approaches. The computational study has been performed at a cell temperature of 160 °C. The average and maximum GDL mass flux, mass flow distribution, and overall pressure drop of these designs are compared to a 4-channel serpentine design, which serves as a reference design. Each of the new designs has a base design with sub-permutations that vary in characteristics such as channel dimension and orientation, channel connection with the inlet and/or outlet, and the presence of dead ends. Consequently, a total of twelve different designs are investigated computationally. A comprehensive 3D computational fluid dynamics (CFD) model using Ansys CFX solver in Ansys Workbench 18.2 has been developed and validated, and a series of simulations are carried out at two different mass flow rates.
2. Computational Model
2.1. Flow Field Pattern Geometry
Initially, five base flow field patterns were selected: the 4-channel serpentine, a hybrid design (a combination of parallel–serpentine patterns), a 2-channel spiral, a dual-triangle sandwich, and a parallel pin-type design. The distinguishing features of these patterns are shown in Figure 1. The 4-channel serpentine design is the reference flow pattern for the comparison because, at low and high temperature, it is the state of the art [11,16,32]. The outermost (channel 1) and innermost (channel 4) channels are labeled as Ch-1 and Ch-4, respectively, in Figure 1a. The other base flow field patterns have sub-patterns. The sub-patterns for each base pattern are considered in order to improve the mass flux distribution and average mass flux, as well as to reduce the pressure drop achieved in preliminary simulations for the base designs. The base hybrid flow field pattern (initial design), a novel pattern shown in Figure 1b, has a uniform channel and rib width. This pattern is termed as the uniform hybrid design. The uniform hybrid design has three parallel sections (upper, middle, and lower) that each consist of a single serpentine channel, as labeled in Figure 1b. Its sub-pattern, termed the non-uniform hybrid design (Figure 1c), has a different channel and rib width for the upper section. The upper parallel section has a wider channel than the middle and lower sections. The middle and lower sections have the same channel and rib width as each other and as the uniform design. Figure 1d shows the base design of the 2-channel spiral flow field pattern. Two sub-patterns, Figure 1e,f, modify how the channels connect with the outlet and incorporate the presence of a dead end at the center of the spiral. Figure 1g highlights the base design of the novel dual-triangle sandwich flow field pattern. This pattern consists of two main trunk channels running diagonally across the flow field: an inlet and an outlet channel. From the inlet trunk, side channels distribute flow and then connect to the outlet channel. These side-channels form a triangular pattern. The sub-patterns are given in Figure 1h,i. These sub-patterns modify how the side channels connect to the outlet trunk channel and incorporate the presence of a dead end. Another flow field pattern termed the parallel pin-type is shown in Figure 1j. This new pattern combines a parallel design and a pin design with the purpose of preventing the low-to-zero flow region at two corners of the flow field common in these two conventional designs (the parallel and pin-type flow fields) [11]. Figure 1j is the base parallel pin-type design. It consists of elongated pin ribs that form parallel horizontal channels, with shorter passages between the parallel channels. As highlighted in Figure 1k,l, the sub-patterns incorporate changes such as connecting all the ribs on the first horizontal channel and blocking the leftmost vertical channel to produce a short, 180° bend shape between the two uppermost horizontal channels (Figure 1k). Additional changes include connecting the pin ribs at different locations to create elongated ribs to disrupt the vertical channels.
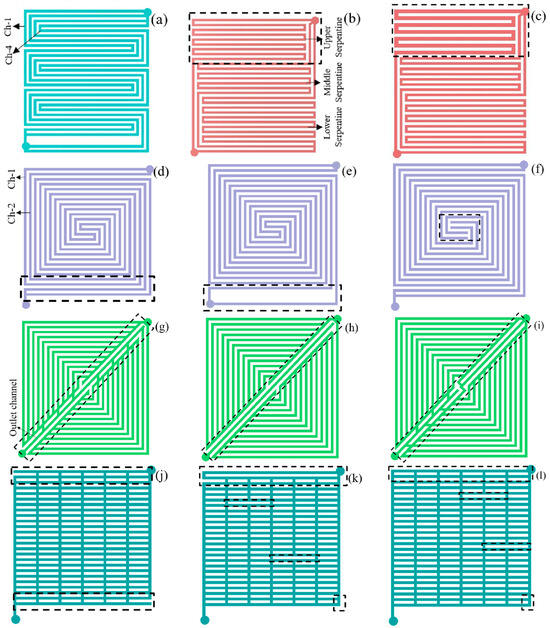
Figure 1.
Flow field patterns. White areas are ribs and colored areas are channels. Dashed lines are used to highlight differences between designs. (a) 4-channel serpentine, (b) uniform hybrid design (combined parallel and serpentine design), (c) non-uniform hybrid design, (d) spiral design-1, (e) spiral design-2, (f) spiral design-3, (g) dual-triangle sandwich design-1, (h) dual-triangle sandwich design-2, (i) dual-triangle sandwich design-3, (j) parallel pin-type design-1, (k) parallel pin-type design-2, (l) parallel pin-type design-3.
Consequently, a total of 12 different designs are explored for computational analysis. The channel and rib (in-between 2 channels) width of all the designs are set at 1 mm except for the non-uniform hybrid design (Figure 1c), where the uppermost parallel serpentine channel and rib width dimension are 1.5 mm and 1.13 mm, respectively. The channel depth for all 12 designs is maintained at 1 mm.
2.2. Model Description
2.2.1. Computational Domain
The computational domain consists of a flow field domain (fluid domain) (Figure 1) and porous domain, also referred to as the gas diffusion layer (GDL). The porous domain (GDL) is at the outer face of the flow field domain, with a dimension of 50 mm × 50.50 mm × 0.36 mm (length × width × thickness). Figure 2 shows the computational domain used in this study. The sizing of the domain is based on the lab scale prototype used to validate the model.
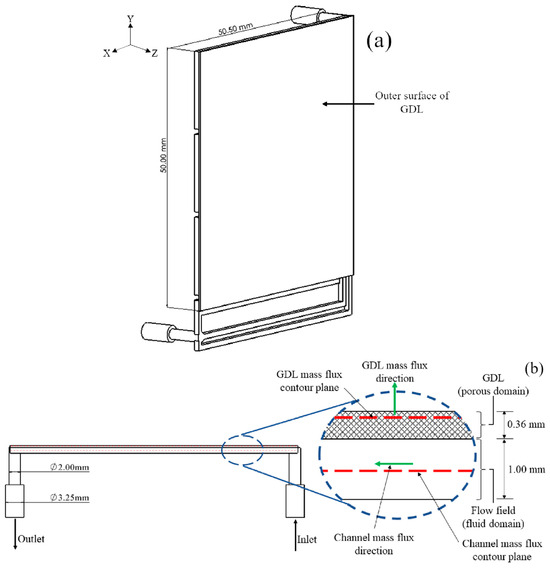
Figure 2.
Computational domain: (a) complete assembly of flow field and porous domain, (b) side view of complete assembly. GDL mass flux and channel mass flux are defined by Equations (10) and (12), respectively.
2.2.2. Model Assumptions and Parameters
The primary purpose of the model is to analyze the ability of the flow fields to distribute reactants across the catalyst layer of the MEA and to provide a relative comparison of the pressure drops for the flow fields. As such, the model focuses on the fluid dynamics and does not model the electrochemical reactions. The model solves the governing equations for mass and momentum conservation. Additionally, the modeling efforts focus on the cathode, because oxygen diffusion to catalyst sites is often more limiting than hydrogen [42] and the air flow rates for the cathode side are generally higher [43], and thus the pressure drop on the cathode side will be greater and contribute more to the parasitic power consumption. While electrochemical reactions are not directly included in the model, during use there is a consumption of reactants at the outer surface of the GDL due to chemical reactions that affect the reactant distribution across the MEA. Based on prior experimental high-temperature PEM work, this consumption is ~10–13% of the inlet air mass flow rate for an air stoichiometry of 2.0 to 2.5 [43]. As such, to represent this gas consumption due to reactions, an outflow from the outer surface of the GDL, termed the reaction outflow, of 12% of the inlet mass flow rate is applied at that surface. While the results focus on the cathode side, similar distributions were obtained for the anode side, albeit with lower values due to the lower flow rates and higher consumption of inlet flow. The following additional assumptions are made in this computational study.
- Gas (air) is an ideal gas;
- The flow is laminar, incompressible, single-phase, and steady-state;
- The system is isothermal (160 °C);
- The porous structure of gas diffusion layer is of the isotropic with superficial velocity loss type;
- No gravitational effect.
2.2.3. Governing Equations
For incompressible flow and steady-state conditions, the simplified form of the continuity equation for the fluid and porous domain is shown in Equation (1) [44],
where u, v, and w are the velocities of flow in the X, Y, and Z directions, respectively.
The momentum equation in the X, Y, and Z directions for the fluid in the flow channel is given by Equations (2)–(4) [44].
For the porous domain (GDL), the momentum equation in the X-, Y-, and Z-directions is given by Equations (5)–(7) [45].
Here, is the momentum loss due to the porous solid.
The momentum loss though the isotropic porous domain in the X-direction is obtained from Equation (8).
Here, U is the total velocity, u is the velocity in the X-direction, μ is the viscosity, k is the intrinsic permeability of the porous medium, is the quadratic loss coefficient (), and L is the thickness of the porous domain. The expression of the momentum loss in the Y-direction and Z-direction are similar to the X-direction but with appropriate directional velocity components. The Ansys CFX solver in Ansys Workbench 18.2 was used to solve the governing equations.
The mass flux distribution contours are plotted for a plane close to the outer surface of the GDL for flux in the Z-direction (see Figure 2b). This mass flux is termed the GDL mass flux () and represents the flux through the GDL. The flow velocity through the GDL () and corresponding GDL mass flux () are obtained from Equations (9) and (10), respectively. The flux distribution at the channel mid-plane in the XY-direction (see Figure 2b), referred to as the channel mass flux (), is also plotted. This flux represents the flow through the channels. The flow velocity at the channel mid-plane () and the channel mass flux () are obtained from Equations (11) and (12), respectively. The flow velocity at the channel mid-plane () is the resultant of the velocity in the X- and Y-direction, which is used to calculate the channel mass flux.
where , , and are the velocity at the horizontal (X-axis), vertical (Y-axis), and perpendicular (Z-axis) to the direction of the outer surface of the GDL plane.
2.2.4. Parameters and Boundary Conditions
For the inlet condition, a uniform mass flow rate was applied to the inlet tube shown in Figure 2. Two inlet flow rates (low and high) were simulated. These flow rates (given in Table 1) were selected based on empirical volumetric flow rates corresponding to operating the cell at a current density for moderate power output (~500 mA/cm2 or ~0.6 V) and high power output (~1000 mA/cm2) [43]. The outlet (see Figure 2) was set to atmospheric pressure (1 atm). The flow field domain mass and momentum equations were coupled to the porous domain equations by specifying a conservative interface flux at the interface between the two domains. As discussed, at the outer surface of the GDL, a constant outflow flow rate of 12% of the inlet flow rate was applied to account for chemical reactions based on prior empirical data for fuel cells operating at similar temperatures and flow rates [43]. A no-slip boundary condition was applied to any solid, e.g., the channels walls. The targeted residue was set to 1 × 10⁻⁶ for the solution convergence. Table 1 provides the parameters associated with the boundary conditions, and other conditions held constant for the simulations.

Table 1.
Parameters used for computational analysis.
2.2.5. Meshing
Table 2 shows the details of the meshes used in this study. Figure 3 shows the meshing of the flow domain (flow field domain and porous medium) for the 4-channel serpentine FFP (Figure 1a)
Table 2.
Details of meshes.
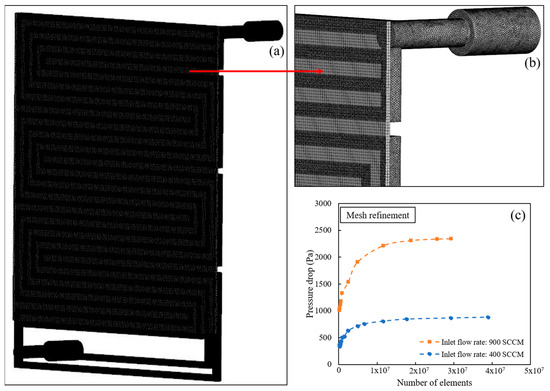
Figure 3.
Meshing of 4-channel serpentine flow field pattern with porous GDL: (a) Complete domain, (b) zoomed view, and (c) mesh refinement result.
A mesh independent study was conducted at both flow rates to establish mesh independence with minimum computational time. Mesh sizes from 0.1 to 0.6 mm were simulated (Figure 3c). For the high flow rate, the solution became mesh-independent at element sizes less than or equal to 0.13 mm. The low flow rate simulations became independent at sizes less than or equal to 0.15 mm. Therefore, a mesh size of 0.13 mm was used for all the subsequent simulations.
3. Model Validation
After the mesh independence analysis, the model was validated with experimental results at element sizes less than or equal to 0.13 mm. To validate the model, the pressure drop through a 3-channel serpentine flow field pattern was measured at different flow rates and compared to the computational results. The pressure drop between the inlet and outlet of the anode and cathode side of the fuel cell assembly was measured using a series 2000 Magnehelic® differential pressure gauge purchased from Dwyer Instrument, LLC, Michigan City, IN 46360, USA. Figure 4 shows the image of the experimental set-up used in this study. The channel and rib width of the 3-channel serpentine pattern used for the experiment was 0.80 mm, and the depth of channel was 1.10 mm. The flow field would cover an active area of 25 cm2. Air was supplied to the fuel cell at rates from 100 to 1100 SCCM. For each flow rate, the experiment was repeated five times for each flow field to obtain the average pressure drop and to estimate the total experimental uncertainty (including multiple measurements and the pressure gauge uncertainty) using standard uncertainty calculation techniques. The total uncertainty is reported at a 95% confidence level. A physical geometry representative of the experimental pattern and gas lines was constructed and the flow through it modeled using the methods described in prior sections to predict the pressure drop. However, the outflow at the GDL was set to zero because, during the pressure drop measurement, there was no chemical reaction occurring.
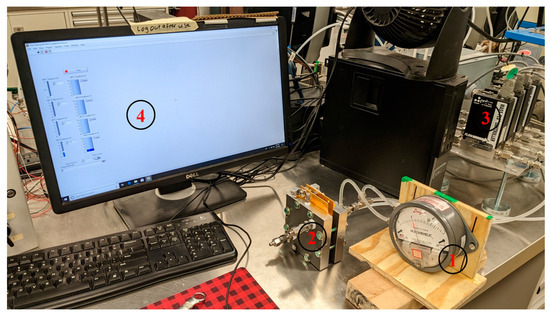
Figure 4.
Experimental set-up (1. differential pressure gauge, 2. fuel cell fixture, 3. mass flow controller, 4. display of lab view).
Figure 5 shows the comparison between the computational and experimental results of the pressure drop. The pressure-drop curve obtained from computational study is in excellent agreement with the experimental data. There is some minor difference between the measurement and the simulations, but the difference is within the experimental uncertainty.

Figure 5.
Comparison of pressure drop obtained from experimental and computational approach at different flow rates using the 3-channel serpentine flow field. Error bars represent 95%-level experimental uncertainty.
4. Results and Discussion
The flow field designs are evaluated based on (i) the average GDL mass flux and (ii) the maximum GDL mass flux, (iii) the GDL mass flux distribution, and (iv) the overall pressure drop in the flow field. These parameters are listed in order of importance; however, trade-offs between the metrics need to be considered when evaluating the results. For example, a high average mass flux may not be justifiable if the pressure drop is excessive. The mass flux distribution is quantified by the difference between the average and maximum mass flux through the GDL and by contour plots of the local mass flux. For the mass flux, it is desirable to have a high average mass flux through the GDL in order to ensure there are sufficient reactants for the electrochemical reactions [47]. A high localized maximum mass flux accelerates localized reaction kinetics, which might result in an increase in overall performance in the short term or be good for high power applications and offset some of the impact of non-uniformity in flux. However, it is more desirable to have a high average mass flux with a uniform mass flux distribution, because a uniform flux with high mass flow through the GDL helps to prevent local starvation, which results in voltage drop, a reduction in lifetime, and catalyst degradation [48,49,50,51]. The pressure drop is given least importance because its significance depends on the circumstance. For example, whether a low mass flux with a low parasitic consumption or high mass flux with a cost of high parasitic consumption is prioritized. However, it is most desirable to have a high GDL mass flux with a lower pressure drop to ensure a higher power output with a lower parasitic power consumption. For evaluating the expected performance, the GDL mass flux (Equation (10), Figure 2b) is used, while the channel mass flux (Equation (12), Figure 2b) distribution is used to help interpret the GDL mass flux distribution. Similar behaviors for the GDL mass flux contours were observed at the low and high inlet conditions. Thus, the discussion primarily uses the low inlet condition for the GDL mass flux distribution plots. The high inlet condition contours are given in the Supplemental Information.
4.1. Four-Channel Serpentine Flow Field
Figure 6 shows the plots of the average and maximum GDL mass flux at both low and high inlet flow conditions for the 4-channel serpentine flow field. The average mass flux increases from 0.001 and 0.0022 kg/m2·s due to an increase in the inlet flow rate from 400 to 900 SCCM. The maximum mass flux also doubles. For both inlet flow conditions, the average mass flux values are significantly lower, by an order of magnitude, than the maximum mass flux values. This indicates that the mass flux distribution is not uniform, since the differences between the average and maximum mass flux values are significant. Additionally, the difference increases as the inlet flow rate is increased to 900 SCCM, which implies that the non-uniformity increases as the flow increases.
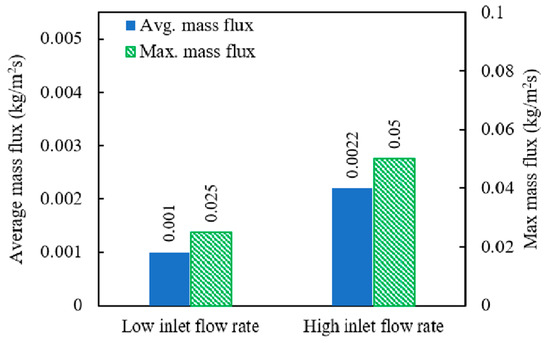
Figure 6.
Average and maximum GDL mass flux at both low and high inlet flow conditions for the 4-channel serpentine flow field.
The pressure drop through the flow field is moderate, with 377 Pa at 400 SCCM and 1057 Pa at 900 SCCM. This pressure drop is due to the resistance to air flow through the channel, which increases with the channel length and the presence of short bends [11,52]. Additionally, the merging of channel 1 and 2 (Figure 1a) before connecting with the outlet, followed by the convergence of three channels at the outlet, could be another possible source for increased flow resistance. The moderate pressure drop utilizing the 4-channel serpentine design was also observed in an experimental study conducted by Taccani et al. [32].
The mass flux distributions are shown in Figure 7. For the low (Figure 7a) and high (Figure 7d) inlet flow rates, the local GDL mass flux is typically in the range of 0–0.0125 kg/m2·s and 0–0.015 kg/m2·s, respectively. There are small regions with slightly higher magnitudes (up to ~0.025 kg/m2·s and ~0.05 kg/m2·s for the low and high inlet flow rate conditions, respectively). However, these regions are small (see Figure 7a,d). Since the majority of the GDL has mass fluxes within the ranges of 0–0.0125 kg/m2·s and 0–0.015 kg/m2·s, these ranges are used for the max and min scale values in Figure 7b and Figure 7e for the low and high inlet flow rate conditions, respectively. This scaling is performed to more clearly show the majority of the mass flux distribution. This scaling is also used for the flux distribution of the other flow fields, because the majority of the mass flux for those fields also falls within that range, and to facilitate comparison between flow fields. The maximum mass flux values are also reported for the other flow fields.
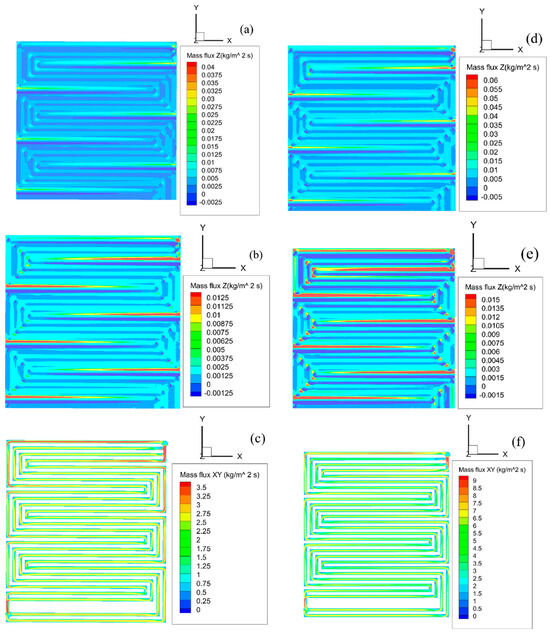
Figure 7.
GDL (Z-direction) and channel mass flux (in XY-plane) contours for the 4-channel serpentine flow field: GDL mass flux on a wide scale ((a) low flow and (d) high flow condition), GDL mass flux on a concise scale ((b) low flow and (e) high flow condition), and channel mass flux ((c) low flow and (f) high flow condition).
As shown by Figure 7b, the GDL mass flux distribution demonstrates some non-uniformity, which confirms the observation from Figure 6. The high mass flux regions occur, primarily, at locations directly above channel 1 (Ch-1) and channel 4 (Ch-4), as these two channels have a higher channel mass flux compared to the others (Figure 7c). However, the GDL mass flux is relatively low (zero-to-low flow) at locations directly above the rib area, particularly the rib area between the serpentine bends. Due to high mass flux values in channels 1 and 4, there is lower air flow in the other channels, which results in low air flow in those regions of the GDL plane that are above the rib regions next to these channels. These zero-to-low mass flux regions are also observed at high flow conditions (Figure 7e), where the area of zero-to-low flux regions above the rib locations increases slightly compared to what is obtained at low flow conditions. Due to the increasing inlet flow rate, the flow velocity through the channel increases, but the flow velocity through the GDL does not increase enough to fill the rib area.
4.2. Hybrid Design Flow Field
Figure 8 compares the average and maximum mass flux through the GDL, along with the overall pressure drop, for the hybrid flow field designs. As shown by Figure 8a, both designs yield a nearly similar average mass flux through the GDL at both inlet flow conditions. This indicates that the designs would provide a similar amount of gas in the catalyst active area. However, the non-uniform hybrid design has a ~1.3 and ~1.2 times lower localized maximum mass flux compared to the uniform hybrid design for the low and high inlet flow conditions, which is due to the decrease in flow resistance through the wider channel (upper serpentine section, Figure 1c). These lower maximum mass fluxes in the non-uniform hybrid design reduce the difference between the average and maximum mass flux for the non-uniform hybrid design (difference at 400 SCCM: 0.029 kg/m2·s, 900 SCCM: 0.072 kg/m2·s) compared to the uniform hybrid design (difference at 400 SCCM: 0.039 kg/m2·s, 900 SCCM: 0.0869 kg/m2·s). This reveals that the non-uniform design provides a slightly more even distribution compared to the uniform design. For both flow field designs, the difference between the average and maximum mass flux increases for an increase in flow rate from 400 SCCM to 900 SCCM. This indicates that the non-uniformity increases as the flow increases. In Figure 8b, the non-uniform hybrid design exhibits a lower pressure drop compared to the uniform design, particularly at the high inlet flow rate, which is again due to the increase in channel width in the upper serpentine flow channel. The modification of the upper serpentine channel in the non-uniform hybrid design reduces the pressure drop by ~15%. These results agree with the prior work on low temperatures conducted by Shimpalee et al., where they found that the increase in channel width reduces the pressure drop [53].
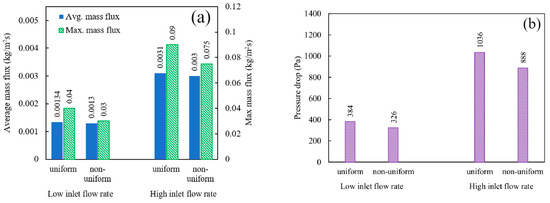
Figure 8.
Comparison of the average and maximum GDL mass flux, along with the overall pressure drop between the uniform and non-uniform hybrid designs: (a) Mass flux, (b) pressure drop.
The mass flux distribution is given in Figure 9 for the low inlet flow condition. The high flow rate (900 SCCM) contours are provided in the Supplemental Material (Figure S1). Figure 9a,c display the GDL mass flux contours of the uniform and non-uniform hybrid design, respectively. The contour plots agree with the observation on the GDL mass flux distribution from Figure 8a. Both designs have a similar minimum flow rate (i.e., deep blue regions of zero flow) above the rib regions, particularly over the rib areas between serpentine sections. Higher mass flux values occur over the channels. These alternating low and high mass flux regions create a striped pattern across the flow field for both designs. However, the uniform hybrid design has slightly more regions of high mass flux (the light orange to dark red regions) located above the channels, particularly in the upper serpentine channel. Having slightly more regions of high mass flux has a very minimal impact on altering the average mass flux values. However, it increases the local maximum and the level of non-uniformity in the uniform hybrid design. Looking at the channel mass flux contours in Figure 9b (uniform design) and Figure 9d (non-uniform design), the non-uniform hybrid design has a higher channel mass flux in the upper serpentine channel than the uniform hybrid design, which is due to the increase in channel width and the wider channel subtending a larger fraction of the inlet hole circumference. Although the channel mass flux in the upper serpentine channel of the non-uniform hybrid design increases, this improvement does not have any substantial impact on the GDL mass flux. Comparing the GDL mass flux to the channel mass flux, one key area of low GDL mass flux corresponds to the upper serpentine channel as it exits the serpentine portion and connects to the outlet. There is high channel flow in this part of the channel but a low GDL mass flux. This indicates that more resistance in the channel could be used at this location to force more flow into the GDL.
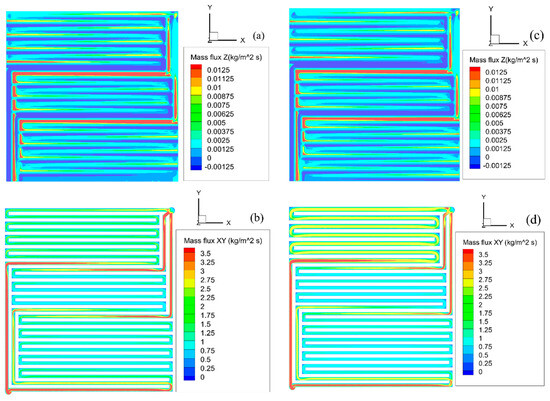
Figure 9.
Comparison of the GDL (Z-direction) and channel mass flux (in the XY-plane) between the uniform and non-uniform hybrid designs at the low inlet flow rate condition: Uniform hybrid ((a) GDL mass flux, (b) channel mass flux) and non-uniform hybrid ((c) GDL mass flux, (d) channel mass flux).
In summary, the modification of the upper serpentine channel in the non-uniform hybrid design reduces the overall pressure drop and causes a slight improvement in uniformity without significantly altering the average mass flux through the GDL. However, it does decrease the maximum mass flux and GDL mass flux in the region above the upper serpentine section due to low resistance to flow through the channel.
4.3. Two-Channel Spiral Design
Figure 10 shows the comparison of the average and maximum mass flux through the GDL, along with the overall flow field pressure drop, for the 2-channel spiral flow field designs. Figure 10a shows that, at the low and high inlet flow conditions, design-2 and design-3 yield a similar average mass flux through the GDL, which is higher than design-1. This higher average GDL mass flux is due to the modification of the channel connection with the outlet (design-2, Figure 1e) and the presence of a dead end at the center of the flow field (design-3, Figure 1f). Although the maximum mass flux values for all the designs are similar at the low flow condition, the value is ~1.3 times higher in design-1 and design-3 than design-2 for the high inlet flow condition. For design-1 (Figure 1d) and design-3, the two channels merge into a single channel before connecting with the outlet. This merging causes an increase in channel flow resistance, which results in an increase in the localized GDL mass flux value. For low inlet flow conditions, the differences between the average and maximum GDL mass flux for all three designs are nearly equal (difference at 400 SCCM: 0.059 kg/m2·s), while at the high inlet flow condition, design-2 has the lowest difference (difference at 900 SCCM: 0.097 kg/m2·s) compared to design-1 (difference at 900 SCCM: 0.128 kg/m2·s) and design-3 (difference at 900 SCCM: 0.127 kg/m2·s). This indicates that design-2 has a more even distribution compared to the other designs. For all the designs, the difference between the average and maximum mass flux increases as the inlet flow rate increases from low to high, which reveals that the non-uniformity in gas distribution increases due to an increase in inlet flow rate from low to high. Design-2 has the lowest pressure drop for the spiral designs, as shown in Figure 10b. It is ~10% and ~14% lower than the design-1 and design-3, respectively. This is due to two reasons: (1) the modification of the channel connection at the outlet, where the channels in design-2 are connected to flow field outlets independently, and (2) the absence of a dead end. These result in a lower resistance to flow in the channels, and thus the lower pressure drops.
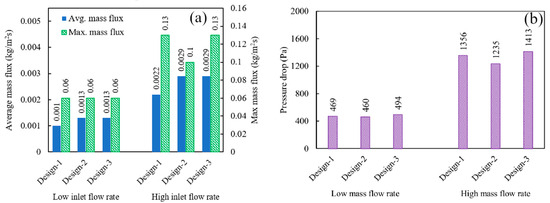
Figure 10.
Comparison of average and maximum GDL mass flux, along with the overall pressure drop, among various 2-channel spiral designs: (a) Mass flux, (b) pressure drop.
Figure 11 shows the mass flux distribution contours for various designs of the 2-channel spiral flow field for the low inlet flow condition. As shown by Figure 11a (design-1), Figure 11c (design-2), and Figure 11e (design-3), all the designs exhibit zero GDL mass flux regions (i.e., deep blue regions), particularly in the outward-spiraling flow channel areas (the channels that spiral from the center to the outlet). This zero GDL mass flux in the outward-spiraling flow channel regions is due to the gradual decrease in flow resistance through the channels as the flow approaches the outlet. This low flow resistance through the channel increases the flow velocity in the channels as it moves outward (Figure 11b,d,f), and thus decreases the GDL mass flux. Although the high mass flux regions (red regions) are nearly similar for all the designs, the amount of zero flow regions and low (light blue) mass flux regions is greater for design-1 than design-2 and design-3. This indicates that design-1 provides less uniformity in GDL mass flux distribution compared to other designs (as discussed for Figure 10). Additionally, having more regions of zero mass flux in design-1 explains the decrease in the average GDL mass flux observed in Figure 10. Both design-2 and design-3 provide a similar GDL mass flux distribution at the low inlet flow condition, as expected from the average and maximum mass flux. At 900 SCCM (Supplementary Figure S2), the total area of zero-to-low GDL mass flux regions also increases in all the designs; however, design-1 still has the greatest amount of zero-to-low mass flux regions.
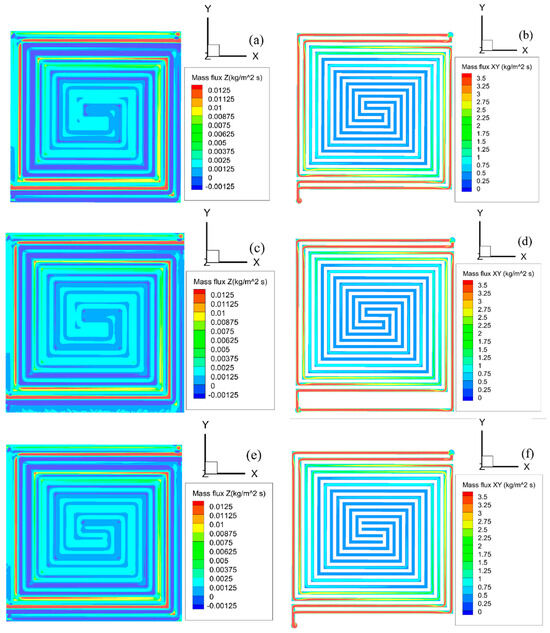
Figure 11.
GDL (Z-direction) and channel (in XY-plane) mass flux contours for different spiral designs at low inlet flow rate: Design-1 ((a) GDL mass flux, (b) channel mass flux), design-2 ((c) GDL mass flux, (d) channel mass flux), and design-3 ((e) GDL mass flux, (f) channel mass flux).
In summary, the modification in the flow field pattern by connecting the channels independently to the outlet (design-2, Figure 1e) increases the average GDL mass flux, improves gas distribution, and reduces the pressure drop, but it also decreases the maximum mass flux at the high inlet flow rate. Alternatively, merging two channels into a single channel before connecting to the outlet (design-1, Figure 1d) improves the localized GDL mass flux, but it causes a decrease in the average GDL mass flux, with a high pressure drop. Beside this modification, the incorporation of the dead end at the center of the spiral design (design-3, Figure 1f) increases the average GDL mass flux and improves uniformity, without altering the maximum mass flux compared to the base design (design-1, Figure 1d); however, it also has a higher pressure drop.
4.4. Dual-Triangle Sandwich Design
Figure 12 shows the comparison of average and maximum mass flux through the GDL, along with the overall pressure drop, of the dual-triangle sandwich flow field designs. As shown by Figure 12a, at low and high inlet flow conditions, design-2 exhibits a higher average and maximum mass flux compared to the other designs. These higher average and maximum mass flux values are due to the presence of dead ends in the diagonal trunk channel of design-2 (Figure 1h), which forces the air to flow through the GDL. Design-3 has the lowest average and maximum mass flux. This indicates that the modification of side channel connections to the outlet trunk in design-3 (Figure 1i) reduces the air flow through the GDL. However, these mass fluxes are just slightly lower than the values provided by design-1. Positively, design-3 exhibits the smallest difference between the average and maximum GDL mass flux (difference at 400 SCCM: 0.015 kg/m2·s, 900 SCCM: 0.033 kg/m2·s). The differences for design-1 (difference at 400 SCCM: 0.019 kg/m2·s, 900 SCCM: 0.048 kg/m2·s) and design-2 (difference at 400 SCCM: 0.049 kg/m2·s, 900 SCCM: 0.097 kg/m2·s) are greater. This low difference indicates a greater uniformity in GDL mass flux. For all three dual-triangle sandwich designs, the difference increases as the inlet flow rate is increased from 400 to 900 SCCM, indicating a decrease in uniformity in GDL mass flux distribution with an increase in inlet flow rate. Looking at the pressure drop chart in Figure 12b, the pressure drop through the flow field in design-2 is ~2 and ~3.5 times higher compared to design-1 and design-3, respectively, which is due to the presence of a dead end in the upper and lower triangle and the lack of a connection from the triangles to outlet channel. Design-3 yields the lowest pressure drop among all the designs. The modification of the base design (design-1) to design-3 causes a decrease in pressure drop by ~36% and ~32% at low and high flow rate conditions, respectively.

Figure 12.
Comparison of average and maximum GDL mass flux, along with overall pressure drop among different dual-triangle sandwich designs: (a) Mass flux, (b) pressure drop.
The mass flux distributions for the various designs are given in Figure 13 for the low inlet flow rate condition. The high inlet flow rate conditions are provided in the Supplemental Material (Figure S3). Figure 13a,c and e depict the GDL mass flux contours of design-1, design-2, and design-3, respectively. The contour plots confirm the observation from Figure 12. All the dual-triangle sandwich designs have similar minimum flow rates (i.e., regions of zero flow, deep blue regions), and all the designs have similar values for mass flux in the bulk of the triangle regions of the flow field. However, design-2 has more regions of high mass flux (the red regions located along the diagonal and the right edge). Having more regions of high mass flux increases the average mass flux observed in Figure 12. In contrast, design-1 and design-3 have similar amounts of high flux regions, albeit in different locations. Thus, these designs have a similar average mass flux. For design-1, the high mass flux regions are mostly along the top and right sides. For design-3, they are along the upper portion of the diagonal and right edge. However, as discussed, the mass flux distribution is more uniform in design-3 compared to the other designs. In design-1, there are regions of zero flow (deep blue) on the right edge and top, while design-2 has zero flow regions in the center diagonal trunk channel as well. In contrast, design-3 has a very small region with zero-to-low flow (deep and light blue regions). Additionally, in the triangle regions, in all three designs, the areas above the rib regions exhibit a slightly lower mass flux (0 < ≤ 0.00125 kg/m2·s) compared to the area above the channels (0.00125 < ≤ 0.0025 kg/m2·s). However, design-2 has a more pronounced difference in mass flux for the regions over the ribs versus the channels. In design-3, the contrast between these two regions is less. Design-3 has a better uniformity because it has a more even air distribution in the flow channels (Figure 13f). The modification in channel connections between the upper and lower triangle and the outlet channel improves the channel mass flux uniformity in design-3 significantly. Although the uniformity in gas distribution provided by design-3 is relatively good, it yields a low average mass flux (Figure 12a) and falls with a range of 0 to 0.0025 kg/m2·s in most of the GDL active area.
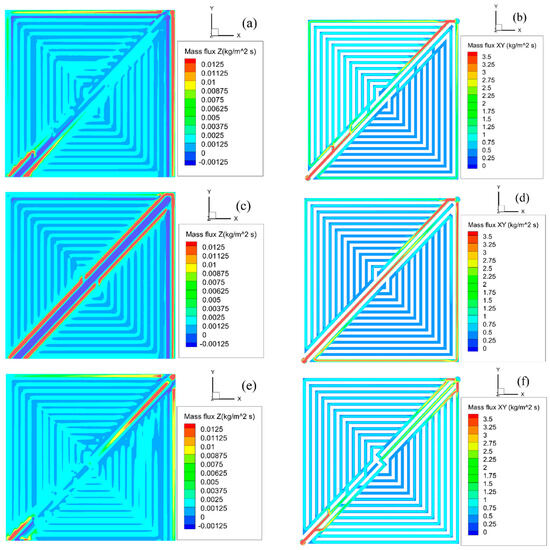
Figure 13.
Comparison between various dual-triangle sandwich designs in terms of the GDL (Z-direction) and channel (in the XY-plane) mass flux at the low inlet flow rate condition: Design-1 ((a) GDL mass flux, (b) channel mass flux), design-2 ((c) GDL mass flux, (d) channel mass flux), and design-3 ((e) GDL mass flux, (f) channel mass flux).
In summary, modifying the channel configuration by removing channel connections between the diagonal trunk channels and the triangle patterns (design-2, Figure 1h) increases the average and maximum GDL mass flux. However, the modifications reduce the uniformity and increase the pressure drop significantly (~2.0 to 2.4 times from the base design). This high pressure could cause an increase in parasitic power consumption. In contrast, modifying the base design (design-1) by altering the channel connections between the side channels of the triangle patterns and the outlet trunk, termed design-3 (Figure 1i), improves the uniformity in the GDL mass flux distribution with a significantly lower pressure drop. However, this modification reduces the average GDL mass flux. Design-1 provides a compromise with higher mass fluxes than design-3 (but lower than design-2) and lower pressure drops than design-2 (but higher than design-3).
4.5. Parallel Pin-Type Flow Field
Figure 14 shows the comparison of average and maximum GDL mass flux, along with the overall pressure drop, of the parallel pin-type flow field designs. As shown by Figure 14a, at the low and high inlet flow conditions, all the designs exhibit a nearly similar average GDL mass flux. As to the maximum GDL mass flux, design-1 and design-3 are nearly equal at both conditions. However, having a shorter, 180° bend shape between the top two horizontal, parallel channels and connecting all the ribs on the first horizontal channel (design-2) increases the localized mass flux (Figure 1k), but it does not significantly increase the average GDL mass flux. Due to the higher maximum mass flux, the difference between the average and maximum GDL mass flux in design-2 (difference at 400 SCCM: 0.0323 kg/m2·s, 900 SCCM: 0.0733 kg/m2·s) is significantly higher than design- 1 (difference at 400 SCCM: 0.0143 kg/m2·s, 900 SCCM: 0.0284 kg/m2·s) and design-3 (difference at 400 SCCM: 0.0123 kg/m2·s, 900 SCCM: 0.0284 kg/m2·s). This indicates that design-2 provides a less uniform GDL mass flux distribution compared to the other designs. Again, the non-uniformity in gas distribution, as quantified by the difference between the average and max flux, increases with an increase in inlet flow rate. Looking at the pressure drop chart in Figure 14b, design-2 has a slightly higher pressure drop than the other designs, which is due to introducing the 180° short bend between the top two parallel channels. This short-bend shape increases the resistance to flow through the channel, resulting in an increase in pressure drop. The other two designs have a similar pressure drop, indicating the channels have a similar resistance to flow.

Figure 14.
Comparison of average and maximum GDL mass flux, along with the overall pressure drop, among different parallel pin-type designs: (a) Mass flux, (b) pressure drop.
The mass flux distribution of the various designs of the parallel pin-type flow field are shown in Figure 15 for the low inlet flow condition. The mass flux distributions for the high inlet flow condition are given in the Supplemental Data (Figure S4). Figure 15a,c and e display the GDL mass flux contours of design-1, design-2, and design-3, respectively. All the designs, particularly design-1 and design-3, provide a fairly uniform gas distribution over the majority of the flow field areas; however, the mass flux is low. There are some small regions in these designs that have a high mass flux. Design-2 has the most regions with a high mass flux. However, having more regions of high mass flux (the red regions located at the top edge) does not improve the average mass flux significantly, because design-2 also has more regions of a zero (the dark blue regions adjacent to the red regions) and low mass flux (light blue regions over the rib area). These additional regions of high and low mass flux in design-2 are due to the 180° short bend connection between the two top parallel channels. The flow resistance through the channel is high before the 180° short bend and low after the bend. This results in a high and low mass flux through the GDL from the horizontal channels that are before and after the 180° short bend, respectively. Design-1 and design-3 have nearly similar high mass flux regions, located at the top-right and bottom-left corners. Design-3 provides a slightly better distribution than design-1 around the top and right side, which is due to connecting the horizontal channel with the vertical channel in the top-left and bottom-right edges (Figure 1l). Looking at the channel mass flux contour in Figure 15b for design-1, there is a diagonal stretch observed from top-left to bottom-right with low flow through the horizontal channels and more flow through the vertical channels. The incorporation of larger ribs, highlighted in Figure 1k (design-2) and Figure 1l (design-3), breaks up the flow through the vertical channels and forces localized flow through the horizontal channels. Although these larger ribs balance the flow between horizontal and vertical channels, they do not impact the improvement of GDL mass flux distribution, except for minor changes in low mass flux regions’ location.
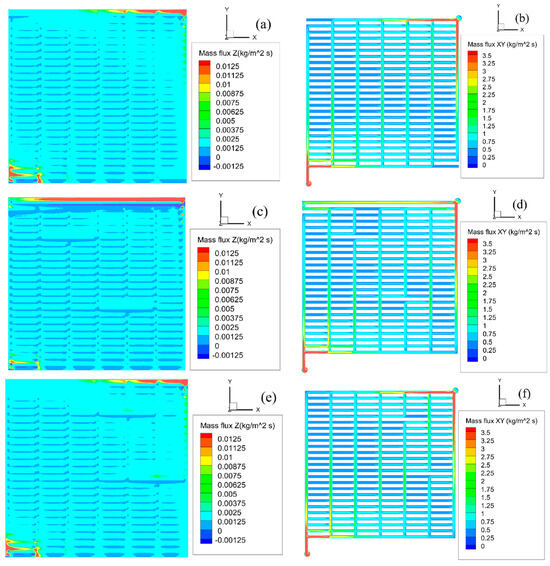
Figure 15.
Comparison between various parallel pin-type designs in terms of GDL (Z-direction) and channel (in XY-plane) mass flux at low inlet flow rate condition: Design-1 ((a) GDL mass flux, (b) channel mass flux), design-2 ((c) GDL mass flux, (d) channel mass flux), and design-3 ((e) GDL mass flux, (f) channel mass flux).
In summary, in comparison to design-1, incorporating a 180° short bend between the top two horizontal channels and connecting all the ribs on the first horizontal channel (design-2) increases the maximum mass flux significantly. However, it does not increase the average GDL mass flux significantly, because the zero-to-low mass flux regions also increase. Introducing larger ribs in the flow channels forces localized flow from the vertical to the horizontal channels; however, for the limited number of elongated ribs considered, these localized changes do not significantly affect the overall mass flux through the GDL. The connection between the horizontal and vertical channels at the top-left and bottom-right corners causes a minor improvement in the GDL mass flux distribution and alters the location of the low mass flux region for design-3.
4.6. Comparison between Various Flow Field Patterns
To better understand the positives and negatives of the various designs, sub-patterns from each of the various flow field designs are compared to each other and to the 4-channel serpentine. The designs selected for the comparison are the uniform hybrid design, 2-channel spiral design-2, dual-triangle sandwich design-1, and parallel pin-type design-3. For the hybrid designs, the uniform hybrid design has been selected because it offers a higher maximum GDL mass flux and higher average GDL mass flux than the non-uniform design, although it exhibits a slightly poorer distribution and a higher pressure drop than the non-uniform hybrid design. For the spiral design, design-2 is chosen because it yields a higher average mass flux and a lower pressure drop, and provides a better distribution than the other designs. Design-3 yields a similar average mass flux as design-2, with a ~1.3 times higher maximum mass flux, which could enhance localized reaction kinetics. However, it also provides a ~1.14 times higher pressure drop, with a slightly poorer gas distribution uniformity compared to design-2. For the dual-triangle sandwich design, design-1 (the base design) is considered, because it occupies a middle ground, which could provide a balanced need for an average and maximum mass flux, gas distribution uniformity, and moderate pressure drop. For the parallel pin-type design, design-3 is selected because it provides a similar average GDL mass flux to the other designs, with a slightly better uniformity in gas distribution and a lower pressure drop.
Figure 16 depicts the comparison of the average and maximum GDL mass flux, along with the overall pressure drop, for the selected designs. As shown in Figure 16a, at the low and high inlet flow conditions, parallel pin-type design-3 and dual-triangle design-3 provide the lowest average GDL mass flux, while the uniform hybrid and 2-channel spiral design-2 have the highest average GDL mass flux. For the maximum GDL mass flux, the 2-channel spiral design-2 yields the highest value, while parallel pin-type design-3 has the lowest value among all the designs. These high, average and maximum GDL mass flux values are, in general, related to the flow resistance. In general, designs with higher pressure drops have higher GDL mass flux values. However, it is not always the case. For example, 2-channel spiral design-2 has the higher pressure drop and the higher GDL mass flux. However, the uniform hybrid has a pressure drop similar to the 4-channel serpentine, but with a higher GDL mass flux. Thus, while a high flow resistance through the channel helps promote a high mass flux through the GDL, the overall pattern of the channel is also influential. The high average and maximum mass fluxes may have a positive impact by providing sufficient reactants during high load conditions. However, if the high average GDL mass flux is caused primarily by high resistance to flow in the channels and thus comes at the cost of higher pressure drops (Figure 16b), the high pressure drops may cause long-term MEA degradation [11,54]. Additionally, the flow fields exhibit a different sensitivity to the increase in inlet flow rate. For the uniform hybrid design, there is a larger increase in the average GDL mass flux when going from the low flow to high flow condition. In contrast, parallel pin-type design-3 has a much smaller increase in average GDL mass flux. A larger increase in average GDL mass flux with an increasing inlet flow rate is beneficial for flow fields that need to transition between low and high load conditions. In Figure 16b, 2-channel spiral design-2 has the highest pressure drop, while the dual-triangle sandwich design yields the lowest pressure drop. Both the uniform hybrid design and 4-channel serpentine design yield a similar pressure drop, which is the third lowest among the flow fields.
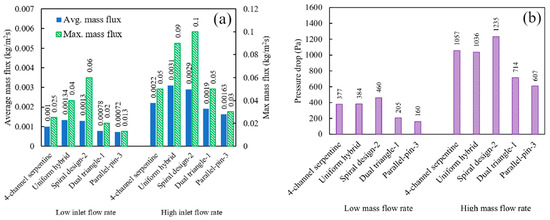
Figure 16.
Comparison of average and maximum GDL mass flux, along with the overall pressure drop, among different flow field designs: (a) Mass flux, (b) pressure drop.
The differences between the average and maximum GDL mass flux of the various flow fields in Figure 16a are given in Table 3. The difference for parallel pin-type design-3 and dual-triangle sandwich design-1 is lower than for the other designs, which indicates that these designs exhibit better mass flux uniformity. This fact is readily observed by comparing the mass flux contour plots of these designs (e.g., Supplementary Figure S5d,e). Between these two flow fields, the uniformity is slightly better for parallel pin-type design-3 than dual-triangle sandwich design-1. Although these flow fields offer a better gas distribution, the low average mass flux might cause mass transport losses at high load conditions. In contrast, the difference between the average and maximum mass flux is substantially higher in 2-channel spiral design-2 than the other designs, which indicates it has the highest non-uniformity in gas distribution. The uniform hybrid design has the second highest difference. The 4-channel spiral design is in the middle of the pack in terms of the difference between the average and maximum GDL mass flux, but it skews closer to the dual-triangle and parallel-pin designs than it does to the hybrid and 2-channel spiral designs.
Table 3.
Difference between the average and maximum GDL mass flux for the compared flow fields.
Comparing the designs, the 4-channel serpentine provides a moderate average and maximum mass flux and pressure drop. The uniform hybrid design offers a higher average and maximum mass flux, with a similar pressure drop to the 4-channel serpentine design. However, this higher flux comes at the cost of a more non-uniform distribution and a higher amount of zero mass flux regions than the 4-channel serpentine flow field. Thus, both designs may provide a similar performance for low and high load conditions because they exhibit off-setting trade-offs between the average GDL mass flux and amount of zero mass flux regions. The 2-channel spiral design-2 has the highest maximum GDL mass flux along with a high average GDL mass flux, which would be beneficial during operation at high load conditions. However, it increases the pressure drop and non-uniformity compared to the 4-channel serpentine. This high-pressure drop could have a detrimental effect on the MEA’s lifetime. In contrast, the dual-triangle sandwich design-1 and parallel-pin design-3 improve the uniformity of the mass flux through the GDL and reduce the pressure drop compared to the 4-channel serpentine design. However, this comes at a cost of a lower mass flux through the GDL. If used at conditions where high fluxes of reactants are not needed (e.g., low load conditions), this more even distribution might help with the long-term durability of the MEA by using the entire active area more evenly. Additionally, this low-pressure drop would reduce the parasitic power consumption when a large cell stack is considered. This study has quantified the fluid dynamic performance of the proposed flow fields, which provides a launching point to start the analysis of the electrochemical performance of the designs.
5. Conclusions
This study proposes various novel flow field designs (e.g., hybrid designs, dual-triangle sandwich designs) and the modification of conventional designs (e.g., 2-channel spiral designs, parallel-pin designs), and evaluates their computational fluid dynamic (CFD) performance in terms of average and maximum GDL mass flux, GDL mass flux distribution, and the pressure drop around the flow fields for a high-temperature PEM fuel cell. It compares the fluid dynamics to a 4-channel serpentine design. The study also introduces various channel modification routes and their impacts on mass transport through the GDL and pressure drop. The key findings are summarized as follows:
- Regardless of the overall design, the incorporation of a dead end in the flow channel configuration increases the average and maximum GDL mass flux, but it also increases the pressure drop.
- The channel configurations and their connections to the inlet–outlet significantly influence the gas distribution uniformity around the flow field. Merging the channels before connecting to the outlet causes an increase in flow resistance through the channels and thus increases the pressure drop, average GDL mass flux, and localized maximum mass flux. For instance, design-1 and design-3 for the 2-channel spiral flow field have an approximately 10% and 14% higher pressure drop than design-2, respectively, because the channels merge into a single channel before connecting to the outlet. Although the gas flow resistance through the channel fosters a high GDL mass flux, the impact of the channel pattern on the GDL mass flux is also significant.
- The dual-triangle sandwich design-1 and parallel pin-type design-3 exhibit a more even GDL mass flux distribution and low pressure drop, but yield a low average and low localized maximum mass flux through the GDL. This more even distribution with a low-pressure drop could help contribute to long-term MEA durability and thus be used in low load conditions, where a high mass flux of reactants is not needed. However, the low average mass flux may not allow these designs to be used at high load conditions, because these designs have the possibility to create fuel starvation.
- The 4-channel serpentine and hybrid designs strike a middle-of-the-road approach between a higher GDL mass flux and the amount of zero mass flux regions. This implies that both designs might potentially perform similarly well under both low and high load conditions.
- The 2-channel spiral design-2 offers the highest average GDL mass flux and localized GDL mass flux. For instance, it provides a ~32% higher average GDL mass flux than the 4-channel serpentine at high load conditions. This design could be beneficial for high load conditions, as it would supply enough reactants for stable operation. However, it yields a high pressure drop (~17% higher than the 4-channel serpentine), which may cause MEA degradation.
Supplementary Materials
The following supporting information can be downloaded at: https://www.mdpi.com/article/10.3390/en17194898/s1, Figure S1: Comparison of the GDL (Z-direction) and channel (in the XY-plane) mass flux between the uniform and non-uniform hybrid designs at the high inlet flow rate condition: Uniform hybrid ((a) GDL mass flux, (b) channel mass flux) and non-uniform hybrid ((c) GDL mass flux, (d) channel mass flux); Figure S2: GDL (Z-direction) and channel (in XY-plane) mass flux contours for different 2-channel spiral designs at high inlet flow rate: Design-1 ((a) GDL mass flux, (b) channel mass flux), design-2 ((c) GDL mass flux, (d) channel mass flux), and design-3 ((e) GDL mass flux, (f) channel mass flux); Figure S3: Comparison between various dual-triangle sandwich designs in terms of the GDL (Z-direction) and channel (in XY-plane) mass flux at high inlet flow rate condition: Design-1 ((a) GDL mass flux, (b) channel mass flux), design-2 ((c) GDL mass flux, (d) channel mass flux), and design-3 ((e) GDL mass flux, (f) channel mass flux); Figure S4: Comparison between various parallel pin-type designs in terms of GDL (Z-direction) and channel (in XY-plane) mass flux at high inlet flow rate condition: Design-1 ((a) GDL mass flux, (b) channel mass flux), design-2 ((c) GDL mass flux, (d) channel mass flux), and design-3 ((e) GDL mass flux, (f) channel mass flux); Figure S5: Comparison of the GDL (Z-direction) mass flux contours among best performing designs of each flow field pattern at low flow rate condition: (a) 4-channel serpentine design, (b) uniform hybrid design, (c) 2-channel spiral design-2, (d) dual-triangle sandwich design-1, and (e) parallel pin-type design-3.
Author Contributions
Conceptualization, A.C.G.; methodology, P.R.C.; model development, P.R.C.; investigation and data interpretation, A.C.G. and P.R.C.; resources, A.C.G.; data curation, P.R.C.; writing—original draft, P.R.C.; writing—review and editing., A.C.G.; supervision, A.C.G.; project administration, A.C.G.; funding acquisition, A.C.G. All authors have read and agreed to the published version of the manuscript.
Funding
This research was funded by the Office of the Secretary of Defense—US Army Ground Vehicle Systems Center (grant number: HQ0034-20-2-0007).
Data Availability Statement
The original contributions presented in the study are included in the article/Supplementary Materials, further inquiries can be directed to the corresponding author.
Acknowledgments
The authors are thankful to the US Army Ground Vehicle Systems Center for supporting this research. DISTRIBUTION STATEMENT A. Approved for Public Release; Distribution is Unlimited. OPSEC #8968.
Conflicts of Interest
The authors declare no conflicts of interest.
Nomenclature
| Abbreviations | |
| CFD | Computational fluid dynamics |
| GDL | Gas diffusion layer |
| FFP | Flow field pattern |
| HT | High temperature |
| MEA | Membrane electrode assembly |
| PEM | Proton exchange membrane |
| SCCM | Standard cubic centimeters per minute |
| Symbols | |
| Density (kg/m3) | |
| Dynamic viscosity (Pa·s) | |
| Intrinsic permeability (m2) | |
| Quadratic loss coefficient (m−1) | |
| L | Thickness of porous medium (m) |
| Mass flux (kg/m2·s) | |
| Momentum loss (kg/m2·s2) | |
| U | Total velocity (m/s) |
| Velocity in X-direction (m/s) | |
| Velocity in Y-direction (m/s) | |
| Velocity at channel mid-plane (m/s) | |
| Flow velocity through the GDL (m/s) | |
| Velocity in Z-direction (m/s) |
References
- Judkins, R.R.; Fulkerson, W.; Sanghvi, M.K. The Dilemma of Fossil Fuel Use and Global Climate Change. Energy Fuels 1993, 7, 14–22. [Google Scholar] [CrossRef]
- Mei, J.; Meng, X.; Tang, X.; Li, H.; Hasanien, H.; Alharbi, M.; Dong, Z.; Shen, J.; Sun, C.; Fan, F.; et al. An Accurate Parameter Estimation Method of the Voltage Model for Proton Exchange Membrane Fuel Cells. Energies 2024, 17, 2917. [Google Scholar] [CrossRef]
- Velisala, V.; Naga Srinivasulu, G. Computational Fluid Dynamics Study of 3-Pass Serpentine Flow Field Configuration on Proton Exchange Membrane Fuel Cell Performance. Int. J. Ambient Energy 2020, 41, 183–188. [Google Scholar] [CrossRef]
- Liu, H.; Li, P.; Juarez-Robles, D.; Wang, K.; Hernandez-Guerrero, A. Experimental Study and Comparison of Various Designs of Gas Flow Fields to PEM Fuel Cells and Cell Stack Performance. Front. Energy Res. 2014, 2, 2. [Google Scholar] [CrossRef]
- Boettner, D.D.; Paganelli, G.; Guezennec, Y.G.; Rizzoni, G.; Moran, M.J. Proton Exchange Membrane Fuel Cell System Model for Automotive Vehicle Simulation and Control. J. Energy Resour. Technol. Trans. ASME 2002, 124, 20–27. [Google Scholar] [CrossRef]
- Li, X. Principles of Fuel Cells; Taylor & Francis Inc.: Philadelphia, PA, USA, 2005; ISBN 1-59169-022-6. [Google Scholar]
- Kothari, R.; Buddhi, D.; Sawhney, R.L. Sources and Technology for Hydrogen Production: A Review. Int. J. Glob. Energy Issues 2004, 21, 154–178. [Google Scholar] [CrossRef]
- Rosli, R.E.; Sulong, A.B.; Daud, W.R.W.; Zulkifley, M.A.; Husaini, T.; Rosli, M.I.; Majlan, E.H.; Haque, M.A. A Review of High-Temperature Proton Exchange Membrane Fuel Cell (HT-PEMFC) System. Int. J. Hydrogen Energy 2017, 42, 9293–9314. [Google Scholar] [CrossRef]
- O’Hayre, R.; Cha, S.-W.; Colella, W.; Prinz, F.B. Fuel Cell Fundamentals, 3rd ed.; John Wiley & Sons: Hoboken, NJ, USA, 2016; ISBN 9781119113805. [Google Scholar]
- Tang, X.; Yang, M.; Shi, L.; Hou, Z.; Xu, S.; Sun, C. Adaptive State-of-Health Temperature Sensitivity Characteristics for Durability Improvement of PEM Fuel Cells. Chem. Eng. J. 2024, 491, 151951. [Google Scholar] [CrossRef]
- Sauermoser, M.; Kizilova, N.; Pollet, B.G.; Kjelstrup, S. Flow Field Patterns for Proton Exchange Membrane Fuel Cells. Front. Energy Res. 2020, 8, 13. [Google Scholar] [CrossRef]
- Wilberforce, T.; Khatib, F.N.; Ijaodola, O.S.; Ogungbemi, E.; El-Hassan, Z.; Durrant, A.; Thompson, J.; Olabi, A.G. Numerical Modelling and CFD Simulation of a Polymer Electrolyte Membrane (PEM) Fuel Cell Flow Channel Using an Open Pore Cellular Foam Material. Sci. Total Environ. 2019, 678, 728–740. [Google Scholar] [CrossRef]
- Wilberforce, T.; El-Hassan, Z.; Khatib, F.N.; Al Makky, A.; Mooney, J.; Barouaji, A.; Carton, J.G.; Olabi, A.G. Development of Bi-Polar Plate Design of PEM Fuel Cell Using CFD Techniques. Int. J. Hydrogen Energy 2017, 42, 25663–25685. [Google Scholar] [CrossRef]
- Wilberforce, T.; Ijaodola, O.; Emmanuel, O.; Thompson, J.; Olabi, A.G.; Abdelkareem, M.A.; Sayed, E.T.; Elsaid, K.; Maghrabie, H.M. Optimization of Fuel Cell Performance Using Computational Fluid Dynamics. Membranes 2021, 11, 146. [Google Scholar] [CrossRef] [PubMed]
- Roshandel, R.; Arbabi, F.; Moghaddam, G.K. Simulation of an Innovative Flow-Field Design Based on a Bio Inspired Pattern for PEM Fuel Cells. Renew. Energy 2012, 41, 86–95. [Google Scholar] [CrossRef]
- Zhang, L.; Shi, Z. Optimization of Serpentine Flow Field in Proton-Exchange Membrane Fuel Cell under the Effects of External Factors. Alex. Eng. J. 2021, 60, 421–433. [Google Scholar] [CrossRef]
- Lim, B.H.; Majlan, E.H.; Daud, W.R.W.; Rosli, M.I.; Husaini, T. Numerical Investigation of the Effect of Three-Dimensional Modified Parallel Flow Field Designs on Proton Exchange Membrane Fuel Cell Performance. Chem. Eng. Sci. 2020, 217, 115499. [Google Scholar] [CrossRef]
- Atyabi, S.A.; Afshari, E.; Zohravi, E.; Udemu, C.M. Three-Dimensional Simulation of Different Flow Fields of Proton Exchange Membrane Fuel Cell Using a Multi-Phase Coupled Model With Cooling Channel. Energy 2021, 234, 121247. [Google Scholar] [CrossRef]
- Zehtabiyan-Rezaie, N.; Arefian, A.; Kermani, M.J.; Noughabi, A.K.; Abdollahzadeh, M. Effect of Flow Field with Converging and Diverging Channels on Proton Exchange Membrane Fuel Cell Performance. Energy Convers. Manag. 2017, 152, 31–44. [Google Scholar] [CrossRef]
- Atyabi, S.A.; Afshari, E. Three-Dimensional Multiphase Model of Proton Exchange Membrane Fuel Cell with Honeycomb Flow Field at the Cathode Side. J. Clean. Prod. 2019, 214, 738–748. [Google Scholar] [CrossRef]
- Zhang, X.; Ma, X.; Yang, J.; Zhu, X.; Tai, S.; Shuai, S. Effect of Liquid Water in Flow Channel on Proton Exchange Membrane Fuel Cell: Focusing on Flow Pattern. Energy Convers. Manag. 2022, 258, 115528. [Google Scholar] [CrossRef]
- Iranzo, A.; Cabello González, G.M.; Toharias, B.; Boillat, P.; Rosa, F. Water Liquid Distribution in a Bioinspired PEM Fuel Cell. Int. J. Hydrogen Energy 2024, 50, 221–233. [Google Scholar] [CrossRef]
- Hakenjos, A.; Muenter, H.; Wittstadt, U.; Hebling, C. A PEM Fuel Cell for Combined Measurement of Current and Temperature Distribution, and Flow Field Flooding. J. Power Sources 2004, 131, 213–216. [Google Scholar] [CrossRef]
- Babay, M.A.; Adar, M.; Chebak, A.; Mabrouki, M. Comparative Sustainability Analysis of Serpentine Flow-Field and Straight Channel PEM Fuel Cell Designs. Int. J. Syst. Assur. Eng. Manag. 2024, 15, 3954–3970. [Google Scholar] [CrossRef]
- Mojica, F.; Rahman, M.A.; Mora, J.M.; Ocon, J.D.; Chuang, P.Y.A. Experimental Study of Three Channel Designs with Model Comparison in a PEM Fuel Cell. Fuel Cells 2020, 20, 547–557. [Google Scholar] [CrossRef]
- Li, S.; Yuan, J.; Xie, G.; Sunden, B. Numerical Investigation of Transport Phenomena in High Temperature Proton Exchange Membrane Fuel Cells with Different Flow Field Designs. Numer. Heat Transf. Part A Appl. 2017, 72, 807–820. [Google Scholar] [CrossRef]
- Rahgoshay, S.M.; Ranjbar, A.A.; Ramiar, A.; Alizadeh, E. Thermal Investigation of a PEM Fuel Cell with Cooling Flow Field. Energy 2017, 134, 61–73. [Google Scholar] [CrossRef]
- Yan, H.; Zhang, W.; Qu, Z.; Chen, N. Flow Field Plate of Polymer Electrolyte Membrane Fuel Cells: A Review. J. Renew. Sustain. Energy 2023, 15, 012701. [Google Scholar] [CrossRef]
- Bunyan, S.T.; Dhahad, H.A.; Khudhur, D.S.; Yusaf, T. The Effect of Flow Field Design Parameters on the Performance of PEMFC: A Review. Sustainability 2023, 15, 10389. [Google Scholar] [CrossRef]
- Wang, X.D.; Duan, Y.Y.; Yan, W.M. Novel Serpentine-Baffle Flow Field Design for Proton Exchange Membrane Fuel Cells. J. Power Sources 2007, 173, 210–221. [Google Scholar] [CrossRef]
- Martins Belchor, P.; Camargo Forte, M.M.; Ortiz Suman Carpenter, D.E. Parallel Serpentine-Baffle Flow Field Design for Water Management in a Proton Exchange Membrane Fuel Cell. Int. J. Hydrogen Energy 2012, 37, 11904–11911. [Google Scholar] [CrossRef]
- Taccani, R.; Zuliani, N. Effect of Flow Field Design on Performances of High Temperature PEM Fuel Cells: Experimental Analysis. Int. J. Hydrogen Energy 2011, 36, 10282–10287. [Google Scholar] [CrossRef]
- Wang, Y.; Liao, X.; Liu, G.; Xu, H.; Guan, C.; Wang, H.; Li, H.; He, W.; Qin, Y. Review of Flow Field Designs for Polymer Electrolyte Membrane Fuel Cells. Energies 2023, 16, 4207. [Google Scholar] [CrossRef]
- Ozdemira, S.N.; Taymaz, I. Numerical Investigation of the Effect of Blocked Gas Flow Field on PEM Fuel Cell Performance. Int. J. Environ. Sci. Technol. 2021, 18, 3581–3596. [Google Scholar] [CrossRef]
- Asadzade, M.; Shamloo, A. Design and Simulation of a Novel Bipolar Plate Based on Lung-Shaped Bio-Inspired Flow Pattern for PEM Fuel Cell. Int. J. Energy Res. 2017, 41, 1730–1739. [Google Scholar] [CrossRef]
- Falcucci, G.; Jannelli, E.; Minutillo, M.; Ubertini, S. Fluid Dynamic Investigation of Channel Design in High Temperature PEM Fuel Cells. J. Fuel Cell Sci. Technol. 2012, 9, 021014. [Google Scholar] [CrossRef]
- Lan, H.; Xing, L.; Song, X.; Yang, L. A Novel Flow Field Design Method for HT-PEM Fuel Cells: A Hybrid Topology and Surrogate Model. Int. J. Hydrogen Energy 2023, 48, 32955–32967. [Google Scholar] [CrossRef]
- Wu, H.W.; Ho, T.Y.; Han, Y.J. Parametric Optimization of Wall-Mounted Cuboid Rows Installed in Interdigitated Flow Channel of HT-PEM Fuel Cells. Energy 2021, 216, 119261. [Google Scholar] [CrossRef]
- Agarwal, H.; Thosar, A.U.; Bhat, S.D.; Lele, A.K. Interdigitated Flow Field Impact on Mass Transport and Electrochemical Reaction in High-Temperature Polymer Electrolyte Fuel Cell. J. Power Sources 2022, 532, 231319. [Google Scholar] [CrossRef]
- Xia, L.; Xu, Q.; He, Q.; Ni, M.; Seng, M. Numerical Study of High Temperature Proton Exchange Membrane Fuel Cell (HT-PEMFC) with a Focus on Rib Design. Int. J. Hydrogen Energy 2021, 46, 21098–21111. [Google Scholar] [CrossRef]
- Perng, S.W.; Wu, H.-W.; Chen, Y.-B.; Zeng, Y.K. Performance Enhancement of a High Temperature Proton Exchange Membrane Fuel Cell by Bottomed-Baffles in Bipolar-Plate Channels. Appl. Energy 2019, 255, 113815. [Google Scholar] [CrossRef]
- Suo, M.; Sun, K.; Chen, R.; Che, Z.; Zeng, Z.; Li, Q.; Tao, X.; Wang, T. Oxygen Transport in Proton Exchange Membrane Fuel Cells with Metal Foam Flow Fields. J. Power Sources 2022, 521, 230937. [Google Scholar] [CrossRef]
- Chowdhury, P.R.; Gladen, A.C. Comparative and Sensitivity Analysis of Operating Conditions on the Performance of a High Temperature PEM Fuel Cell. Int. J. Hydrogen Energy 2024, 50, 1239–1256. [Google Scholar] [CrossRef]
- Anderson, J.D. Computational Fluid Dynamics: The Basics with Applications, 1st ed.; McGraw-Hill: New York, NY, USA, 1995. [Google Scholar]
- Hashemi, F.; Rowshanzamir, S.; Rezakazemi, M. CFD Simulation of PEM Fuel Cell Performance: Effect of Straight and Serpentine Flow Fields. Math. Comput. Model. 2012, 55, 1540–1557. [Google Scholar] [CrossRef]
- Saka, K.; Orhan, M.F.; Hamada, A.T. Design and Analysis of Gas Diffusion Layers in a Proton Exchange Membrane Fuel Cell. Coatings 2023, 13, 2. [Google Scholar] [CrossRef]
- Wang, Z.; Fu, X.; Shao, Y.; Zhang, X.; Hu, Z.; Xu, L.; Li, J.; Ouyang, M. Experimental Study on Voltage Instability of Proton Exchange Membrane Fuel Cell: Types and Boundaries. Int. J. Green Energy 2024, 21, 2368–2377. [Google Scholar] [CrossRef]
- Su, H.; Ye, D.; Cai, Y.; Guo, W. Air Starvation of Proton Exchange Membrane Fuel Cells and Its Beneficial Effects on Performance. Appl. Energy 2022, 323, 119626. [Google Scholar] [CrossRef]
- Alegre, C.; Lozano, A.; Manso, Á.P.; Álvarez-Manuel, L.; Marzo, F.F.; Barreras, F. Single Cell Induced Starvation in a High Temperature Proton Exchange Membrane Fuel Cell Stack. Appl. Energy 2019, 250, 1176–1189. [Google Scholar] [CrossRef]
- Du, F.; Hirschfeld, J.A.; Huang, X.; Jozwiak, K.; Dao, T.A.; Bauer, A.; Schmidt, T.J.; Orfanidi, A. Simulative Investigation on Local Hydrogen Starvation in PEMFCs: Influence of Water Transport and Humidity Conditions. J. Electrochem. Soc. 2021, 168, 074504. [Google Scholar] [CrossRef]
- Jia, F.; Tian, X.; Liu, F.; Ye, J.; Yang, C. Oxidant Starvation under Various Operating Conditions on Local and Transient Performance of Proton Exchange Membrane Fuel Cells. Appl. Energy 2023, 331, 120412. [Google Scholar] [CrossRef]
- Bruus, H. Theoretical Microfluidics; Oxford University Press: Oxford, UK, 2008; ISBN 978-0-19-923508-7. [Google Scholar]
- Shimpalee, S.; Van Zee, J.W. Numerical Studies on Rib & Channel Dimension of Flow-Field on PEMFC Performance. Int. J. Hydrogen Energy 2007, 32, 842–856. [Google Scholar] [CrossRef]
- Wang, J. Theory and Practice of Flow Field Designs for Fuel Cell Scaling-up: A Critical Review. Appl. Energy 2015, 157, 640–663. [Google Scholar] [CrossRef]
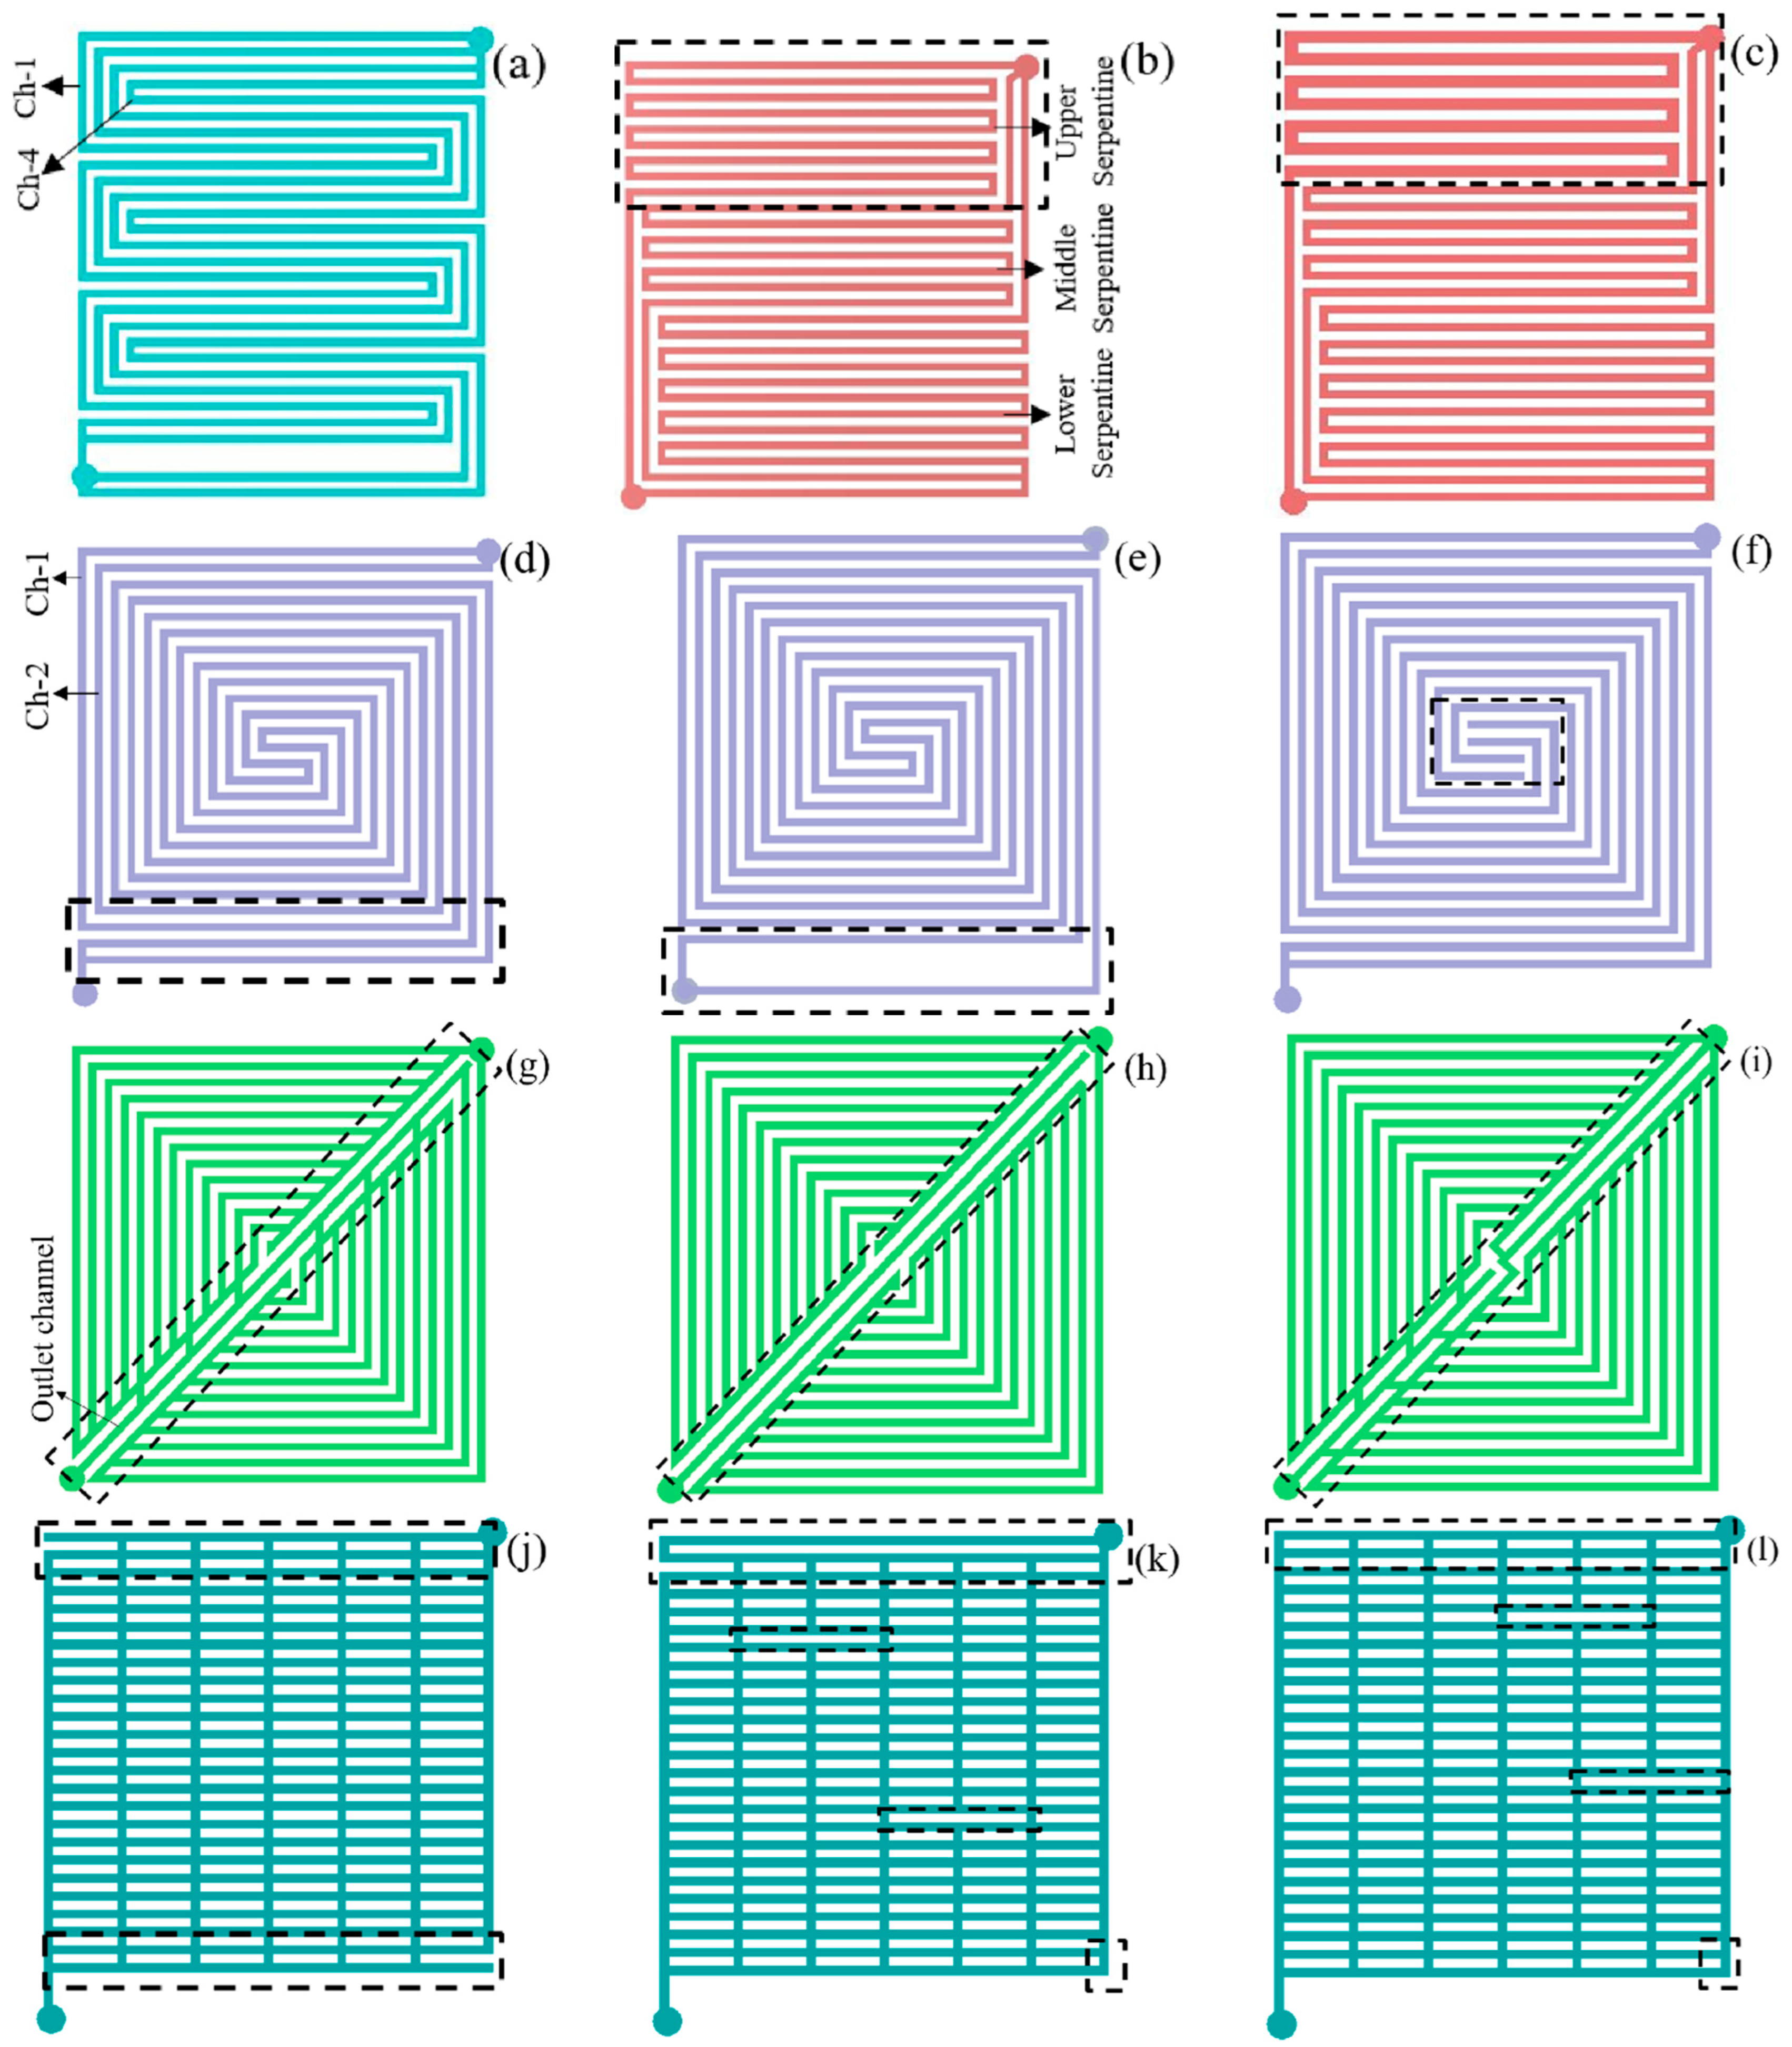
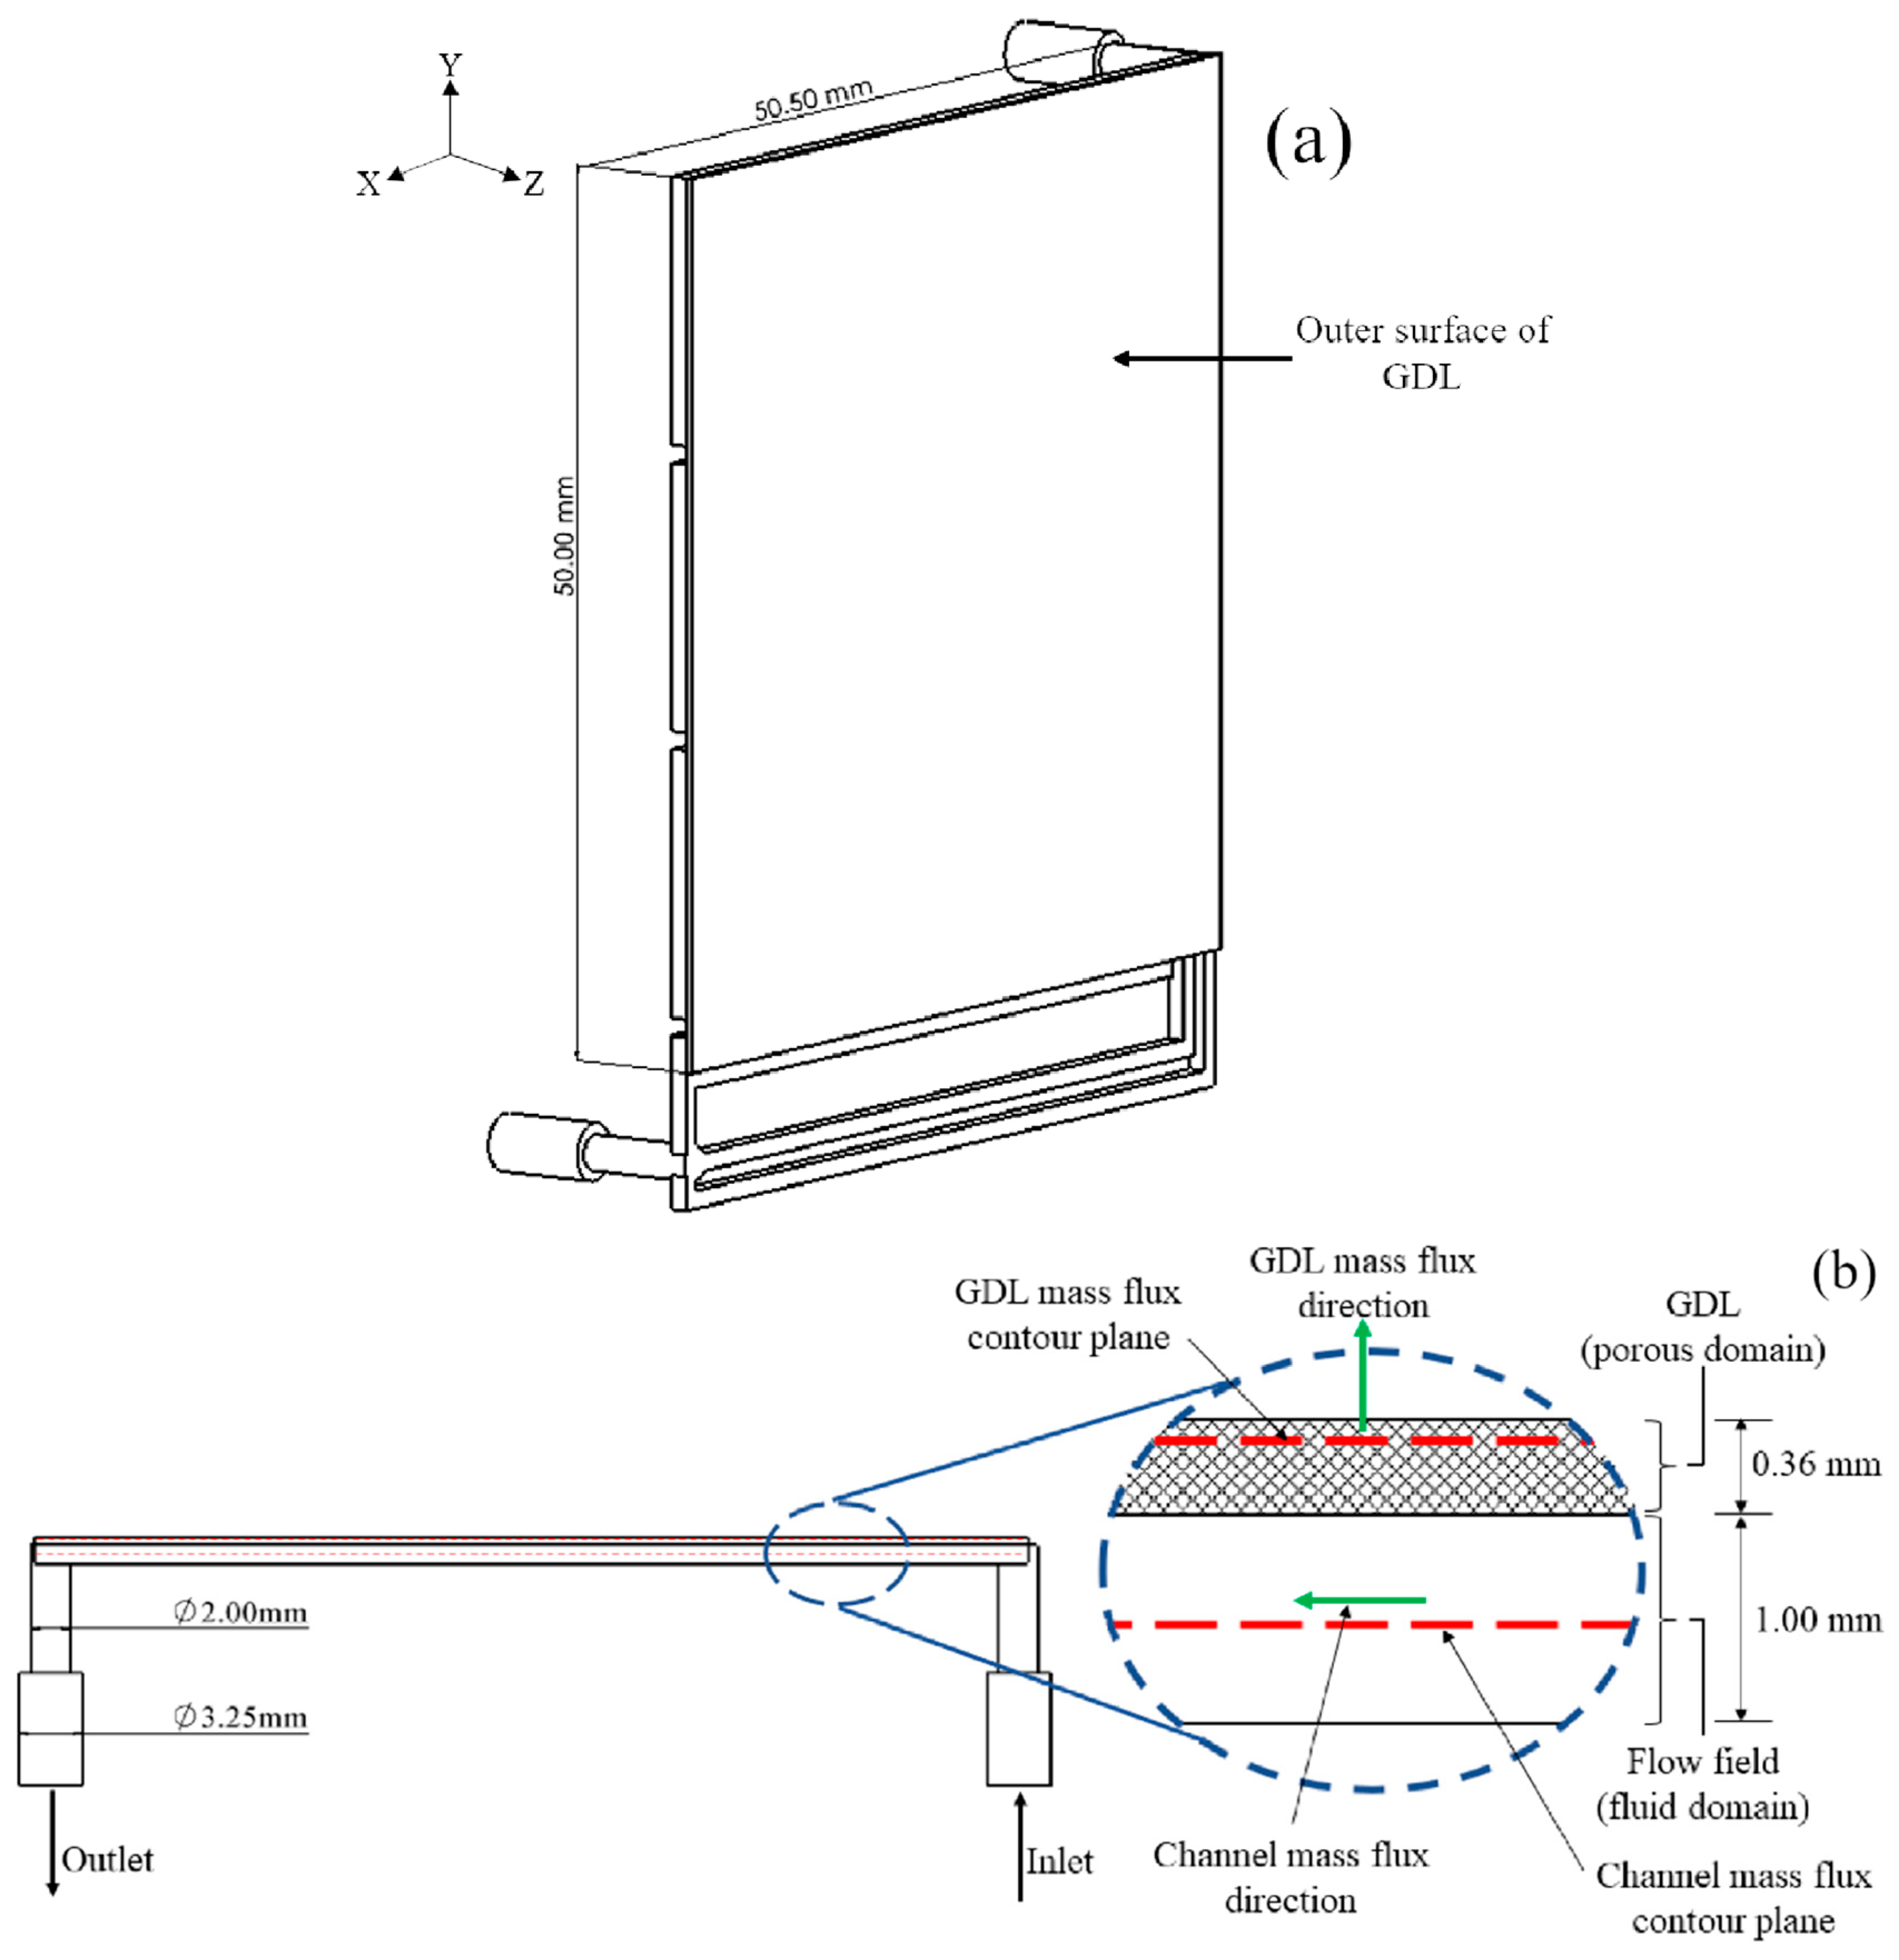

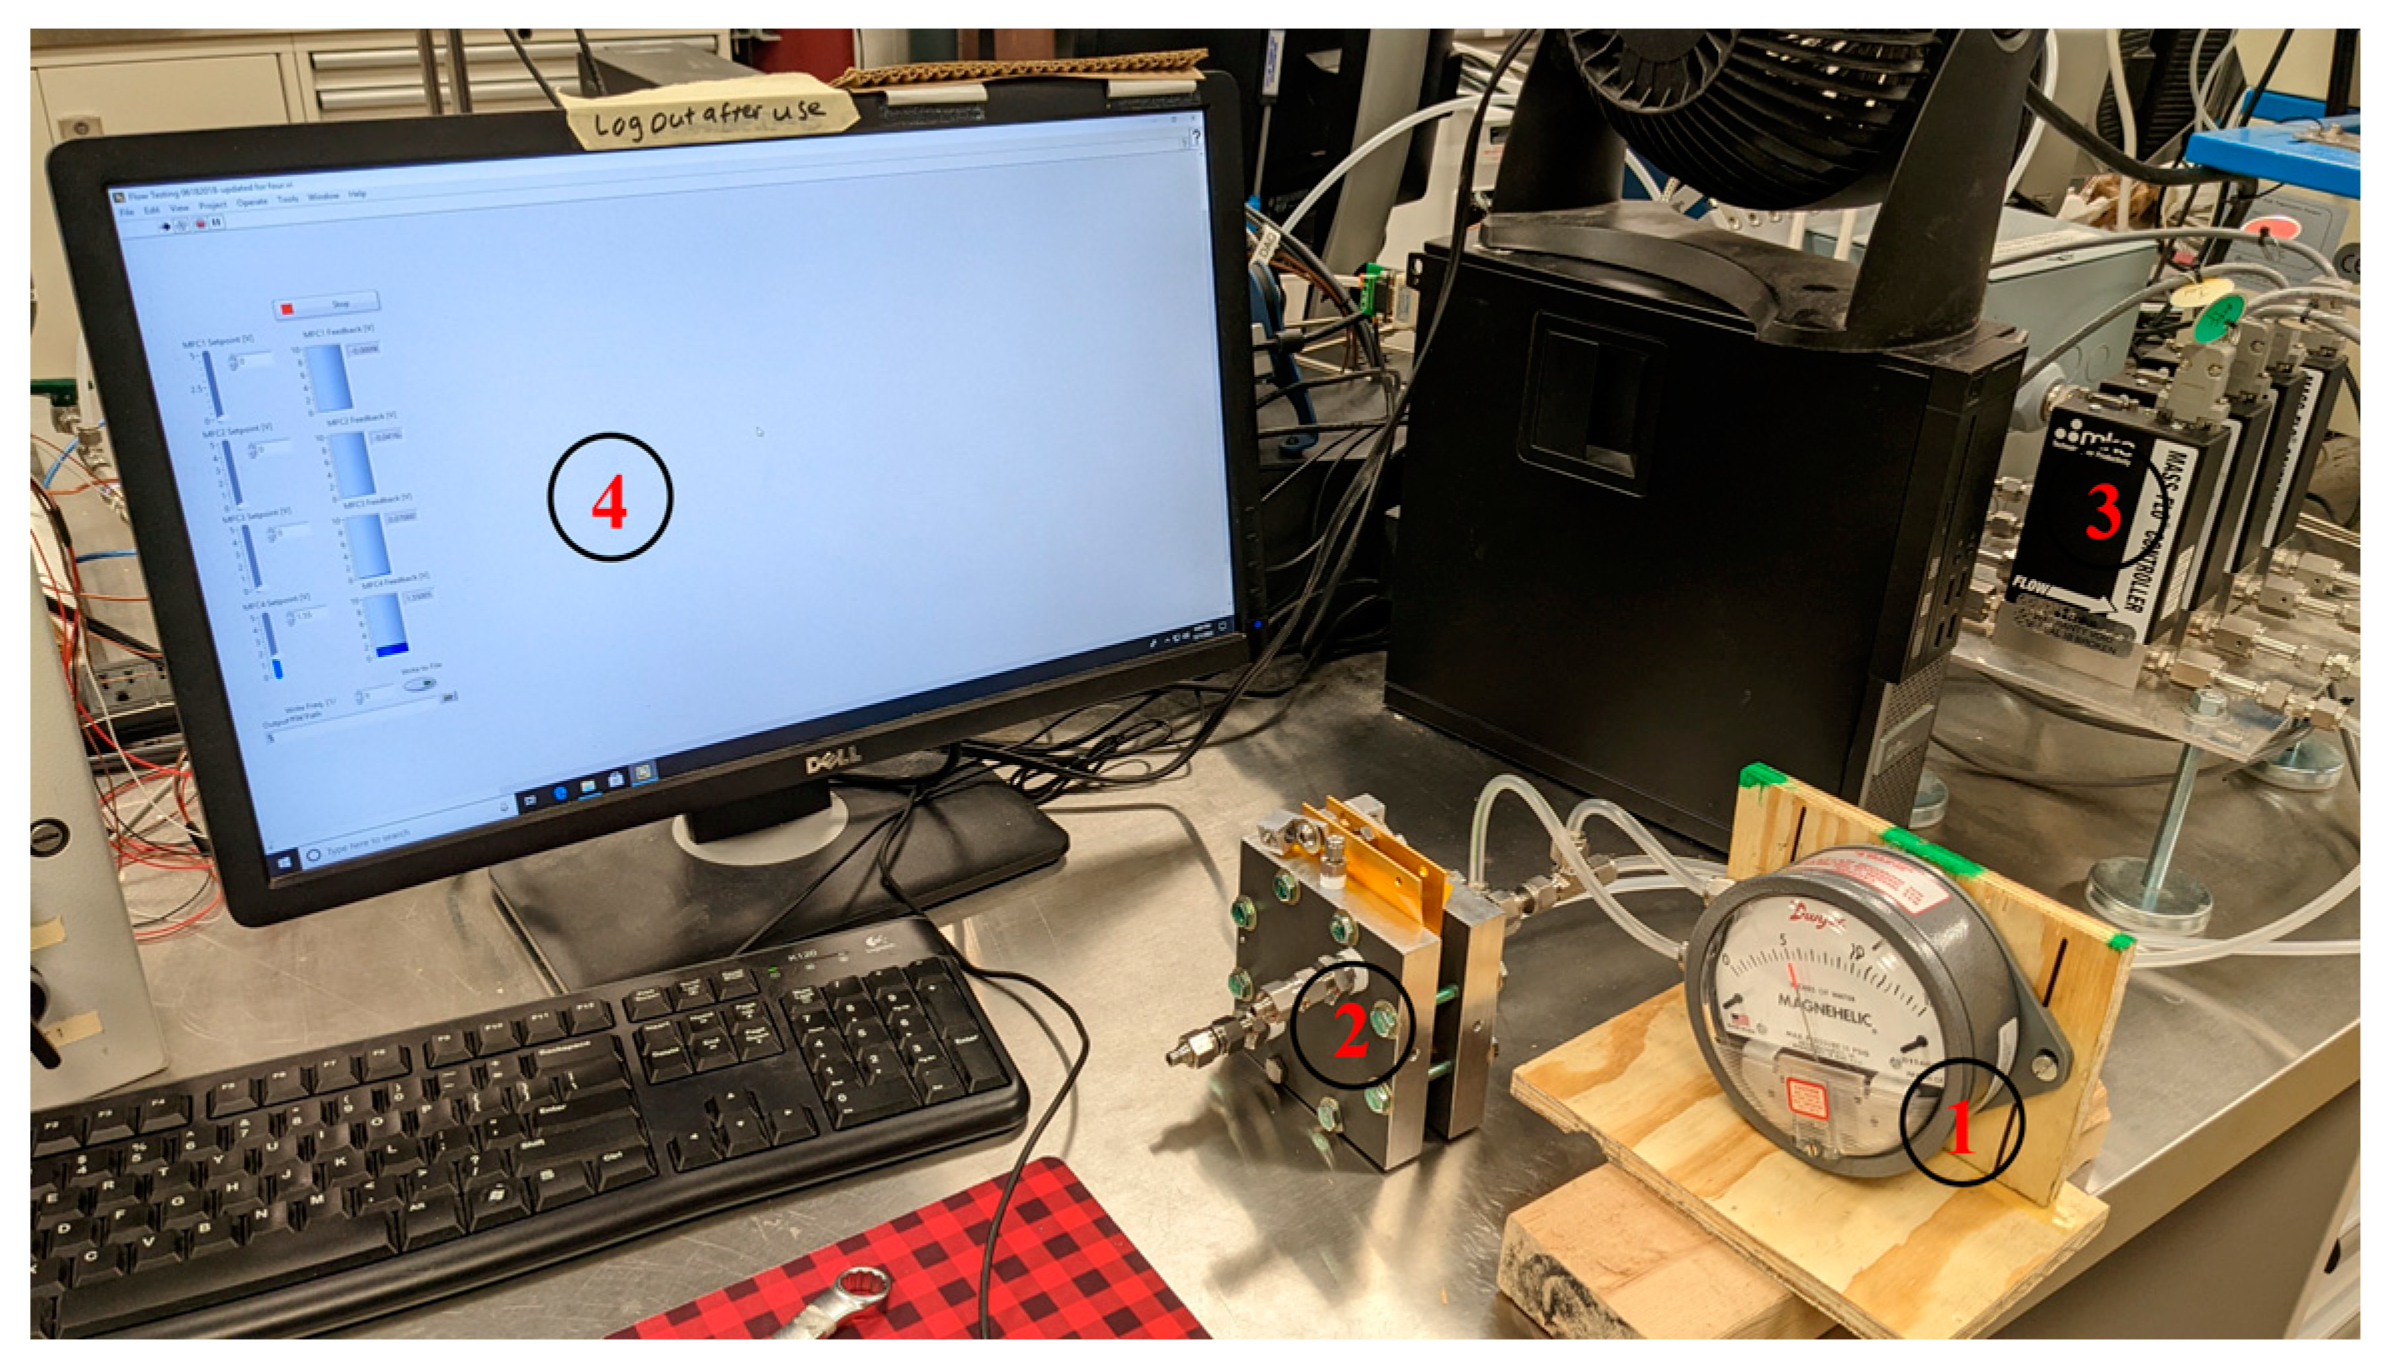
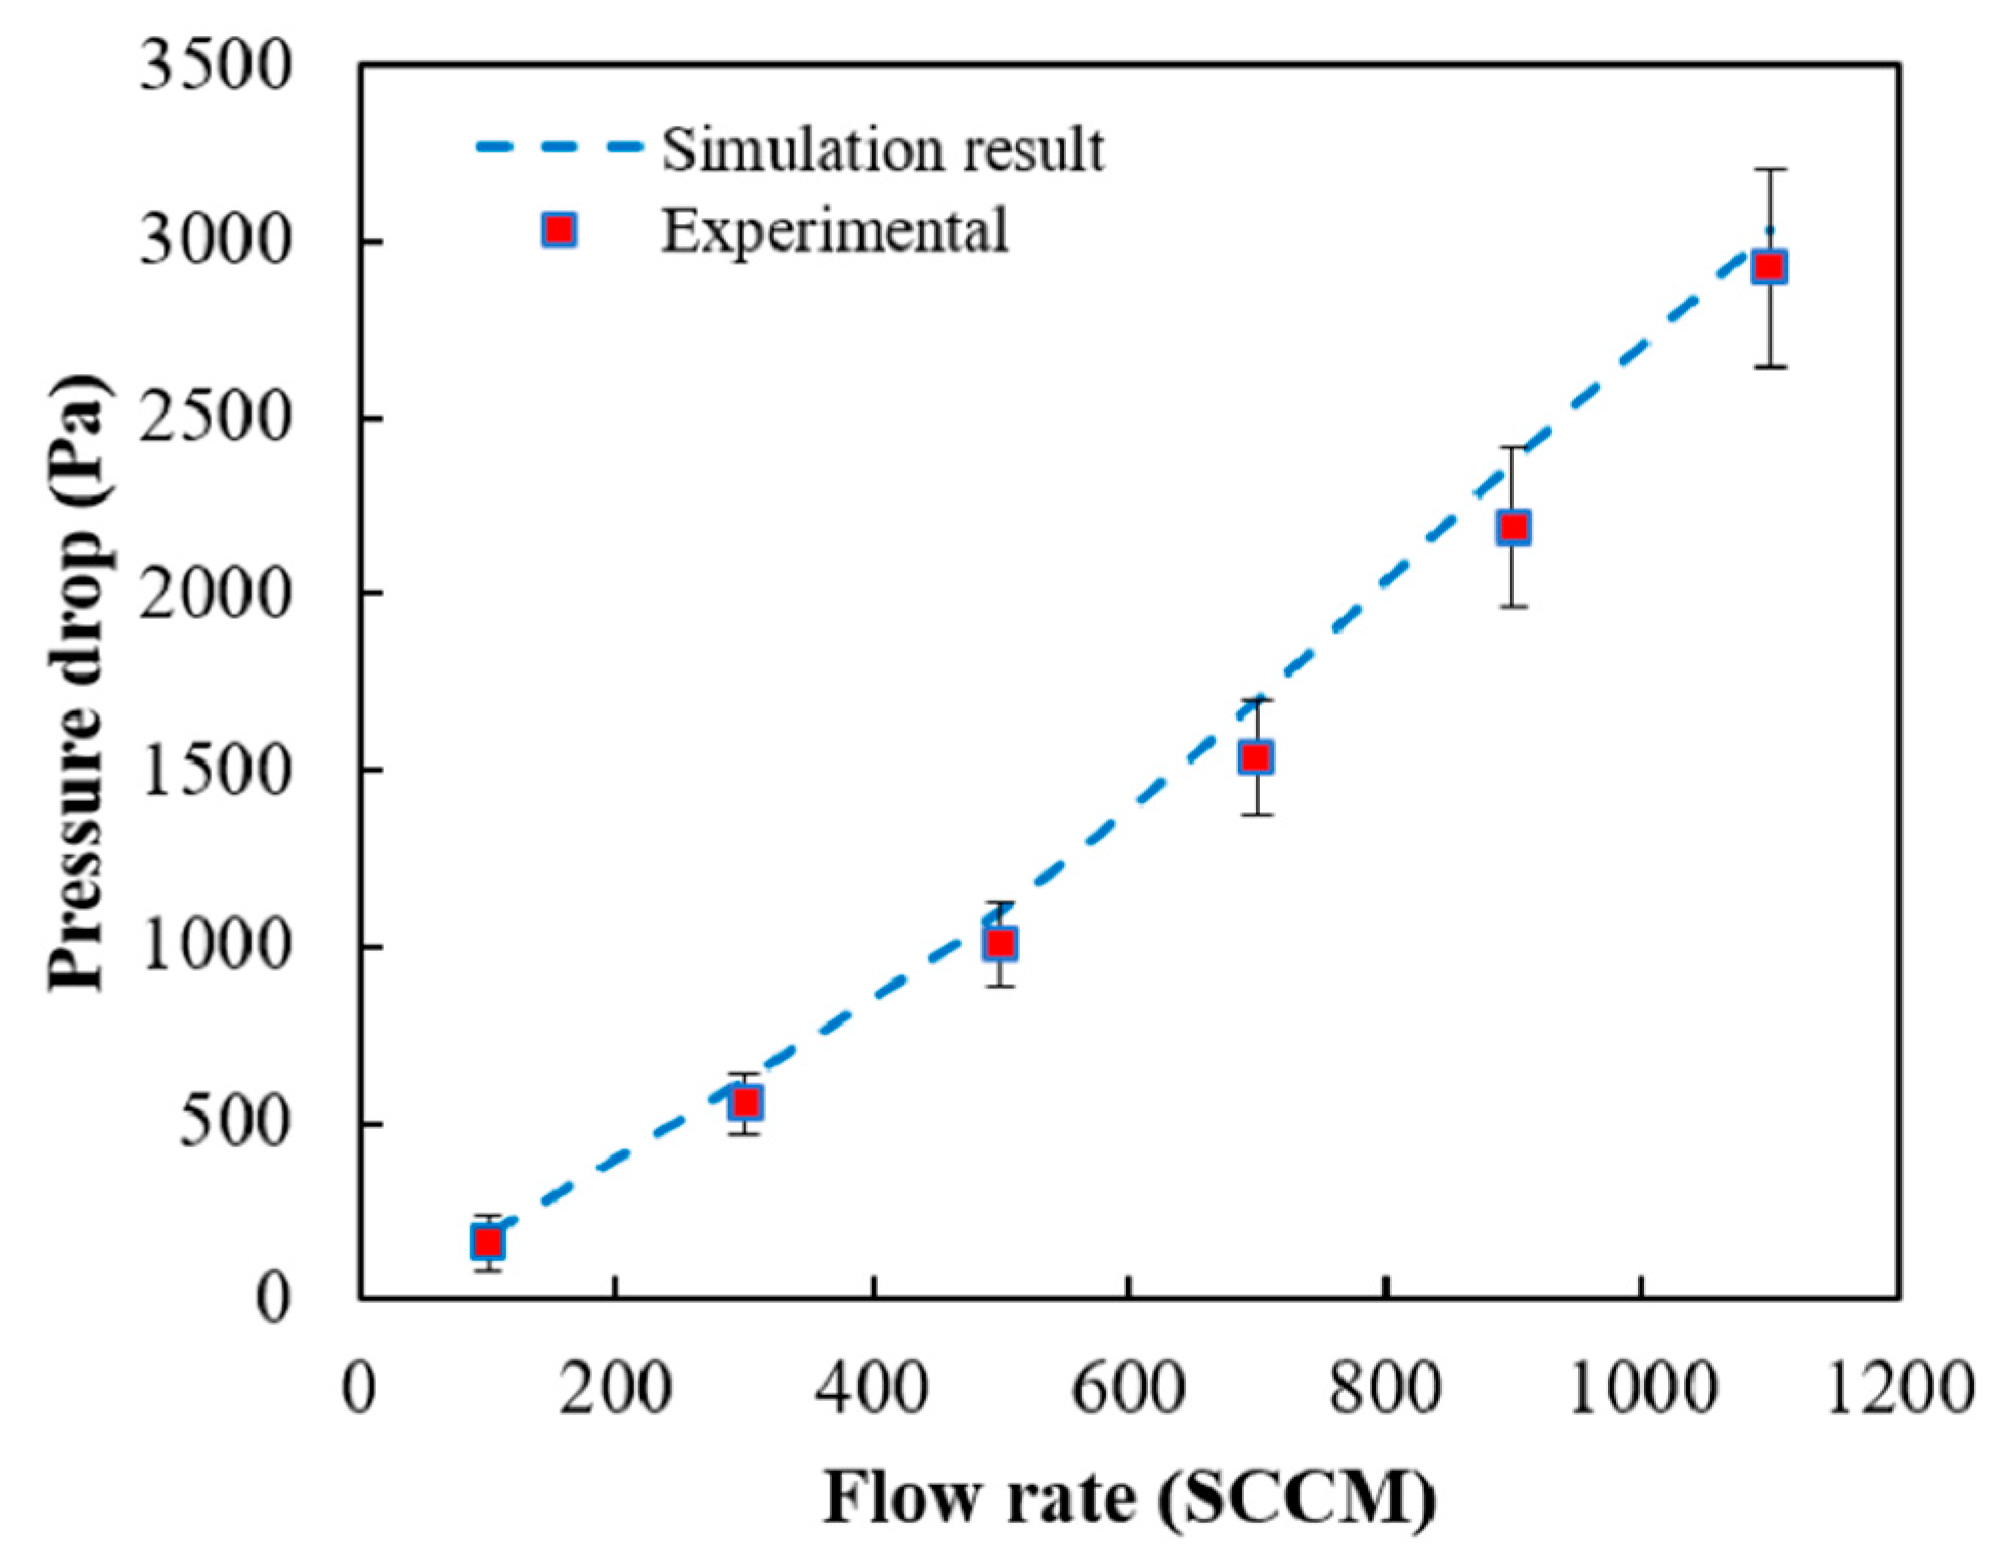
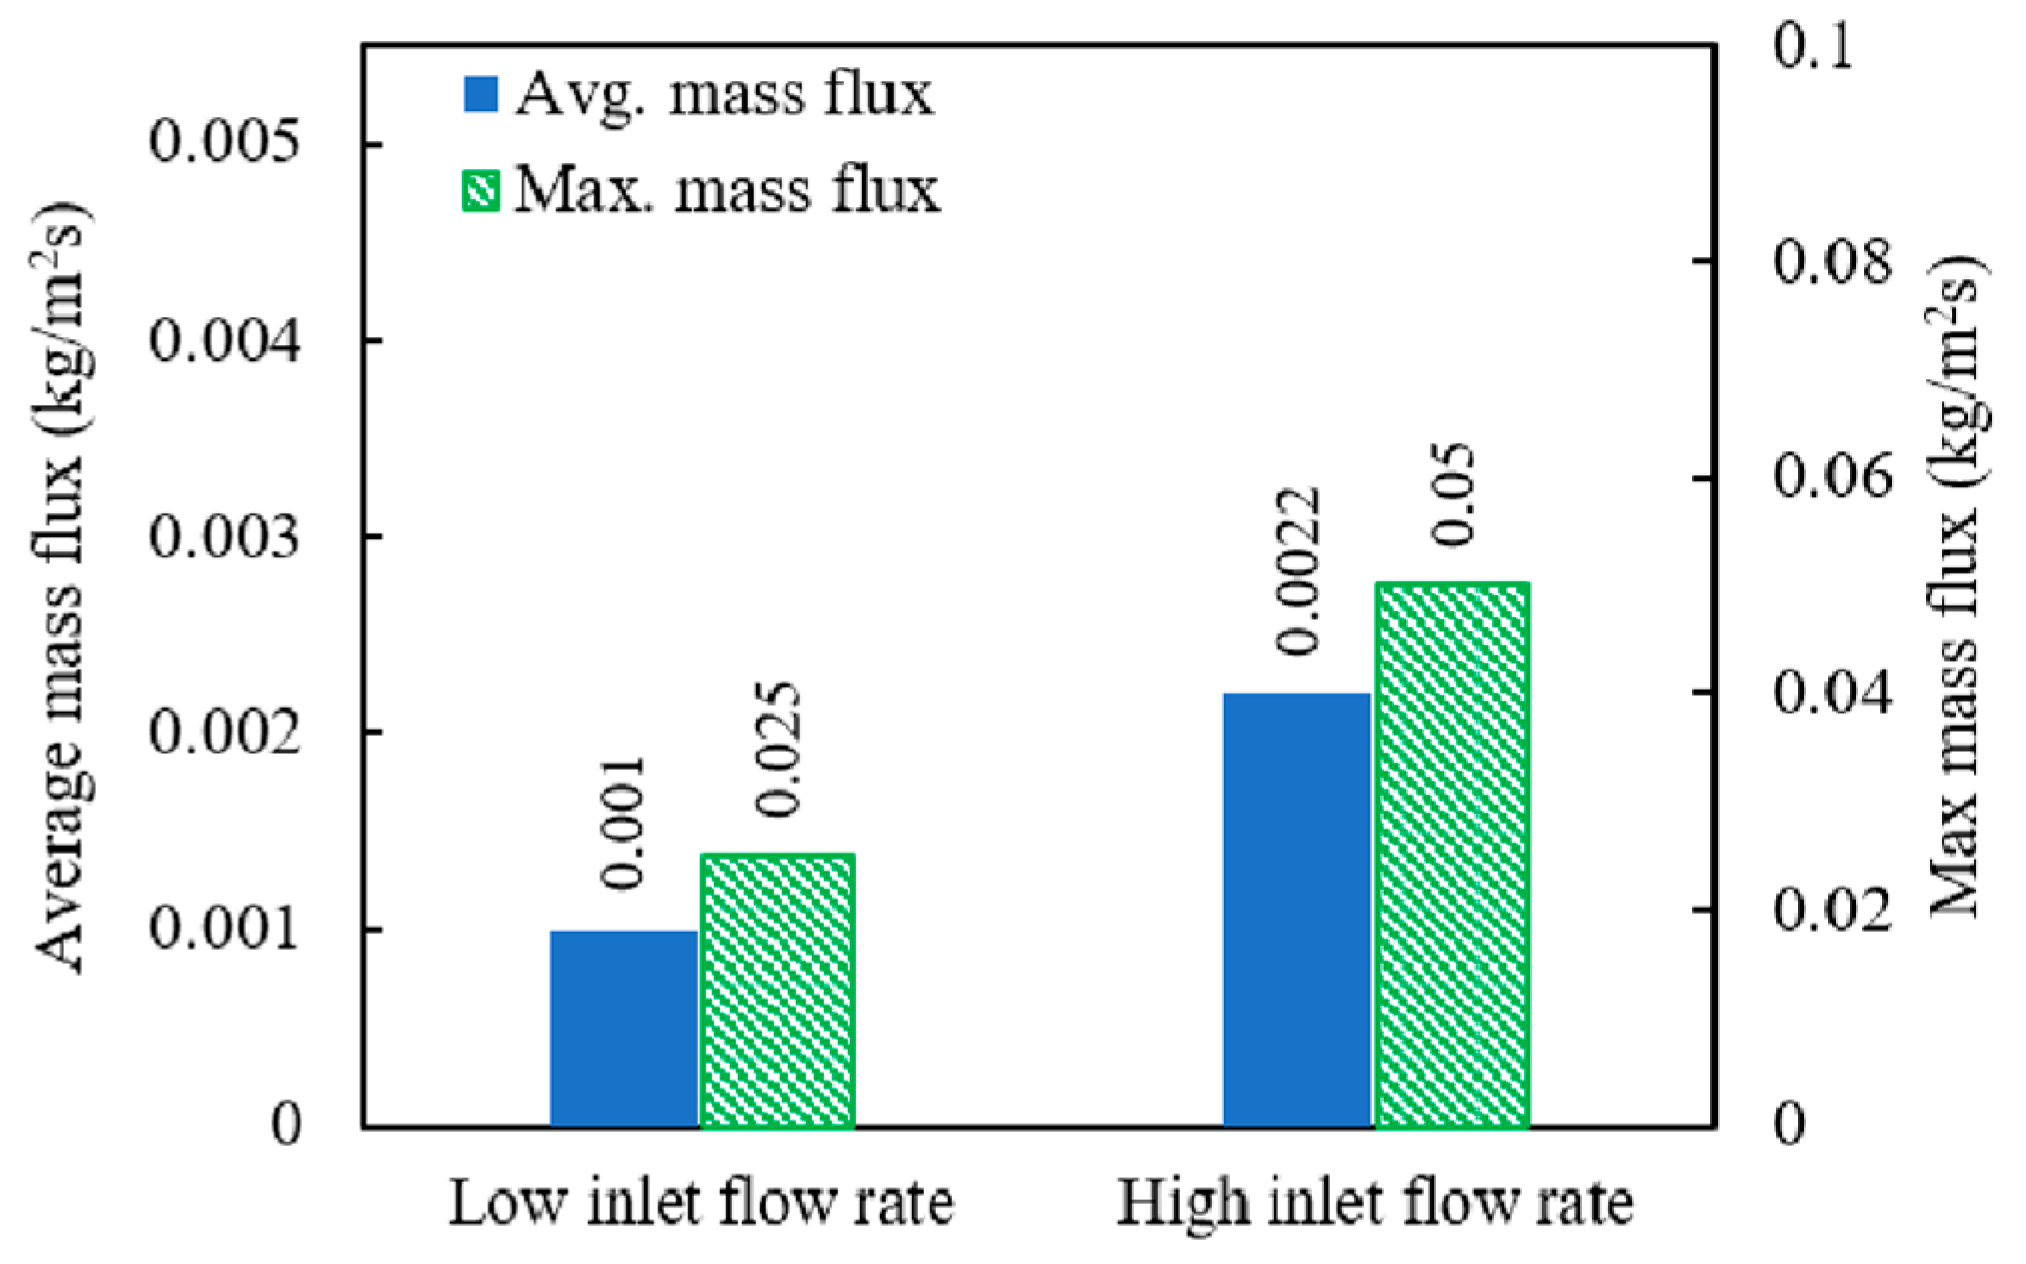
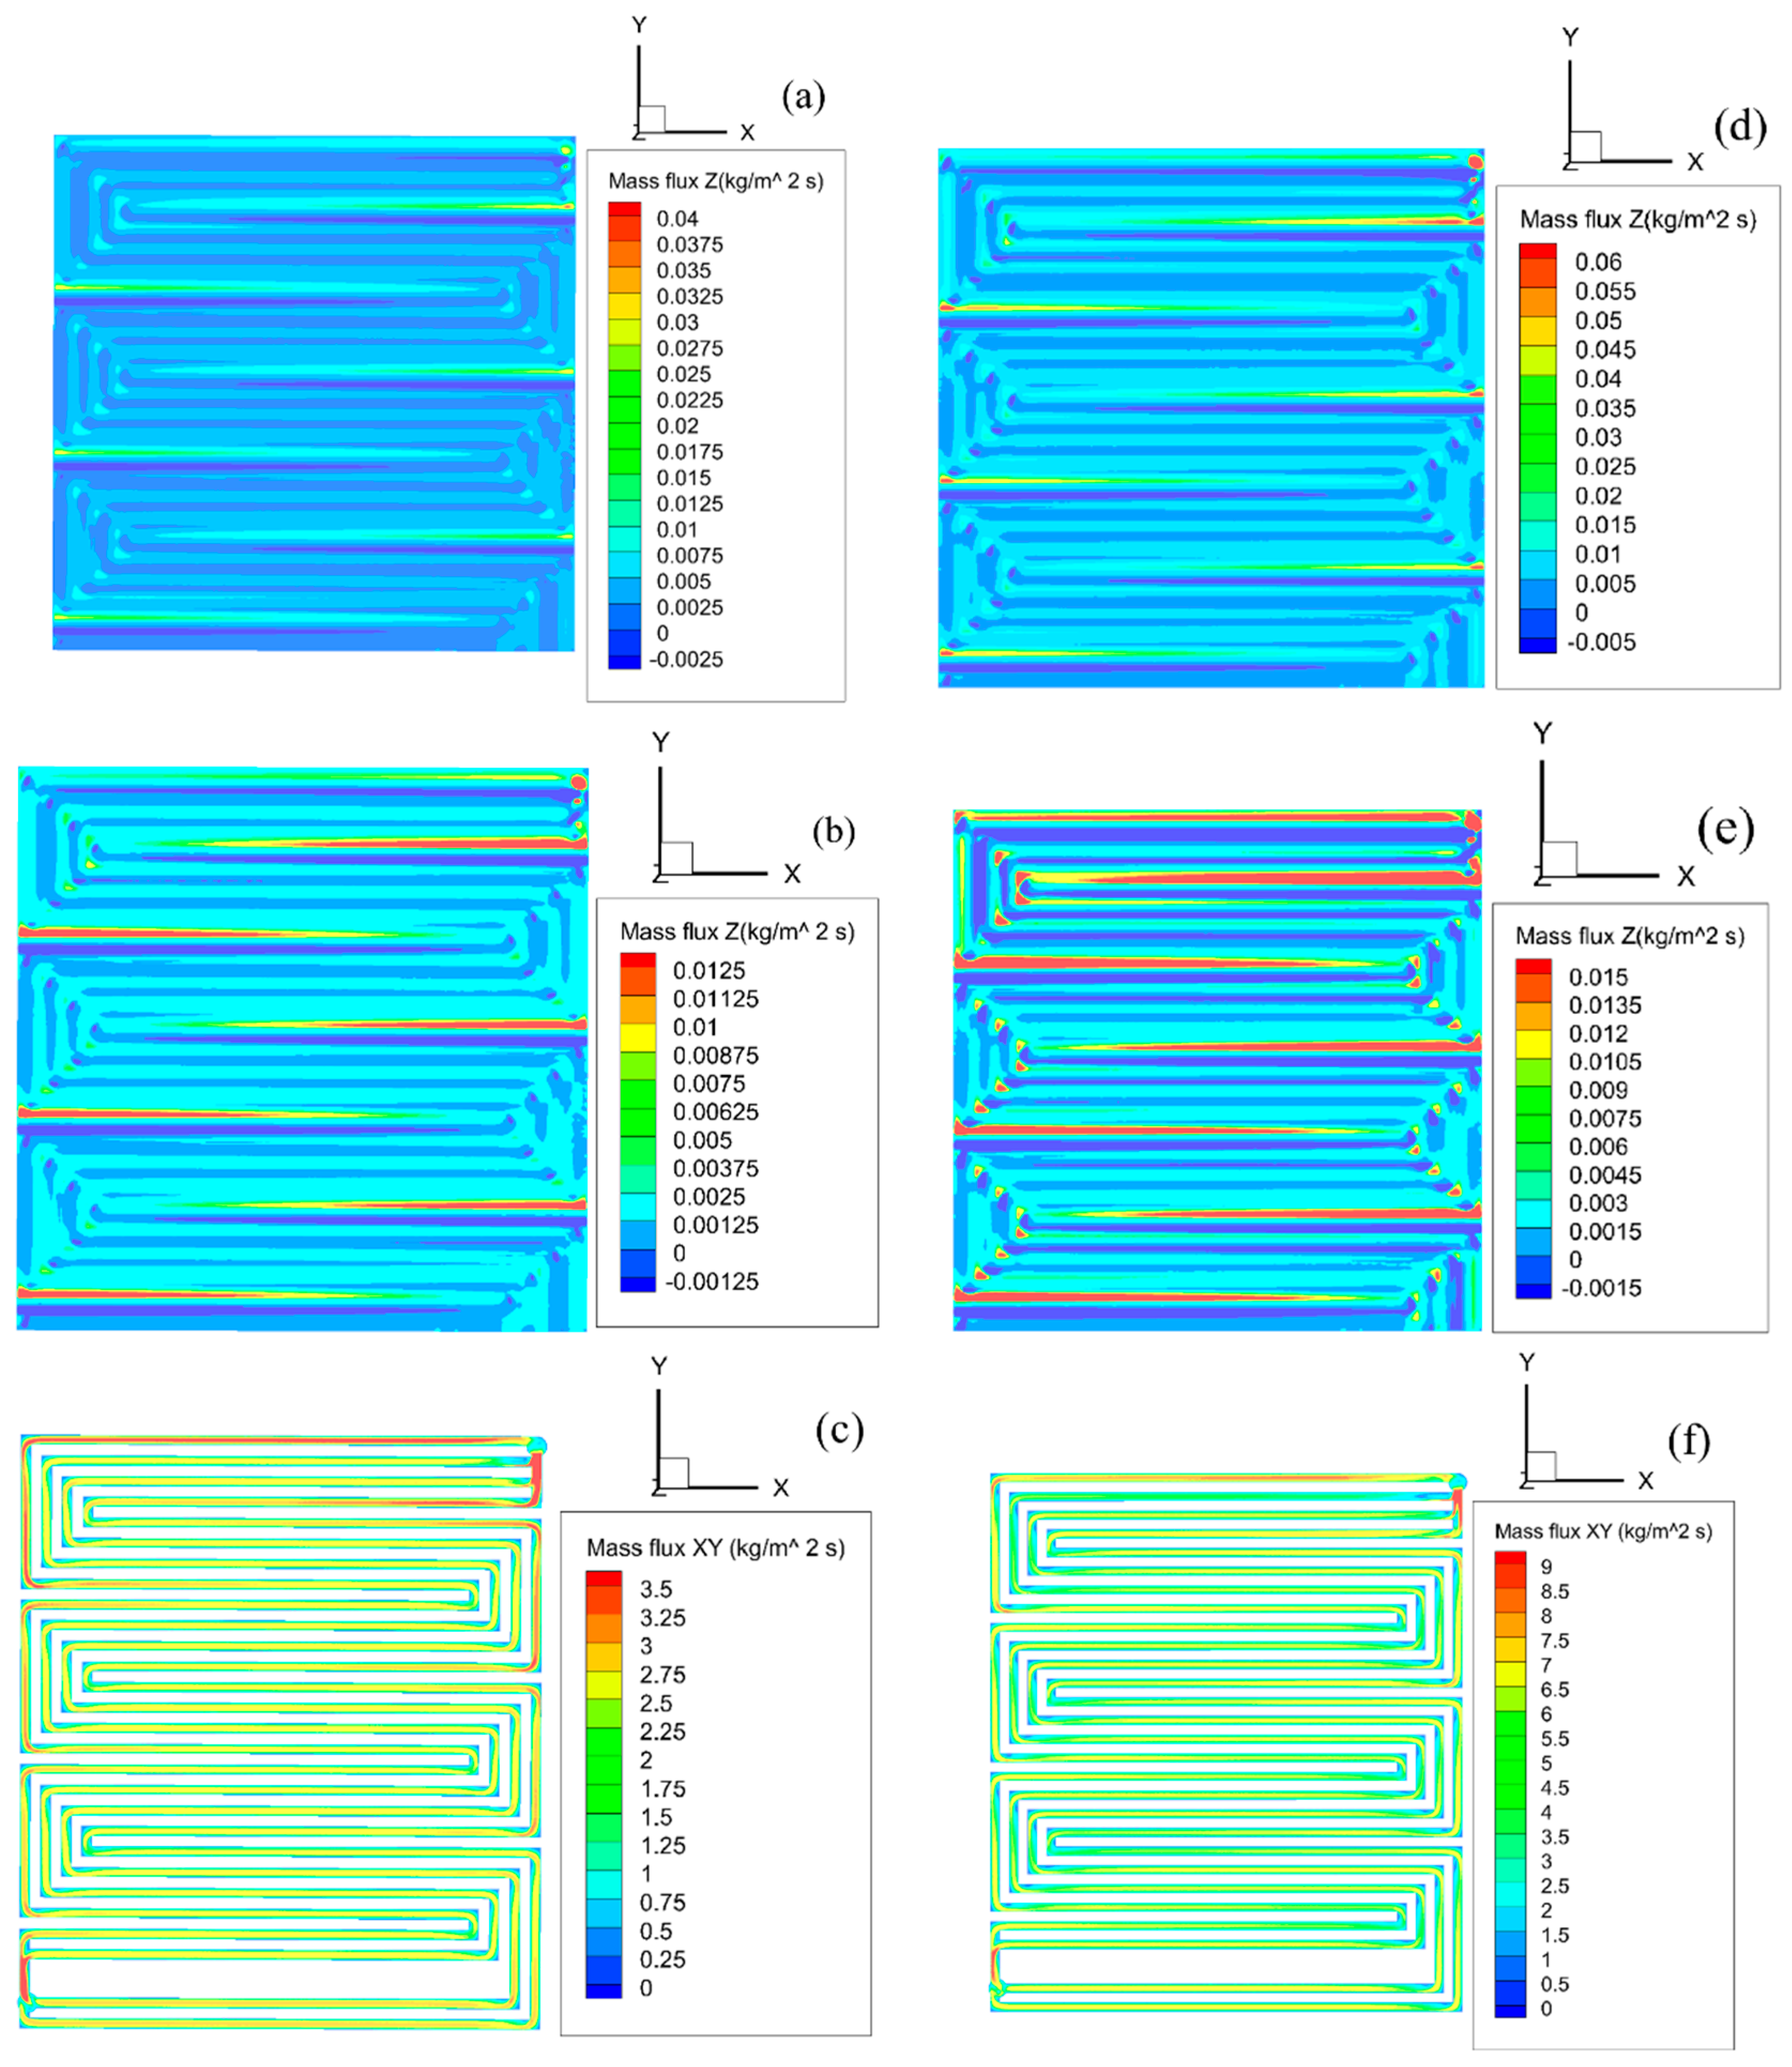

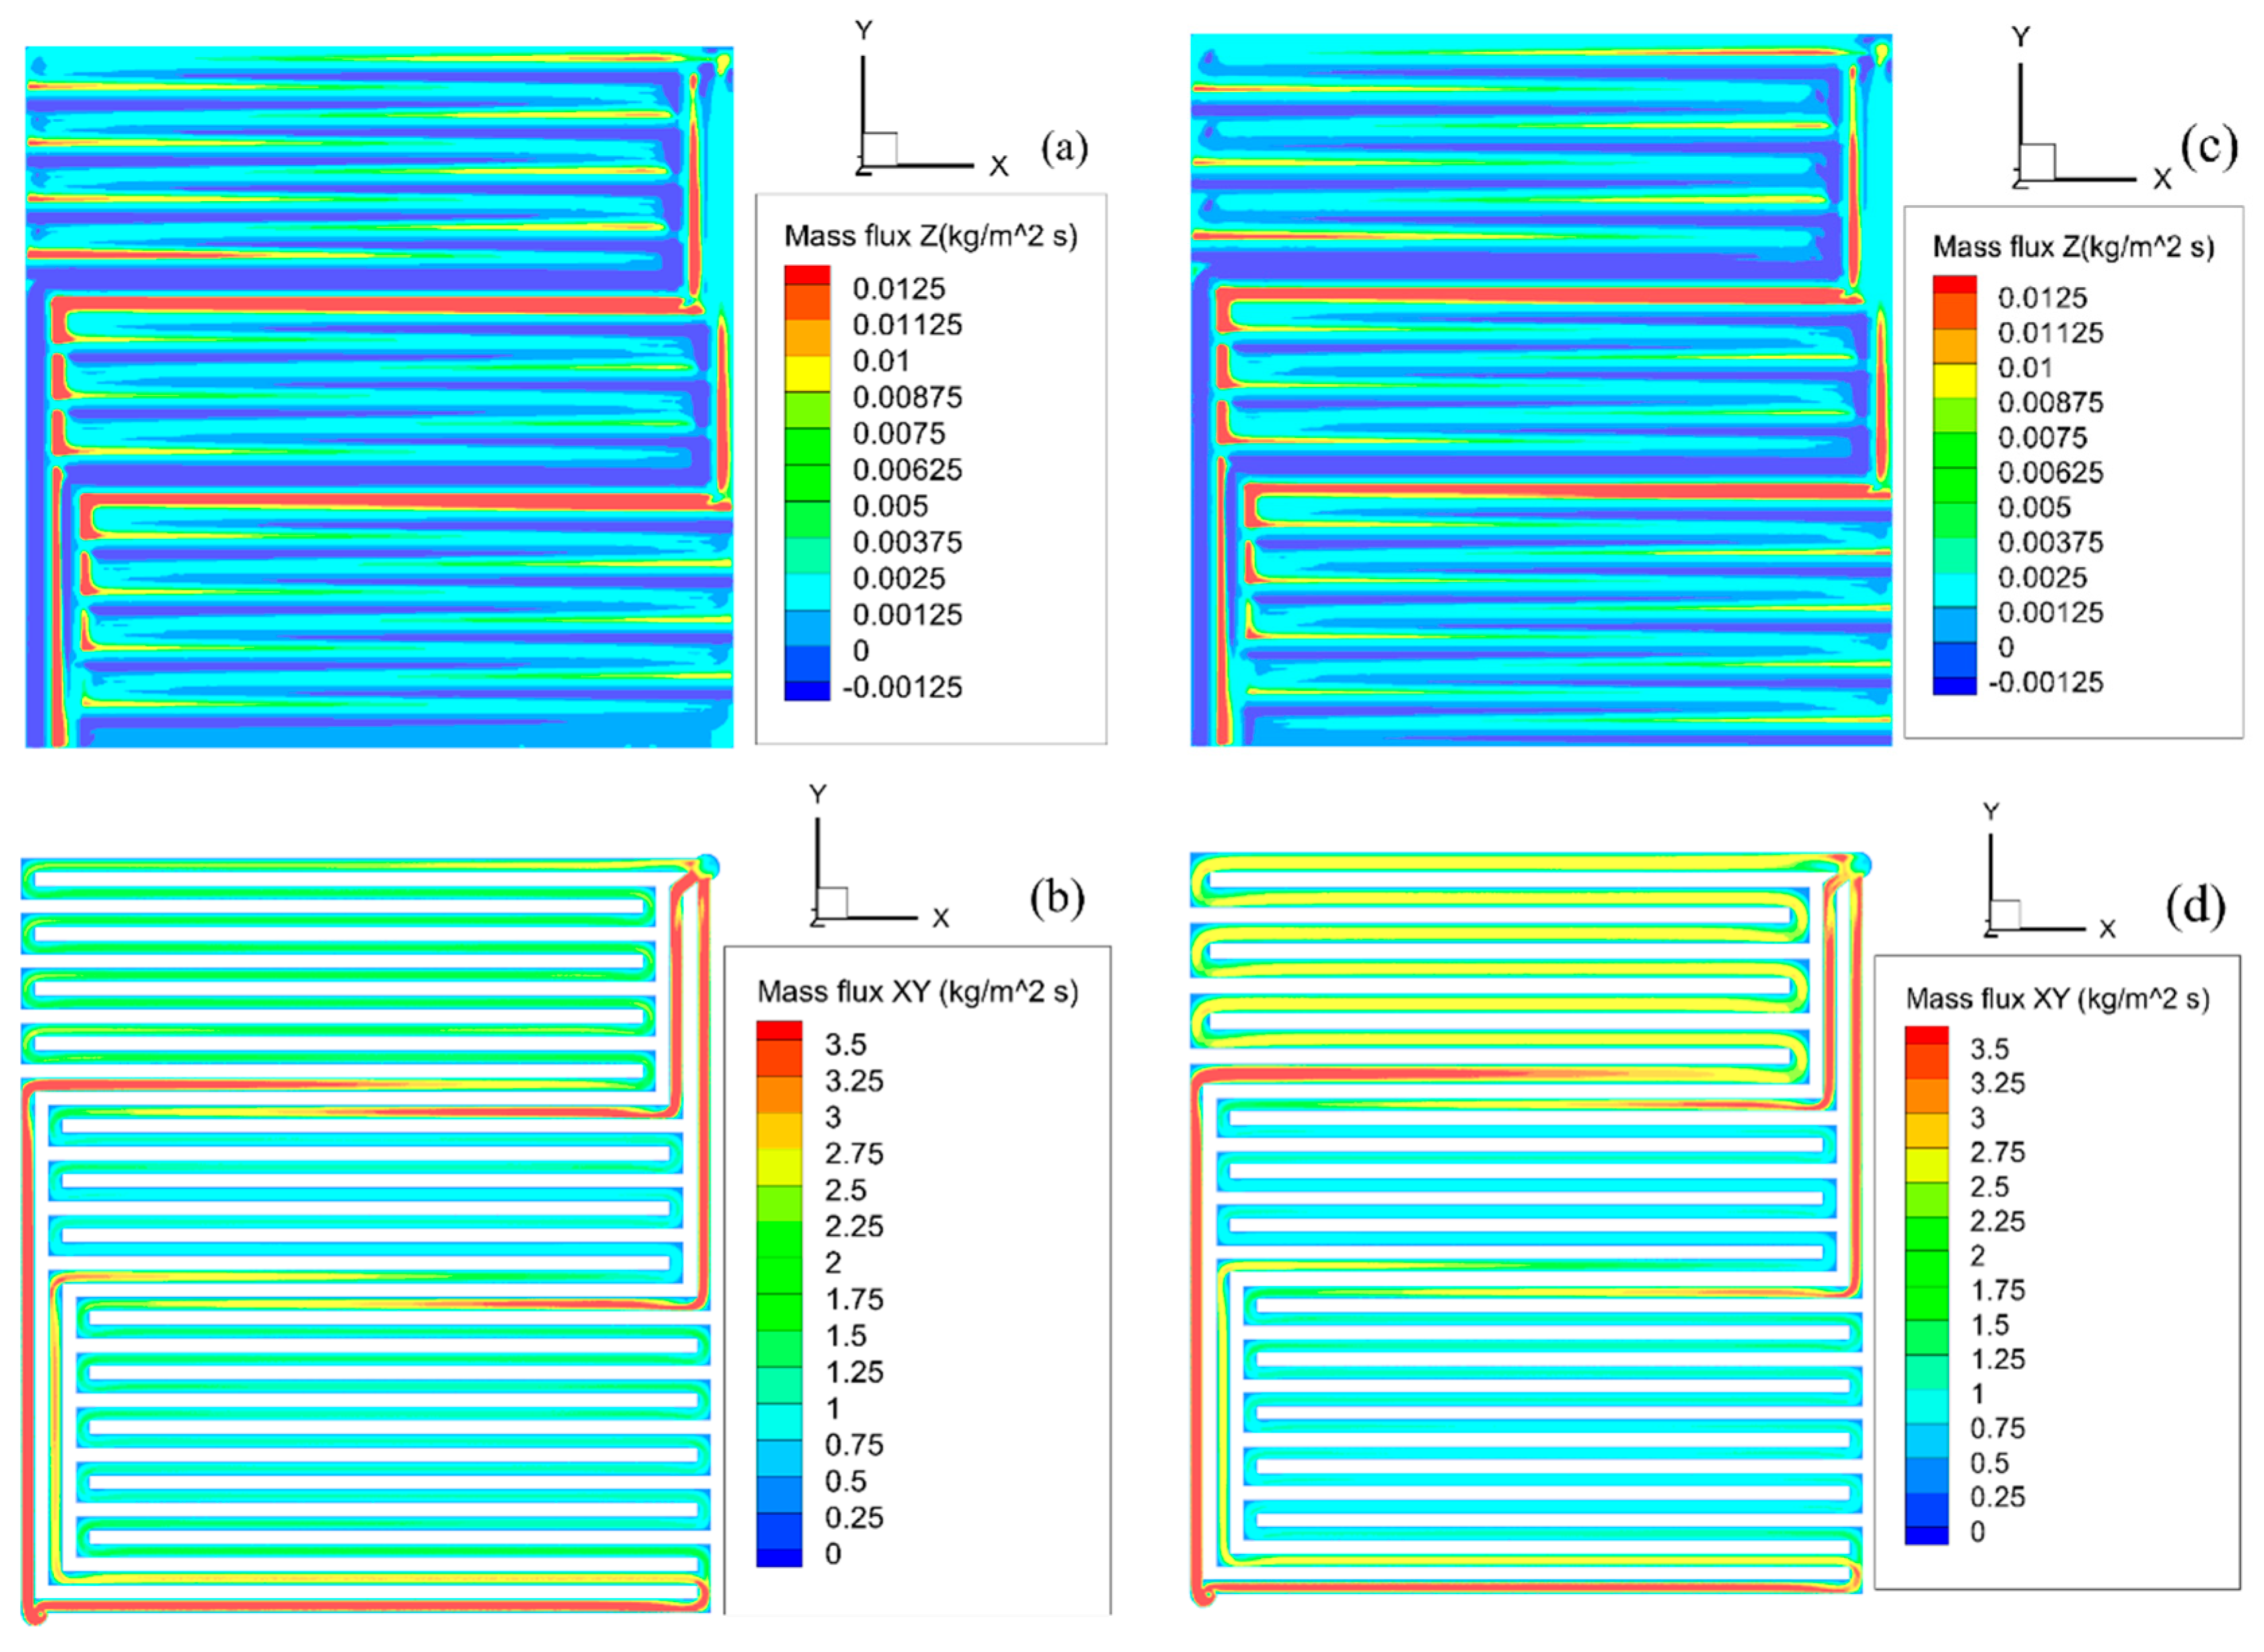

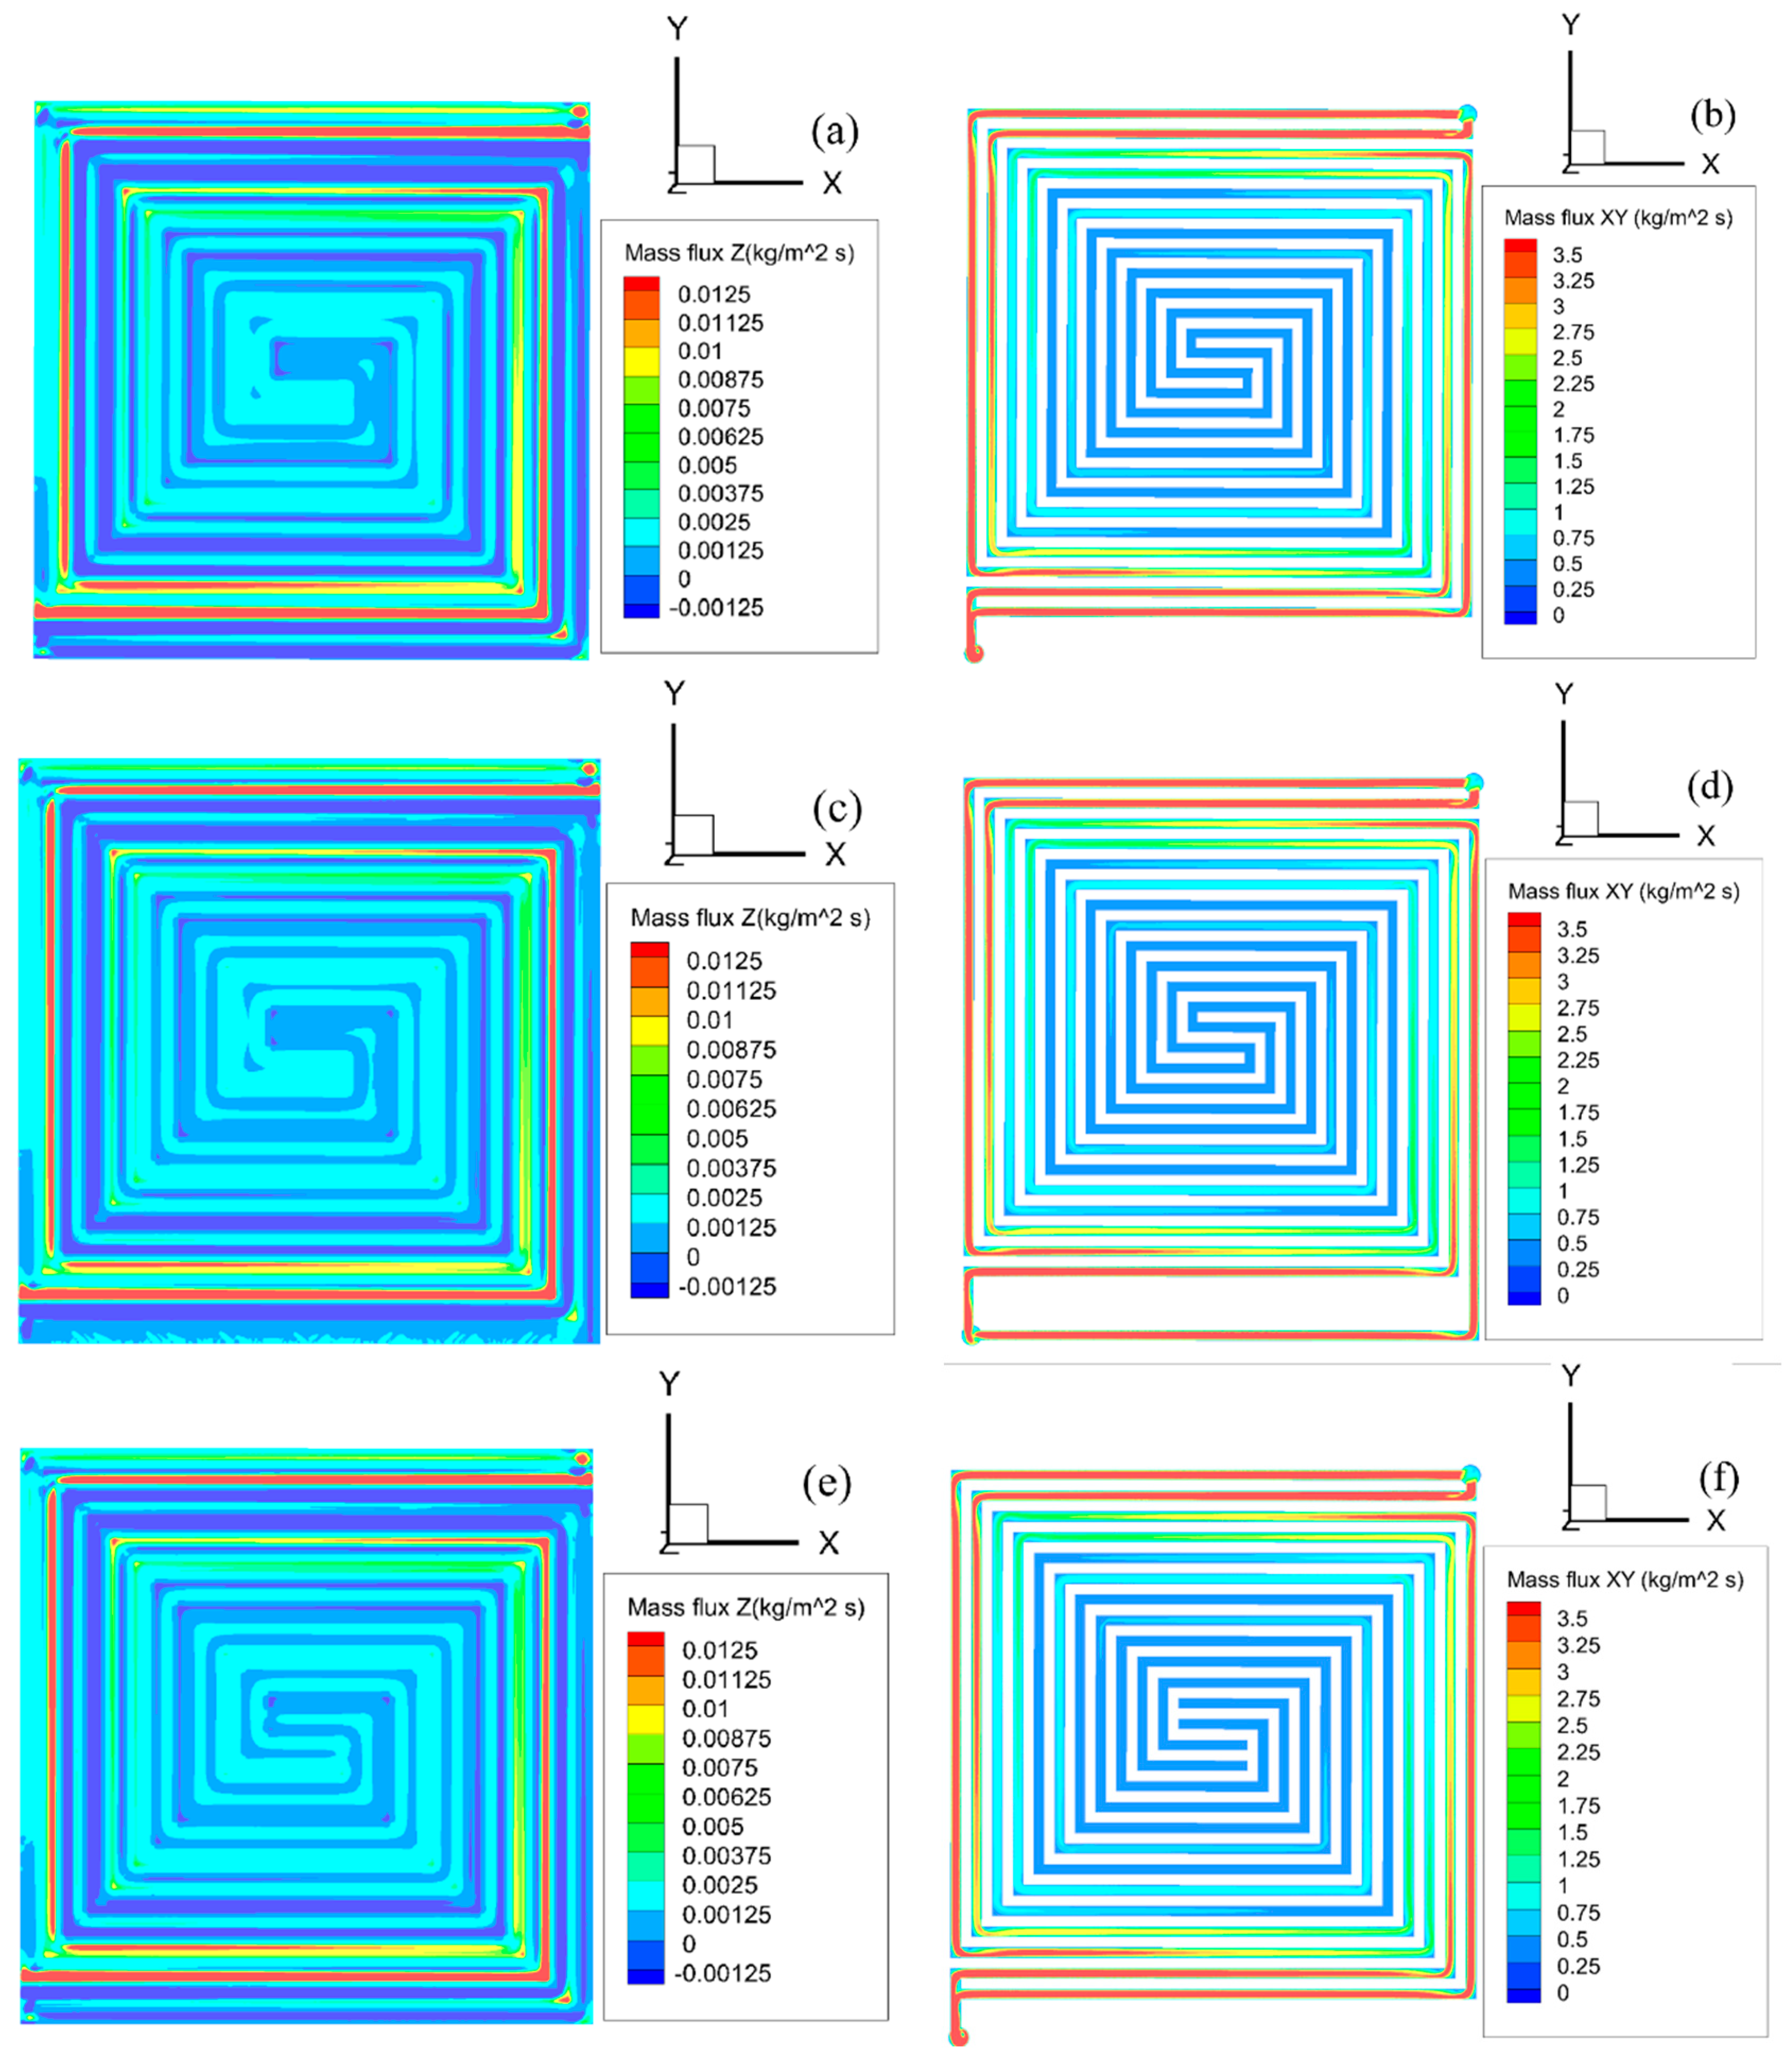
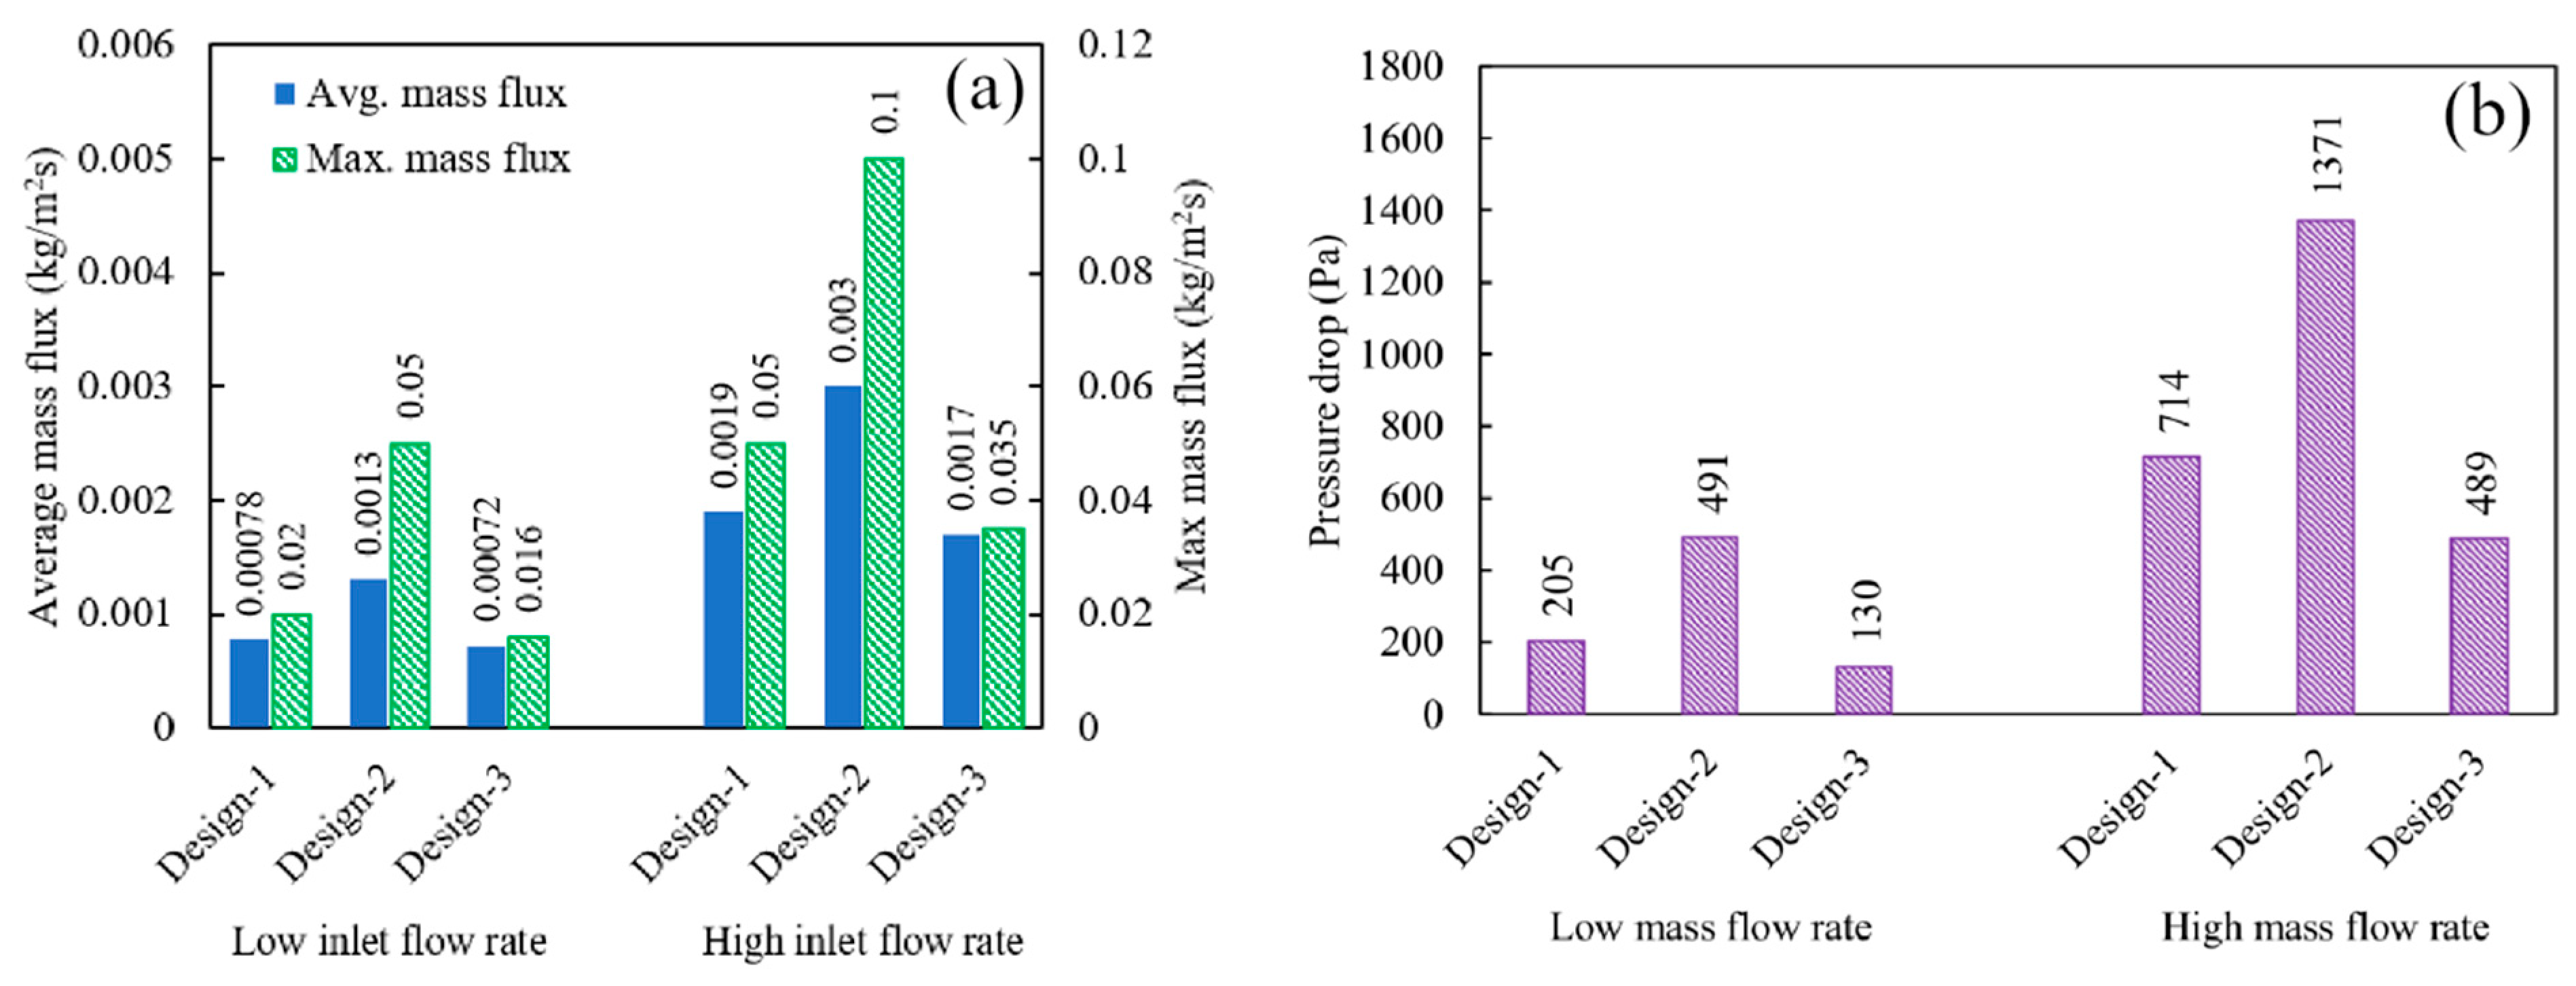
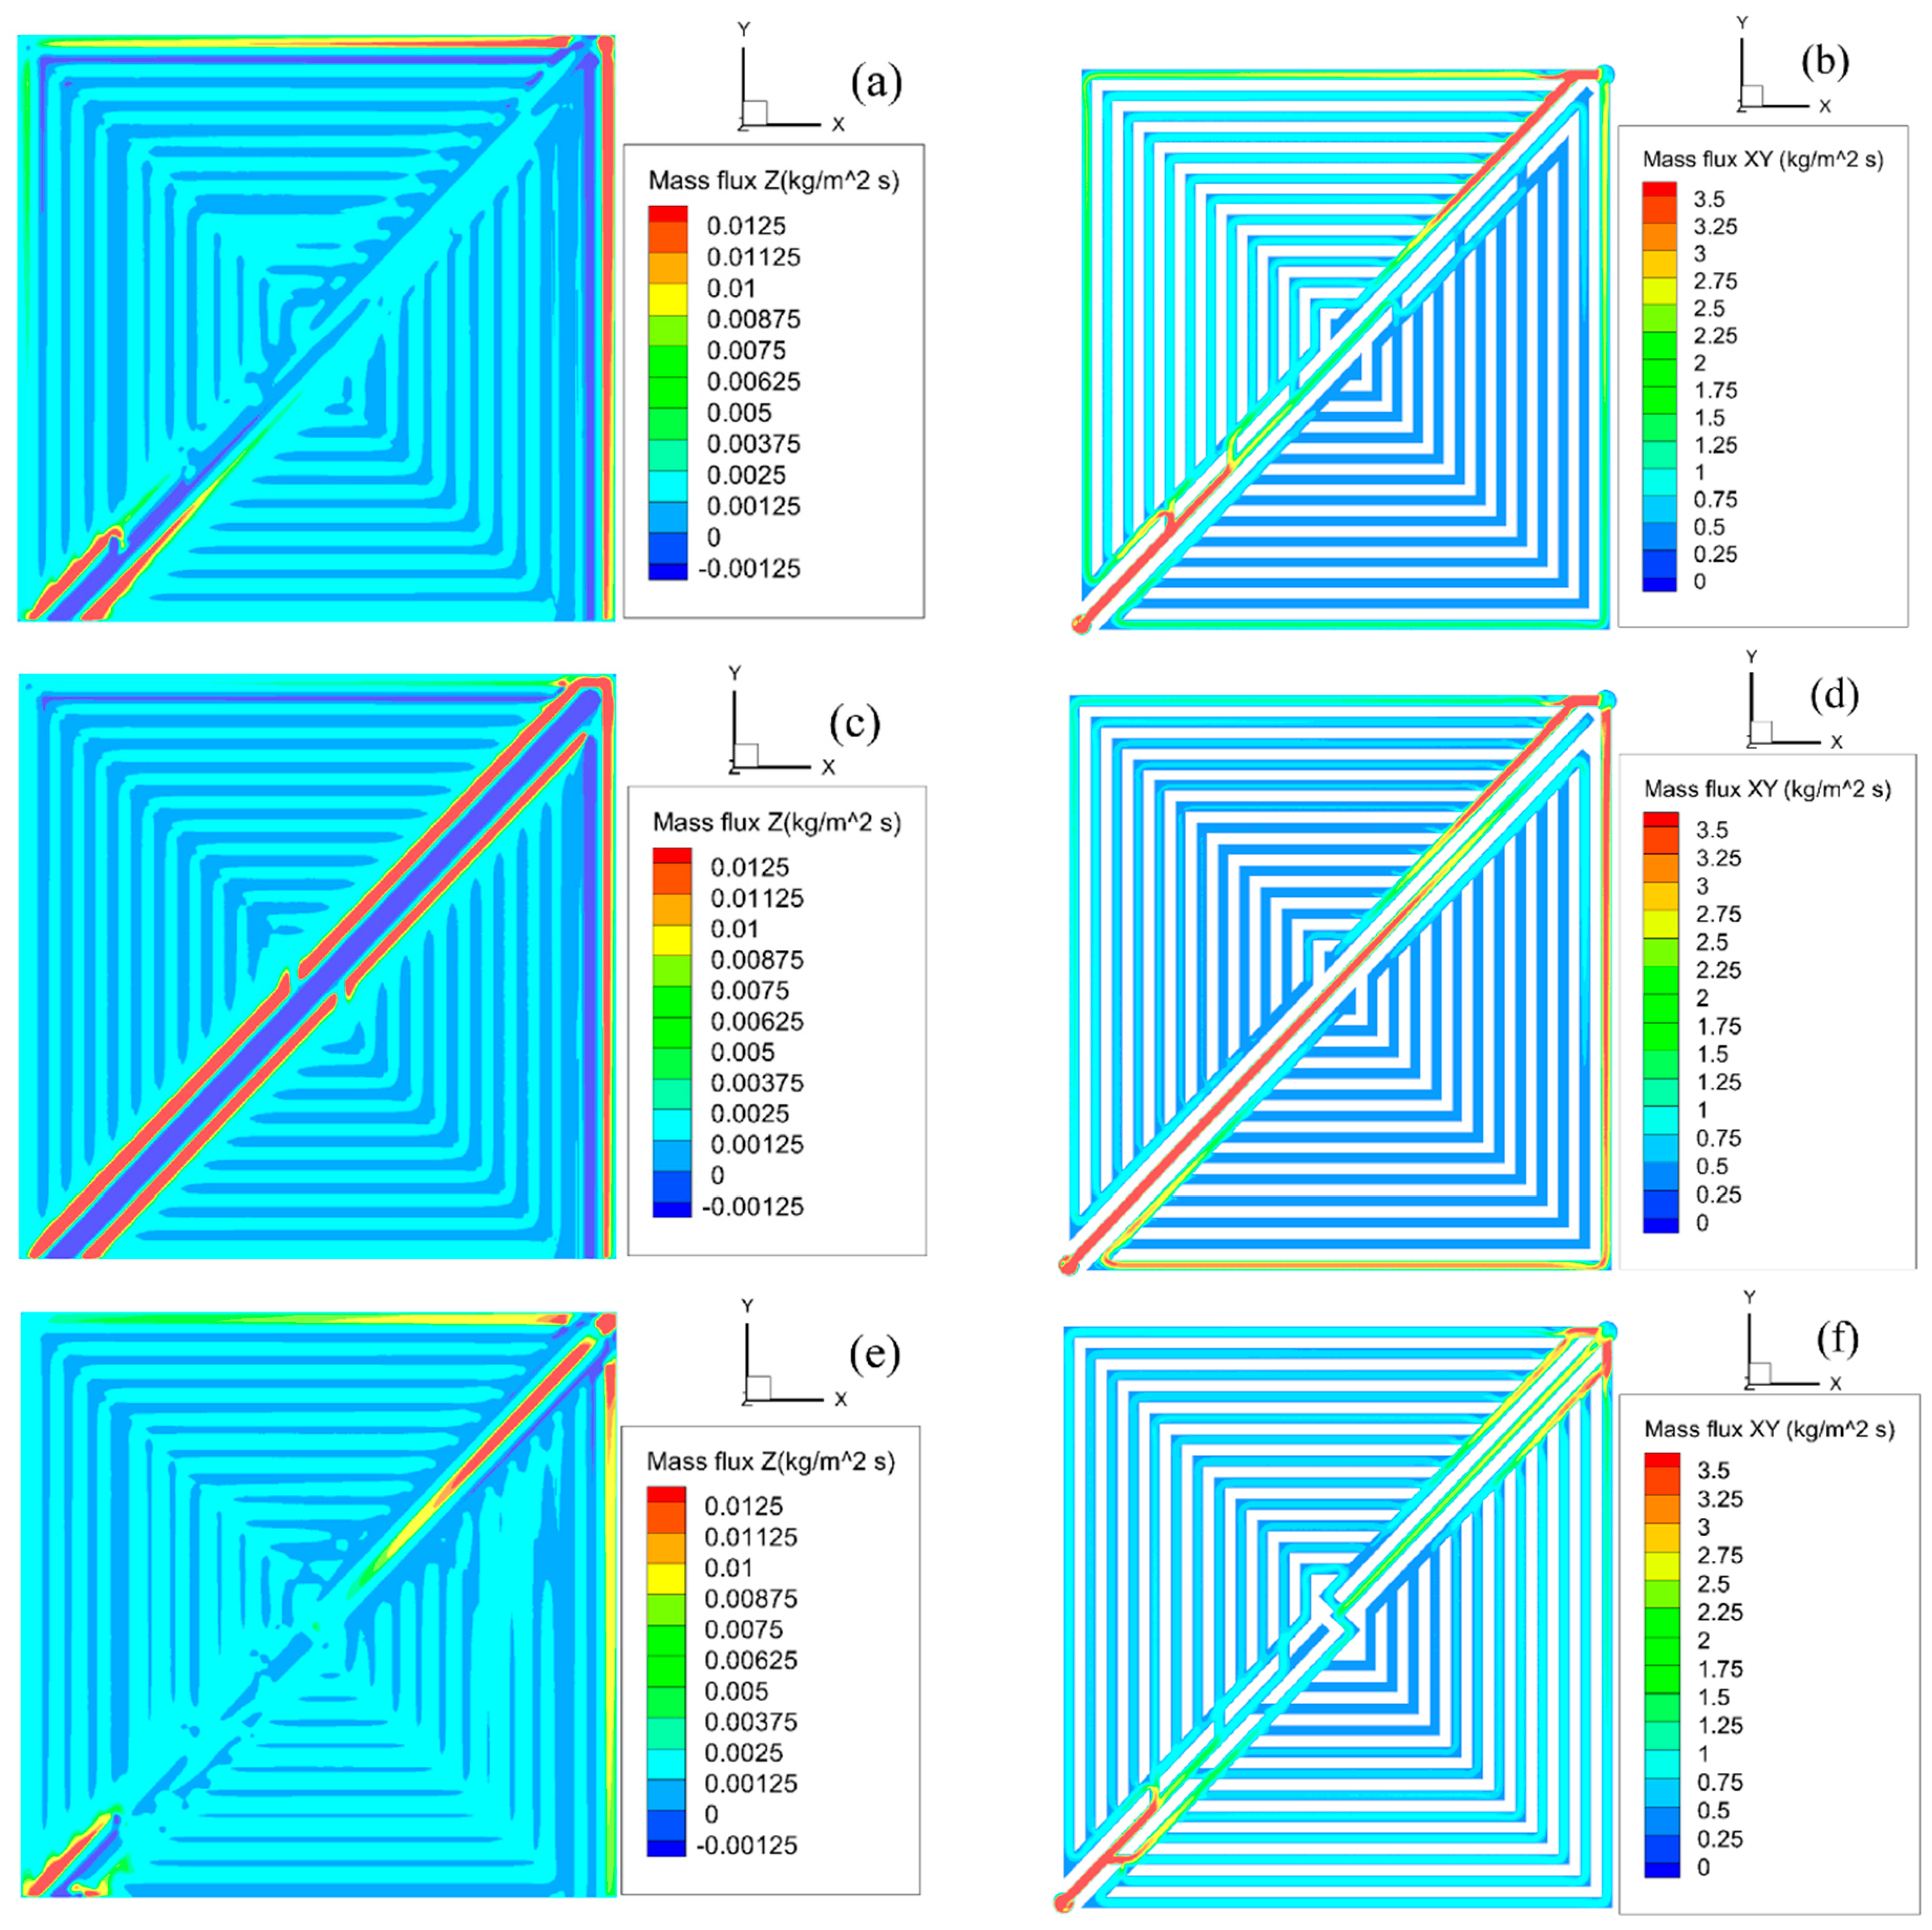
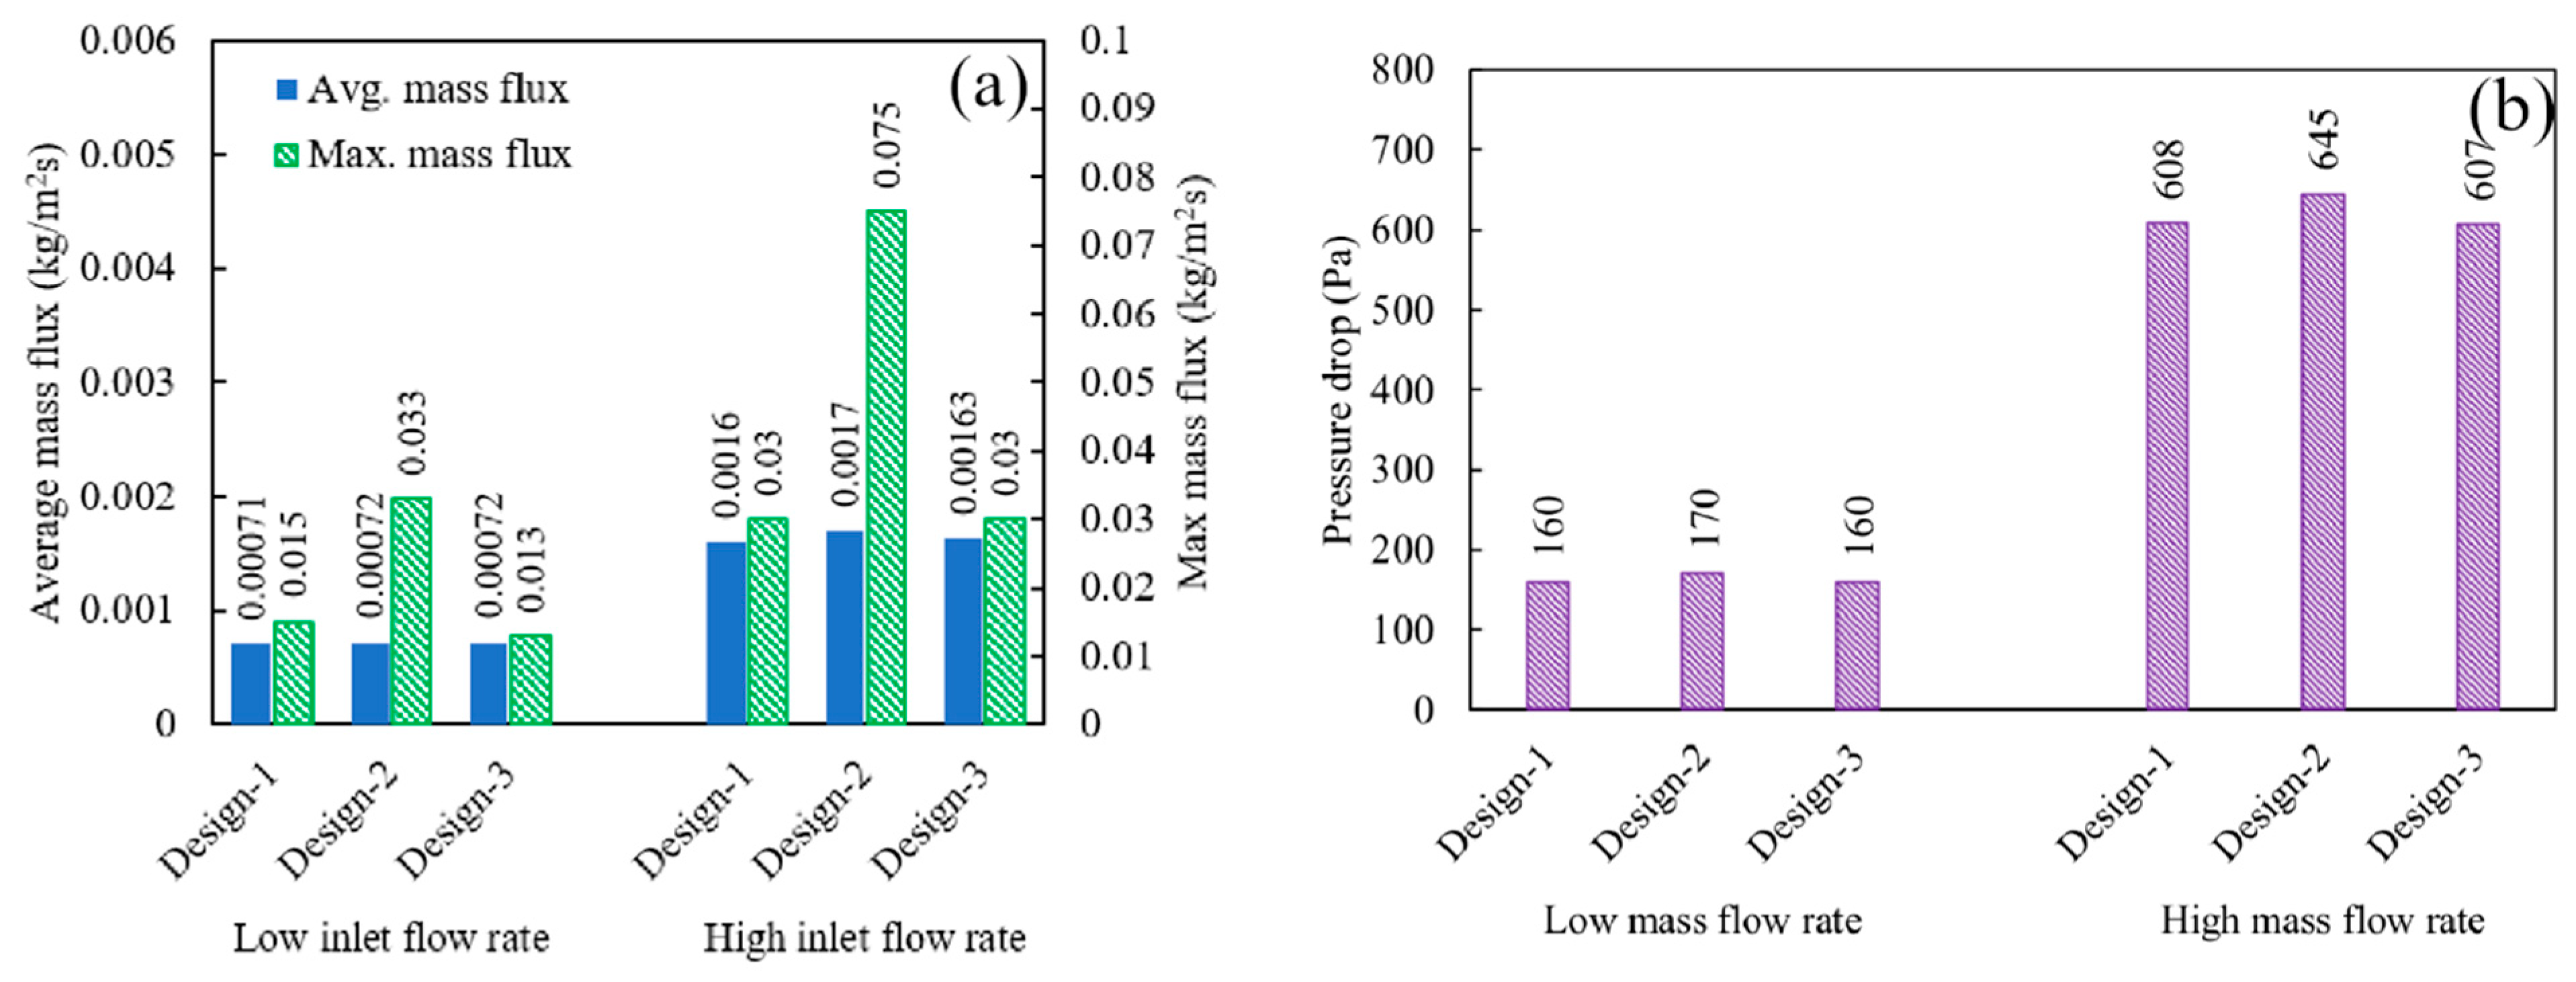
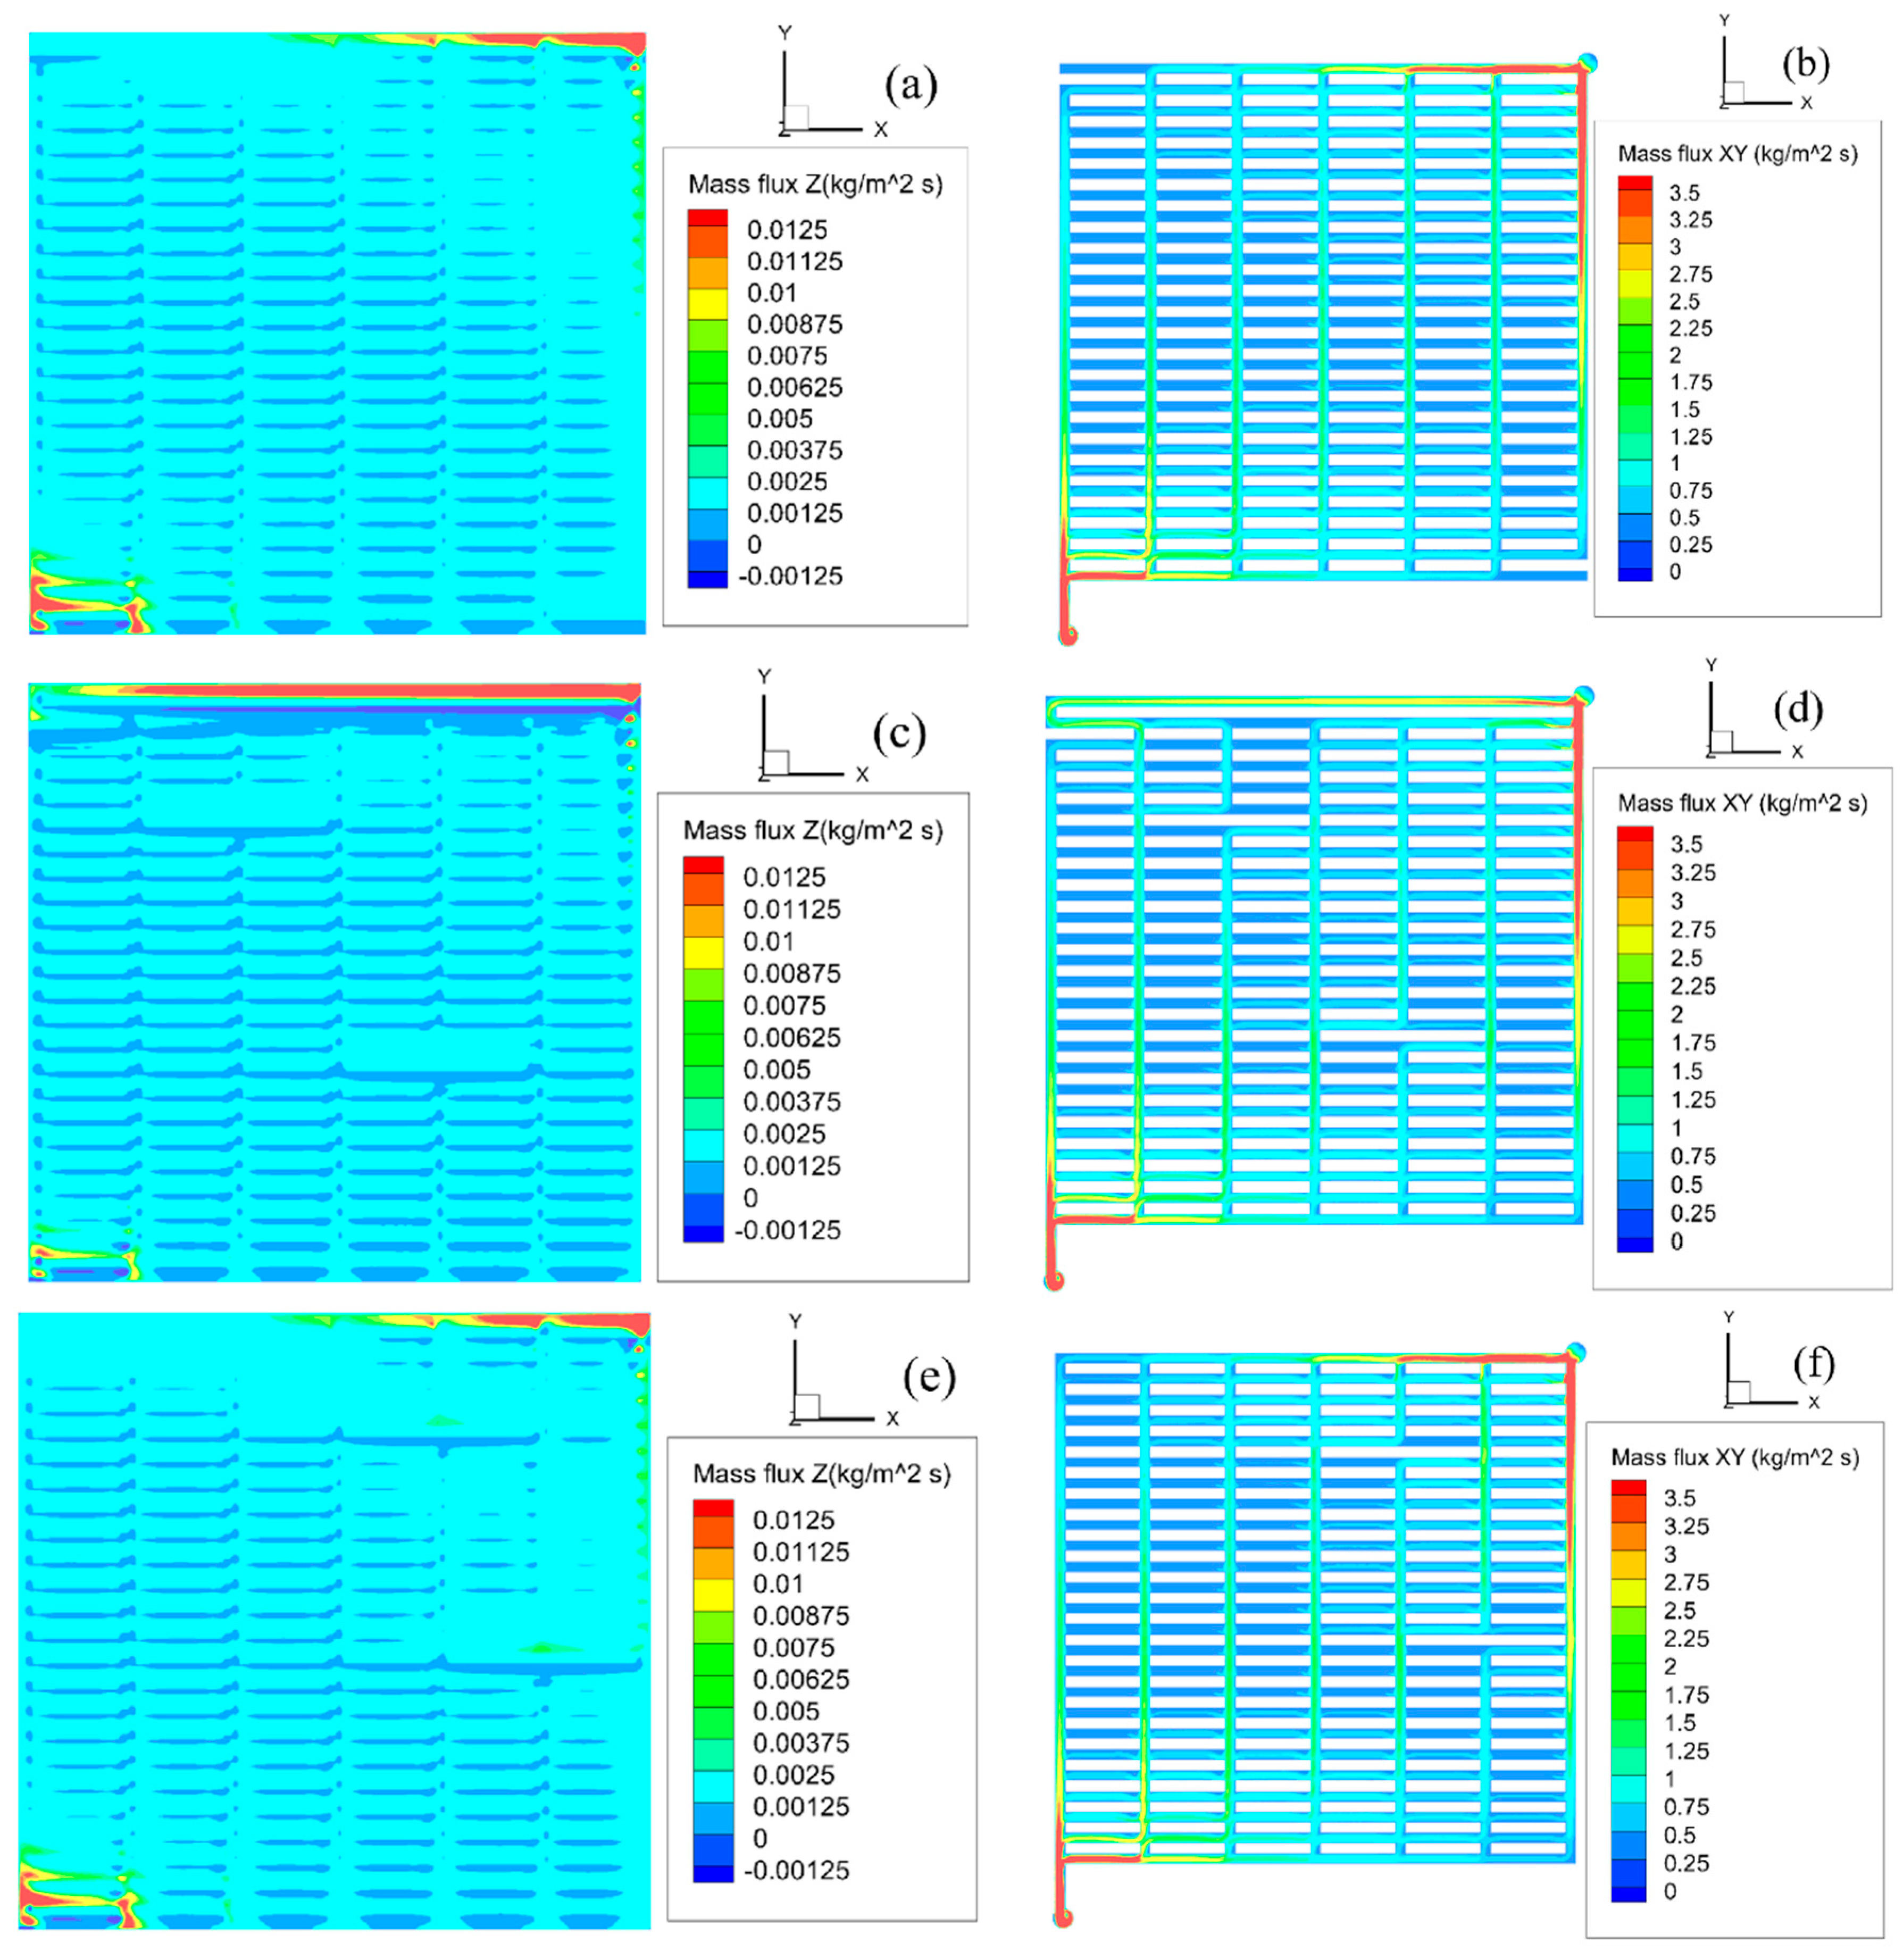

Disclaimer/Publisher’s Note: The statements, opinions and data contained in all publications are solely those of the individual author(s) and contributor(s) and not of MDPI and/or the editor(s). MDPI and/or the editor(s) disclaim responsibility for any injury to people or property resulting from any ideas, methods, instructions or products referred to in the content. |
© 2024 by the authors. Licensee MDPI, Basel, Switzerland. This article is an open access article distributed under the terms and conditions of the Creative Commons Attribution (CC BY) license (https://creativecommons.org/licenses/by/4.0/).