Abstract
This study is focused on the modelling of the production of bio-oil by thermochemical liquefaction. Species Acacia melanoxylon was used as the source of biomass, the standard chemical 2-Ethylhexanol (2-EHEX) was used as solvent, p-Toluenesulfonic acid (pTSA) was used as the catalyst, and acetone was used for the washing process. This procedure consisted of a moderate acid-catalysed liquefaction process and was applied at 3 different temperatures to determine the proper model: 100, 135, and 170 °C, and at 30-, 115-, and 200-min periods with 0.5%, 5.25%, and 10% (m/m) catalyst concentrations of overall mass. Optimized results showed a bio-oil yield of 83.29% and an HHV of 34.31 MJ/kg. A central composite face-centred (CCF) design was applied to the liquefaction reaction optimization. Reaction time, reaction temperature, as well as catalyst concentration, were chosen as independent variables. The resulting model exhibited very good results, with a highly adjusted R-squared (1.000). The liquefied products and biochar samples were characterized by Fourier-transformed infrared (FTIR) and thermogravimetric analysis (TGA); scanning electron microscopy (SEM) was also performed. The results show that invasive species such as acacia may have very good potential to generate biofuels and utilize lignocellulosic biomass in different ways. Additionally, using acacia as feedstock for bio-oil liquefaction will allow the valorisation of woody biomass and prevent forest fires as well. Besides, this process may provide a chance to control the invasive species in the forests, reduce the effect of forest fires, and produce bio-oil as a renewable energy.
Keywords:
Acacia; Acacia melanoxylon; biofuel liquefaction; bio-oil; biomass; catalyst; forest fires 1. Introduction
Nowadays, non-renewable energy sources represent a significant amount of the primary energy usage all over the world. Non-renewable energy sources contribute to global warming, climate change, and pollution. Among the other renewable energy types, biomass initiatives have been developing recently to limit the use of fossil fuels and reduce the carbon footprint [1].
In Portugal alone, available forest biomass, including wood industry leftovers, amounts to about 2.2 million tons per year, or 11,578 GWh/year. When all facilities’ raw materials are considered, around 6.0 Mtons per year are reached. A sustainable production approach regarding raw materials based on the recycled component of biomass production could contribute to addressing this forest biomass deficit [2]. Every year, forest fires rage over Portugal’s forests, killing and injuring a great number of people. Devastating wildfires caused considerable damage to Portugal in 2017, with fires blazing continuously in late spring, and burned areas all over the world have been reported by the European Commission as 478,461 ha [3].
Biomass is an essential renewable energy source that is used in many industries, such as electricity, heat, and transportation. It has several advantages, including the fact that it is neutral in terms of carbon as the carbon content is recycled from the atmosphere itself [4]. The spread of biomass energy alongside fossil fuels and other renewable energy sources like solar and wind is closely related to many other technological advancements, in addition to having a direct impact on land use, biodiversity, climate change, low-carbon economies, and sustainable development [5]. Forest biomass is the more abundant raw material for the production of biofuels and chemical feedstock for industry [6].
Liquefaction is a novel technique that has attracted attention to new technologies that reduce environmental impact and promote long-term sustainability while also being a potential solution to the global problem. The use of biomass-derived chemicals to synthesise materials that were previously made from petroleum-based ones can reduce the current dependence on fossil resources and the environmental concerns associated with their use, as well as add value to agroforestry by-products (wood scraps, bark, wheat, corncobs, etc.) [7]. Liquefaction of lignocellulosic biomass residues is an innovative concept that is an extensively researched process [8]. Thermochemical liquefaction can be applied to major raw material sources such as agriculture, forest, food, and industrial residues, like carob tree, pinewood, cork [8], eucalyptus [9], swine manure, poplar, cattle manure [10], potato peel, wheat straw [11], corn straw [12], olive pomace [13], and rice husk [14,15]. This process is often acid-catalysed and takes place at moderate temperatures (100–250 °C) in the presence of organic solvents such as polyalcohol and ethylene carbonate. This method is gaining attention because the presence of the solvent dilutes the product and prevents cross-linking and back-reactions [16]. The process does not require high pressure or a prior drying step. Liquefaction allows the conversion of biomass with a high water content. In general, the operating conditions that can affect liquefaction are biomass composition, type of solvent, catalyst, temperature, and reaction time. One of the factors influencing liquefaction is the type of solvent. Simple alcohols such as methanol, ethanol, propanol, and butanol result in higher conversion rates, while longer chain alcohols and organic acids leave more solid residues. However, singlet alcohols have low boiling points and therefore evaporate before liquefaction begins. Such low-boiling alcohols require the use of sealed high-pressure vessels, which places greater demands on the equipment [17].
Acacia is a genus of shrubs and trees that are widely distributed throughout the world. In Portugal, the acacia species that are most commonly found include Acacia dealbata, Acacia longifolia, and Acacia melanoxylon. These trees were introduced to Portugal from Australia and South Africa in the late 18th and early 19th centuries and have since become established as invasive species in many parts of the country [18]. The Acacia melanoxylon, also known as the blackwood, is native to southeastern Australia and was introduced to Portugal in the late 19th century. This species is often found in gardens and parks due to its attractive foliage and dense, durable wood. It has become naturalized in many parts of Portugal, particularly in the central and northern regions of the country [19].
While the acacia trees are valued for their ornamental qualities and commercial uses, they have also become a serious problem in Portugal. These trees are considered invasive species that can outcompete native flora and fauna, alter ecosystems, and even create fire hazards. The acacia shrubs are considered to be one of the most invasive plant species occurring in Portugal [20]. The spread of acacia trees in Portugal is due, partially, to their ability to reproduce and spread rapidly. They can thrive in a variety of soil types and can tolerate both drought and frost. In addition, the trees are known for their ability to resprout after being cut down or burned, which makes them difficult to eradicate. To address the problem of invasive acacia trees in Portugal, various control measures have been implemented (Decreto-Lei n. º 565/99 de 21 de Dezembro). These include manual removal, chemical control, and the introduction of biological control agents such as insects and fungi that feed on the trees. These measures have had varying degrees of success, and ongoing efforts are needed to control the spread of the invasive species [21].
In conclusion, the distribution of acacia trees in Portugal is a complex issue that involves both the ornamental value of the trees and their invasive nature. While these trees have become established in many parts of the country, efforts are underway to control their spread and mitigate their impact on the environment.
Acacia species generally comply with the standards established for the species to be an ideal energy source, which includes a high yield of biomass per hectare, a low energy input requirement during growth, an affordable expense requirement during cultivation, and should produce biomass with a low number of contaminants and external nutrient requirements. It has been researched that acacia species have the favourable thermochemical characteristics needed to create biofuels using thermochemical procedures [22]. Therefore, thermochemical liquefaction of Acacia melanoxylon will help to overcome several issues, such as controlling the invasive presence of Acacia, reducing the effect of wildfires, and more importantly, producing bio-oil, renewable energy.
To our knowledge, no literature exists on the modelling and liquefaction of Acacia melanoxylon species using an acid catalyst. In light of this situation, the research will serve as a significant pioneer and guide.
2. Materials and Methods
2.1. Materials and Chemicals
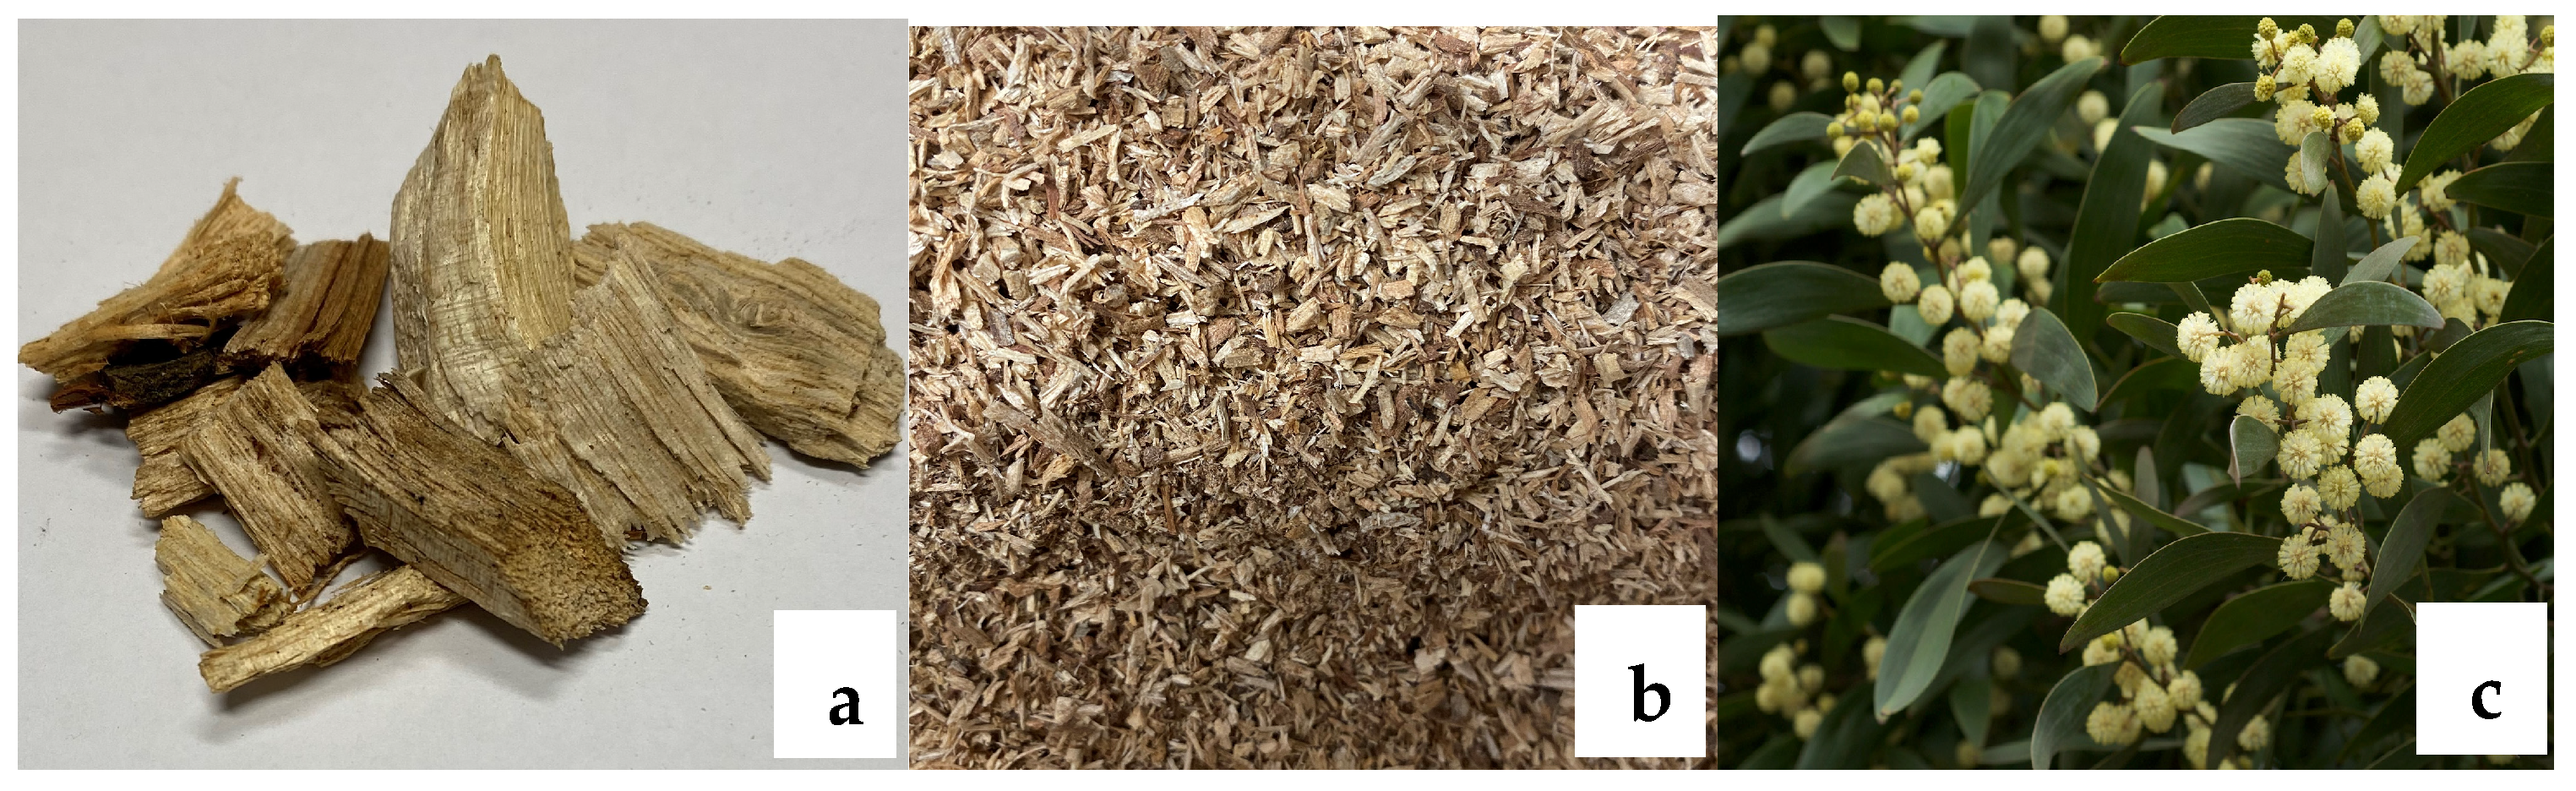
Biomass samples of Acacia melanoxylon wood chips were collected by Parques de Sintra, Monte da Lua, located in Sintra, Portugal, as this is an invasive species rather abundant in Portuguese forests, and it was used as feedstock material. As shown in Figure 1, the biomass sample was dried for one month, then milled in a Retsch© SM 2000 mill (ThermoScientific, Waltham, MA, USA), and finally sieved in a Retsch© ISO 9001 vibrating sieve (ThermoScientific, Waltham, MA, USA). A 40–60 mesh fraction was then used for further chemical analysis.

Figure 1.
(a) Acacia wood chips, (b) shredded acacia wood chips, and (c) Acacia melanoxylon tree.
During the reaction, 2-Ethylhexanol (99% purity, Acros, Pittsburgh, PA, USA) was used as a solvent, pTSA (99% purity, Sigma-Aldrich, St. Louis, MO, USA) was used as a catalyst, and the solvent acetone (99–100%, Enzymatic) was used for the washing process.
2.2. Liquefaction Reaction
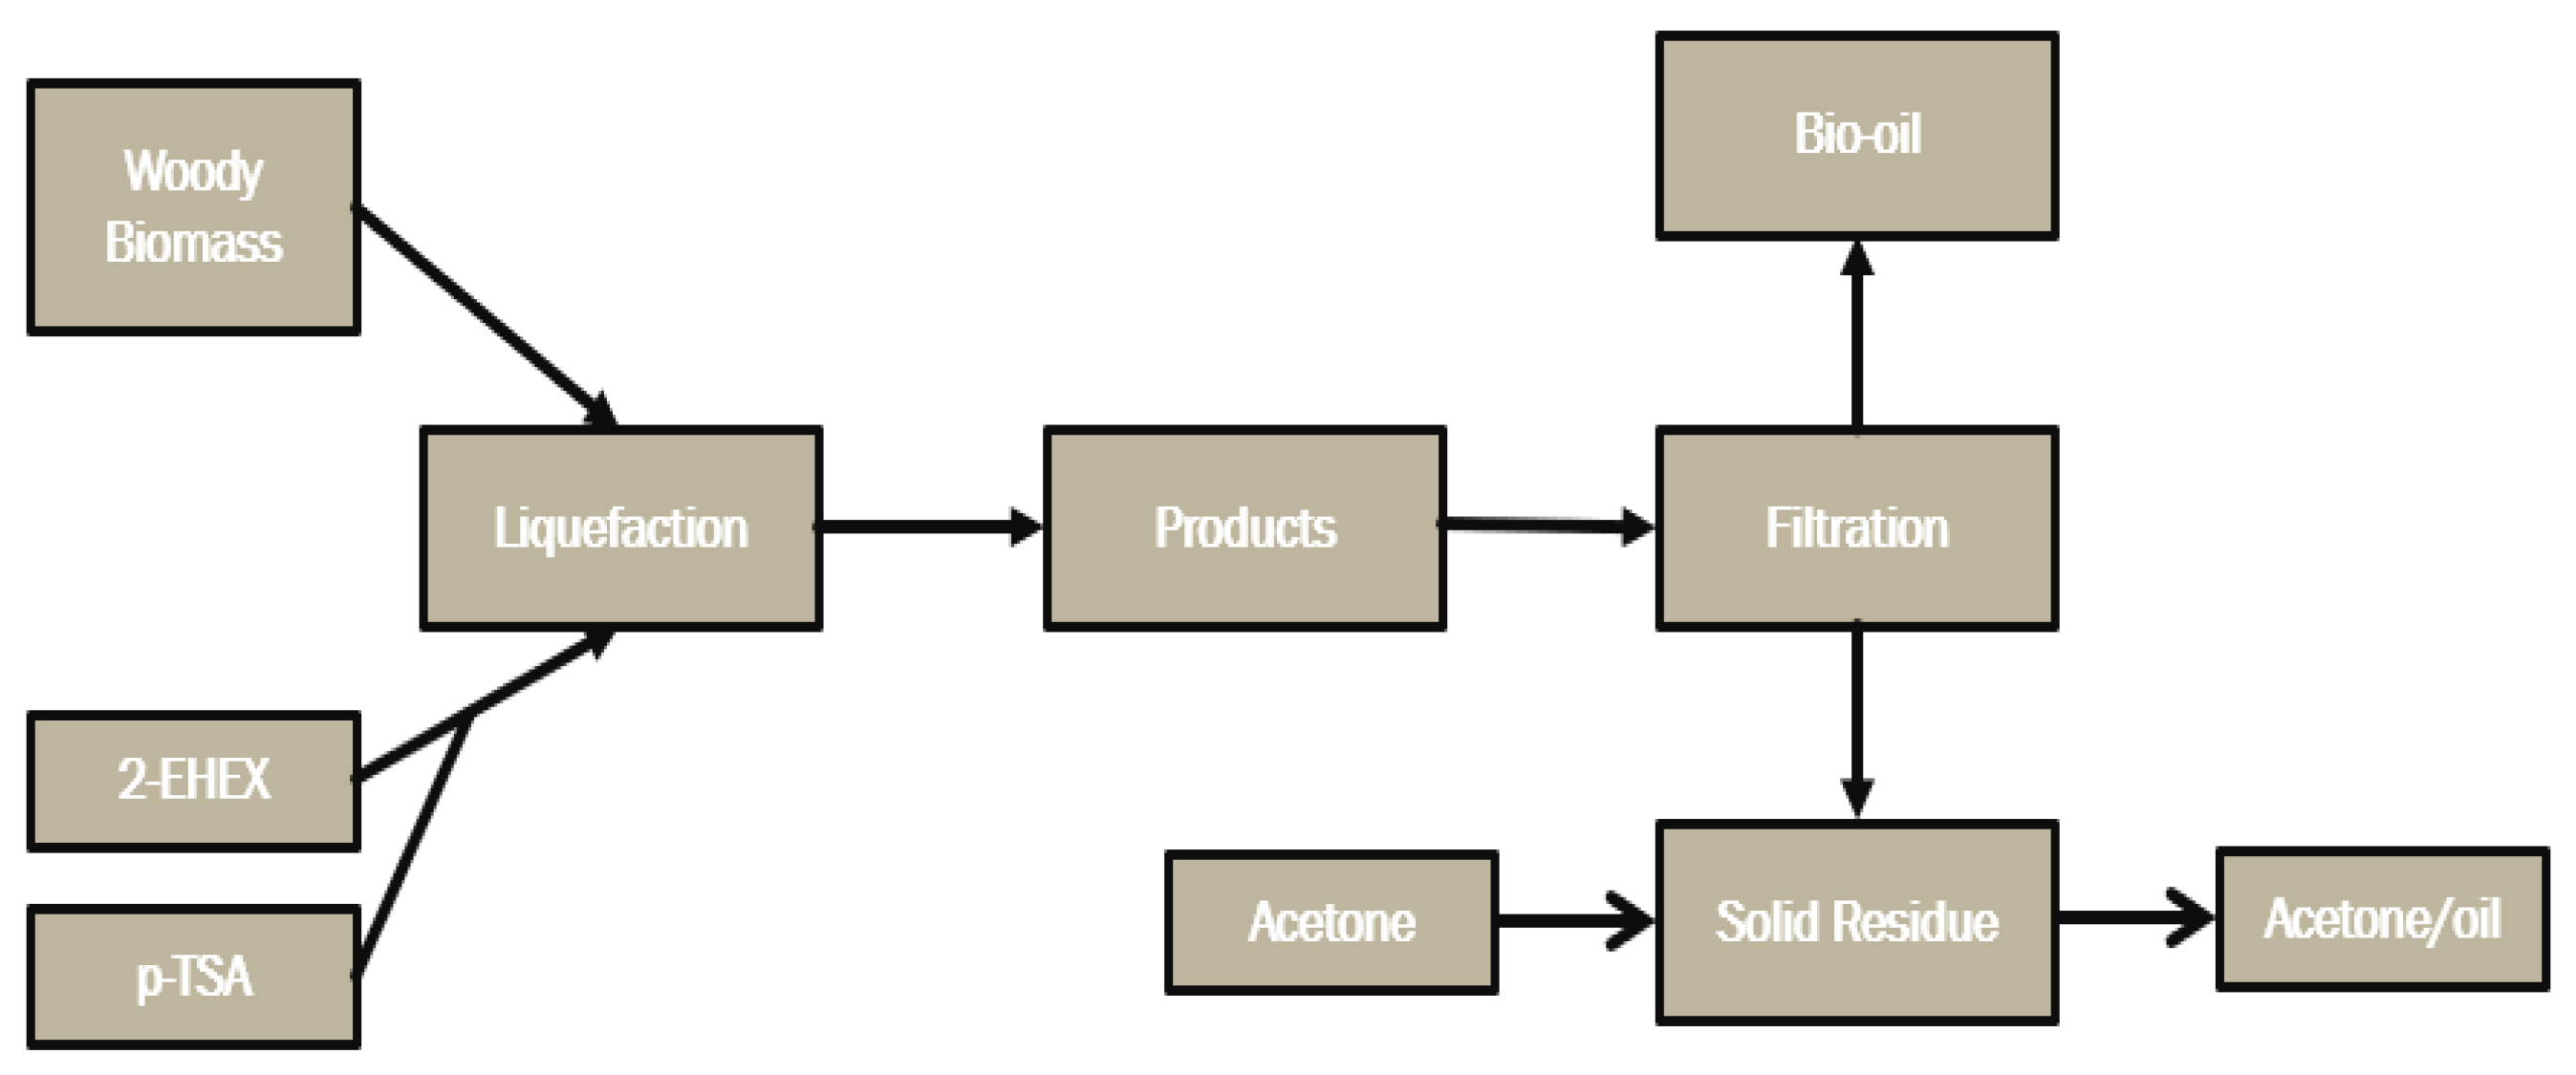
The procedure was performed at 160 °C during 90 min with a feed ratio between biomass and solvent (B:S) of 1:5, 2-EHEX was used as the solvent, and the catalyst (pTSA) mass was fed as 3% (m/m) of overall mass, and the feedstock used were standard wood chips. A process map describing the liquefaction process is shown in Figure 2.

Figure 2.
Process map of thermochemical liquefaction reaction of forestry biomass.
The procedure comprised using a moderate acid catalyst, and the process consisted of three different temperatures, 100, 135, and 170 °C, and at 30-, 115-, and 200-min periods. A three-neck glass reactor was used for the reaction, and the catalyst concentration was varied between 0.5%, 5.25%, and 10% (m/m) relative to the total mass. A Dean–Stark condenser was connected to one of the necks, and a thermocouple was placed in the other neck. When the mixture reached the determined temperature, the zero time (t = 0) was set. Water evaporates during the liquefaction process, which may potentially contain solvents. To maintain the concentration, the evaporated water taken from the reactor was reintroduced into the reactor. When the temperature reached 40 °C, the liquid part of the mixture was separated from the residue. The residue was washed with acetone, dried in a 100 °C oven, and weighed. Following the liquefaction process, the glass reactor was left to cool before vacuum filtering was applied using a BUCHI V-700 (Flawil, Switzerland) vacuum pump. Following the extraction of the bio-oil, the bio-oil residue was eliminated from the solid residue by washing it with acetone.
The liquefaction yield was determined according to Equation (1) as follows:
where msolid is the mass of solid residue after filtration and minitial is the initial mass (g).
2.3. Fourier-Transformed Infrared (FTIR-ATR) Analysis
The FTIR-ATR analysis was carried out with a Spectrum Two-Perkin Elmer (Waltham, MA, USA) apparatus. Spectra were collected between 600 and 4000 cm−1 wavenumbers using Perkin Elmer-Spectrum 10 IR software to determine the standard fingerprint region of the lignocellulosic material.
2.4. Ultimate Analysis and Higher Heating Value (HHV)
Ultimate analysis of the bio-oil sample with the best liquefaction yield, biochar, and fresh biomass was performed by an Elemental Micro Analyzer, Velp Scientifica EMA 502 (Usmate, Italy) to obtain the chemical composition respecting carbon (C), hydrogen (H), sulphur (S), and nitrogen (N).
The oxygen content was determined in accordance with Equation (2), as follows:
Also, a higher heating value (HHV) of the bio-oil sample was obtained using a correlation developed by Mateus et al. [23], via Equation (3):
The energy densification ratio (EDR in MJ/kg) values were determined according to Equation (4) [23], and higher heating values of the biomass and bio-oil samples are displayed in Table 1.

Table 1.
Elemental analysis results of the fresh biomass.
2.5. Thermogravimetric Analysis (TGA)
Hitachi-STA7200 (Tokyo, Japan) equipment was used in non-sealed aluminium crucibles to perform thermogravimetric analysis (TGA) on biochar and bio-oil samples at temperatures ranging from 30–600 °C in an N2 atmosphere with a flow rate of 200 mL/min and a heating rate of 5 °C/min.
2.6. Scanning Electron Microscopy (SEM) Analysis
Before and after the thermochemical liquefaction procedure, scanning electron microscopy (SEM) analysis was performed in order to detect morphological changes in the acacia wood chips. A microscope, the Phenom ProX G6 from ThermoFisher Scientific (Waltham, MA, USA), was used, with a low vacuum detector and an operating pressure of around 60 Pa.
2.7. Response Surface Methodology (RSM) and Statical Analysis
Response surface methodology (RSM) is a successful method for development, improvement, and optimization operations based on experimental data obtained at different levels on a set of input variables. It enables the assessment of each parameter’s impact and the parameters’ significant interactions [24]. It optimizes nonlinear systems in comparison to conventional experimental design techniques, enabling more accurate estimation of principal and interaction effects by regression fitting. For carrying out experiments, analysing connections between independent variables and responses, and creating models, it is a particular collection of statistical design combinations and numerical optimization methods [25]. There are three basic steps in the RSM approach. The experiment needs to be designed first, and then the coefficients of a mathematical model are estimated using the experimental data. In order to verify the model’s accuracy, the reaction is predicted and compared to the experimental results [26].
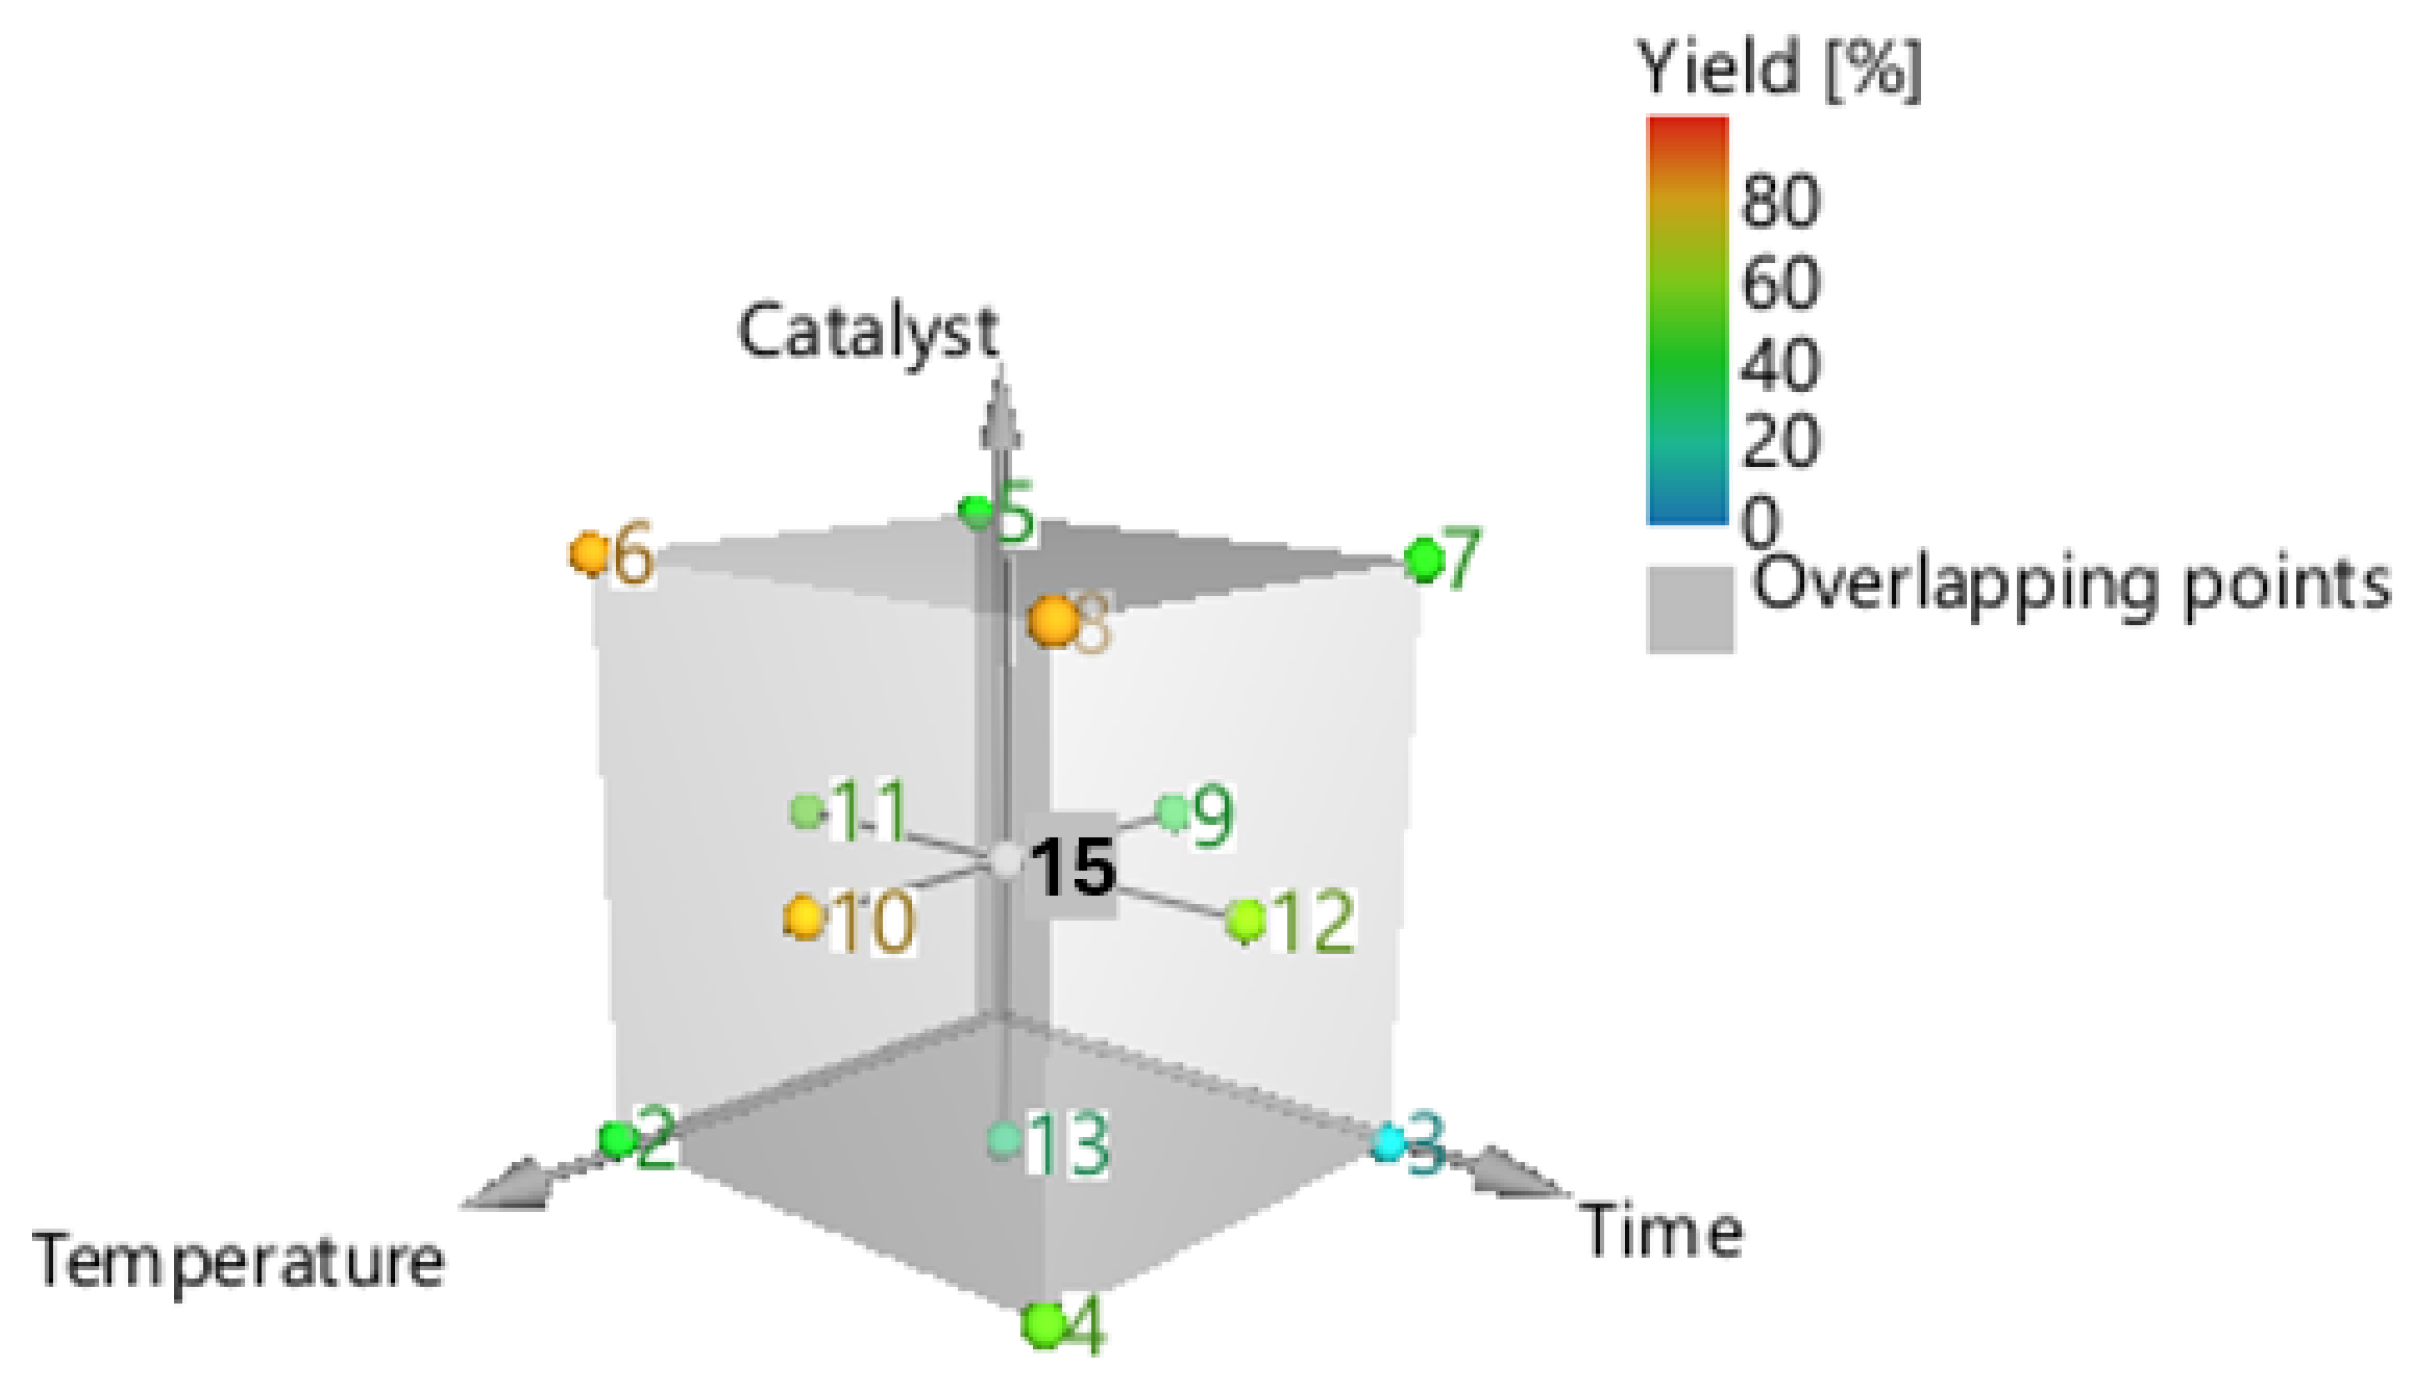
This paper aims to conduct a more systematic analysis using an RSM experiment to explore the effects and interactions of the three key and independent experimental variables, such as reaction temperature (x1), reaction time (x2), and catalyst concentration (x3). The factorial design applied was a central composite face-centred (CCF) design (Figure 3). The design included three duplicates of the cube’s central point (0,0,0), one experiment for each cube’s vertices (factorial points), face-centred (axial points), and a total of 17 experimental sites. The three variables—temperature, duration time, and catalyst concentration—were coded and varied from 100 to 170 °C, 30 to 200 min, and 0.5 to 10% w/w, respectively. The response of the conversion (Y, %), which is a function of these three parameters, is given by Equation (5), as follows [24]:
where Y is the response of the model and xn the independent variable, commonly referred to as factors [26].
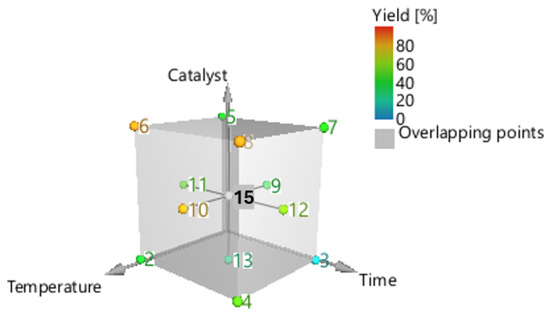
Figure 3.
Central composite face centre designs for the optimization of acacia wood chip liquefaction.
The experimental results were fitted using multiple linear regression (MLR) techniques. An overview and forecasting model for the variations in the factors was created using a second-order polynomial, as shown in Equation (6) [27], as follows:
whereas Y indicates the predicted response, β0, βi, βii, and βij signify the regression coefficient for intersection, linear, square, and interaction effects, respectively, ε represents a random error, and Xi and Xj are dimensionless coded estimators of independent factors. The experimental design was developed using the software MODDE Pro version 12.1 (Umetrics AB, Umea, Sweden).
3. Results
3.1. Chemical Analysis of Biomass
The moisture of the biomass was determined before the liquefaction process took place, and the moisture content of the feedstock was determined to be 8.04%. In addition, the contents of carbon, hydrogen, and oxygen are shown in Table 1.
The results show that carbon, hydrogen, and oxygen vary between 47.44%, 5.79%, and 46.77%, respectively, whereas nitrogen and sulphur content were below the detection limit. As a result, these components can be eliminated, as explained by other authors [28]. The HHV value of the used biomass feedstock was 18.82 MJ/kg.
3.2. Biomass Thermochemical Liquefaction
The objective of the current study was to assess and model acacia wood chips, namely, Acacia melanoxylon wood chips from Parques de Sintra, Monte da Lua, in Sintra, Portugal. The data on the thermochemical liquefaction reactions of acacia wood chips are presented on Table 2.
Table 2.
Thermochemical liquefaction reactions of acacia wood chips.
Acacia wood chip samples were subjected to the liquefaction process under various conditions in order to assess the impact of biomass valorization on process yield and model the liquefaction of acacia wood chips. Under 100, 135, and 170 °C, the reaction lasted between 30 and 200 min. Table 3 presents the results, showing that the best conversion liquefaction was 83.29% at 170 °C and 30 min of reaction time, and the worst yield value for liquefaction was 12.93% at 100 °C and 200 min of reaction time. It is possible to conclude that under particular conditions, Acacia melanoxylon, as biomass, produced an ideal liquefaction yield.
Table 3.
Coefficient values for the obtained model.
The results showed that the liquefaction yield was similar to other studies performed by using pTSA as the acid catalyst [8]. The crystallinity of pTSA, in contrast, is lower than that of the commercially available mineral acids. Because pTSA has a low proportion of crystallinity, it may liquefy organic sulfonic acid more effectively than other acids, such as sulphuric and hydrochloric acid [29]. It seems appropriate to presume that higher temperatures have a positive impact on the liquefaction yield. The formation of a solid residue following maximum conversion results in an increase in the insoluble solid fraction. These compounds, also known as tar type and humin content, are frequently linked to reactions of recondensation of decomposition products. The yields of the liquid fraction are reduced as a result of this occurrence. The residue of biomass continues to liquefy during extended reactions, boosting the conversion [30].
Regarding the decomposition mechanism, it is thought that in holocellulose, the acidic catalyst protonates the oxygen atoms in the glycosidic bonds, which is followed by the hydrolysis of this bond followed by the formation of carbonium ions, which then react to produce smaller moieties. However, lignin behaves in a way that is comparable to how ether and ester bonds are broken during the cleavage process [31].
Low biomass conversions were observed for lower temperatures, such as 100 °C. It is easier to understand the differences in the breakdown activation energies of the feedstock’s components, hemicellulose, cellulose, and lignin when it is regarded that lignin has the greatest value, just followed by cellulose and hemicellulose. Crystalline cellulose must be taken into account because it can impact the process. Crystalline cellulose has a higher decomposition activation energy than amorphous cellulose. Low temperatures prevent the reaction’s energy from breaking the glycosidic bonds and the cellulose’s crystalline structure.
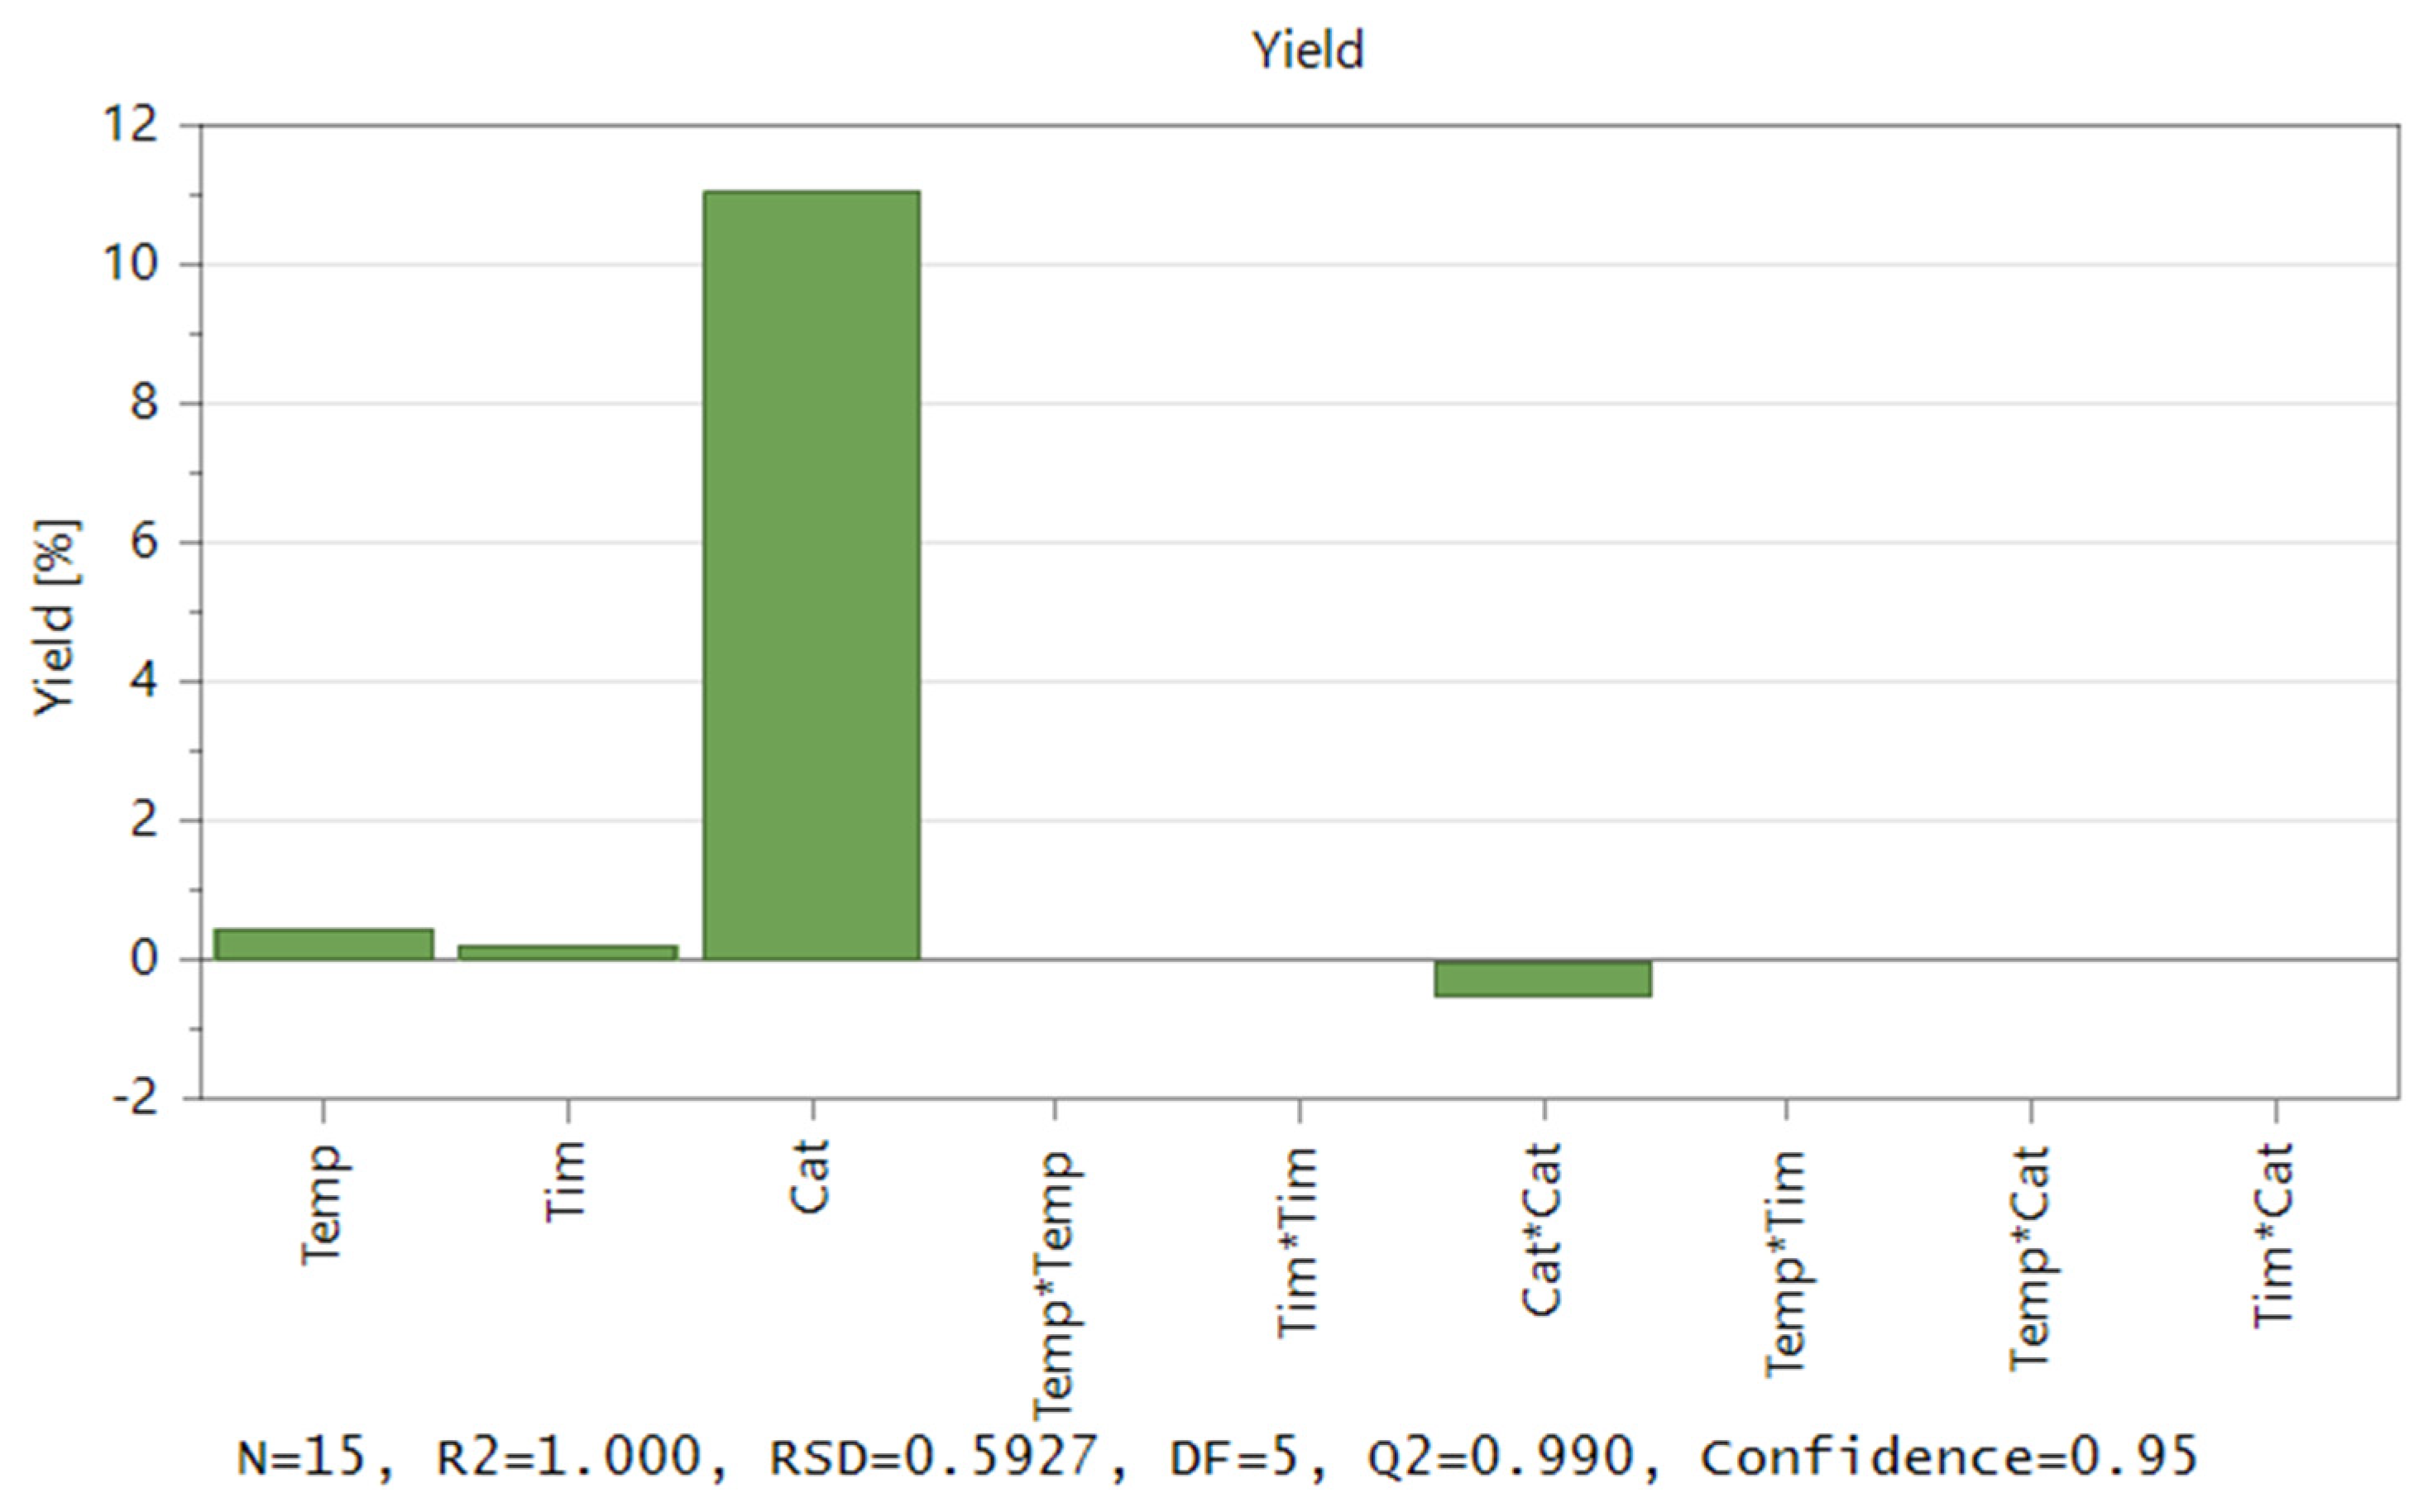
Software MODDE 12.1 Pro® was applied to develop an experimental matrix, and the central composite face-centred (CCF) design was selected. First, the effects of three variables (T, cat, and time), the second-order effects, and the interactions between the two variables (T*T), (cat*cat), (time*time), (T*cat), (T*time), and (time*cat) were estimated. Figure 4 exhibits both the correlation coefficient and the model’s coefficient plot. The effect of each variable measures the influence of its variation on the response. It should also be noted that catalyst concentration has the greatest influence on yield, whereas reaction time has a minimal impact on yield.
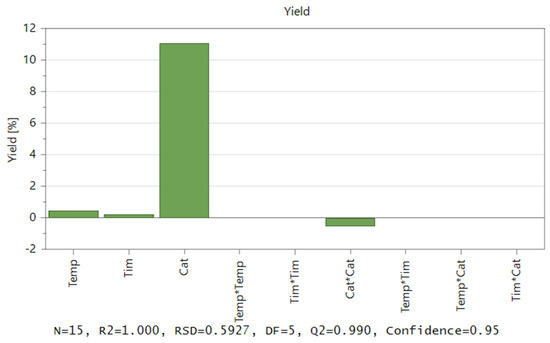
Figure 4.
Contribution of coefficients to the model regarding the liquefaction of acacia wood chips.
R2 = 1.000 indicates (Figure 4) that the derived model has a strong fit with the experimental data. This R2 value shows that independent variables, in the factor area, have the potential to account for 100% of the observations. The software demonstrates an astonishing capacity to anticipate brand-new correct responses with a 100% probability. A reliable prediction of the impact of modifying process parameters and process optimization was made possible by the Q2 value of 0.99, which is ideal >0.5. The model exhibited an excellent validity score that was far higher than the necessary value, which is 0.25. Similar to this, the reproducibility that was produced greatly outperformed the needed value, showing a high experimental control [32].
The correlation coefficients and their impact on the yield provided a basis for the regression model equation. Figure 4 shows the plot effect that was used to determine values. The influence on the yield is considered significant if the confidence interval exceeds the origin.
whereas Y corresponds to yield, X1 to the temperature, X2 to the reaction time, and X3 to the catalyst concentration.
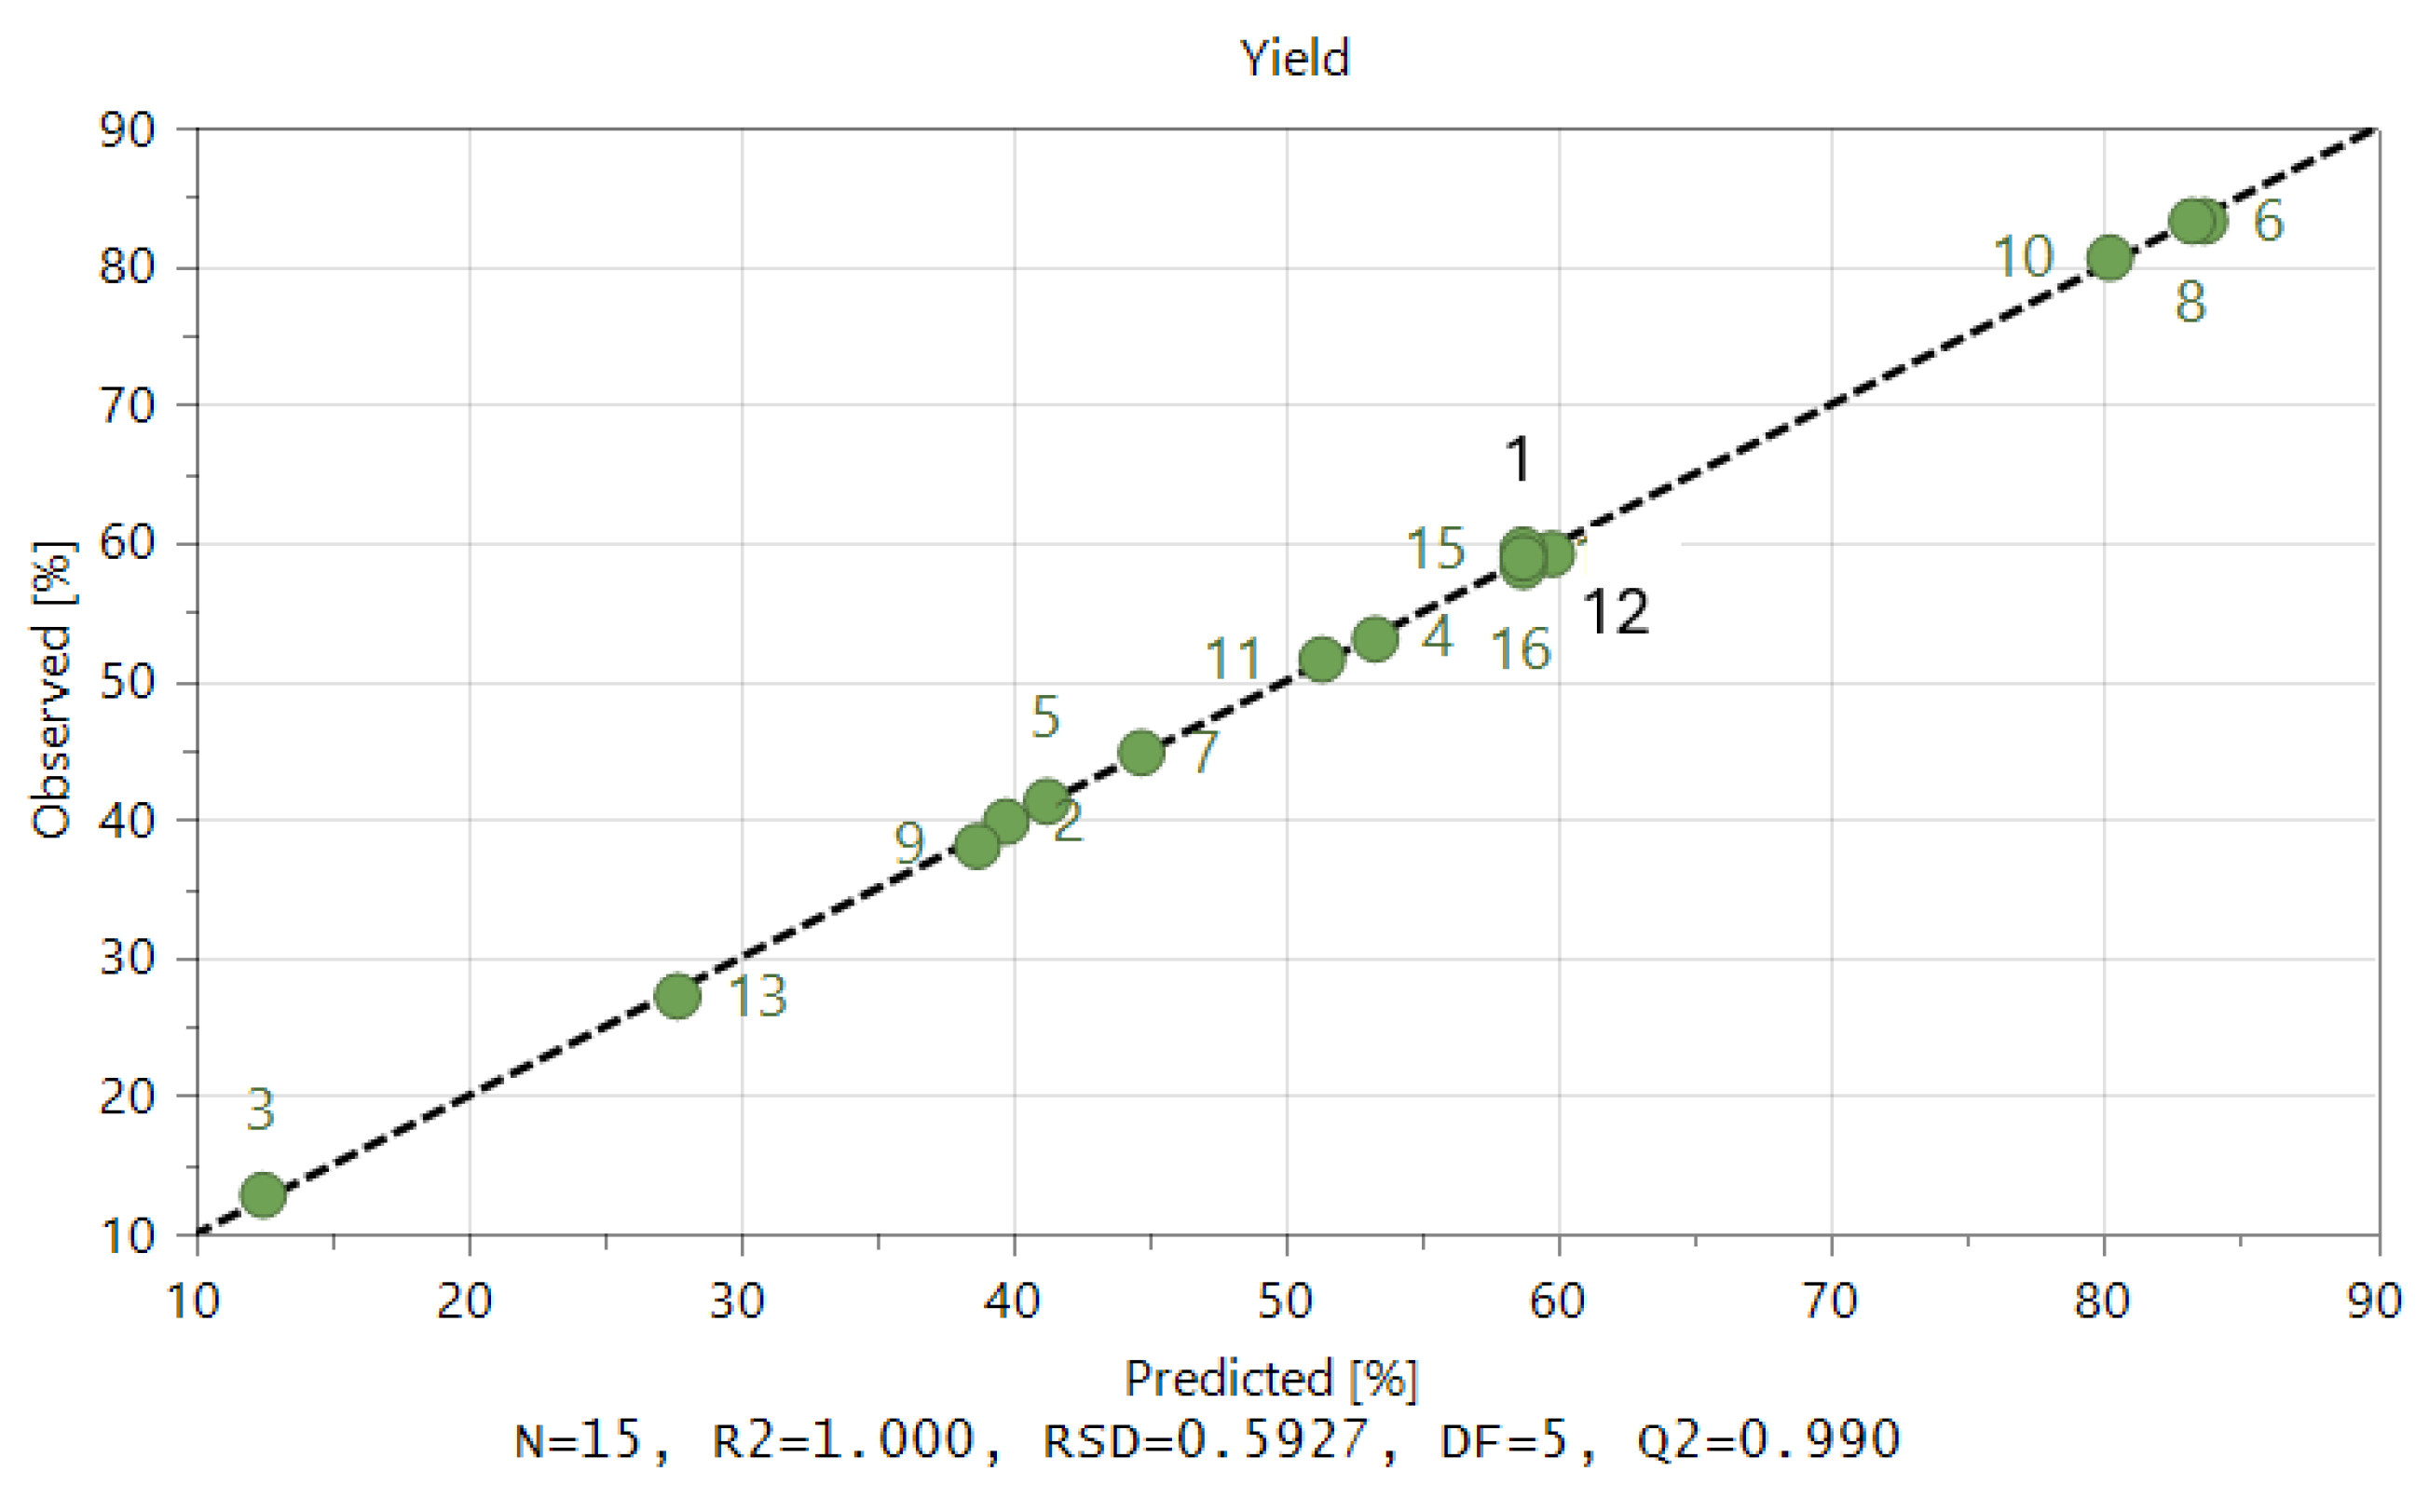
Figure 5 displays the performance of the model as provided by Equation (7) for both the calibration and validation sets. This graphic demonstrates that the calibration model created for the prediction of the liquefaction of acacia wood chips has excellent accuracy, even for such experiments conducted for various temperatures and catalyst concentrations.
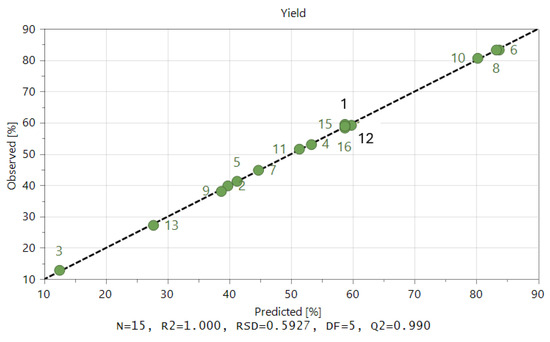
Figure 5.
Predicted versus experimental liquefaction conversion resulting from the obtained model.
Variance analysis (ANOVA) was used to evaluate the model fit and to compare it to pure error. where Y1 corresponds to yield, X1 to the temperature, X2 to the duration time, and X3 to the catalyst concentration.
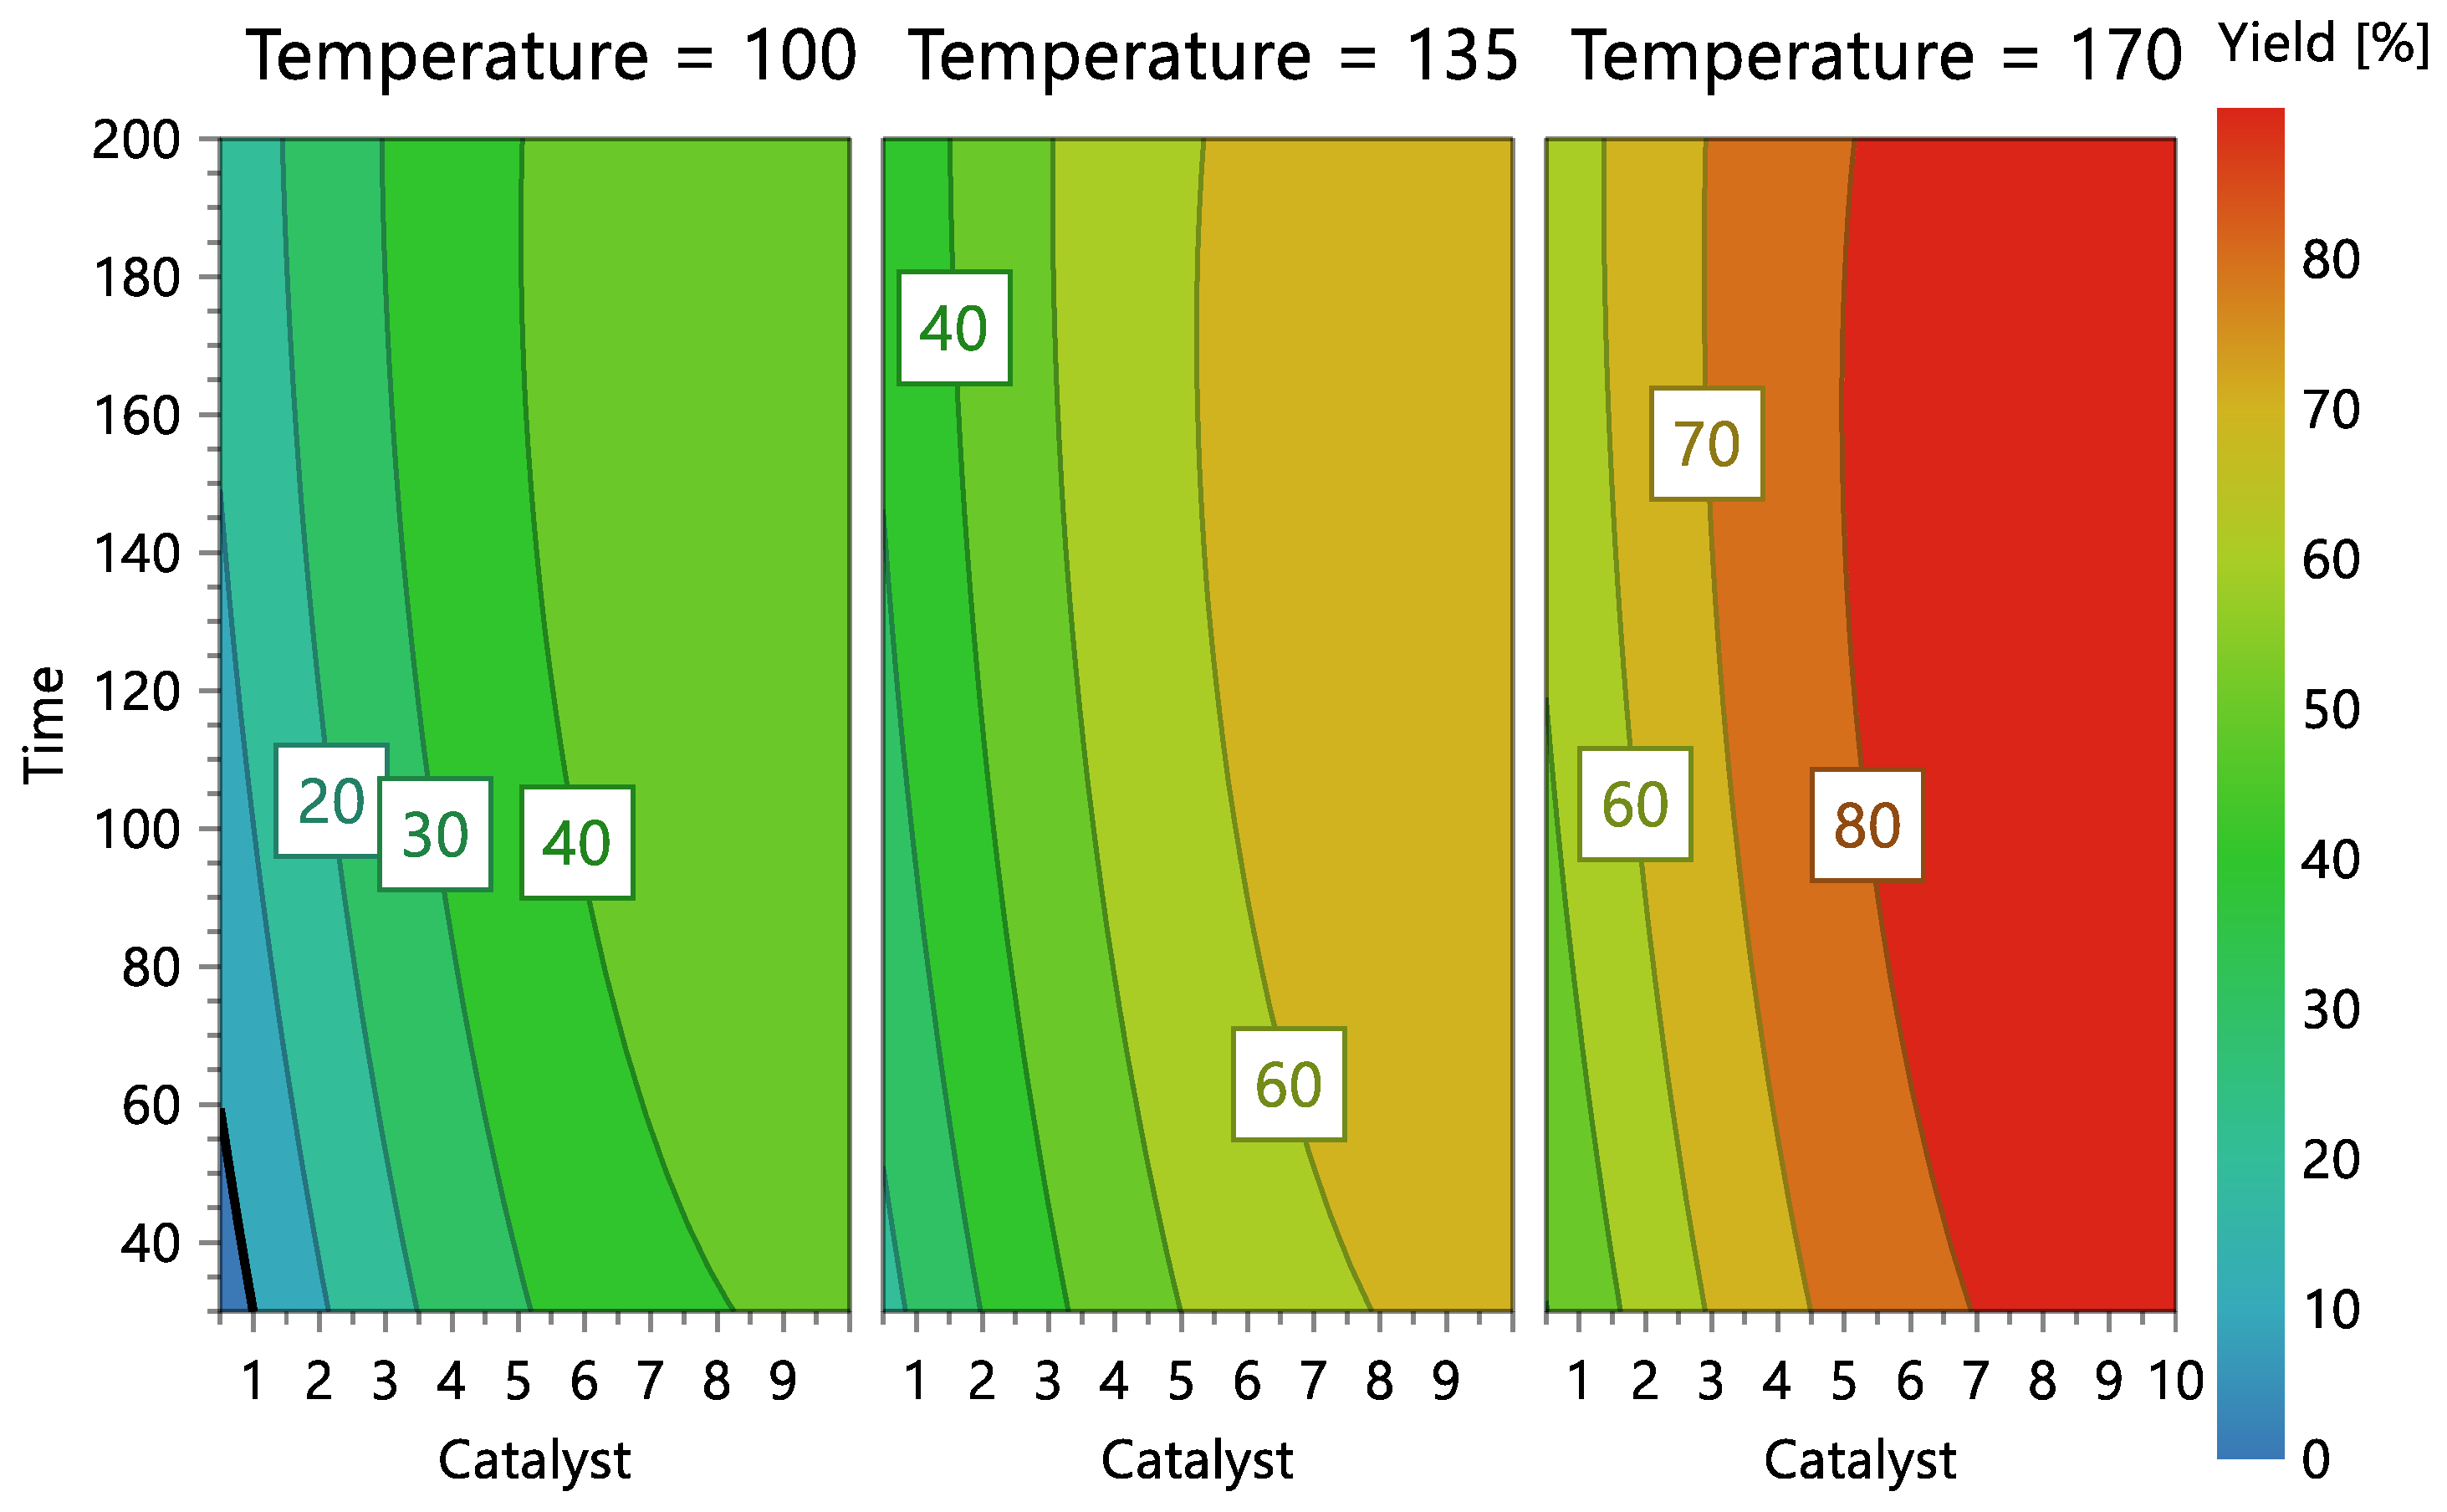
The graphical representation of the model (Figure 6 and Figure 7) shows that the ideal liquefaction conditions to maximize conversion are achieved when the acacia sample is having the reaction at 170 °C in the presence of more than 10% catalyst for more than 30 min.
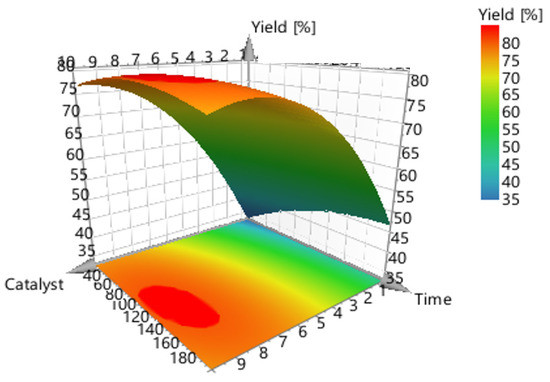
Figure 6.
3-D surface plot concerning the response (conversion, %) of catalyst concentration (m/m %) vs. reaction time (mins).

Figure 7.
Reaction contour plots according to temperature levels, catalyst concentration, and reaction time.
Figure 6 shows the model’s contour plot, which demonstrates that temperature is the most crucial element.
Figure 7 shows the model’s contour plot, which demonstrates that catalyst concentration is the most crucial element. In fact, if the catalyst concentration is used at the highest level (10%) and the highest temperature (170 °C), conversions exceeding 80% can be accomplished using a short reaction time (30 min).
3.3. Higher Heating Value (HHV) of Bio-Oil and Biochar Samples
Ultimate analysis was performed using samples of bio-oil and solid residue from the process having the highest liquefaction efficiency, and estimated HHV values were determined and is shown in Table 4. As predicted, the liquefaction process reduced the O/C ratios of bio-oil products by roughly 0.31 when compared to equivalent ratios in biomass feedstock [33,34]. Since the value of bio-oil is quite higher than that of coals and similar to that of hydrocarbons, it is challenging to identify trends in H/C ratios [33].
Table 4.
Elemental analysis of the bio-oil and biochar from the reaction with the best liquefaction yield.
The highest yield of bio-oil had an HHV of 34.31 MJ/kg, and the liquefaction procedure increased the sample’s HHV value by almost 82.28%. Considering the energy concentration ratio of 1.82, the energy gain of bio-oil is therefore obvious. This improvement is related to the loss of water and oxygen (by about 56%) during liquefaction. Higher HHV values are obtained by the thermochemical liquefaction reported in this study compared to bio-oils obtained by fast pyrolysis and other pyrolysis techniques. This occurrence in the fast pyrolysis process is explained by the higher oxygen concentration [34,35].
3.4. Scanning Electron Microscopy (SEM) Analysis of Biomass and Biochar Samples
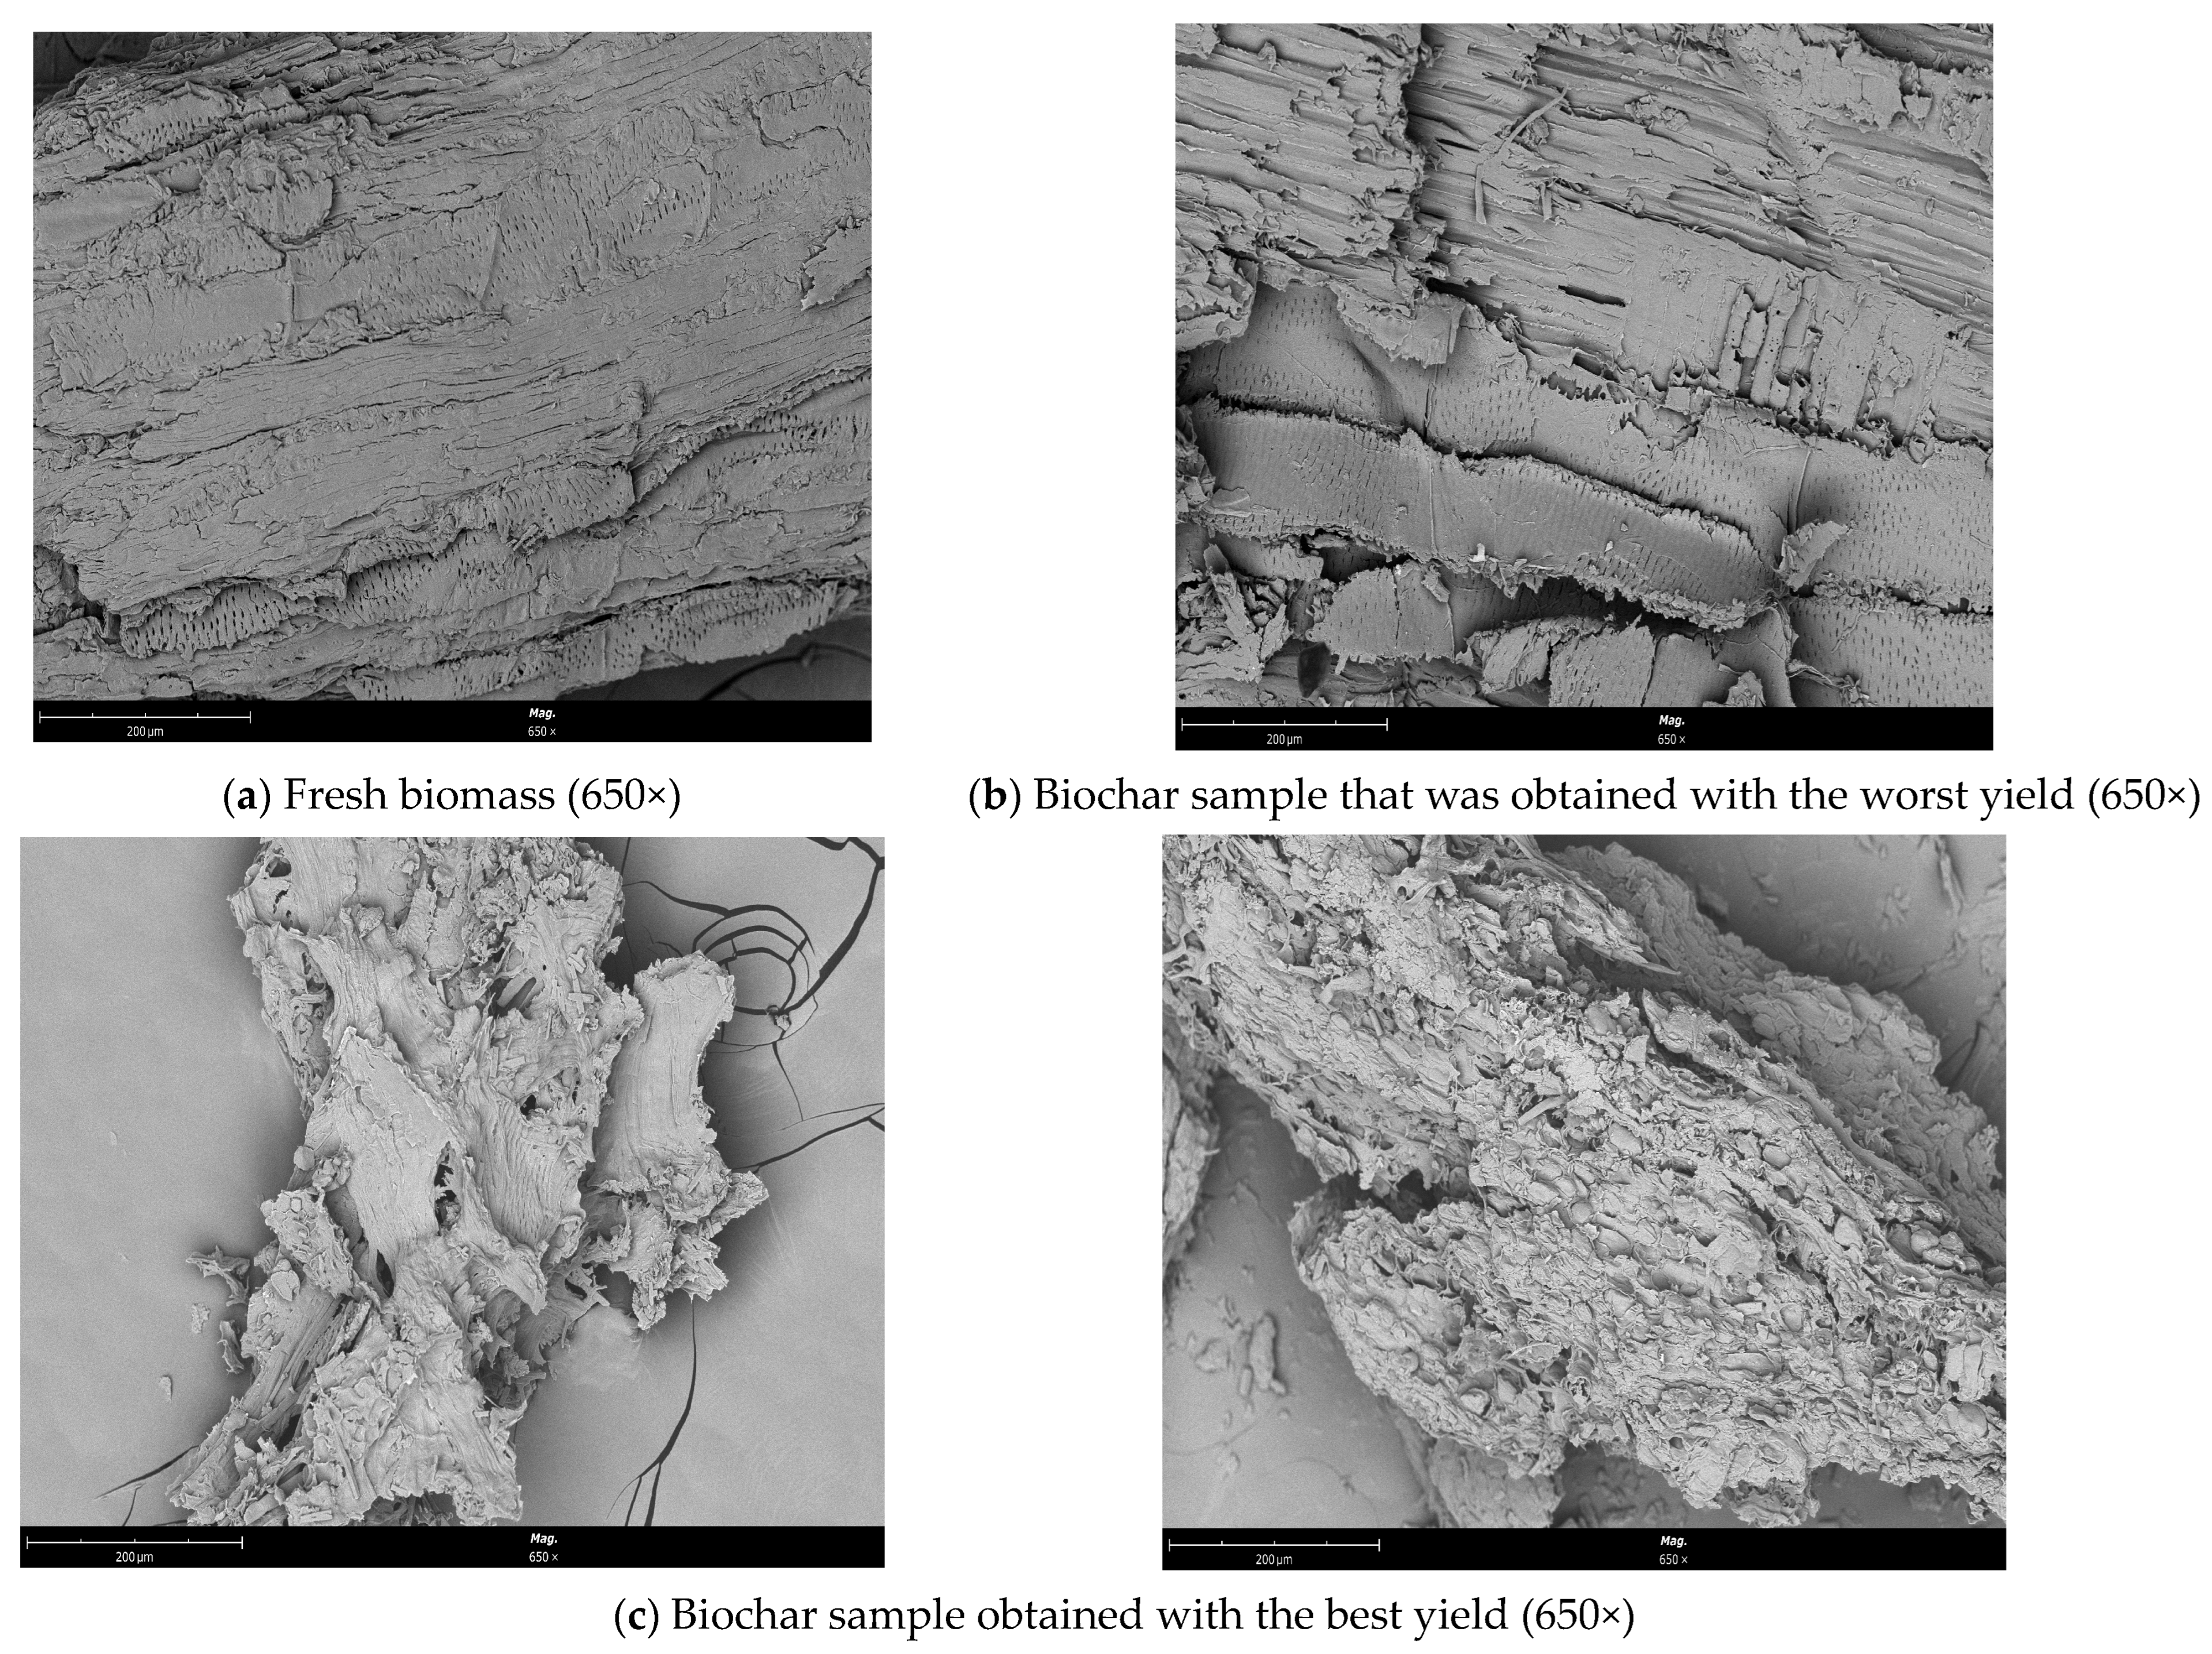
Figure 8 exhibits SEM images of fresh biomass and biochar (from the reaction with the best and worst conversions) samples that were obtained. Following the experiment at 170 °C, differences between the fresh biomass and biochar samples can be seen. After the liquefaction process, distinct modifications occurred, particularly in the sample from the reaction having the best conversion yield.
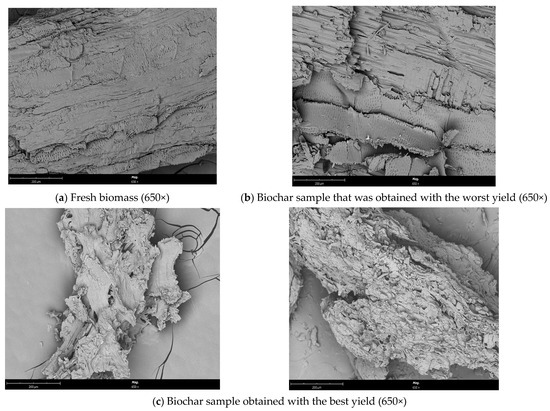
Figure 8.
SEM micrograph of (a) the fresh biomass (650×), (b) the sample that was obtained with the worst yield (650×), and (c) the biochar sample that was obtained with the best yield (650×).
Before liquefaction, biomass consists of a bunch of irregularly shaped and porous fibres to be subjected to SEM analysis to identify morphological changes [36]. The sample from the reaction having the best conversion yield became comparatively fluffy when we compared the biochar samples after the liquefaction process, and the fibres were exposed and dissociated from the original related structure. While the biomass structure appeared to have deteriorated, it was also observed that the fibre length decreased, and the biomass structure completely deteriorated. With the removal of hemicellulose and lignin, many openings of various sizes were formed on the surface [37]. However, fewer holes were found on the surface of the biochar sample that was generated from the reaction having the worst conversion efficiency than on the surface of the fresh biomass.
3.5. Fourier-Transformed Infrared (FTIR-ATR) Analysis of Biomass, Bio-Oil, and Biochar Samples
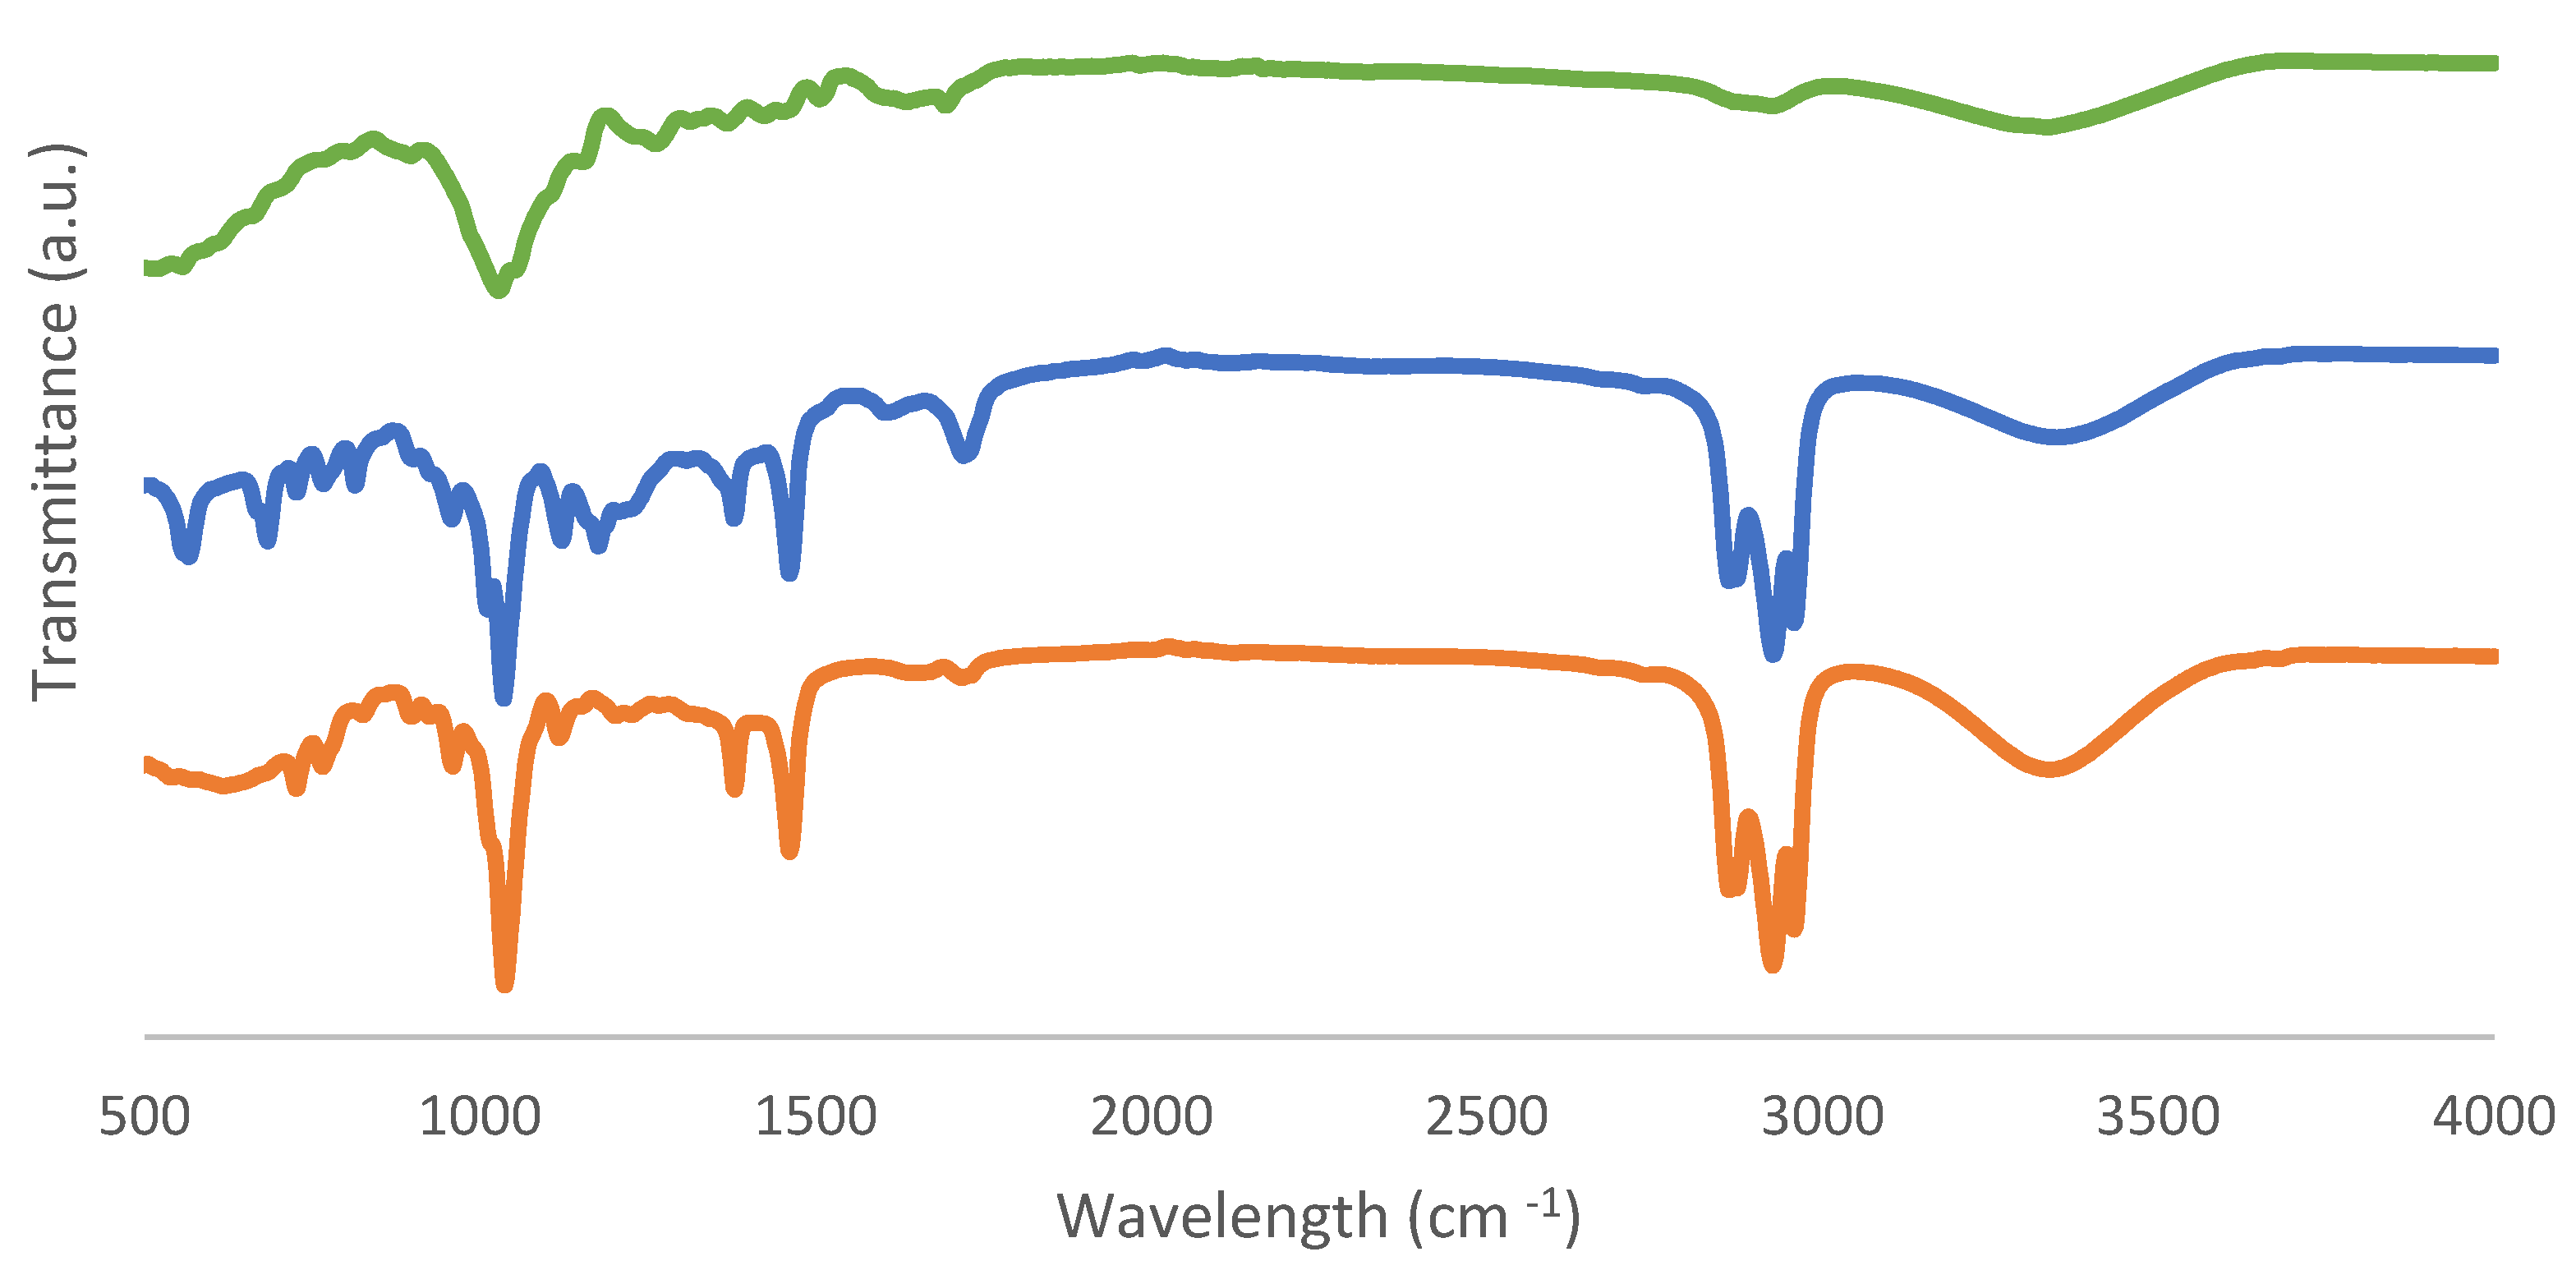
FTIR-ATR spectra obtained from fresh biomass and solid and liquid samples as biochar and bio-oil products are shown in Figure 9 and Figure 10.
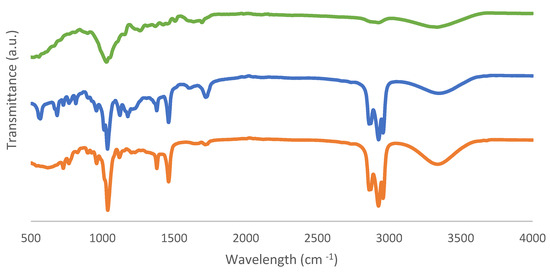
Figure 9.
FTIR-ATR spectra of (a) fresh biomass, (b) bio-oil from the sample with the best conversion, and (c) bio-oil from the sample with the worst conversion.
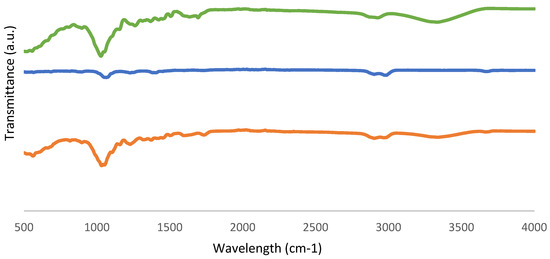
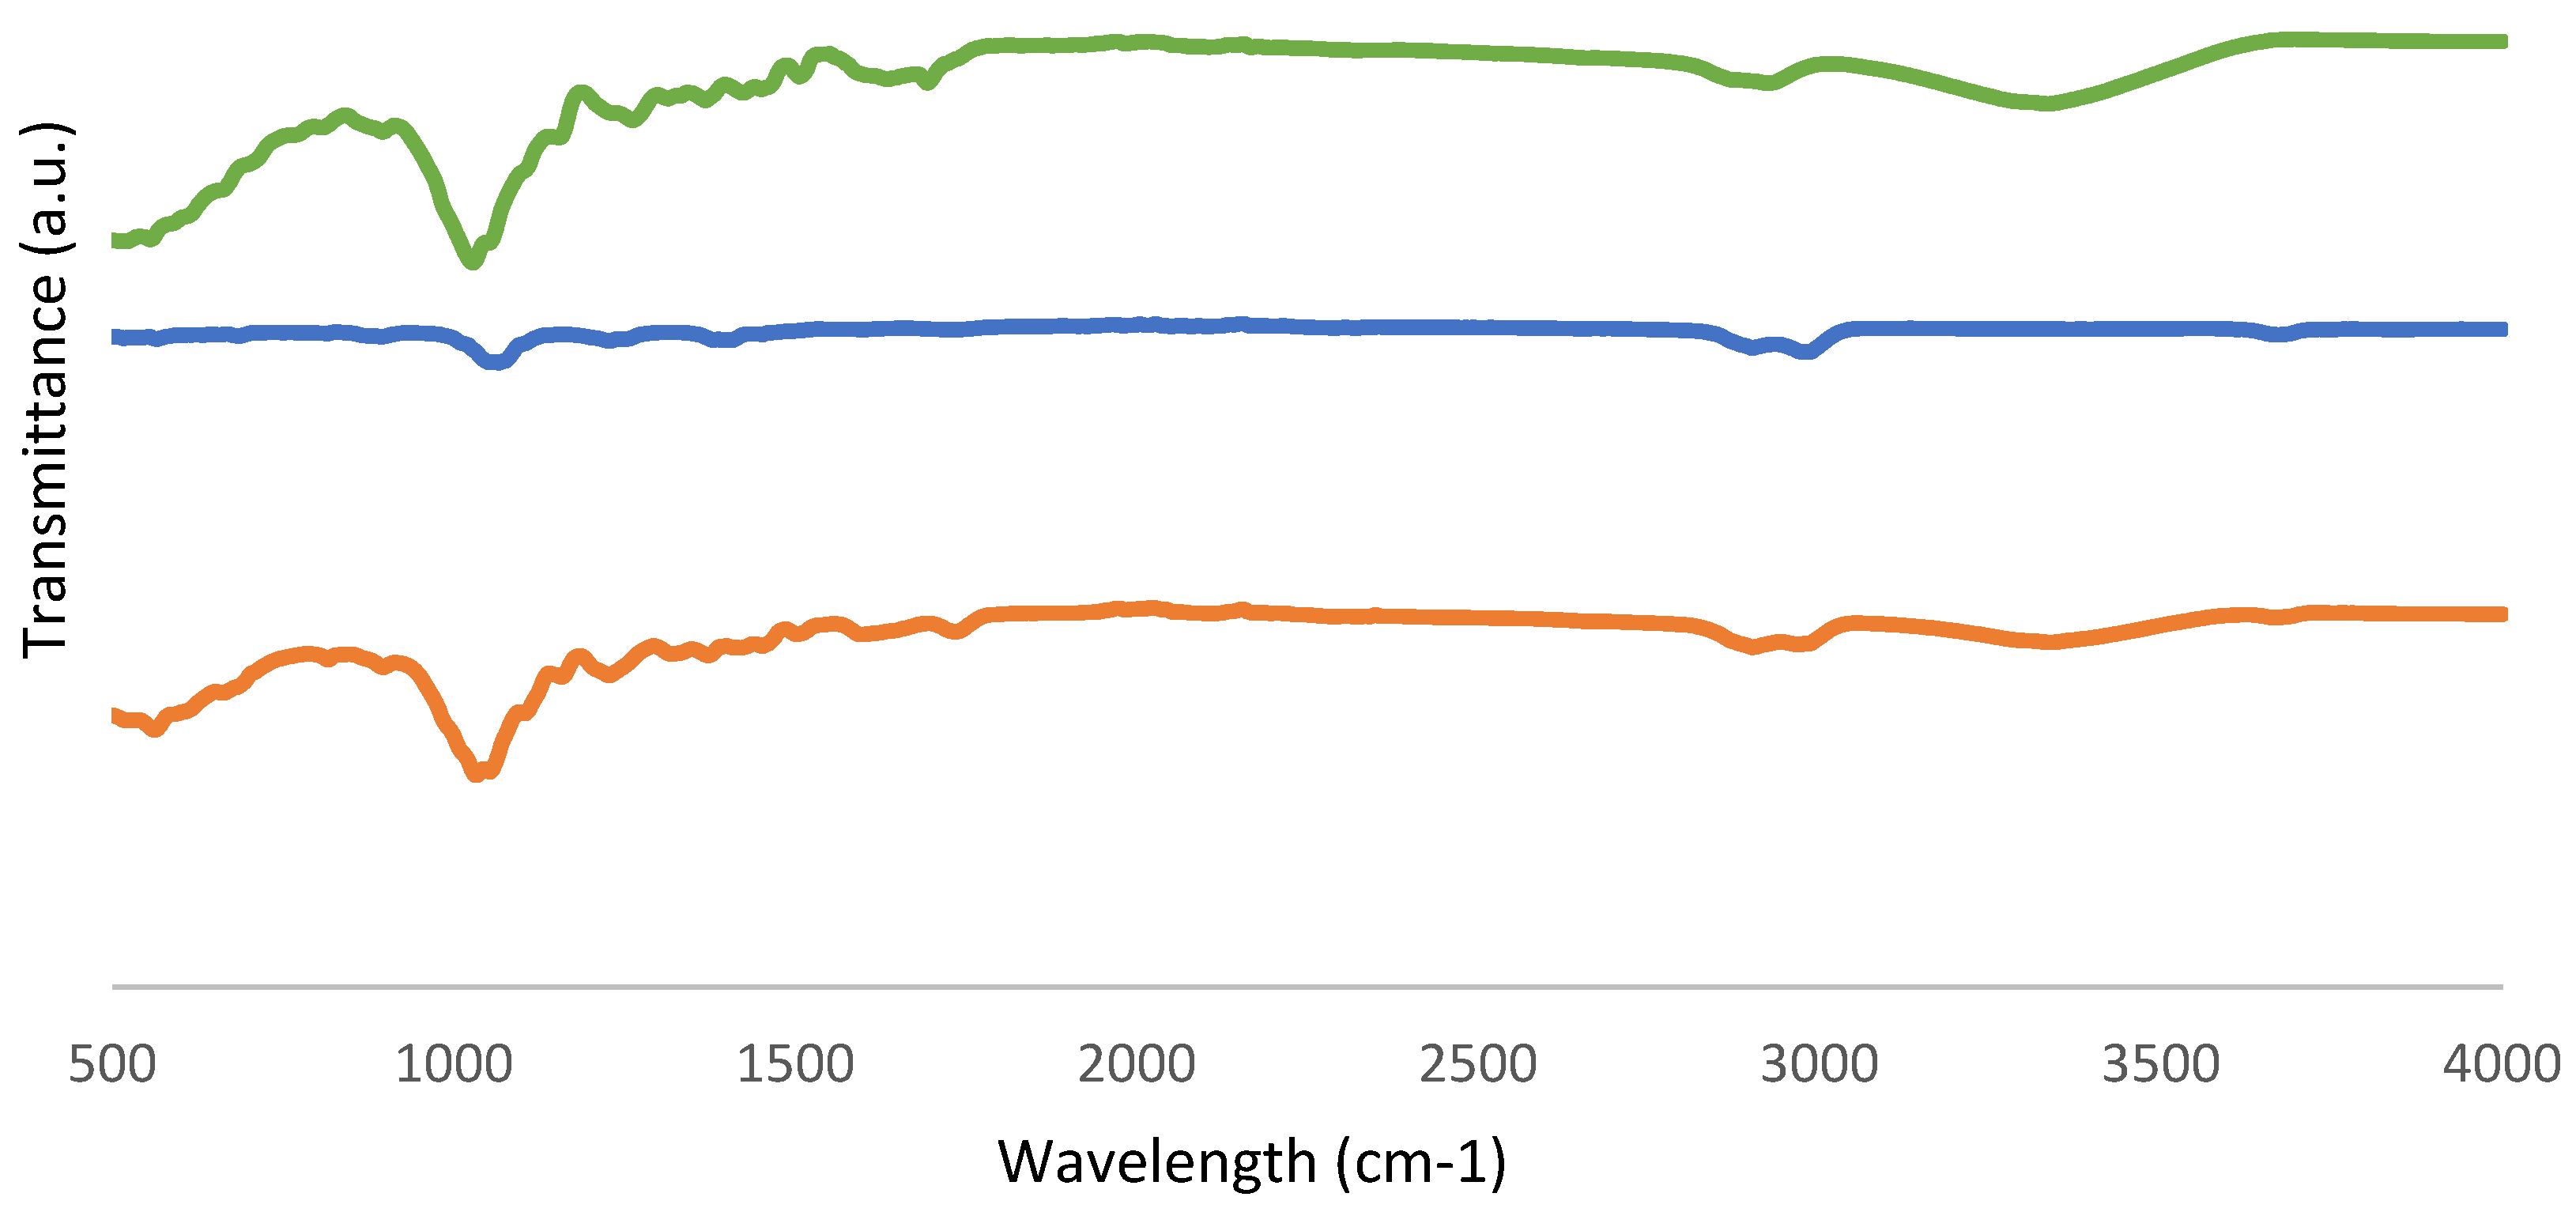
Figure 10.
FTIR-ATR spectra of (a) fresh biomass, (b) biochar from the sample with the best conversion, and (c) biochar from the sample with the worst conversion.
Table 5 displays absorption bands corresponding to the relevant peaks. The bands in the 3600–3200 cm−1 range are known as O-H stretching bonds, which can be caused by the presence of water or hydroxyl groups, according to the FTIR data. Furthermore, the peak 1633 cm−1 referred to the O-H bending of water, proving the presence of moisture as well. The stretching of the C-H molecule and the solvent 2-EHEX are both present in the 3000–2800 cm−1 region. This signal, which is associated with unconjugated ketone, ester, or carboxylic groups on aliphatic chains in liquefied biomass and is related to the conversion of hemicellulose and located in the region of 1730–1700 cm−1, then corresponds to the C=O carbonyl groups. Additionally, the C-O-H single bond, which is located in the 1440–1395 cm−1 range, could indicate the presence of derivatives from aromatic carbohydrates. The peaks that are seen for bio-oil samples, with wavenumbers of 1036–1035 cm−1 and 1118–1117 cm−1, indicate the existence of the hydroxyl group as well.
Table 5.
The main adsorption observed on FTIR spectra.
3.6. Thermogravimetric Analysis (TGA) of Biomass, Bio-Oil, and Biochar Samples
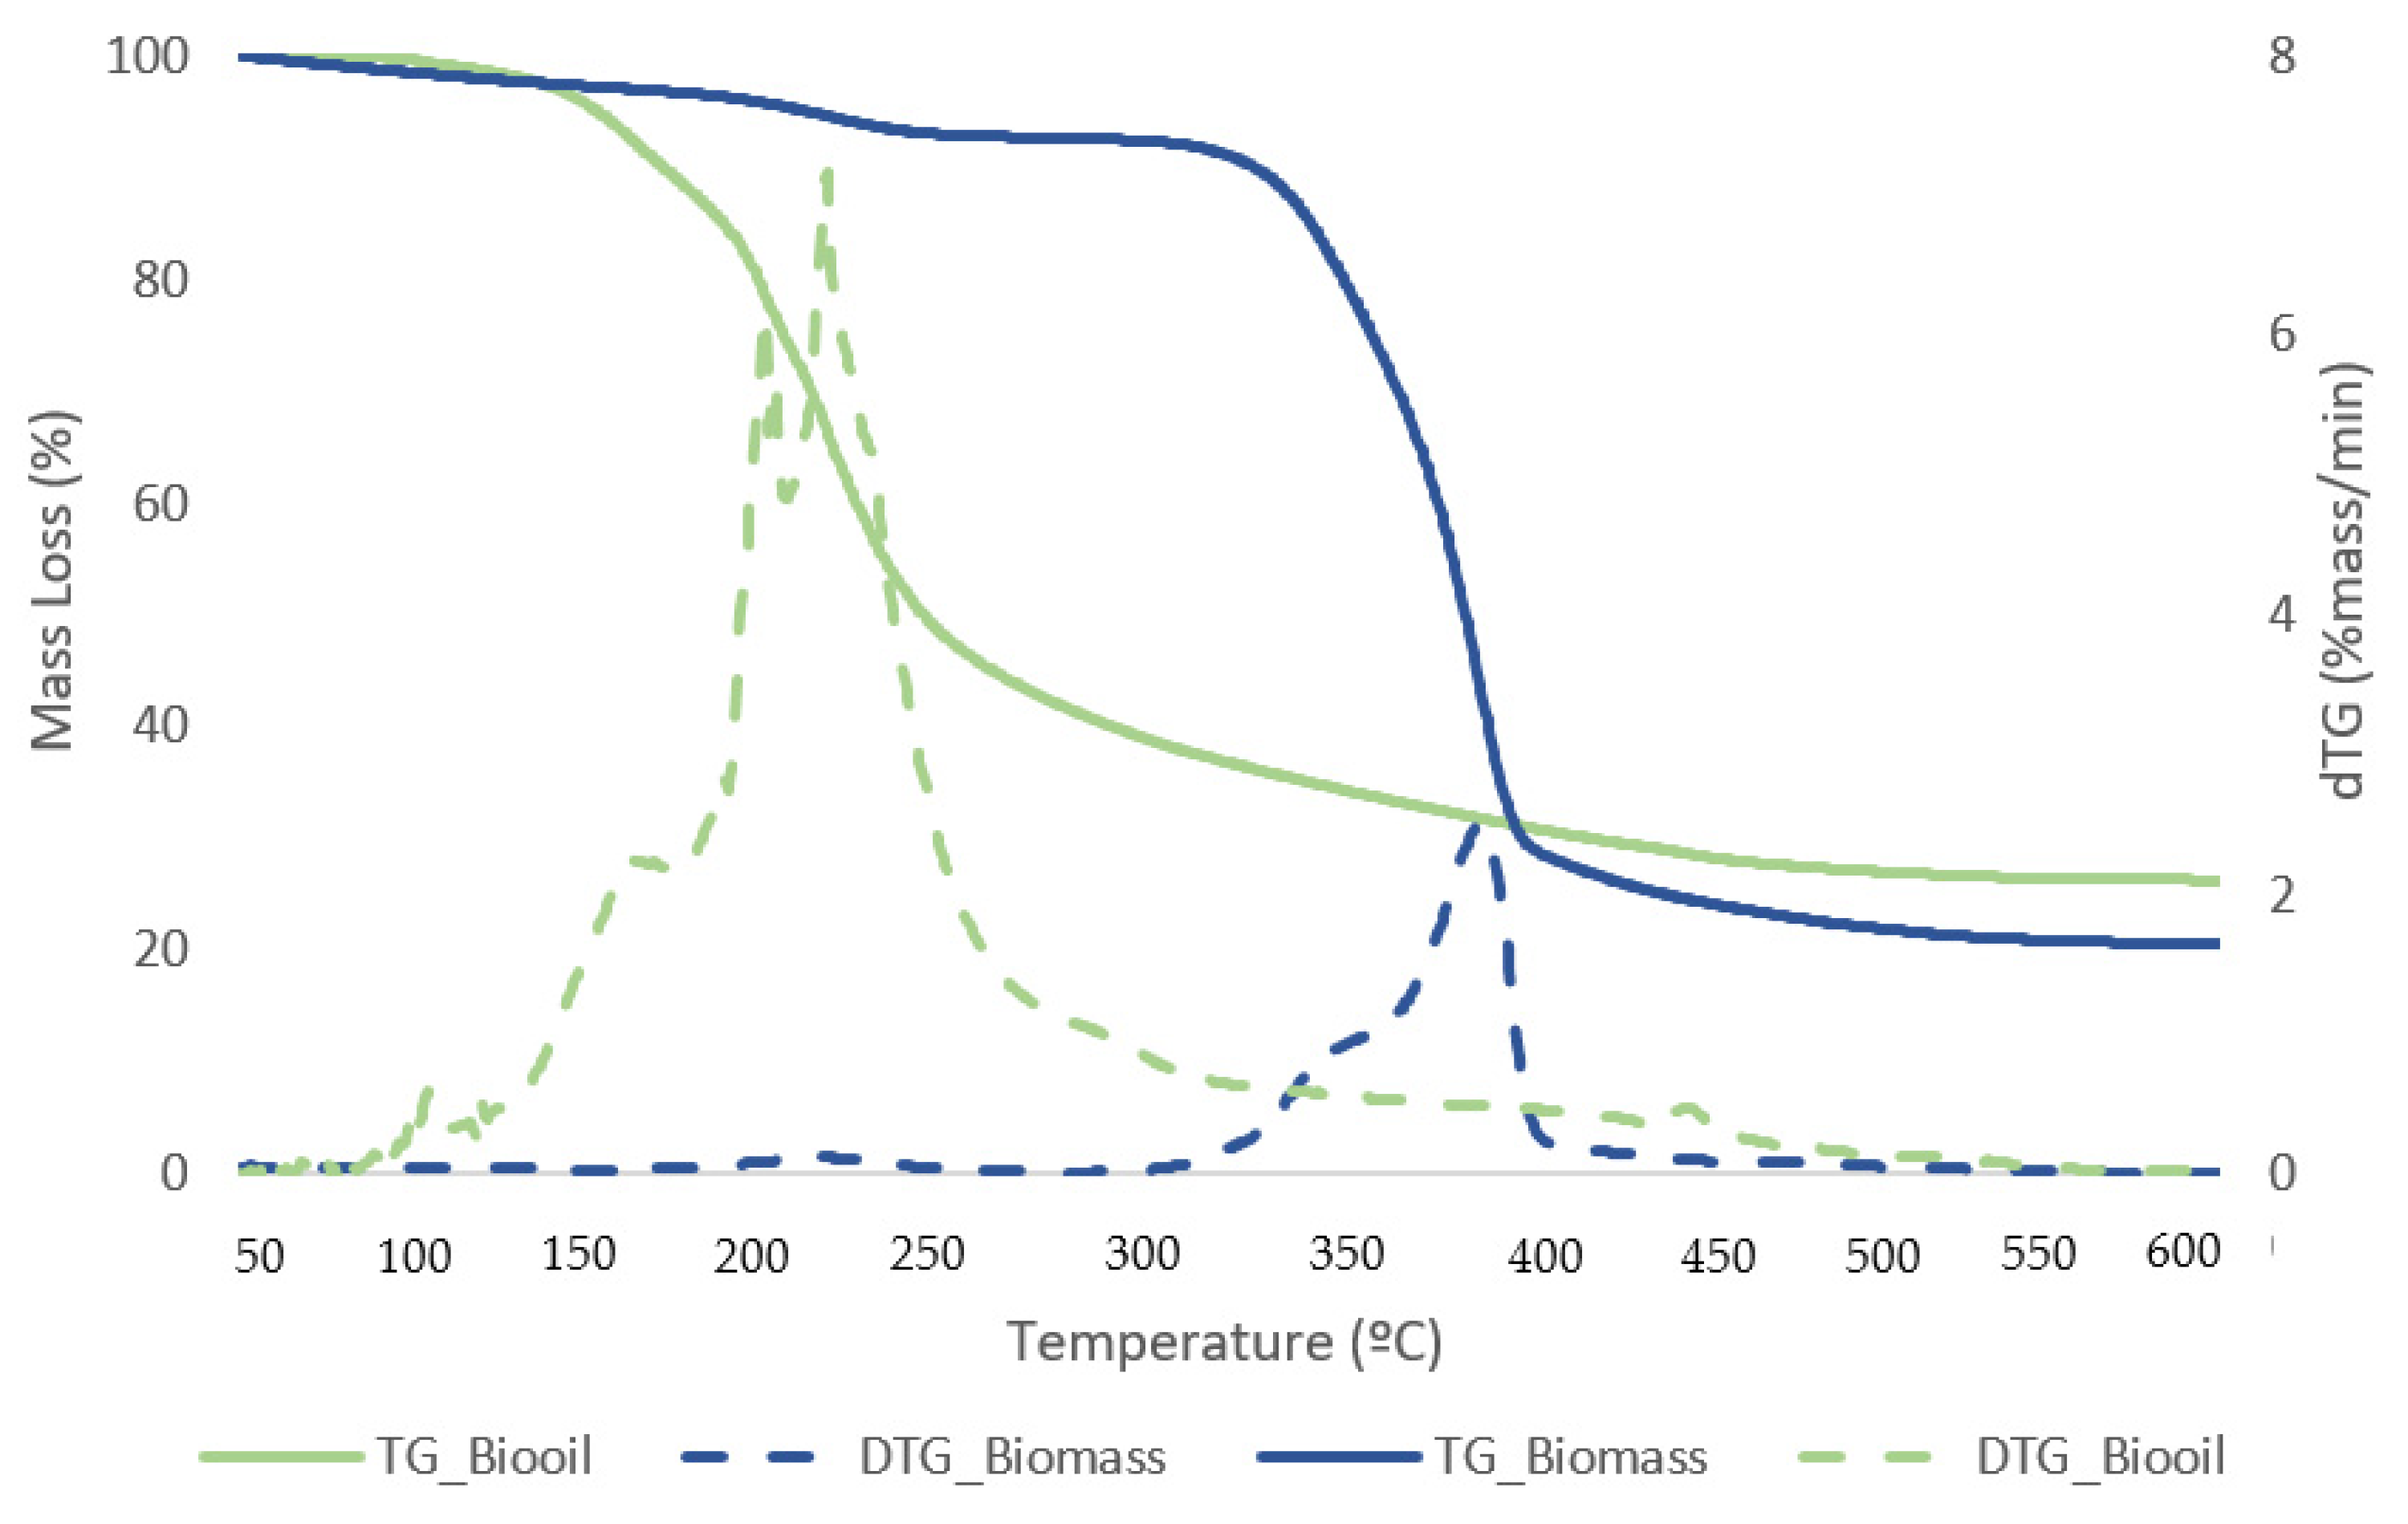
Figure 11 and Figure 12 exhibit TG curves that indicate a weight loss with temperature change for samples of biomass and bio-oil and biochar from the reaction that generated the best liquefaction yield.
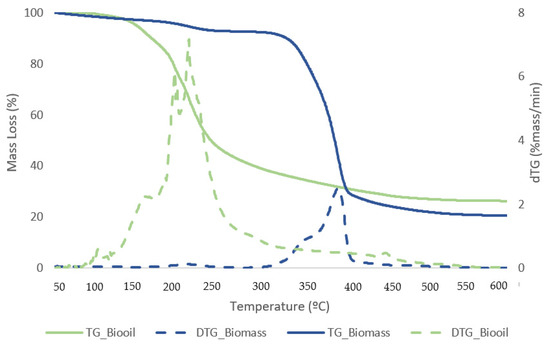
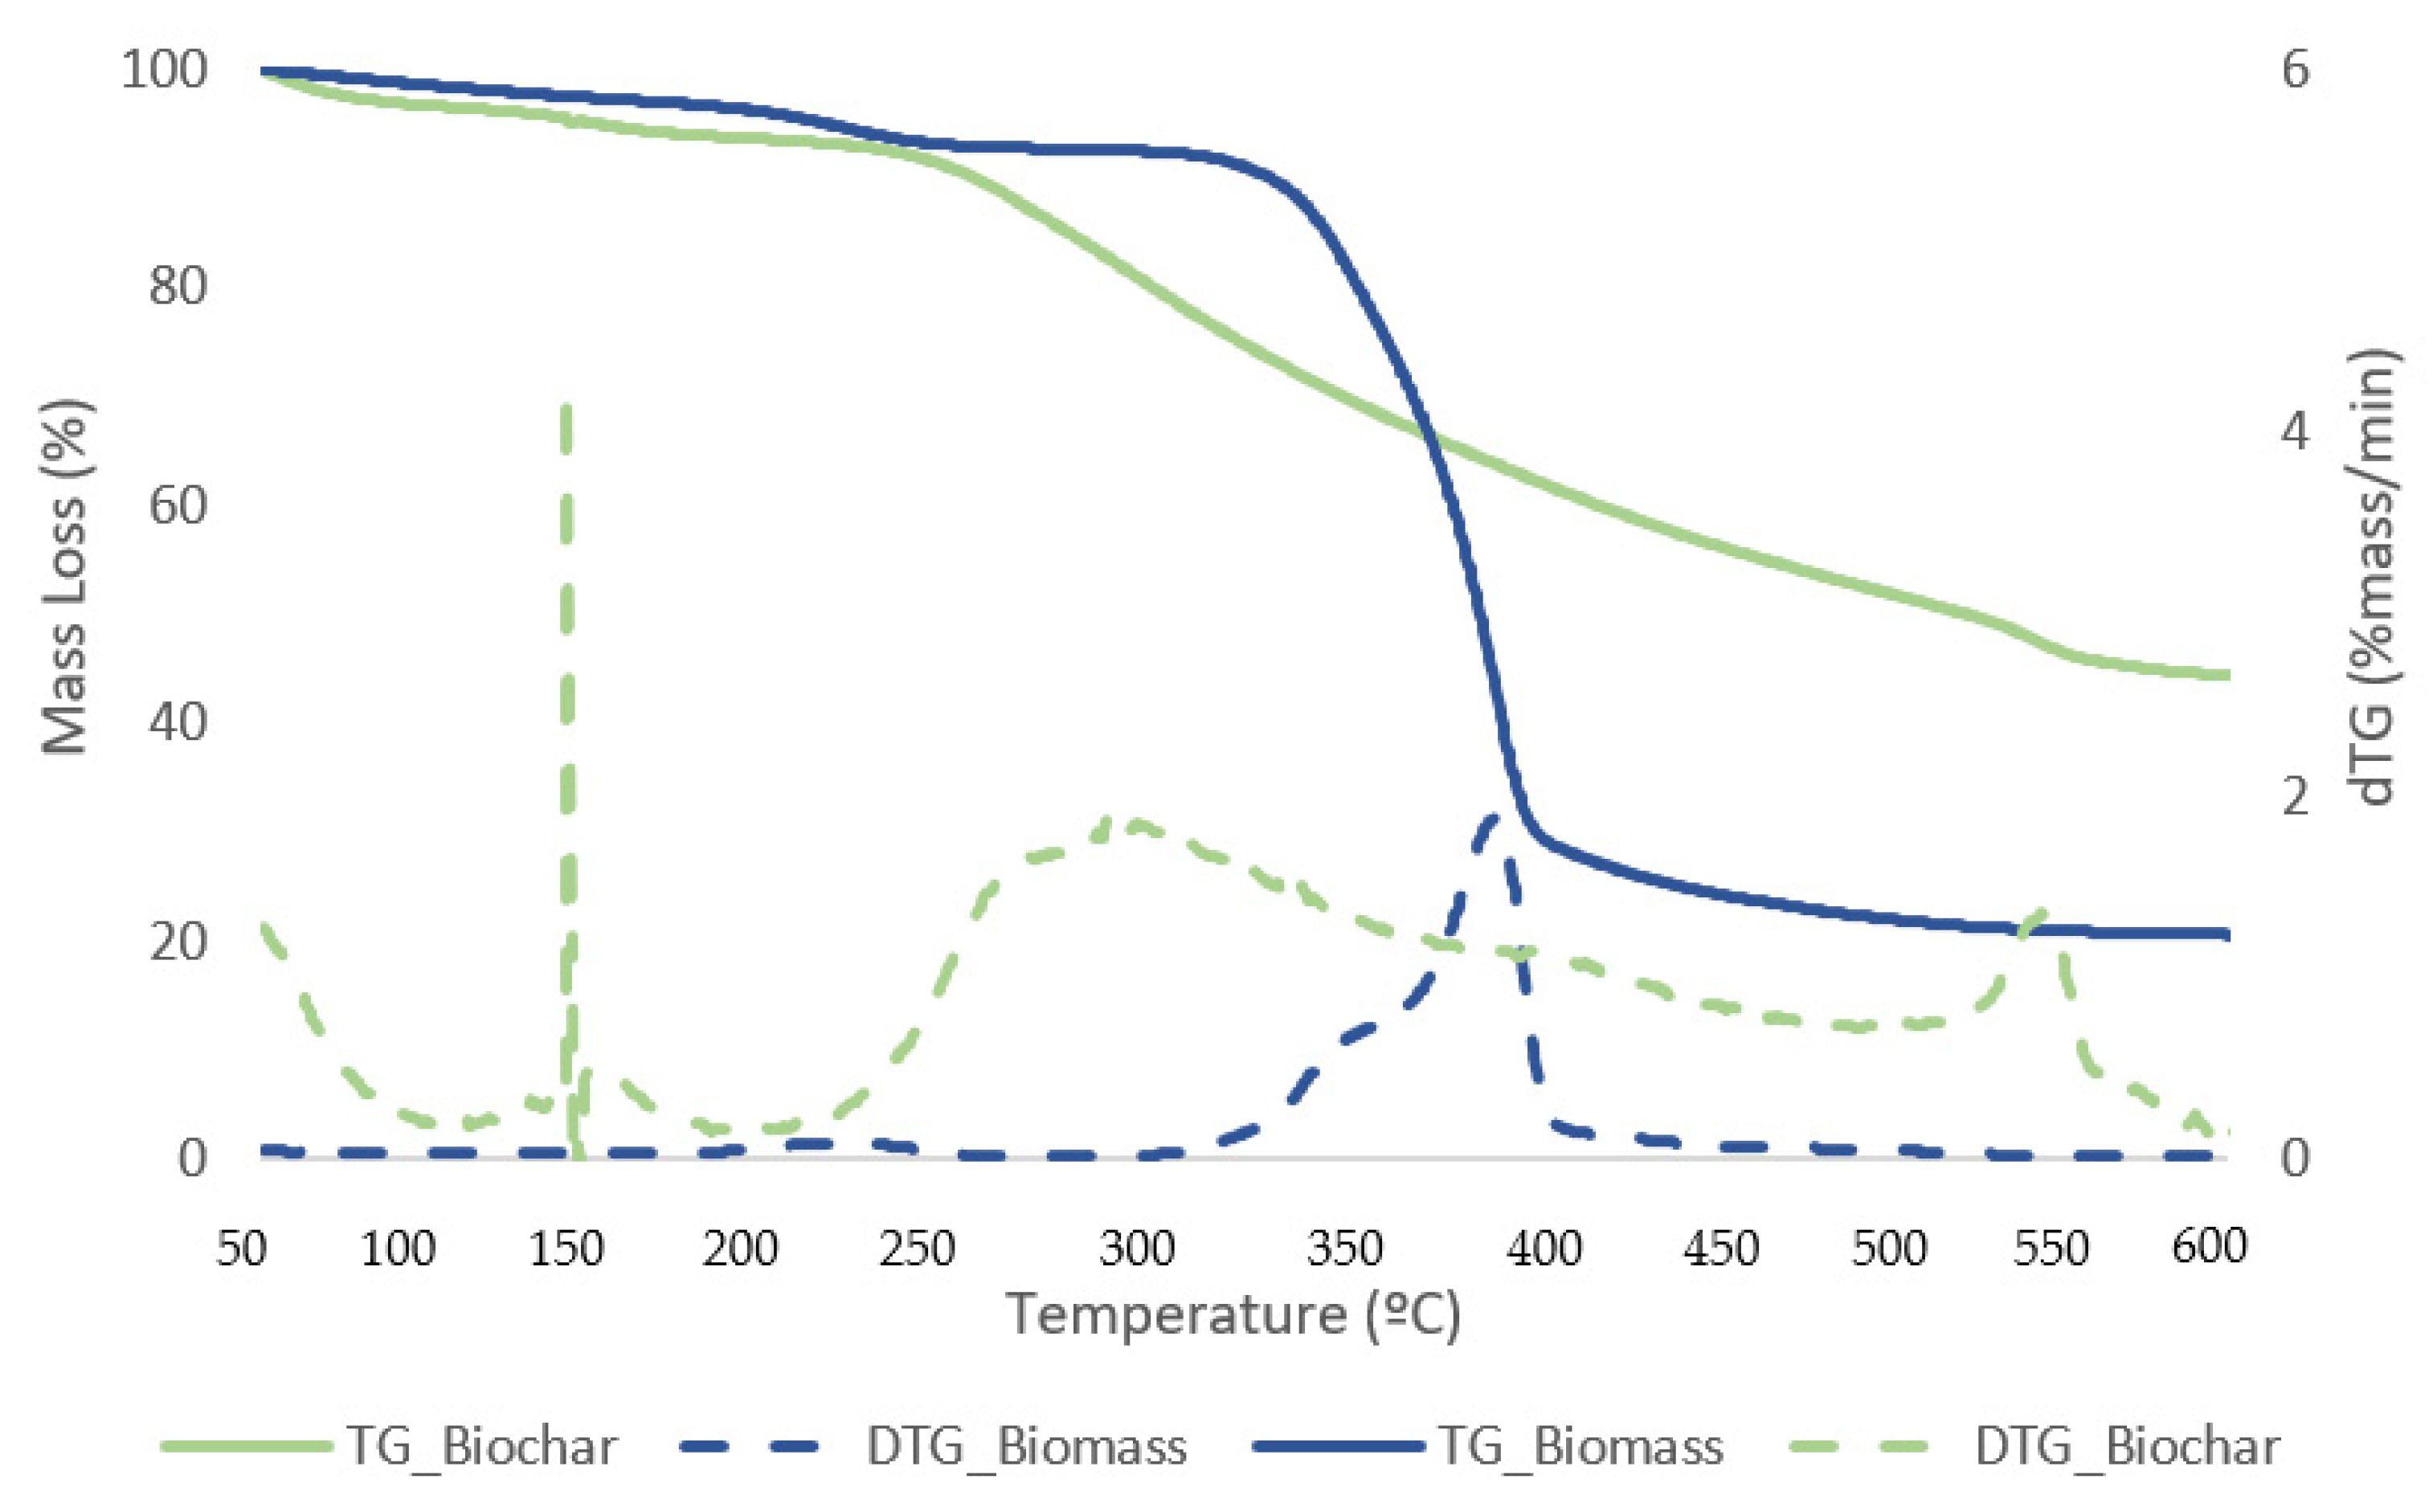
Figure 11.
TG (solid lines) and DTG (dashed lines) curves for biomass and dried bio-oil samples with the best conversion.
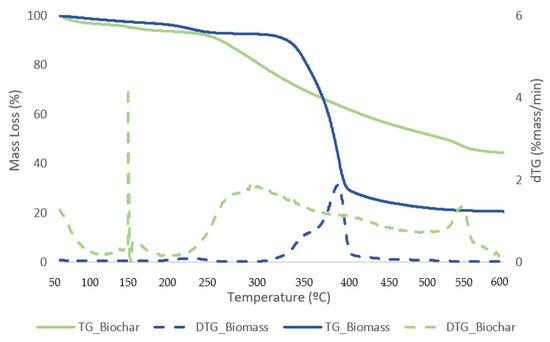
Figure 12.
TG (solid lines) and DTG (dashed lines) curves for biomass and biochar samples with the best conversion.
The first stage for samples of biomass and solid residue begins at 50 °C and concludes at 240 °C. At this point, the elimination of moisture and extremely volatile components is the cause of the mass loss. At 240 °C, the second phase lasts until 340 °C, during which time 54.1% of the biomass is lost in mass. The breakdown of hemicellulose and cellulose is the main cause of the active pyrolysis seen in this stage [39,40]. The third stage has a 31.3% mass loss and lasts from 340 °C to 590 °C. The complete thermal degradation process is separated into three zones: drying (1st), devolatilization (2nd), and char production (3rd). The drying zone removes moisture and light volatile materials, whereas the devolatilization zone involves active pyrolysis. In the char formation zone, disruption and demethylation of lignin cause char formation [41]. It has been observed that the temperature ranges at which hemicellulose, cellulose, and lignin thermally decompose are 210–325, 310–400, and 160–900 °C, respectively [42]. Apart from hemicellulose and cellulose, which are primarily thought to be degraded in the stages of active pyrolysis, lignin is also broken down within this temperature range. Mass loss is very minimal at temperatures above 590 °C due to the gradual deterioration that produces char as residue. This stage, known as passive pyrolysis, can occur as a result of lignin degradation. Other researchers have reported similar patterns for different biomass species [43,44].
At low temperatures, the bio-oil samples consistently lost the majority of their mass; at 150 °C, they began to lose mass, and shown in Table 6; and at 220 °C, they consistently slowed down. A small degradation was seen at temperatures lower than 150 °C, which might be because of the solvent in the bio-oil. Lighter derivatives correlate to the starting thermal temperature of thermal decomposition, which was around 150 °C. A mass loss of about 52.15% was observed on average in the second stage between 240 and 440 °C, which may have been caused by heavier components in the bio-oil. It is explained by the gradual breakdown of the sample in the third stage, which occurred between 440 and 590 °C, producing non-degradable ash and carbon.
Table 6.
TG temperatures and mass loss of the liquid and solid samples.
3.7. Lignocellulosic Content Estimation
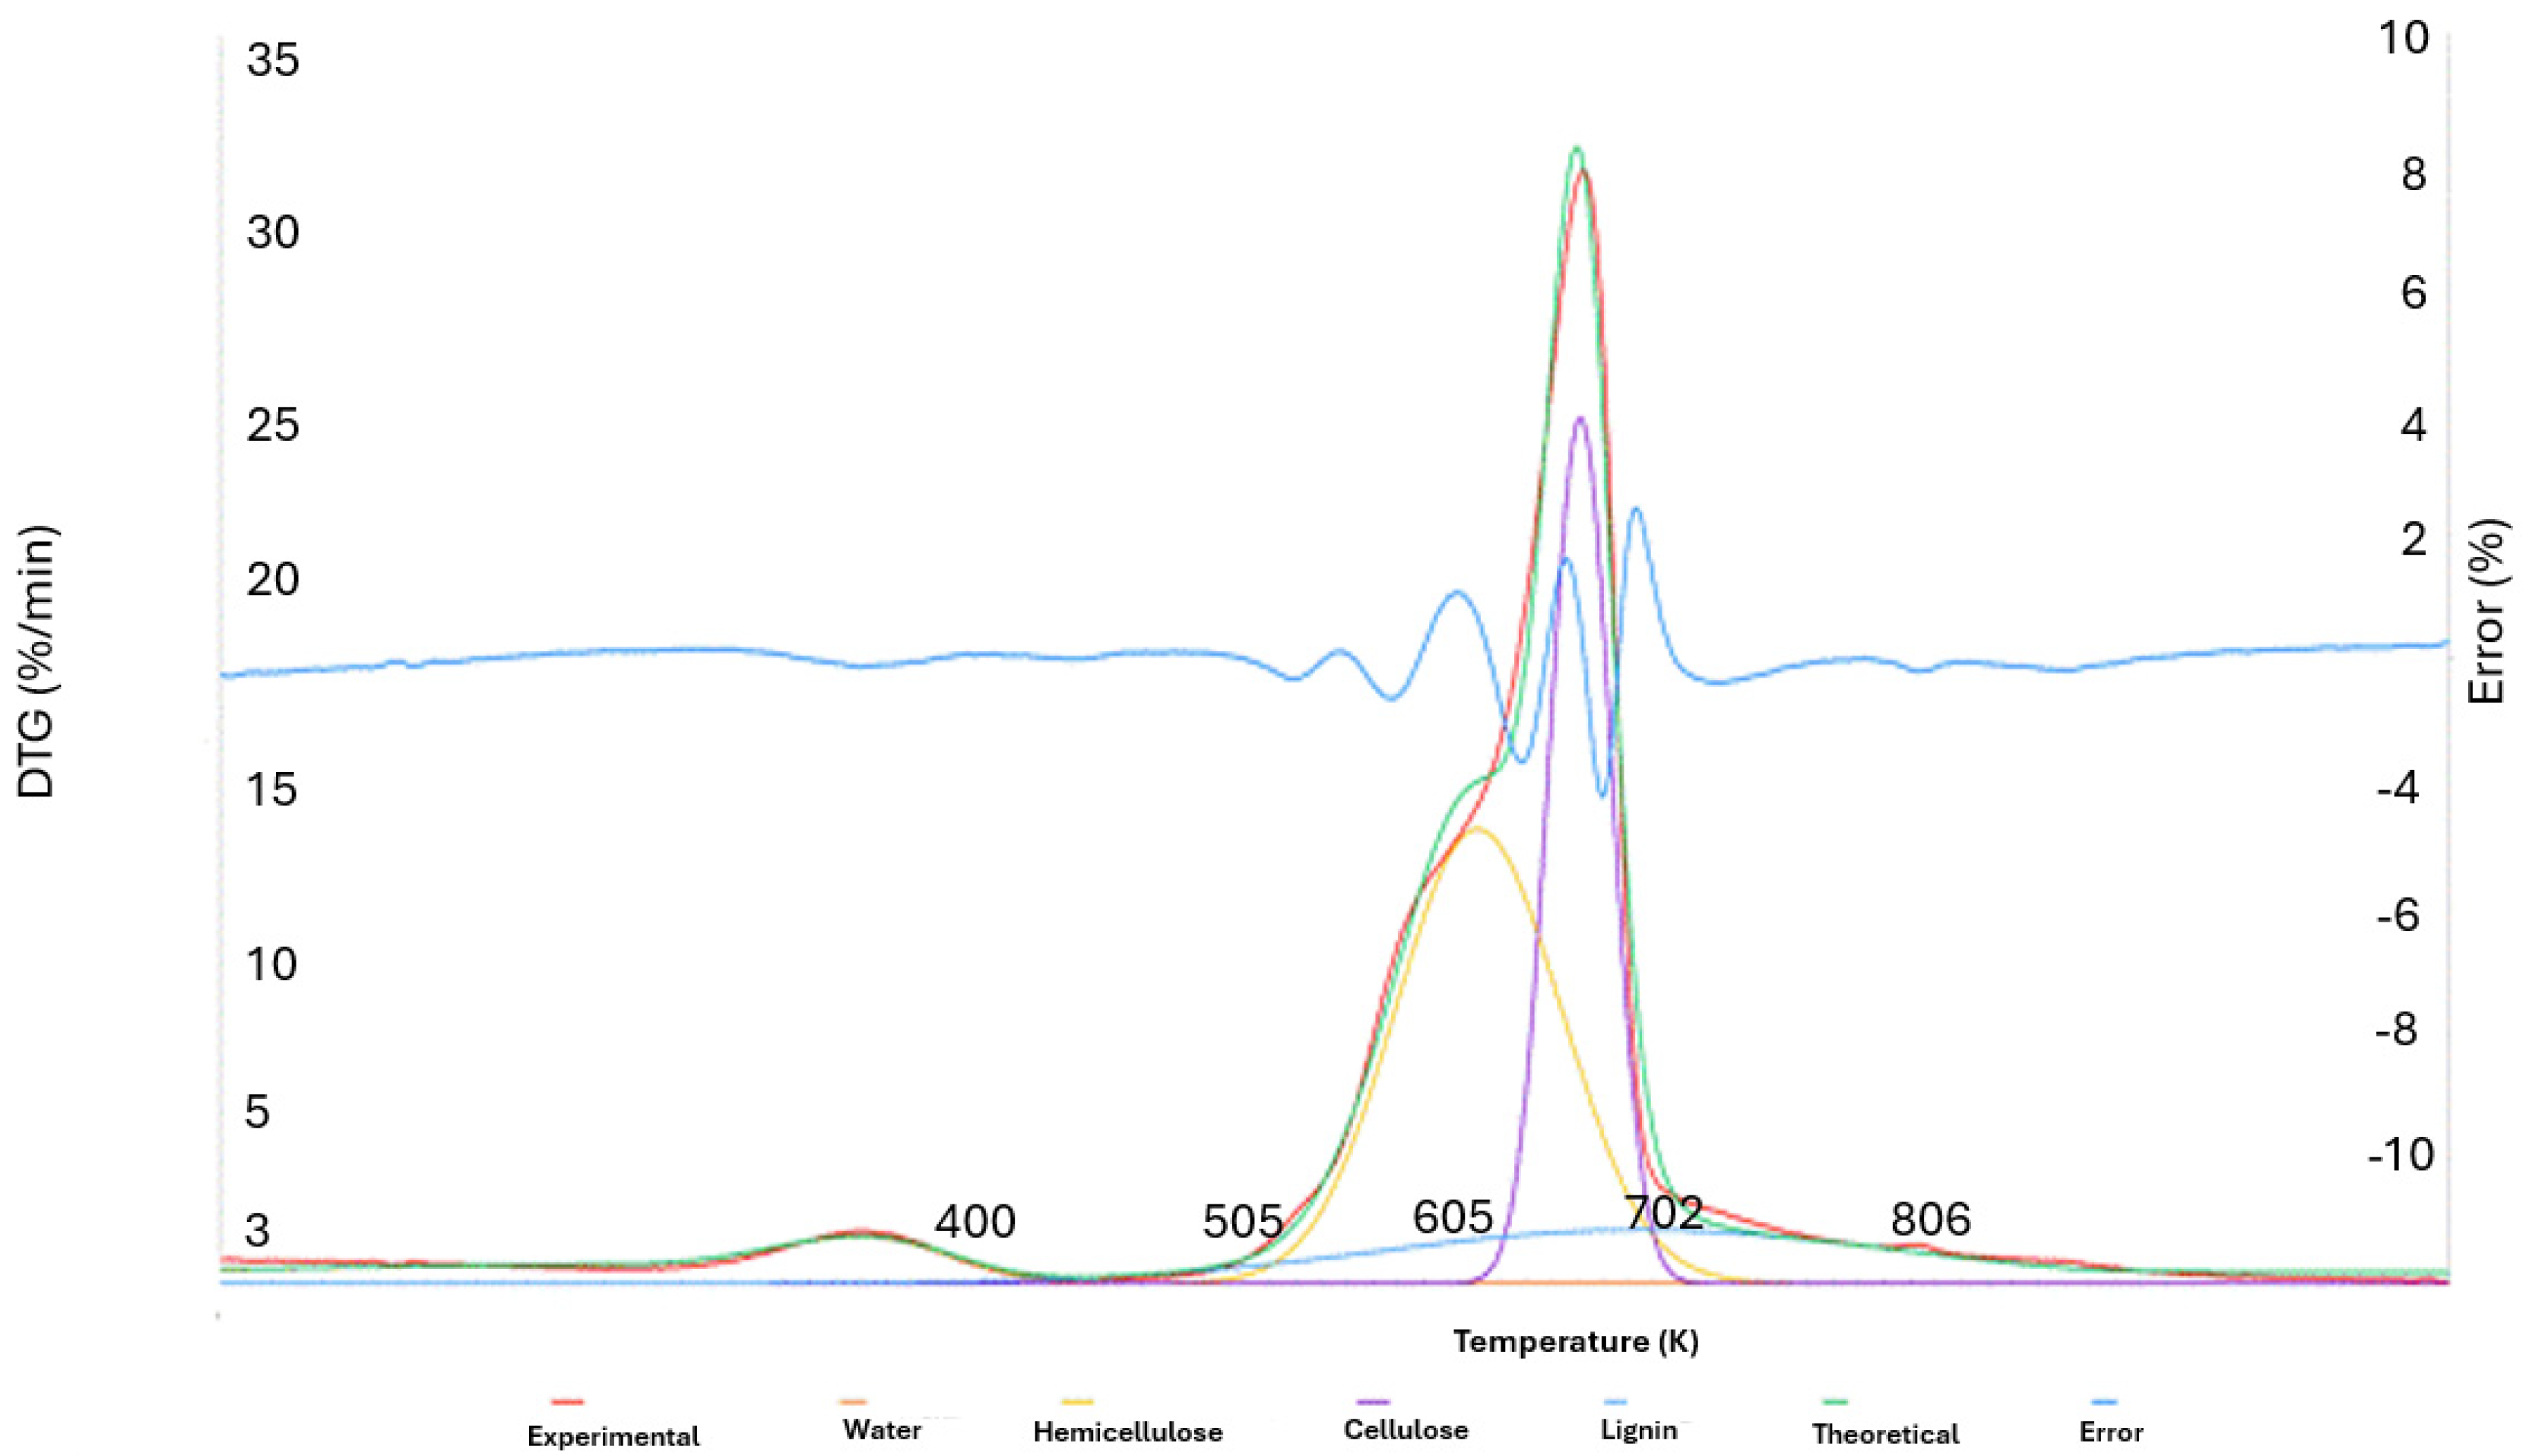
It is essential to evaluate the proportion of lignocellulosic polymeric components in forestry biomass in order to determine its suitability for the production of energy or chemicals. The traditional approach of chemical separation by volumetry is slow, time-consuming, and requires the use of many chemicals, which makes it unsuitable for producing results with industrial use [45]. On the other hand, new, affordable, and accurate approaches have been made possible quickly due to modern rapid techniques like thermogravimetry (TG). Woody biomass was analysed using TG, and the composition of the lignocellulosic material was determined by deconvolution of the rate of mass loss curves using a pseudo-component model.
A curve of time derivative mass loss in function of temperature was generated using a series of DTG data points to determine the lignocellulosic content of each sample at a heating rate of 30 °C/min. DTG data were analysed in relation to an isolated sample of each lignocellulosic component, namely, cellulose, hemicellulose, and lignin, for an estimation of the volatilization temperature ranges in order to build a comparison with the literature [34,45] Hemicellulose, cellulose, and lignin are three different lignocellulosic components that thermally decompose at temperatures of 498–598 K, 598–648 K, and 523–773 K, respectively [35].
Using DTG, a multi-component model was applied to determine the sample’s composition, admitting the presence of four main groups: water, hemicellulose, cellulose, and lignin. Each of these groups contributes to the experimental curve, and it is possible to recreate a “theoretical” curve by adding the four different curves that each group’s rate of volatilization at various temperatures represents. The Solver tool in Microsoft Excel is used to create this theoretical curve, which closely resembles the experimental curve. To minimize the deviations, symmetric Gaussian-type curves are adjusted by modifying three parameters for each region’s curve: α, amplitude; b, position; and c, width at half height [35].
The mean squared error (MSE) was the error technique used to reduce the variance between the curves (Equation (8)).
where DTGT is each interval value of the determined theoretical curve, resulting in the summation of the four regional curves, DTGE is the experimentally obtained interval values of the DTG curve, and n is the total registered intervals number. Equation (9) shows the definition of DTGT as a function of the parameters, α, b, and c, as follows:
where temperature values (measured in K) are indicated by index T.
Table 7 shows the corresponding parameters modified by Solver for each of the four separate curves to match the experimental DTG curve of the sample.
Table 7.
Deconvolution configurations for each curve to minimize errors concerning the DTG curve.
Figure 13 displays an illustration of the theoretical curve created using the aforementioned deconvolution approach and applied to experimental DTG data acquired from Acacia melanoxylon biomass.
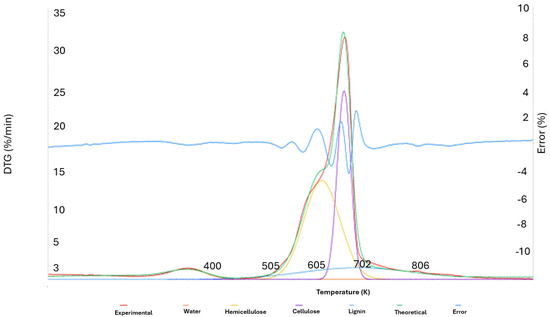
Figure 13.
Graphic representation of the deconvolution of the 4 curves and the DTG.
Since the area beneath the final individual DTG curves is proportional to the mass change, the mass loss of each component can be determined by a straightforward numerical integration using the trapezoid technique. Equation (10) specifies an integrative function G(T) for symmetric Gaussian-type curves.
Analytical integration is expressed as follows in the form of integral I (Equation (11)).
The sum of the decomposed volatile mass compositions plus the fixed carbon residue, distributed in the proportions mentioned above, was used to calculate the overall percentages of lignocellulosic components contained in the tested biomass sample, as indicated in Table 8. The percentages are determined on a dry mass basis and add up to 100% when the ash content of the biomass residue is also considered.
Table 8.
Calculated sample composition, taking into account each component’s proportional fixed carbon residue and volatilized mass.
4. Conclusions
Acacia wood chips have been effectively optimized for thermochemical liquefaction. After 30 min of reaction time at 170 °C with 10% pTSA, the bio-oil recovery rate was 83.29%. With MODDE 12.1 Pro®, a model was created to predict and modulate the process. For the liquefaction reaction optimization, a reaction surface methodology (Central Composite Face Centred-CCF design) was used; reaction temperature, duration time, and catalyst concentration were selected as independent variables. The model predicted that during treatments lasting 30 min at 170 °C, with a modest catalyst concentration of 10%, the maximum bio-oil conversion (>80%) of acacia wood chips could be obtained. FTIR-ATR was used to identify bio-oil and showed that it contained biomass products.
The TGA data allowed for the characterization of the biomass sample in terms of composition using discrete Gaussian type and pseudo-component models, providing information regarding biomass composition. The amounts of cellulose, hemicellulose, and lignin in the biomass sample were precisely determined in compliance with the literature. In comparison to other chemical approaches, thermogravimetry has proven to be a genuinely simple and rapid way of analysing biomass. It also offers a less expensive approach.
Ultimate analysis showed that the carbon concentration greatly increased upon the liquefaction process. The higher heating value was significantly impacted by changes in chemical composition. Bio-oil’s HHV was calculated as 34.31 MJ/kg, 1.82 times higher than the fresh biomass. Forest fire biomass may typically be used in the liquefaction process without sacrificing effectiveness or performance. This study demonstrates how recovering and turning wood into biofuels through liquefaction can help us decrease the damaging effects of forest fires. Additionally, this technology may offer the chance to manage invasive species that are present in the woods of Portugal and other countries around the world. Similar studies can be executed for other species existing within the Portuguese forests.
Author Contributions
Conceptualization, R.G.d.S.; methodology, R.G.d.S. and S.O.; formal analysis, R.G.d.S. and S.O.; investigation, R.G.d.S., D.G., H.S. and J.P.; resources, R.G.d.S. and J.B.; writing—original draft preparation, S.O. and R.G.d.S.; writing—review and editing, J.P. and S.O.; supervision, R.G.d.S., J.P., J.G. and A.C.; project administration, J.P., J.G. and R.G.d.S. All authors have read and agreed to the published version of the manuscript.
Funding
This research received no external funding.
Data Availability Statement
The data that support the findings will be available in ISEL/IPL at www.isel.pt (accessed on 17 September 2024) following an embargo from the date of publication to allow for commercialization of research findings.
Acknowledgments
The authors gratefully acknowledge the support of the CERENA strategic project (FCT-UIDB/04028/2020) and funding to the FCT–Fundação para a Ciência e Tecnologia, I.P., Portugal I&D project CLEANFOREST (PCIF/GVB/0167/2018).
Conflicts of Interest
The authors declare no conflict of interest.
References
- Andika, R.; Nandiyanto, A.B.D.; Putra, Z.A.; Bilad, M.R.; Kim, Y.; Yun, C.M.; Lee, M. Co-Electrolysis for Power-to-Methanol Applications. Renew. Sustain. Energy Rev. 2018, 95, 227–241. [Google Scholar] [CrossRef]
- Ferreira, S.; Monteiro, E.; Brito, P.; Vilarinho, C. Biomass Resources in Portugal: Current Status and Prospects. Renew. Sustain. Energy Rev. 2017, 78, 1221–1235. [Google Scholar] [CrossRef]
- European Commission. Forest Fires—Forests—Environment. 2020. Available online: https://ec.europa.eu/environment/forests/fires.htm (accessed on 21 June 2023).
- Ren, S.; Lei, H.; Wang, L.; Bu, Q.; Chen, S.; Wu, J.; Julson, J.; Ruan, R. The Effects of Torrefaction on Compositions of Bio-Oil and Syngas from Biomass Pyrolysis by Microwave Heating. Bioresour. Technol. 2013, 135, 659–664. [Google Scholar] [CrossRef] [PubMed]
- Rosillo Callé, F.; De Groot, P.; Hemstock, S.L.; Woods, J. The Biomass Assessment Handbook: Energy for a Sustainable Environment; Routledge: London, UK, 2015. [Google Scholar]
- Ozturk, M.; Saba, N.; Altay, V.; Iqbal, R.; Hakeem, K.R.; Jawaid, M.; Ibrahim, F.H. Biomass and Bioenergy: An Overview of the Development Potential in Turkey and Malaysia. Renew. Sustain. Energy Rev. 2017, 79, 1285–1302. [Google Scholar] [CrossRef]
- Soares, B.; Gama, N.; Freire, C.; Barros-Timmons, A.; Silva, R.; Pascoal Neto, C.; Ferreira, A. Ecopolyol Production from Industrial Cork Powder via Acid Liquefaction Using Polyhydric Alcohols. ACS Sustain. Chem. Eng. 2014, 2, 846–854. [Google Scholar] [CrossRef]
- Galhano, R.; Santos, D.; Carvalho, R.; Silva, R.; Carlos Bordado, J.; Cardoso, A.C.; Do Rosário Costa, M.; Mateus, M.M. Natural Polymeric Water-Based Adhesive from Cork Liquefaction. Ind. Crop. Prod. 2016, 84, 314–319. [Google Scholar] [CrossRef]
- Guerra, L.; Moura, K.; Rodrigues, J.; Gomes, J.; Puna, J.; Bordado, J.; Santos, T. Synthesis Gas Production from Water Electrolysis, Using the Electrocracking Concept. J. Environ. Chem. Eng. 2017, 6, 604–609. [Google Scholar] [CrossRef]
- Fang, J.; Liu, Z.; Luan, H.; Liu, F.; Yuan, X.; Long, S.; Wang, A.; Ma, Y.; Xiao, Z. Thermochemical Liquefaction of Cattle Manure Using Ethanol as Solvent: Effects of Temperature on Bio-Oil Yields and Chemical Compositions. Renew. Energy 2021, 167, 32–41. [Google Scholar] [CrossRef]
- Jiang, X.; Li, P.; Ding, Z.; Wang, A.; Bing, H.; Zhang, J. Thermochemical Liquefaction of Wheat Straw and Its Effectiveness as an Extender for Asphalt Binders: Characterization of Liquefied Products and Potential Opportunities. Constr. Build. Mater. 2021, 305, 124769. [Google Scholar] [CrossRef]
- Zhang, S.; Zhou, S.; Yang, X.; Xi, W.; Zheng, K.; Chu, C.; Ju, M.; Liu, L. Effect of Operating Parameters on Hydrothermal Liquefaction of Corn Straw and Its Life Cycle Assessment. Environ. Sci. Pollut. Res. 2020, 27, 6362–6374. [Google Scholar] [CrossRef] [PubMed]
- Nunes, L.J.R.; Loureiro, L.M.E.F.; Sá, L.C.R.; Silva, H.F.C. Thermochemical Conversion of Olive Oil Industry Waste: Circular Economy through Energy Recovery. Recycling 2020, 5, 12. [Google Scholar] [CrossRef]
- Liu, Y.; Yuan, X.Z.; Huang, H.J.; Wang, X.L.; Wang, H.; Zeng, G.M. Thermochemical Liquefaction of Rice Husk for Bio-Oil Production in Mixed Solvent (Ethanol–Water). Fuel Process. Technol. 2013, 112, 93–99. [Google Scholar] [CrossRef]
- Minowa, T.; Kondo, T.; Sudirjo, S.T. Thermochemical Liquefaction of Indonesian Biomass Residues. Biomass Bioenergy 1998, 14, 517–524. [Google Scholar] [CrossRef]
- Liu, Z.; Zhang, F.S. Effects of Various Solvents on the Liquefaction of Biomass to Produce Fuels and Chemical Feedstocks. Energy Convers. Manag. 2008, 49, 3498–3504. [Google Scholar] [CrossRef]
- Yan, Y.; Pang, H.; Yang, X.; Zhang, R.; Liao, B. Preparation and Characterization of Water-Blown Polyurethane Foams from Liquefied Cornstalk Polyol. J. Appl. Polym. Sci. 2008, 110, 1099–1111. [Google Scholar] [CrossRef]
- Nunes, L.J.R.; Meireles, C.I.R.; Pinto Gomes, C.J.; Almeida Ribeiro, N.M.C. Historical Development of the Portuguese Forest: The Introduction of Invasive Species. Forests 2019, 10, 974. [Google Scholar] [CrossRef]
- Raposo, M.A.M.; Pinto Gomes, C.J.; Nunes, L.J.R. Evaluation of Species Invasiveness: A Case Study with Acacia Dealbata Link. on the Slopes of Cabeça (Seia-Portugal). Sustainability 2021, 13, 11233. [Google Scholar] [CrossRef]
- Hellmann, C.; Sutter, R.; Rascher, K.G.; Máguas, C.; Correia, O.; Werner, C. Impact of an Exotic N2-Fixing Acacia on Composition and N Status of a Native Mediterranean Community. Acta Oecologica 2011, 37, 43–50. [Google Scholar] [CrossRef]
- Marchante, H.; Palhas, J.; Núñez, F.A.L.; Marchante, E. Invasive Species Impacts and Management. In Life on Land; Springer: Berlin/Heidelberg, Germany, 2019; pp. 1–12. [Google Scholar] [CrossRef]
- Ahmed, A.; Abu Bakar, M.S.; Azad, A.K.; Sukri, R.S.; Mahlia, T.M.I. Potential Thermochemical Conversion of Bioenergy from Acacia Species in Brunei Darussalam: A Review. Renew. Sustain. Energy Rev. 2018, 82, 3060–3076. [Google Scholar] [CrossRef]
- Mateus, M.M.; Bordado, J.M.; Galhano dos Santos, R. Estimation of Higher Heating Value (HHV) of Bio-Oils from Thermochemical Liquefaction by Linear Correlation. Fuel 2021, 302, 121149. [Google Scholar] [CrossRef]
- Zhu, Z.; Rosendahl, L.; Toor, S.S.; Chen, G. Optimizing the Conditions for Hydrothermal Liquefaction of Barley Straw for Bio-Crude Oil Production Using Response Surface Methodology. Sci. Total Environ. 2018, 630, 560–569. [Google Scholar] [CrossRef]
- Hadhoum, L.; Loubar, K.; Paraschiv, M.; Burnens, G.; Awad, S.; Tazerout, M. Optimization of Oleaginous Seeds Liquefaction Using Response Surface Methodology. Biomass Convers. Biorefin. 2021, 11, 2655–2667. [Google Scholar] [CrossRef]
- Sheng, C.; Azevedo, J.L.T. Estimating the Higher Heating Value of Biomass Fuels from Basic Analysis Data. Biomass Bioenergy 2005, 28, 499–507. [Google Scholar] [CrossRef]
- Zhai, Q.; Long, F.; Hse, C.; Wang, F.; Shupe, T.F.; Jiang, J.; Xu, J. Facile Fractionation of Bamboo Wood Toward Biomass Valorization by p -TsOH-Based Methanolysis Pretreatment. ACS Sustain. Chem. Eng. 2019, 7, 19213–19224. [Google Scholar] [CrossRef]
- Jasiukaityté, E.; Kunaver, M.; Strlič, M. Cellulose Liquefaction in Acidified Ethylene Glycol. Cellulose 2009, 16, 393–405. [Google Scholar] [CrossRef]
- Njoku, C.N.; Otisi, S.K. Application of Central Composite Design with Design Expert V13 in Process Optimization. In Response Surface Methodology—Research Advances and Applications; IntechOpen: London, UK, 2023. [Google Scholar] [CrossRef]
- Hassan, E.B.M.; Steele, P.H.; Ingram, L. Characterization of Fast Pyrolysis Bio-Oils Produced from Pretreated Pine Wood. Appl. Biochem. Biotechnol. 2009, 154, 182–192. [Google Scholar] [CrossRef]
- Ong, H.C.; Yu, K.L.; Chen, W.H.; Pillejera, M.K.; Bi, X.; Tran, K.Q.; Pétrissans, A.; Pétrissans, M. Variation of Lignocellulosic Biomass Structure from Torrefaction: A Critical Review. Renew. Sustain. Energy Rev. 2021, 152, 111698. [Google Scholar] [CrossRef]
- Kumar, R.; Mago, G.; Balan, V.; Wyman, C.E. Physical and Chemical Characterizations of Corn Stover and Poplar Solids Resulting from Leading Pretreatment Technologies. Bioresour. Technol. 2009, 100, 3948–3962. [Google Scholar] [CrossRef] [PubMed]
- Bui, N.Q.; Fongarland, P.; Rataboul, F.; Dartiguelongue, C.; Charon, N.; Vallée, C.; Essayem, N. FTIR as a Simple Tool to Quantify Unconverted Lignin from Chars in Biomass Liquefaction Process: Application to SC Ethanol Liquefaction of Pine Wood. Fuel Process. Technol. 2015, 134, 378–386. [Google Scholar] [CrossRef]
- Juan, J.; Flores, A.; Guadalupe, J.; Quiñones, R.; Liliana, M.; Rodríguez, Á.; Víctor, J.; Vera, A.; Espino Valencia, J.; Guevara Martínez, S.J.; et al. Thermal Degradation Kinetics and FT-IR Analysis on the Pyrolysis of Pinus Pseudostrobus, Pinus Leiophylla and Pinus Montezumae as Forest Waste in Western Mexico. Energies 2020, 13, 969. [Google Scholar] [CrossRef]
- Rego, F.; Soares Dias, A.P.; Casquilho, M.; Rosa, F.C.; Rodrigues, A. Fast Determination of Lignocellulosic Composition of Poplar Biomass by Thermogravimetry. Biomass Bioenergy 2019, 122, 375–380. [Google Scholar] [CrossRef]
- Liu, Y.; He, Z.; Shankle, M.; Tewolde, H. Compositional Features of Cotton Plant Biomass Fractions Characterized by Attenuated Total Reflection Fourier Transform Infrared Spectroscopy. Ind. Crop. Prod. 2016, 79, 283–286. [Google Scholar] [CrossRef]
- Popescu, C.M.; Popescu, M.C.; Singurel, G.; Vasile, C.; Argyropoulos, D.S.; Willfor, S. Spectral Characterization of Eucalyptus Wood. Appl. Spectrosc. 2007, 61, 1168–1177. [Google Scholar] [CrossRef] [PubMed]
- Xu, F.; Yu, J.; Tesso, T.; Dowell, F.; Wang, D. Qualitative and Quantitative Analysis of Lignocellulosic Biomass Using Infrared Techniques: A Mini-Review. Appl. Energy 2013, 104, 801–809. [Google Scholar] [CrossRef]
- Ren, S.; Lei, H.; Wang, L.; Bu, Q.; Chen, S.; Wu, J. Thermal Behaviour and Kinetic Study for Woody Biomass Torrefaction and Torrefied Biomass Pyrolysis by TGA. Biosyst. Eng. 2013, 116, 420–426. [Google Scholar] [CrossRef]
- Açıkalın, K. Pyrolytic Characteristics and Kinetics of Pistachio Shell by Thermogravimetric Analysis. J. Therm. Anal. Calorim. 2012, 109, 227–235. [Google Scholar] [CrossRef]
- Collard, F.X.; Blin, J. A Review on Pyrolysis of Biomass Constituents: Mechanisms and Composition of the Products Obtained from the Conversion of Cellulose, Hemicelluloses and Lignin. Renew. Sustain. Energy Rev. 2014, 38, 594–608. [Google Scholar] [CrossRef]
- Lopez-Velazquez, M.A.; Santes, V.; Balmaseda, J.; Torres-Garcia, E. Pyrolysis of Orange Waste: A Thermo-Kinetic Study. J. Anal. Appl. Pyrolysis 2013, 99, 170–177. [Google Scholar] [CrossRef]
- Chutia, R.S.; Kataki, R.; Bhaskar, T. Thermogravimetric and Decomposition Kinetic Studies of Mesua ferrea L. Deoiled Cake. Bioresour. Technol. 2013, 139, 66–72. [Google Scholar] [CrossRef] [PubMed]
- Park, J.I.; Liu, L.; Ye, X.P.; Jeong, M.K.; Jeong, Y.-S. Improved Prediction of Biomass Composition for Switchgrass Using Reproducing Kernel Methods with Wavelet Compressed FT-NIR Spectra. Expert Syst. Appl. 2012, 39, 1555–1564. [Google Scholar] [CrossRef]
- Carrier, M.; Loppinet-Serani, A.; Denux, D.; Lasnier, J.M.; Ham-Pichavant, F.; Cansell, F.; Aymonier, C. Thermogravimetric Analysis as a New Method to Determine the Lignocellulosic Composition of Biomass. Biomass Bioenergy 2011, 35, 298–307. [Google Scholar] [CrossRef]

Disclaimer/Publisher’s Note: The statements, opinions and data contained in all publications are solely those of the individual author(s) and contributor(s) and not of MDPI and/or the editor(s). MDPI and/or the editor(s) disclaim responsibility for any injury to people or property resulting from any ideas, methods, instructions or products referred to in the content. |
© 2024 by the authors. Licensee MDPI, Basel, Switzerland. This article is an open access article distributed under the terms and conditions of the Creative Commons Attribution (CC BY) license (https://creativecommons.org/licenses/by/4.0/).