Article

A Novel Method for Online Diagnostic Analysis of Partial Discharge in Instrument Transformers and Surge Arresters from the Correlation of HFCT and IEC Methods

by
Marcel Antonionni de Andrade Romano
1,*,
André Melo de Morais
1,
Marcus Vinicius Alves Nunes
1,
Kaynan Maresch
2,
Luiz Fernando Freitas-Gutierres
2,
Ghendy Cardoso, Jr.
2,
Aécio de Lima Oliveira
2,
Erick Finzi Martins
3,
Cristian Hans Correa
3 and
Herber Cuadro Fontoura
3
1
High and Extra High Voltage Laboratory, Institute of Technology, Federal University of Pará, Pará 66075-110, PA, Brazil
2
Laboratory for Analysis and Protection of Electrical Systems, Technology Center, Federal University of Santa Maria, Santa Maria 97105-900, RS, Brazil
3
Engineering Board, CPFL Transmission, Porto Alegre 90230-181, RS, Brazil
*
Author to whom correspondence should be addressed.
Energies 2024, 17(19), 4921; https://doi.org/10.3390/en17194921
Submission received: 24 June 2024 / Revised: 9 July 2024 / Accepted: 17 July 2024 / Published: 1 October 2024

Abstract

:
In this work, a new methodology is proposed for the online and non-invasive extraction of partial discharge (PD) pulses from raw measurement data obtained using a simplified setup. This method enables the creation of sub-windows with optimized size, each containing a single candidate PD pulse. The proposed approach integrates mathematical morphological filtering (MMF) with kurtosis, a first-order Savitzky-Golay smoothing filter, the Otsu method for thresholding, and a specific technique to associate each sub-window with the phase angle of the applied voltage waveform, enabling the construction of phase-resolved PD (PRPD) patterns. The methodology was validated against a commercial PD detection device adhering to the IEC (International Electrotechnical Commission) standard. Experimental results demonstrated that the proposed method, utilizing an off-the-shelf 8-bit resolution data acquisition system and a low-cost high-frequency current transformer (HFCT) sensor, effectively diagnoses and characterizes PD activity in high-voltage equipment, such as surge arresters and instrument transformers, even in noisy environments. It was able to characterize PD activity using only a few cycles of the applied voltage waveform and identify low amplitude PD pulses with low signal-to-noise ratio signals. Other contribution of this work is the diagnosis and fault signature obtained from a real surge arrester (SA) with a nominal voltage of 192 kV, corroborated by destructive disassembly and internal inspection of the tested equipment. This work provides a cost-effective and accurate tool for real-time PD monitoring, which can be embedded in hardware for continuous evaluation of electrical equipment integrity.

1. Introduction

Ensuring continuity and quality in the provision of electrical power system represents a critical challenge within modern infrastructure. The degradation of insulation in high-voltage equipment such as instrument transformers (IT), surge arresters, and underground cables constitutes an inherent problem, arising from factors such as thermal and mechanical stresses, natural aging, and transient overvoltages [1,2,3,4]. In this context, the assessment of operational conditions through the detection of partial discharges [5,6,7,8] emerges as a crucial methodology, and monitoring these discharges provides valuable insights into the integrity of electrical equipment [2,3,9], enabling proactive interventions to prevent catastrophic failures. The synergy between ensuring uninterrupted power supply and the application of advanced assessment techniques underscores the growing importance of predictive approaches in the efficient management of highly complex electrical systems.
Among the existing methods for measuring PD, the conventional method stands out, as defined by IEC-60270 [10]. This method, however, has the limitation of requiring the disconnection of the system under test, rendering it unsuitable for field inspections. To overcome this limitation, alternative techniques have emerged recently, utilizing sensors based on HFCT [11], ultrasonic acoustics [12,13], ultra-high frequency (UHF) [14], and others [5].
Each of these techniques has its own limitations: HFCT is sensitive to conducted noise, which can interfere with the accurate detection of PD signals [15], although efforts are being made to improve signal detection in noisy environments [16]; ultrasonic techniques may struggle to detect internal discharges due to varying acoustic impedance and can be affected by environmental noise [17]; UHF methods are susceptible to radiated noise, including interference from radio stations [18], which can compromise the accuracy of the PD detection [19].
The characteristic signals of partial discharges, or simply PD pulses, exhibit relatively high frequencies and can be detected using HFCT sensors, which are typically designed for a range from a few kHz to several tens of MHz. These sensors are portable and easy to handle [11,20,21]. However, the acquisition of electrical signal data on-line and on-site is complicated by the presence of noise, which poses a significant challenge for PD diagnosis. This is because measurements taken in noisy environments can result in PD pulses being partially or even completely masked by noise. Even frequency domain investigations attempting to separate these can fail due to the overlapping frequency spectra common in both PD signals and noise [16,22,23,24]. There are three major types of additive noise according to their frequency spectrum: sinusoidal noise, pulse-shaped interferences, and white noise [25].
In this regard, the detection of PD pulses necessitates the use of high-performance data acquisition hardware equipped with features that facilitate the recognition of PD signals, consequently making commercial devices expensive [11,20].
Numerous developments reported in the technical literature involve signal processing to discriminate and extract characteristics of PD pulses immersed in noise within a data window. Techniques such as the wavelet transform (WT) [23,24,26,27,28], singular value decomposition (SVD) [25,29,30] and mathematical morphological filtering (MMF) [31,32] are employed for this purpose. In these cases, a considerable amount of measured data is processed, resulting in high computational loads and rendering the methodologies less effective.
The present theoretical review of pulse segmentation methods for PD analysis found few relevant studies. The authors in [33] developed an adaptive pulse extraction system to divide the original discrete PD sequences into various time intervals, continuously applying the discrete wavelet transform (DWT) to each frame until segments containing PD pulses are identified. Ashtiani et al. [16] proposed a method to extract PD pulses before any noise reduction attempts, applicable even in conditions where the measured signal exhibits intense noise. This method detects the PD pulses, provides narrow data windows around the positions of the PD pulses, and discards data windows that do not present PD. In [34], an experience is reported on the design and implementation of a comprehensive continuous monitoring system for use in power transformers ranging from 138 kV to 500 kV within Brazil’s National Interconnected System.
Regarding the evaluation of PD using HFCT sensors, it is more common to observe developments based on analyses in simplified systems (tip-plane and small insulating samples subjected to high voltage, for example) containing typical artificial defects such as corona discharge, surface discharge, presence of conductive particles, and cavity discharge [11,15,18,19], or proposals involving diagnosis in insulated cables [3,14,16]. However, few studies were observed in the literature review involving PD analysis and diagnosis in IT and SA. Field PD measurements conducted on zinc oxide surge arresters and current transformers reported in [4,35] corroborate the feasibility of using HFCT sensors to identify PD activity in real equipment; however, such evaluations did not involve methods to extract PD pulses, construct the phase-resolved PD, and compare with the IEC method.
In this work, we introduce a novel methodology for segmenting raw PD measurement signals into optimized sub-windows, each containing a single PD pulse. This approach incorporates a unique blend of techniques including MMF, kurtosis analysis, a first-order Savitzky-Golay smoothing filter, the Otsu method [36] for thresholding and a first derivative criterion for pulse candidate discrimination. Futhermore, each sub-window is associated with phase angle of the applied voltage waveform, enabling the construction of the PRPD.
The effectiveness of our methodology was validated in laboratory setting using equipment removed from service, comparing favorably with a commercial device adhering to IEC-60270 standard [10]. Experimental results indicate that, even using a off-the-shelf data acquisition system with 8-bit resolution, associated with a low-cost HFCT sensor, the algorithm, implemented on a standard workstation, is capable of partial discharges monitoring and generate the phase-resolved PD.
Additional validation was conducted through fault signature analysis on a surge arrester with a nominal voltage of 192 kV, corroborated by destructive disassembly and internal inspection, underscoring the reliability and practical relevance of our approach. Looking forward, the methodology holds promise for real-time PD evaluation when embedded in appropriate hardware.
The remainder of this work is organized as follows: the methodology proposed for PD detection and PRPD assembly is explained in Section 2; next, the methodology and laboratory test arrangements, at high voltage, for PD measurement are presented in Section 3; results and discussions are presented in Section 4; and, the last section condenses the conclusions of the paper.

2. Methodology Proposed for Discrimination and Presentation of PD Signals

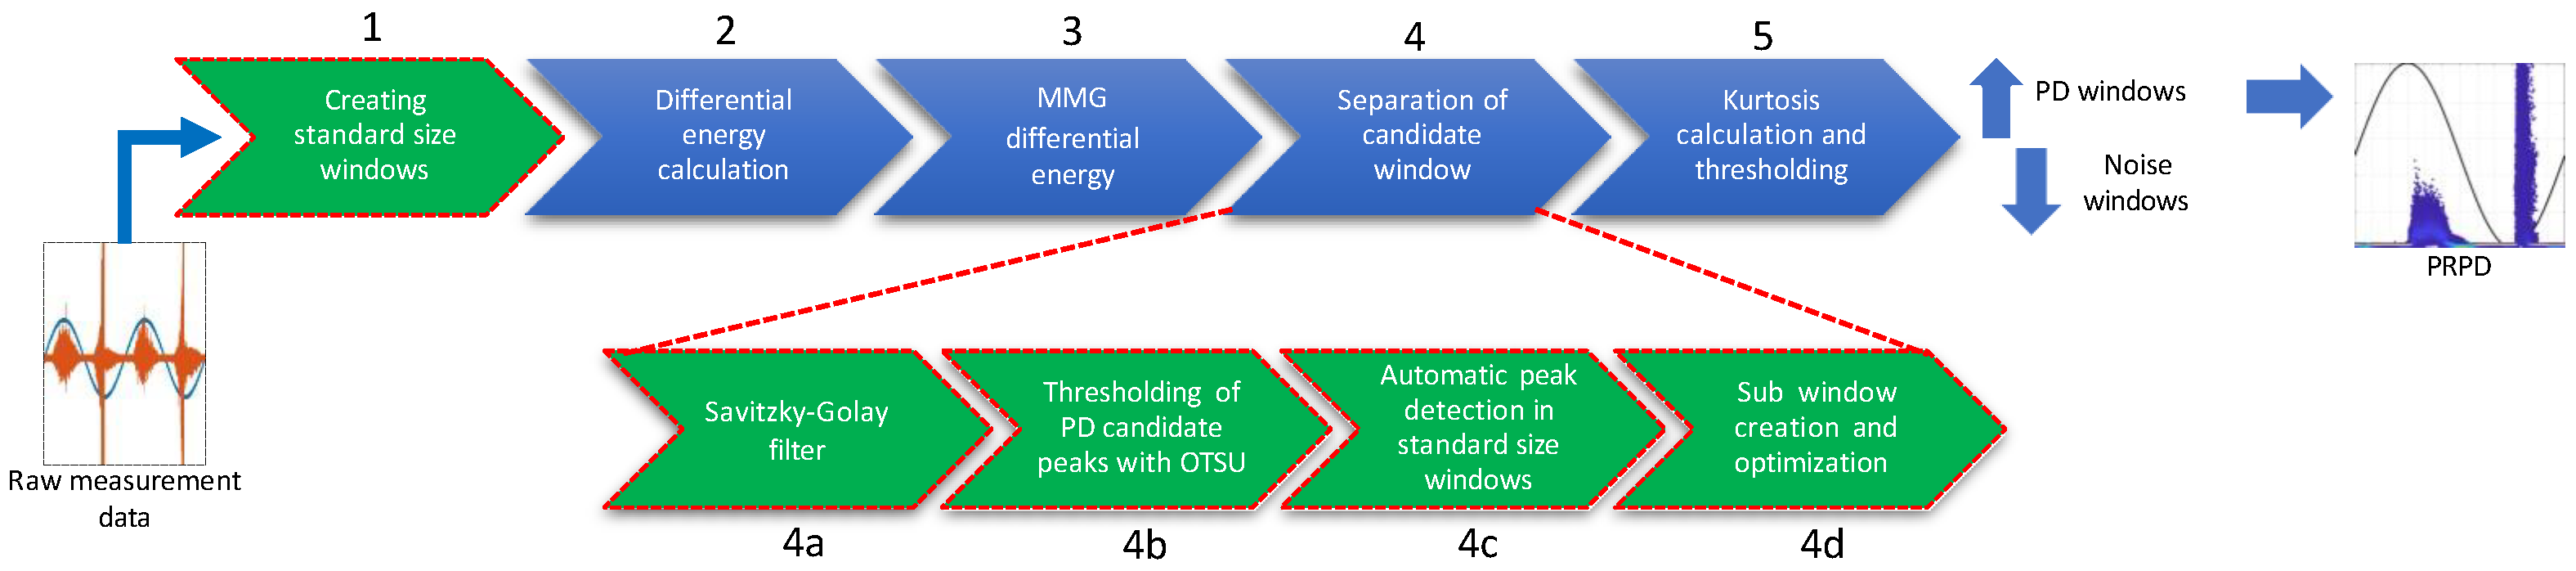
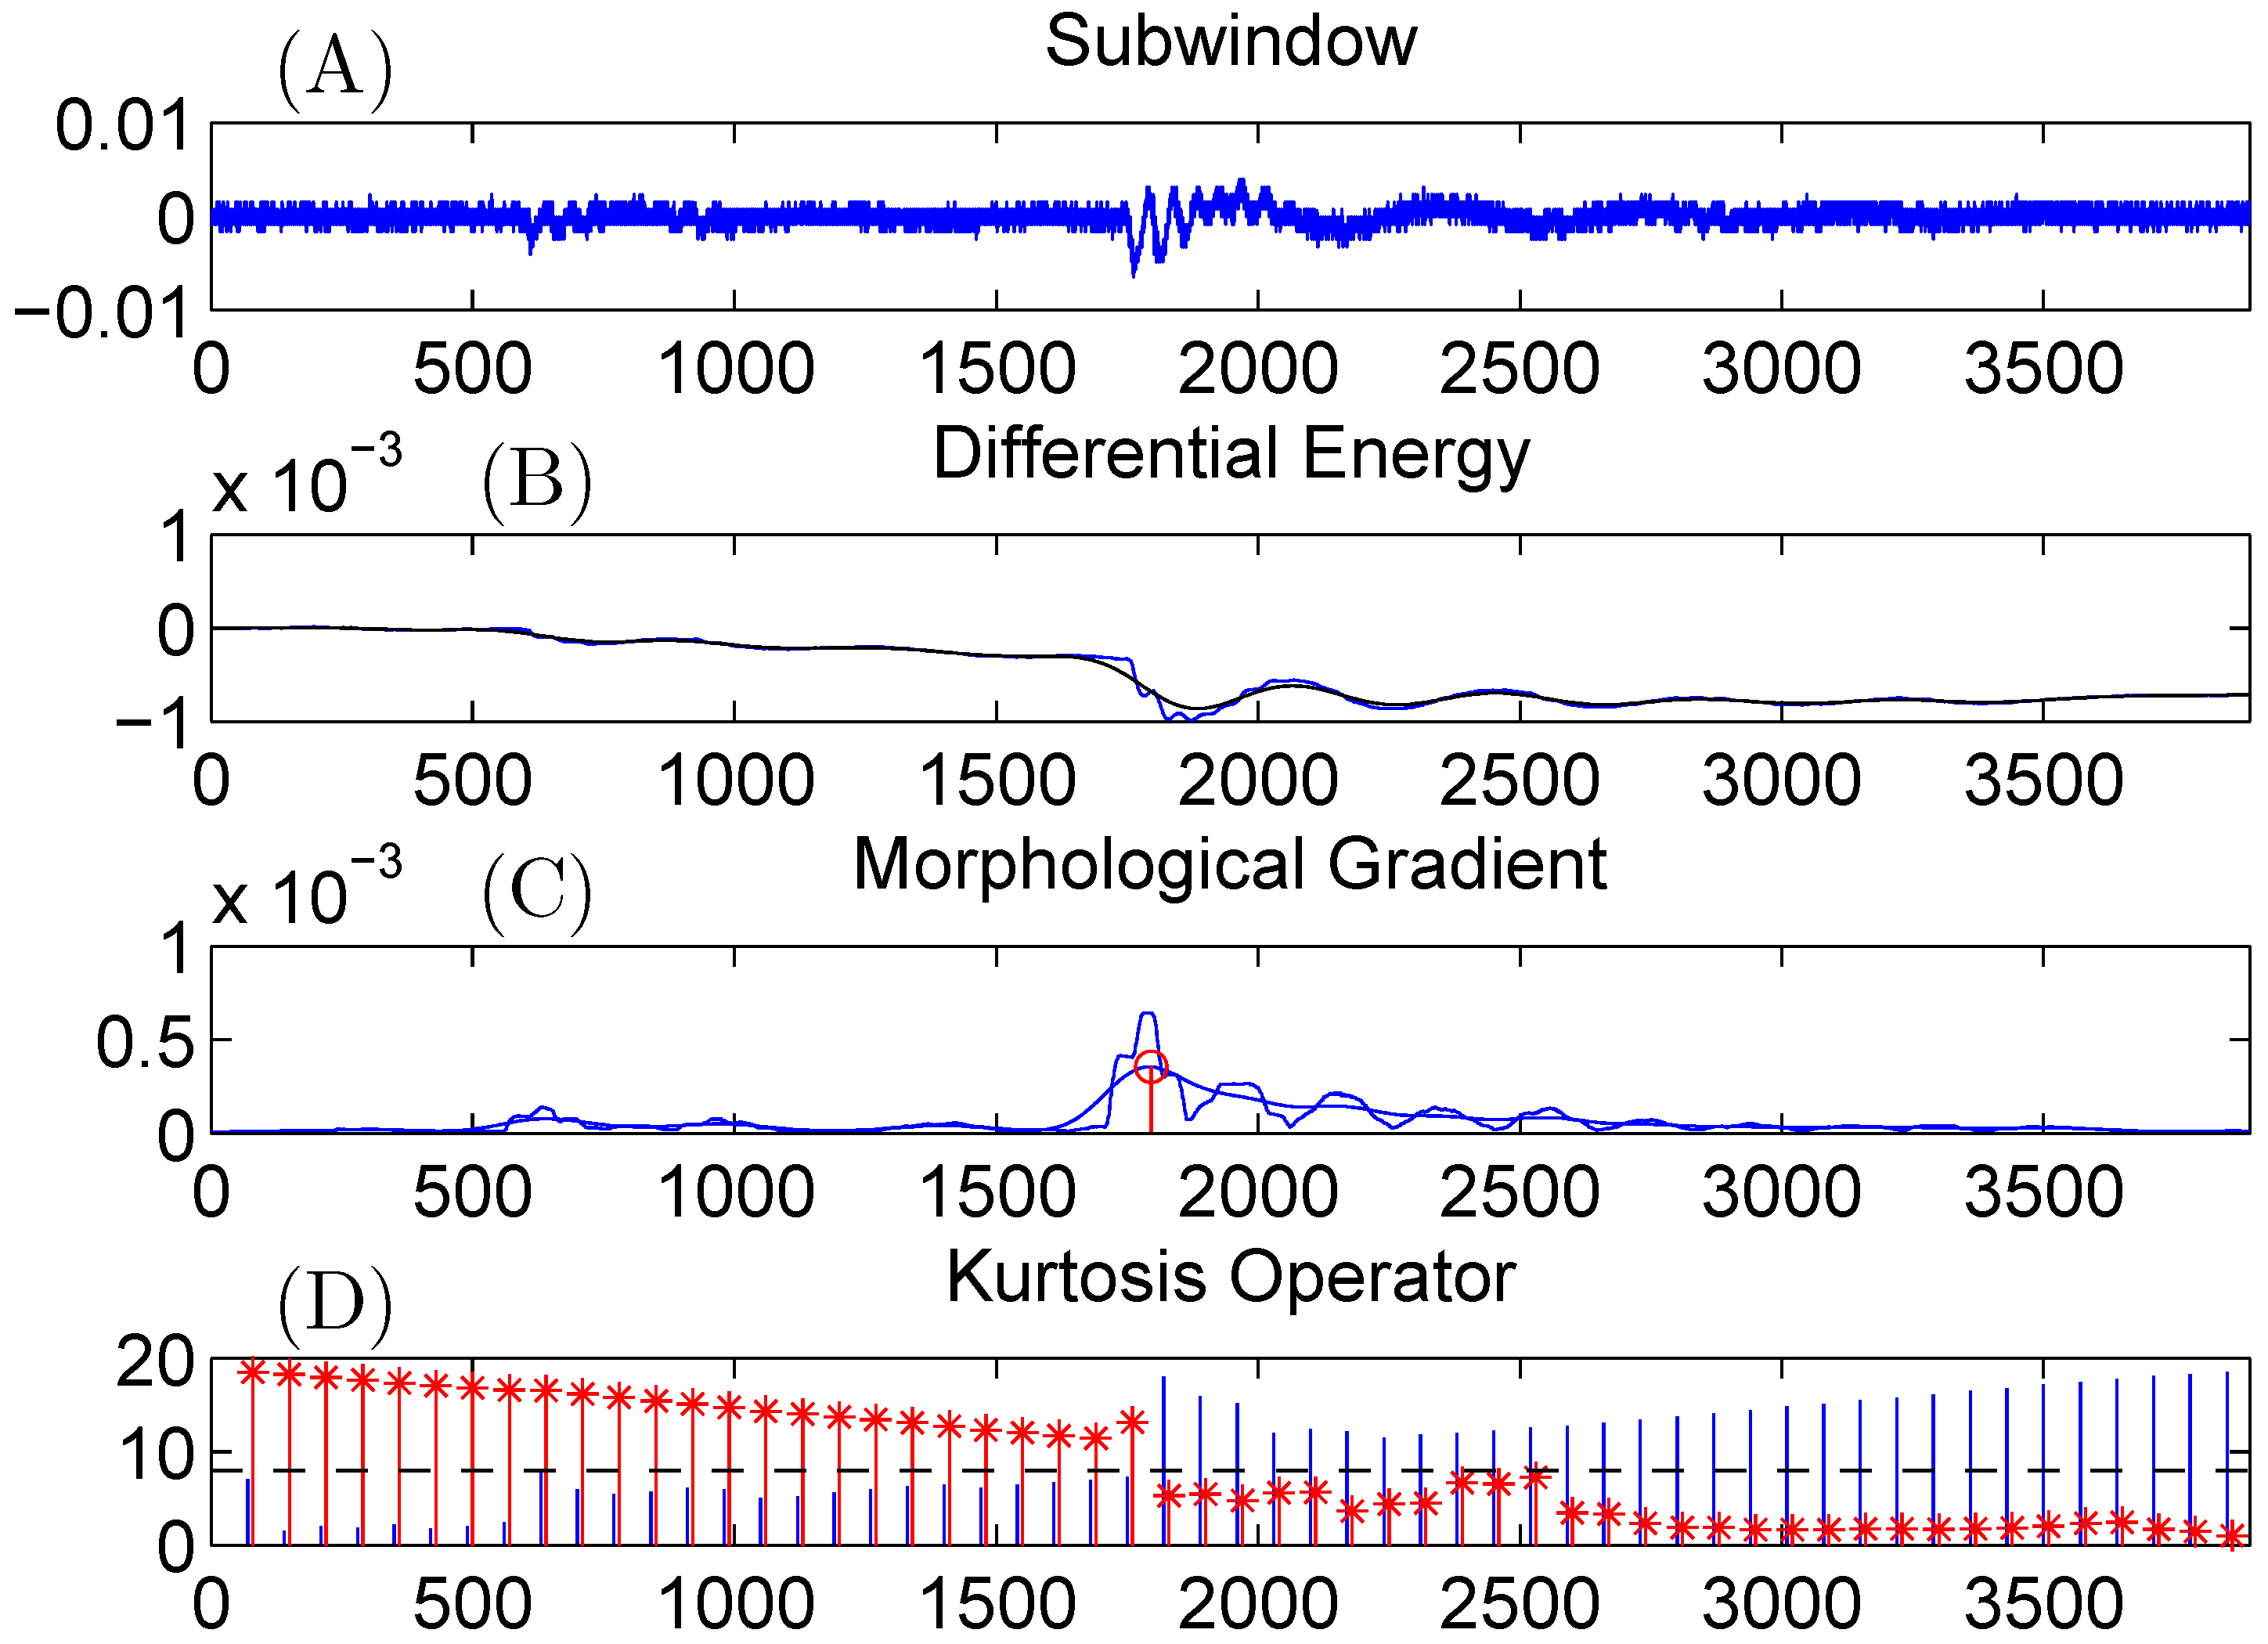
2.1. Procedures for Pre-Processing and Detection of PD Signals

In this section, is described the procedures for pre-processing and detecting partial discharges signals. The approach involves initially segmenting the continuous data acquisition into fixed windows. These windows are then subjected to successive refinements to either confirm the presence of PD pulses or reject the window based on predefined criteria. This method allows for effective isolation and identification of PD activity within large datasets.
For evaluate this technique, a digital oscilloscope of 10 M point recording length and 2.5 GHz sampling frequency acquired signals of applied voltage from a voltage divider and the pulses candidate to PD, measured from the ground conductor and coupled by an high-frequency current transformer. The complete experimental setup is detailed in Section 3. Figure 1 illustrates a typical acquisition with the waveforms of both voltage applied by the source and voltage induced in HFCT by the current passing the grounding conductor of the object under testing and provides details of the technique for the phase reference in the current pulses.
A flexible approach regarding sampling rate and temporal reference (trigger delay) was adopted for data acquisition by the oscilloscope in different ways and by distinct teams, allowing the use of previously acquired data as long as it demonstrates methodological consistency. Initially and from the sampling interval and the recording length, the availability of sufficient points for recording at least one period of the voltage waveform was checked. In case of availability, a classical type I Chebyshev IIR (infinite impulse response) low-pass filter of 50 kHz cutoff frequency is constructed from information of sampling rate. Data on applied voltage are then subjected to zero-phase digital filtering (direct and reverse direction [37]) and the offset direct current (DC) can be removed from the initial estimate of the number of points in a cycle if the alternating current (AC) coupling is not used in the data acquisition.
A zero-crossing technique was employed to delineate the start, midpoint, and end of each cycle, with the first complete cycle chosen as the reference one (denoted by Index 1 in Figure 1) and the other complete cycles were included and indexed from the reference (indexes 2, 3, and 4). If the reference cycle cannot be used or if sufficient points are left for a 360 coverage, negative and positive parts of the semi-cycle are added at the beginning and at the end of the acquisition, respectively (indexes −1 and 5). The windows of the cycle duly marked (red dashed lines) enable the construction of angular references for the reference cycle (highlighted in the abscissa in Figure 1) and for the others in a similar fashion.
From the beginning of each cycle (or semicycle), the voltage signal obtained by HFCT was initially divided into windows whose size was coherent with the smallest angular discrimination desired for PRPD. In this study, phase-resolved PD coincided with the windows of the commercial equipment used for comparison purposes (256 windows per 1 / 60 s cycle), as illustrated in Figure 2. The figure also shows the indexes of the windows, referenced from the beginning of cycle 1, and the information on the angular difference reference (based on a sinusoid with crossing with the positive semi-cycle starting at 0 ).
A technique that discriminates the existence of pulses immersed in noise and at the same time determines indexes for a windowing of variable size is required specially in pulses of low amplitude with unfavorable signal-noise relation (Figure 2) and windowing of fixed size, which can bring more than one pulse in a same window, as well as cut one due to the large number of pulses per acquisition. The methodology proposed in this study was inspired in [16].
Towards the characteristics of this study, namely, number of samples available per scenario and need for the construction of PRPD, some important changes, apart from the insertion of other steps, were implemented to the methodology of [16], leading to the development of a new one for the detection of PD signals and construction of PRPD, from measurements performed by an HFCT sensor.
Figure 3 displays the novel methodology for any data measured by an HFCT sensor. For a better elucidation of the methodology, observe one of the measurement registrations obtained by HFCT in Figure 1. The step one, the samples of measurement raw data are divided into windows of fixed size, which is defined in function of number of samples obtained in a time interval equivalent to 1/256 of a cycle of the waveform of the voltage applied, i.e., assuming the test voltage is in the 60 Hz frequency, a cycle is equivalent to 16.66 ms and divided into 256 windows. In this case the interval of each window is approximately 65.1 μs. The aim is to make the structure of the results from the HFCT sensor and the output data registered by the commercial equipment that measured PD compatible with IEC method, detailed in Section 3. Figure 3 illustrates the procedure.
The differential energy (step 2), calculated by (1) below, and use of MMG (step 3), are incorporated for samples of window −97 in Figure 2 (see Figure 4A):
E ^ = i = 1 k i ( y i ) 2 k i = + 1 i f y i 0 1 i f y i < 0 ,
where E ^ is energy of signal and y is amplitude of sample. Figure 4B,C show the results for the calculation of differential energy and application of the MMG filter for a window of standard size containing pulses candidate to PD, respectively.
Due to the existence of more than one pulse in a same window and each window being associated with a phase angle, a strategy that enables separating those candidate pulses for discriminating them as either PD, or noise for the construction of PRPD in the final stage of the method is required. Therefore, the step 4 introduces significant contributions to the methodology of [16] (see highlight in Figure 3) for establishing a procedure that objectively determines both subdivision and index of subwindows containing an only pulse candidate to PD. Towards a deeper comprehension, observe the following components highlighted in Figure 4C:
  • A first-order smoothing Savitzky-Golay filter [38] (step 4a) applied to the output of step 3, that from the convolution operation (2) is defined by
    Y j = i = 1 m 2 m 1 2 C i y j + i , with m + 1 2 j n m 1 2 ,
    generates a smoothed version of this (black line in Figure 4C), denoted by Y j , with the coefficients C i pre-computed using the least squares method, for a window of n points estimated around the central value. The parameter m controls the size of the filter ( 2 m + 1 ) as well as its degree of smoothness. Despite a simple implementation, the aforementioned filter proved effective and efficient (due to the low computational resource employed) in discriminating the pulses candidate to PD, as shown in Figure 4C;
  • The threshold produced by Otsu method [36], used as a thresholding technique in the step 4b for determining a magnitude threshold above which pulses can be considered either candidates to PD, or noise. Figure 4C also shows the threshold defined by Otsu for the window under analysis, as indicated by the dashed horizontal line in black;
  • The rising and falling thresholds and the PD candidate pulses generated, respectively, from the identification of crossings with the threshold established by Otsu (step 4b), incorporating the first derivative criterion for the discrimination of pulses (step 4c); and
  • The central point of the samples length between two candidate pulses, which will determine the end of the first subwindow and the beginning of the second one. In the step 4d, subwindows with optimized size containing only one PD pulse will be subordinated to the origin window for the construction of PRPD at the end of the method. Figure 4C illustrates the procedure.
After the subwindows created have been automatically established with optimized size from the window of fixed size taken as an example (Figure 4), the step 5 refers to the kurtosis calculation as a final criterion for discriminating a pulse candidate as PD or noise. For the kurtosis operator (3) and following the same definition adopted in [16], then
γ = E ( x μ ) 4 σ 4 ,
where E ( . ) represents a quantity expected value, and μ (4) and σ 2 (5) are average and variance of samples of signal x, respectively, calculated as
μ = 1 n i = 1 n ( x i ) ,
σ 2 = i = 1 n ( x i μ ) 2 n .
Base on the analysis of the kurtosis operator application to windows or subwindows, ref. [16] established a value of 8 as a generalist threshold of kurtosis value independent of the pulse shape, i.e., candidate pulses whose operator result is greater than or equal to 8 are discriminated as PD. On the other hand, those whose threshold is lower than 8 are noise. In function of the accuracy obtained in the analysis (above 98%), such a criterion was adopted in the present study. Figure 5 illustrates the methodological procedure of pulse discrimination considering the first subwindow extracted from fixed window 97. The kurtosis operator for the samples calculated from left to right and vice-versa shows, simultaneously, value above 8 in the region of incidence of pulse (see Figure 5C), thus considered a PD pulse.

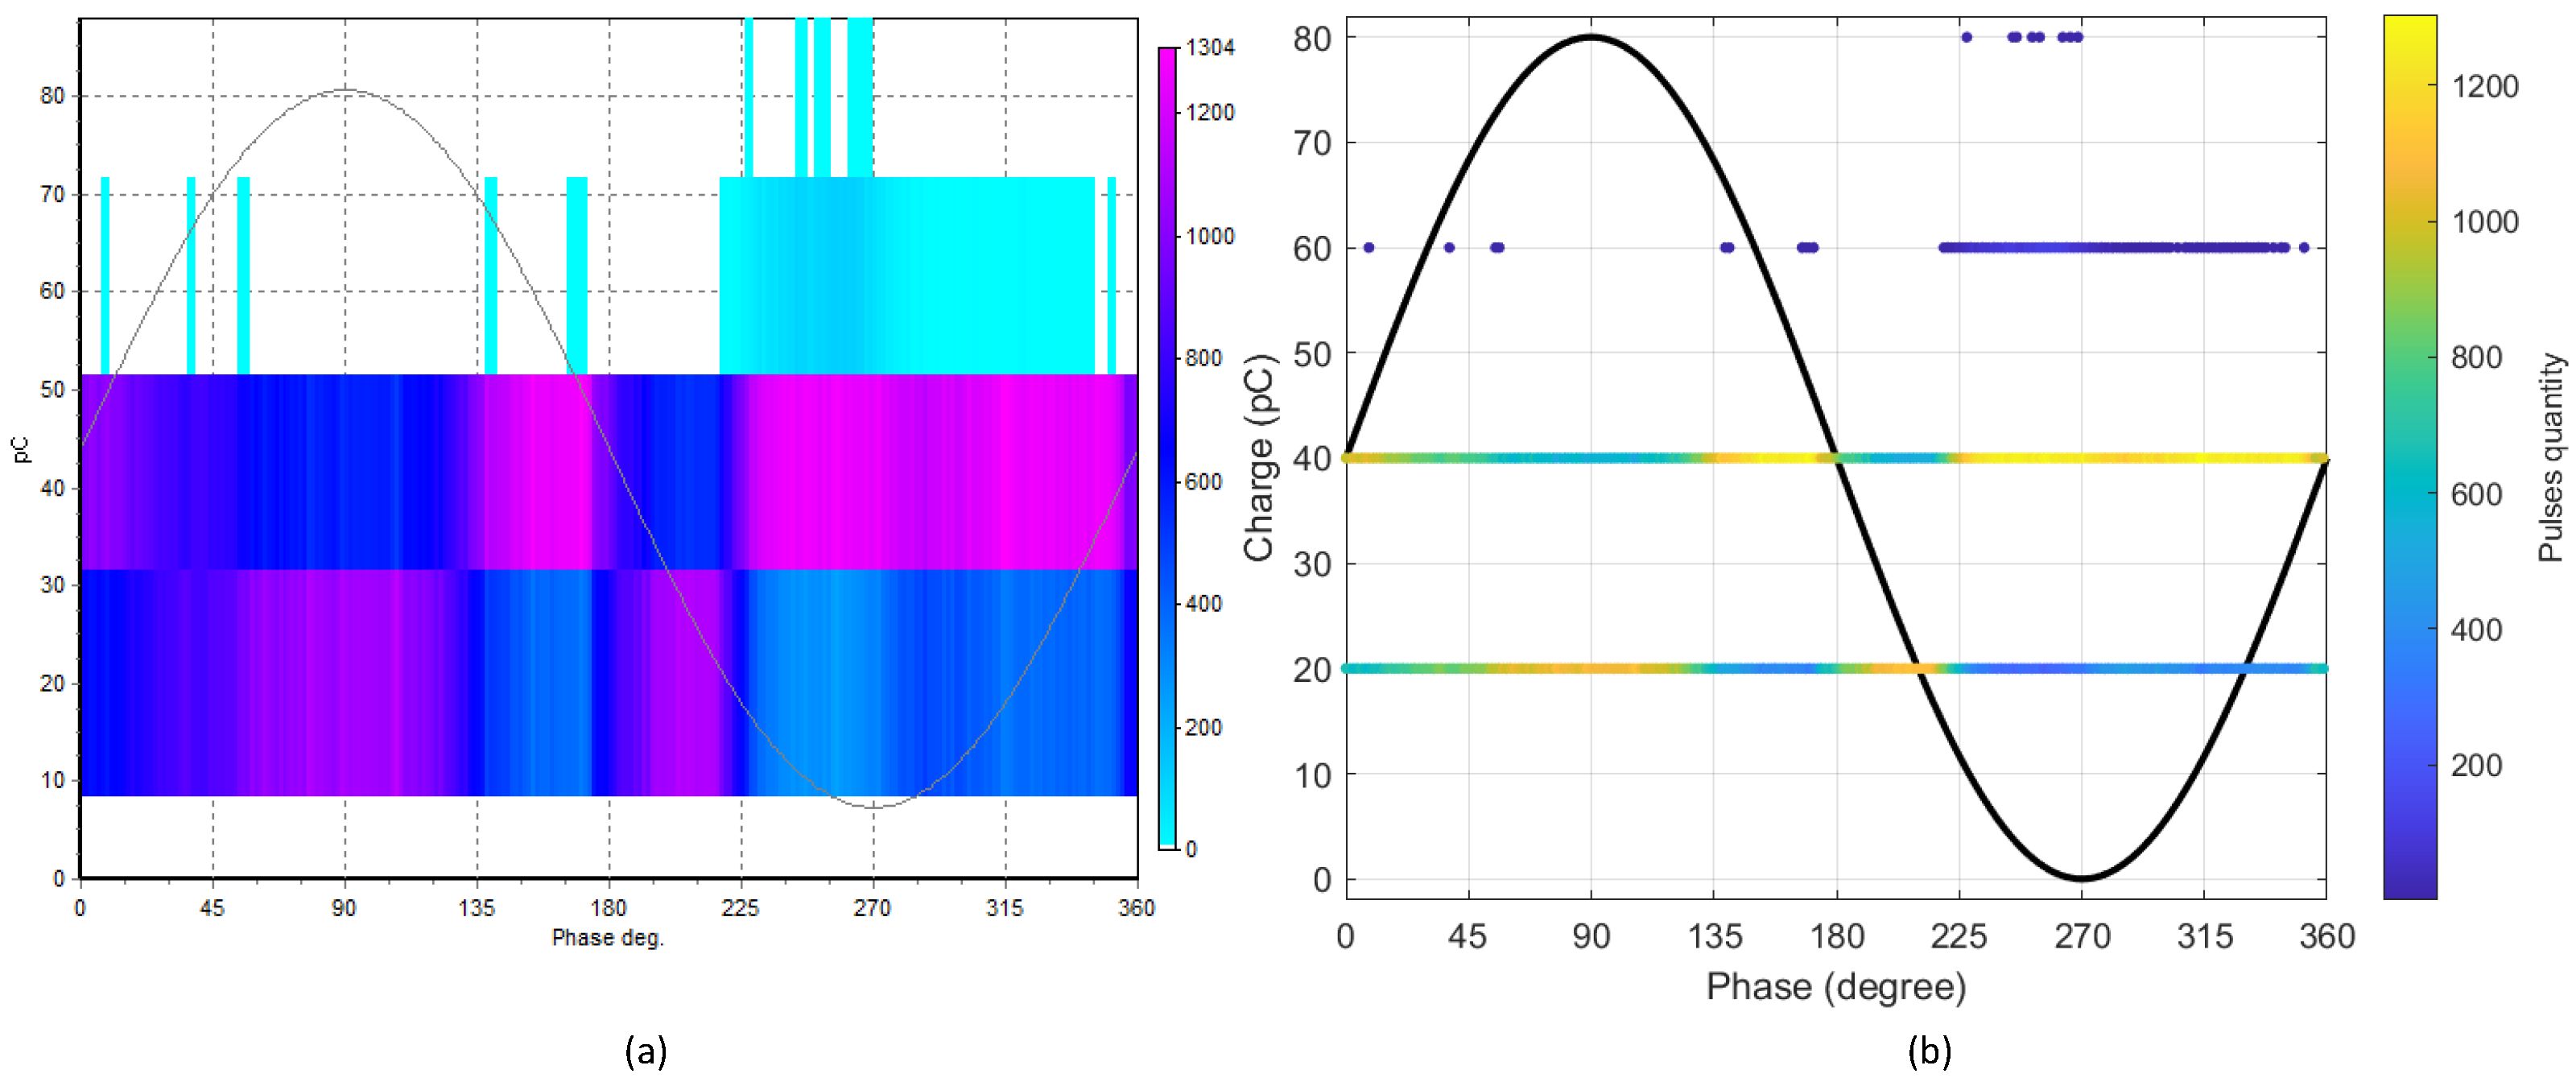
2.2. Phase-Resolved Partial Discharge Assembly

As highlighted at the beginning of Section 2.1, a zero crossing technique adopted aimed at precisely identifying the cycles of waveform of the voltage applied to ITs, hence, constructing the angular references for the reference cycle and for the other cycles (highlighted in the abscissa of Figure 1). Moreover, the HFCT signal was initially subdivided into windows whose size was coherent with the smallest angular discrimination desired for PRPD. At Section 2.1 also highlighted such a PD activity representation was established to coinciding with windows of the commercial equipment that measured PD pulses by the electrical method.
The measure to be referenced in PRPD can be calculated after the subdivision of windows and their discrimination as PD subwindows. The peak point of the morphological gradient was chosen as the angular reference of the subwindow for cases in which the pulse passes two distinct angular positions (at the beginning or at the end of the window). The measure is individually calculated per pulse, initially forming a table with both amplitude and phase for each pulse. The number of intervals to be discretized in the measure was chosen to coinciding with the one of the commercial equipment. After the construction of the initial table, the values were discretized according to that choice.
The inputs of same amplitude and phase were grouped towards a table with three entities, namely, phase, measure amplitude, and counting, which is equivalent to the commercial equipment output and serves as input for the routine of diagram plotting. A vector of voltage values obtained from the decimation of voltage values initially filtered is also part of that routine.
The procedure can accommodate different measures, i.e., the measure adopted in this study is the value of the voltage peak verified in the PD pulse expressed in mV. However, the same procedure can be employed if a module is inserted for the calculation of the apparent load of the PD pulse (measured in pC).
A data structure that favors the use of identified pulses and metadata in future analysis was built. The present development can be embarked in hardware and enable evaluations of the conditions of equipment operations in real time with minor modifications to the algorithm, such as the implementation of windowing techniques. Additionally, it can support studies that utilize pattern recognition techniques for the automatic characterization of defects through the structuring and accumulation of test results.

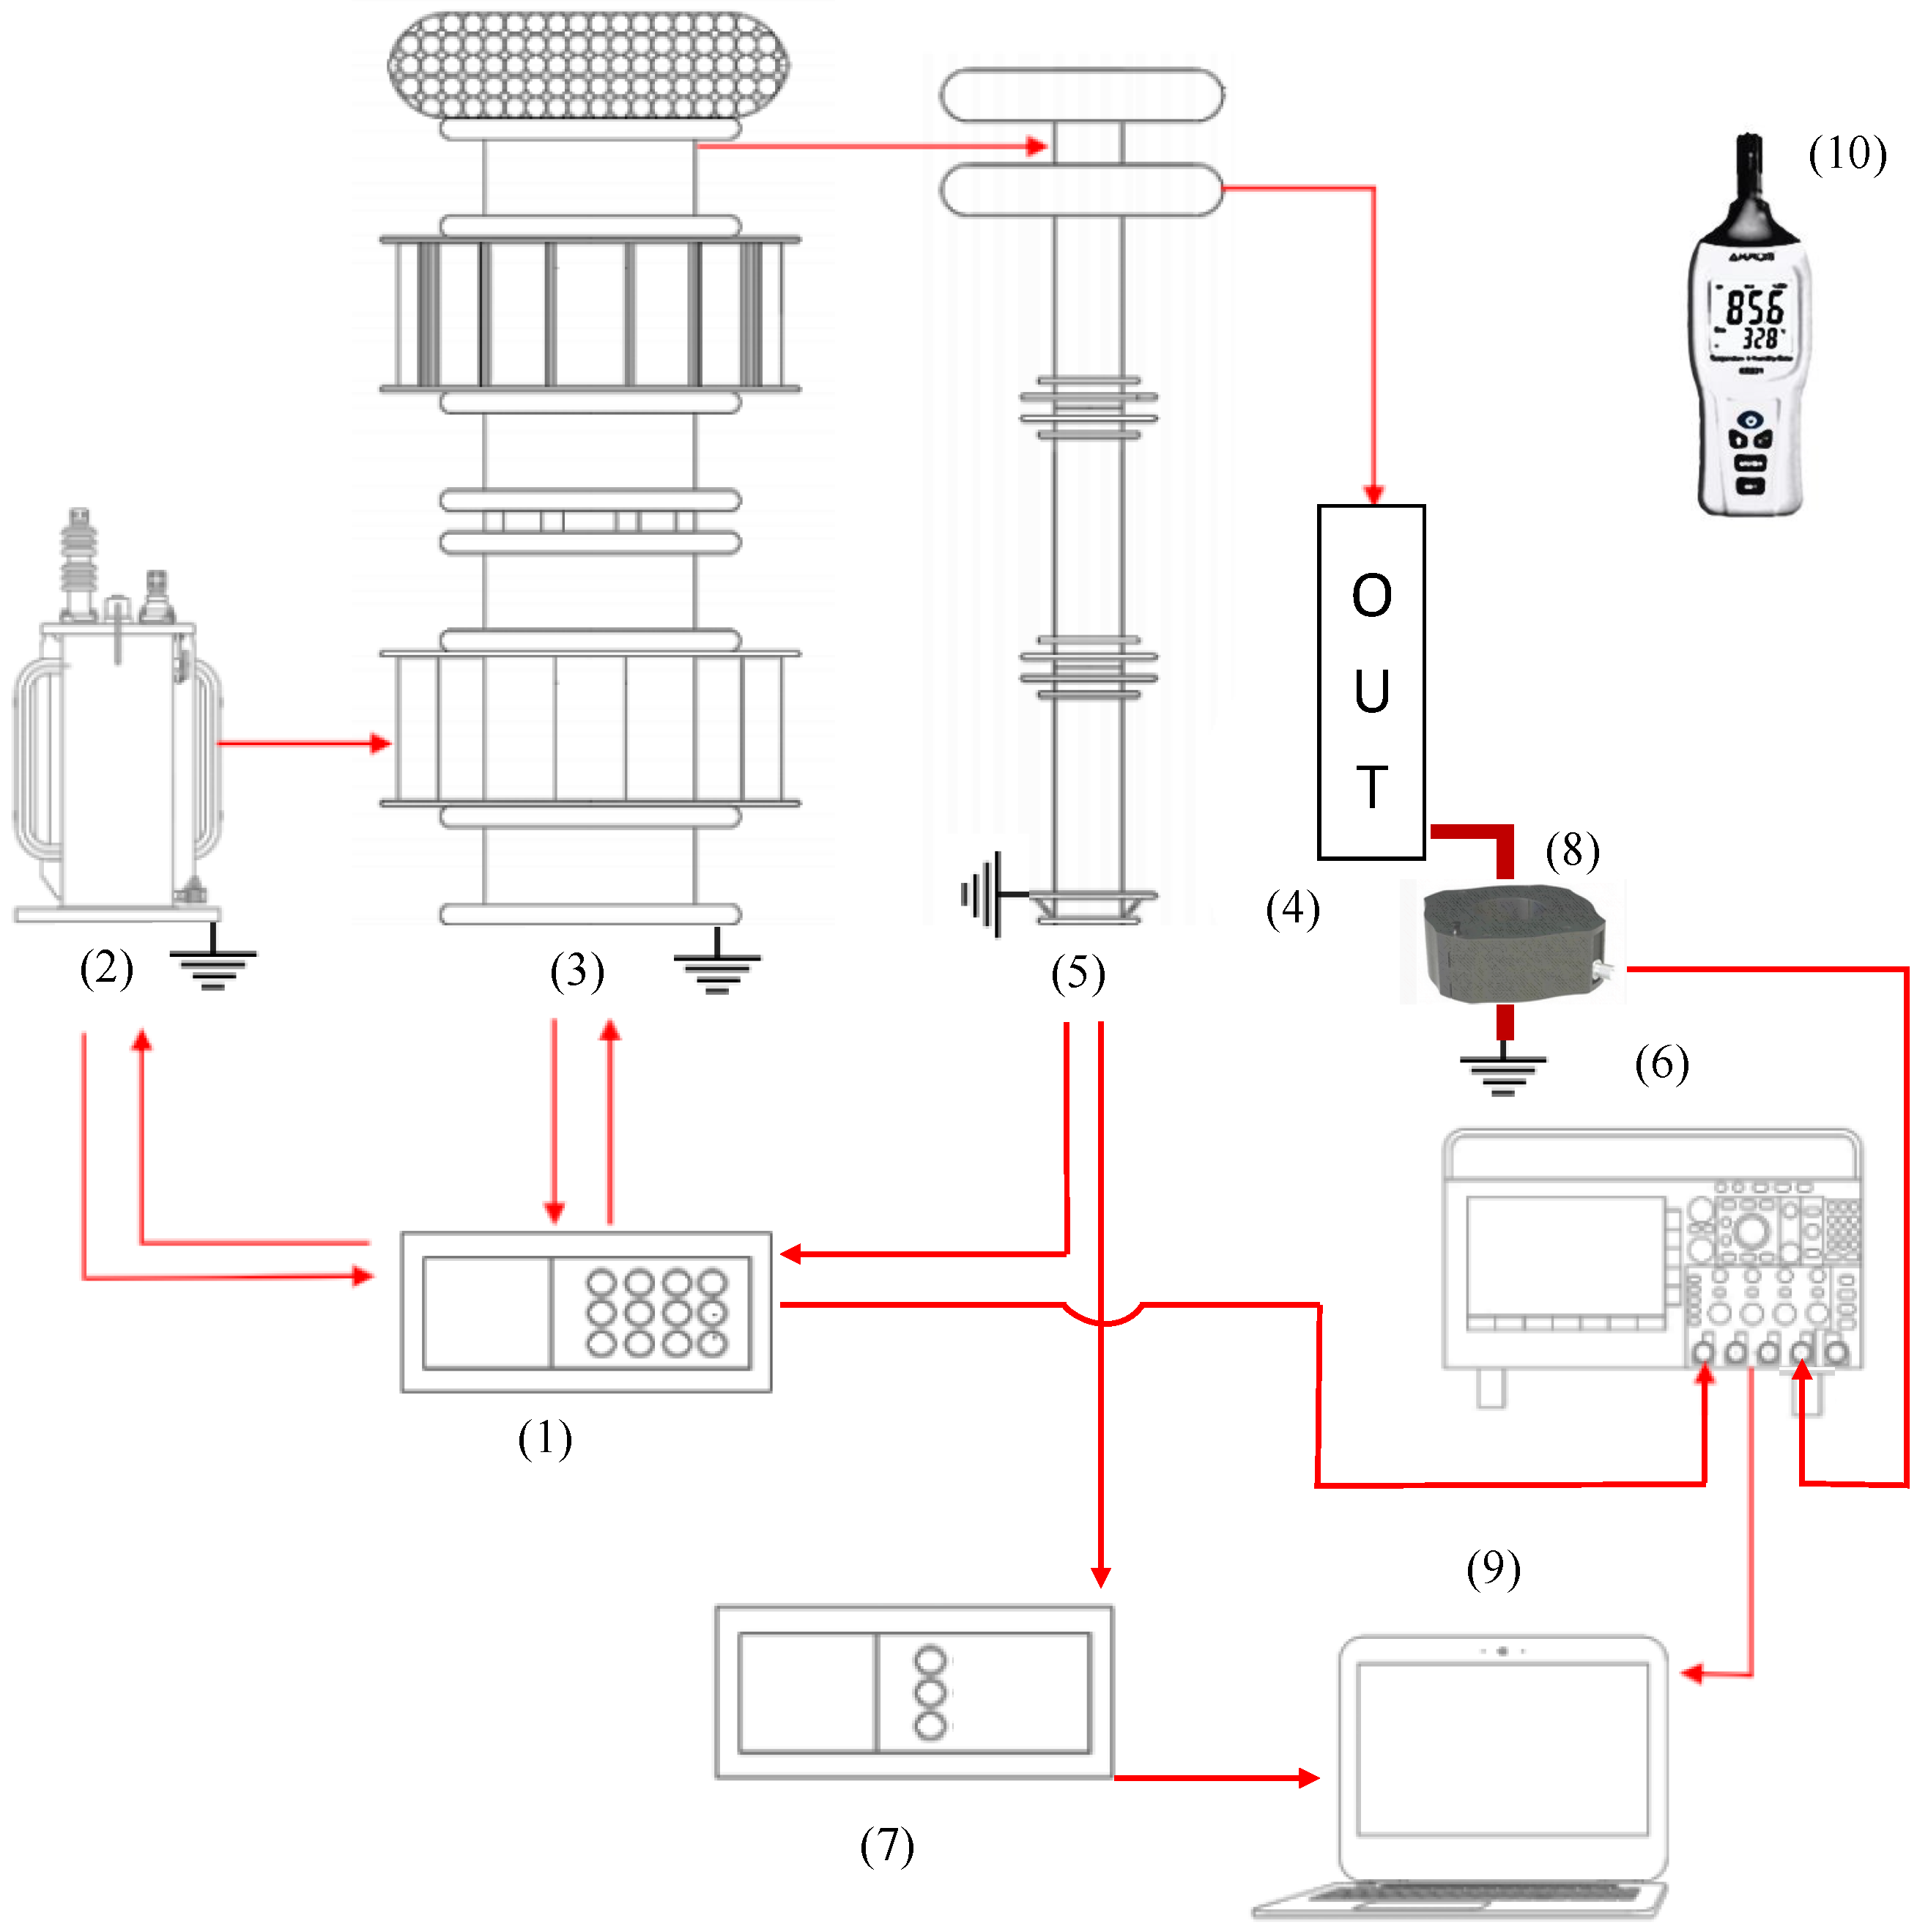
3. Experimental Setup

The laboratory is equipped with a resonant series system for the generation and measurement of voltage levels up to 800 kV, 60 Hz. The PD measurement trials by IEC method are in accordance with the setup shown in Figure 6 and detailed in what follows.
Both elements and procedures used in the experimental setup consist of: the trial managed by the control and measurement system (1), which activates two transformers, of which one is a regulator and the other is an exciter represented by (2), so that the latter energizes the resonant-series source (3). The desired voltage is then applied to the terminals of the object tested (OUT) (4). The capacitive voltage divider (5) measures voltage at the OUT terminals acquired by (1) and, from one of its output channels, voltage is also measured by a digital oscilloscope (6) with a channel of high-frequency current signals generated by PD acquired by a remote measuring system still available in (5) DDX 9121ARIV (7). The HFCT sensor, represented by (8), is installed involving the OUT grounding conductor connected to (6) by a coaxial cable; all data extracted from measures are stored in a computer (9) and, for all measured scenarios, environmental conditions of temperature and humidity are registered by a thermohygrometer (10) prior to the trials established for each setup.
As addressed elsewhere, a PD detector coupled to a quadripole circuit embarked in a capacitive voltage divider acquires apparent electrical load signals. One of the PD detector outputs by IEC method is the map of PRPD and made available by software in both image and textual formats (compatible with XML—extensible markup language), of which the latter is tabulated in a matrix ( 3 × 1 ) (where n is number of occurrences of values in the diagram during measurement time t) containing phase, θ (in electrical degrees), PD intensity (in pC), and number of pulses.
The output values are internally discretized and stored in the commercial solution in 8-bit words with signal for the load magnitude resolution and 8-bit words with no signal for discriminating the phase of the waveform of the voltage applied where the PD pulses fall.
Data in ‘.xml’ format is used for the purpose of providing the PRPD for the IEC method outside the manufacturer’s software environment. Therefore, an algorithm was developed and, for validation purposes, further compared with the image output, as illustrated in Figure 7, from data obtained in a PD measurement test. In all cases, phase-resolved PD of IEC method serves as a reference for confirming the PD occurrence.
On the other hand, a model HFCT-300 (Doble) high-frequency current transformer sensor coupled to a digital oscilloscope measures the PD signals available in the OUT grounding conductor. The band width of the sensor is 35 kHz to 20 MHz and the oscilloscope has the following characteristics: 350 MHz (analogical frequency) and up to 2.5 GS/s sampling rate. The data acquired and stored are further processed according to the methodology established in Section 2.1.

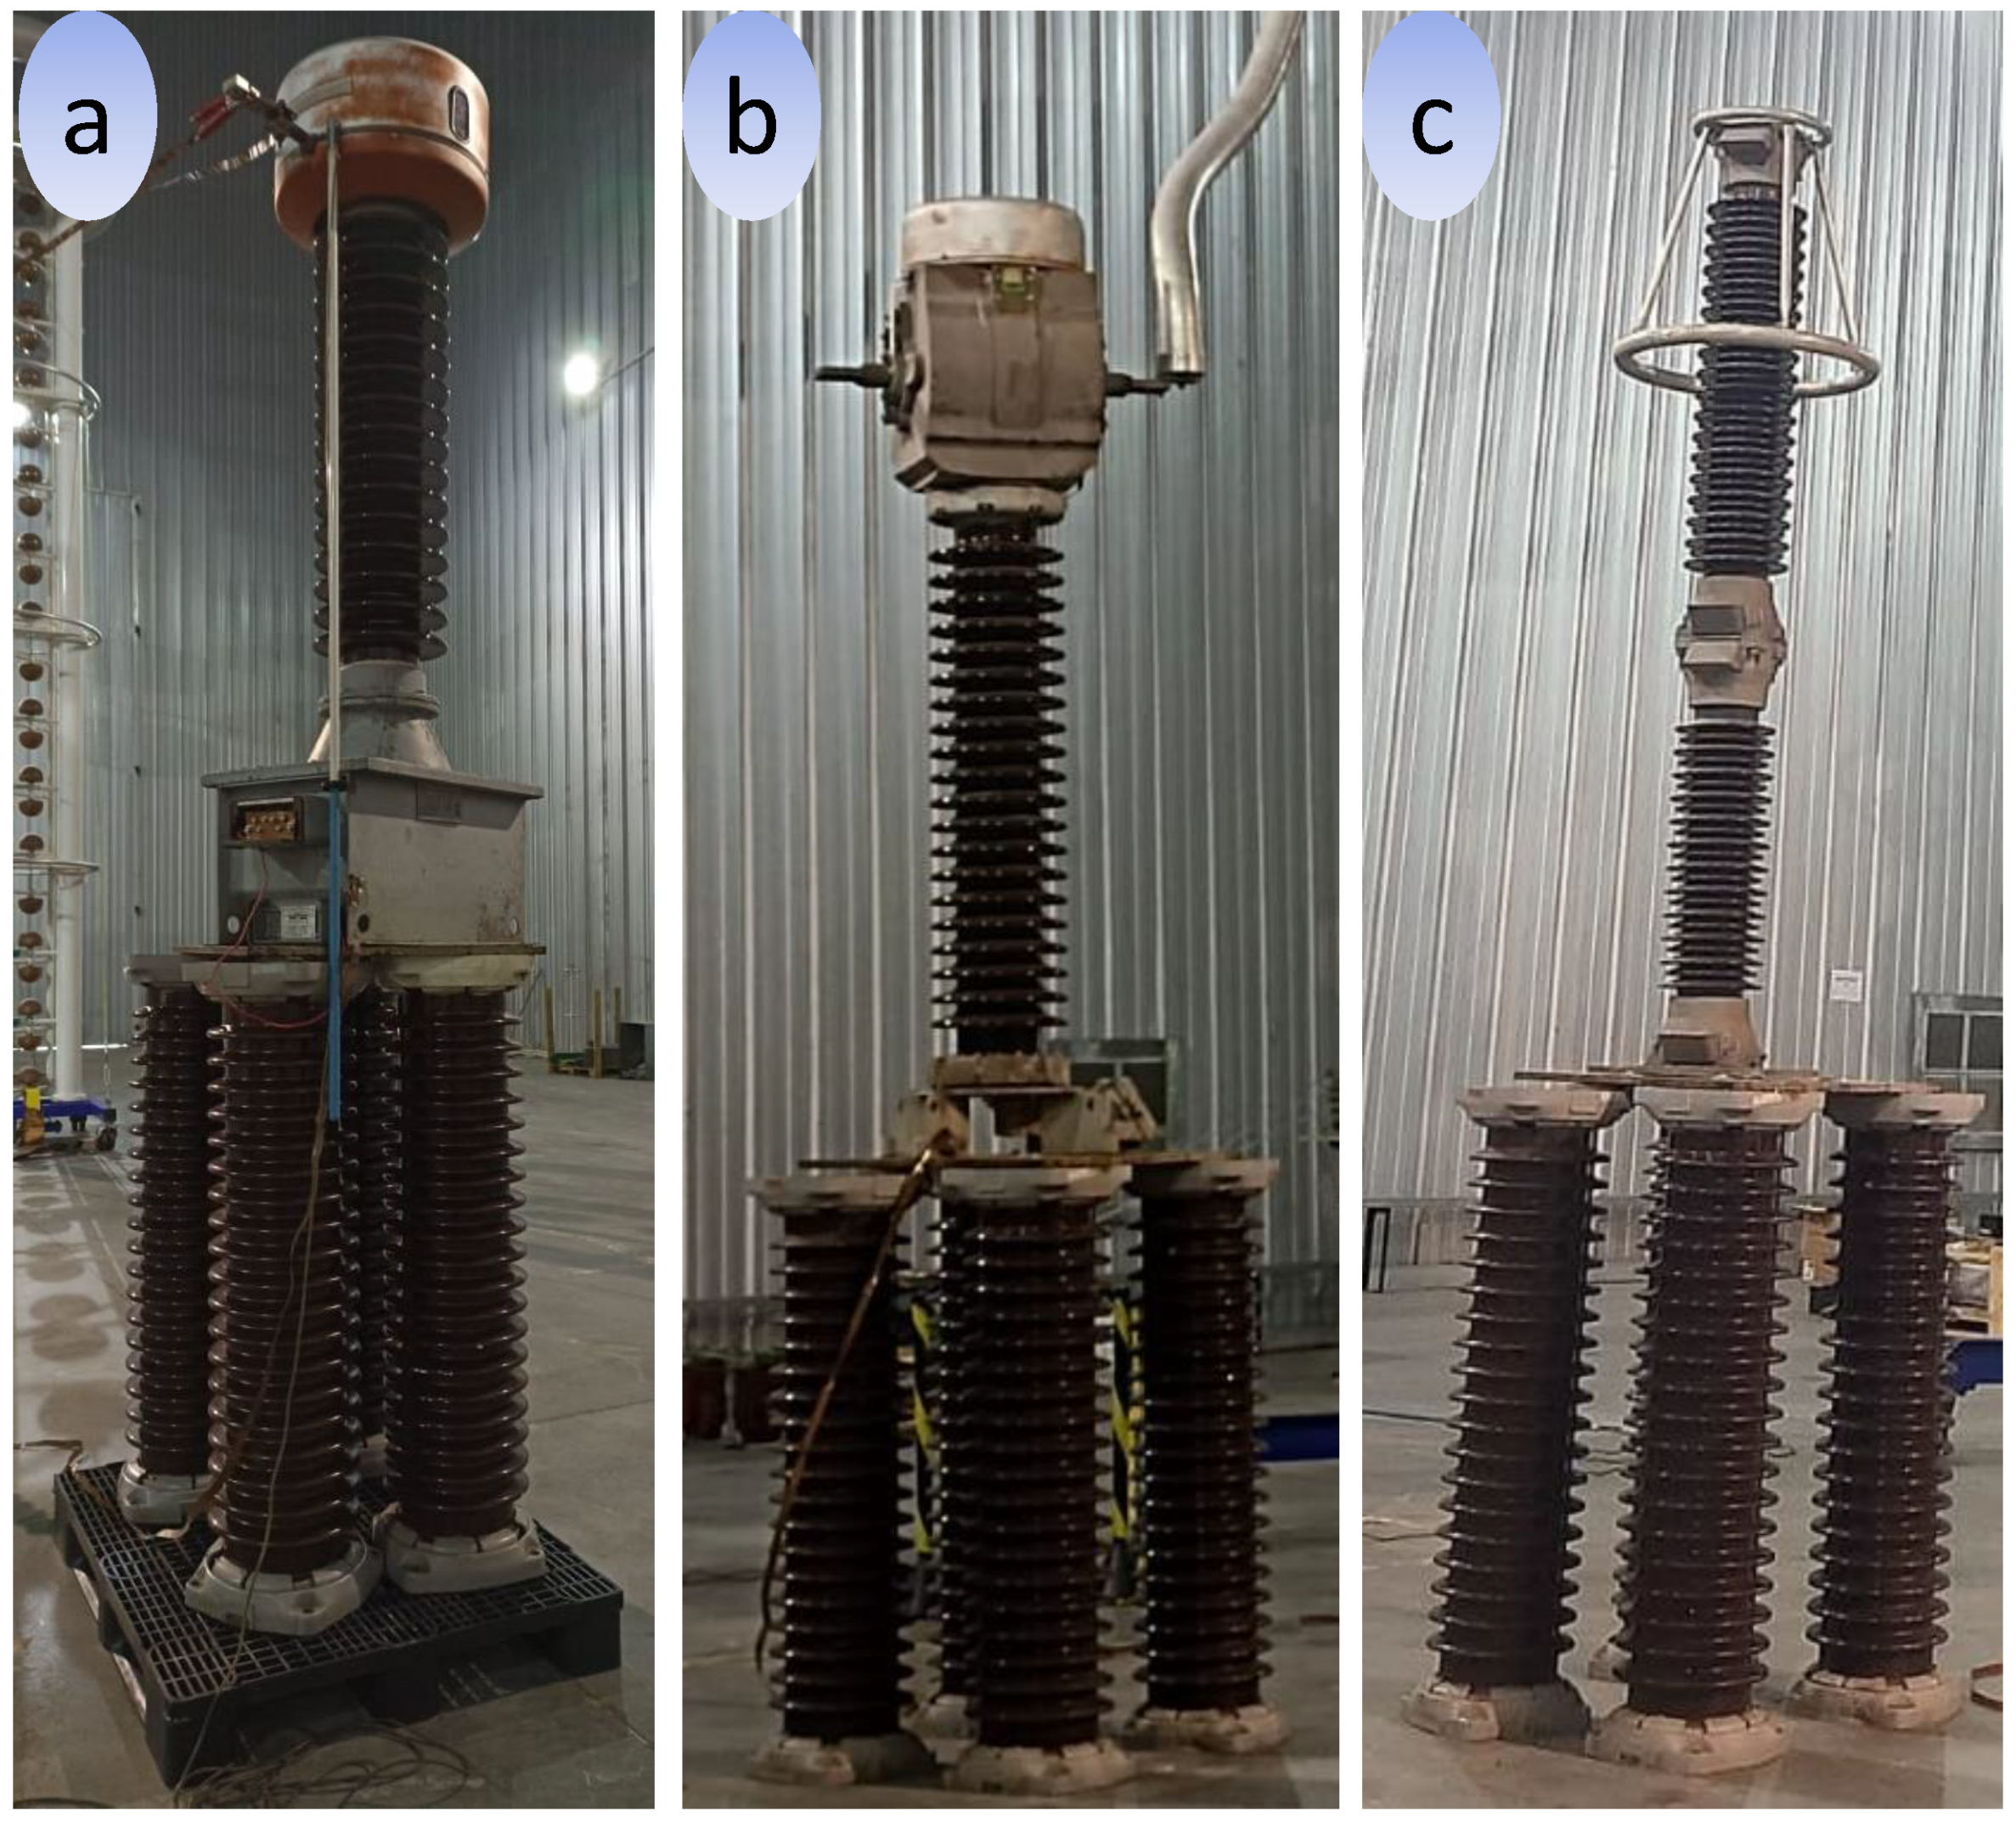
3.1. Description of Objects Under Testing and Tests

Figure 8 shows the 3 equipment removed from operation and made available for PD measurement trials. Among OUT are two different types of IT and one SA, namely, a 145 kV voltage class inductive voltage transformer (IVT), 145 kV current transformer (CT), and the SA of 192 kV nominal voltage.
Initial tests in the IT for the detection of PD by IEC method revealed no PD activity. Therefore, some non-destructive procedures were adopted for inducing PD in the external insulation (corona and surface type) of the IT and evaluating the PD measurement results through the measurement setup shown in Figure 8. The tests conducted for the IT are categorized into four types of scenarios, namely, normal, corona, and saline solution deposition. Section 3.1.1 details each of such tests.
The same tests were conducted in the SA. Despite the 40 kV voltage level applied (well below the approximately 132.8 kV operation level), the PD activity was observed, indicating, in that first analysis, a possible anomaly in the equipment. Therefore, the non-destructive procedures were not adopted in the tests with the SA for inducing PD.

3.1.1. Insertion of External PD into IT and Test Scenarios

  • Normal
A test called “normal” has no PD occurrence. In general, such experiments involve clean equipment that operates under standard conditions (e.g., no pollution). They also include tests in which, despite elements being introduced for triggering PD, such as artificially depositing light pollution in the equipment or even inserting a metallic object in the OUT basis, no PD was observed for the PRPD test.
  • Corona;
A metallic object is placed in the energized part of the equipment (upper part), creating a load accumulation that triggers a phenomenon known as corona effect, which typically occurs in tip structures. The aim is to observe and analyze answers associated with the occurrence of that effect in those experiments, thus evaluating the PD detection capacity related to that specific condition. Figure 9a illustrates the Corona test.
  • Saline solution deposition;
Such tests involve the application of saline pollution solutions in all external surface of IT for inducing the occurrence of superficial PD, such as dry band arcs and conductive paths between energized and grounded parts and /or corona-type. Figure 9b shows a pollution impregnation test.
Norm IEC 60815:2008 [39] was the theoretical foundation for the determination of pollution severity and preparation of saline solutions for deposition on ITs. It establishes the severity of the pollution deposited in an insulator can be determined according to a factor called Equivalent salt deposit density (ESDD). Such a factor is directly proportional to the degradation of insulation capacity due to water becoming conductor in combination with salt, increasing its conductivity as more salt is added to the solution.
The procedure of cleaning and calculation of ESDD is usually adopted for insulators strings. However, towards the establishment of reference values for external pollution, hence, superficial PD and corona, IT were impregnated with pollution with E S D D 0.05 mg/cm2. The ESDD value is approximate, since the solution temperature was 20 °C and a simplification was performed for the calculation of IT areas. However, according to the test results, intense superficial PD were produced.
Although quite low in comparison to the values of the norm, the pollution level used here is sufficient for producing PD and, in more intense cases, activated the protection of the resonant source. Such protection has no specific adjustment; however, it is based on a second-order high-pass filter embarked in the control and measurement system (element 1 in Figure 6) that monitors the distortion level of the applied voltage measured. When the PD occurrence is highly intense, the current pulses generated by PD cause strong distortions in the voltage waveform, activating protection.
The tests aim at producing incipient PD signal patterns measured by an HFCT sensor with no occurrence of electrical arcs of apparent defects, thus enabling, in real cases and, as further discussed, decision-making based on IT predictive maintenance in function of problems caused by external PD and becoming an important issue for the substation operation.
The procedure for the production and measurement of PD resulting from pollution impregnation involved:
  • Preparation of the saline solution and ESDD calculation considering an approximate value of the IT superficial area and disregarding the temperature;
  • Application of pollution to all the IT body by a sprayer;
  • Application of operation nominal voltage of the equipment; and Measurement of PD activity by IEC and HFCT methods.
The test scenarios with SA involved analyses with the complete equipment, i.e., the two serial modules, separately considered. As addressed in the following section, the SA upper module showed PD levels of nC order, which was a determining factor for investigating the state of both zinc oxide blocks and connection metallic components, all within the porcelain case of the SA.

4. Results and Discussions

Regarding partial discharges diagnosis, a set of 152 tests were conducted, with simultaneous acquisitions involving the HFCT sensor and IEC methods. This section presents the results of 7 tests from this set, as follows: 1 test with the IVT as the OUT (Figure 8a); 2 tests applied to the CT (Figure 8b); and 4 tests involving the SA (Figure 8c). To verify the accuracy of the methodology proposed in qualitative comparison with the standardized method, the results obtained for PD activity in terms of the phase-resolved PD diagram were expressed on different vertical scales, namely, PD pulse amplitude in mV for the proposed method, and apparent PD charge in pC for the standardized method.
Figure 10 displays the result of the data collected in a class 145 kV IVT subjected to 79.7 kV applied voltage and considering the influence of the saline solution applied to the IVT external insulation for achieving an approximately 0.05 mg/cm2 ESDD level. Towards better results with the methodology proposed, both time and amplitude scales varied in the oscilloscope. The acquisition time was 10 s for DDX, which enabled the acquisition of 600 cycles of the voltage wave (of 60 Hz frequency), whereas 6 acquisitions were performed in the methodology proposed, each with 0.1 s acquisition time, leading to 0.6 total seconds. The independent acquisitions and the phase-synchronization methodology enabled making use of 29 cycles, or 0.483 effective seconds.
Despite having only 4.83% of the effective acquisition time, the methodology proposed can generate a PRPD diagram showing the same tendencies of the commercial equipment. The following important differences are also observed:
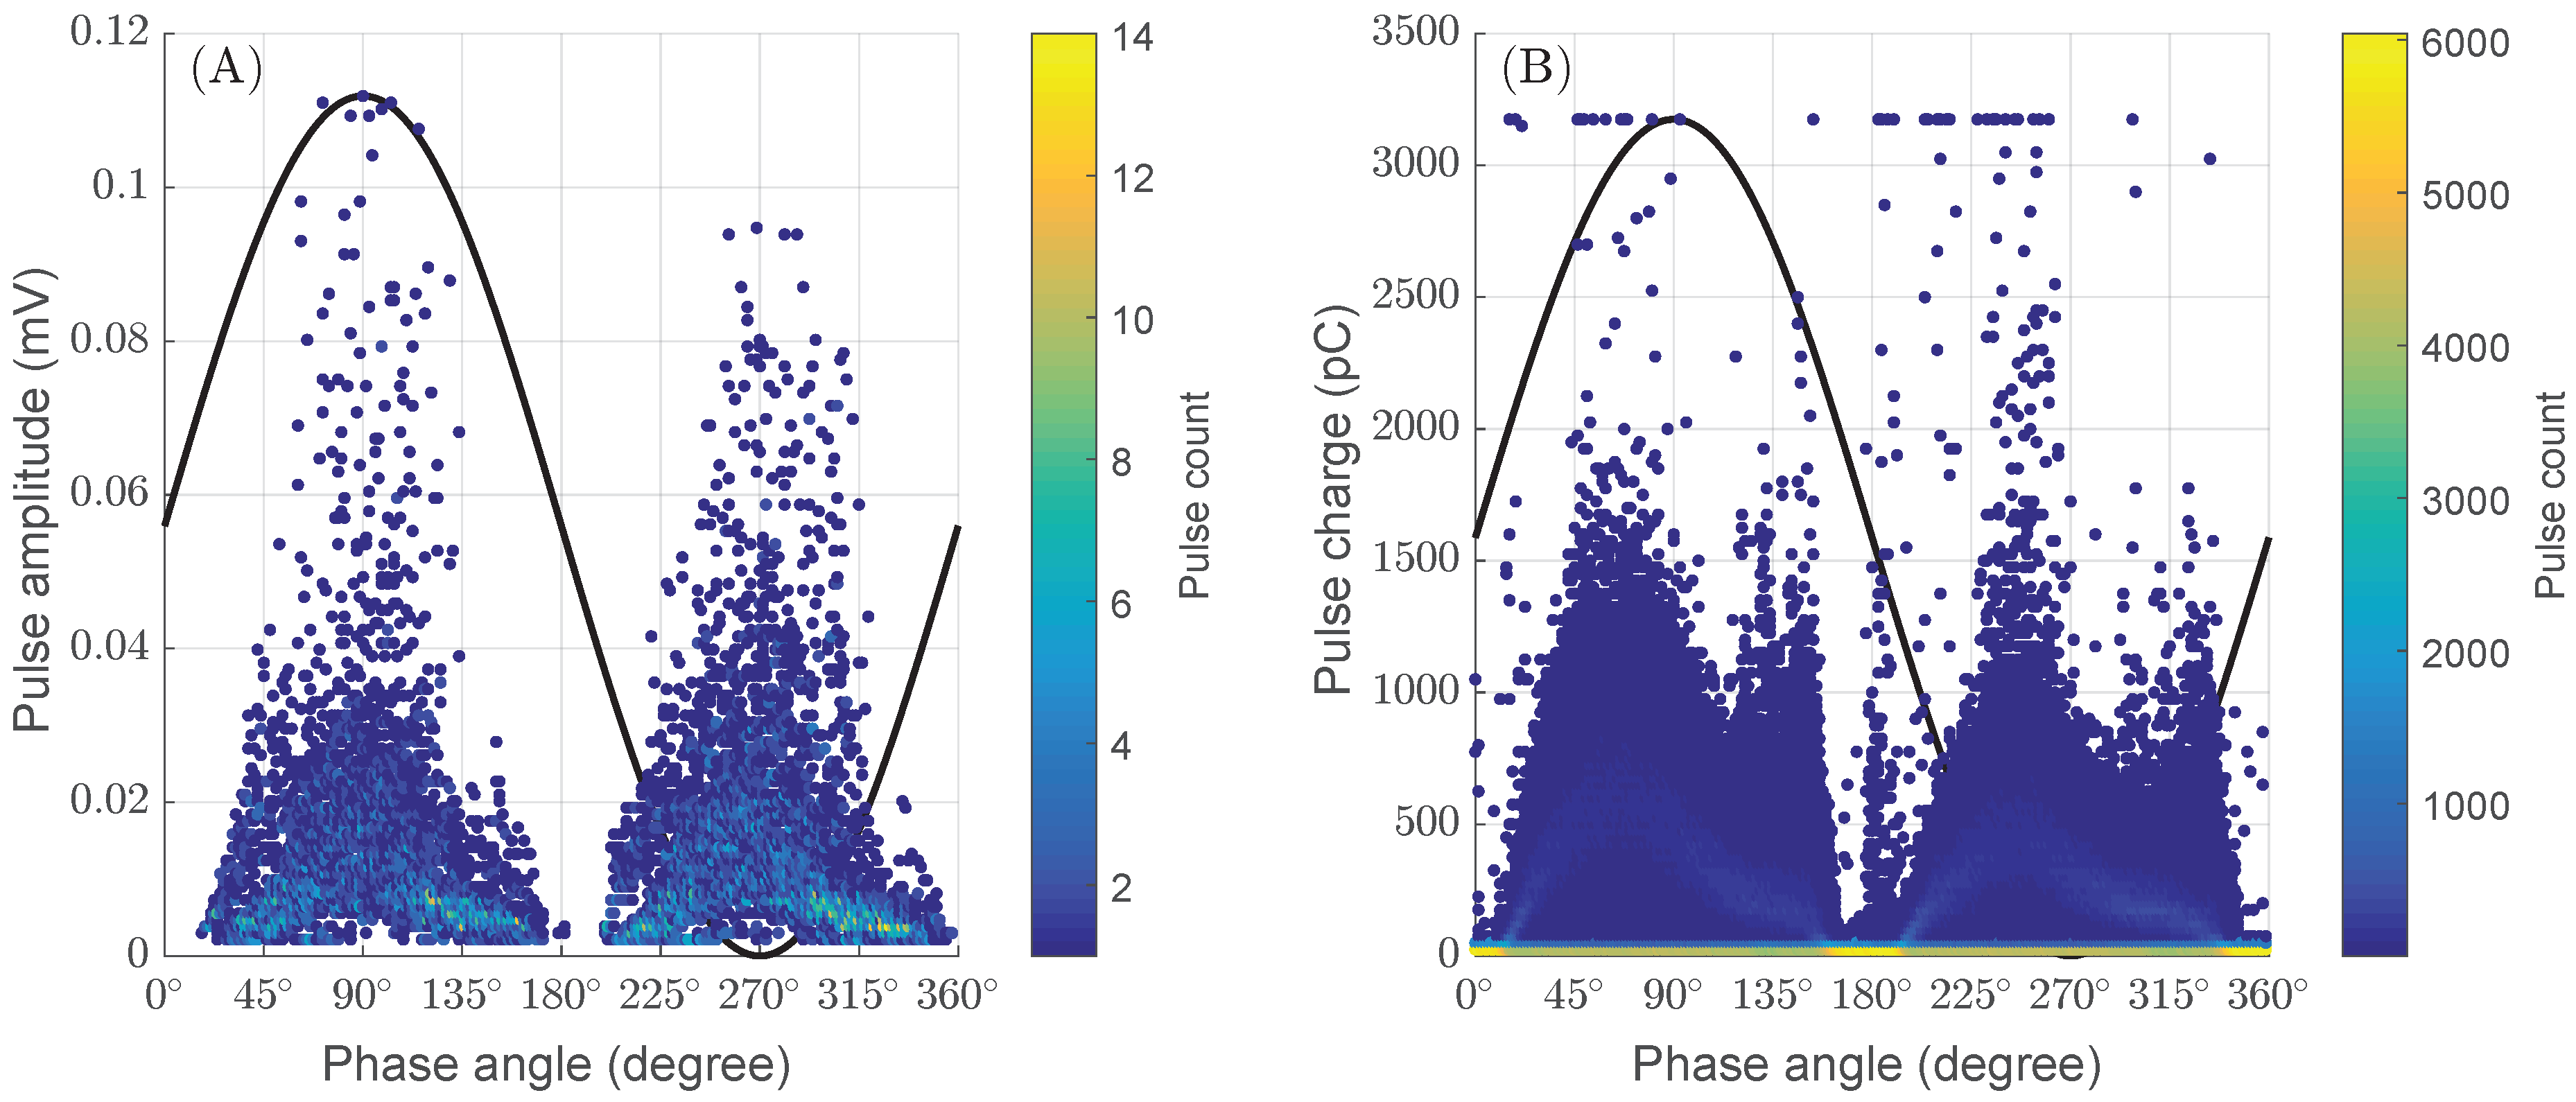
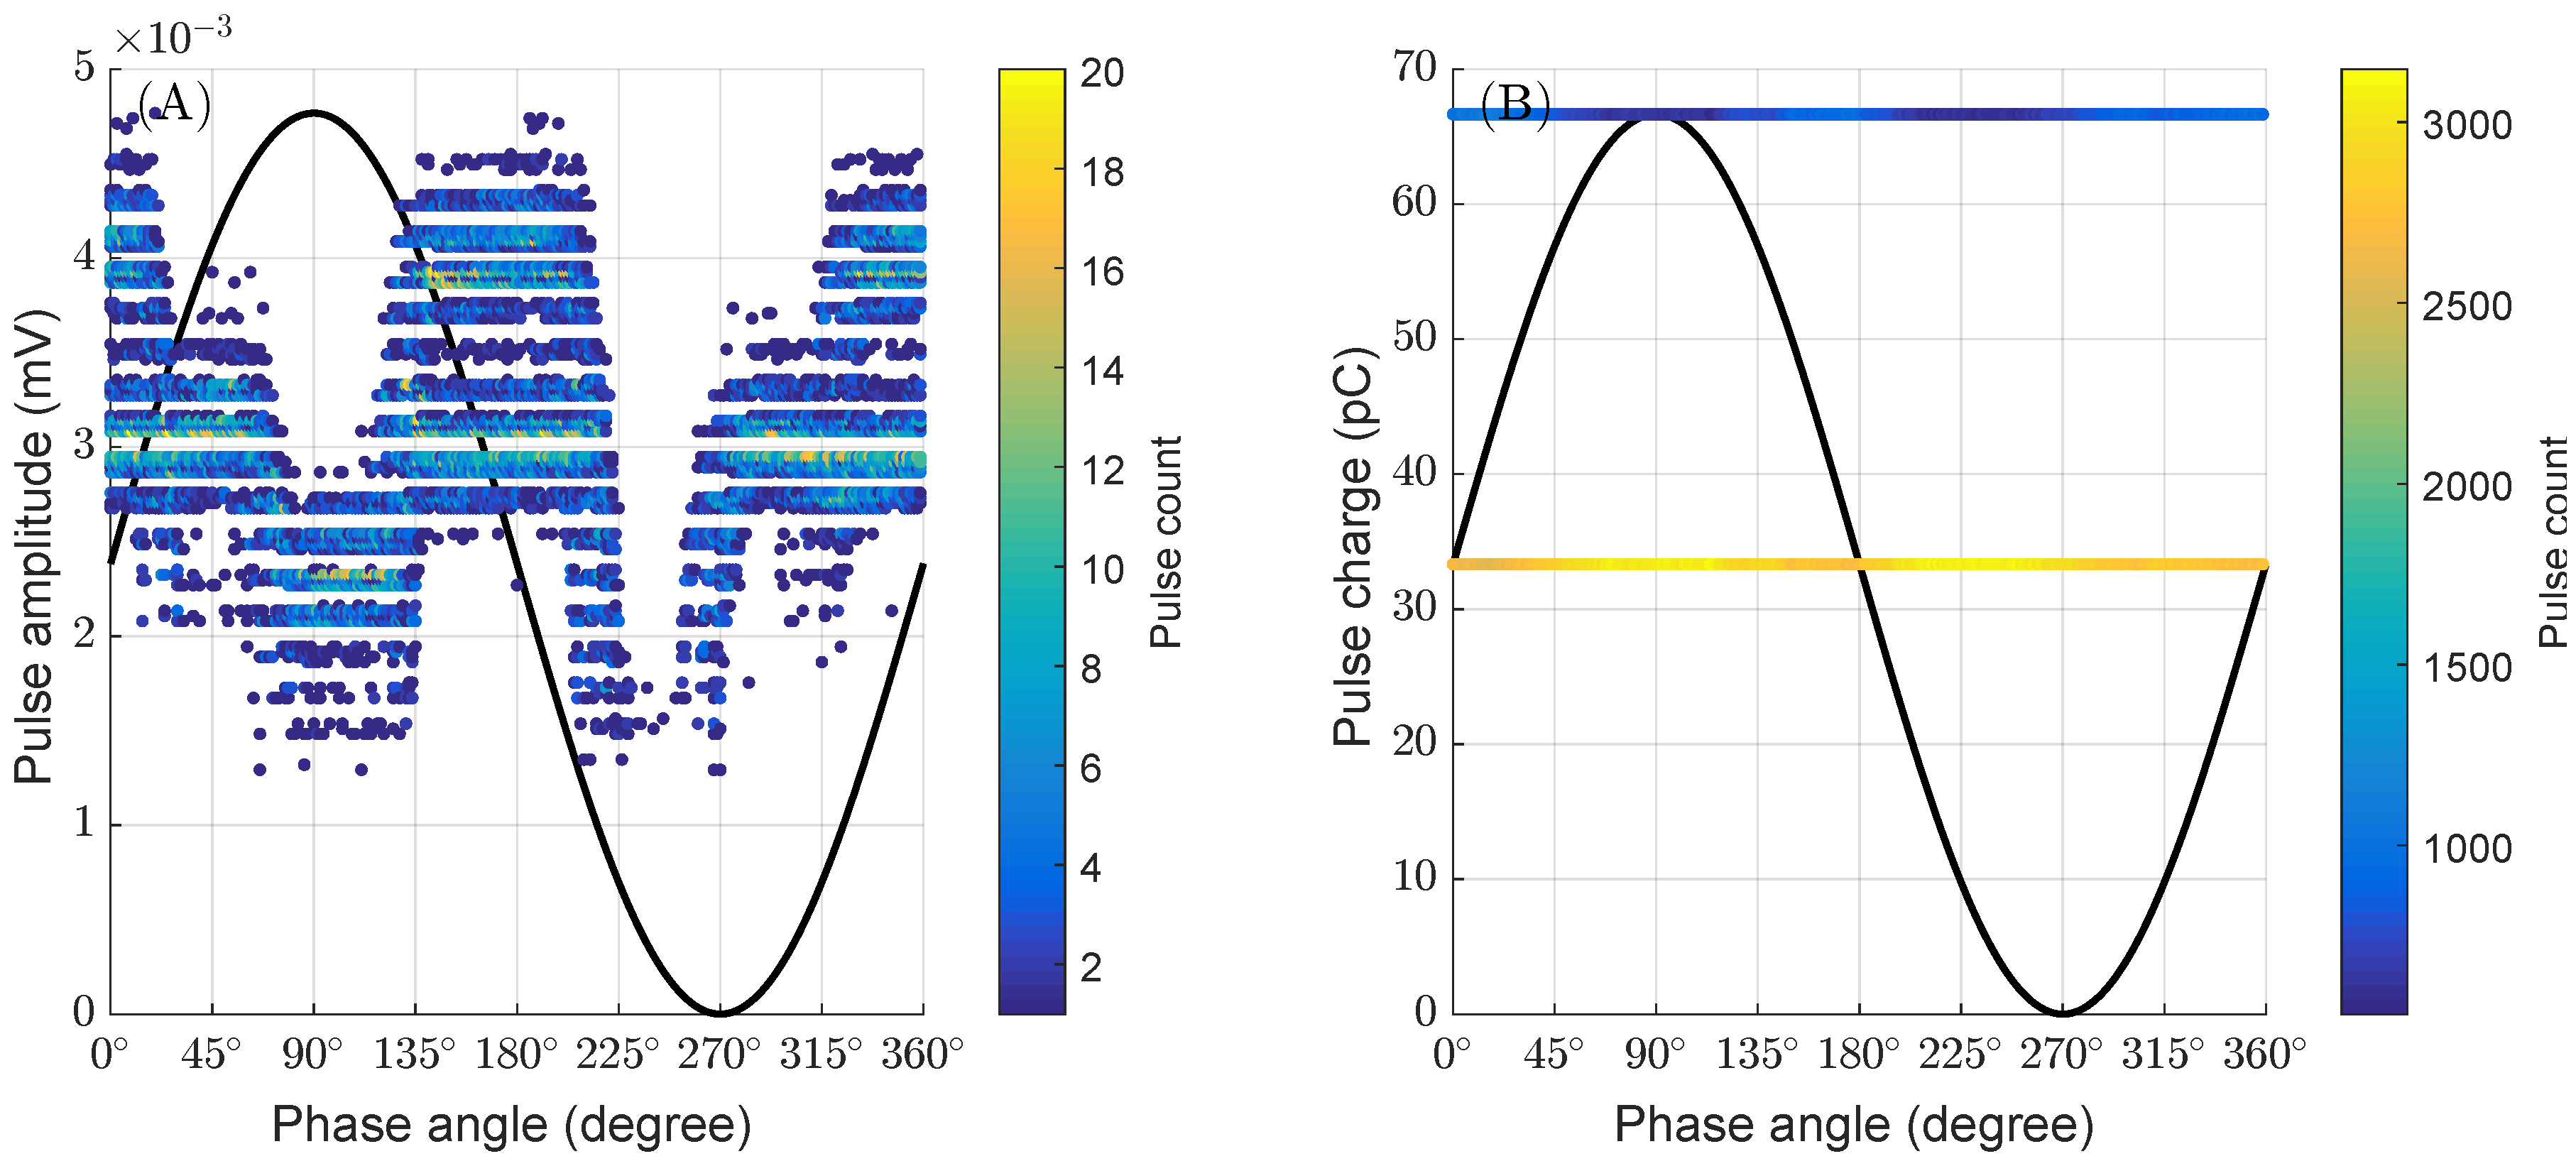
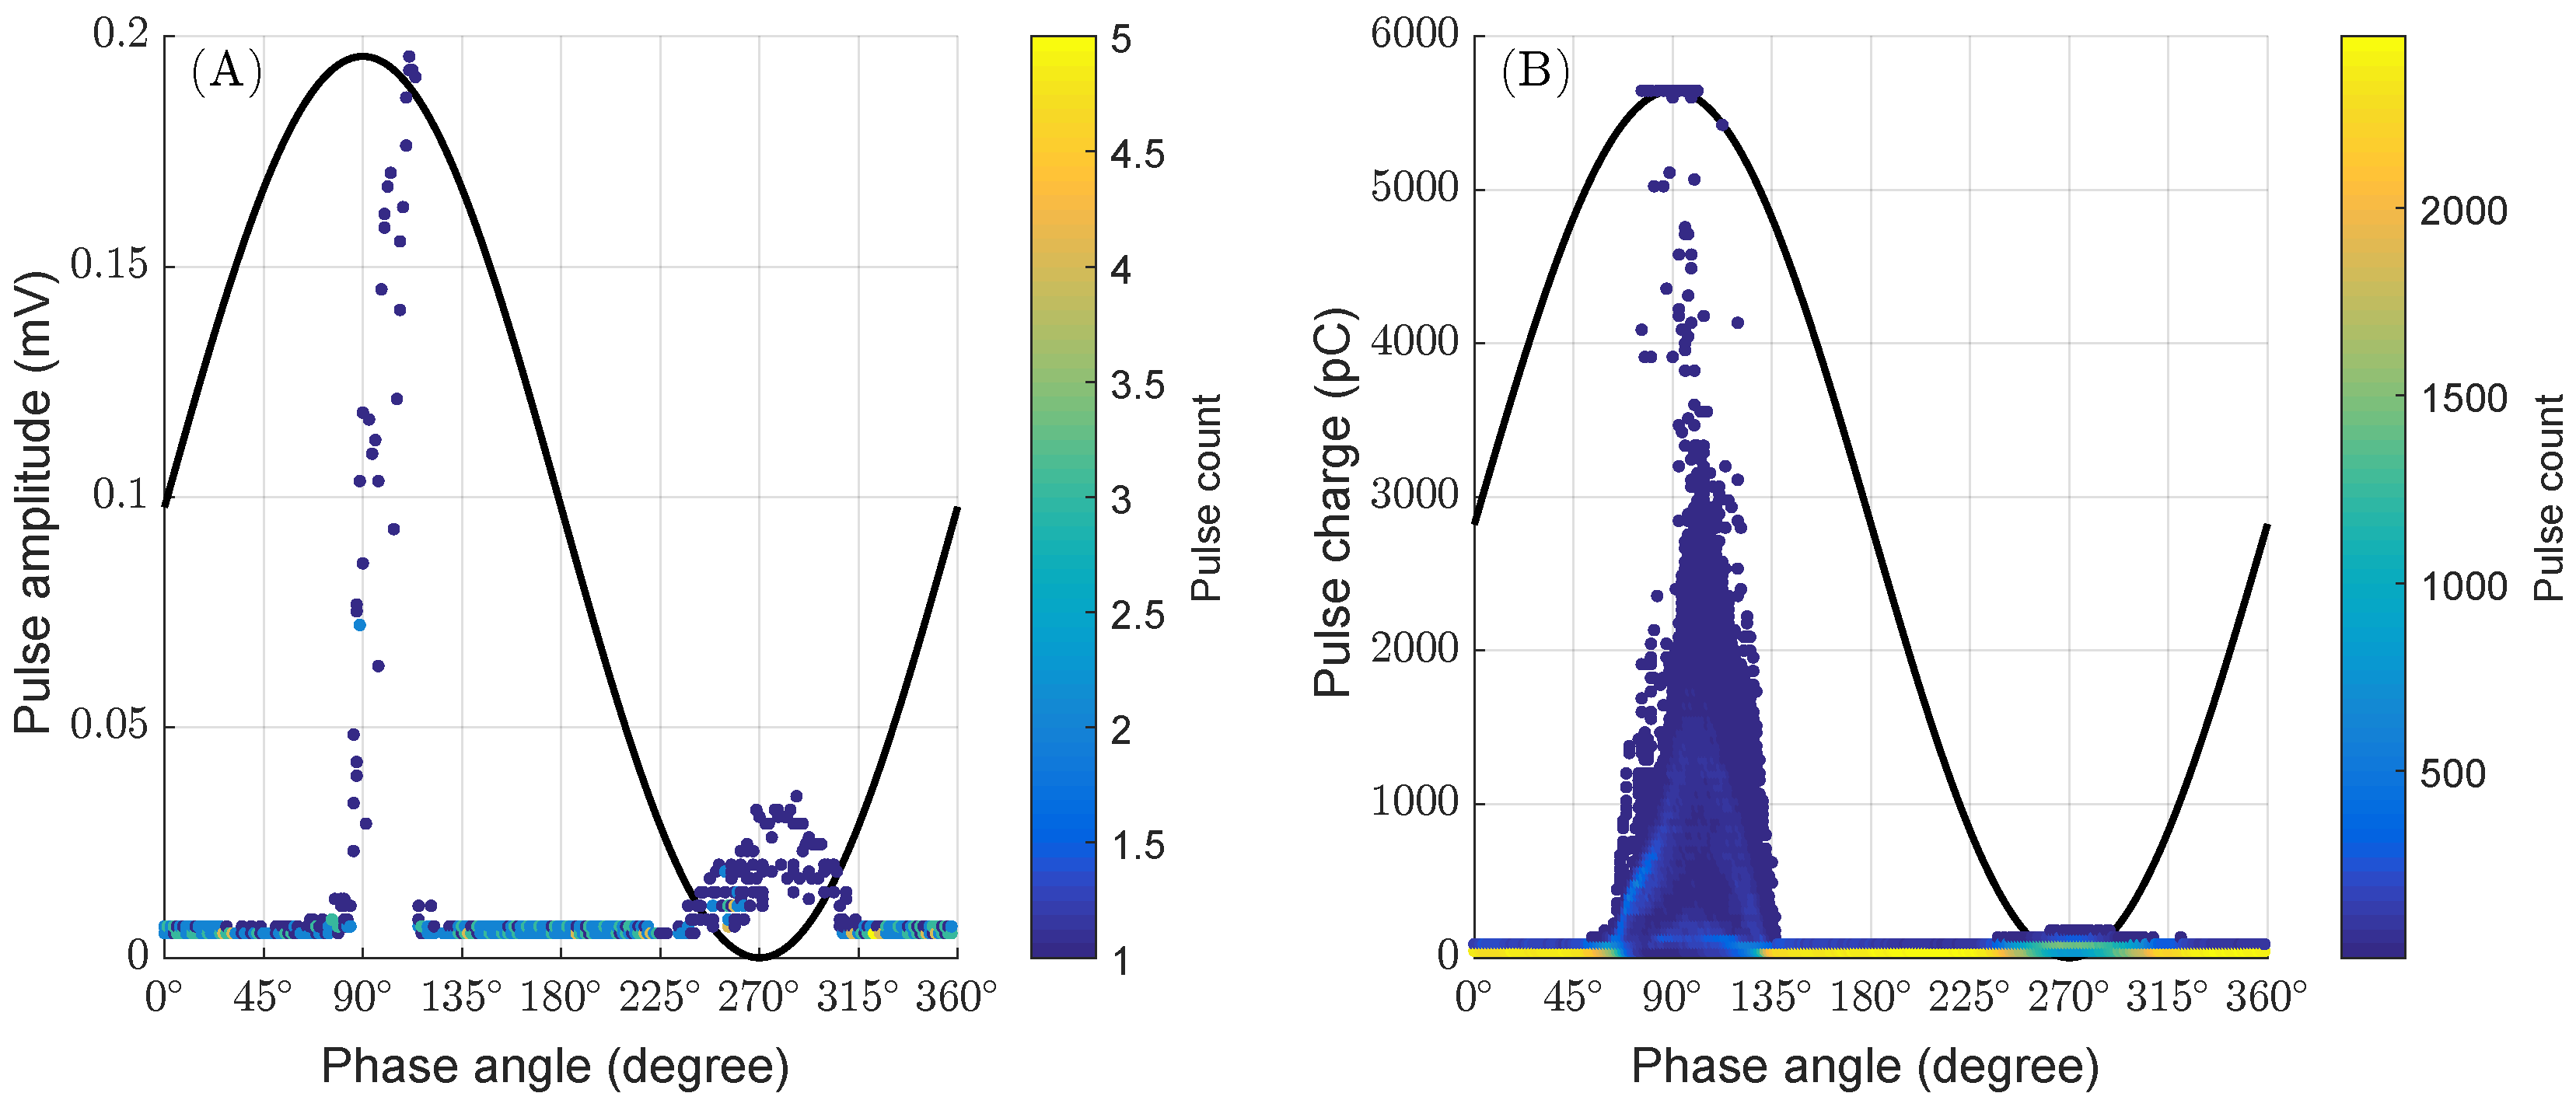
  • The amplitude scale in the oscilloscope was adjusted to avoiding saturation, hence, guaranteeing visualization of the maximum amplitude of the PD pulses measured, as shown in Figure 10a;
  • For this case the methodology shows little activity of PD to pulses near zero crossing.
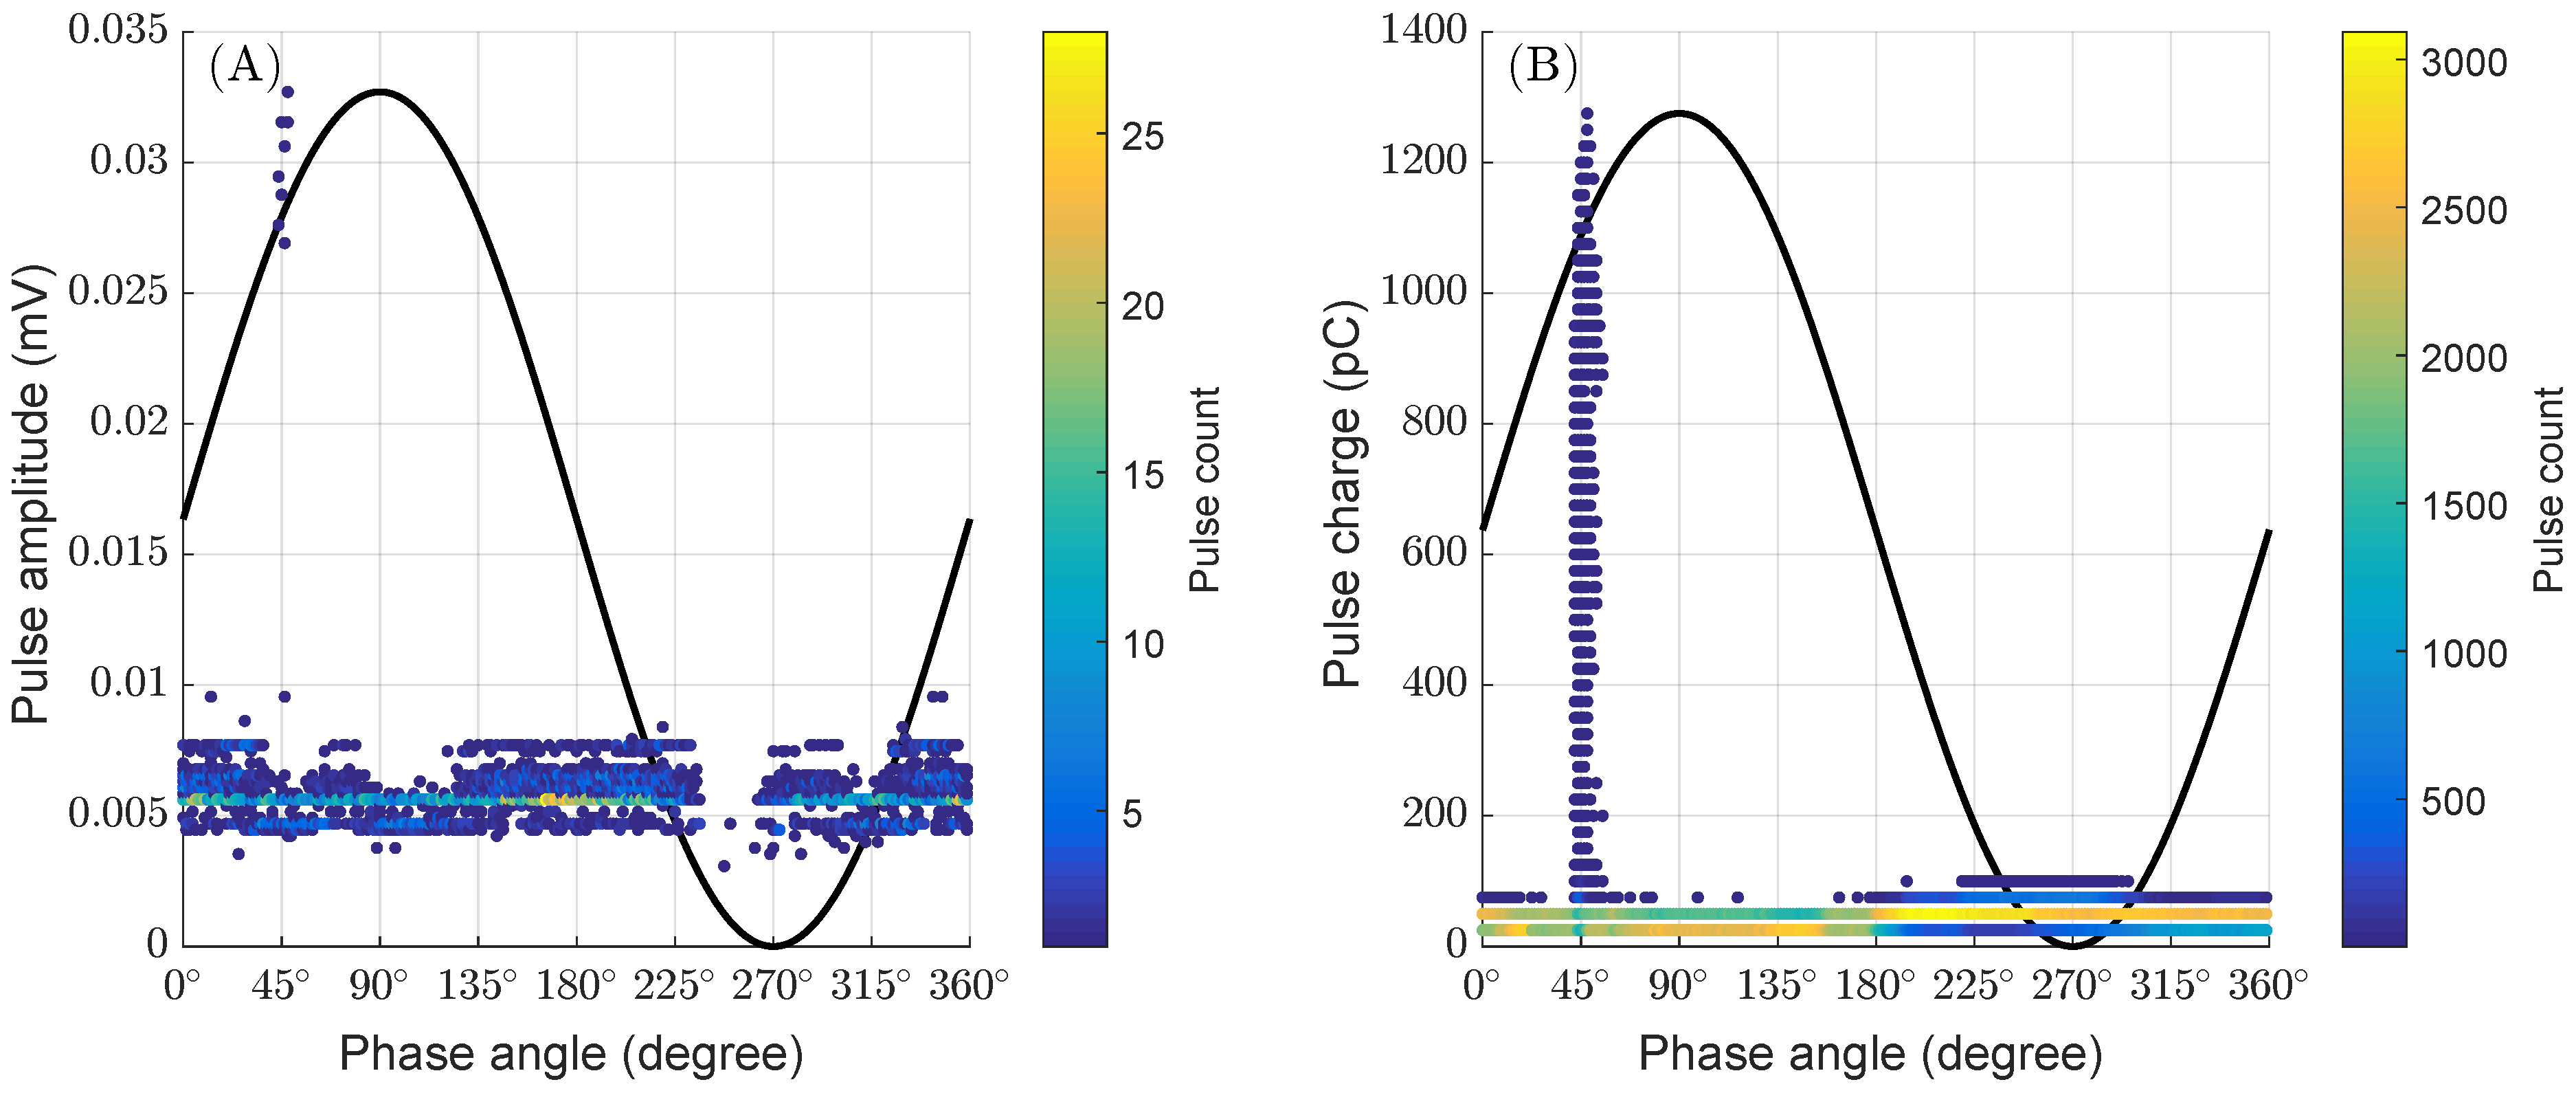
  • Saturation is observed in the results from the commercial equipment near 3200 pC (see Figure 10b);
The use of an oscilloscope with an analogical-digital converter of 8-bit vertical resolution and the consequent discretization of low-amplitude values in relation to the scale background associated with acquisition noise hamper the detection of pulses whose amplitude is near the smallest discretization interval. Therefore, little occurrence low-amplitude PD pulses (some units pulses) in tests with presence of high-amplitude PD pulses and acquisition adjustments required in the oscilloscope is justifiable. Although the result with the IEC method indicated PD pulses with high amplitudes near crossing zero, the largest number of PD pulses occur in this range are of low amplitudes. This can be seen in Figure 10b, with the help of the color bar shown in the respective figure. In this sense, it is important to confirm that the PRPD in Figure 10a was produced considering only 29 cycles (0.483), making it quite plausible the hypothesis that there were no PD pulses with high amplitude when passing through zero at this time.
On the other hand, the use of a commercial oscilloscope with possible amplitude-adjustable input stages, predictable behavior of saturation recovery, and calibration standardized and facilitated in all acquisition range enables the capture of the dynamics of high-amplitude pulses above the range of the commercial solution.
The kurtosis criterion adopted is selective in the discrimination of pulses, tending to not sensitize pulses near zero crossings in the voltage wave, while better discriminating pulses in regions near positive and negative peaks of the sinusoid. Such selectivity was investigated in relation to the commercial solution in test conditions under which higher-amplitude PD pulses are not detected and vertical acquisition lower scales can be chosen by the oscilloscope without its saturation.
Figure 11 shows the results of the applied voltage test (79.7 kV) with a CT class 145 kV as the test object with a previously cleaned surface. According to Figure 11B, only two amplitude levels, i.e., approximately 66 pC and 33 pC, were obtained, evidencing the smallest discretization interval of the commercial equipment. On the other hand, Figure 11A shows the methodology presents more discretization levels of PD pulse amplitude, favoring more precise results, due to adjustments in the vertical scale of the oscilloscope towards avoiding saturation effects, but enabling higher sensitivity, even with the analysis of around 30 cycles. Except for the previously mentioned effects and resolution limitations, a relative agreement can be observed between the PD activity recorded by the two methods, due to the fact that the largest PD amplitudes are obtained at the zero-crossing points and, in addition, the analysis of the present case corroborates what was exposed in the previous result regarding the detection of low-amplitude PD pulses.
Other tests were conducted on the CT 145 kV class, this time considering the presence of a strange object (metallic tape) on the HV connection side (see Figure 9A). For this arrangement, the results shown in Figure 12 indicate that the PD activity, recorded using the IEC method (Figure 12B), has higher amplitude around the 45º phase angle, reaching PD pulses with amplitudes up to 1250 pC. As expected, the results obtained with the method proposed (Figure 12A) show good agreement with those obtained using the IEC method, as the highest amplitude PD pulses (approximately 33 mV) were also concentrated around the 45º angle. Regarding the measurements with the method proposed for this arrangement, it is important to highlight two aspects: an acquisition duration of only 8 cycles of the applied voltage waveform was sufficient to obtain the fault diagnosis; and, the presence of more amplitude discretization levels, ranging from 3.5 mV to 9.5 mV, facilitated better visualization of low amplitude PD pulses and background noise, which, based on the results obtained for the clean CT arrangement (see Figure 11a), should be occurring approximately between 6 mV to 9.5 mV and 3.5 mV to 6 mV, respectively.
The results in Figure 13 show high PD activity (of the order of nC, according to Figure 13B) in a SA of 192 kV nominal voltage subjected to 60 kV test voltage, representing, approximately, only 45.2% of the operation voltage of the equipment, thus strongly indicating failure in the asset. According to the figure, a comparison between the results from the methodology proposed and from the commercial equipment qualitatively revealed good concordance in the discrimination of the PD pulses phase, since both results show PD in the 35 to 155 and 215 to 330 ranges and pulses of highest intensity around 90° and 270°. Saturation effects for the commercial equipment are observed in angular displacements around 90 and 270 , which highlights the potential of the methodology for determining the general tendencies for PD activity with a reduced number of cycles (≈ 1.6 % ).
The sensibility of the methodology is also displayed in Figure 14, which represents the PRPDs obtained from measurements with the SA subjected to a 30 kV voltage level applied for substantially reducing PD activity. The discretization of data at similar levels enables visualizing agreement between measurements performed in the commercial equipment in relation to the methodology proposed. Moreover, a minimum amplitude level of the pulses was observed, which is possibly due to the estimator adopted for the pulse amplitude (maximum of the subwindow´s absolute value). The estimator can be easily adjusted for compensating for those effects, in case of relevance in some context.
As part of a first effort for investigating the motivation of the high PD activity level in the SA, the equipment was disassembled and tests were conducted only in the upper section, as shown in Figure 15. The SA section under analysis has 109.7 kV nominal voltage and was subjected to two voltage levels, namely, 40 kV and 50 kV, in distinct tests, yielding the PD measurement results displayed in Figure 16 and Figure 17, respectively. Such a section is clearly the main responsible one for the PD activity shown in Figure 13. The following comments on the evaluation are appropriate:
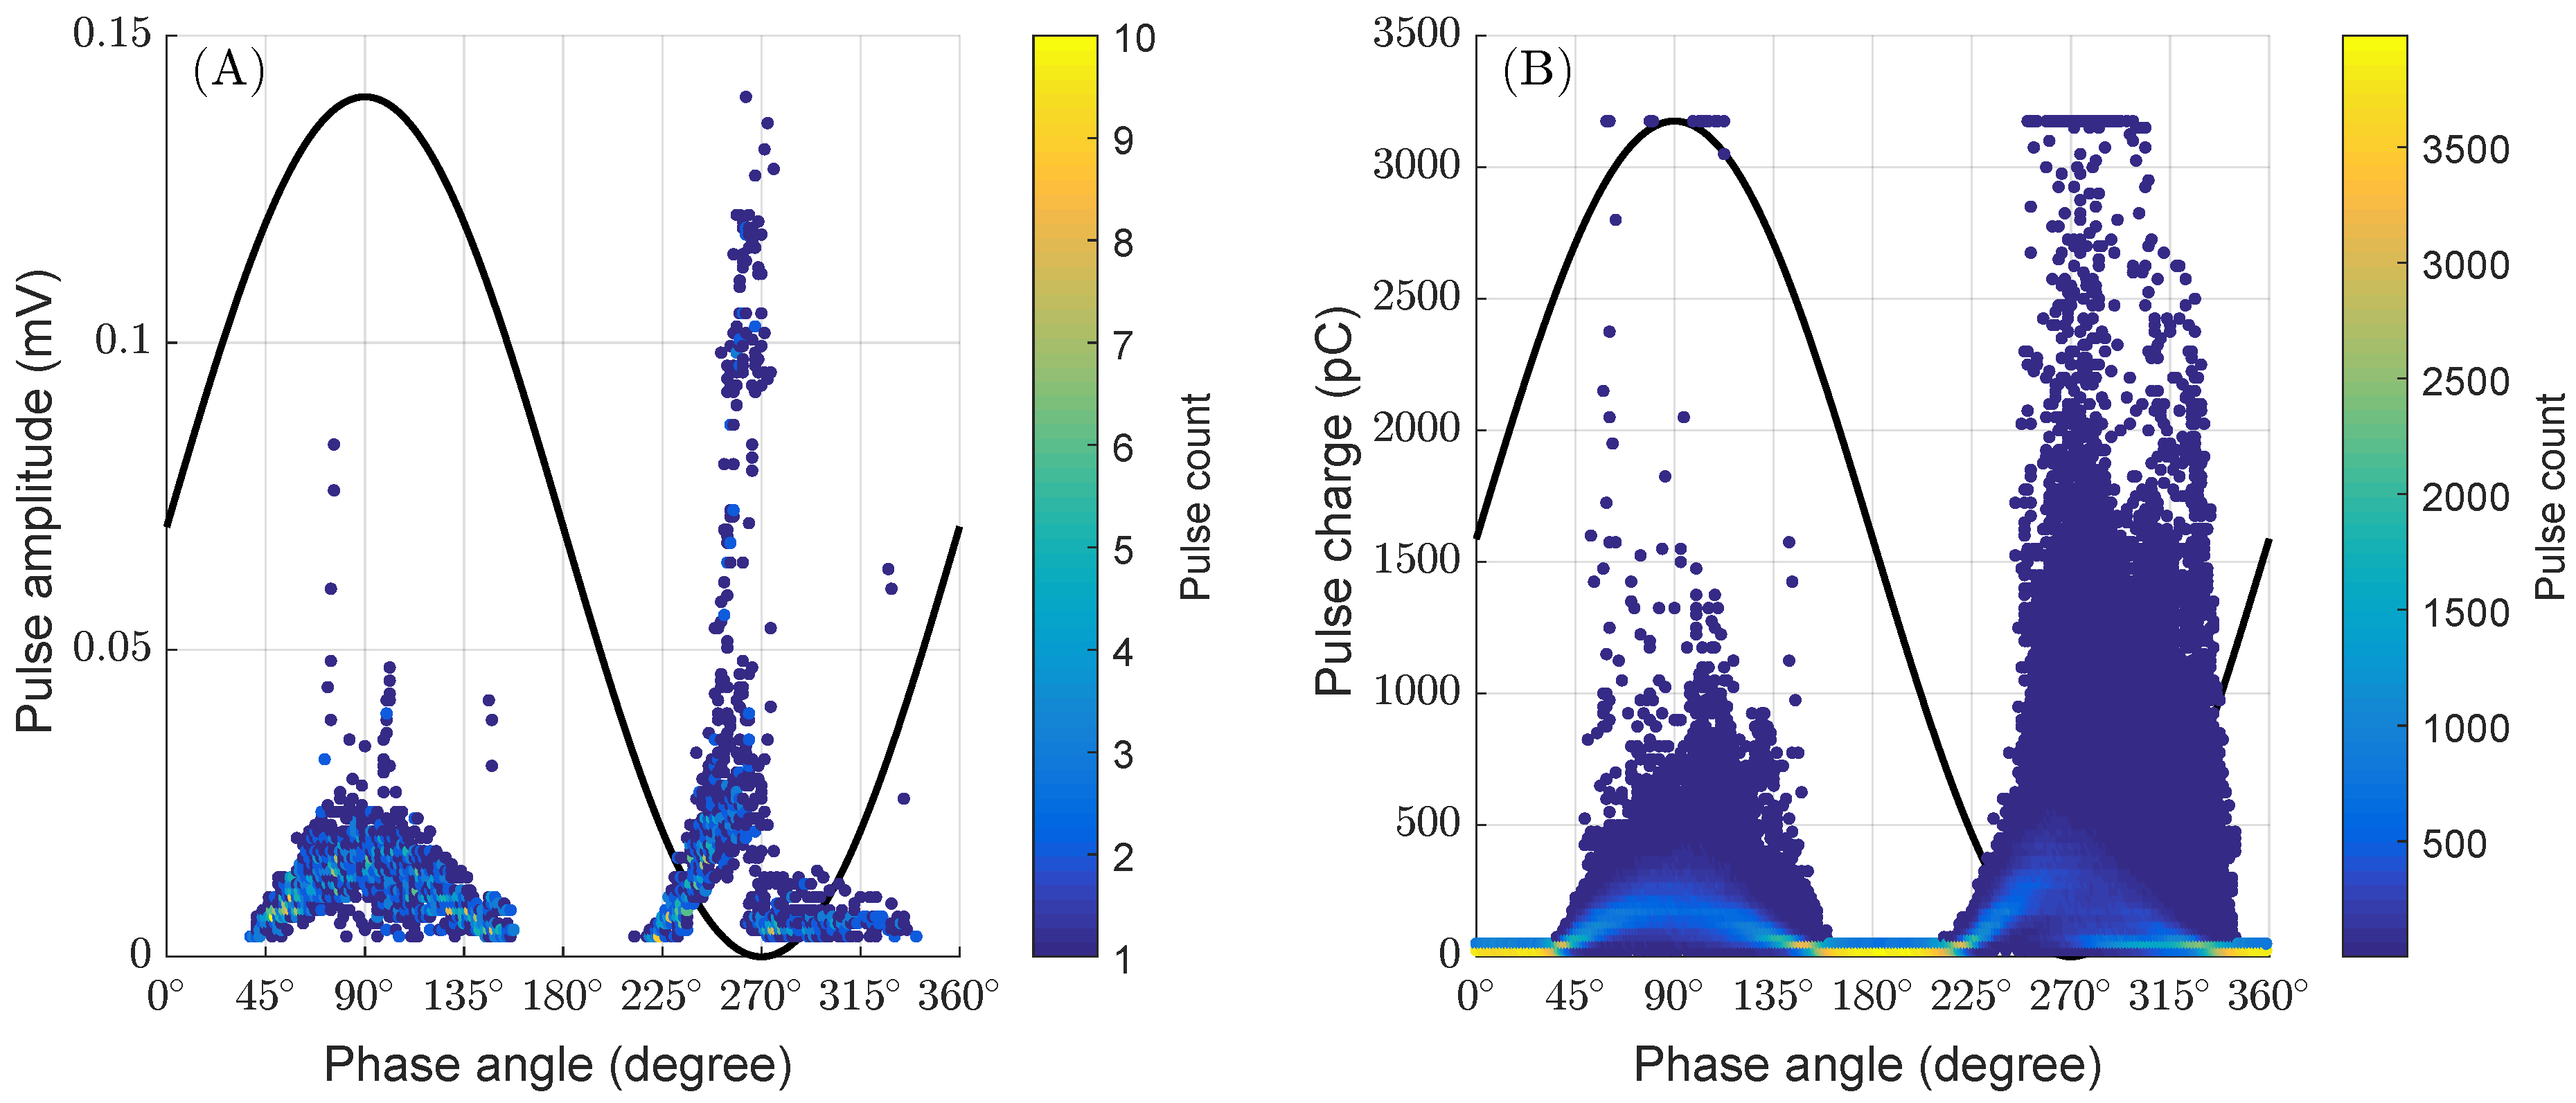
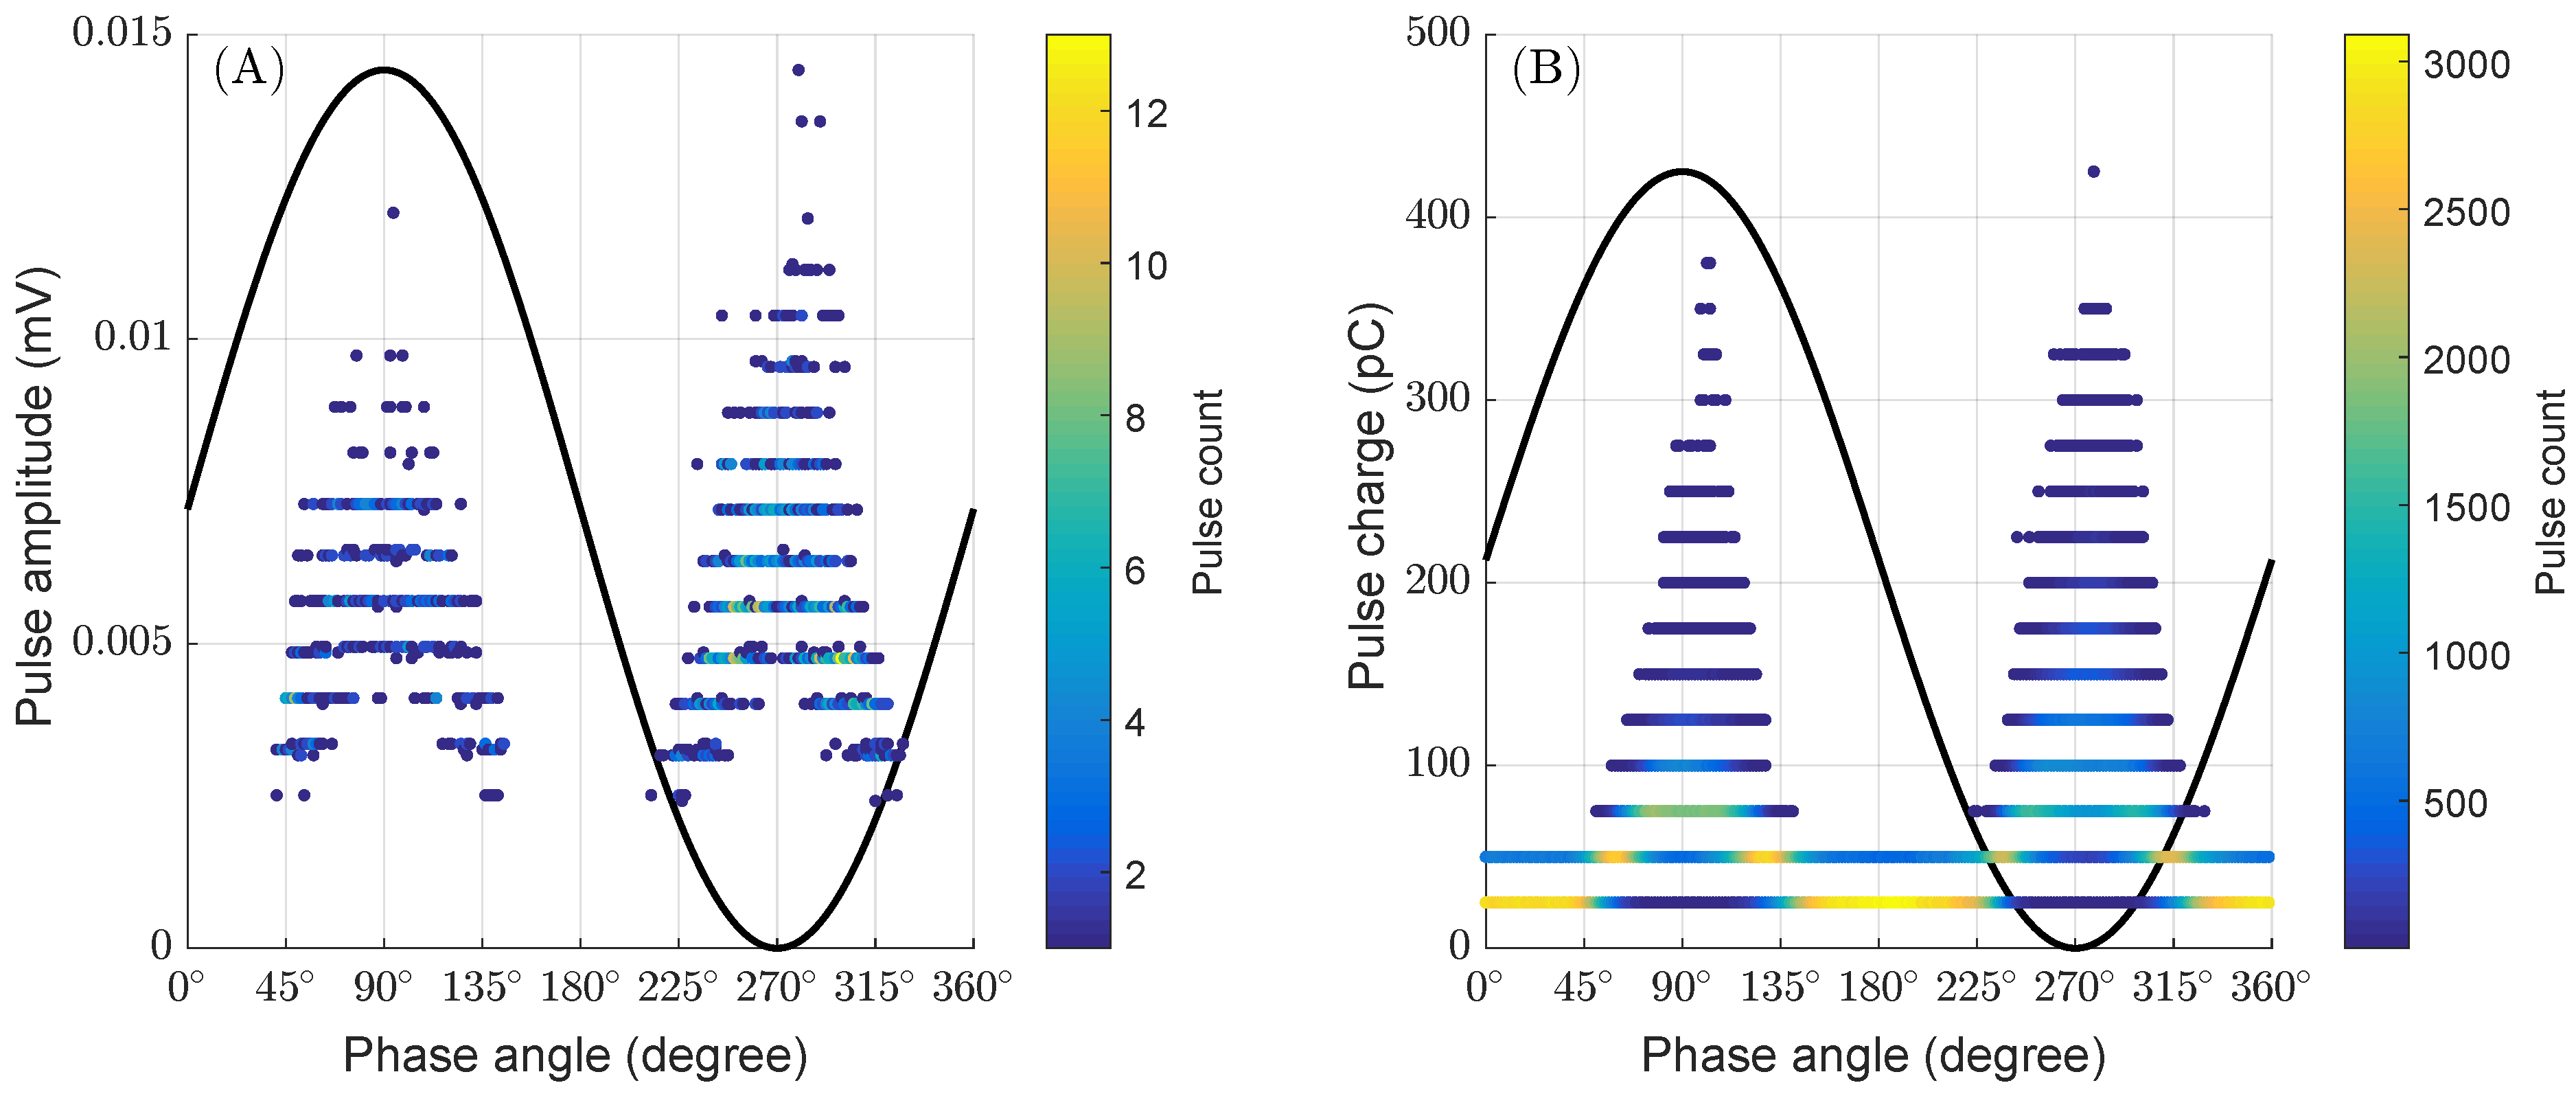
  • Tests conducted in the upper section also qualitatively evidence the agreement of the PD activity between the methodology proposed and the conventional one, despite the saturation of the commercial equipment;
  • Both methods corresponded in the profile change of the test PD incidence with the complete SA (concentration of higher-amplitude pulses in the negative semicircle) and of the tests applied only to the upper section (concentration of higher-amplitude pulses in the positive semicircle);
  • The method proposed enabled observing the general dynamics of the PD incidence measured by the electrical method with the registration of two cycles (Figure 16) and even with one cycle (Figure 17), corroborating the potential of the tool.
The results obtained with the PD measurements confirmed the diagnosis of failure of the upper section of the SA and, to investigate the possible causes, its opening was conducted. Figure 18 shows all elements found in the porcelain housing and displays the degradations that favors PD activity. According to Figure 18b, the surfaces of the internal metallic structures of the SA show several oxidation regions, as is the case of the metallic parts used for sealing and separating ZnO blocks (Figure 18b). It is also observed that some of which in a highly advanced corrosion state (e.g., compression spring) (Figure 18d). The upper section of the SA may have lost watertightness, thus enabling moisture ingress and favoring oxidation process, hence, superficial degradation of the metallic parts, where, under voltage applied condition, their superficial failures contributed to PD occurrence.
Therefore, the PD profile displayed in Figure 16a and Figure 17a represents a signature/fingerprint for such a type of failure, highlighting another contribution of this study.

5. Conclusions

This article demonstrated the operation conditions of equipment widely used in electrical energy substations can be diagnosed by a robust and innovative methodology for discriminating pulses of partial discharges in signals obtained with a significant noise level. This novel approach involves software raw data processing from noninvasive instrumentation for detecting PD from a measurement setup containing devices of general use and relative commercial availability, considering the use of an HFCT sensor and an 8-bit and 2.5 GS/s oscilloscope. The innovation lies in the method’s ability to effectively isolate PD pulses within noisy environments and construct PRPD diagrams using minimal acquisition cycles.
The demonstration was based on simultaneous acquisitions in tests with high voltage applied and a qualitative comparison among the PRPDs generated by the methodology proposed and the one acquired by the commercial equipment according to IEC method. Tests of voltage applied to IT and SA, involving conditions that promoted scenarios of low and high PD activity, validated the method.
PRPDs from the signals measured by the method proposed and the standardized methodology showed a qualitative correlation, according to all experimental results. Moreover, the tool clearly showed potential for constructing a PRPD diagram based on few acquisition cycles of the wave formation of the voltage applied and favoring a PD activity diagnosis, as shown by the results for the upper section of the surge arrester. The results also validated the failure condition of that section, which was proven after the asset opening for an internal investigation. All such factors are important indicators of the potential of such a novel methodology for evaluating the operation conditions of high-voltage electrical equipment.
However, several challenges and limitations associated with the proposed method warrant detailed discussion. Currently, the technique is not implemented in real-time, which may limit its applicability in scenarios requiring immediate data analysis and decision-making. Furthermore, our method necessitates the acquisition of raw data for the entire electrical cycle, demanding significant memory capacity or the integration of the technique into the data acquisition process for real-time operation. Addressing these challenges will likely involve advancements in both hardware capabilities and algorithm efficiency, potentially enabling real-time implementation in future iterations of the technology.
Future enhancements to our methodology could include refining the estimation of the apparent charge of detected PD pulses. By accurately assessing these values, we can construct detailed PRPD patterns, enabling a quantitative comparison across different PD measurement methods. Such advancements could significantly enhance the diagnostic capabilities of PD analysis, leading to more informed maintenance strategies and improved reliability of high-voltage systems.

Author Contributions

Conceptualization, M.A.d.A.R., A.M.d.M. and M.V.A.N.; methodology, M.A.d.A.R.; validation, M.A.d.A.R. and A.M.d.M.; formal analysis, M.A.d.A.R., A.M.d.M. and M.V.A.N.; investigation, M.A.d.A.R.; resources, A.d.L.O.; data curation, A.M.d.M. and M.A.d.A.R.; writing—original draft preparation, M.A.d.A.R., A.M.d.M. and M.V.A.N.; writing—review and editing, K.M., L.F.F.-G. and G.C.J.; supervision, A.d.L.O.; project administration, E.F.M., H.C.F. and C.H.C. All authors have read and agreed to the published version of the manuscript.

Funding

This research was funded by CPFL Transmission through the project PD-05785-2107/2021—DE2107: “Methodology for aging assessment of insulation in instrument transformers and surge arresters through ultrasonic measurements of partial discharges”, conducted under the Electric Sector Research and Development (R&D) Program, regulated by the Agência Nacional de Energia Elétrica (ANEEL) of Brazil. Partial support was also provided by the Coordenação de Aperfeiçoamento de Pessoal de Nível Superior—Brazil (CAPES/PROEX)—Finance Code 001.

Data Availability Statement

The datasets presented in this article are not readily available because the raw datasets utilized in this study are proprietary, held under the ownership of CPFL, and are not publicly available due to confidentiality constraints. Requests for access to the datasets should be directed to the corresponding author, who will guide interested researchers through the process of obtaining access under specific conditions that comply with CPFL’s policies.

Acknowledgments

The authors acknowledge the Pro-Rectory of Research and Post-Graduate Studies PROPESP/UFPA and the Electric Sector Research and Development Program through the project PD-05785-2107/2021—DE2107: “Methodology for aging assessment of insulation in instrument transformers and surge arresters through ultrasonic measurements of partial discharges” regulated by the National Electric Energy Agency—ANEEL, in partnership with CPFL Transmissão and UFSM, the Federal University of Santa Maria, Brazil, for the support given to this research.

Conflicts of Interest

The authors declare they have no conflict of interest.

References

  1. Du, J.; Mi, J.; Jia, Z.; Mei, J. Feature Extraction and Pattern Recognition Algorithm of Power Cable Partial Discharge Signal. Int. J. Pattern Recognit. Artif. Intell. 2023, 37, 2258010. [Google Scholar] [CrossRef]
  2. Subramaniam, A.; Sahoo, A.; Manohar, S.S.; Raman, S.J.; Panda, S.K. Switchgear Condition Assessment and Lifecycle Management: Standards, Failure Statistics, Condition Assessment, Partial Discharge Analysis, Maintenance Approaches, and Future Trends. IEEE Electr. Insul. Mag. 2021, 37, 27–41. [Google Scholar] [CrossRef]
  3. Zhang, X.; Pang, B.; Liu, Y.; Liu, S.; Xu, P.; Li, Y.; Liu, Y.; Qi, L.; Xie, Q. Review on Detection and Analysis of Partial Discharge along Power Cables. Energies 2021, 14, 7692. [Google Scholar] [CrossRef]
  4. Rodrigues, T.B.; Amorim, H.P.; Tanscheit, R.; Vellasco, M. Automatic Evaluation of Partial Discharges Presence in Surge Arresters and Current Transformers Installed in Substations without Equipment Shutdown. In Proceedings of the 2020 IEEE 3rd International Conference on Dielectrics, ICD 2020, Valencia, Spain, 5–31 July 2020; pp. 842–845. [Google Scholar] [CrossRef]
  5. Wu, M.; Cao, H.; Cao, J.; Nguyen, H.L.; Gomes, J.B.; Krishnaswamy, S.P. An overview of state-of-the-art partial discharge analysis techniques for condition monitoring. IEEE Electr. Insul. Mag. 2015, 31, 22–35. [Google Scholar] [CrossRef]
  6. Bartnikas, R. Partial discharges their mechanism, detection and measurement. IEEE Trans. Dielectr. Electr. Insul. 2002, 9, 763–808. [Google Scholar] [CrossRef]
  7. Stone, G.C.; Cavallini, A.; Behrmann, G.; Serafino, C.A. Practical Partial Discharge Measurement on Electrical Equipment, 1st ed.; IEEE Press Series on Power and Energy Systems; Wiley-IEEE Press: Hoboken, NJ, USA, 2023. [Google Scholar]
  8. Montanari, G.; Cavallini, A. Partial discharge diagnostics: From apparatus monitoring to smart grid assessment. IEEE Electr. Insul. Mag. 2013, 29, 8–17. [Google Scholar] [CrossRef]
  9. Kai, R.; Yamanoue, T.; Tanaka, H.; Kawano, H.; Kozako, M.; Hikita, M. A Study of PRPD Statistics to Improve the Performance of PD Detection and Defect Type Identification. In Proceedings of the 2022 9th International Conference on Condition Monitoring and Diagnosis, CMD 2022, Kitakyushu, Japan, 13–18 November 2022; pp. 666–671. [Google Scholar] [CrossRef]
  10. IEC 60270:2000; High-Voltage Test Techniques: Partial Discharge Measurements. British Standard: London, UK, 2000.
  11. Gu, F.C.; Chang, H.C.; Hsueh, Y.M.; Kuo, C.C.; Chen, B.R. Development of a high-speed data acquisition card for partial discharge measurement. IEEE Access 2019, 7, 140312–140318. [Google Scholar] [CrossRef]
  12. Maresch, K.; Freitas-Gutierres, L.F.; Oliveira, A.L.; Borin, A.S.; Cardoso, G.; Damiani, J.S.; Morais, A.M.; Correa, C.H.; Martins, E.F. Advanced Diagnostic Approach for High-Voltage Insulators: Analyzing Partial Discharges through Zero-Crossing Rate and Fundamental Frequency Estimation of Acoustic Raw Data. Energies 2023, 16, 33. [Google Scholar] [CrossRef]
  13. Maresch, K.; Freitas-Gutierres, L.; Cardoso, G., Jr.; Borin, A.; Damiani, J.; Quatrin, A.; Morais, A.; Nunes, M.; Correa, C.; Martins, E.; et al. Innovative Approach for Detecting Early-Stage Partial Discharges in Instrument Transformers via Ultrasound and Random Forest Analysis. Measurement 2024, 232, 114710. [Google Scholar] [CrossRef]
  14. Singsathien, J.; Suwanasri, T.; Suwanasri, C.; Ruankon, S.; Fuangpian, P.; Namvong, W.; Saengsaikaew, P.; Khotsang, W. Partial discharge detection and localization of defected power cable using HFCT and UHF sensors. In Proceedings of the 2017 14th International Conference on Electrical Engineering/Electronics, Computer, Telecommunications and Information Technology (ECTI-CON), Phuket, Thailand, 27–30 June 2017; pp. 505–508. [Google Scholar] [CrossRef]
  15. Uckol, H.I.; Ilhan, S. Identification of corona discharges based on wavelet scalogram images with deep convolutional neural networks. Electr. Power Syst. Res. 2023, 224, 109712. [Google Scholar] [CrossRef]
  16. Ashtiani, M.; Shahrtash, S. Partial discharge pulse localization in excessive noisy data window. IEEE Trans. Dielectr. Electr. Insul. 2015, 22, 428–435. [Google Scholar] [CrossRef]
  17. Freitas-Gutierres, L.F.; Maresch, K.; Morais, A.M.; Nunes, M.V.; Correa, C.H.; Martins, E.F.; Fontoura, H.C.; Schmidt, M.V.; Soares, S.N.; Cardoso, G.; et al. Framework for decision-making in preventive maintenance: Electric field analysis and partial discharge diagnosis of high-voltage insulators. Electr. Power Syst. Res. 2024, 233, 110447. [Google Scholar] [CrossRef]
  18. Uwiringiyimana, J.P.; Khayam, U.; Suwarno; Montanari, G.C. Comparative Analysis of Partial Discharge Detection Features Using a UHF Antenna and Conventional HFCT Sensor. IEEE Access 2022, 10, 107214–107226. [Google Scholar] [CrossRef]
  19. Salih, M.; Harid, N.; Barkat, B.; Habib, B.H. Correlation Between Partial Discharge Parameters Measured by UHF, IEC and HFCT Methods. In Proceedings of the 2023 58th International Universities Power Engineering Conference (UPEC), Dublin, Ireland, 30 August–1 September 2023; pp. 1–6. [Google Scholar] [CrossRef]
  20. Klüss, J.V.; Elg, A.P.; Wingqvist, C. High-Frequency Current Transformer Design and Implementation Considerations for Wideband Partial Discharge Applications. IEEE Trans. Instrum. Meas. 2021, 70, 1–9. [Google Scholar] [CrossRef]
  21. Kumar, C.L.G.P.; Khalid, N.H.A.; Ahmad, M.H.; Nawawi, Z.; Sidik, M.A.B.; Jambak, M.I.; Kurnia, R.F.; Waldi, E.P.; Aulia. Development and Validation of Rogowski Coil with Commercial High Frequency Current Transformer for Partial Discharge Detection. In Proceedings of the 2018 International Conference on Electrical Engineering and Computer Science (ICECOS), Pangkal Pinang, Indonesia, 2–4 October 2018; pp. 315–320. [Google Scholar] [CrossRef]
  22. Long, J.; Wang, X.; Tian, M.; Dai, D.; Zhu, G.; Zhang, J. A novel automatic pulse segmentation approach and its application in PD-induced electromagnetic wave detection. IEEE Trans. Dielectr. Electr. Insul. 2017, 24, 304–315. [Google Scholar] [CrossRef]
  23. Zhou, X.; Zhou, C.; Kemp, I.J. An improved methodology for application of wavelet transform to partial discharge measurement denoising. IEEE Trans. Dielectr. Electr. Insul. 2005, 12, 586–594. [Google Scholar] [CrossRef]
  24. Gaouda, A.M.; El-Hag, A.; Abdel-Galil, T.K.; Salama, M.M.; Bartnikas, R. On-line detection and measurement of partial discharge signals in a noisy environment. IEEE Trans. Dielectr. Electr. Insul. 2008, 15, 1162–1173. [Google Scholar] [CrossRef]
  25. Ashtiani, M.; Shahrtash, S. Partial discharge de-noising employing adaptive singular value decomposition. IEEE Trans. Dielectr. Electr. Insul. 2014, 21, 775–782. [Google Scholar] [CrossRef]
  26. Ma, X.; Zhou, C.; Kemp, I.J. Interpretation of wavelet analysis and its application in partial discharge detection. IEEE Trans. Dielectr. Electr. Insul. 2002, 9, 446–457. [Google Scholar] [CrossRef]
  27. Satish, L.; Nazneen, B. Wavelet-based denoising of partial discharge signals buried in excessive noise and interference. IEEE Trans. Dielectr. Electr. Insul. 2003, 10, 354–367. [Google Scholar] [CrossRef]
  28. Bajwa, A.A.; Habib, S.; Kamran, M. An investigation into partial discharge pulse extraction methods. Int. J. Electr. Power Energy Syst. 2015, 73, 964–982. [Google Scholar] [CrossRef]
  29. Dai, D.; Wang, X.; Long, J.; Tian, M.; Zhu, G.; Zhang, J. Feature extraction of GIS partial discharge signal based on S-transform and singular value decomposition. IET Sci. Meas. Technol. 2017, 11, 186–193. [Google Scholar] [CrossRef]
  30. Li, L.; Wei, X. Suppression Method of Partial Discharge Interferences Based on Singular Value Decomposition and Improved Empirical Mode Decomposition. Energies 2021, 14, 8579. [Google Scholar] [CrossRef]
  31. Jean, G.; Banon, F.; Barrera, B.J.; Rezende, S.M.; Cover, F.B.; Christine, L.; Cover, B.; Angulo, J.; Serra, J. Mathematical Morphology and Its Applications to Signal and Image Processing: 8th International Symposium on Mathematical Morphology; MCT/INPE: Brasilia, Brazil, 2007; pp. 127–163. [Google Scholar]
  32. Ashtiani, M.B.; Shahrtash, S.M. Feature-oriented de-noising of partial discharge signals employing mathematical morphology filters. IEEE Trans. Dielectr. Electr. Insul. 2012, 19, 2128–2136. [Google Scholar] [CrossRef]
  33. Zhang, Z.; Xiao, D.; Liu, Y. A wavelet transform approach to adaptive extraction of partial discharge pulses from interferences. In Proceedings of the 2009 IEEE/PES Power Systems Conference and Exposition, Seattle, DC, USA, 15–18 March 2009; pp. 1–7. [Google Scholar] [CrossRef]
  34. Amorim, H.P.; Carvalho, A.T.D.; Rodrigues, T.B.; Borges, J.B.S.; de C. Cunha, C.F.F. On-site measurements of Partial Discharges through tap of the bushings—Brazilian experience in power transformers. In Proceedings of the 2013 IEEE International Conference on Solid Dielectrics (ICSD), Bologna, Italy, 30 June–4 July 2013; pp. 1020–1023. [Google Scholar] [CrossRef]
  35. Tatizawa, H.; Bacega, A.G.; Burani, G.F. Evaluation at Field of Aged 345kV Class ZnO Surge Arresters. In Proceedings of the 2010 IEEE PES Transmission & Distribution Conference & Exposition: Smart Solutions for a Changing World, New Orleans, LA, USA, 19–22 April 2010. [Google Scholar]
  36. Otsu, N. A threshold selection method from gray-level histograms. IEEE Trans. Syst. Man Cybern. 1979, 9, 62–66. [Google Scholar] [CrossRef]
  37. Gustafsson, F. Determining the initial states in forward-backward filtering. IEEE Trans. Signal Process. 1996, 44, 988–992. [Google Scholar] [CrossRef]
  38. Savitzky, A.; Golay, M.J. Smoothing and differentiation of data by simplified least squares procedures. Anal. Chem. 1964, 36, 1627–1639. [Google Scholar] [CrossRef]
  39. EC/TS 60815-2: 2008; Selection and Dimensioning of High-Voltage Insulators Intended for use in Polluted Conditions. Part 2: Ceramic and Glass Insulators for AC Systems (I). EC/TS: Geneva, Switzerland, 2008.
Figure 1. Voltage waveforms from a partial discharges detection test.
Energies 17 04921 g001
Figure 2. Initial windows of fixed size in an HFCT signal.
Energies 17 04921 g002
Figure 3. Procedure for discriminating subwindow with PD pulse and constructing PRPD.
Energies 17 04921 g003
Figure 4. Detail of a sampling window and determination of differential energy, morphological gradient, and delimitation of candidate subwindow.
Energies 17 04921 g004
Figure 5. Procedure for discriminating subwindow with PD pulse and constructing PRPD.
Energies 17 04921 g005
Figure 6. Elements of the experimental setup.
Energies 17 04921 g006
Figure 7. Validation of the algorithm for the PRPD generation with DDX 9121ARIV data. (a) Image output. (b) Algorithm output from data in ‘.xml’ format.
Energies 17 04921 g007
Figure 8. Objects under testing. (a) Inductive voltage transformer. (b) Current transformer. (c) Surge arrester.
Energies 17 04921 g008
Figure 9. Procedures for inducing external PD on ITs. (a) Metallic tape as a strange object. (b) Application of saline solution on the external IT surface.
Energies 17 04921 g009
Figure 10. PRPDs from the measurements with the saline solution scenario applied to the class 145 kV external insulation of IVT subjected to 79.7 kV, 60 Hz (A) HFCT sensor and method proposed (B) IEC Method.
Energies 17 04921 g010
Figure 11. PRPDs from the measurements considering cleaned TC subjected to 79.7 kV, 60 Hz. (A) HFCT sensor and method proposed. (B) IEC Method.
Energies 17 04921 g011
Figure 12. PRPDs from the measurements considering the presence of a strange object on the HV connection side of TC subjected to 79.7 kV, 60 Hz. (A) HFCT sensor and method proposed. (B) IEC Method.
Energies 17 04921 g012
Figure 13. PRPDs from measurements with the surge arrester, 192 kV nominal voltage, when subjected to 60 kV, 60 Hz. (A) HFCT sensor and method proposed (B) IEC Method.
Energies 17 04921 g013
Figure 14. PRPDs from measurements with the surge arrester, 192 kV nominal voltage, when subjected to 30 kV, 60 Hz. (A) HFCT sensor and method proposed (B) IEC Method.
Energies 17 04921 g014
Figure 15. Test setup in the upper unitary section of the surge arrester, 109.7 kV nominal voltage.
Energies 17 04921 g015
Figure 16. PRPDs from the measurements with the upper unitary section of the surge arrester, 109.7 kV nominal voltage, when subjected to 40 kV, 60 Hz. (A) HFCT sensor and method proposed (B) IEC Method.
Energies 17 04921 g016
Figure 17. PRPDs from the measurements with the upper unitary section of the surge arrester, 109.7 kV nominal voltage, when subjected to 50 kV, 60 Hz. (A) HFCT sensor and method proposed (B) IEC Method.
Energies 17 04921 g017
Figure 18. Internal investigation and details of the internal parts of the upper unitary section of the surge arrester with stronger evidences of degradation. (a) Elements found in the porcelain housing. (b) Metallic structures of sealing, separation of blocks and compression spring. (c) Sealing structures. (d) Compression spring.
Energies 17 04921 g018
Disclaimer/Publisher’s Note: The statements, opinions and data contained in all publications are solely those of the individual author(s) and contributor(s) and not of MDPI and/or the editor(s). MDPI and/or the editor(s) disclaim responsibility for any injury to people or property resulting from any ideas, methods, instructions or products referred to in the content.

