Article

On the Use of the Multi-Site Langmuir Model for Predicting Methane Adsorption on Shale

1
State Key Laboratory of Shale Oil and Gas Enrichment Mechanisms and Efficient Development, Beijing 102206, China
2
Sinopec Key Laboratory of Shale Oil/Gas Exploration and Production Technology, Beijing 102206, China
3
Chemical and Petroleum Engineering, University of Calgary, Calgary, AB T2N 1N4, Canada
4
College of Artificial Intelligence, China University of Petroleum (Beijing), Beijing 102249, China
5
SINOPEC Petroleum Exploration and Production Research Institute, Beijing 100083, China
*
Author to whom correspondence should be addressed.
Energies 2024, 17(19), 4990; https://doi.org/10.3390/en17194990
Submission received: 5 April 2024 / Revised: 12 August 2024 / Accepted: 16 August 2024 / Published: 6 October 2024
(This article belongs to the Section H: Geo-Energy)

Abstract

:
Shale gas, mainly consisting of adsorbed gas and free gas, has served a critical role of supplying the growing global natural gas demand in the past decades. Considering that the adsorbed methane has contributed up to 80% of the total gas in place (GIP), understanding the methane adsorption behaviors is imperative to an accurate estimation of total GIP. Historically, the single-site Langmuir model, with the assumption of a homogeneous surface, is commonly applied to estimate the adsorbed gas amount. However, this assumption cannot depict the methane adsorption characteristics due to various compositions and pore sizes of shales. In this work, a multi-site model integrating the energetic heterogeneity in adsorption is derived to predict methane adsorption on shale. Our results show that the multi-site model is capable of addressing the heterogeneity of shales by a wide range of adsorption energy distributions (owing to the complex compositions and different pore sizes), which is different from the single-site model only characterized by single adsorption energy. Consequently, the multi-site model results have better accuracy against the experimental data. Therefore, applying the multi-site Langmuir model for estimating GIP in shales can achieve more accurate results compared with using the traditionally single-site model.

1. Introduction

In recent years, natural gas has gained worldwide attention due to the increasing demand of natural gas consumption globally, continuous declining of conventional oil and gas production, widespread availability of unconventional gas reserves, as well as improved technologies to extract it from the ground. In addition, natural gas is also considered as a clean energy option and is favored over other fossil fuels due to its remarkable low environmental impact. As a result of these, there is a fast-growing demand for natural gas all over the world. Despite the vast demand for natural gas energy consumption globally, the production of conventional gas has not been forecasted to increase dramatically in the coming years to meet this demand. Nevertheless, the production of unconventional gas is expected to increase significantly to meet the demand of future natural gas energy consumption.
Shale gas has the most estimated amount available among the unconventional gas resources, which is around 32,600 trillion cubic feet [1]. The vast amount of shale gas scatters around the world in many regions. In the USA, an estimated amount of 862 trillion cubic feet of shale gas is lying underneath the ground. Thus, shale gas is considered a valuable energy resource globally due to its enormous amount available [2]. Meanwhile, as the horizontal well drilling and hydraulic fracturing technologies have significantly improved in the past decades, the production of shale gas is forecasted to increase intensely as well. For instance, in the USA, the shale gas production is likely to dominate the total amount of gas produced in the next couple of decades while the other unconventional gas production is decreasing dramatically.
Generally, shale gas mainly exists in a shale reservoir in three forms, free gas in the void space of fractures and matrix, adsorption on the organic matters and clay materials, as well as a dissolved form in bitumen. The total gas in place for shales gas reservoir is considered as a sum of free gas and adsorbed gas, because the portion of gas dissolved in the bitumen is often too little to be of any significance. Additionally, the contribution of adsorbed gas to the total gas in place is relatively more significant [3]. As one can see, in some particular cases, the portion of the amount of gas in the adsorbed phase is significantly more than that in the free phase. For instance, at 6% TOC, the amount of gas that exists in the free gas phase is around 30% of total gas in place comparing to the adsorbed amount of gas, which is at around 70%. In fact, some of the shale plays in North America have potentials of 20–85% of total gas in the adsorbed state [4,5]. Due to a large amount of gas in the adsorption state, it is critical to understand the nature of adsorption well to have an accurate estimation of the total amount of shale gas in a reservoir [6].
The composition and pore sizes distribution vary to a great extent for different shales. Yet, the current widely used models for estimating the amount of methane adsorption assume merely homogeneous surface composition, which has a constant value for adsorption heat and standard entropy across a surface. It is hardly the case with the reality as illustrated above. Because of these, a homogenous adsorption model cannot depict the true nature of methane adsorption. Instead, a heterogeneous adsorption model is needed to describe the adsorption behaviors of methane on shales accurately. Additionally, when it comes to quantifying the amount of adsorbed gas in shale, the current widely used method (i.e., Langmuir isotherm) is to consider the absolute adsorption as the actual gas in the adsorbed phase [7,8]. It is the case when the pressure is low (less than 2 MPa) [9]. However, as the reservoir pressure goes up, a dramatic difference between the Langmuir isotherm and Gibbs isotherm starts to appear. As a result of that, the application of traditional Langmuir isotherm under high-pressure conditions would potentially affect the estimation of total gas in place for methane in shales. In order to have an accurate estimation of GIP in shales, a more precise approach should be taken with the notion of Gibbs excess adsorption [10].
In this work, we first introduce the definition of adsorption, with comparing both the absolute adsorption and excess adsorption. Then, we review the current traditional adsorption models and discuss their shortcomings unable to address the heterogeneity of shales. A step-by-step approach of deriving a multi-site model for both absolute and excess adsorption is carried out to depict the heterogeneous energetic nature of shales. Relevant assumptions in the derivation of equations are made and discussed as well. Finally, we demonstrate the fitting results with the traditional single-site adsorption model and multi-site adsorption model. A comparison of the results is made in terms of accuracy with the experimental data.

2. Absolute Adsorption and Excess Adsorption

The term adsorption was first brought up by Kayser in 1881 to address the phenomenon that had been recognized by Fontana and Scheele in 1777 and described as the process of increasing concentration of gas molecules towards the adjacent solid surfaces [11]. The adsorption process is mainly caused by a weak van der Waals force between gas molecules and a solid surface, which is classified as physisorption [8,12].
There are generally two terms used for describing the adsorbed phase in porous media. One is called absolute adsorption, which is defined as the total amount of gas in the adsorbed state in porous media [13]. The concept of absolute adsorption takes an adsorbed layer into account, as shown in Figure 1a. The other term used to describe the adsorption is called excess adsorption, which was introduced by Gibbs (1931). On the contrary to the absolute adsorption, the definition of excess adsorption does not take an actual adsorbed layer volume into account, as shown in Figure 1b. In the Gibbs model of adsorption, a dividing surface is replacing the actual interface between the bulk gas phase and the solid instead [14].

2.1. Equations for Absolute and Excess Adsorption

The equation of absolute adsorption is a function of the adsorbed phase volume and the adsorbed phase density, as Figure 1a demonstrates, shown as follows:
n a b = V a ρ a M
where   n a b is the absolute adsorption amount, g/cm3; V a is the volume of the adsorbed phase, cm3/g; ρ a is the density of the adsorbed phase g/cm3.
The relationship between the absolute adsorption and excess adsorption can be clearly illustrated by Figure 1b as well; as one can see in this figure, the excess adsorption amount is included in the absolute adsorption amount. Therefore, the equation for excess adsorption is subtracted from the absolute adsorption equation, shown as follows:
n e x = V a ρ a M V a ρ g M
where ρ g is the density of free gas in the bulk phase, g/cm3.
By substituting Equation (1) into Equation (2), another expression of excess adsorption can be obtained as follows:
n e x = n a b ( 1 ρ g ρ a )

2.2. Bulk Phase Density

As it is shown in Equation (3), the value of the bulk phase density is essential in determining the excess adsorption value. The bulk phase density denoted as ρ g is often calculated using the method named an equation of state (EOS). The EOS method is used to calculate the bulk phase density of the gas at specific pressure and temperature. There are, in fact, several various EOS methods available for that purpose. Among them, the most commonly applied ones are the cubic equations of Peng–Robinson (PR), the multiparameter Setzmann and Wagner (Se–W), as well as the Redlich–Kwong (RK). In this thesis, the RK EOS method [15] is chosen for the calculation of ρ g due to its accuracy of prediction under high-temperature and high-pressure conditions [16], which is also the case in most shale reservoir conditions. The RK EOS equations are shown as follows:
ρ g = M P Z R T
P = R T V b a V ( V + b )
V = Z R T P ; a = 0.42748 R 2 T c 2.5 T 0.5 P c ; b = 0.08664 R T c P c
where M is the molar mass of methane, g/mol; Z is the compressibility factor of methane in the gas phase; V is the molar volume of methane, cm3/mol; Tc is the critical temperature of methane, K; Pc is the critical pressure of methane, MPa; a and b are the parameters in the RK EOS method.

2.3. Adsorbed Phase Density

Also, the adsorbed phase density is critical regarding evaluating both the absolute and excess adsorption amounts. Nevertheless, it is difficult to measure the value of the adsorbed phase density directly. At present, adsorbed phase density is generally determined by some theoretical models. For instance, Nikolaev and Dubinin (1958) [17] regarded the adsorbed phase density as a constant, and it is the inverse of the van der Waals volume. Reich et al. (1980) [18] regarded the adsorbed phase density as the liquid density at the boiling point, and Mehta and Danner (1985) [19] regarded the adsorbed phase density as the liquid density at the critical point.
Meanwhile, some other methods take account of the effect of temperature when it comes to approximating the adsorbed phase density. For instance, in the equation proposed by Ozawa et al. (1976) [20], it is noted that the adsorbed phase density decreases as temperature increases. This is caused by the thermal expansion effect mentioned above. Taking account of the thermal expansion effect in an adsorbed phase density provides the benefit of bringing more physical meaning to the adsorption phenomenon than treating the adsorbed phase density as a constant. Additionally, another benefit of considering the thermal expansion effect with an adsorbed phase density is such that better results of adsorption isotherms curves will be generated than that of the ones with a constant adsorbed phase density [21]. Therefore, the equation proposed by Ozawa et al., shown in the following, will be used in the next section to calculate the adsorbed phase density:
ρ a = ρ l e λ ( T T b )
where ρ l is the liquid methane density at boiling point, 422.36 kg/m3;   λ is the thermodynamic expansion coefficient, K−1. A detailed explanation of this coefficient and its application will be discussed in the following sections; T b is the boiling temperature of methane, 111.66 K [22].

3. Single-Site Langmuir Adsorption Model

3.1. Single-Site Absolute Adsorption Model

When studying the methane adsorption phenomenon on various shale rock compositions (shales, clays, or kerogens), many researchers have chosen to apply the Langmuir monolayer equation for the same reason [7,8]. The Langmuir monolayer equation for an absolute adsorption amount is a function of n m a x , P, and P L , shown in the equation as follows:
n a b = n m a x P P L + P
The value of n m a x , the maximum adsorption capacity, is with respect to the adsorbed amount at a full capacity of the monolayer. For this value, Langmuir (1918) has indicated that it is independent of both temperature and pressure; rather, it is only related to the actual amount of adsorption sites that are available for the adsorbent. On the other hand, the value of P L , the Langmuir pressure, depends on the temperature.
Specifically, the Langmuir pressure is a function of enthalpy as well as entropy for adsorption [14], as shown as follows:
P L = P 0 exp ( Δ S 0 R ) exp ( Δ H R T )
where P 0 is the pressure at the perfect gas reference state and P 0 equals 0.1 MPa; Δ S 0 is the standard molar integral entropy at saturation where the surface energy coverage approaches unity, J/mol/K; Δ H is the differential enthalpy of adsorption, KJ/mol, and it numerically equals the isosteric heat of adsorption, i.e., ΔH = −Qst.
Therefore, Equation (7) can be rewritten as:
P L = P 0 exp ( Δ S 0 R ) exp ( Q st R T )

3.2. Single-Site Excess Adsorption Model

As discussed in Equation (3), the amount of excess adsorption is closely related to that of the absolute adsorption. Their only difference is characterized by the bulk gas phase volume that takes up the adsorbed phase volume in the absolute adsorption. When we use the single-site Langmuir model to describe the absolute adsorption, the excess adsorption model can be given as:
n e x = n m a x P P L + P ( 1 ρ g ρ a )
When we use Equation (5) to describe the density for the adsorption phase, Equation (9) can be further given as:
n e x = n m a x P P L + P ( 1 ρ g ρ l e λ ( T T b ) )
The parameters listed in this equation are the same as appearing in the original equation. The value of ρ g is calculated using the RK EOS equation discussed in Equation (4).

4. Multi-Site Langmuir Adsorption Model

Even though the Langmuir absolute adsorption model has demonstrated positive results with studying the methane adsorption in shale reservoirs, it does have one shortcoming with this model, which is associated with the nature of the shale reservoirs. As mentioned before, the single-site Langmuir adsorption model has been widely used to investigate the adsorption behaviors of each of the shale rock compositions individually (e.g., clays or kerogens). In reality, shale rocks are often made of a variety of compositions, such as quartz, clay, and kerogen. The single-site Langmuir model, however, assumes that the adsorbent is a homogeneous surface [23]. Therefore, it is inappropriate to apply this single-site Langmuir model directly to heterogeneous shale rocks when it comes to studying the real methane adsorption behaviors.

4.1. Heterogeneity for Methane Adsorption on Shale

Since shale rocks are often made up of several different compositions, their adsorption energy is usually heterogeneous as well across their surfaces, meaning that various adsorption energy is observed on their surfaces instead of a singular value for an entire adsorbent. For example, the methane adsorption heat for clay lies in the range between 9.6 KJ/mol and 16.6 KJ/mol, which means that various clays have various capabilities towards methane adsorption [24]. Meanwhile, when it comes to methane adsorption on isolated kerogens, their heat of adsorption is in a much wider range, from 8.46 KJ/mol to 21.9 KJ/mol. This observation indicates that methane adsorption on kerogens is rather a complicated issue; in fact, this wide range of adsorption heat is due to the various types of kerogens as well as different stages of their thermal maturity [7,21,25,26,27,28,29]. Additionally, pore size of adsorbents also affects their adsorption energy. In the case with a smaller pore size, the interaction between a fluid and a wall is stronger than that in the case of a larger pore size. Therefore, a smaller pore size leads to higher adsorption energy [30,31]. On the contrary, in the case where a pore size is greater than ~10 nm, as the pore size increases, the change in adsorption energy is noticeably less.

4.2. Multi-Site Absolute Adsorption Model

Since compositions and pore sizes play critical roles in determining the adsorption energy, merely assuming a homogeneous surface with constant adsorption energy is not applicable any longer to analyze the complex methane adsorption on strongly heterogeneous shales. To overcome this challenge, a new model is required to address a variety of shale rocks compositions, as well as pore size distributions, i.e., multiple adsorption sites across adsorption surfaces; thus, the following equations are provided for such a purpose:
n a b = n m a x i = 1 i = n α ( i ) P P L ( i ) + P
And the Langmuir pressure is given as
P L ( i ) = P 0 exp ( Δ S ( i ) 0 R ) exp ( Q s t ( i ) R T )
where n is the number of the adsorption sites that are available; α ( i ) is the fraction of a single adsorption site; P L ( i ) is the Langmuir pressure for a single adsorption site, MPa; Δ S ( i ) 0 is the standard entropy for a single adsorption site, J/mol/K; Q s t ( i ) is the adsorption heat for a single adsorption site, KJ/mol.
Compared with the single-site Langmuir model in Equation (9), this model embraces the intricate compositions of natural shale rocks and is, therefore, more valid to be applied to analyze the real methane gas adsorption behaviors. Nevertheless, this model contains more unknown variables compared with the single-site Langmuir model. Specifically, the unknown parameters in the equations include: n m a x , α ( i ) ,   Δ S ( i ) 0 , and Q s t ( i ) . In order to simplify the model and make it more applicable to use, two simplifications are made in our work:
(1)
Taking an average value of entropy Δ S m 0 , for adsorption to eliminate the parameter Δ S ( i ) 0 . Thus, Equation (12) becomes:
P L ( i ) = P 0 exp ( Δ S m 0 R ) exp ( Q s t ( i ) R T )
where Δ S m 0 is the average or apparent standard entropy for adsorption, J/mol/k.
(2)
Assuming a Gaussian distribution is often the case with the adsorption heat Q s t ( i ) for shales, as described by the equations below:
f ( i ) = 1 σ 2 π exp ( ( Q s t ( i ) Q m ) 2 2 σ 2 )
f T = Q m i n Q m a x 1 σ 2 π exp ( ( Q s t ( i ) Q m ) 2 2 σ 2 ) d Q s t
α ( i ) = f ( i ) f T
i = 1 i = n α ( i ) = 1
where Q m is the mean value for the adsorption heat of the adsorbent, KJ/mol; σ is the standard deviation of the normal distribution. Instead of having negative infinity and positive infinity as the lower and upper limits for adsorption heat, values of 0 KJ/mol and 30 KJ/mol are assumed as Qmin and Qmax, respectively.

4.3. Multi-Site Excess Adsorption Model

Similarly, just like the single-site excess adsorption equation, the multi-site excess adsorption model can also be derived by substituting both Equation (11) of the multi-site absolute adsorption model and Equation (5) of the adsorbed phase density into Equation (3), the result is shown as the following equation below:
n e x = n m a x i = 1 i = n α ( i ) P P L ( i ) + P · ( 1 ρ g ρ l e λ ( T T b ) )
To simplify this model, the same simplifications used for the multi-site absolute adsorption model for parameters P L ( i ) and α ( i ) are applied to this model as well.

5. Samples and Experiments

In this section, a series of methane adsorption experiments are conducted with actual shale samples collected from China, and the measured adsorption isotherms are validated with the adsorption models introduced above. The physical properties of our four studied samples are grain density, bulk density, total pore volume, and total porosity. The results obtained are listed in Table 1. Both the grain density and bulk density values are comparable for four samples. The value of the total pore volume is in the same trend as the total porosity.
Then, the studied samples are crushed and milled to about 100 mesh with average particle sizes of 150 μm. Next, those powders are put into an oven at 110 °C for 24 h to dry up. Once that is completed, the methane adsorption isotherm experiments are ready to start. Our experiments are conducted by a volumetric method with the help of equipment called an IMI isotherm analyzer (manufactured by Hiden Analytical Ltd. in Warrington, UK). This equipment is a highly automatic one, and its main procedures are controlled by an embedded computer in the Process Control Interface (PCI), including the free volume measurement, pressure recording, and uptake recording. There are two steps we take to conduct this experiment with this equipment. The first step is to add the weighted sample inside the sample cell, and the second step is to set the equilibrium pressure and the temperature. In this study, we conduct the experiments at three different temperatures, which are 30 °C (303.15 K), 60 °C (333.15 K), and 90 °C (363.15 K). The pressure range for this experiment is between 0.5 MPa and 20 MPa. The temperature and pressure ranges are set this way to mimic the actual shale reservoir conditions. For each sample, we collect 16 data measurements of methane uptake versus pressure at three temperature conditions.
Once the above adsorption experiments are carried out and the required data are collected, we then start to apply the excess adsorption models (both the single-site and multi-site equations) to fit with the measurement data to check if these two models are valid to represent the real adsorption scenarios.

6. Results and Discussion

6.1. Adsorption Isotherms Fitting by Single-Site Model

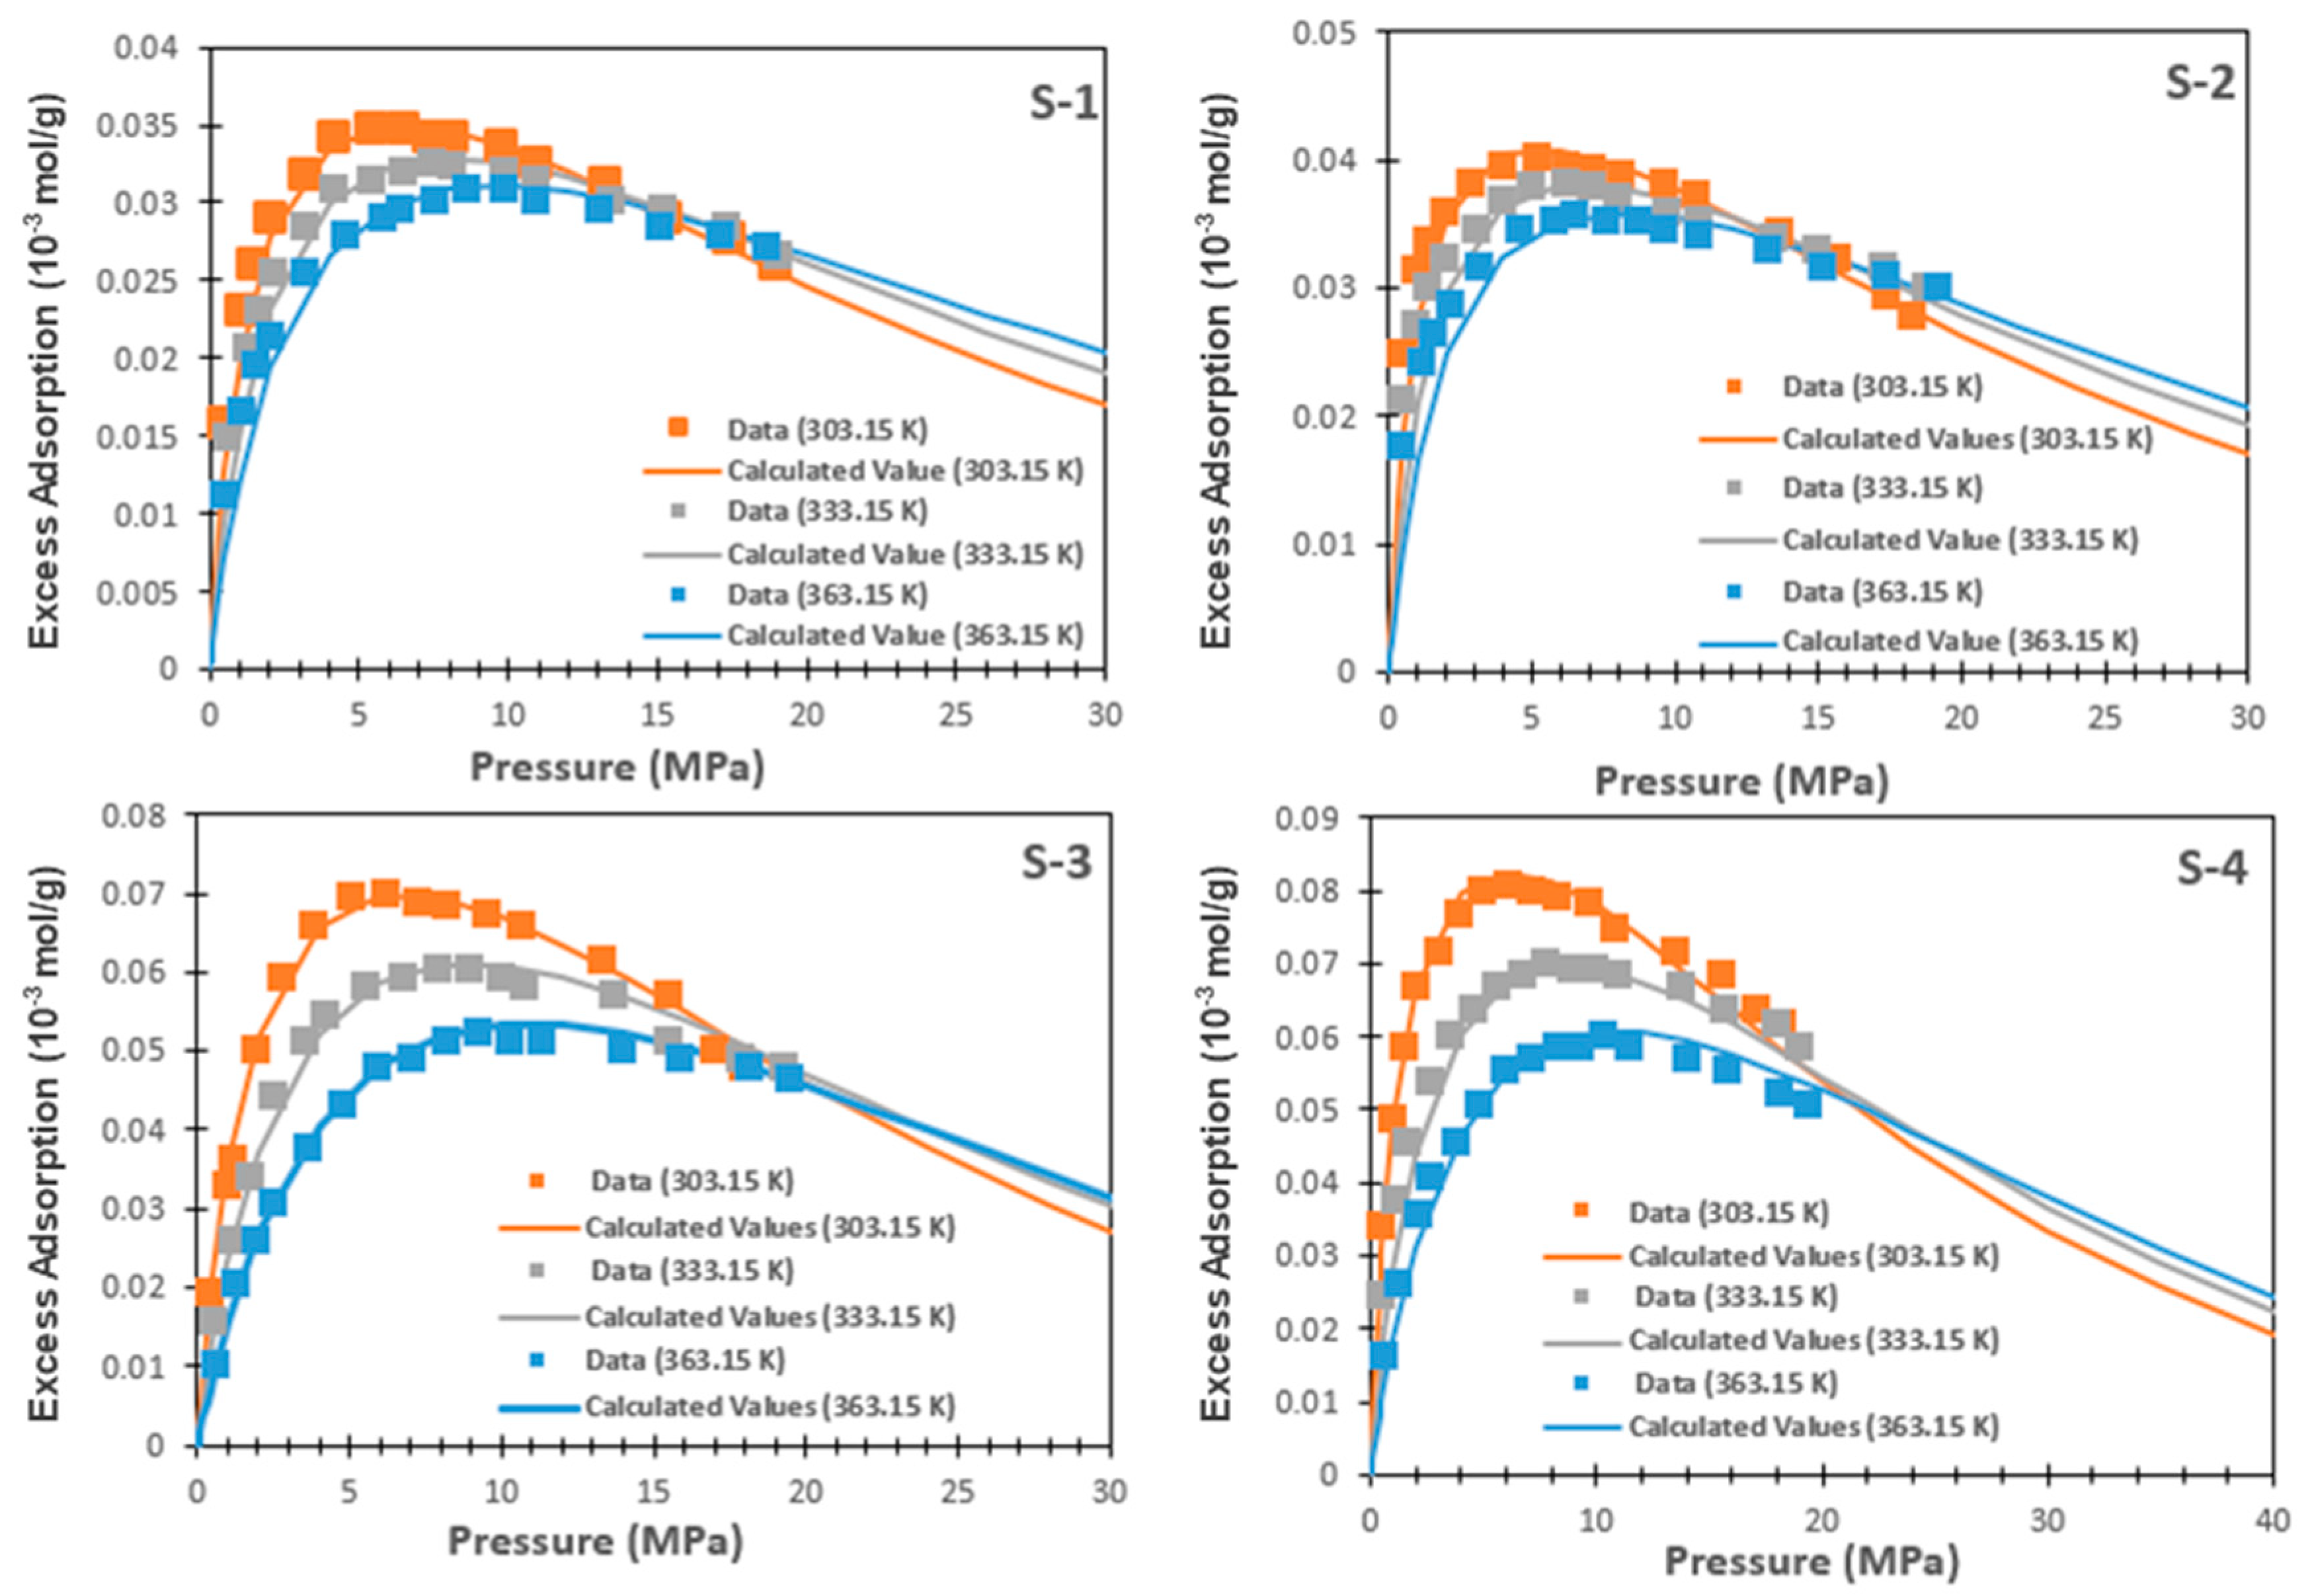
As shown in Equation (10), the single-site excess adsorption model has three parameters that can potentially be modified to fit the calculated adsorption values with the measured data. These three parameters are   n m a x ,   P L , and   λ . After trials and errors with modifying these three parameters, our calculated results are well fitted with the measured adsorption data for our four shale samples with temperature ranging from 303.15 K to 363.15 K and pressure up to 20 MPa, as shown in Figure 2. The fitting parameters are summarized in Table 2.
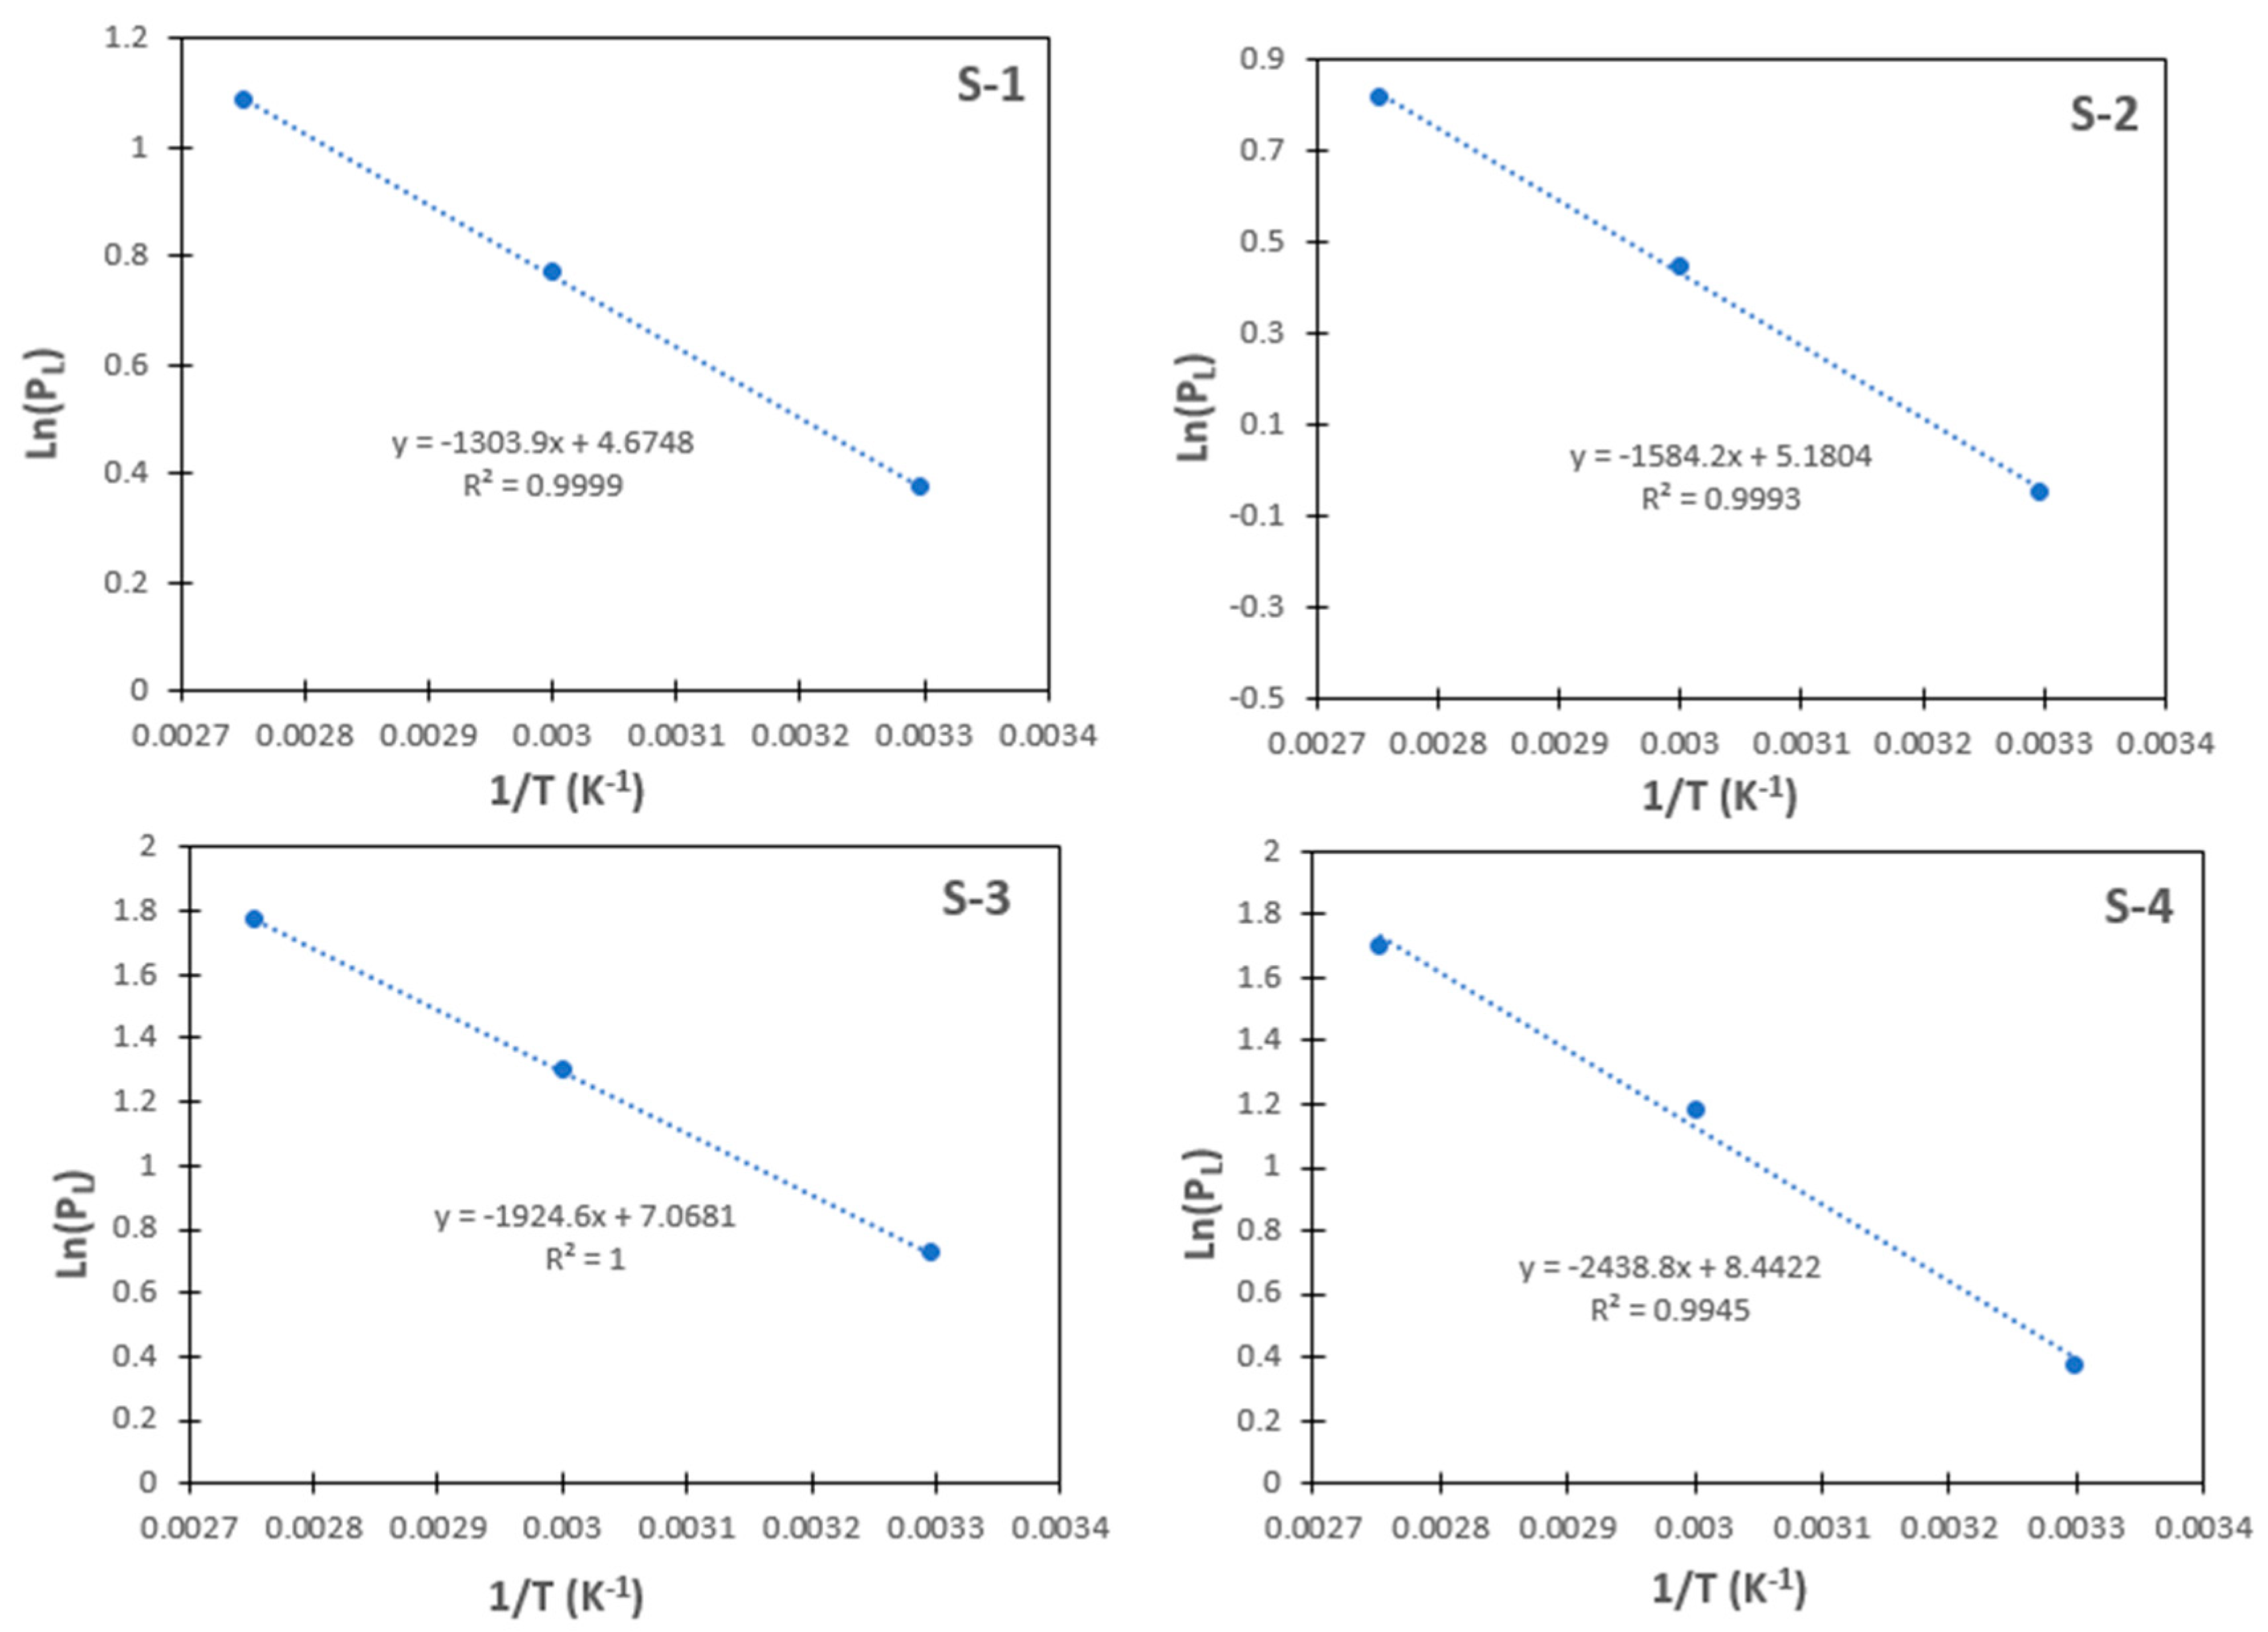
The value of n m a x is a property of the adsorbent and only related to the number of the adsorption sites available to the adsorbent; therefore, the temperature has no effect on it. The value of λ is a property of the adsorption fluid, which is methane in our case, and this value is also not affected by the temperature either. The only parameter that fluctuates with the temperature is P L . The reason behind this can be explained by Equation (7), which shows that P L is a function of temperature and two thermodynamic parameters Δ S 0 (adsorption entropy) and Δ H (adsorption enthalpy). To find out the values of these two parameters for each shale sample, a linear relationship between P L and these two parameters is derived from Equation (7) as follows:
ln P L = Δ H R T Δ S 0 R + ln P 0
Since we already have the values of P L , R, T, and P 0 , the two unknown values of Δ S 0 and Δ H of each sample can be calculated from the intercept and slope of the linear relationship between ln P L and   1 T , as demonstrated in Figure 3. Also, the fitted Δ S 0 and Δ H for our studied four samples are also shown in Table 2. As one can see, sample S-4 has the largest absolute values of adsorption enthalpy and entropy compared to the rest of the samples. That means that the binding energy for methane molecules on S-4 is significantly higher compared to that of the rest of the samples.

6.2. Adsorption Isotherms Fitting by Multi-Site Model

As shown in Equations (13)–(15), the multi-site excess adsorption model has five parameters that we can potentially modify to fit the calculated adsorption values with the actually measured data. These five parameters are n m a x , Δ S m 0 , Q m , σ , and λ , and all the parameters listed in this table are independent of the effect of temperature. After trials and errors with modifying these five parameters, our calculated results are well fitted with the measured adsorption data for our four shale samples with temperature ranging from 303.15 K to 363.15 K and pressure up to 20 MPa, as shown in Figure 4. The fitting parameters are summarized in Table 3.
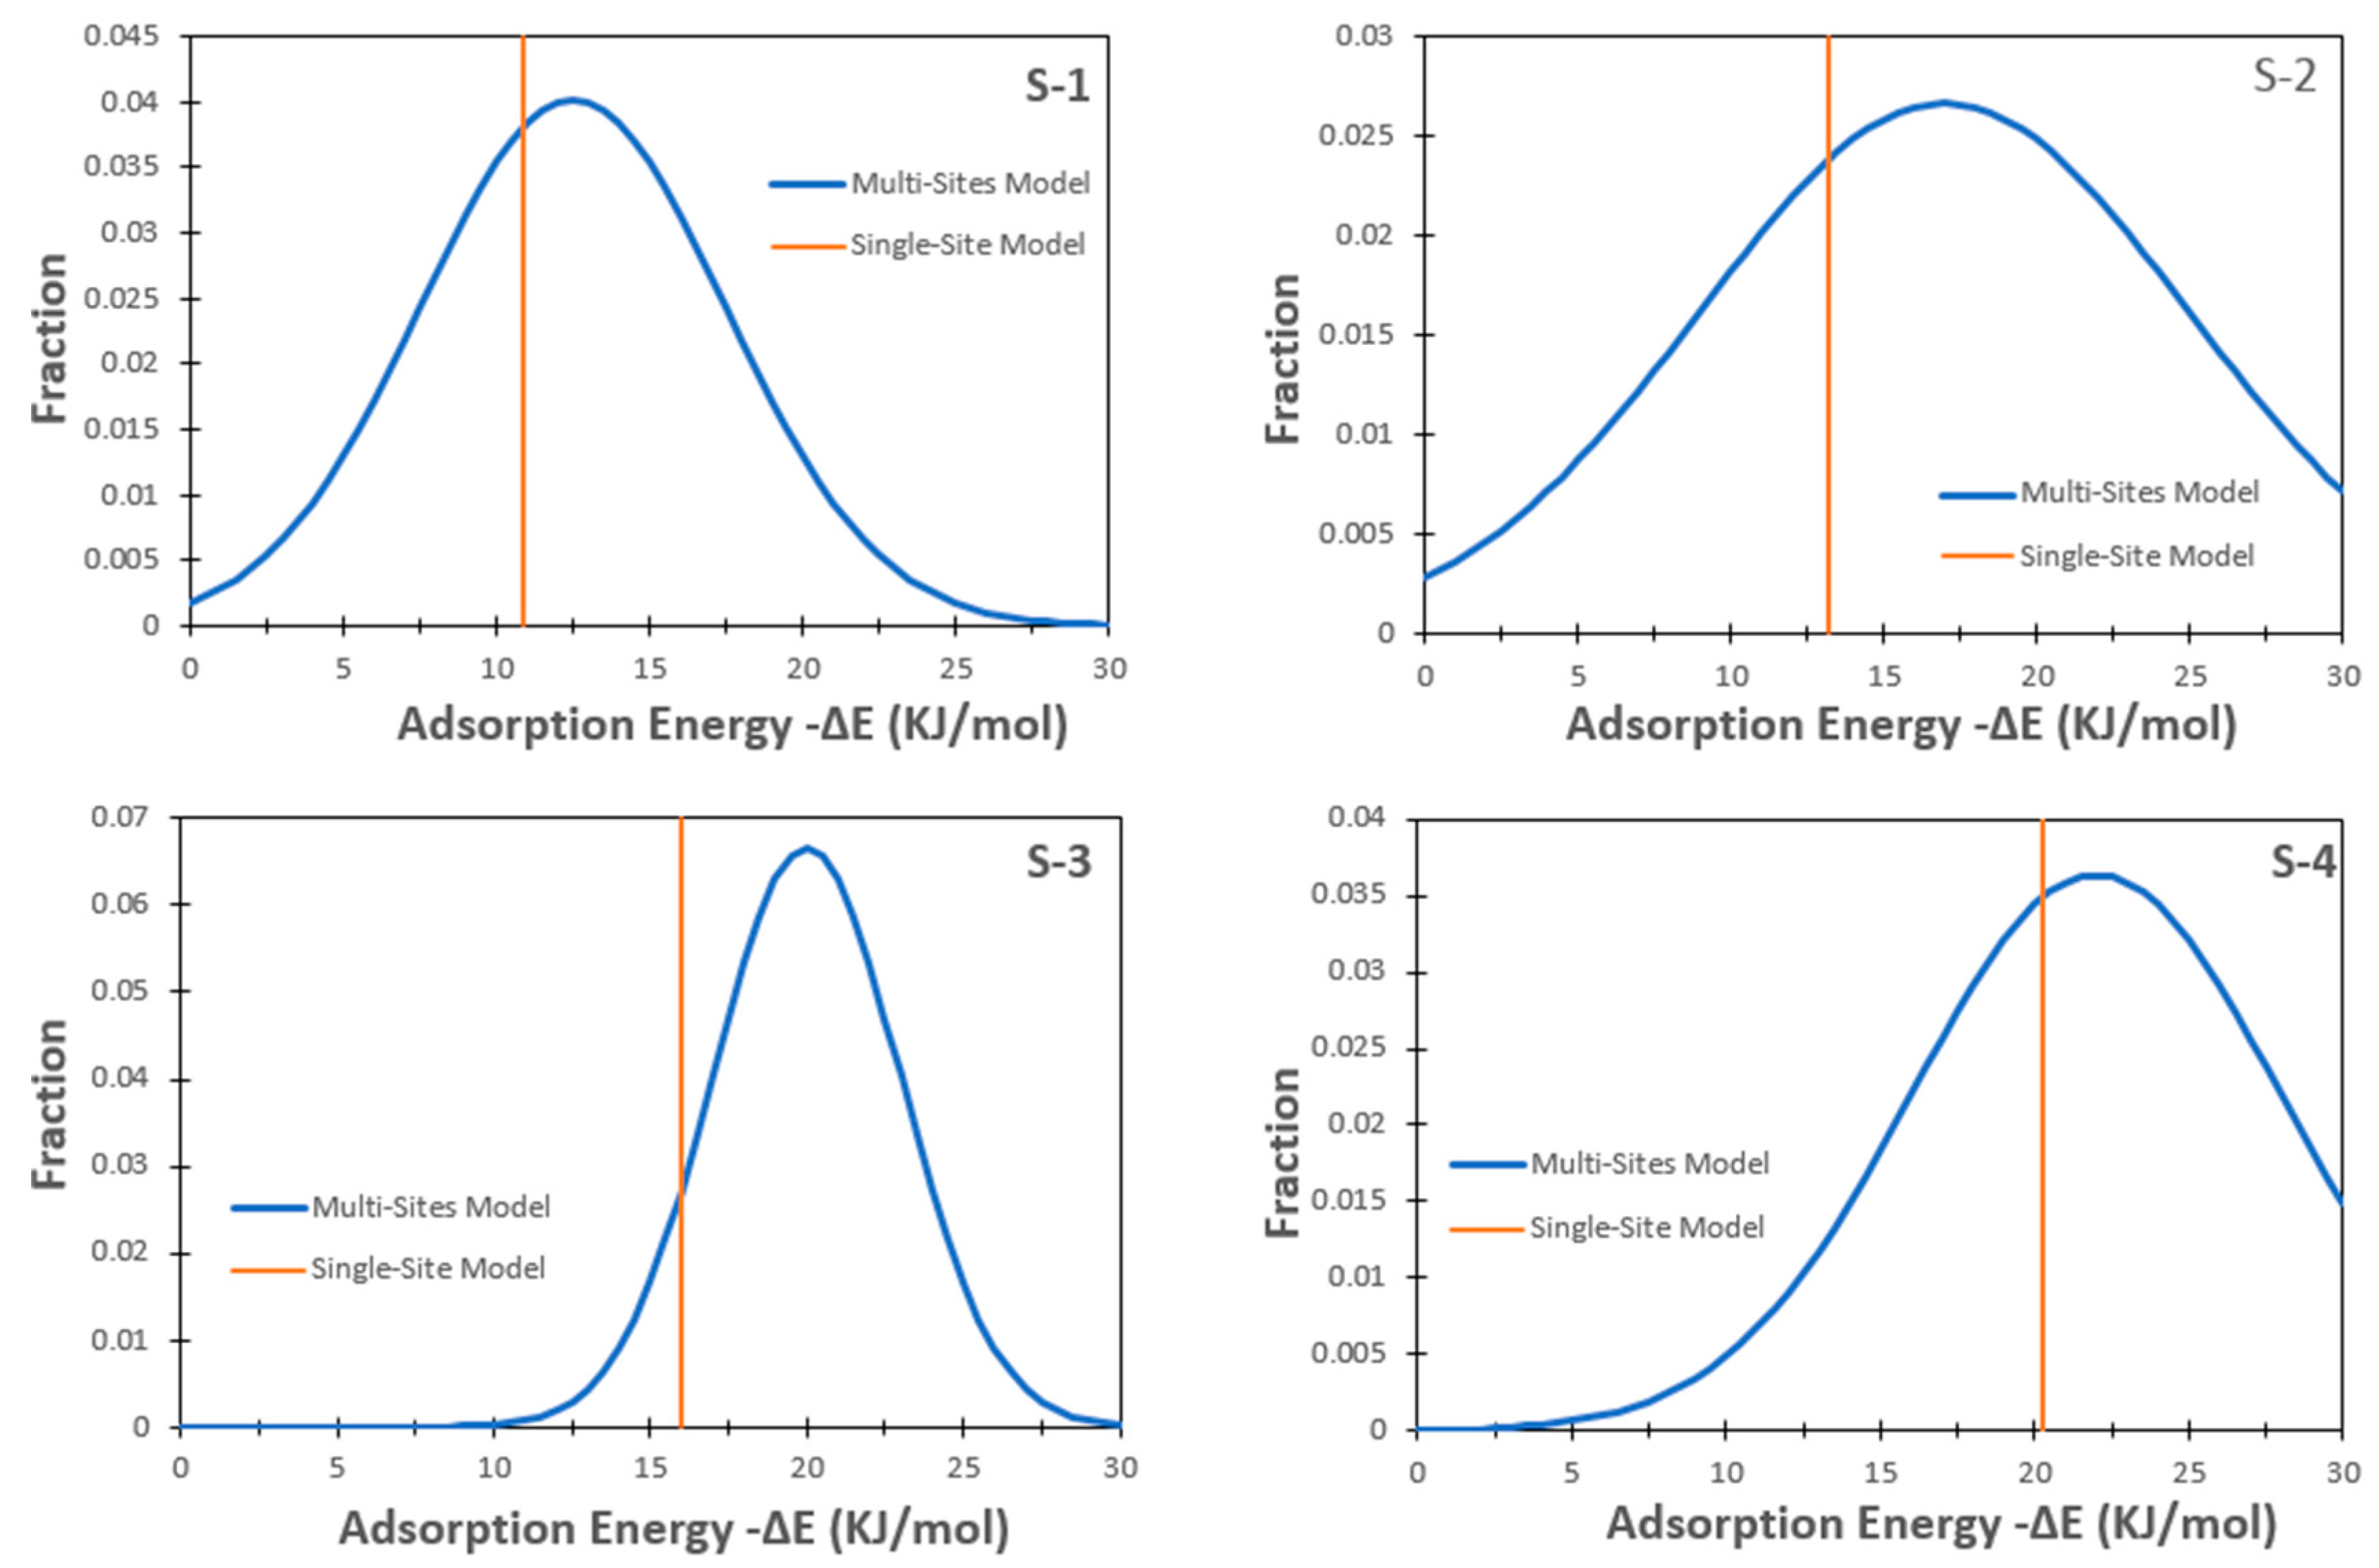
The energy distribution of each sample is also illustrated in Figure 5 with a comparison of the constant adsorption value of the single-site adsorption model; where the distribution of adsorption energy is calculated by Equations (14a)–(14d) from a Gaussian distribution assumption, and the related parameters are shown in Table 3, and adsorption energy fitted by the single-site adsorption model is the value of Enthalpy Δ H in Table 2. As one can see in these figures, the multi-site adsorption model for each sample has a wide range of values for adsorption energy due to the consideration of heterogeneity. On the contrary, the single-site adsorption model is incapable of addressing the various adsorption energy across the shale surface. It assumes a constant value for adsorption energy instead. Because of that, the single-site model lacks physical meaning when it comes to describing the adsorption heat distribution across the shale surfaces. More comparisons of these two models, regarding their accuracy against the measured experimental data, will be made in the following section.

6.3. Comparison of Two Models

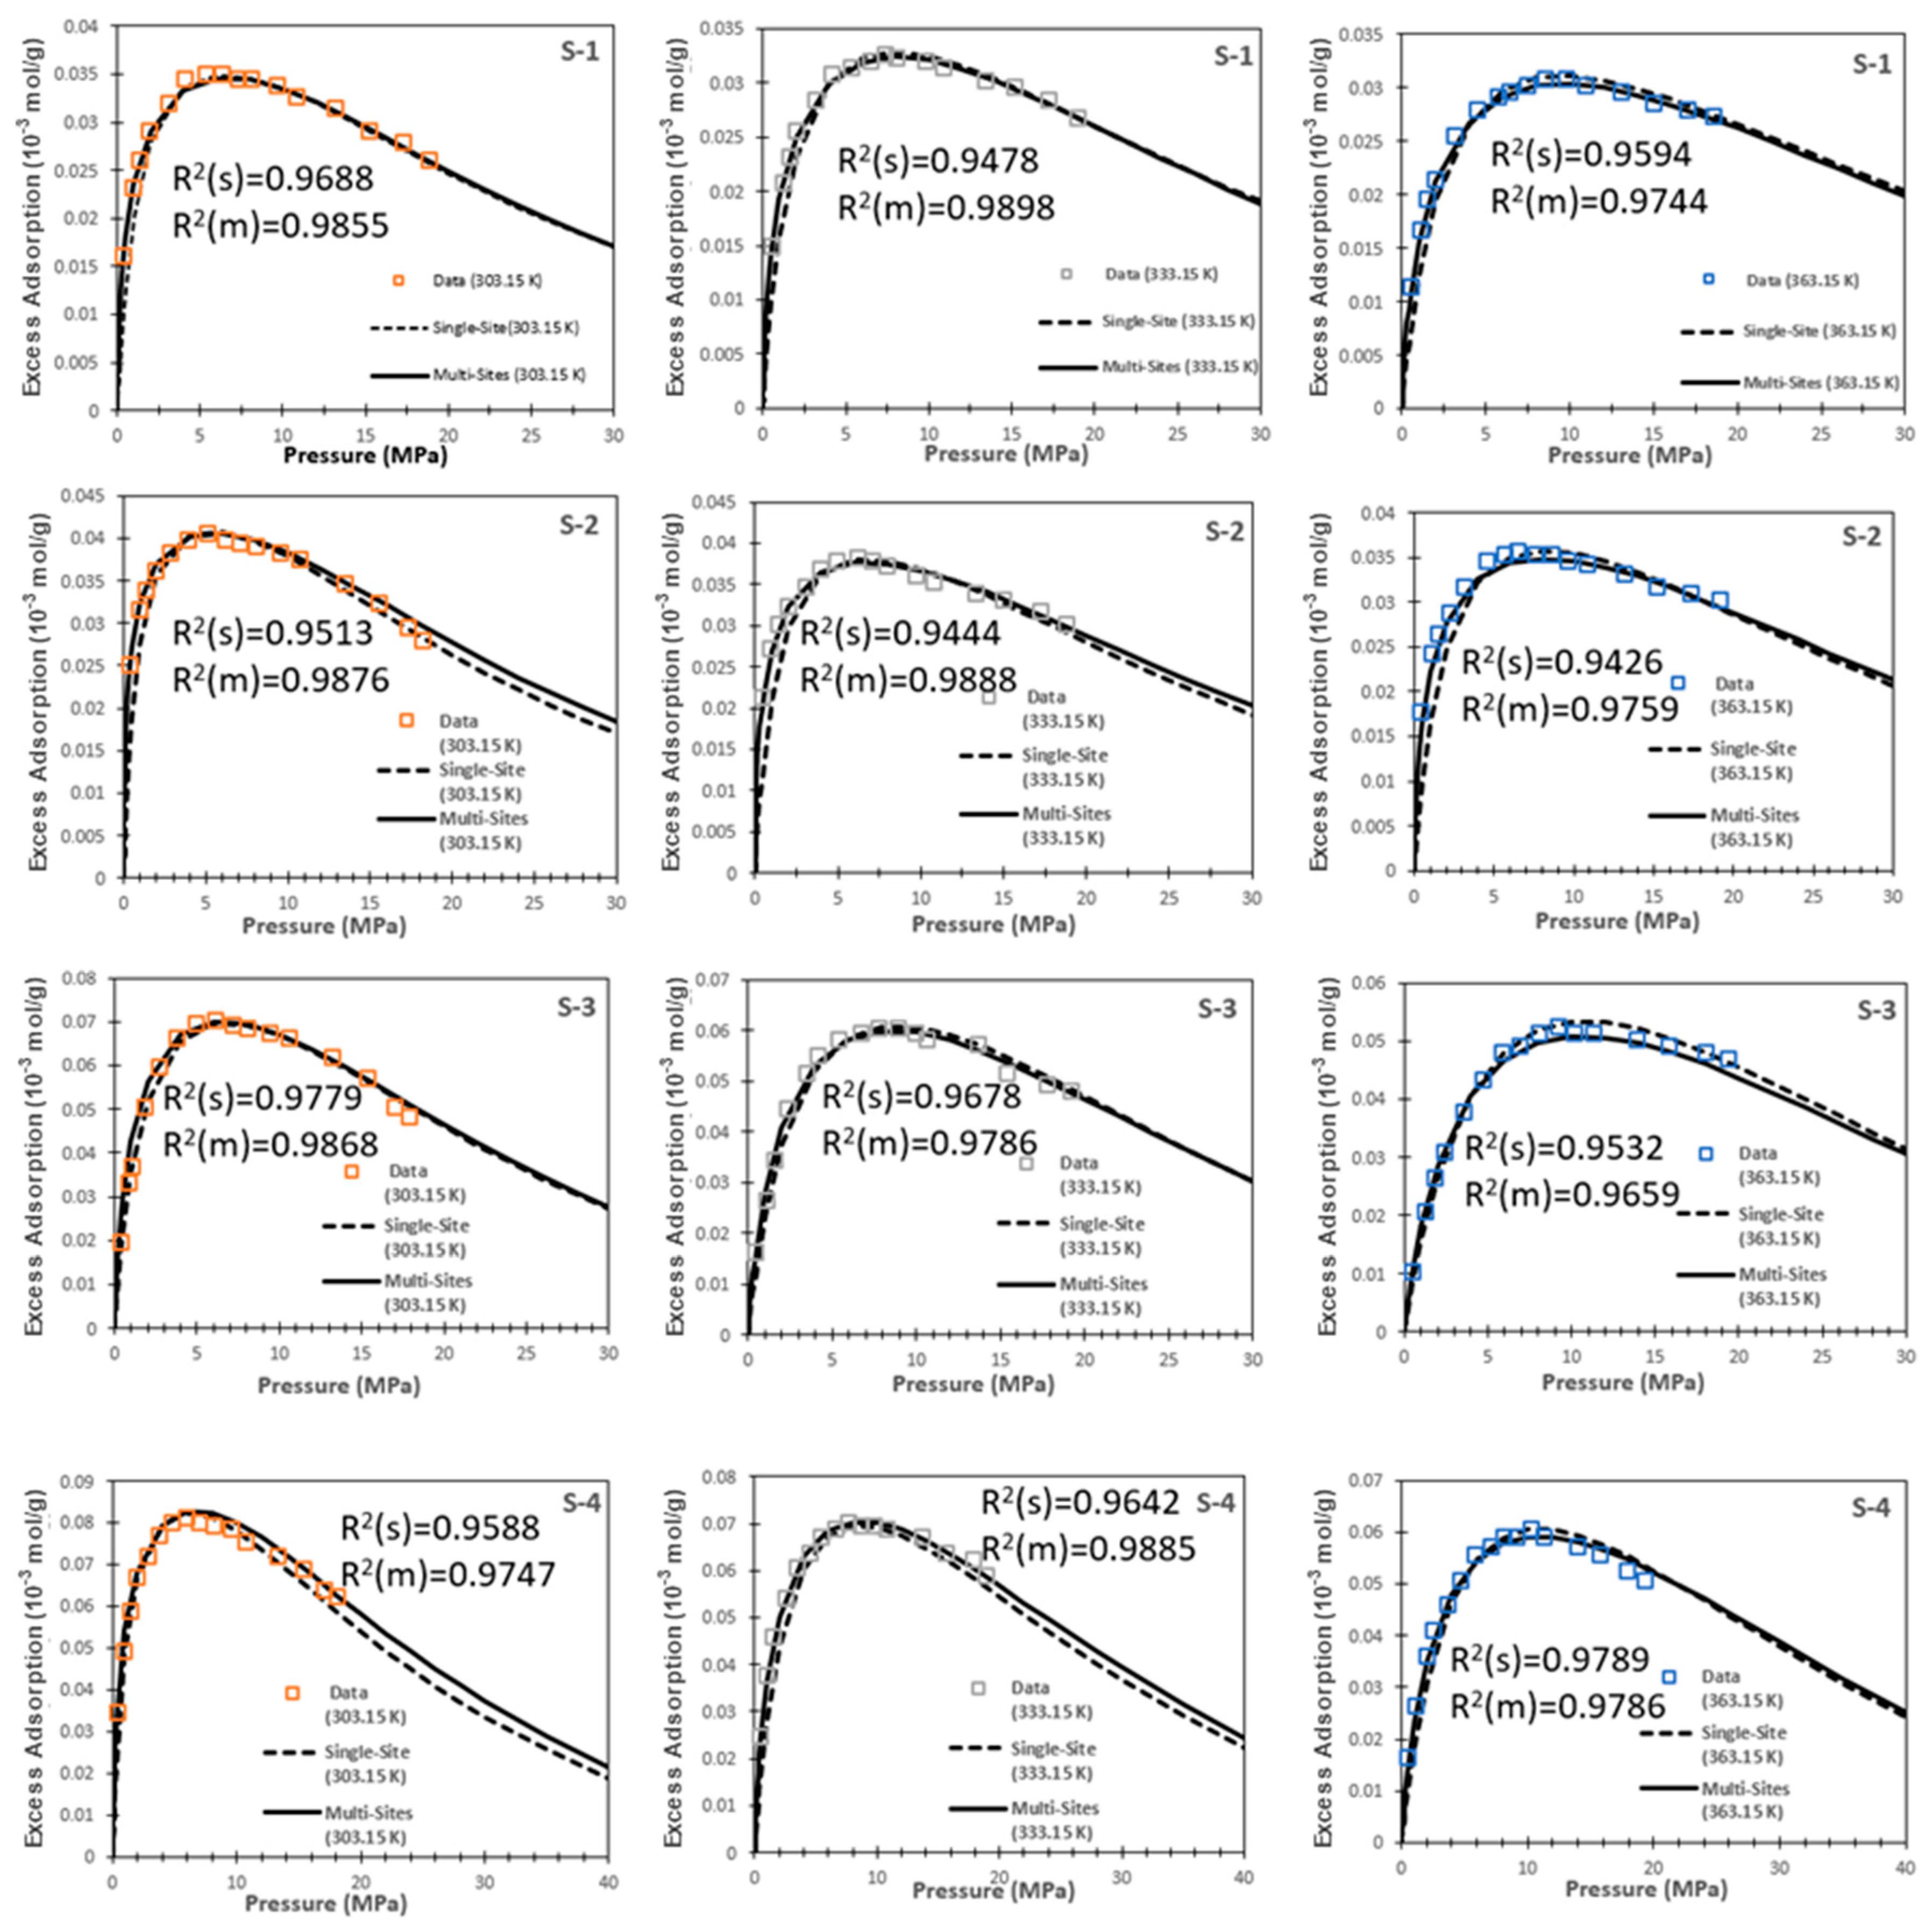
As shown in the previous two sub-sections, both the single-site model and multi-site model have achieved acceptable fitting results with the experimentally measured data. Now, it is time to compare these two models regarding their accuracy with these data. Figure 6 demonstrates the comparison of these two models for the four samples, and Table 4 is generated to summarize the percentage of errors of applying each model for each sample. As one can see in Table 4, the results calculated by the multi-site model have a lower percentage of errors compared with those of the single-site model for all four samples. The multi-site adsorption model predicts better adsorption behaviors of methane on shales because it addresses the heterogeneity of shale surfaces by having a wide range of adsorption heat values instead of having a constant value, which is the case for the single-site model.

6.4. Absolute Adsorption and Excess Adsorption

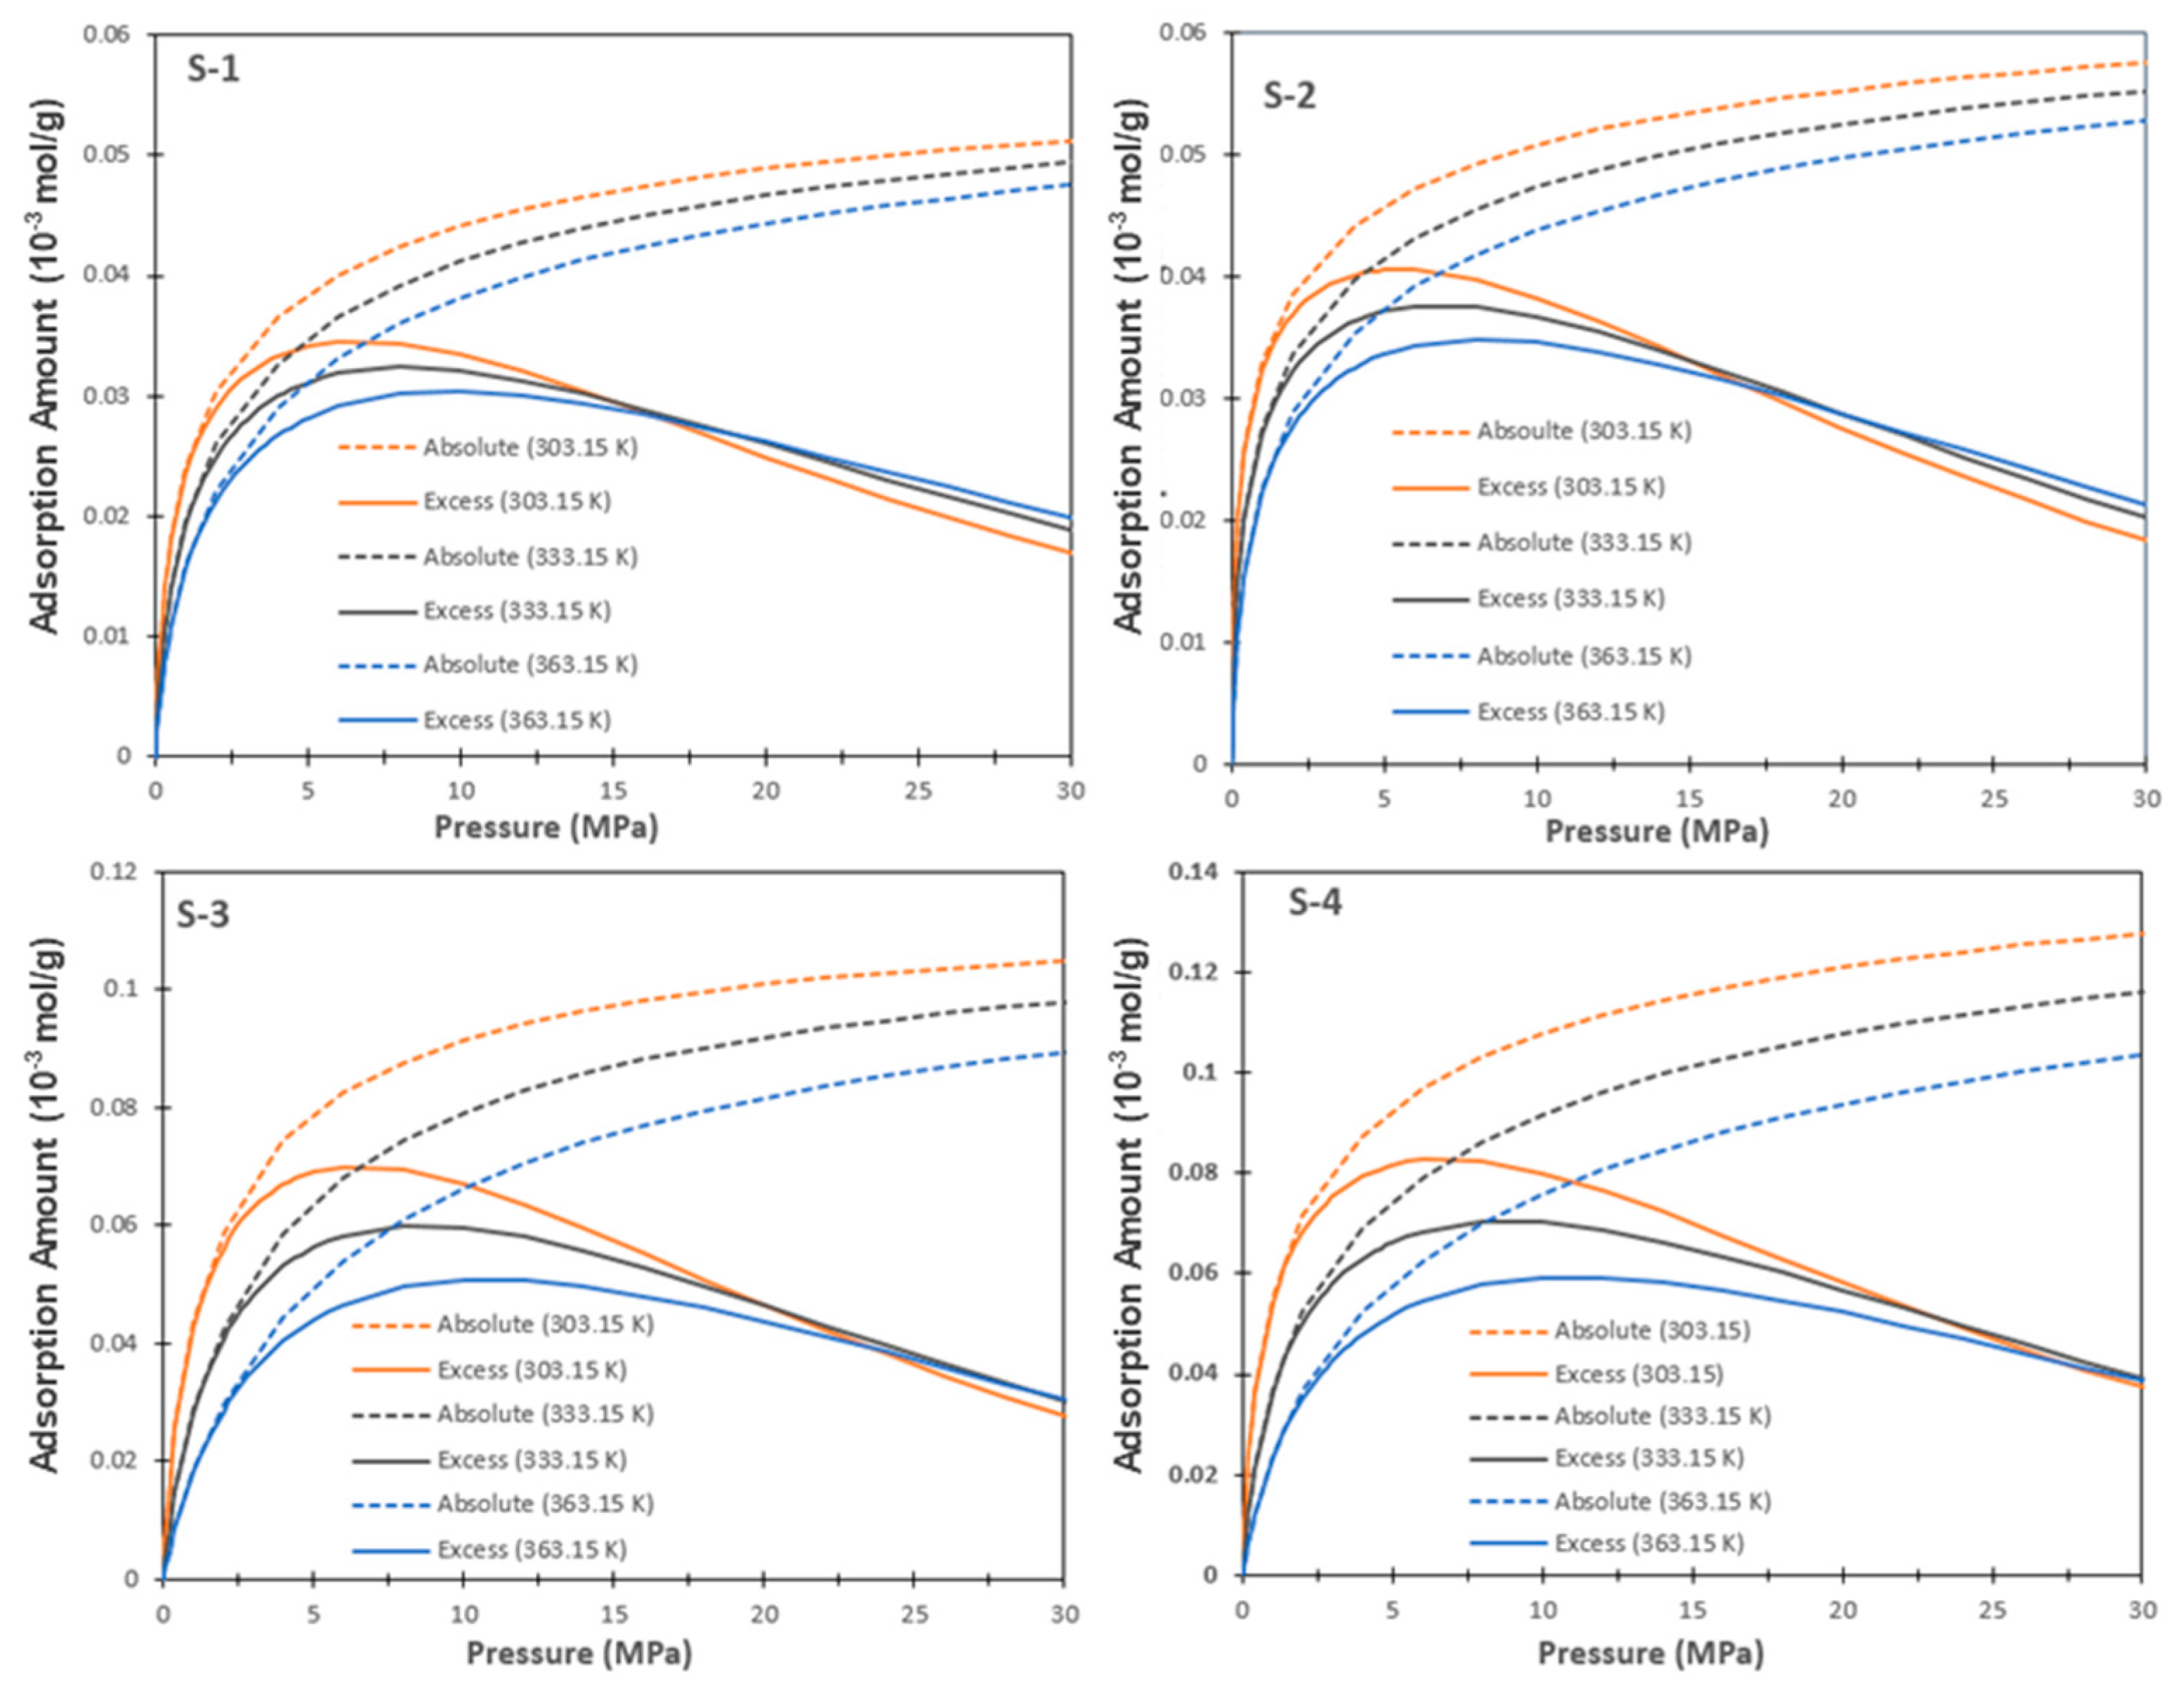
In the previous sections, we have compared the single-site and multi-site adsorption models with the actual experimental data and concluded that the multi-site model is more accurate when it comes to predicting the methane adsorption behaviors on shales. In this section, we will compare the absolute adsorption and excess adsorption isotherms of the multi-site model. To compare these two isotherms, first, we need to use the fitted parameters and substitute them into Equation (11) to obtain the absolute adsorption isotherm for each sample under three different temperatures. Then, we plot them together with the excess adsorption isotherms under the same conditions, as shown in Figure 7.
As one can see in those curves, the absolute adsorption always decreases while the temperature increases. The excess adsorption isotherm curves have similar behaviors with those of the absolute adsorption isotherm curves up to a particular pressure. Then, there comes a change, when the temperature goes higher and the adsorption uptake becomes less. This change is observed with the crossovers of the excess adsorption isotherm curves under three different temperatures in Figure 7. The effect of temperature on absolute adsorption is well understood and can be attributed to the thermodynamic theory, which states that as the temperature increases, the gas molecules become more kinetic and, therefore, the residence time on the shale rocks becomes significantly shorter. Because of that, an apparent reduction in the absolute adsorption occurs.
Compared with the straightforward effect of temperature on absolute adsorption, the effect of temperature on excess adsorption is instead a complex issue and needs to be studied in detail. As Equation (3) shows, the uptake amount of methane depends on the relative magnitude of n a b and   ( 1 ρ g ρ a ) . As discussed above, when temperature increases, the absolute adsorption value of n a b decreases. On the other hand, the value of ( 1 ρ g ρ a ) starts to increase, which is due to the fact that the value of ρ g starts to decrease as temperature increases. Since these two values are in inverse trends with the effect of temperature, whether the value of the excess adsorption increases or decreases depends on the relative magnitudes of these two terms; and thus, crossovers occur in the excess adsorption isotherm curves

7. Conclusions

In this work, four samples of shales are selected to carry out the methane adsorption analysis, and the obtained results are then used to validate the single-site and multi-site excess adsorption models. The following conclusions can be drawn:
(1)
Several laboratory tests have been conducted to understand the characteristics of these shale samples. The results have shown that these samples have many features in common, such as the primary compositions of the content being quartz, clay, and kerogen. Once the physical properties of these samples are studied, a series of adsorption isotherms analyses, with a wide range of pressures and temperatures, corresponding to the actual shale reservoir condition, are then carried out for these samples.
(2)
The traditional single-site Langmuir adsorption model is commonly applied to investigate the methane adsorption in shales. However, this model assumes that a surface is homogeneous, and thus it is incapable of addressing the heterogeneity (various mineral materials and pore sizes) of shales on methane adsorption. Therefore, in order to accurately analyze the methane adsorption behaviors on shales, an adsorption model with an assumption of a heterogeneous surface is needed.
(3)
Both the single-site and multi-site excess adsorption models achieved satisfying fitting results with the actual measured data. Nevertheless, the multi-site model is capable of addressing the heterogeneity of shales by a wide range of adsorption energy distributions (owing to the complex compositions and different pore sizes), which is different from the single-site model only characterized by single adsorption energy. Consequently, the multi-site model results have better accuracy against the experimental data.

Author Contributions

Writing—original draft preparation, Z.W.; Writing—review & editing, L.J. and T.Z.; Formal analysis, Y.J.; Methodology, Z.W. and K.Z.; Investigation, Y.J. and K.Z.; Supervision, L.J. and T.Z. All authors have read and agreed to the published version of the manuscript.

Funding

This research was funded by [State Key Laboratory of Shale Oil and Gas Enrichment Mechanisms and Efficient Development] grant number [33550000-21-ZC0613-0301].

Data Availability Statement

Data are contained within the article.

Conflicts of Interest

The authors declare no conflict of interest.

References

  1. Aguilera, R. Flow units: From conventional to tight-gas to shale-gas to tight-oil to shale-oil reservoirs. SPE Reserv. Eval. Eng. 2014, 17, 190–208. [Google Scholar] [CrossRef]
  2. IEA (International Energy Agency): Outlook for unconventional gas. World Energy Outlook 2015, 2015, 229–268.
  3. Wood, D.A.; Hazra, B. Characterization of organic-rich shales for petroleum exploration & exploitation: A review-Part 3: Applied geomechanics, petrophysics and reservoir modeling. J. Earth Sci. 2017, 28, 779–803. [Google Scholar]
  4. Curtis, J.B. Fractured shale-gas systems. AAPG Bull. 2002, 86, 1921–1938. [Google Scholar]
  5. Lu, X.C.; Li, F.C.; Watson, A.T. Adsorption measurements in Devonian shales. Fuel 1995, 74, 599–603. [Google Scholar] [CrossRef]
  6. Li, J.; Li, X.; Wang, X.; Li, Y.; Wu, K.; Shi, J.; Yang, L.; Feng, D.; Zhang, T.; Yu, P. Water distribution characteristic and effect on methane adsorption capacity in shale clay. Int. J. Coal Geol. 2016, 159, 135–154. [Google Scholar] [CrossRef]
  7. Zhang, T.; Ellis, G.S.; Ruppel, S.C.; Milliken, K.; Yang, R. Effect of organic-matter type and thermal maturity on methane adsorption in shale-gas systems. Org. Geochem. 2012, 47, 120–131. [Google Scholar] [CrossRef]
  8. Ji, L.; Zhang, T.; Milliken, K.L.; Qu, J.; Zhang, X. Experimental investigation of main controls to methane adsorption in clay-rich rocks. Appl. Geochem. 2012, 27, 2533–2545. [Google Scholar] [CrossRef]
  9. Ross, D.J.; Bustin, R.M. The importance of shale composition and pore structure upon gas storage potential of shale gas reservoirs. Mar. Pet. Geol. 2009, 26, 916–927. [Google Scholar] [CrossRef]
  10. Ambrose, R.J.; Hartman, R.C.; Diaz-Campos, M.; Akkutlu, I.Y.; Sondergeld, C.H. Shale Gas-in-Place Calculations Part I: New Pore-Scale Considerations. SPE J. 2012, 17, 219–229. [Google Scholar] [CrossRef]
  11. Roque-Malherbe, R.M. Adsorption and Diffusion in Nanoporous Materials; CRC Press/Taylor & Francis: Boca Raton, FL, USA, 2018. [Google Scholar]
  12. Yang, F.; Ning, Z.; Zhang, R.; Zhao, H.; Krooss, B.M. Investigations on the methane sorption capacity of marine shales from Sichuan Basin, China. Int. J. Coal Geol. 2015, 146, 104–117. [Google Scholar] [CrossRef]
  13. Do, D.D.; Do, H.D.; Fan, C.; Nicholson, D. On the existence of negative excess isotherms for argon adsorption on graphite surfaces and in graphitic pores under supercritical conditions at pressures up to 10,000 atm. Langmuir 2010, 26, 4796–4806. [Google Scholar] [CrossRef] [PubMed]
  14. Myers, A.L. Thermodynamics of adsorption in porous materials. AIChE J. 2002, 48, 145–160. [Google Scholar] [CrossRef]
  15. Redlich, O.; Kwong, J.N. On the thermodynamics of solutions. V. An equation of state. Fugacities of gaseous solutions. Chem. Rev. 1949, 44, 233–244. [Google Scholar] [CrossRef]
  16. Wu, K.; Chen, Z.; Li, X.; Dong, X. Methane storage in nanoporous material at supercritical temperature over a wide range of pressures. Sci. Rep. 2016, 6, 33461. [Google Scholar] [CrossRef]
  17. Nikolaev, K.M.; Dubinin, M.M. Concerning adsorptional properties of carbon adsorbents 3. A study of adsorption isotherms of gases and vapors on active carbons over a wide interval of temperatures, including the critical region. Russ. Chem. Bull. 1958, 7, 1124–1133. [Google Scholar] [CrossRef]
  18. Reich, R.; Ziegler, W.T.; Rogers, K.A. Adsorption of methane, ethane, and ethylene gases and their binary and ternary mixtures and carbon dioxide on activated carbon at 212-301 K and pressures to 35 atmospheres. Ind. Eng. Chem. Process Des. Dev. 1980, 19, 336–344. [Google Scholar] [CrossRef]
  19. Mehta, S.D.; Danner, R.P. An improved potential theory method for predicting gas-mixture adsorption equilibria. Ind. Eng. Chem. Fundam. 1985, 24, 325–330. [Google Scholar] [CrossRef]
  20. Ozawa, S.; Kusumi, S.; Ogino, Y. Physical adsorption of gases at high pressure. IV. An improvement of the Dubinin—Astakhov adsorption equation. J. Colloid Interface Sci. 1976, 56, 83–91. [Google Scholar] [CrossRef]
  21. Yang, F.; Xie, C.; Xu, S.; Ning, Z.; Krooss, B.M. Supercritical methane sorption on organic-rich shales over a wide temperature range. Energy Fuels 2017, 31, 13427–13438. [Google Scholar] [CrossRef]
  22. Setzmann, U.; Wagner, W. A new equation of state and tables of thermodynamic properties for methane covering the range from the melting line to 625 K at pressures up to 100 MPa. J. Phys. Chem. Ref. Data 1991, 20, 1061–1155. [Google Scholar] [CrossRef]
  23. Langmuir, I. The adsorption of gases on plane surfaces of glass, mica and platinum. J. Am. Chem. Soc. 1918, 40, 1361–1403. [Google Scholar] [CrossRef]
  24. Li, J.; Chen, Z.; Wu, K.; Wang, K.; Luo, J.; Feng, D.; Qu, S.; Li, X. A multi-site model to determine supercritical methane adsorption in energetically heterogeneous shales. Chem. Eng. J. 2018, 349, 438–455. [Google Scholar] [CrossRef]
  25. Hu, Y.; Devegowda, D.; Striolo, A.; Phan, A.; Ho, T.A.; Civan, F.; Sigal, R.F. Microscopic dynamics of water and hydrocarbon in shale-kerogen pores of potentially mixed wettability. Spe J. 2014, 20, 112–124. [Google Scholar] [CrossRef]
  26. Hu, H.; Zhang, T.; Wiggins-Camacho, J.D.; Ellis, G.S.; Lewan, M.D.; Zhang, X. Experimental investigation of changes in methane adsorption of bitumen-free Woodford Shale with thermal maturation induced by hydrous pyrolysis. Mar. Pet. Geol. 2015, 59, 114–128. [Google Scholar] [CrossRef]
  27. Gasparik, M.; Bertier, P.; Gensterblum, Y.; Ghanizadeh, A.; Krooss, B.M.; Littke, R. Geological controls on the methane storage capacity in organic-rich shales. Int. J. Coal Geol. 2014, 123, 34–51. [Google Scholar] [CrossRef]
  28. Gasparik, M.; Ghanizadeh, A.; Bertier, P.; Gensterblum, Y.; Bouw, S.; Krooss, B.M. High-pressure methane sorption isotherms of black shales from the Netherlands. Energy Fuels 2012, 26, 4995–5004. [Google Scholar] [CrossRef]
  29. Huang, L.; Ning, Z.; Wang, Q.; Qi, R.; Zeng, Y.; Qin, H.; Ye, H.; Zhang, W. Molecular simulation of adsorption behaviors of methane, carbon dioxide and their mixtures on kerogen: Effect of kerogen maturity and moisture content. Fuel 2018, 211, 159–172. [Google Scholar] [CrossRef]
  30. Blanco AA, G.; Vallone, A.F.; Korili, S.A.; Gil, A.; Sapag, K. A comparative study of several microporous materials to store methane by adsorption. Microporous Mesoporous Mater. 2016, 224, 323–331. [Google Scholar] [CrossRef]
  31. Xiong, J.; Liu, X.; Liang, L.; Zeng, Q. Adsorption of methane in organic-rich shale nanopores: An experimental and molecular simulation study. Fuel 2017, 200, 299–315. [Google Scholar] [CrossRef]
Figure 1. Illustration of (a) absolute adsorption and (b) excess adsorption.
Energies 17 04990 g001
Figure 2. Fitting results of experimental data by single-site adsorption model.
Energies 17 04990 g002
Figure 3. A linear relationship between ln P L and   1 T for four shale samples.
Energies 17 04990 g003
Figure 4. Fitting results of experimental data with multi-site adsorption model.
Energies 17 04990 g004
Figure 5. Comparison of multi-site model’s energy distribution with the single-site model’s constant adsorption energy for each shale sample.
Energies 17 04990 g005
Figure 6. Comparison of single-site and multi-site models for the four samples.
Energies 17 04990 g006
Figure 7. Comparison of absolute adsorption and excess adsorption isotherms.
Energies 17 04990 g007
Table 1. Physical characteristics of shale samples.
SampleGrain Density (g/cm3)Bulk Density (g/cm3)Total Pore Volume (cm3/g)Total Porosity (%)
S-12.252.490.01413.5
S-22.302.210.01864.1
S-32.562.430.02105.1
S-42.742.490.03659.1
Table 2. Fitting parameters of single-site excess adsorption model by Equation (10).
SampleTemperature T (K) Maximum   Adsorption   n m a x (10−3 mol/g)Langmuir Pressure PL (MPa)Expansion Coefficient λ (k−1) Standard   Entropy   Δ S 0 (J/mol/K) Enthalpy   Δ H (KJ/mol)
S-1303.150.0501.450.0015−58.01−10.84
333.152.15
363.152.95
S-2303.150.0550.950.0018−62.21−13.17
333.151.55
363.152.25
S-3303.150.1102.050.0022−77.91−16.00
333.153.65
363.155.85
S-4303.150.1201.450.0020−89.33−20.27
333.153.25
363.155.45
Table 3. Fitting parameters of multi-site excess adsorption model.
Sample Maximum   Adsorption   n m a x (10−3 mol/g) Average   Entropy   Δ S m 0 (J/mol/K) Adsorption   Heat   ( mean )   Q m (kJ/mol)Standard Deviation σ (Dimensionless)Expansion Coefficient λ (K−1)
S-10.053−66−12.550.0015
S-20.060−76−1780.0018
S-30.108−90.5−2030.0022
S-40.124−98−2260.0020
Table 4. Comparison of single-site and multi-site models with measured data.
SampleTemperature (K)Percentage of Error (%)
Single-Site ModelMulti-Site Model
S-1303.153.121.45
333.155.221.02
363.154.062.56
S-2303.154.871.24
333.155.561.12
363.155.742.41
S-3303.152.211.32
333.153.222.14
363.154.683.41
S-4303.154.122.53
333.153.581.15
363.152.112.14
Disclaimer/Publisher’s Note: The statements, opinions and data contained in all publications are solely those of the individual author(s) and contributor(s) and not of MDPI and/or the editor(s). MDPI and/or the editor(s) disclaim responsibility for any injury to people or property resulting from any ideas, methods, instructions or products referred to in the content.