Abstract
As global energy demand continues to rise, integrating renewable energy sources (RES) into power systems has become increasingly important. However, the intermittent nature of RES, such as solar and wind, presents challenges for maintaining a stable energy supply. To address this issue, energy storage systems are essential. One promising technology is micro-compressed air energy storage (micro-CAES), which stores excess energy as compressed air and releases it when needed to balance supply and demand. This study investigates the integration of micro-CAES with RES in a 19-home microgrid in northern Portugal. The research aims to evaluate the effectiveness of a microgrid configuration that includes 100 kW of solar PV, 70 kW of wind power, and a 50 kWh micro-CAES system. Using real-world data on electricity consumption and local renewable potential, a simulation is conducted to assess the performance of this system. The findings reveal that this configuration can supply up to 68.8% of the annual energy demand, significantly reducing reliance on the external grid and enhancing the system’s resilience. These results highlight the potential of micro-CAES to improve the efficiency and sustainability of small-scale renewable energy systems, demonstrating its value as a key component in future energy solutions.
1. Introduction
Together with population growth and technological advancements, the demand for energy is rapidly rising. To achieve the most efficient and environmentally friendly energy system, increasing the share of renewable energy sources (RES) in the power grid is essential. RES are usually characterised by intermittent and weather-dependent energy generation [1]. Therefore, balancing energy supply and demand is a growing challenge for the energy sector [2]. The variability in the profile of the generation curve indicates the necessity of its integration with energy storage solutions (or other control strategies) to avoid energy waste during peak generation and to use it during periods of highest demand. The transition towards higher shares of RES worldwide underscores the pressing need for innovative storage solutions to address the mismatch between the daily demand for energy and production as its dependend on weather conditions [3]. Micro-compressed air energy storage (micro-CAES—up to 1 MW) [4] emerges as a promising technology solution to mitigate the intermittency of RES. By storing excess energy from RES, primarily during off-peak hours, and discharging it to meet peak demand, micro-CAES effectively leverages compressed air to balance energy supply and demand. North Portugal presents significant potential for the application of storage installations and the development of microgrids. The favourable climate and geographical conditions of the country make it an ideal location to harness renewable energy sources. By investing in these technologies, Portugal can improve its energy security, reduce dependence on fossil fuels, and contribute to global efforts to combat climate change. A key technology enabling the smooth operation of microgrids is compressed air energy storage system. CAES technology stores energy in the form of compressed air, which can later be converted back into electricity when needed. This technology is particularly advantageous for microgrids as it allows for efficient management of energy supply and demand, ensuring a stable and reliable power supply even when renewable energy sources are intermittent. The integration of RES, such as PV systems and wind power, with energy storage is a promising strategy for meeting the energy needs of small communities. PV systems convert sunlight directly into electricity, while wind turbines generate power from wind energy. When these renewable sources are abundant, excess energy can be stored using micro-CAES technology. During periods of low renewable energy production, the stored energy can be released to maintain a continuous power supply.The use of RES reduces greenhouse gas emissions and mitigates the environmental impact of energy production. Furthermore, microgrids with integrated storage and renewable sources can operate independently of the main grid, providing resilience against power outages and improving the reliability of the energy supply for local communities.
Although extensive research has explored microgrid optimisation [5,6,7] and the potential of compressed air energy storage (CAES) in broader energy systems [8], there is a notable gap in the literature regarding the analysis and integration of microscale-CAES within microgrids. Recent research [9] investigated the integration of microgrids with wind turbines, focussing on optimising electricity generation and improving grid stability during faults. The study developed a control method that incorporates battery storage to improve the response of the microgrid to load changes and overall stability. There are also studies focussing on energy savings in buildings and residential complexes. Two-layer energy management strategies have been proposed in [10] to optimise hydrogen flow to refueling stations and power allocation between electric and hydrogen systems. The effectiveness of the strategy was validated through real-time simulations. Energy management strategies using the battery energy storage system were described in [7]. Their case study, which used real data from the Greek electricity grid, aimed to minimise costs and determine the required energy storage capacity. Another study [6] focused on optimising microgrid operation by combining long-term hydrogen storage with short-term battery storage. Simulations aimed to enhance the overall performance of RES and the microgrid. Wu et al. [11] proposed an energy scheduling approach to optimise energy management and RES energy utilisation. The authors [2] developed an adaptive control methodology using a dynamic pricing strategy to enhance energy balancing in renewable energy smart microgrids. The proposed controller effectively responds to fluctuations in RES generation and load demand. The [12] investigates a CAES system designed to store energy when demand is low and release it when demand and prices are high. The programming method was developed to schedule the system’s operations based on probabilistic forward price estimates, with a case study in Turkey demonstrating the economic feasibility and profitability of this energy storage technology.
Currently, electrochemical methods, primarily Li-ion batteries, dominate electrical energy storage [13,14]. Although offering high efficiency and operational stability, these batteries have drawbacks such as short lifespans, self-discharge, capacity degradation, and environmental impact concerns [15,16,17]. Therefore, there is a growing interest in alternative energy storage technologies, particularly those with sustained discharge over 4–8 h. Compressed air energy storage (CAES) emerges as a promising candidate in this domain. The idea behind this technology involves compressing air (charging), storing it in a mechanical energy reservoir (tank, cavern), and then expanding it in an expander (discharging). Large-scale CAES projects have demonstrated efficiency and cost-effectiveness, as evidenced by large-scale commercial projects [18,19,20,21]. However, on a microscale, low round-trip efficiency remains a primary challenge [22,23] Numerous microscale projects have employed compressed air as an energy carrier [9,24,25]. However, the potential of reciprocating expanders and the influence of their control mechanisms on system efficiency and performance remain largely unexplored.
Due to the noticeable lack of competitiveness of battery energy storage systems (BESS) on a micro scale, the use of micro-CAES has appeared as an alternative solution. Energy storage technologies should prioritise the development of systems with capacities ranging from 10 kW to 1 MW, especially to address the needs of small renewable energy installations, emergency power systems for critical infrastructure, energy islands, and smart distributed networks (Smart Grids). A particular focus should be on medium-term storage solutions with durations of several hours to days. The introduction of dynamic electricity tariffs for consumers in the coming years also necessitates the development of long- and medium-term electrical energy storage technologies. The need not only for the use of sustainable energy solutions, but also for proper energy management has been driven by rising energy prices. As a result, households are increasingly prioritising conscious energy consumption and procurement [26].
This paper fills a critical knowledge gap by investigating the practical implementation of micro-scale CAES with distributed renewable energy sources, such as rooftop solar photovoltaic (PV) and wind turbines, within a real-world microgrid framework, utilising detailed data from a small community in northern Portugal. The innovation of this work also lies in addressing a topic that has not been previously explored in the scientific community. Leveraging data from various sources, including the E-Redes Open Data Platform [27] for hourly electricity consumption, and meteorological data for solar and wind potential estimation [28], this study conducts a comprehensive year-long assessment of the operation of the residential energy system.
The aim of this study is to design and simulate a microgrid system in northern Portugal, focusing on the role of a micro-CAES system in balancing energy supply and demand. This study seeks to address the research gap by investigating different configurations and system sizes to optimise microgrid performance, with a particular emphasis on the synergy between renewable technologies and energy storage solutions. The subsequent sections will elaborate on the design and simulation process. Section 2 will describe the methodology, including the use of the EnergyPLAN tool and the sensitivity analysis conducted. Section 3 will explore various microgrid configurations and present the results of the simulations, with a focus on determining the optimal system sizes for efficient microgrid operation.
2. Materials and Methods
2.1. Microgrid Topology
As a case study, the feasibility of implementing a distributed microgrid with solar PV and wind power integrated with micro-scale CAES for 19 houses in northern Portugal was analysed. Real data on electricity consumption from the E-Redes Open Data Platform [27] and data on solar PV and wind potential were estimated using Renewables Ninja [28]. EnergyPLAN 16.3 [29] software was used to conduct the simulations. EnergyPLAN enables hourly simulations, encompassing electricity generation, consumption, import, export, as well as micro-CAES charging/discharging processes. Methodology flow chart showing individual steps of the research process can be seen in Figure 1.
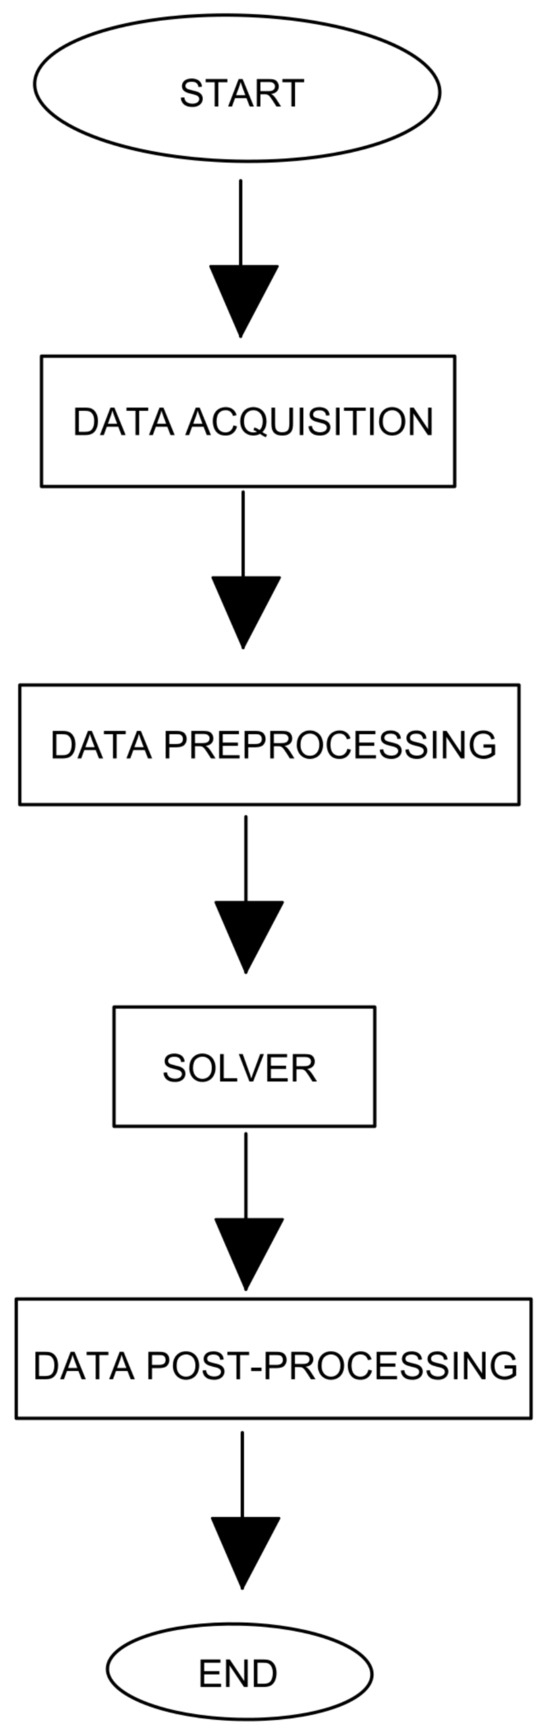
Figure 1.
Methodology flow chart.
The microgrid configuration integrated both PV systems and wind power as primary RES, with micro-CAES serving as the storage solution. To bridge potential energy deficits between renewable generation, energy storage and domestic demand, the system could utilise external power plants or the grid. When the microgrid needed to operate in island mode, this energy gap could be filled, for example, with diesel generators. Figure 2 shows the microgrid system topology. Table 1 provides input parameters of the microgrid.
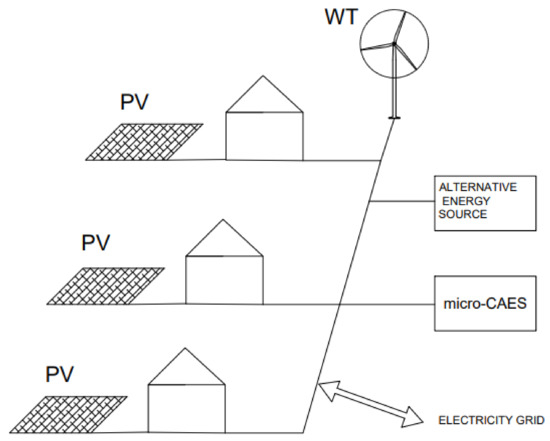
Figure 2.
Microgrid topology, illustrating the integration of photovoltaic (PV) panels, wind turbine (WT), micro-CAE) and the connection to the external grid.

Table 1.
Real data input parameters of the microgrid.
Depending on the capabilities and size of the usable area of the microgrid, there is flexibility in the design of renewable energy installations. Figure 2 shows photovoltaic installations as systems associated with each of the houses. This setup can also be configured as a single large installation. When everything is part of the same microgrid, transmission losses are negligible because energy is produced locally. As for wind turbines, these can also be configured as a single installation or several residential units. However, in our analysis, we considered a single turbine due to the better wind potential of a taller mast. To ensure that the various components of the microgrid work together efficiently, careful consideration must be given to component sizing and capacity, particularly in relation to weather-dependent renewable energy sources (RES), such as wind and solar PV. A 100 kWh micro-CAES system was selected for this study as it aligns with the typical capacity requirements of a microgrid serving a small, localised community. This storage capacity is considered appropriate for a small-scale energy system designed to balance intermittent renewable energy generation and meet the fluctuating energy demands of domestic consumers. The 100 kWh capacity will enable the microgrid to store excess energy generated from RES, during periods of low demand, and release it during peak demand time, enhancing grid stability, reducing reliance on external sources, and optimising the utilisation of locally generated renewable energy. Additionally, energy demand fluctuations, influenced by time of day, season, and load variations, must be taken into account. By accurately gauging both the supply potential and the demand requirements, the microgrid can be optimised for better performance and energy efficiency. Figure 3 and Figure 4 show the monthly and cumulative hourly electricity demand profile [27] and the RES production [28] for the case study analysed, respectively.
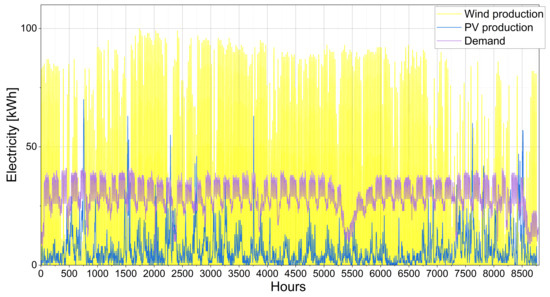
Figure 3.
Hourly electricity demand and RES production thought the year.
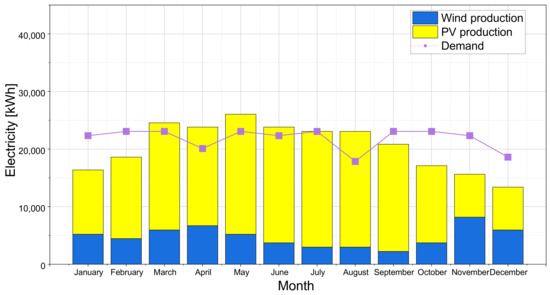
Figure 4.
Cumulative monthly electricity demand and RES production throughout the year [27,28].
Although the microgrid includes up to 19 homes, the average energy demand throughout the year is not high, 21.824 kWh/month. This is because all homes use gas heating and thus, during winter, do not consume additional electricity for heating or hot water. Additionally, some of the homes already have solar PV installations, which help meet part of their energy needs. To select the appropriate size of renewable energy installations, a sensitivity analysis was conducted to determine how the different capacities of solar PV and wind power would cover the electricity demand. The results of 14 configurations highlighted the importance of such analysis for accurately estimating the size of both solar PV and wind power systems, with capacities ranging from 40 to 170 kW. Figure 5 shows the percentage coverage of annual energy demand depending on the size of the renewable energy installations.
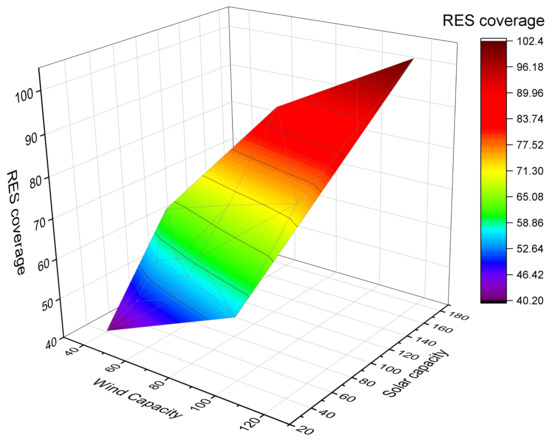
Figure 5.
RES demand coverage throughout the year depending on wind and solar power capacity.
The parameter range was selected as follows: the smallest possible sizes of renewable installations, i.e., 40 kW, corresponded to the maximum instantaneous demand of the microgrid for electricity. Their capacity was then gradually increased to achieve 100% demand coverage. This way, an optimal solution could be found, i.e., the real possible size of the installation, considering the size of the area occupied by the microgrid while ensuring maximum demand coverage. The size of the energy storage system and capacity of renewables installations directly impacted microgrid performance and limitations. For a combined 40 kW PV and wind installation, only 40.1% of the demand could be met. Full coverage of electrical energy demand was achieved only with a PV installation size of 170 kW and 120 kW of wind turbine capacity. For this configuration, the demand coverage amounted to 102.3%. The results also indicate that it was optimal to install a larger PV capacity, as it had a higher generation potential throughout the year. With a 100 kW PV and 100 kW wind installation, the coverage was 73.7%. Reducing the installation by 30 kW resulted in only a minor decrease in RES share of 4.9%.
Careful selection of these parameters is crucial to ensure reliable, sustainable energy supply and demand matching. Such careful planning helps achieve a balanced and resilient system that can maximise the use of renewable energy while meeting the energy demands of the connected infrastructure. Additionally, optimising these parameters can reduce dependency on external energy sources, minimise the carbon footprint of the microgrid, and lower its operational costs. This strategic approach is essential for the long-term viability and efficiency of renewable energy systems within microgrids.
2.2. Energy Storage System (Micro-CAES)
As we are considering a micro-CAES installation, the expansion turbine, which works quite well in large CAES systems (above 10 MW) [30,31], does not fit the concept due to mismatched operating conditions. Piston drives are the most suitable for CAES in micro- and small-scale applications due to their low costs and low operational speeds [30]. The piston expander in a micro-CAES system is resistant to varying mass flows, supply pressures, and changing linear speeds. Its ability to adapt not only to the required energy at any given moment, but also to the amount of air stored in the tank makes it an excellent fit for the microgrid concept. Additionally, the expander offers a quick response and start up time in which it does not consume electrical energy.
The proprietary micro-CAES technology comprises six stages: compression, pre-preparation, storage, post-preparation, expansion, and generation [32]. The topology of the micro-CAES topology is shown in Figure 6.
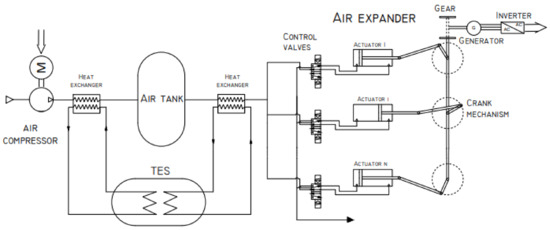
Figure 6.
Micro-CAES topology.
The compression stage consists of a compressor equipped with a heat exchanger to recover waste heat generated during the compression process. The obtained heat goes to thermal energy storage. Subsequently, the air goes to the pre-preparation section where it is further cooled, dried, and filtered, and then to a steel tank where it is stored. The discharge of energy storage consists of delivering air from the tank to the post-preparation section where the air is heated from the thermal energy storage using a heat exchanger and portioned according to an algorithm that takes into account the desired power and the state of charge of the compressed air tank [33]. Subsequently, the warm portions of air are delivered to the cylinder chambers where they are expanded. Their energy is converted into mechanical energy by slider–crank mechanism, which drives a shaft mounted on bearings. Mechanical energy is converted into electrical energy in the electrical generator. Additionally, the generation section consists of a linear coaxial planetary gear to increase rotational speed before the generator and a flywheel to smooth out fluctuations in rotational speed. The CAD visualisation of the mechanical construction of the multipiston air expander is shown in Figure 7 [34].
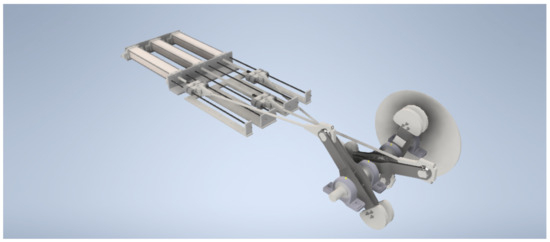
Figure 7.
Air expander construction—3D visualization.
For the case study, a compressed air energy storage installation was selected with a charging and discharging power of 50 kW, an energy capacity of 100 kWh in a tank volume of 75 m3, a storage pressure of 25 bar, and a working pressure of 5–25 bar and a roundtrip efficiency of 61%. Depending on the demand, the supply pressure in the micro-CAES system can be adjusted to achieve the desired output power. The parameters of the system used in the microgrid simulation are provided in Table 2.
Table 2.
Micro-CAES system parameters.
2.3. Energy Management Strategy
The authors of [35] defined the optimal strategies for CAES operation. In practice, depending on weather conditions and energy prices, energy storage is charged or discharged on the basis of the energy price data from the previous day. As a result, EnergyPlan seeks the optimal solution for each hour.To develop a comprehensive energy management strategy for the microgrid, one should start by implementing energy storage to reduce peak demand by storing energy during low-demand periods and releasing it during high-demand periods. Several operational modes are available. One mode involves no operation, which does not generate additional energy production and does not change the storage level. Another mode activates the compressor, resulting in the consumption of electricity and an increased storage level. Alternatively, the expander can be activated, generating electrical energy while decreasing the storage level. Additionally, simultaneous compressor and expander operation is possible, generating electricity without altering the storage level. This mode enables electricity sales when the surplus of renewable energy and the full storage capacity coincide. A key factor is to limit the export and import of energy outside the microgrid. Importing is disadvantageous because it adds to energy costs, especially during peak demand hours. On the other hand, export is undesirable due to the unprofitable prices for selling energy to the grid.
By carefully balancing the operation of these modes, the microgrid can enhance its overall efficiency and sustainability. The use of advanced control systems will enable more accurate optimisation and timing of energy storage and release. Exploring additional revenue streams, such as peak-time electricity sales, can enhance financial viability and resilience. These strategies collectively contribute to the development of more resilient, sustainable, and energy-independent microgrids in Portugal.
3. Results and Discussions
To evaluate the interaction between specific RES (PV or wind turbine) and a 50 kW/100 kWh micro-CAES system, analyses were conducted for three scenarios: Scenario 1—100 kW PV-only; Scenario 2—100 kW wind turbine-only; and Scenario 3—combined 70 kW PV and 100 kW wind turbine system. The first two scenarios were analysed to provide a detailed representation and investigation of the behaviour of renewable energy sources operating independently. Furthermore, this analysis aimed to determine the optimal size of the installations and identify the best combination of these RES generation technologies. Scenario 3 aimed to determine the synergistic effects of integrating both types of renewable energy sources with the micro-CAES system, thereby providing a comprehensive understanding of their combined performance and potential benefits. These analyses aimed to identify the most efficient and effective configuration to maximise renewable energy use and ensure reliable energy supply within the microgrid Figure 8 illustrates the cumulative montlhy energy distribution within the microgrid for the solar only scenario (Scenario 1).
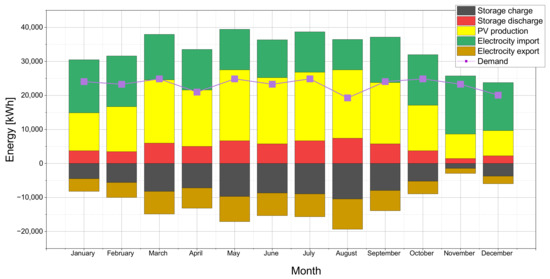
Figure 8.
Monthly energy balance for Scenario 1, showing energy storage, generation, grid interaction, and demand over a year.
When the solar PV capacity was 100 kW (Scenario 1), demand coverage reached 55.1%. Positive values represent on-site energy generation, while negative values indicate energy imports and storage charging. The demand profile is depicted as a connected line. During the seven months of high solar irradiation, average energy production from solar PV surpassed demand. However, in autumn and winter, there was a significant reduction in energy production due to lower solar generation, with the lowest production recorded in November at 7200 kWh. This leads to an increased need for importing electricity into the microgrid. The energy storage system complemented the PV system by consuming energy during the night and at night, contributing to 22.1% of the total demand with a utilisation of 57,936 kWh. Micro-CAES reduced electricity exports by 23,064 kWh. However, due to the storage system’s limited capacity, 40–50% of stored energy was returned to the grid.
Scenario 2, featuring a 100 kW wind turbine, achieved 30.5% of demand coverage. Figure 9 presents the cumulative monthly energy flow within this microgrid configuration.
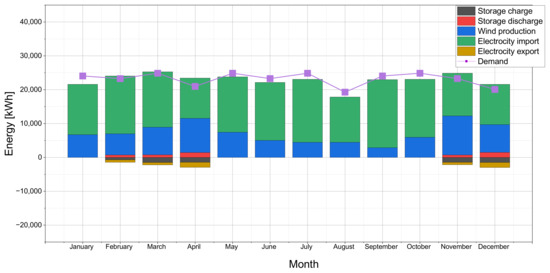
Figure 9.
Monthly energy balance for Scenario 2, showing energy storage, generation, grid interaction, and demand over a year.
Wind energy production, peaking at 11,520 kWh in November, was lower compared with solar PV. Grid electricity consumption averaged 70–75%, and reduced to 50% in April, November, and December. The limited installed capacity of wind power resulted in minimal energy export and storage utilisation. RES with micro-CAES covered 31.5% of demand with a storage utilisation of 5088 kWh throughout the year. While wind energy generation is lower, it could effectively complement solar installations, considering seasonal and geographical wind patterns.
Solar PV and wind power generation fluctuate monthly due to weather conditions. Based on individual RES performance results (Scenarios 1 and 2), a combined system of 100 kW solar PV and 70 kW wind power was selected. Therefore, to ensure the highest possible demand coverage while maintaining a realistically feasible size for RES installations, further analysis focused on a microgrid equipped with 100 kW of solar PV capacity and 70 kW of wind power (Scenario 3). Figure 10 shows cumulative monthly energy distribution in the microgrid.
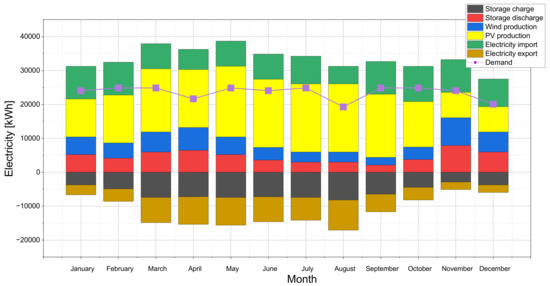
Figure 10.
Monthly energy balance for Scenario 3, showing energy storage, generation, grid interaction, and demand over a year.
The combined use of solar PV and wind power significantly increased renewable energy generation (Scenario 3). Demand exceeded the combined output of renewable energy and energy storage discharge in only three months. Due to the ability to store excess energy, the microgrid utilised most of the energy produced by RES, exporting only a small amount. The combination of the PV and wind turbine in the microgrid energy system resulted in a reduction in electricity importe from the grid and the coverage of the demand by RES was 68.8% during one year. The coverage of demand by micro-CAES was 21.5%, with storage discharge of 56,328 kWh through the year. Additionally, energy exports to the grid decreased by 40,176 kWh. Energy storage utilisation intensified during autumn and winter due to increased operational frequency and reduced RES availability. This integrated approach not only optimised the use of renewable energy sources, but also enhanced the overall efficiency and reliability of the microgrid. By storing surplus energy during periods of high generation, the system could offset lower production periods, particularly in autumn and winter when renewable energy availability diminished. The reduced exports to the grid reflect improved local energy consumption, which contributes to economic savings and reduced environmental impact. Figure 11 illustrates the hourly energy management of the microgrid for Scenario 3.
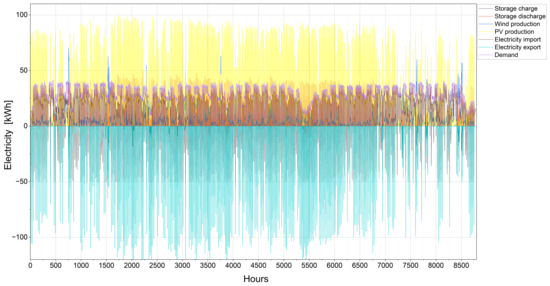
Figure 11.
Hourly energy balance for Scenario 3.
Despite the large RES installation in Scenario 3, hourly energy values were high, but the average hourly amount of generated energy, due to the intermittency of production, was 13 kWh through the year. This demonstrates the necessity of short-term energy storage, which allowed for flexible storage and the release of energy as needed. While the storage system improved the grid performance, the system’s capacity limitations necessitated continued grid imports. Compressor operation during peak generation periods filled the compressed air tank, limiting additional storage. Figure 12 shows the state of charge of the energy storage system throughout the year for Scenario 3.
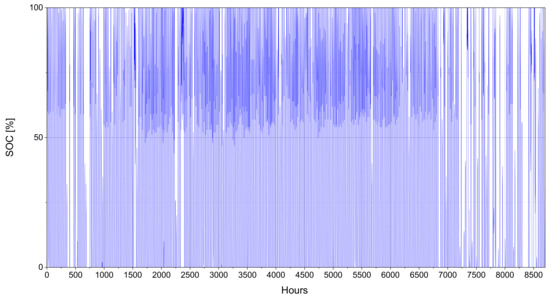
Figure 12.
Hourly SOC of micro-CAES for Scenario 3.
As shown in Figure 12, the storage system was often full during the year. This was due to high instantaneous generation from RES installations and low demand on certain days. This issue can be mitigated by increasing the size of the storage system or the storage pressure. However, both options entail higher installation costs. A larger storage system may also be unfeasible due to limited space in the microgrid. On the other hand, higher storage pressure in micro-CAES installations is associated with losses due to the need for pressure throttling and additional safety measures to prevent leaks.
To highlight the combined benefits of solar PV, wind power, and energy storage, 12 representative days for each month of year were analysed, focusing on energy management strategies. The results are shown in Figure 13.
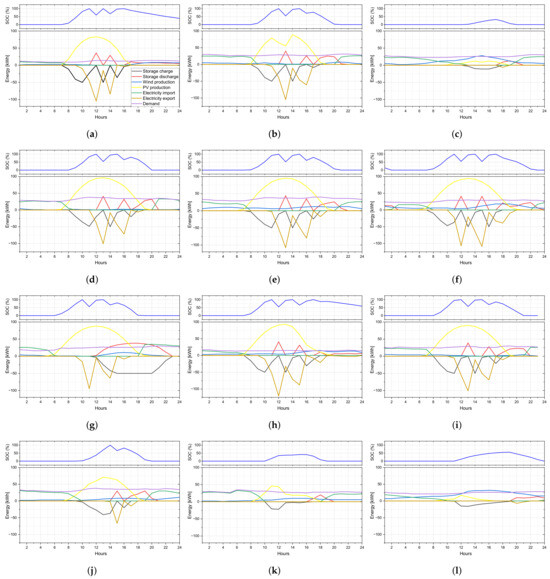
Figure 13.
Overview of daily energy balance in: (a) January; (b) February; (c) March; (d) April; (e) May; (f) June; (g) July; (h) August; (i) September; (j) October; (k) November; (l) December.
Figure 13a illustrates the energy management of a single day in January. The highest potential for energy generation during the day came from the PV installations, which peaked at 82 kW at around noon for a typical day of January. Despite lower overall generation in January compared with summer, peak solar irradiation on certain days led to significant PV output. Figure 13a also depicts the charging and discharging of energy storage, as well as the export and import of energy from the grid. During periods of maximum PV generation, there was both storage charging and energy export due to the excess production relative to the microgrid demand and the filling of the compressed air storage system. Wind turbine generation primarily occurred during early morning and evening hours, complementing the PV system’s reduced output during these periods. The State of Charge (SOC) graph shows that the energy storage reached its maximum capacity of 100% three times throughout the day.
Figure 13b demonstrates energy management during a single day in February. The hourly production from the PV system significantly rises during the day, following a similar pattern to January, reaching a maximum of 89 kW at 14:00 p.m. Wind energy generated only 7 kW at peak during the evening hours.
Figure 13c illustrates the energy management of a typical day in March. During this month, the energy production from the PV installations was significantly lower compared with other months due to reduced sunlight. However, the wind energy potential was higher, reaching its peak of 26 kW at 3 pm. The diminished PV generation led to increased reliance on energy storage, which discharged throughout the day. The SOC of the storage system only reached a maximum of 32%, indicating a low storage capacity utilisation. To meet the electricity demand, grid imports were necessary, peaking at 25 kW during evening hours. This compensated for the shortfall in renewable energy generation, emphasizing the impact of seasonal renewable variability and the need for grid support during periods of reduced production.
During a typical day in April, photovoltaic panel generation also dominated. The results are shown in Figure 13d. Export and storage charging occurred only during periods of maximum sunlight, as the wind turbines did not generate enough energy after dark.
Figure 13e demonstrates the energy management on a typical day in May, characterised by increasing levels of sunlight. The hourly production of renewable energy, particularly from the PV system, significantly rose during the day. At 13:00 p.m., the PV system generated up to 95 kW, which was substantial enough to necessitate the export of excess energy to the grid. Wind energy, while present, contributed minimally with a maximum peak of 12 kW. The compressed air storage system was heavily utilised, reaching its full capacity twice during the day, indicating effective energy storage and release cycles to balance supply and demand. This high renewable energy production in May showcased the potential for significant energy export and the importance of storage systems to manage the energy surplus.
Figure 13f presents energy management during a day in June. Due to high energy generation from photovoltaic panels and increased production from wind turbines, which peaked at 96 kW and 18 kW, respectively, export reached up to 107 kW at the peak. Additionally, the surplus energy wa used to charge the storage, which reached maximum capacity three times during the day.
Figure 13g highlights the energy management on a typical day in July, where PV generation once again dominated over wind energy. The intense summer sunlight resulted in a significant increase in energy generation from the PV system. This surplus energy was effectively managed by charging the storage system and exporting excess to the grid. The efficient utilisation of the energy storage system ensured that the excess energy generated during peak production times was stored for later use, reducing the need for grid imports and enhancing energy independence. Figure 13g also demonstrates the crucial role of energy storage in managing the high variability in PV output, especially during peak sunlight hours.
Similar to other summer months, August experienced high solar energy generation. As shown in Figure 13h, the storage was fully charged three times throughout the day, and a significant amount of energy was exported. The highest PV generation occurred at 13:00 p.m., amounting to 93 kW, while the wind turbines generated a maximum of 14 kW at 18:00 p.m.
Figure 13i depicts the energy management on a typical day in September. During this month, Portugal experienced high levels of solar irradiation, resulting in substantial energy generation from the PV system. Figure 13i shows the intermittent nature of renewable energy generation throughout the day, with periods of high production followed by lower outputs. This intermittency underscores the importance of having robust energy storage systems to balance supply and demand. The storage system reached its maximum charge level twice during the day, demonstrating its effectiveness in capturing and storing excess energy generated during peak production periods. This stored energy was then available for use during periods of lower generation.
Figure 13j illustrates energy management over 24 h in October. With the changing season and reduced sunlight, the maximum PV generation reached 71 kW at 13:00 p.m. The reduced generation led to more frequent discharging of the compressed air storage, which reached 100% SOC only, once during the day. Wind turbines contributed only slightly to meeting electricity demand, producing a maximum of 11 kW at midnight.
Finally, Figure 13k represents a typical day in November. During this month, there was a significant reduction in the potential for energy generation from the PV system due to the shorter daylight hours and lower sunlight intensity. The reduced PV generation necessitated grid electricity imports to meet demand. The energy storage system was utilised but only reached a maximum charge of 43% during the day, indicating limited renewable energy availability for storage. Figure 13k highlights the challenges of maintaining energy independence during months with lower renewable energy generation and emphasises the reliance on grid imports to ensure a continuous energy supply. The reduced PV output in November showcases the seasonal dependency of renewable energy systems and the critical role of energy storage and grid support in maintaining grid stability.
December was characterised by very low sunlight, but the wind energy potential was high. The results for a typical day in December are presented in Figure 13l. Wind turbines generated a peak of 32 kW at 16:00 p.m., while PV panels generated only up to 14 kW at noon. As a result of this low generation, storage only reached a maximum of 56% charge, and energy export was minimal.
Figure 13 collectively illustrates the complex energy management dynamics of a microgrid across different days during one year, showcasing the interplay between PV systems, wind turbines, energy storage, and grid interactions. Throughout the year, PV systems played a significant role in energy generation, particularly during peak sunlight hours, with notable peaks in May and July when solar output was highest. Wind energy supplemented this production, particularly in months with lower solar generation, such as March. Energy storage systems are crucial for balancing supply and demand, as they charge during periods of excess production and discharge when generation is low. This was especially evident in winter months like January and November, where the storage systems helped manage reduced solar output and higher grid imports were necessary. The data emphasise the importance of robust storage solutions and grid integration to handle the variability and intermittency of renewable energy sources, ensuring a stable and reliable energy supply throughout the year. The seasonal variations in energy generation highlight the challenges and strategies involved in maintaining energy independence and efficiency in a renewable energy-powered microgrid.
4. Conclusions
This study comprehensively assessed the performance of a small community microgrid integrating photovoltaic (PV), wind power, and micro-CAES as the storage system, and generated valuable insights for future energy planning and infrastructure development by enabling exploration of diverse system configurations. As the aproach of integration of micro-CAES with microgrid is somehow ommited in the literature, the paper presents innovative microgrid system and proposes its configuration This approach not only highlights the potential of CAES technology in enhancing the reliability and efficiency of renewable energy systems, but also provides insights into the practical implementation of such systems in real-world scenarios. In summary, the development and deployment of microgrids in Portugal, supported by micro-CAES technology and the integration of PV systems and wind power, offer a robust solution for sustainable energy management. This approach can effectively meet a substantial portion of the energy demand for small communities, promoting energy independence, environmental sustainability, and resilience. The adoption of CAES technology plays a crucial role in ensuring the smooth operation of the microgrid. The implementation of micro-CAES not only increased the coverage of energy demand, but also reduced the importation of electricity by 22,320 kWh and the exportation by 40,176 kWh in the entire year. Reduced electricity imports enhance the microgrid’s energy independence and resilience. By minimising excess energy exports, locally generated renewable energy is optimised, contributing to cost savings and a more sustainable energy system. In summary, by combining 100 kW of solar PV with 70 kW of wind power, it is possible to cover up to 68.8% of the energy demand anual average, significantly reducing reliance on external power sources. The highest RES production of 26,040 kWh/month was observed in May. The analysed microgrid, incorporating energy storage, reduced both electricity imports and exports, leading to lower energy costs. This integrated approach not only enhanced energy system sustainability, but also accelerated the transition to a low-carbon economy. The findings indicate a complementary relationship between PV and wind power generation. Notably, in November, when solar generation reached a minimum of 7440 kWh, wind turbines achieved a maximum output of 8184 kWh. While this study focused on technical performance, economic factors including RES and storage installation costs were not considered. Future research should incorporate dynamic electricity pricing for energy management strategies, aiming to optimise costs and quantify financial benefits for the microgrid community. Achieving a balance between power supply and demand is influenced by a wide range of factors. In this study, we focussed exclusively on balancing power, without taking into account the optimisation of other parameters such as voltage, frequency, or total harmonic distortion (THD). Balancing these parameters in electrical grids is typically achieved through power electronics systems. Furthermore energy-saving technologies which impact both energy demand and consumption should be considered in the further research. Improved insulation of building partitions and more efficient household appliances contribute to economic savings. The next step for consideration and to be explored in a subsequent article should include the potential for optimising these additional factors.
Author Contributions
Conceptualisation, J.L., J.M., P.F.V.F., G.G.D. and D.G.; methodology, J.L., D.G., P.F.V.F. and G.G.D.; formal analysis, D.G., G.G.D. and J.M.; resources, J.M.; writing—original draft preparation, J.M., D.G. and G.G.D.; writing—review and editing, J.L., G.G.D. and D.G.; visualisation, J.M. and D.G. All authors have read and agreed to the published version of the manuscript.
Funding
The work was carried out as part of a research subvention under contract no. 16.16.210.476, which was supported by the Polish Ministry of Science and Higher Education. The research project was supported by the program “Excellence Initiative—Research University” for the AGH University of Krakow as “University grant system for research projects carried out with the participation of doctoral students” (6236), “Funding international internships for young employees and doctoral students” (9612), University mini-grant system for research projects carried out by AGH doctoral students (10486) and University mini-grants system for research projects carried out by a young scientist (10494). This research was funded in part by National Science Centre, Poland (NCN), grant number: DEC-2024/08/X/ST8/00046.
Data Availability Statement
The original contributions presented in the study are included in the article, further inquiries can be directed to the corresponding author.
Conflicts of Interest
The authors declare no conflicts of interest.
Abbreviations
The following abbreviations are used in this manuscript:
| micro-CAES | micro scale compressed air energy storage |
| PV | Photovoltaic panels |
| RES | Renewable energy source |
| SOC | State of charge |
| TES | Thermal energy storage |
| THD | Total harmonic distortion |
| WT | Wind turbine |
References
- Saadat, M.; Shirazi, F.A.; Li, P.Y. Modeling and control of an open accumulator Compressed Air Energy Storage (CAES) system for wind turbines. Appl. Energy 2015, 137, 603–616. [Google Scholar] [CrossRef]
- Alghamdi, H.; Khan, T.A.; Hua, L.G.; Hafeez, G.; Khan, I.; Ullah, S.; Khan, F.A. A novel intelligent optimal control methodology for energy balancing of microgrids with renewable energy and storage batteries. J. Energy Storage 2024, 90, 111657. [Google Scholar] [CrossRef]
- Deng, H.; Wang, J.; Shao, Y.; Zhou, Y.; Cao, Y.; Zhang, X.; Li, W. Optimization of configurations and scheduling of shared hybrid electric-hydrogen energy storages supporting to multi-microgrid system. J. Energy Storage 2023, 74, 109420. [Google Scholar] [CrossRef]
- Courtois, N.; Najafiyazdi, M.; Lotfalian, R.; Boudreault, R.; Picard, M. Analytical expression for the evaluation of multi-stage adiabatic-compressed air energy storage (A-CAES) systems cycle efficiency. Appl. Energy 2021, 288, 116592. [Google Scholar] [CrossRef]
- Wang, Y.; Wang, Z.; Sheng, H. Optimizing wind turbine integration in microgrids through enhanced multi-control of energy storage and micro-resources for enhanced stability. J. Clean. Prod. 2024, 444, 140965. [Google Scholar] [CrossRef]
- Qiu, Y.; Li, Q.; Ai, Y.; Wang, T.; Chen, W.; Bai, H.; Benbouzid, M.; Liu, S.; Gao, F. Optimal scheduling for microgrids considering long-term and short-term energy storage. J. Energy Storage 2024, 93, 112137. [Google Scholar] [CrossRef]
- Álvarez Arroyo, C.; Vergine, S.; de la Nieta, A.S.; Alvarado-Barrios, L.; D’Amico, G. Optimising microgrid energy management: Leveraging flexible storage systems and full integration of renewable energy sources. Renew. Energy 2024, 229, 120701. [Google Scholar] [CrossRef]
- Lund, H.; Salgi, G. The role of compressed air energy storage (CAES) in future sustainable energy systems. Energy Convers. Manag. 2009, 50, 1172–1179. [Google Scholar] [CrossRef]
- Wang, S.; Zhang, X.; Yang, L.; Zhou, Y.; Wang, J. Experimental study of compressed air energy storage system with thermal energy storage. Energy 2016, 103, 182–191. [Google Scholar] [CrossRef]
- Tang, Y.; Xun, Q.; Liserre, M.; Yang, H. Energy management of electric-hydrogen hybrid energy storage systems in photovoltaic microgrids. Int. J. Hydrogen Energy 2024, 80, 1–10. [Google Scholar] [CrossRef]
- Wu, N.; Xu, J.; Linghu, J.; Huang, J. Real-time optimal control and dispatching strategy of multi-microgrid energy based on storage collaborative. Int. J. Electr. Power Energy Syst. 2024, 160, 110063. [Google Scholar] [CrossRef]
- Yucekaya, A. The operational economics of compressed air energy storage systems under uncertainty. Renew. Sustain. Energy Rev. 2013, 22, 298–305. [Google Scholar] [CrossRef]
- Luo, X.; Wang, J.; Dooner, M.; Clarke, J. Overview of current development in electrical energy storage technologies and the application potential in power system operation. Appl. Energy 2015, 137, 511–536. [Google Scholar] [CrossRef]
- Mitali, J.; Dhinakaran, S.; Mohamad, A. Energy storage systems: A review. Energy Storage Sav. 2022, 1, 166–216. [Google Scholar] [CrossRef]
- Ebrahimi, M.; Carriveau, R.; Ting, D.S.; McGillis, A. Conventional and advanced exergy analysis of a grid connected underwater compressed air energy storage facility. Appl. Energy 2019, 242, 1198–1208. [Google Scholar] [CrossRef]
- Olabi, A.G.; Wilberforce, T.; Ramadan, M.; Abdelkareem, M.A.; Alami, A.H. Compressed air energy storage systems: Components and operating parameters—A review. J. Energy Storage 2020, 34, 102000. [Google Scholar] [CrossRef]
- Zhang, J.; Zadeh, A.H.; Kim, S. Geomechanical and energy analysis on the small- and medium-scale CAES in salt domes. Energy 2021, 221, 119861. [Google Scholar] [CrossRef]
- Willow Rock Energy Storage Center—Hydrostor. Available online: https://hydrostor.ca/projects/willow-rock-energy-storage-center/ (accessed on 10 June 2024).
- Silver City Energy Storage. Available online: https://infrastructurepipeline.org/project/silver-city-energy-storage (accessed on 10 June 2024).
- RICAS2020 Design Study. Available online: https://www.ricas2020.eu/ (accessed on 10 June 2024).
- Goderich A-CAES Facility—Hydrostor. Available online: https://scovan.ca/hydrostor-goderich-a-caes-facility/ (accessed on 10 June 2024).
- Chen, L.; Zheng, T.; Mei, S.; Xue, X.; Liu, B.; Lu, Q. Review and prospect of compressed air energy storage system. J. Mod. Power Syst. Clean Energy 2016, 4, 529–541. [Google Scholar] [CrossRef]
- Budt, M.; Wolf, D.; Span, R.; Yan, J. A review on compressed air energy storage: Basic principles, past milestones and recent developments. Appl. Energy 2016, 170, 250–268. [Google Scholar] [CrossRef]
- Mahmoud, M.; Ramadan, M.; Olabi, A.G.; Pullen, K.; Naher, S. A review of mechanical energy storage systems combined with wind and solar applications. Energy Convers. Manag. 2020, 210, 112670. [Google Scholar] [CrossRef]
- Mei, S.W.; Wang, J.J.; Tian, F.; Chen, L.J.; Xue, X.D.; Lu, Q.; Zhou, Y.; Zhou, X.X. Design and engineering implementation of non-supplementary fired compressed air energy storage system: TICC-500. Sci. China Technol. Sci. 2015, 58, 600–611. [Google Scholar] [CrossRef]
- Stute, J.; Pelka, S.; Kühnbach, M.; Klobasa, M. Assessing the conditions for economic viability of dynamic electricity retail tariffs for households. Adv. Appl. Energy 2024, 14, 100174. [Google Scholar] [CrossRef]
- Hourly Consumption by Postal Code—4 Digits—E-REDES. Available online: https://e-redes.opendatasoft.com/explore/dataset/consumos_horario_codigo_postal/analyze/?dataChart=eyJxdWVyaWVzIjpbeyJjaGFydHMiOlt7InR5cGUiOiJsaW5lIiwiZnVuYyI6IlNVTSIsInlBeGlzIjoiY29uc3VtbyIsInNjaWVudGlmaWNEaXNwbGF5Ijp0cnVlLCJjb2xvciI6IiNGRkRDMDAifV0sInhBeGlzIjoiZGF0YWhvcmEiLCJtYXhwb2ludHMiOm51bGwsInRpbWVzY2FsZSI6ImhvdXIiLCJzb3J0IjoiIiwiY29uZmlnIjp7ImRhdGFzZXQiOiJjb25zdW1vc19ob3JhcmlvX2NvZGlnb19wb3N0YWwiLCJvcHRpb25zIjp7fX19XSwiZGlzcGxheUxlZ2VuZCI6dHJ1ZSwiYWxpZ25Nb250aCI6dHJ1ZSwidGltZXNjYWxlIjoiIn0%3D (accessed on 8 May 2024).
- Renewables.ninja. Available online: https://www.renewables.ninja/ (accessed on 8 May 2024).
- Lund, H.; Thellufsen, J.Z.; Østergaard, P.A.; Sorknæs, P.; Skov, I.R.; Mathiesen, B.V. EnergyPLAN—Advanced analysis of smart energy systems. Smart Energy 2021, 1, 100007. [Google Scholar] [CrossRef]
- He, W.; Wang, J. Optimal selection of air expansion machine in Compressed Air Energy Storage: A review. Renew. Sustain. Energy Rev. 2018, 87, 77–95. [Google Scholar] [CrossRef]
- Balje, O.E. A Study on Design Criteria and Matching of Turbomachines: Part A—Similarity Relations and Design Criteria of Turbines. J. Eng. Power 1962, 84, 83–102. [Google Scholar] [CrossRef]
- Leszczyński, J.S.; Gryboś, D.; Markowski, J. Analysis of optimal expansion dynamics in a reciprocating drive for a micro-CAES production system. Appl. Energy 2023, 350, 121742. [Google Scholar] [CrossRef]
- Gryboś, D.; Kubala, P.; Markowski, J.; Leszczyński, J. Control strategy of stable discharge of mechanical energy storage through piston expander in micro compressed air energy storage. In Proceedings of the 6th International Conference on Energy & Environment: Bringing together Engineering and Economics, Guimarães, Portugal, 6–7 June 2024; pp. 343–344. [Google Scholar]
- Leszczyński, J.; Markowski, J.; Gryboś, D. Integrated design strategies for high performance microcaes. In Proceedings of the 6th International Conference on Energy & Environment: Bringing Together Engineering and Economics, Guimarães, Portugal, 6–7 June 2024; pp. 400–405. [Google Scholar]
- Lund, H.; Salgi, G.; Elmegaard, B.; Andersen, A.N. Optimal operation strategies of compressed air energy storage (CAES) on electricity spot markets with fluctuating prices. Appl. Therm. Eng. 2009, 29, 799–806. [Google Scholar] [CrossRef]
Disclaimer/Publisher’s Note: The statements, opinions and data contained in all publications are solely those of the individual author(s) and contributor(s) and not of MDPI and/or the editor(s). MDPI and/or the editor(s) disclaim responsibility for any injury to people or property resulting from any ideas, methods, instructions or products referred to in the content. |
© 2024 by the authors. Licensee MDPI, Basel, Switzerland. This article is an open access article distributed under the terms and conditions of the Creative Commons Attribution (CC BY) license (https://creativecommons.org/licenses/by/4.0/).