Highlights
What are the main findings?
- The BlueLA electric vehicle (EV) carsharing service led to a net reduction of 34% in vehicle miles traveled (VMT) and 48% in greenhouse gas (GHG) emissions between 2021 and 2022.
- BlueLA Community (low-income qualified) members, representing underserved populations, achieved 59% more GHG emission savings compared to Standard (general population) members.
What is the implication of the main finding?
- EV carsharing can bridge mobility access gaps, especially for underserved communities, promoting both environmental sustainability and social equity by offering vehicle access for carless households.
- The electrification of carsharing fleets can significantly increase the environmental benefits of carsharing while accelerating the transition to zero-emission vehicles.
Abstract
This study aims to evaluate the potential of electric vehicle (EV) carsharing services to address social and environmental disparities in urban transportation through an evaluation of BlueLA, a one-way station-based carsharing service in Los Angeles, California. BlueLA provides a clean and affordable mobility option in underserved communities that face significant air quality burdens and have historically been excluded from environmental benefits. By incorporating BlueLA trip activity data from January 2021 to December 2022 (n = 59,112 trips) and an online user survey implemented in early December 2022 (n = 215 responses), we estimate the impacts of BlueLA on personal vehicle ownership patterns, vehicle miles traveled (VMT), and associated greenhouse gas (GHG) emissions. The results show an overall net reduction in VMT and GHG emissions of 463,845 miles and 656 metric tons, respectively, among the BlueLA user population (3074 registered users). When disaggregating impacts by BlueLA member type, our findings show a net reduction of 234 and 371 metric tons in GHG emissions for Standard (general population) and Community (low-income qualified) members, respectively. Additionally, our socio-demographic analysis highlights clear disparities between these two member groups, with Community members typically having lower incomes (i.e., 74% earning below USD 50,000 annually); lower educational attainment (i.e., 46% with at most an associate’s degree); and larger households (i.e., 23% living in households of four or more) compared to Standard members (i.e., 19% earning below USD 50,000, 24% with at most an associate’s degree, and 9% in households of four or more). Moreover, when comparing the VMT and associated GHG emissions due to BlueLA, we find that the presence of BlueLA reduces VMT and GHG emissions by 34% and 48% respectively, and each BlueLA vehicle replaces 16 personally owned vehicles (shed and postponed purchases). Last, when comparing the emissions produced by the electric fleet of BlueLA to those of a comparable fleet of internal combustion engine vehicles, we find that the use of an EV fleet reduces GHG emissions by 43% in comparison. The BlueLA carsharing service has led to notable net reductions in VMT and thus GHG emissions, with a major share of these reductions observed among Community members.
1. Introduction
Over the past couple of decades, shared mobility services gained significant popularity within a transportation system traditionally developed around personal vehicle ownership. One form is carsharing, which provides the user with short-term access to a vehicle at certain rates without the traditional costs and responsibilities that accompany vehicle ownership. Carsharing can provide a flexible and convenient alternative transportation mode to its users while supporting environmental and economic goals such as sustainability and cost reduction. Business-to-consumer carsharing services can be roundtrip or one-way in their operational model [1]. Another rising trend within transportation systems is electrification, accompanied by technological advances in electric batteries and charging infrastructure. Electric vehicle (EV) technology can support environmental sustainability by reducing greenhouse gas (GHG) emissions and tailpipe emissions, and save energy costs, depending on the electrical grid mix. However, this is not a new development, as EVs were a major part of station car programs and carsharing fleets in the 1990s [2]. The benefits of EVs along with the potential of carsharing to increase user mobility and accessibility can be combined to produce a more equitable and environmentally sustainable transportation system. Several carsharing models exist, but the most common are: (1) roundtrip carsharing, where the user must pick up and return the vehicle to the same location (e.g., Zipcar (Boston, MA, USA)), and (2) one-way carsharing, where the user can pick up and return the vehicle within multiple locations. One-way carsharing can be either free floating (e.g., GIG Carshare (Oakland, CA, USA)), where vehicles can be picked up and returned anywhere within the service area, or station-based (e.g., BlueLA (Los Angeles, CA, USA)), where vehicles can be picked up and returned at designated stations only. This study focuses on BlueLA powered by Blink Mobility, a one-way station-based electric carsharing service operating in Los Angeles, with the goal of providing a clean mobility option for residents in underserved communities.
The BlueLA service began in 2018 when the City of Los Angeles was awarded a grant from the California Air Resources Board (CARB) (Sacramento, CA, USA) to pilot EV carsharing in low-income communities of Los Angeles. The inception of BlueLA was driven by a vision to support city and state goals related to transportation, climate change mitigation, and improving access for underserved communities. This innovative service is an integral component of the broader California Climate Investments strategy—an initiative that channels substantial Cap-and-Trade funding toward projects aimed at reducing GHG emissions, strengthening the economy, and providing a healthier, more sustainable environment, particularly in underserved communities. Specifically, BlueLA seeks to address two intertwined challenges facing contemporary urban environments: social equity and environmental justice. Social equity refers to the fair distribution of resources, opportunities, and burdens among all members of a society, while environmental justice specifically focuses on the equal distribution of environmental benefits and burdens among different groups of the population. A pivotal concern in both cases is the pattern of disparity, wherein marginalized communities often bear the impact of environmental burdens and have historically been excluded from environmental benefits [3]. In the transportation context, social equity and environmental justice issues manifest in various ways. These include differential access to clean, affordable, and reliable transportation options, and disproportionate exposure to transportation-related pollution. The BlueLA carsharing service directly aims to address these issues by providing a clean mobility option that is accessible to residents in underserved communities, thereby linking environmental sustainability with social equity/environmental justice.
BlueLA mainly operates within the neighborhoods of Westlake, Koreatown, Pico-Union, Downtown, and Echo Park. The region served by BlueLA faces significant socio-environmental vulnerability, with almost the entire service area ranking among the 25th percentile or higher using CalEnviroScreen. Specifically, 29% of census tracts within the service area fall within the top 95th percentile of CalEnviroScreen scores, and half rank between the 85th and 95th percentiles [4]. This underscores the pressing need for mobility strategies like BlueLA that combine environmental and social benefits. At present, BlueLA deploys 60 Chevrolet Bolt EVs that can be picked up and returned at 40 charging stations, promoting a shift from fossil fuel-dependent personal vehicles to shared EVs. This shift holds the potential to reduce GHG emissions and improve air quality in areas that often bear a disproportionate burden of environmental harms. In terms of social equity, BlueLA’s pricing structure facilitates access to clean transportation for lower-income residents. While the standard membership rate is USD 5 per month with a usage fee of USD 0.20 per minute, the membership rate for income-qualified residents, or “Community” members, is significantly reduced to USD 1 per month with a usage fee of USD 0.15 per minute. Additional discounted rental packages are available, with greater discount rates offered to Community members. The emphasis on affordability for Community members is a critical aspect of BlueLA’s approach. It seeks to demonstrate how carsharing programs could expand access to clean transportation, thereby bridging the “green divide”.
Through this study, we aim to contribute to the understanding of the potential of EV carsharing services to address social and environmental disparities in urban transportation. With a fleet consisting entirely of EVs and operations located in Los Angeles, the BlueLA carsharing service is uniquely positioned to offer increased transportation access and improved environmental outcomes in an urban setting. To provide a comprehensive environmental assessment of BlueLA and its impact within underserved communities (Community members) and the broader population (Standard members), our study primarily focuses on its impact on vehicle ownership patterns, vehicle miles traveled (VMT), and associated GHG emissions. The data used for this analysis include BlueLA trip activity data in addition to survey responses collected from an online survey disseminated among BlueLA members, probing the impact of BlueLA on travel behavior and vehicle ownership. In enhancing this analysis, our research diverges from traditional methods that rely on VMT and vehicle fuel economy standards. Instead, we directly estimate the emissions produced during BlueLA’s EV charging times, using trip activity data to identify specific vehicle charging events. This innovative approach yields a more precise understanding of BlueLA’s environmental footprint and establishes a framework that can be applied in evaluating other EV carsharing programs.
This paper is organized into four main sections: (1) a literature review that provides context and background, (2) a detailed description of the methods employed, (3) a presentation and interpretation of our results, and (4) a conclusion summarizing our key findings.
2. Literature Review
Carsharing has demonstrated its ability to reduce personal vehicle ownership, VMT, and associated GHG emissions [5,6,7]. Moreover, the integration of EVs into carsharing programs has been evolving as a strategy to further reduce GHG emissions and improve air quality while accelerating the transition to electrification in transportation. However, the distribution of these benefits and their potential to contribute to environmental justice is a subject of ongoing debate. Several studies have been conducted to assess these potential impacts of carsharing, and their findings are summarized below.
2.1. Impact of Carsharing on Vehicle Ownership in North America
Multiple studies have analyzed the impact of carsharing on personal vehicle ownership, and their findings show that access to carsharing enables some users to shed a personal vehicle or avoid acquiring one. Martin and Shaheen evaluated car2go, a one-way carsharing system, and reported that between 2% and 5% of car2go members across five North American cities sold a vehicle due to car2go, while another 7% to 10% of the population did not acquire a vehicle due to car2go [5]. Similarly, Martin et al. conducted a survey of North American carsharing members (n = 6281) to evaluate carsharing’s effects on household vehicle holding. They reported that the average number of vehicles per household dropped from 0.47 to 0.24, with the majority of this shift constituting one-car households becoming carless [8].
Two studies of City Carshare in San Francisco found that two and four years into its operation, 30% and 29% of members, respectively, had gotten rid of one or more cars [9,10]. Similarly, a study of PhillyCarShare in Philadelphia, Pennsylvania found that each PhillyCarShare vehicle replaced an average of 23 private vehicles, corresponding to 10.8 vehicles removed by members who got rid of a car in addition to 12 vehicles removed by members who decided not to acquire a vehicle [11]. In another study evaluating a roundtrip carsharing pilot program in New York City, Martin et al. found that 7% of carsharing members avoided a car purchase, and 0.61% of members got rid of a car they already owned due to carsharing [6]. Furthermore, Shaheen et al. conducted a survey (n = 1151) to understand the impact of peer-to-peer (P2P) carsharing, and found that 19% of respondents avoided a personal vehicle purchase due to P2P vehicle access in urban areas [12,13]. Additionally, Katzev studied early adopters of Car Sharing Portland (CSP), and found that 26% sold their personal vehicles and 53% were able to avoid an intended purchase after joining CSP [14].
2.2. Impact of Carsharing on VMT and GHG Emissions in North America
Apart from personal vehicle ownership, the impact of carsharing on VMT and GHG emissions has been a significant focus of several studies. In the study of car2go across five North American cities, Martin and Shaheen estimated a total of between 20 million to 37.5 million miles eliminated or not driven due to car2go, and a reduction in GHG emissions ranging between 5300 and 10,000 metric tons per year across the studied cities [5]. Additionally, the evaluation of the NYC carsharing pilot program reported that VMT was reduced by 7% and GHG emissions were reduced by 6% across its membership base [6].
Further, Martin and Shaheen conducted another study through an online survey of members within carsharing organizations and found that a majority of households were marginally increasing their emissions by gaining access to automobiles, while the remaining households were decreasing their emissions by getting rid of vehicles and driving less in carsharing vehicles. Collectively, the households reducing emissions outweighed the households increasing emissions, leading to a statistically significant reduction in emissions among carsharing members [7]. Additionally, an evaluation of Modo, a carsharing service in Vancouver, showed that despite no reduction in driving behavior, the service reduced GHGs by over 30% [15].
2.3. The Role of EVs in Carsharing and Environmental Justice
The integration of EVs into carsharing programs has the potential to further reduce GHG emissions while accelerating the transition to electrification in transportation. Firnkorn and Müller conducted an online survey (n = 743) of car2go users and found that users who had driven an EV within a carsharing system were more likely to forego a personal vehicle purchase [16]. Furthermore, Shaheen et al. conducted a survey to evaluate the impacts of zero-emission vehicle (ZEV) exposure on U.S. carsharing users. The results show that exposure to plug-in electric vehicles (PHEVs) or EVs through carsharing increased a user’s reported likelihood to purchase a ZEV in the future [17].
The use of EVs promises significant environmental benefits, including reducing local air pollution and global GHG emissions. Yet, the distribution of these benefits and their potential to contribute to environmental justice is a subject of ongoing debate. In the literature, the “green divide” refers to the socio-economic and racial disparities in access to environmental benefits, such as clean air and water, green spaces, and clean energy technologies, including EVs and renewable energy. It highlights how environmental benefits and resources are often unevenly distributed across society, with marginalized communities frequently excluded from these benefits. Research shows that communities facing socio-environmental vulnerabilities, often due to lower incomes, suffer most from the disproportionate distribution of transportation emissions, leading to severe health effects [3,18,19,20]. One study found that low-income communities are disproportionately impacted by climate change, and EV carsharing can play a major role in reducing air pollution [21]. In another evaluation of Miocar, a roundtrip EV carsharing pilot that offers a low-cost carsharing option for members of underserved communities within the Central Valley of California, the results showed that a majority of members belonged to large low-income households (i.e., at least four residents/household), and about 68% of trips would not have been made in the absence of Miocar [22,23].
2.4. Summary and Research Gaps
The current literature offers substantial evidence of the impacts of carsharing on vehicle ownership, VMT, and GHG emissions. The evidence suggests that carsharing leads to a reduction in vehicle ownership, as well as VMT. This in turn results in lower GHG emissions, contributing to the mitigation of urban environmental challenges. Additionally, integrating EVs into carsharing programs has exhibited the potential to not only reduce GHG emissions, but also foster EV acceptance and advance the transition toward electric mobility.
Despite the robust existing literature, less attention is given to the intersection of these impacts in the context of EV carsharing services and the overall impact on social equity and the environment. By exploring the environmental impacts of BlueLA within underserved communities and the broader population, this study contributes to a deeper understanding of how EV carsharing can serve as a strategy for achieving environmental justice within transportation systems. While previous studies have relied on VMT and vehicle fuel economy standards to estimate fuel energy consumption and associated GHG emissions, our research takes an innovative approach by estimating a direct measure of emissions produced during BlueLA’s EV charging times. This direct measure, facilitated by our use and processing of trip activity data to identify vehicle charging events, provides a more precise understanding of the environmental footprint of BlueLA, and it creates a framework that can be replicated in the evaluation of other EV carsharing programs.
3. Methodology
The methodological discussion that follows includes five key sections: (1) data collection, including the user survey and activity data; (2) derivation of charging data to measure energy consumption; (3) measurement of carsharing impact on personal vehicle ownership and use; (4) calculation of VMT and associated GHG emission impacts; and (5) study limitations.
3.1. Data Collection
This study is supported by a robust mixed-methods approach to comprehensively assess the impact of BlueLA on VMT and GHG emissions. We employ two primary sources of data: (1) a detailed set of trip activity data from the BlueLA carsharing service and (2) responses from a comprehensive user survey. The trip activity data provide specific insights into vehicle use, travel distance, travel duration, and the charge level of each vehicle at the start and end of every trip. These data are further processed to extract charging data, which are instrumental in understanding the electric energy consumption of the BlueLA fleet. Meanwhile, the survey data allow us to gain a deeper understanding of user behavior, socio-economic characteristics, and how the BlueLA service has influenced vehicle ownership decisions among users. The combination of these two datasets enables us to quantify the impact of changes in driving behavior, vehicle shedding, and vehicle suppression on VMT and GHG emissions.
3.1.1. User Survey
A user survey was administered to enhance our understanding of the users’ interactions with BlueLA. The survey probed various aspects of the users’ interactions and their perceptions of the carsharing service. To cater to the diverse user base of BlueLA, the survey was offered in English and Spanish languages, ensuring a more inclusive data collection process.
The survey was deployed in early December 2022 to the BlueLA user base with an incentive of a random drawing for 40 Amazon gift cards of USD 50 value each. The survey incorporated two types of de-identified user IDs (De-ID): (1) a De-ID that enabled us to link individual survey respondents to their corresponding subset of trip activity data, and (2) a De-ID that enabled us to identify whether an individual survey respondent has an active or inactive BlueLA membership at the time of survey implementation. The data collection process resulted in 215 responses, out of which 2 responses were in Spanish. The total responses comprised 60% and 40% given by active and inactive BlueLA members, respectively.
3.1.2. Trip Activity Data
The trip activity data, spanning the years 2021 and 2022, capture the operations of the BlueLA fleet. They feature a total of 59,112 trips split into 28,847 trips by Standard members and 30,265 trips by Community members. They comprise a total of 1931 Standard members and 1143 Community members. In 2021, the service was used by 988 Standard members and 644 Community members, while in 2022, the user base expanded to 1299 Standard members and 822 Community members. Each row in the dataset represents a unique trip, while each column captures different trip attributes such as trip start and end times, start and end locations, total trip distance, and the vehicle’s charge level at trip start and end.
3.2. Derivation of Charging Data to Measure Energy Consumption
To estimate a direct measure of energy consumed during the charging of BlueLA EVs, we process our raw trip data using Python programming language to derive charging data for our analysis. Each vehicle is assigned one of three states at any given time: “in-trip”, “charging”, or “fully charged”. The “in-trip” state represents the period between the start and end of a trip. The “charging” state begins when a vehicle is returned at the end of a trip and continues until the vehicle’s battery reaches full charge or until the vehicle is booked in a new trip—whichever happens first. A vehicle is considered “fully charged” when its battery reaches 100%, and it remains in this state until the start of a new trip.
Our calculations are based on a battery size of 66 kWh, which is the battery capacity of the Chevrolet Bolt EVs used in the BlueLA fleet, and an onboard charger power rating of 7.7 kW [24]. Thus, a vehicle would theoretically need approximately 66 kWh/7.7 kW = 8.57 h to charge from 0% to 100%. However, in practice, the actual charging duration can be shorter if a vehicle is booked for a new trip before it reaches full charge. In such cases, we use the charge level reported at the start of the next trip rather than assuming the vehicle had reached 100%. In the special case, where a vehicle is returned at 100% charge at the end of a trip, we directly transition the vehicle’s state to “fully charged”, without going through a “charging” state. This could occur due to a user charging the vehicle at an independent charging station during the trip or due to sensor errors.
While processing the data, we encountered some inconsistencies, such as sensor errors resulting in missing values for the charging state at the start of some trips. When this happens, we use the charging level from the end of the previous trip, along with the elapsed time and charging rate, to estimate the starting charge level for the next trip. After processing the trip data, we create a new dataset representing the state of each vehicle at different points in time, with start and end timestamps and start and end levels of charge. This dataset is the basis for our analysis of vehicle charging patterns and energy consumption.
3.3. Measurement of Carsharing Impact on Personal Vehicle Ownership and Use
We focus on examining the effects of using BlueLA on driving behavior and vehicle ownership patterns, specifically vehicle shedding and suppression. Vehicle shedding refers to the phenomenon where members of BlueLA sell or otherwise get rid of a personal vehicle due to service availability. Conversely, vehicle postponement refers to the suppression of a vehicle purchase, where members delay or avoid purchasing a personal vehicle due to the presence of BlueLA.
We measure vehicle shedding, postponement, and changes in driving behavior through our survey. Survey respondents are asked if they had sold or suppressed a vehicle purchase due to BlueLA, providing us with direct measurements of these effects. Additionally, respondents are asked to estimate the total change in how many miles they have driven annually in their personal vehicle(s) due to BlueLA availability. It is important to note that the effects of vehicle shedding and postponement are considered independently to avoid any potential overlap. Any instances where a respondent indicated both shedding and suppressing a vehicle are counted as a vehicle shed. The quantification of vehicle shedding, postponement, and change in driving behavior is achieved through analysis of these survey responses, with the calculated rates applied to the entire BlueLA membership base to estimate the overall impact.
However, our reliance on survey data provided by BlueLA members invites the possibility of sample bias, as the individuals who chose to respond to the survey might not represent the overall user population of BlueLA. To address this concern, we use a weighting process to adjust the findings to represent the behavior of the overall BlueLA user population more accurately. The first step in the process is to categorize our survey respondents and the total BlueLA population according to their frequency of use of BlueLA. This categorization is important as the frequency of use directly correlates with the potential for vehicle shedding or postponement. Having categorized the respondents and the total population, we then compute ratios of each frequency category’s representation within the total user population compared to its representation within the sample of survey respondents. The calculated weights allow us to rescale the observed survey impacts to mitigate the potential overestimation arising from the sample bias. We obtain the final results on vehicle shedding, postponement, and change in driving behavior by applying these weights to the percentages obtained from the survey (i.e., the proportion of respondents who reported vehicle shedding and the average miles reduced due to it, the proportion of respondents who reported vehicle postponement and the average miles they would have driven had they acquired the vehicle, and the proportion of respondents who reported a change in personal vehicle driving and the average change in miles driven).
3.4. Calculation of VMT and Associated GHG Emission Impacts
VMT is a key metric in transportation research and policy analysis, representing the aggregate distance driven by vehicles over a given period or within a specific geographic region. The calculation of VMT provides a quantifiable measure of the extent to which BlueLA’s carsharing service is being used. The process of calculating VMT for the BlueLA system is directly facilitated by our trip data, which include an explicit “total trip distance” field for each completed trip. This field details the exact distance traveled for each respective trip. Summing up these distances across all the trips undertaken gives us the total VMT for the BlueLA system.
The estimation of emissions in this study revolves around the carbon footprint associated with the electricity used to charge the BlueLA’s all-electric fleet. Unlike internal combustion engine vehicles, which emit GHGs directly from the tailpipe, the primary source of emissions for EVs is from the generation of the electricity used to charge them. Traditionally, GHG analysis relies on an underlying assumption that VMT serves as a valid approximation for vehicle use, and hence, can be indicative of its subsequent emission impacts. This assumption, although widely accepted, has limitations. VMT as a measure does not capture the variability and complexity of different types of trips, be it urban versus highway driving or short trip versus long-haul journeys. Furthermore, VMT overlooks variations in driving conditions, such as rush hour traffic compared to late-night free flow. Both these factors can influence energy consumption levels and associated vehicle emissions. However, in our case of a fully electric vehicle fleet, these factors influence the amount of battery charge consumed, which is recorded in our derived charging data, and thus lead to a more accurate measure of energy consumption and associated GHG emissions.
While EVs produce zero tailpipe emissions, the electricity they consume is often generated from a mix of renewable and non-renewable energy sources, each with its own emissions profile. Thus, the “well-to-wheel” emissions from EVs are primarily dependent on the carbon intensity of the grid where the charging takes place. In our case, we use average California emissions factors with LCFS-based (non-lifecycle) instantaneous factors, measured in gram of CO2-equivalent per kWh (gCO2e/kWh) [25]. The factors account for the varying emission intensity of electricity generation in California throughout the day and across the months in the years 2021 and 2022. We rescale these factors to include an efficiency adjustment of 8.7% for transmission losses [26] as well as 5% for converting AC to DC energy using Blink’s IQ 200 Level 2 EV Charger [24,27]. We multiply these emission factors by the energy consumed by the BlueLA fleet, as estimated from the derived charging data, to estimate the total indirect GHG emissions attributable to the BlueLA system, as shown in Equations (1) and (2).
3.5. Study Limitations
This study acknowledges several constraints and potential sources of bias that could affect the interpretation of our results. Our reliance on survey data provided by BlueLA members invites the possibility of sample bias, as the individuals who chose to respond to the survey might not represent the overall user population of BlueLA. This sample bias could lead to an over or underestimation of certain behaviors or preferences, potentially skewing results toward a more or less favorable view of EV carsharing. Another key limitation is the moderately sized final sample for our analysis, which might limit the generalizability of our findings. Larger sample sizes can provide a more accurate understanding of the population if collected in an unbiased manner. We address both limitations by following our methodology of weighting our findings to better represent the overall user population. This approach adjusts our findings based on BlueLA usage frequency and estimated miles driven, both derived from the self-reported survey data. It is worth noting that while this method offers a more nuanced representation of BlueLA’s impact on personal vehicle ownership and use, it still carries inherent biases and potential inaccuracies. These biases can arise from respondents’ recall limitations, unintentional misrepresentation, which can happen with any survey, as well as inherent biases as to who decides to respond to the survey.
Our weighting methodology aims to adjust the distribution of responses to counter this latter effect in particular, and it provides a more representative estimation of the population-level impacts of the BlueLA service on personal vehicle ownership. However, it may not fully account for all aspects of non-response bias or other systematic differences between respondents and non-respondents. Future research could benefit from employing alternative methodologies or conducting qualitative studies to validate the survey findings.
Furthermore, our approach to estimating emissions focuses on CO2-equivalent emissions from electricity consumption during vehicle charging. Our method of estimating charging data is rooted in the known specifications of the Chevrolet Bolt EVs used in the BlueLA fleet. This estimation is based on several assumptions. These include assumptions on the time charging begins, the charging rate, and the maximum charge level. Depending on the battery, charging guidelines can recommend charging to levels that are below full capacity (e.g., 80%) for improved battery health and charging efficiency. Despite these assumptions, we believe the charging data and supporting assumptions provide a good approximation of the vehicle charging patterns and time-dependent energy consumption in the BlueLA carsharing system.
The study reflects conditions and circumstances of the BlueLA system during the years 2021 and 2022, and provides a snapshot of BlueLA’s environmental impacts during this period. The impacts could have been influenced by the COVID-19 pandemic and its recovery, which might have altered travel patterns and vehicle usage accordingly. Despite these limitations, we believe our study provides a valuable exploration of the environmental impacts of BlueLA, and provides contributions relevant to future research in this area.
4. Results and Discussion
This section presents the findings of our study and provides a discussion of their implications. First, we estimate the overall environmental impact of BlueLA. Then, we disaggregate our results by comparing the annual environmental impact among underserved communities (Community members) and the broader population (Standard members).
4.1. Environmental Impact of BlueLA
The survey was distributed to both active and inactive BlueLA members, with a focus on examining the effects of using BlueLA on driving behavior and vehicle ownership patterns, specifically vehicle shedding and suppression. For our analysis in this section, we concentrate exclusively on responses from active BlueLA members. Active members were defined as members who had an active BlueLA membership at the time of survey implementation. The project may have impacts on inactive members as well, possibly in the form of mobility insurance that enables greater confidence in vehicle shedding or avoiding acquisition. Our analysis focuses on those active members for whom the utility of the system is most clearly demonstrated. To proceed, we match these active respondents with their corresponding trip activity data to obtain a more comprehensive view of their usage patterns, yielding a 63% match rate. Therefore, we proceed to base our analysis on these matched active responses, as we require the trip activity data for our weighting process.
From our sample of 81 matched and active respondents, we examine their responses to survey questions aimed at assessing changes in vehicle ownership and driving behavior. First, we asked respondents to report their personal vehicle holdings and estimate the total miles they drive annually in their personal vehicle(s). In response to this, 23% of the respondents reported owning a personal vehicle (Figure 1). If a respondent reported driving an amount greater than our set cap of 30,000 miles, we adjusted their response to this cap. If a respondent owned multiple vehicles, we divided the reported miles driven evenly among their vehicles to ensure an average of miles driven per vehicle. After these adjustments and applying the weighting process, the weighted share of those respondents is 27%, and their weighted average VMT is 7070 miles.
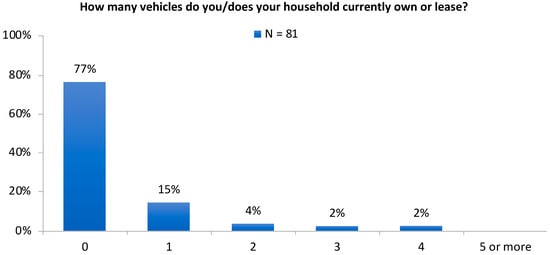
Figure 1.
Distribution of personal vehicle holdings among survey respondents.
For vehicle shedding, respondents were asked: “Have you/your household gotten rid of vehicles because of the increased mobility obtained through BlueLA?” and “If BlueLA were not available, would you/your household still have gotten rid of the vehicle(s)?” The valid responses for our analysis are those where the respondents indicated that they had definitely or partially gotten rid of vehicles due to BlueLA, and confirmed they would still have the vehicle(s) if BlueLA were not available. We find that 5% of the respondents reported shedding one vehicle due to BlueLA use, leading to an average reduction in VMT of 6079 miles. After applying the weighting process, the weighted share of respondents shedding a vehicle becomes 4%, and their weighted average reduction in VMT is 4186 miles. When applying the weighted vehicle shedding rate to the entire BlueLA user population (3074 registered users), this translates to 108 vehicles shed due to the presence of BlueLA. For vehicle suppression, respondents were asked: “If BlueLA were not available, do you think you/your household would acquire a vehicle?” The valid responses for our analysis are those where the respondents definitively or probably indicated they would acquire a vehicle if not for BlueLA. We find that 33% of the respondents reported postponing a vehicle purchase. To ensure conservative estimates, if a respondent indicated they would have driven more than our set cap of 20,000 miles, we adjusted their response to this cap. Furthermore, if a respondent reported suppressing the purchase of multiple vehicles, we rescaled the miles avoided to reflect the suppression of just one vehicle. After these adjustments and applying the weighting process, the weighted share of those respondents becomes 30%, and their weighted average reduction in VMT is 6319 miles. When applying the weighted vehicle suppression rate to the entire BlueLA user population, this translates to 910 vehicles suppressed due to the availability of BlueLA. Combining the vehicle shedding and suppression effects, we find that BlueLA replaced 1018 personal vehicles, which translates to 16 personal vehicles replaced per BlueLA vehicle. Our findings align with previous studies documenting the impact of carsharing service use on personal vehicle replacement. Notably, these results are situated at the higher end of the spectrum reported in the existing literature due to the more pronounced vehicle shedding rates observed in our study.
Additionally, we asked respondents to estimate the total change in miles driven annually in their personal vehicle(s) due to carsharing vehicle access. In response to this, 10% of the respondents reported driving less due to BlueLA use. If a respondent reported a reduction greater than our set cap of 10,000 miles, we adjusted their response to this cap. If a respondent owned multiple vehicles, we divided the reported reduction in miles evenly among their vehicles to ensure an average reduction per vehicle. After these adjustments and applying the weighting process, the weighted share of those respondents remains 10%, and their weighted average VMT reduction is 1632 miles.
Following the quantification of miles reduced due to vehicle shedding, vehicle postponement, and reduced driving, we proceed to translate these reductions into GHG emission savings. The method for this translation, shown in Equation (3), is rooted in the Environmental Protection Agency’s (EPA) standard calculations for GHG emissions from personal vehicle usage [28]. Firstly, we use a measure of vehicle fuel economy to convert the reduced miles into gallons of gasoline saved. For our analysis, we use the 2021 weighted average combined fuel economy of cars and light trucks of 22.9 miles per gallon (MPG), estimated by the Federal Highway Administration [29]. Next, we calculate the carbon dioxide emissions associated with burning a gallon of motor gasoline. The EPA estimates that burning one gallon of motor gasoline results in 8.89 × 10⁻³ metric tons of carbon dioxide emitted. However, passenger vehicles emit other GHGs in addition to carbon dioxide, namely, methane and nitrous oxide. To account for these emissions in our calculation, we use the EPA’s ratio of carbon dioxide emissions to total GHG emissions for passenger vehicles in 2022, which is 0.993. This ratio allows us to express our result in terms of carbon dioxide equivalents, which accounts for the global warming potential of all the GHGs emitted. Therefore, to estimate the GHG emission reductions from the miles reduced due to BlueLA, we divide the carbon dioxide equivalent emissions per gallon of gasoline by the average fuel economy to determine the carbon dioxide equivalent emissions per mile. This is then multiplied by the overall reduction in VMT to derive our estimate of the GHG emission savings due to BlueLA.
As a result, across the entire BlueLA user population, we estimate 575,322 miles avoided due to reduced personal driving, 785,143 miles avoided to vehicle shedding, and 1,156,165 miles avoided due to vehicle suppression. This leads to a total reduction in VMT of 2,516,630 miles, which translates to a reduction in GHG emissions of 982 metric tons.
Having quantified the reduction in VMT and GHG emissions from vehicle shedding, suppression, and reduced driving, we then proceed to assess the total distance traveled by BlueLA members in BlueLA vehicles. This is an essential component of our analysis as the use of these shared EVs contributes to additional VMT and associated GHG emissions produced during the vehicle charging process. As per our calculations, BlueLA members drove a total of 2,052,785 miles in BlueLA vehicles. To calculate the emissions associated with these trips, we rely on the variable emission factors outlined in our methodology, which represent the GHG emissions produced per kWh of electricity used. We apply these factors in Equations (1) and (2) of our methodology to estimate the GHG emissions produced during the charging of BlueLA’s EVs, which amounts to 326 metric tons.
In the final step, we combine our estimates of the increase in VMT and GHG emissions from the use of BlueLA vehicles and the decrease from vehicle shedding, suppression, and reduced driving to determine the net environmental impact of BlueLA. The net VMT change leads to a net reduction of 463,845 miles, and the net change in GHG emissions leads to a net reduction of 656 metric tons. These results provide a comprehensive measure of the environmental impact of BlueLA, factoring in both the emissions avoided through reduced personal vehicle use and the emissions generated from the use of shared EVs.
To compare overall system VMT and GHG emissions, we consider two scenarios in the presence and absence of BlueLA while accounting for personal vehicle mileage. Using the same methodology as in Equation (3), across the entire BlueLA user population, we estimate 6,160,640 miles driven in personal vehicles, equivalent to 2407 metric tons of GHG emissions. In the first scenario where BlueLA is available, we combine VMT and GHG emissions resulting from personal vehicle driving and BlueLA system operations, and deduct those avoided as a result of vehicle shedding, suppression, and reduced personal vehicle driving behavior. This translates to 5,696,795 miles and 1751 metric tons. In the second scenario where BlueLA does not exist, we combine VMT and GHG emissions resulting from personal vehicle driving and those previously avoided but now realized from vehicle shedding, suppression, and reduced personal vehicle driving behavior. This translates to 8,677,271 miles and 3389 metric tons. Thus, the presence of BlueLA results in an overall system reduction of 34% in VMT and 48% in associated GHG emissions.
To fully evaluate the environmental impact of using an EV fleet, we also calculate the GHG emissions that would have been produced if BlueLA vehicles were instead traditional gasoline vehicles with internal combustine engines (ICEs). This allows us to compare the emissions produced by the electric fleet to those of a comparable fleet of internal combustion engine vehicles. We translate the total VMT driven by BlueLA vehicles into GHG emissions using the EPA’s estimated real-world fuel economy for 2021 of 31.85 MPG [30]. We find that if BlueLA had operated a hypothetical fleet of traditional gasoline vehicles, the total GHG emissions would have been 576 metric tons. Therefore, using an EV fleet would reduce GHG emissions by 43% or 250 metric tons. These results underscore the potential of EV carsharing services like BlueLA in reducing GHG emissions and improving air quality.
4.2. Equity Implication: A Disaggregated Analysis of Standard and Community Members
Out of our sample of 81 matched and active respondents, 46 were Standard members, while 35 were Community members. From an equity perspective, our survey data illustrate clear socio-demographic disparities between Standard and Community members of BlueLA (Table 1). For instance, 74% of Community members reported earning less than USD 50,000 annually, while 68% of Standard members reported an annual income of USD 75,000 or more. Education levels and household sizes also differ, as Community members generally have lower educational attainment and larger households than Standard members. Despite these differences, 74% of both groups do not own or lease a vehicle, underscoring the role of BlueLA in providing vehicle access to zero-car households.

Table 1.
Socio-demographic variables for survey respondents 1 and the general population within the BlueLA service area.
To further understand the socio-demographic disparities between Standard and Community members of BlueLA, we employ Chi-squared tests to statistically evaluate the differences in distributions across key variables. This test is particularly appropriate for categorical data, allowing us to discern whether observed distributions deviate significantly from expected distributions under the assumption of independence. Our findings (Table 2) reveal a pronounced disparity in income levels between the two membership groups, with a statistically significant result (p < 0.0001) and a strong association between the type of BlueLA membership and income levels, as quantified by Cramér’s V. Cramér’s V is a measure of association for nominal categorical data, with values ranging between 0, indicating no association, and 1, indicating a perfect association. With a Cramér’s V value of 0.66 for household income, our data underscore the earlier observation where a majority of Community members reported earning less than USD 50,000 annually, in contrast to the Standard members, most of whom earn USD 75,000 or more. However, for other socio-demographic variables like education level, race, household size, and vehicle ownership, the differences between the two groups are not statistically significant, as indicated by p-values greater than the conventional threshold of 0.05. The effect sizes for these variables, as measured by Cramér’s V, range from weak to moderate, suggesting that while there might be observable differences in distributions, they are not as pronounced or statistically significant as the income disparities.
Table 2.
Results of the statistical tests comparing socio-demographic variables between standard and community members of BlueLA.
These socio-demographic disparities bear crucial implications for our understanding of BlueLA and its role in contributing to social equity and environmental justice. As the literature has pointed out, transportation benefits have historically been concentrated among wealthier and more educated population groups, while transportation burdens have been disproportionately distributed among minority and lower-income segments of society [3,18,19,20]. Thus, examining these disparities aligns with our study’s goal of evaluating how BlueLA, funded to pilot EV carsharing in low-income communities, can address social equity and environmental justice issues prevalent in the transportation context.
Our study takes an additional step in comparing the yearly environmental impacts across the two different member types: Standard and Community members. We aim to provide insights into the contribution of each of the two user groups to the overall environmental impacts of BlueLA. In this context, we disaggregate the VMT reduced due to vehicle shedding, vehicle suppression, and reduced driving for both Standard and Community members separately for 2021 and 2022. The process remains consistent with our previously outlined methodology; we apply weights to adjust for the potential overrepresentation of more active users, extrapolate the findings to each member type’s respective population, and translate the miles reduced to GHG emission savings.
Our analysis of vehicle shedding, vehicle suppression, and reduced personal driving for both member types illustrate these findings (Table 3 and Table 4). For the 46 Standard members, we estimate weighted shares of 1% shedding a vehicle, 25% suppressing a vehicle, and 5% reporting reduced driving due to BlueLA. The corresponding estimates for the 35 Community members are higher: 7% reported shedding a vehicle, 36% reported suppressing a vehicle, and 17% reported reduced driving. When these rates are applied to the BlueLA user population, we find that in 2021, among 988 Standard users, there was a total reduction of 588,000 in VMT, which translates to 229 metric tons of GHG emissions saved. In 2022, among 1299 Standard users, there was a total reduction of 417,000 in VMT, leading to 163 metric tons of GHG emissions saved. This results in cumulative GHG savings of 392 metric tons over the two years for Standard members. For Community members, the impact is even more pronounced. In 2021, among 644 Community users, the total reduction was 583,000 VMT, leading to 227 metric tons of GHG emissions saved. In 2022, among 822 Community users, the total reduction was 798,000 VMT, leading to 312 metric tons of GHG emissions saved. Thus, the cumulative GHG savings over the two years for Community members is 539 metric tons, which is significantly more than that for Standard members despite the smaller user population.
Table 3.
Survey and BlueLA user population data for vehicle shedding, vehicle suppression, and reduced driving by member type and year.
Table 4.
VMT and GHG emission savings by BlueLA member type and year.
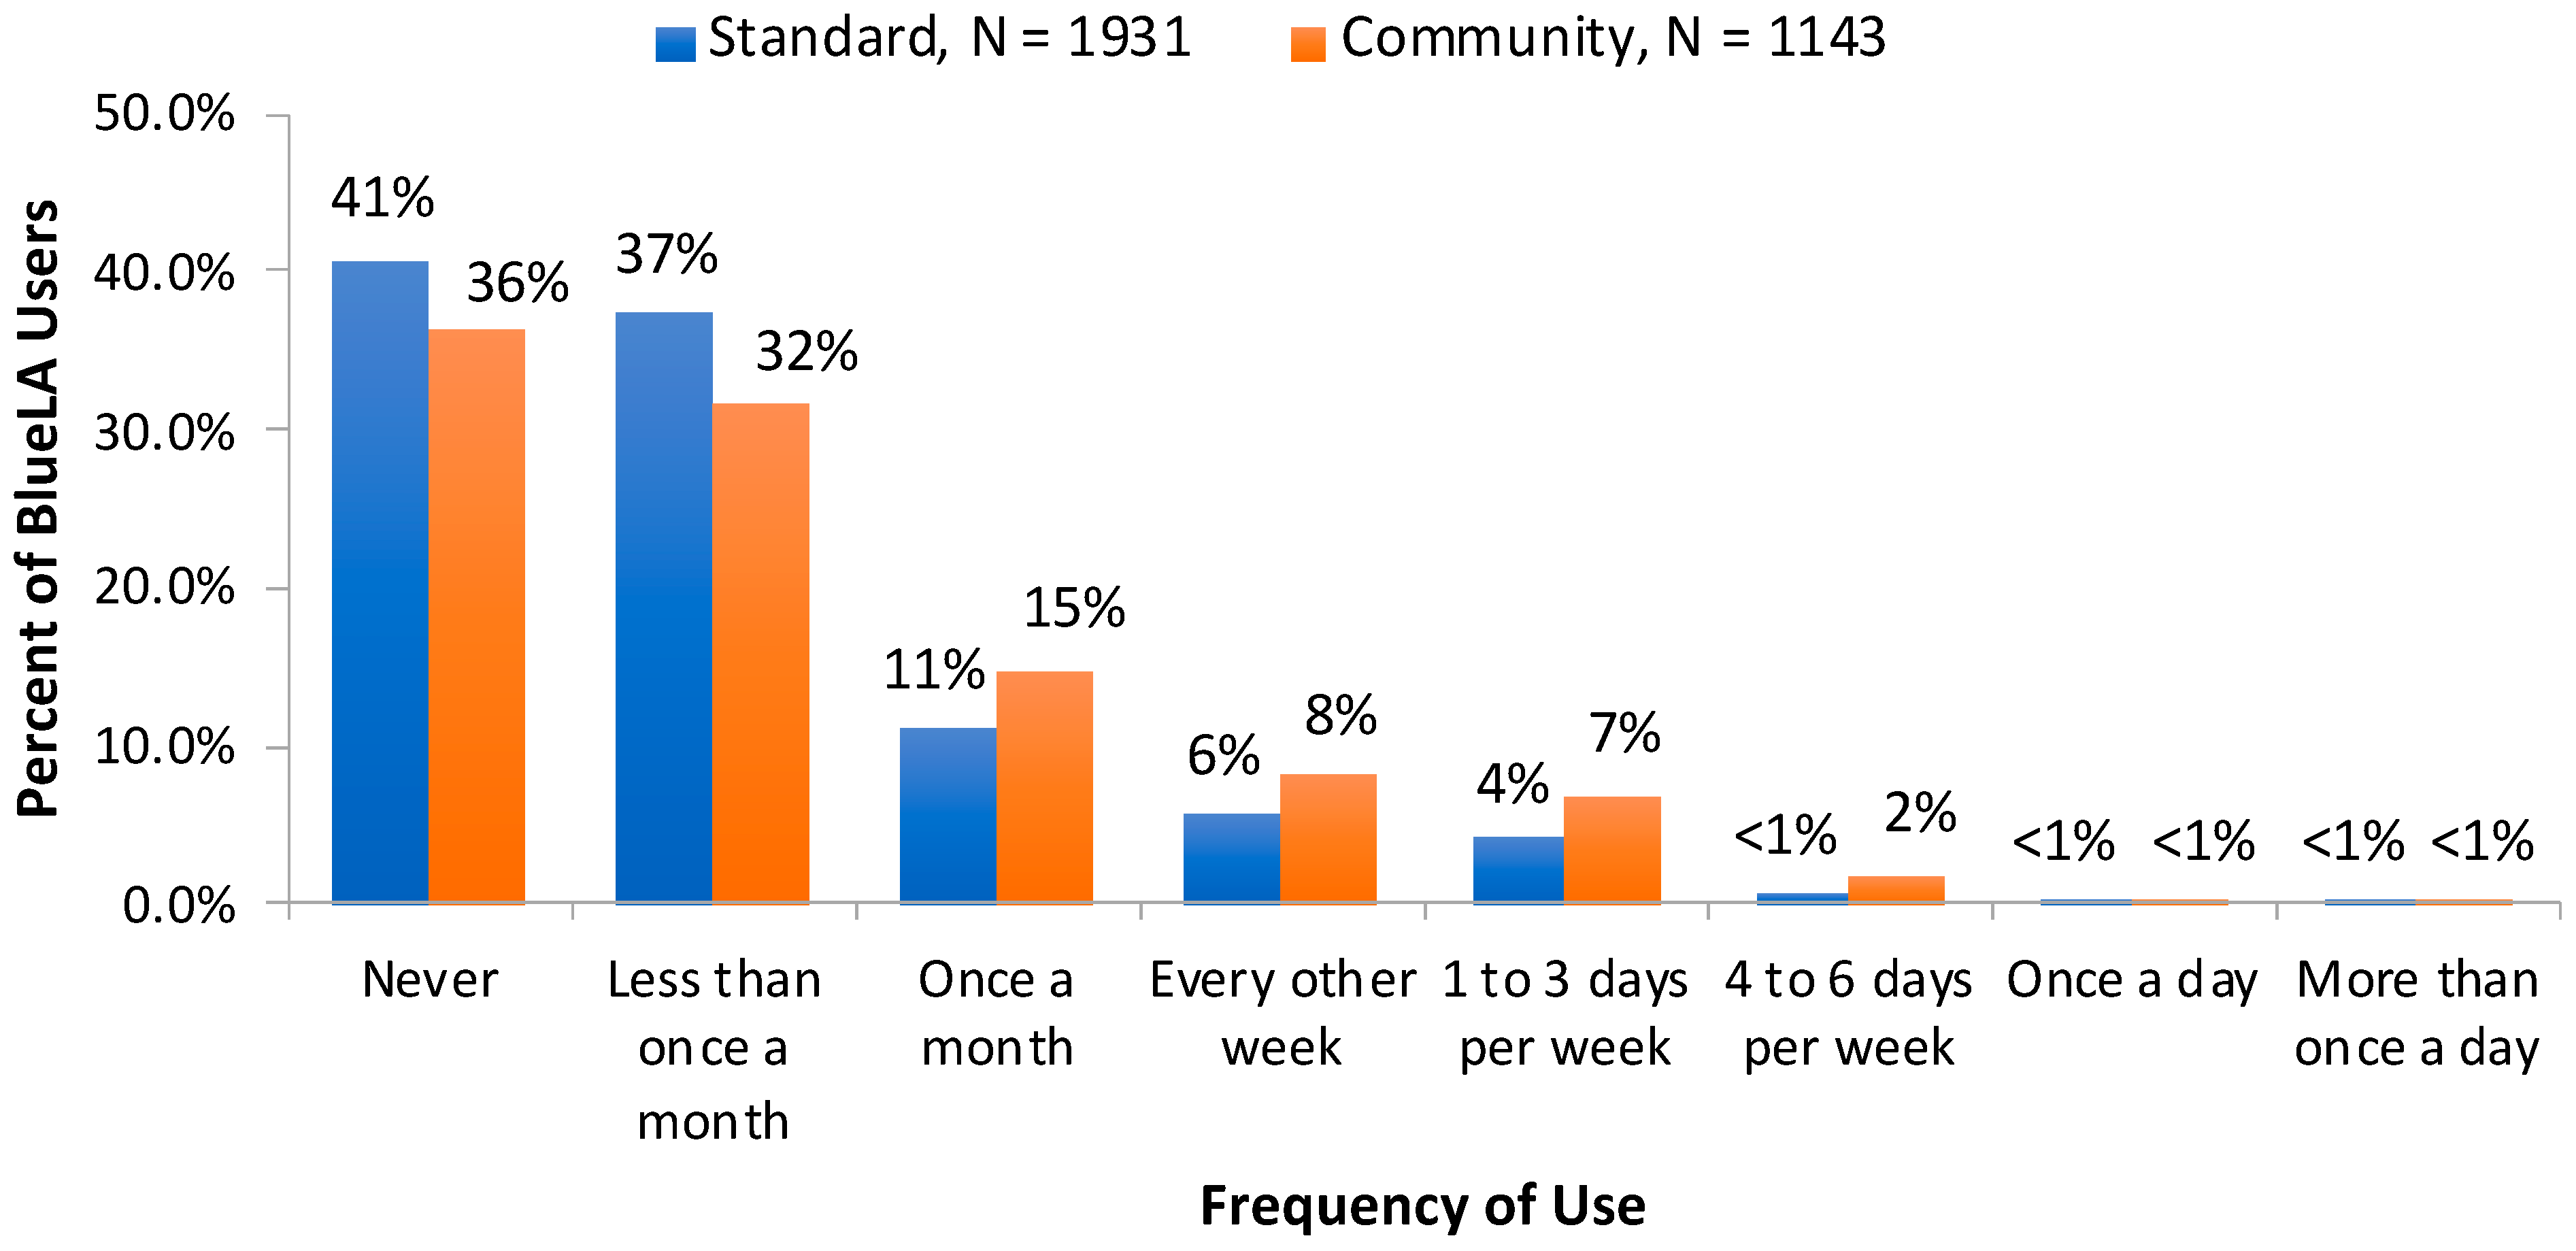
The disparity in VMT reduction and GHG emission savings between Standard and Community members underscores the impact of socioeconomic factors on carsharing use and its environmental outcomes. Through this disaggregation, we observe differences in the frequency of use of BlueLA between Standard and Community members for both years combined (Figure 2). The distribution of frequency categories within each member type reveals varied usage patterns leading to a variation in the average miles avoided due to vehicle shedding, vehicle suppression, and reduced driving.
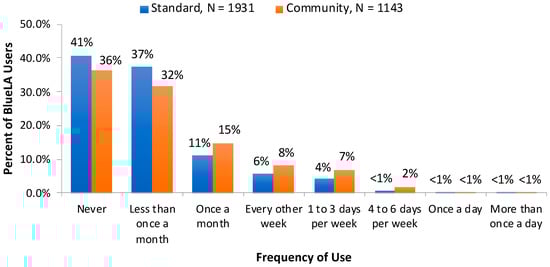
Figure 2.
Distribution of BlueLA average frequency of use for Standard and Community members.
The frequency distribution of usage among both Standard and Community members provides valuable insights into their use of the BlueLA service. It is noticeable that for both years and both member types, the highest proportions of users fall within the “Never” and “Less than once a month” categories. However, there are observable differences between Standard and Community members’ use patterns. Community members seem to have slightly higher proportions in the more frequent categories (i.e., “Once a month” and more), suggesting that they rely more on the BlueLA service for their mobility needs than Standard members. The same differences in use among both groups are observed when disaggregating the results by year, but with slightly increased use levels.
Average trips per week further highlight these differences. For Standard members, the average number of trips per week was 1.58 in 2021, which decreased slightly to 1.51 trips per week in 2022. On the other hand, Community members showed an 8% increase in their average weekly trips, from 1.54 in 2021 to 1.66 in 2022. The observed variations in frequency of use in addition to the different impact rates reported in the survey by Standard and Community members (Table 3) subsequently influence their magnitude of contribution to VMT reduction and GHG emission savings.
With the disaggregated environmental savings calculated for Standard and Community members, we then estimate the total VMT by BlueLA members using the shared EVs. Our calculations show that in 2021, Standard members traveled a total of 407,000 miles, and Community members traveled 362,000 miles using BlueLA vehicles (Table 5). In 2022, the total distances driven by Standard and Community members increased to 594,000 miles and 689,000 miles, respectively, which can be attributed to the growth in the user base. The associated GHG emissions are computed based on the energy consumption during the charging of BlueLA’s EVs. For 2021, BlueLA charging resulted in 56 metric tons of GHG emissions for Standard members and 51 metric tons for Community members. These emissions rose in 2022, reaching 102 metric tons for Standard members and 117 metric tons for Community members, which can be attributed to the observed VMT increase.
Table 5.
VMT and GHG emissions net impact by BlueLA member type and year.
Despite the emissions caused due to BlueLA vehicle use, our assessment of the net environmental impact of the service demonstrates its potential for overall reductions in GHG emissions. When combining the emissions savings due to vehicle shedding, suppression, and reduced driving with the emissions from BlueLA vehicle use, both 2021 and 2022 show a net reduction in GHG emissions for both Standard and Community members, with greater net impacts observed for Community members.
BlueLA has led to notable net reductions in VMT and thus GHG emissions, with a major share of these reductions observed among Community members. Specifically, the use of the service by Community members, who typically reside in underserved neighborhoods, results in significant miles reduced, and consequently, a notable decrease in GHG emissions. This is consistent with BlueLA’s mission to increase access to sustainable and affordable mobility options in underserved communities. By reducing dependence on privately owned vehicles in these communities and providing a mobility option for zero-car households, BlueLA aids in improving transportation accessibility and lessens the environmental burden associated with vehicle use.
5. Conclusions
Through our evaluation of BlueLA, this study aims to investigate the potential of EV carsharing to address social and environmental disparities in urban transportation. Operating since 2018, BlueLA provides a clean and affordable mobility option in underserved communities that face socio-environmental vulnerabilities and have historically been excluded from environmental benefits, thereby linking environmental sustainability with social equity and environmental justice.
Our research process involves a comprehensive evaluation of BlueLA’s impact on vehicle ownership patterns, VMT, and associated GHG emissions. Using data from a member survey and BlueLA trip activity records, we provide estimates of changes in VMT and resultant GHG emissions linked to the use of BlueLA. Notably, our innovative approach of calculating direct emissions from EV charging events stands to significantly enhance the granularity of our environmental impact assessment.
Our calculated net environmental impact of the service emphasizes the potential for overall VMT reductions and associated GHG emissions. When combining the VMT and emission savings due to vehicle shedding, suppression, and reduced driving with the VMT and emissions from BlueLA vehicle use, we observe a net reduction in VMT of 463,845 miles and a net decrease in GHG emissions of 656 metric tons. When disaggregating the impacts by BlueLA member type, our findings show that in 2021 and 2022, Standard members traveled a total of 1,001,000 miles and Community members traveled 1,051,000 miles using BlueLA vehicles. Despite this increase in VMT due to the growth in user base, a total net reduction of 234 and 371 metric tons in GHG emissions is achieved for Standard and Community members, respectively. Greater impacts for Community members are attributed to their higher frequencies of use of BlueLA and their higher rates of vehicle shedding, suppression, and reduced driving due to using BlueLA. Moreover, when comparing the VMT and associated GHG emissions produced in the presence and absence of BlueLA, we find that the presence of BlueLA reduces VMT by 34% and GHG emissions by 48%, and each BlueLA vehicle replaces 16 personally owned vehicles. Last, when comparing the emissions produced by the electric fleet of BlueLA to those of a comparable fleet of internal combustion engine vehicles, we find that the use of an EV fleet reduces GHG emissions by 43% in comparison.
By providing a comparative analysis of environmental impacts across different member types, our study demonstrates the role of EV carsharing in promoting social equity while contributing to environmental sustainability. The BlueLA carsharing service has led to notable net reductions in VMT and thus GHG emissions, with a major share of these reductions observed among Community members. As sustainable mobility strategies continue to be deployed, insights from our findings can be employed to design programs that target GHG emission reductions but also emphasize accessibility and affordability, thereby advancing both environmental and societal equity goals. Nevertheless, it is important to note that other socio-economic and locational factors could influence use patterns and subsequent environmental impacts. Despite the complexities, positive environmental benefits for both member types are demonstrated for the BlueLA EV carsharing service. Future research could focus on longer-term studies to understand the evolving impacts of EV carsharing services, especially as they expand and integrate with other forms of urban transportation. Additionally, policymakers could leverage these insights to design targeted incentives and infrastructure support for EV carsharing, particularly in underserved communities. Such initiatives could include subsidies for EV carsharing memberships, investment in charging infrastructure in these areas, and the integration of carsharing into broader urban mobility plans (e.g., mobility wallets).
Author Contributions
Study conception and design: Z.Y., E.W.M. and S.A.S.; funding acquisition: S.A.S.; data collection: Z.Y., E.W.M. and S.A.S.; analysis and interpretation of results: Z.Y., E.W.M. and S.A.S.; draft manuscript preparation: Z.Y., E.W.M. and S.A.S. All authors have read and agreed to the published version of the manuscript.
Funding
This research was funded by the California Air Resources Board. CARB Agreement No. 19MSC006.
Data Availability Statement
The data used in this study are not publicly available due to IRB-related restrictions. Additionally, the trip activity data employed in this research were provided to researchers by the operator under the understanding of business confidentiality. The authors must adhere to these privacy and confidentiality considerations in place.
Acknowledgments
This study is supported by the California Air Resources Board (CARB) under the Clean Mobility Options Pilot Program and South Los Angeles Universal Basic Mobility Pilot Program. This article is based in part on research conducted on behalf of CARB. Shaheen is a member of CARB’s Board. The research contract was executed before she was appointed to the CARB Board. Shaheen conducted a substantial portion of this research prior to her nomination. After joining the Board, she continued her contributions to this effort without compensation and no longer serves as the Principal Investigator. We are grateful to BlueLA powered by Blink Mobility for their provision of the crucial data necessary for this research. Our appreciation extends to our research team for their diligent efforts in research design, data collection and analysis, and to our survey participants for their valuable input. While the views expressed in this paper are those of the authors, the contributions of all parties involved in this research are deeply valued.
Conflicts of Interest
The authors declare no conflict of interest.
References
- Shaheen, S.; Cohen, A.; Randolph, M.; Farrar, E.; Davis, R.; Nichols, A. Shared Mobility Policy Playbook; University of California: Berkeley, CA, USA, 2019. [Google Scholar]
- Shaheen, S.A.; Cano, L.A.; Camel, M.L. Electric Vehicle Carsharing in a Senior Adult Community in San Francisco Bay Area; No. 13-4491; Transportation Sustainability Research Center: Berkeley, CA, USA, 2013. [Google Scholar]
- Bullard, R.D. Addressing urban transportation equity in the United States. Fordham Urb. LJ 2003, 31, 1183. [Google Scholar]
- South Los Angeles Universal Basic Mobility Pilot Program; STEP-IG-02; Los Angeles Department of Transportation; Sustainable Transportation and Communities Division, California Air Resources Board: Sacramento, CA, USA, 2021.
- Martin, E.; Shaheen, S. Impacts of Car2go on Vehicle Ownership, Modal Shift, Vehicle Miles Traveled, and Greenhouse Gas Emissions: An Analysis of Five North American Cities; Transportation Sustainability Research Center: Berkeley, CA, USA, 2016. [Google Scholar]
- Martin, E.; Stocker, A.; Nichols, A.; Shaheen, S. Roundtrip Carsharing in New York City: An Evaluation of a Pilot Program and System Impacts; Transportation Sustainability Research Center: Berkeley, CA, USA, 2021. [Google Scholar]
- Martin, E.W.; Shaheen, S.A. Greenhouse gas emission impacts of carsharing in North America. IEEE Trans. Intell. Transp. Syst. 2011, 12, 1074–1086. [Google Scholar] [CrossRef]
- Martin, E.; Shaheen, S.A.; Lidicker, J. Impact of carsharing on household vehicle holdings: Results from North American shared-use vehicle survey. Transp. Res. Rec. 2010, 2143, 150–158. [Google Scholar] [CrossRef]
- Cervero, R.; Tsai, Y. City Carshare in San Francisco, California: Second-Year Travel Demand and Car Ownership Impacts. Transp. Res. Rec. 2004, 1887, 117–127. [Google Scholar] [CrossRef]
- Cervero, R.; Golub, A.; Nee, B. City Carshare: Longer-Term Travel Demand and Car Ownership Impacts. Transp. Res. Rec. 2007, 1992, 70–80. [Google Scholar] [CrossRef]
- Lane, C. PhillyCarShare: First-Year Social and Mobility Impacts of Carsharing in Philadelphia, Pennsylvania. Transp. Res. Rec. 2005, 1927, 158–166. [Google Scholar] [CrossRef]
- Shaheen, S.; Martin, E.; Hoffman-Stapleton, M. Shared mobility and urban form impacts: A case study of peer-to-peer (P2P) carsharing in the US. J. Urban Des. 2021, 26, 141–158. [Google Scholar] [CrossRef]
- Shaheen, S.; Martin, E.; Bansal, A. Peer-to-Peer (P2P) Carsharing: Understanding Early Markets, Social Dynamics, and Behavioral Impacts; Transportation Sustainability Research Center: Berkeley, CA, USA, 2018. [Google Scholar]
- Katzev, R. Car Sharing: A New Approach to Urban Transportation Problems. Anal. Soc. Issues Public Policy 2003, 3, 65–86. Available online: www.asap-spssi.org/pdf/katzev.pdf (accessed on 31 July 2005). [CrossRef]
- Namazu, M.; Dowlatabadi, H. Characterizing the GHG emission impacts of carsharing: A case of Vancouver. Environ. Res. Lett. 2015, 10, 124017. [Google Scholar] [CrossRef]
- Firnkorn, J.; Müller, M. Free-floating electric carsharing-fleets in smart cities: The dawning of a post-private car era in urban environments? Environ. Sci. Policy 2015, 45, 30–40. [Google Scholar] [CrossRef]
- Shaheen, S.; Martin, E.; Totte, H. Zero-emission vehicle exposure within US carsharing fleets and impacts on sentiment toward electric-drive vehicles. Transp. Policy 2020, 85, A23–A32. [Google Scholar] [CrossRef]
- Morello-Frosch, R.; Jesdale, B.M.; Sadd, J.L.; Pastor, M. Ambient air pollution exposure and full-term birth weight in California. Environ. Health 2010, 9, 1–13. [Google Scholar] [CrossRef] [PubMed]
- Su, J.G.; Jerrett, M.; Morello-Frosch, R.; Jesdale, B.M.; Kyle, A.D. Inequalities in cumulative environmental burdens among three urbanized counties in California. Environ. Int. 2012, 40, 79–87. [Google Scholar] [CrossRef] [PubMed]
- Houston, D.; Wu, J.; Ong, P.; Winer, A. Structural disparities of urban traffic in Southern California: Implications for vehicle-related air pollution exposure in minority and high-poverty neighborhoods. J. Urban Aff. 2004, 26, 565–592. [Google Scholar] [CrossRef]
- Espino, J.; Truong, V.; Director, E.E. Electric Carsharing in Underserved Communities; The Greenlining Institute: Oakland, CA, USA, 2015. [Google Scholar]
- Rodier, C.; Harold, B.; Zhang, Y.; Carlos Sanchez, J.C.; Harrison, M.; Francisco, J. The Central Valley Initiative; Plug-In Hybrid & Electric Vehicle Research Center: Davis, CA, USA, 2022. [Google Scholar]
- Rodier, C.; Randall, C.; Garcia Sanchez, J.C.; Harrison, M.; Francisco, J.; Tovar, A. Challenges and Opportunities for Publicly Funded Electric Vehicle Carsharing; National Center for Sustainable Transportation: Davis, CA, USA, 2022. [Google Scholar]
- Blink, M. How Long Does It Take to Re-Charge with a Blink Charger? Blink Mobility Website. Available online: https://blinkmobility.com/how-long-does-it-take-to-re-charge-with-a-blink-charger/ (accessed on 25 July 2023).
- Zhang, X.; Martin, E.; Shaheen, S. The Dynamics of the California Electric Grid Mix and Electric Vehicle Emissions Factors; Working Paper; University of California: Berkeley, CA, USA, 2023. [Google Scholar]
- Deru, M.; Torcellini, P. Source Energy and Emission Factors for Energy Use in Buildings (Revised); No. NREL/TP-550-38617; National Renewable Energy Lab.: Golden, CO, USA, 2007.
- Voelcker, J. EVs Explained: Charging Losses. Car and Driver. Available online: www.caranddriver.com/features/a36062942/evs-explained-charging-losses/ (accessed on 10 April 2021).
- Environmental Protection Agency. Greenhouse Gas Equivalencies Calculator—Calculations and References. U.S. Environmental Protection Agency. Available online: www.epa.gov/energy/greenhouse-gases-equivalencies-calculator-calculations-and-references (accessed on 25 July 2023).
- Federal Highway Administration. Annual Vehicle Distance Traveled in Miles and Related Data—2021. Highway Statistics 2021, U.S. Department of Transportation. Available online: www.fhwa.dot.gov/policyinformation/statistics/2021/vm1.cfm (accessed on 25 July 2023).
- Environmental Protection Agency. The 2022 EPA Automotive Trends Report: Greenhouse Gas Emissions, Fuel Economy, and Technology Since 1975. U.S. Environmental Protection Agency. 2022. Available online: https://www.epa.gov/system/files/documents/2022-12/420s22001.pdf (accessed on 26 July 2023).
- U.S. Census Bureau. 2017–2021 American Community Survey 5-Year Estimates. Available online: http://data.census.gov/ (accessed on 31 July 2023).

Disclaimer/Publisher’s Note: The statements, opinions and data contained in all publications are solely those of the individual author(s) and contributor(s) and not of MDPI and/or the editor(s). MDPI and/or the editor(s) disclaim responsibility for any injury to people or property resulting from any ideas, methods, instructions or products referred to in the content. |
© 2024 by the authors. Licensee MDPI, Basel, Switzerland. This article is an open access article distributed under the terms and conditions of the Creative Commons Attribution (CC BY) license (https://creativecommons.org/licenses/by/4.0/).