Article

Controlling Factors of Vertical Geochemical Variations in Hydrate-Rich Sediments at the Site GMGS5-W08 in the Qiongdongnan Basin, Northern South China Sea

1
National Key Laboratory of Petroleum Resources and Engineering, China University of Petroleum, Beijing 102249, China
2
College of Geosciences, China University of Petroleum, Beijing 102249, China
3
National Engineering Research Center of Gas Hydrate Exploration and Development, Guangzhou Marine Geological Survey, Ministry of Natural Resources, Guangzhou 511458, China
*
Authors to whom correspondence should be addressed.
Energies 2024, 17(2), 412; https://doi.org/10.3390/en17020412
Submission received: 15 November 2023 / Revised: 9 December 2023 / Accepted: 10 January 2024 / Published: 14 January 2024

Abstract

:
Large amounts of natural gas hydrates have been discovered in the Qiongdongnan Basin (QDNB), South China Sea. The chemical and stable carbon isotopic composition shows that the hydrate-bound gas was a mixture of thermogenic and microbial gases. It is estimated that microbial gas accounts for 40.96% to 60.58%, showing a trend of decrease with the increase in burial depth. A significant amount of gas hydrates is thought to be stored in the mass transport deposits (MTDs), exhibiting vertical superposition characteristics. The stable carbon isotopic values of methane (δ13C1) in the MTD1, located near the seabed, are less than −55‰, while those of the methane below the bottom boundary of MTD3 are all higher than −55‰. The pure structure I (sI) and structure II (sII) gas hydrates were discovered at the depths of 8 mbsf and 145.65 mbsf, respectively, with mixed sI and sII gas hydrates occurring in the depth range 58–144 mbsf. In addition, a series of indigenous organic matters and allochthonous hydrocarbons were extracted from the hydrate-bearing sediments, which were characterized by the origin of immature terrigenous organic matter and low-moderate mature marine algal/bacterial materials, respectively. More allochthonous (migrated) hydrocarbons were also discovered in the sediments below the bottom boundary of MTD3. The gas hydrated is “wet gas” characterized by a low C1/(C2 + C3) ratio, from 2.55 to 43.33, which was mainly derived from a deeply buried source kitchen at a mature stage. There is change in the heterogeneity between the compositions of gas and biomarkers at the site GMGS5-W08 along the depth and there is generally a higher proportion of thermogenic hydrocarbons at the bottom boundary of each MTDs, which indicates a varying contribution of deeply buried thermogenic hydrocarbons. Our results indicate that the MTDs played a blocking role in regulating the vertical transportation of hydrate-related gases and affect the distribution of gas hydrate accumulation in the QDNB.

1. Introduction

Natural gas hydrate was formed by methane-dominated hydrocarbon gas and water in the gas hydrate stability zone in low-temperature and high-pressure conditions [1,2,3,4]. They preferentially occurred in shallowly buried subsea sediments or in permeable rocks in the land tundra [4]. The total carbon fixed in the form of natural gas hydrate is enormous, which is almost twice as much as the conventional fossil fuels [5]. Recently, natural gas hydrates have received increasing attention worldwide because of their significant carbon storage capability and their potential as a new energy resource [6]. A total of six natural gas hydrate drilling expeditions were conducted in the South China Sea (SCS) by the Guangzhou Marine Geological Survey (GMGS) between 2007 and 2019 [7,8,9,10,11]. During the fifth natural gas hydrate drilling expedition (GMGS5) in 2018, a complex gas hydrate system that was characterized by abundant visible vein-like and massive gas hydrates was discovered in the Songnan low-uplift block of the western Qiongdongnan Basin (QDNB) [8,10,11,12].
In the past five years, a series of geological and geochemical investigations have been conducted to interpret the accumulation process and mechanism of the typical leakage-type gas hydrates at the site GMGS5-W08 in the QDNB [8,12,13,14]. These hydrates predominantly originate from deeply buried coaly type thermogenic gas sources via effective faults [8,12,13,14]. Organic geochemical and Raman spectroscopic results suggest that the gas hydrates at the site GMGS5-W08 are a mixture of structure I (sI) and structure II (sII) gas hydrates derived from both the thermogenic and microbial gas sources. Variations in the proportions of these gases along the depth profile result in distinct sI and sII hydrate distributions [11,13,15]. The microbial gas and coaly type thermogenic gas migrated upward to the gas hydrates stability zone through the combination of faults, gas chimneys, and pipe-like gas pathways [10,13,16,17,18,19]. Gas chimneys, acting as migration conduits, are formed due to high-pressure conditions from Oligocene thermogenic and Miocene microbial gas accumulations [10,12,13,14,18,20,21]. In the deep-water sedimentary system, including central channel sedimentary systems, curved channels, and mass transport deposits (MTDs) [22]. Three sets of MTDs have been identified using seismic and logging data and are characterized via vertical superposition and fracture development. The three MTDs are buried at depths of 0–58 mbsf, 58–98 mbsf, and 98–143 mbsf, respectively, and are potential storage spaces for leakage-type gas hydrates. The bottom boundaries of each MTD are shown in the Figure 1b,c.
Notably, the geochemical characteristics of hydrate-related gas and sediments at the site GMGS5-W08 show a strong vertical heterogeneity. For example, the proportion of methane within the hydrate gas gradually decreased with the increase in buried depth [7]. However, the characteristics of the vertical geochemical heterogeneity and its controlling factors have not yet been fully understood. On the basis of the systematic geochemical analyses of hydrate-related gas and sediment samples from 0 mbsf to 188 mbsf, and with the relevant results of previous studies, this paper aims to study the origin of hydrate-related hydrocarbons and the hydrocarbons’ evolution during migration at the site GMGS5-W08. Our results reveal a comprehensive control of the effect on natural gas hydrate geochemistry via multiple factors, including gas sources, gas migration, and overlay cap rocks, which may be highly significant for the exploration of natural gas hydrates in this region.

2. Geological Setting

The QDNB is a Cenozoic extensional basin located in the southeast of the Hainan Island (Figure 1a) [13,14,15,16,17,18,19,20,21,22,23,24]. The basin underwent the Eocene–Oligocene rifting and the Neogene–Quaternary depression structural evolution stages, in which four significant tectonic events, i.e., the Shenhu, Zhujiang, Nanhai, and Dongsha movements, have been further identified [19,25,26,27]. The deep-water area in the QDNB has been divided into five third-order tectonic units, including the Songnan-Baodao, Lingshui, and Beijiao sags, and the Songnan and Lingnan low uplifts. The QDNB was filled by eight formations (from bottom to top), including the Eocene, lower Oligocene Yacheng Formation, upper Oligocene Lingshui Formation, lower Miocene Sanya Formation, middle Miocene Meishan Formation, upper Miocene Huangliu Formation, Pliocene Yinggehai Formation, and Quaternary Ledong Formation (Figure 2) [19,21,27]. Two sets of source rocks, i.e., the Oligocene marine and continental transitional source rocks (Yacheng and Lingshui Formations), and the Miocene marine source rock (Sanya and Meishan Formations), have been found in the QDNB. Several natural gas fields with huge reserves have been reported in the Meishan and Huangliu Formation sandstone reservoirs of the Miocene submarine Central Canyon System, such as the LS17-2, L18-1, and L25-1 gas fields [28,29,30,31,32,33]. The coal-bearing mudstones in the Yacheng and Lingshui Formations were the main source rocks [30,31,34,35], and the thick marine mudstones within the Miocene and Pliocene formations are considered to be the regional cap rocks of the conventional petroleum system [23,31,33,36].
During the GMGS5 and GMGS6 expeditions, a large amount of visible vein, nodular, and massive gas hydrates were discovered in the QDNB [7,12,13,14,19,22]. A large number of gas hydrate samples were drilled and obtained at site GMGS5-W08 in 2018 [7,8,12].

3. Samples and Methods

3.1. Sample Collection

A total of 20 hydrate-related gas samples were obtained from 0 mbsf to 188 mbsf at the site GMGS-W08 in the QDNB, including 4 samples during the depressurization of pressurized cores and 16 hydrate-bound gas samples. All the hydrate-related gas samples were obtained and stored following the experimental method reported by Lai et al. [14].
In addition, a total of 11 core samples of clayey silt sediment were collected at the site GMGS5-W08, with a burial depth ranging from 0 mbsf to 188 mbsf. All sediment samples were wrapped in aluminum foil and stored at a temperature of −20 °C.

3.2. Geochemical Experiments of Gas Samples

The gas compositions were analyzed using an Agilent 7890A (Santa Clara, CA, USA) gas chromatograph equipped with an HP-PLOT Q capillary column and flame ionization detector, following the standards set by Lai et al. [14]. In addition, the stable carbon and hydrogen isotopes were determined using a gas chromatography−isotope ratio mass spectrometry system (GC-IR-IRMS, Thermo Finnigan MAT 253, San Jose, CA, USA) with the same capillary column as used in the Agilent 7890A gas chromatograph.

3.3. Geochemical Experiments of Sediments

3.3.1. Total Organic Carbon Analyses

The 11 rock core samples were initially dried by freezing at a temperature of −80 °C. After freeze drying, they were crushed to 80 mesh using an agate mortar. These powdered samples were stored at −20 °C for subsequent analysis and testing. To remove inorganic carbon, the powdered samples were treated with hydrochloric acid (1.5 mol/L). They were then washed with deionized water for 48 h and subsequently dried at 80 °C for 24 h in an oven. The total organic carbon (TOC) content was determined using an LECO CS-230 carbon/sulfur analyzer.

3.3.2. Rock-Eval Pyrolysis Analyses

Rock-Eval pyrolysis, following the procedure outlined by Espitali’e et al. [37] and conducted using the OGE-VI rock pyrolyzer, was employed to assess the bulk geochemical properties of 11 sedimentary rock samples. This analysis focused on four key parameters: S1, S2, S3, and Tmax. S1 quantifies extractable hydrocarbon compounds released during pyrolysis, S2 measures the hydrocarbons generated and retained post pyrolysis, S3 signifies CO2 emissions during pyrolysis, and Tmax indicates the maximum temperature for hydrocarbon generation during organic matter thermal maturation.

3.3.3. Extractable Organic Matter (EOM) and Gas Chromatography–Mass Spectrometry (GC–MS)

The 11 samples underwent a 72 h extraction in a Soxhlet apparatus using a dichloromethane/methanol (DCM/MeOH) solvent mixture (9:1, v/v). Initially, asphalt removal was achieved with petroleum ether at room temperature over 12 h. Subsequently, a silica/alumina column separation was employed to isolate saturated and aromatic hydrocarbon fractions from the deasphalting extract, using petroleum ether and a mixture of petroleum ether and dichloromethane (2:1, v/v), respectively. Analysis of these fractions was performed using Agilent 5975i and Agilent 5977i GC–MS systems, following the procedures and conditions described by Lai et al. [14]. All geochemical experiments on the core samples were conducted at the National Key Laboratory of Petroleum Resources and Engineering, China University of Petroleum (Beijing), Beijing, China.

4. Results

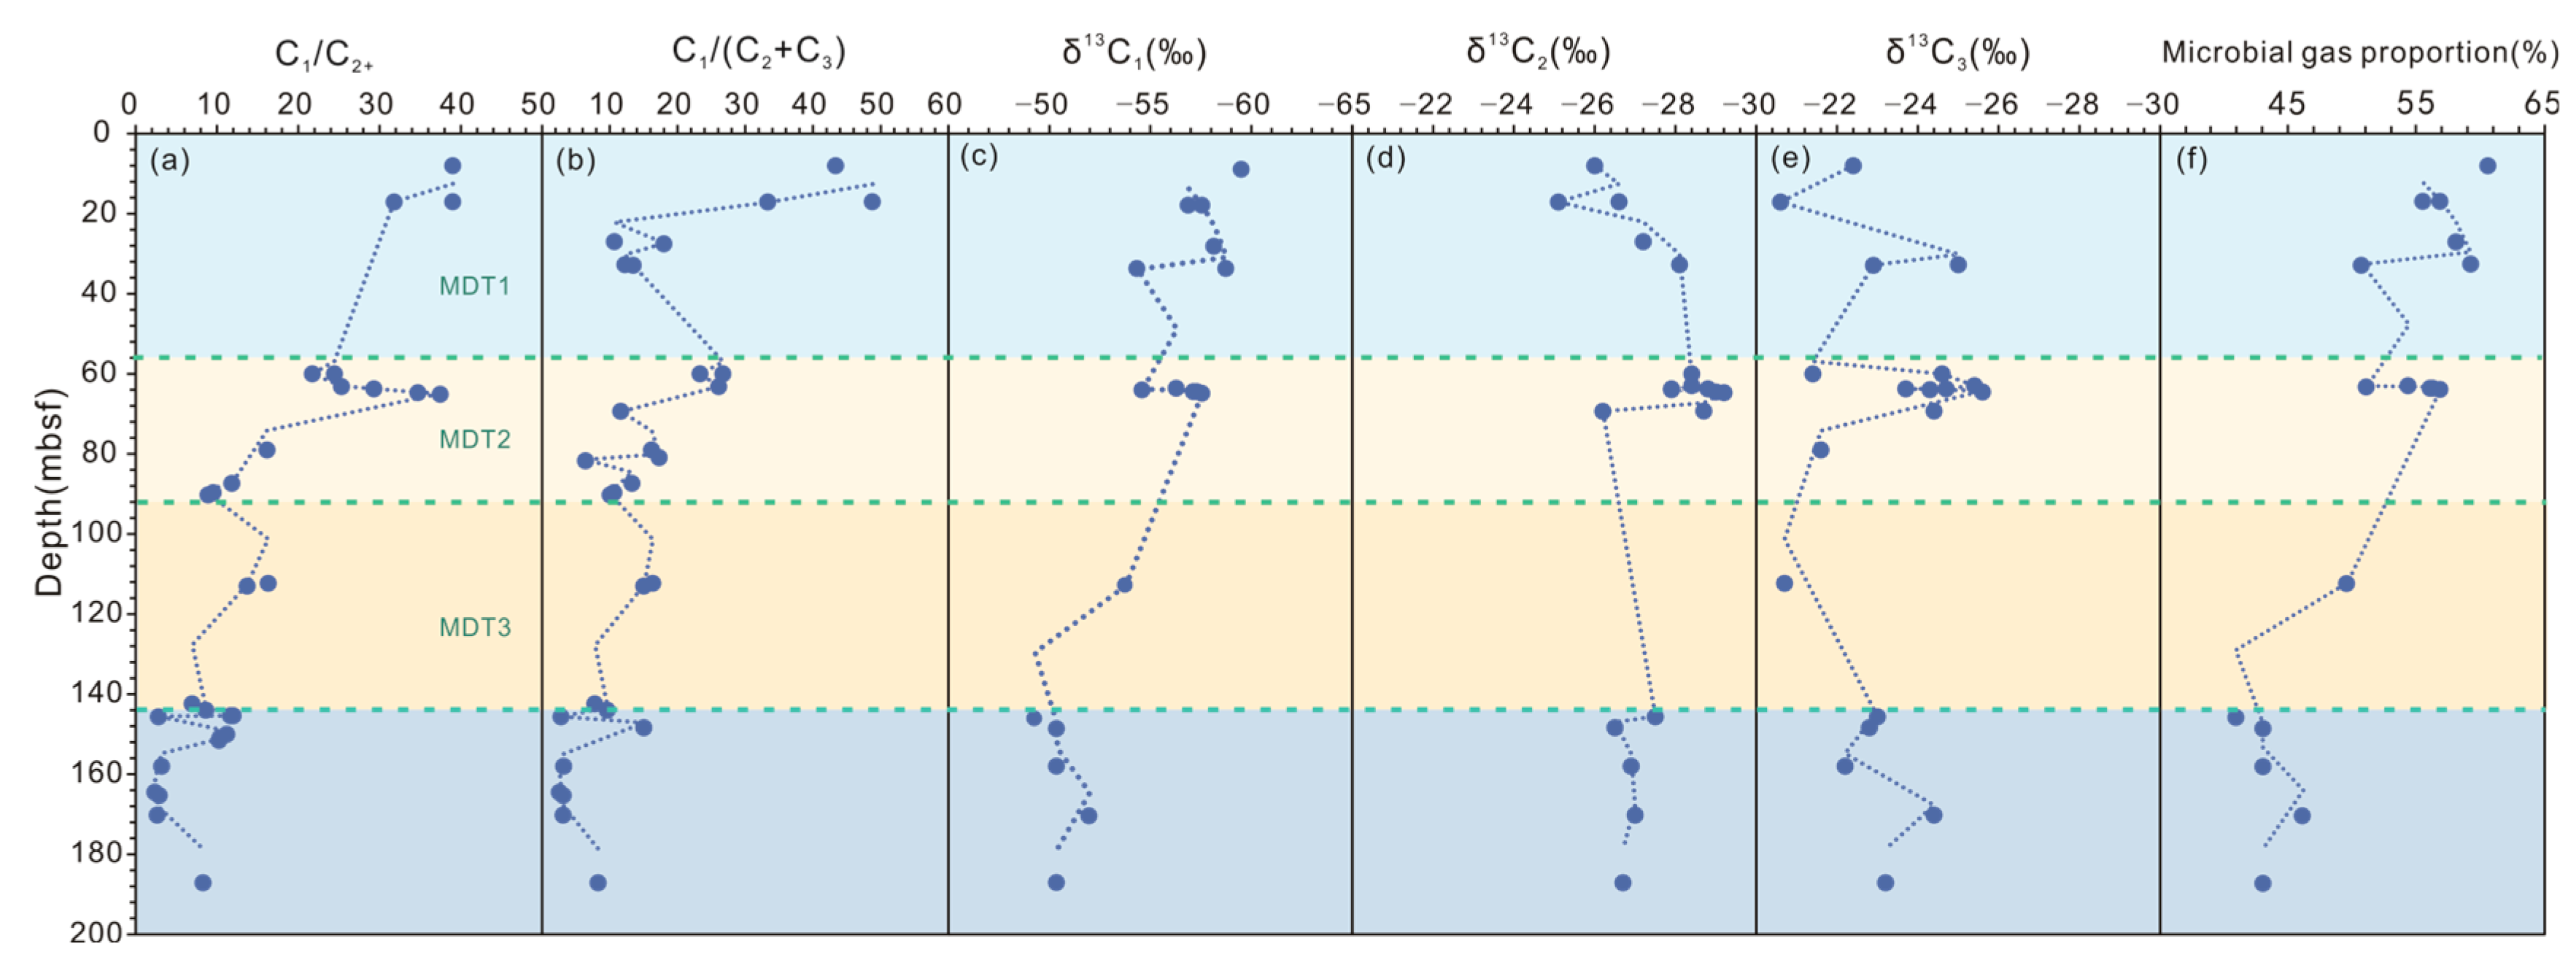
4.1. The Geochemical Characteristics of Natural Gas

Table 1 presents the compositional analysis of three gas hydrate samples and 17 collected gas data, detailing both gaseous hydrocarbon compositions and stable carbon isotope compositions. The predominant component is methane (C1), ranging from 70.1% to 97.5%, followed by moderate levels of ethane (C2) (2.2% to 18.5%) and propane (C3) (0.05% to 11.3%). Higher carbon number hydrocarbons (C3+) are present in limited quantities, ranging from 0% to 4.10%. Notably, the C1/(C2 + C3) ratio varies from 2.55 to 43.33. In addition, the values of stable carbon isotopes of C113C1), C213C2), and C313C3), range from −63.7‰ to −49.3‰, −29.2‰ to −22‰, and −24.6‰ to −20.6‰, respectively. Furthermore, the hydrogen isotope value of C1 (δD1) ranges from −181‰ to −171‰.

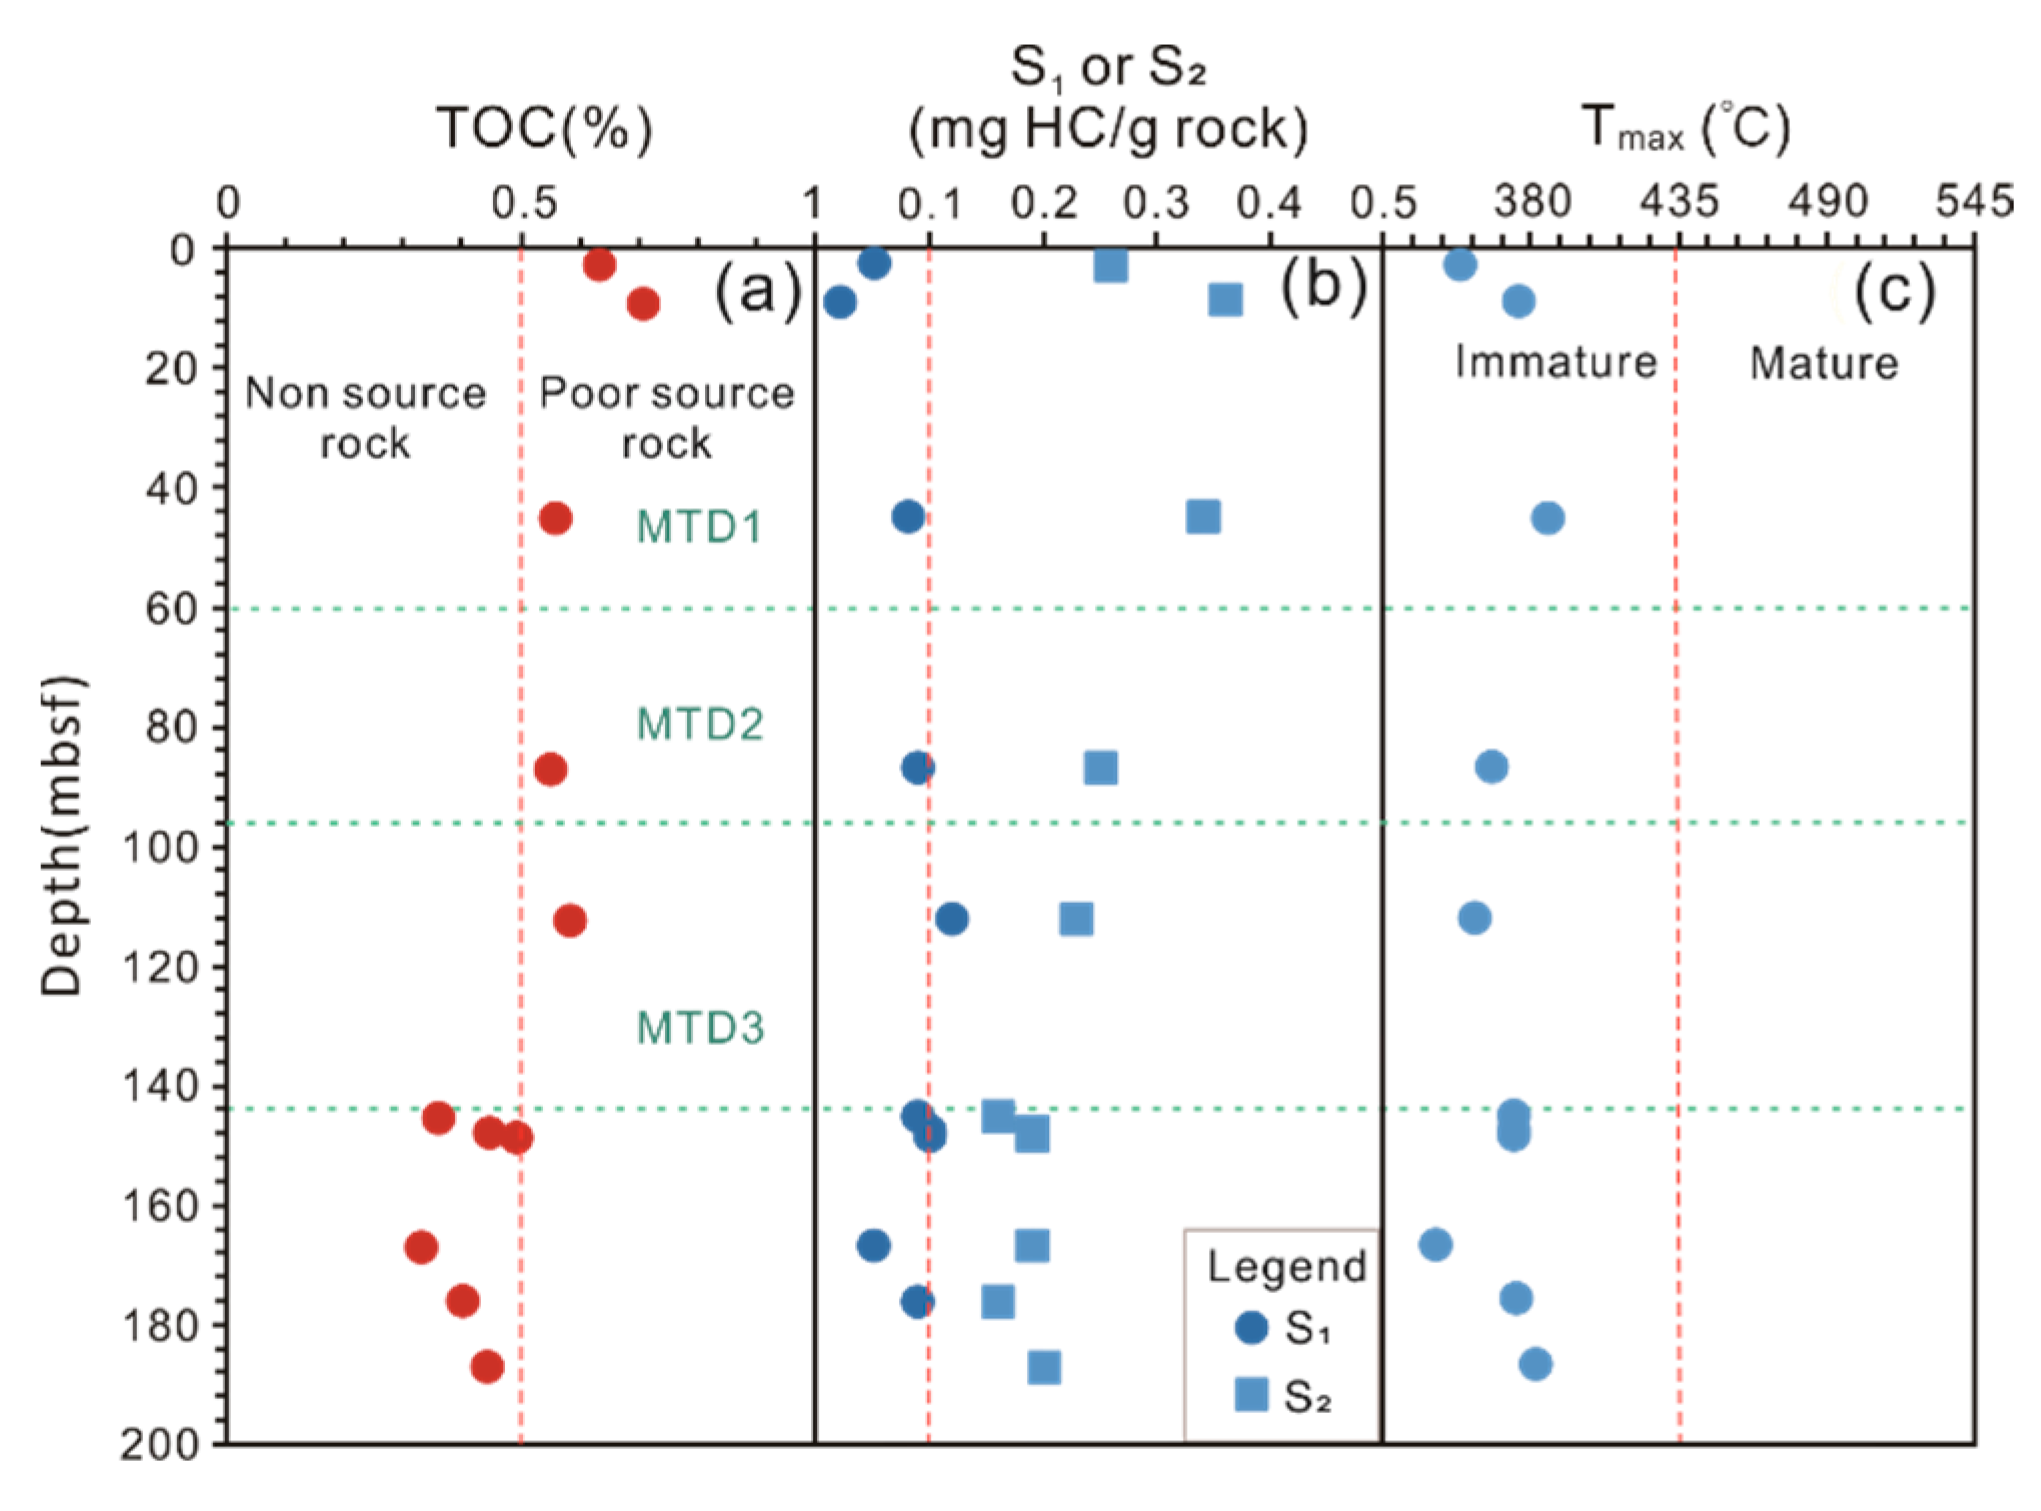
4.2. Bulk Geochemical Properties of Sediments

Table 2 presents the TOC contents and pyrolysis parameters of the 11 sediment samples. The TOC contents exhibit remarkably low values, ranging from 0.29% to 0.71%, with an average of 0.48%. The measured pyrolysis parameters, including S1, S2, and Tmax, also exhibit notably low values, with averages of 0.06 mg/g, 0.23 mg/g, and 367 °C, respectively. In contrast, the values of S3 are remarkably high, ranging from 1.12 to 1.57 mg/g, with an average of 1.29 mg/g. The calculated pyrolysis parameters hydrocarbon index (HI), oxygen index (OI), and production index (PI), range from 25.76 to 67.78 mg HC/g TOC, 221.75 to 444.14 mg CO2/g TOC, and 0.05 to 0.36, respectively.

4.3. The Compositions of Biomarkers

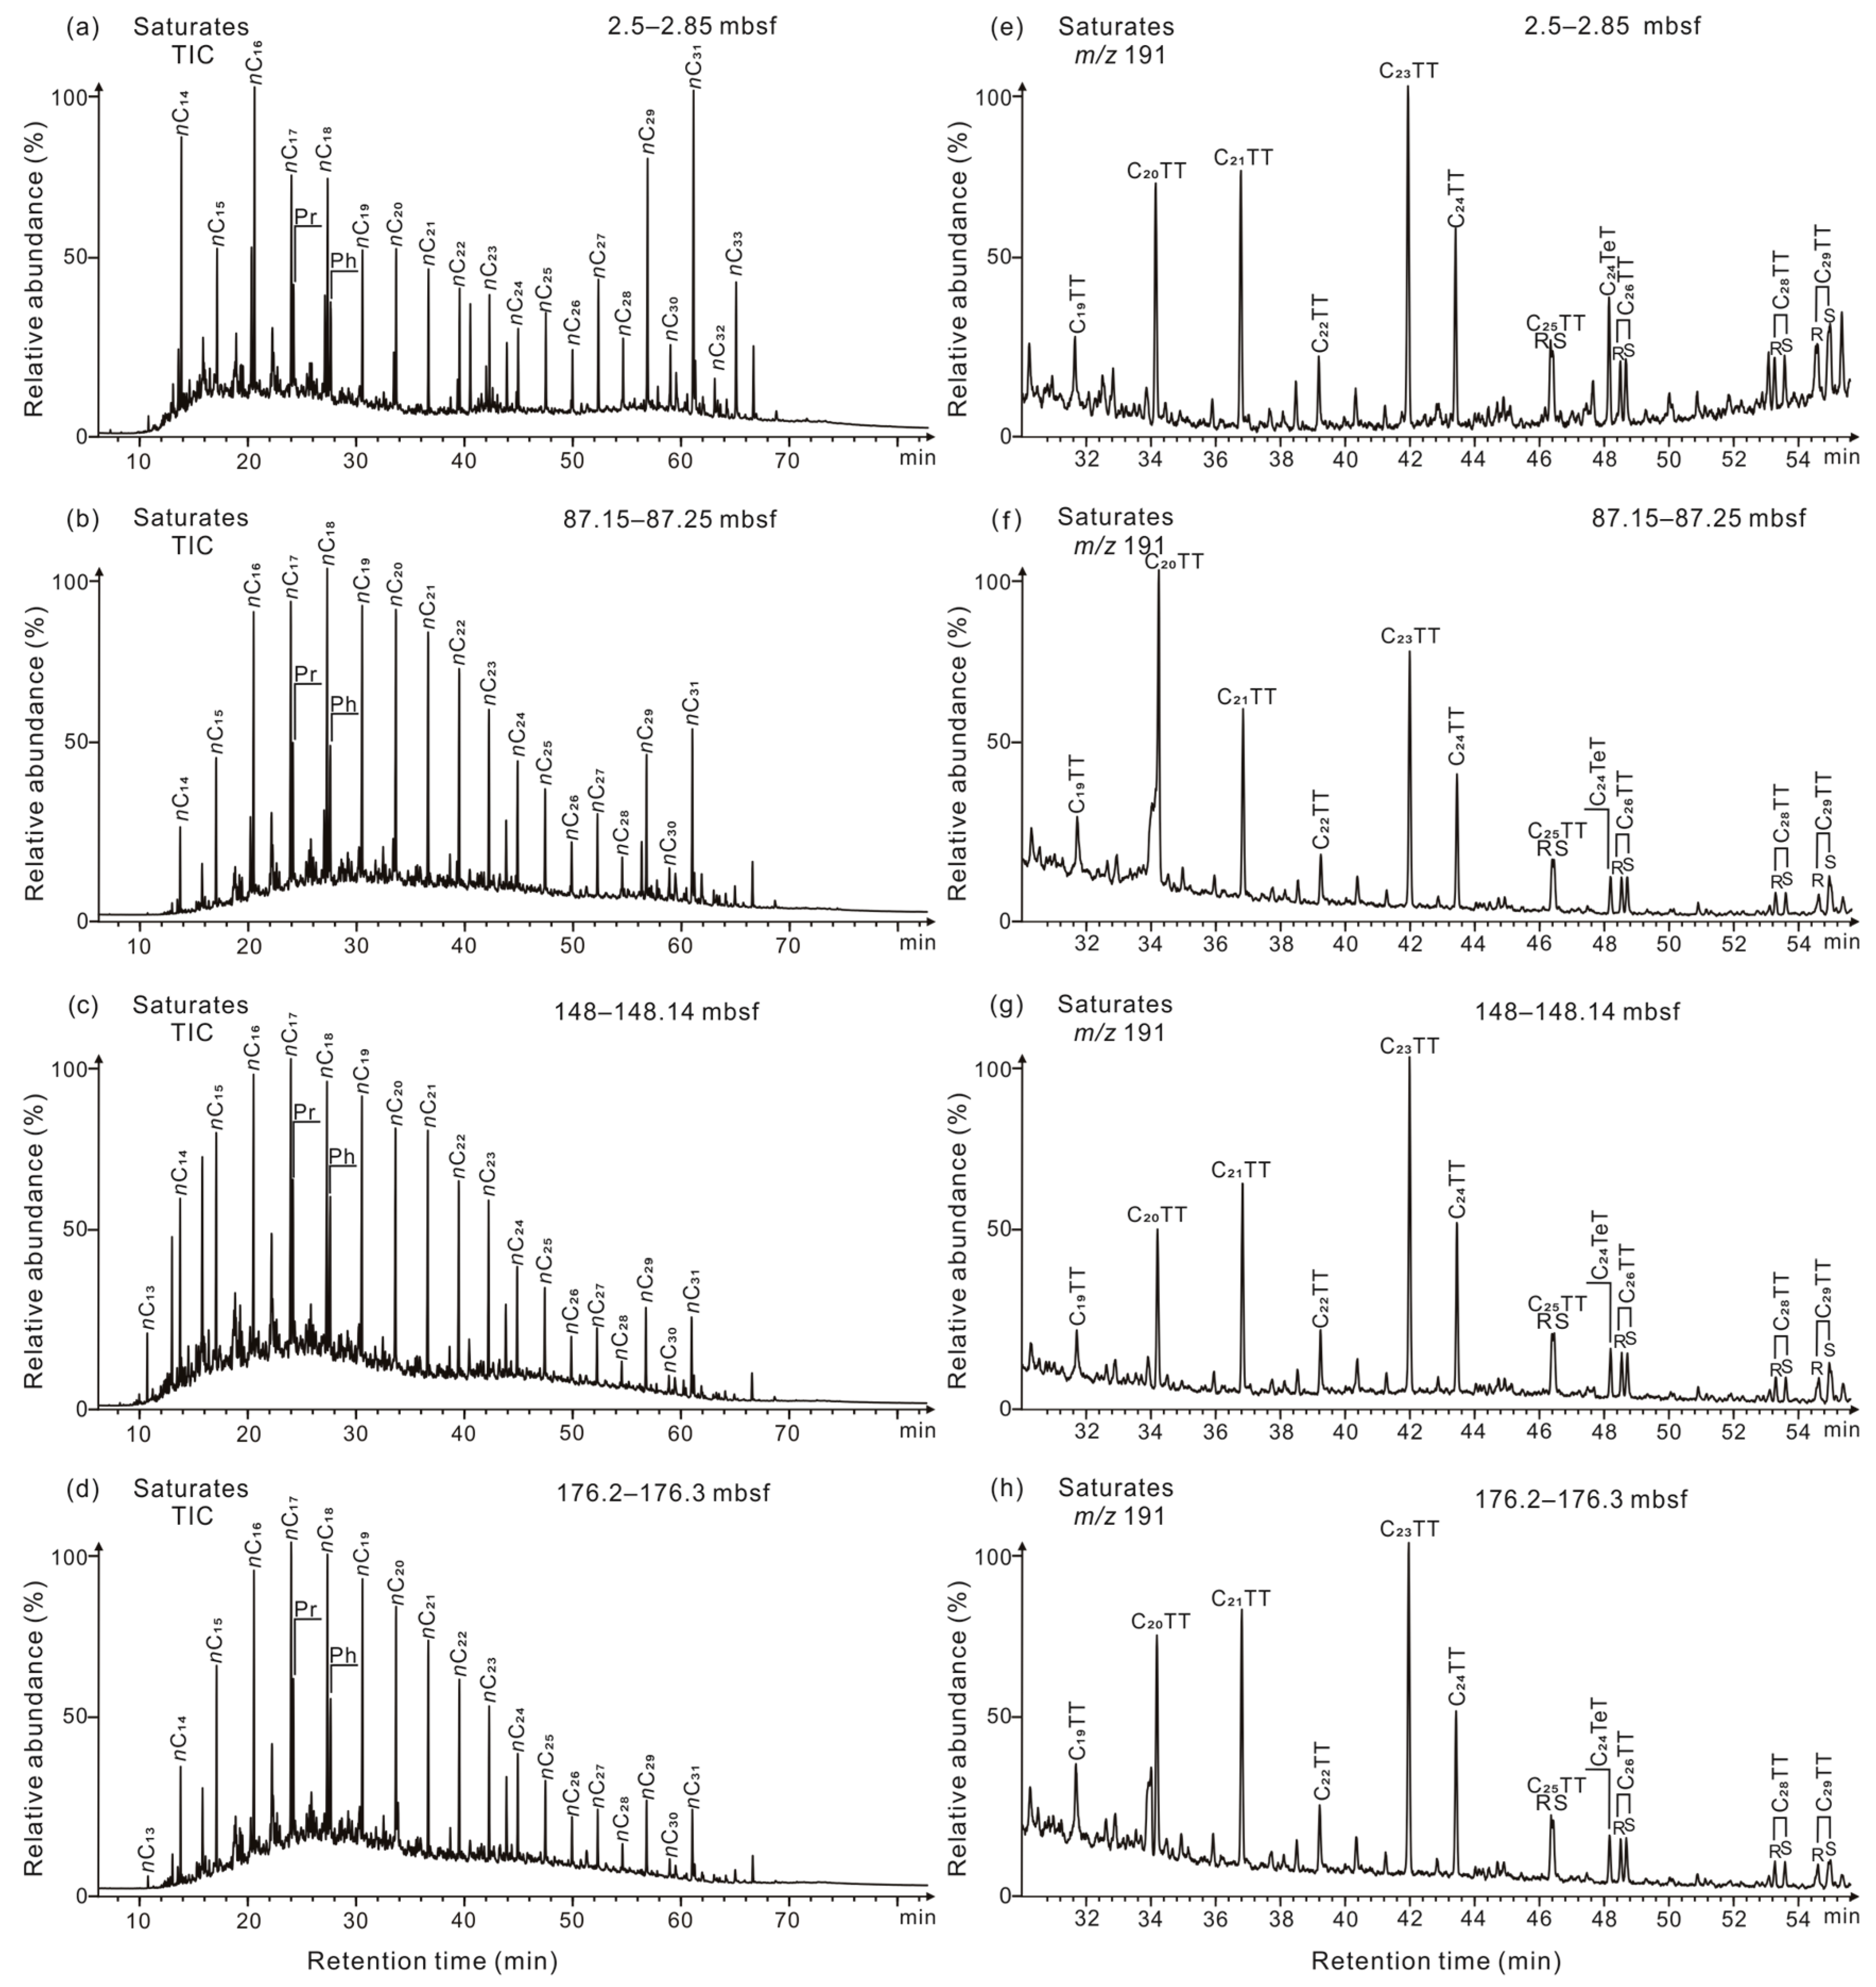
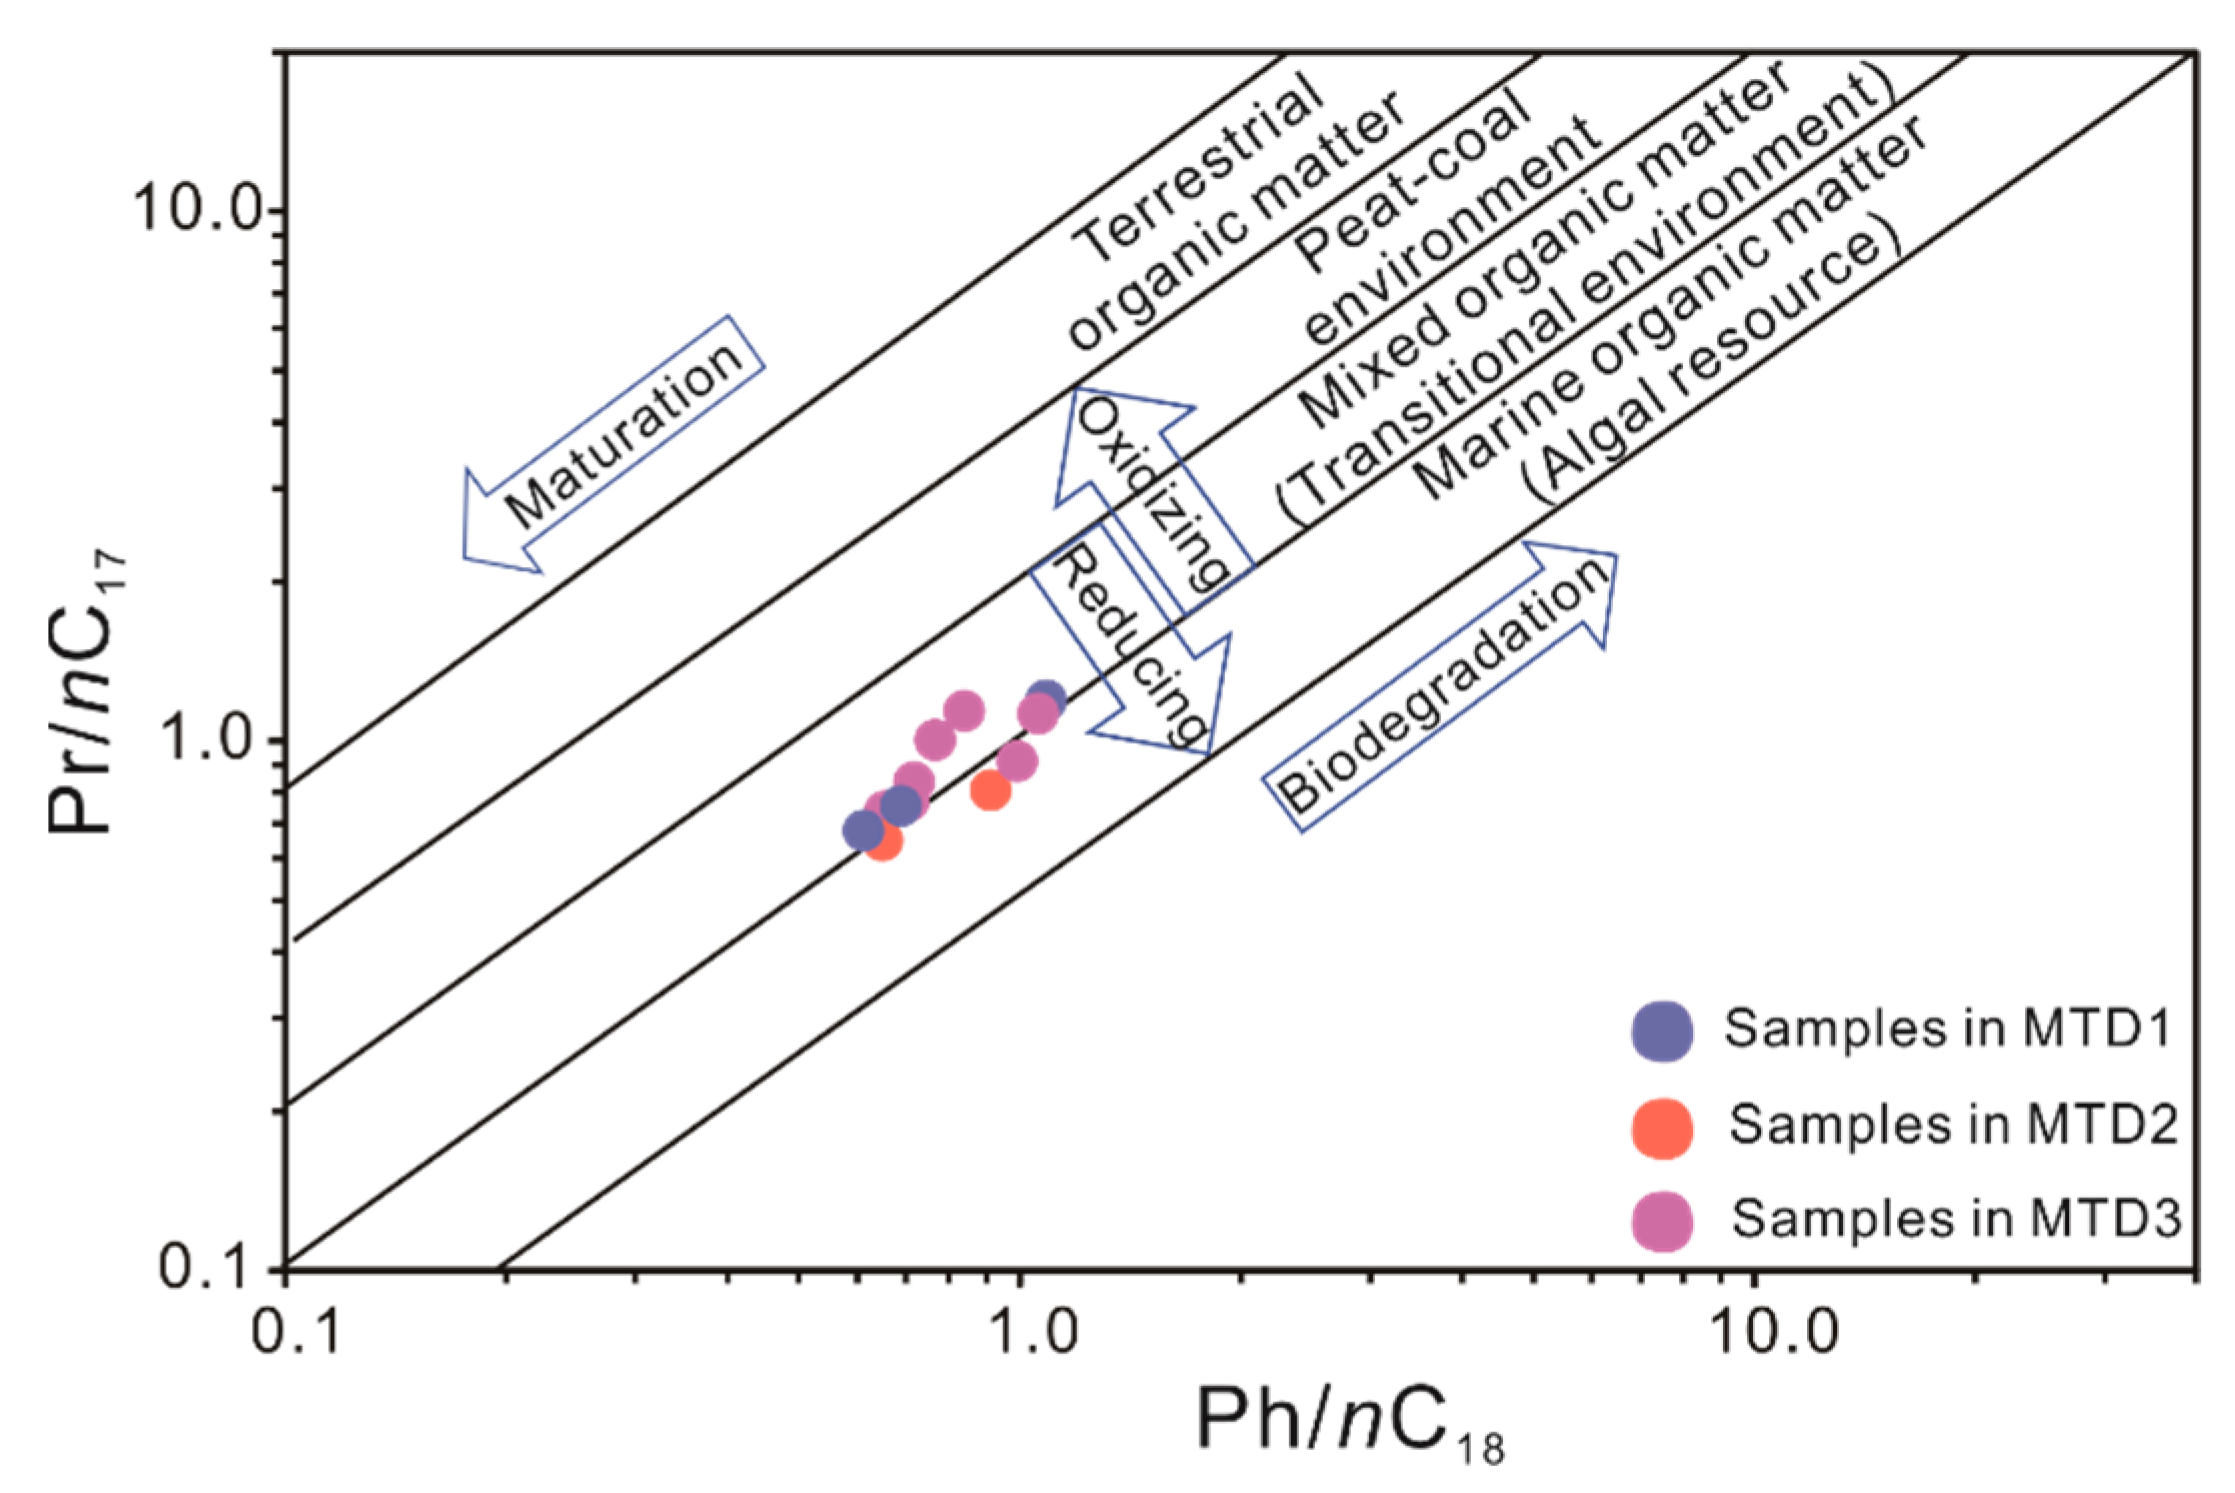
4.3.1. Normal Alkanes and Acyclic Isoprenoids

The total ion current (TIC) of the saturated hydrocarbon displays a distribution pattern of n-alkanes ranging from nC14 to nC35 (Figure 3a–d). Significant odd-to-even preference (OEP, 0.65 < OEP < 2.26) and high carbon preference index (CPI, 0.86 < CPI < 2.02) are observed in the nC23 to nC35 range (Table 3). In addition, the ratios of pristane to phytane (Pr/Ph), Pr/nC17, and Ph/nC18 vary between 0.22 to 1.30, 0.65 to 1.00, and 0.61 to 0.77, respectively.

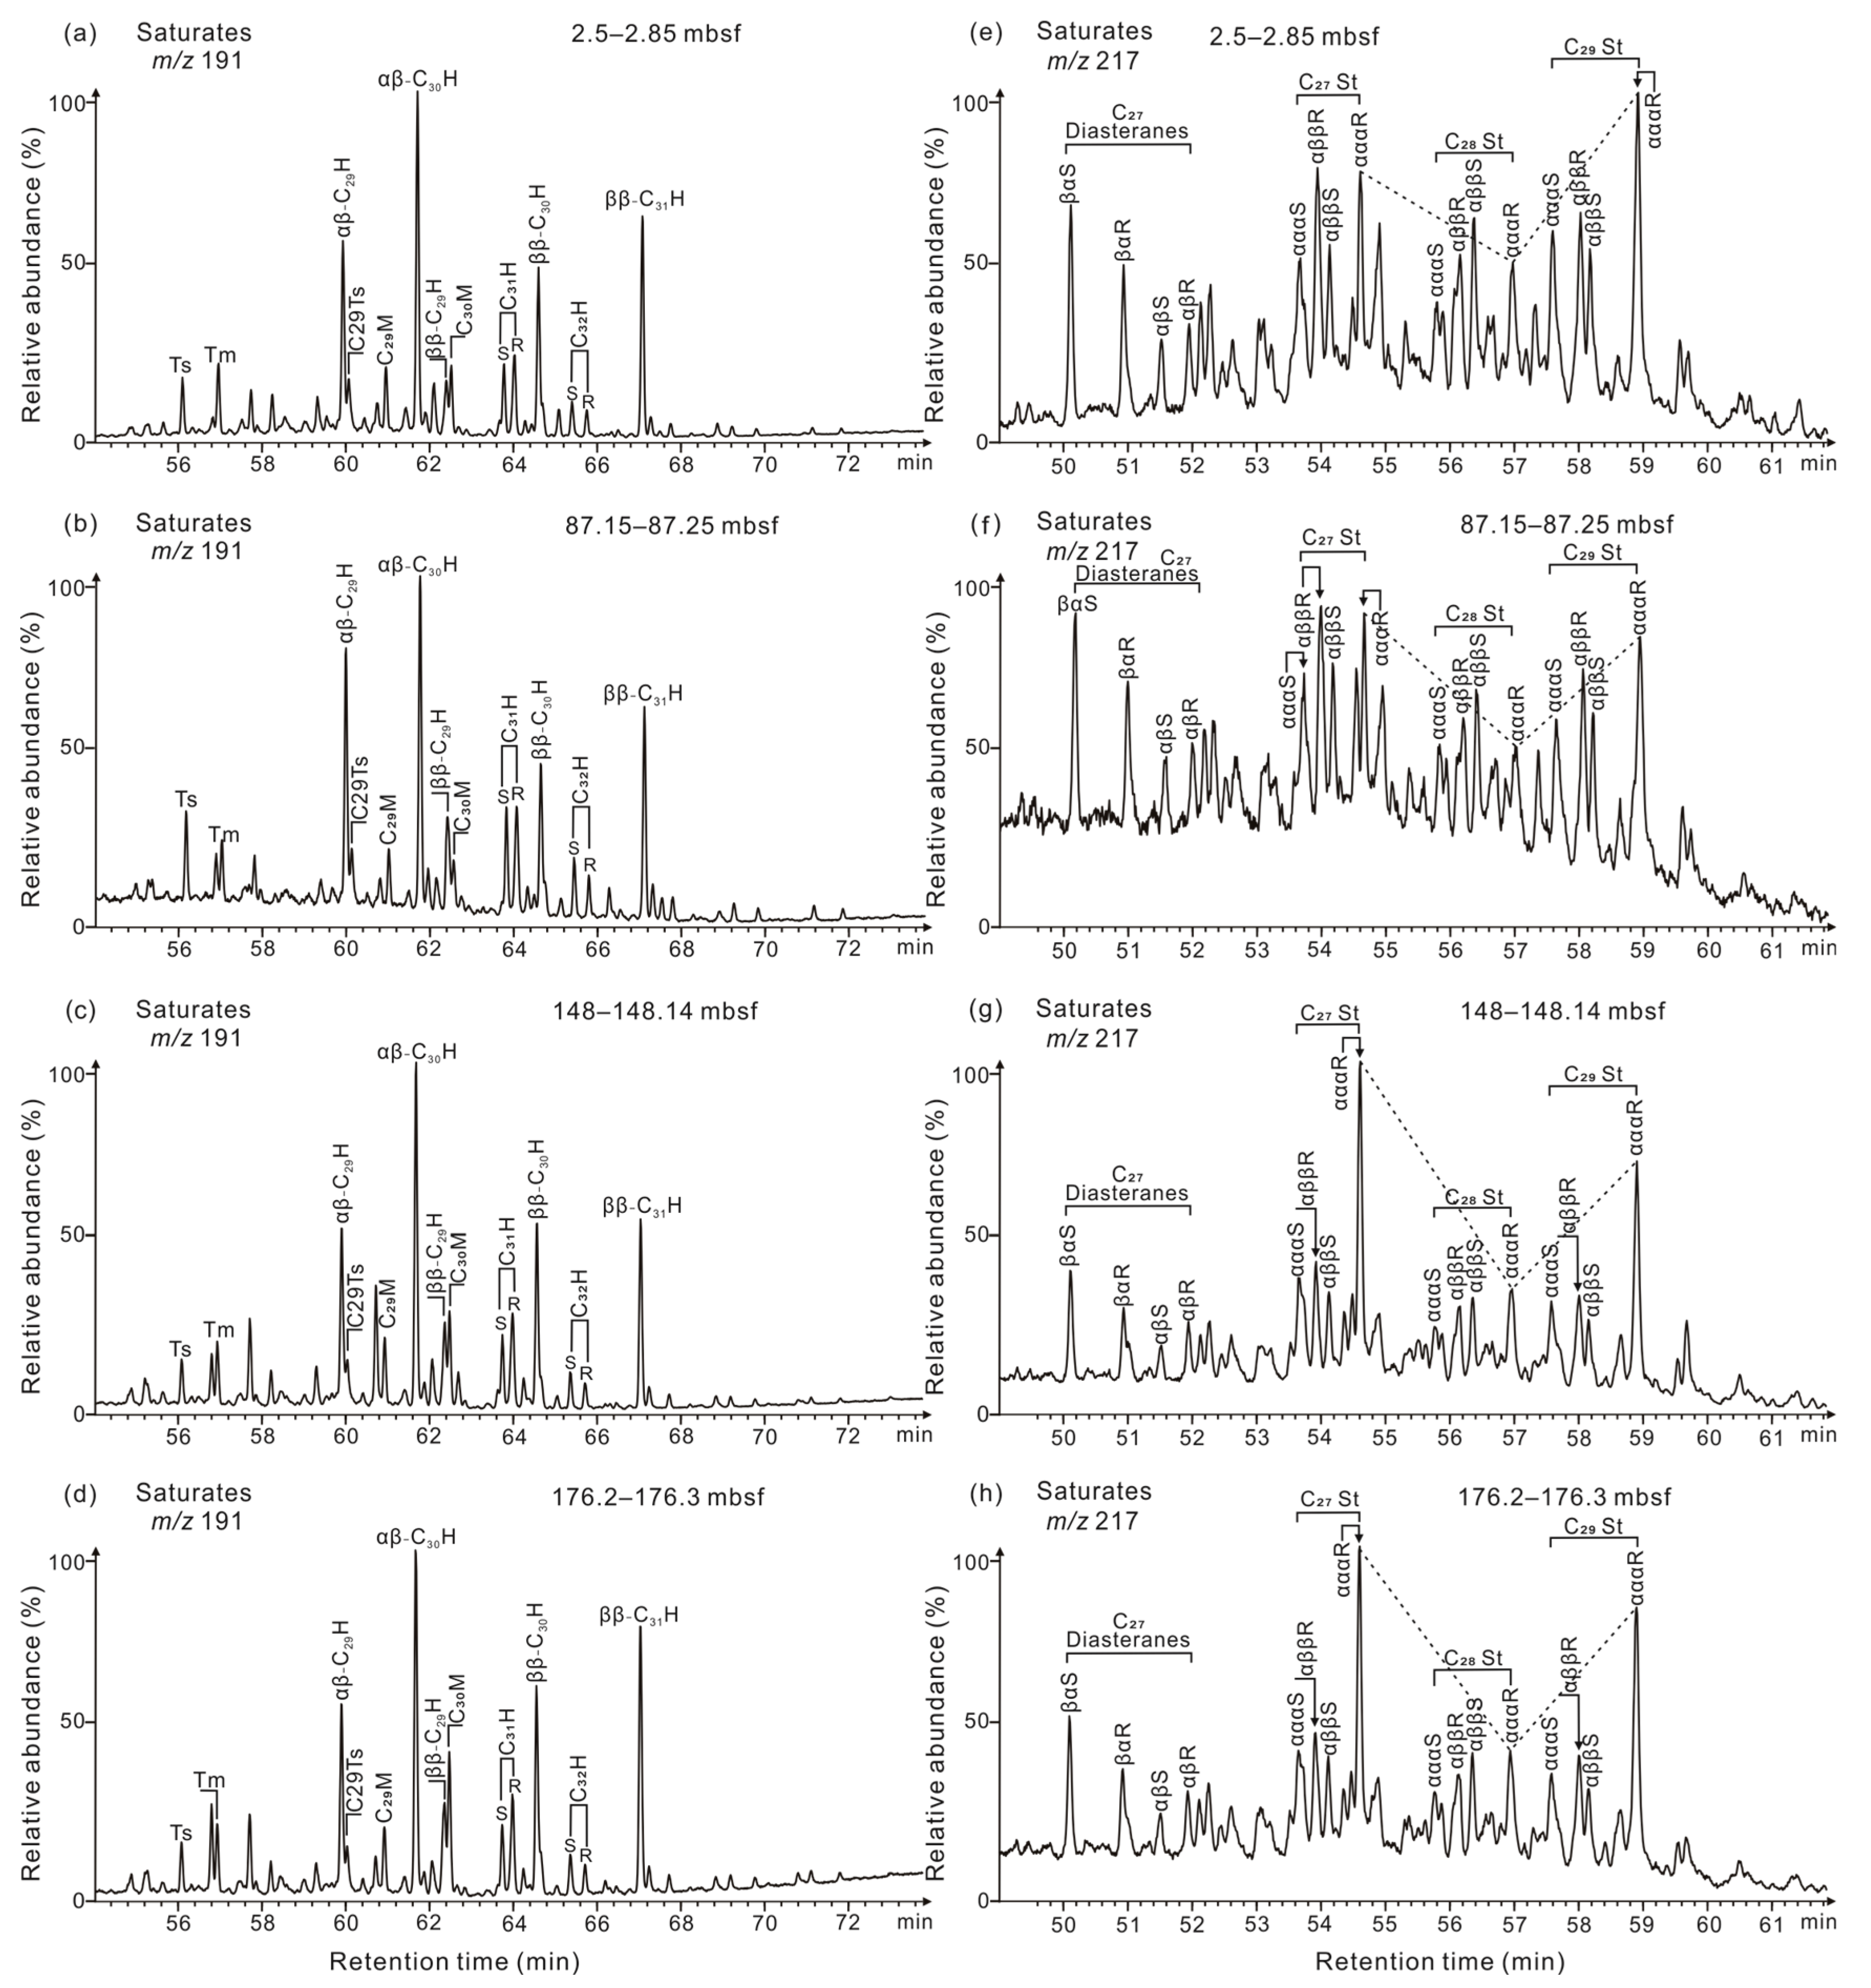
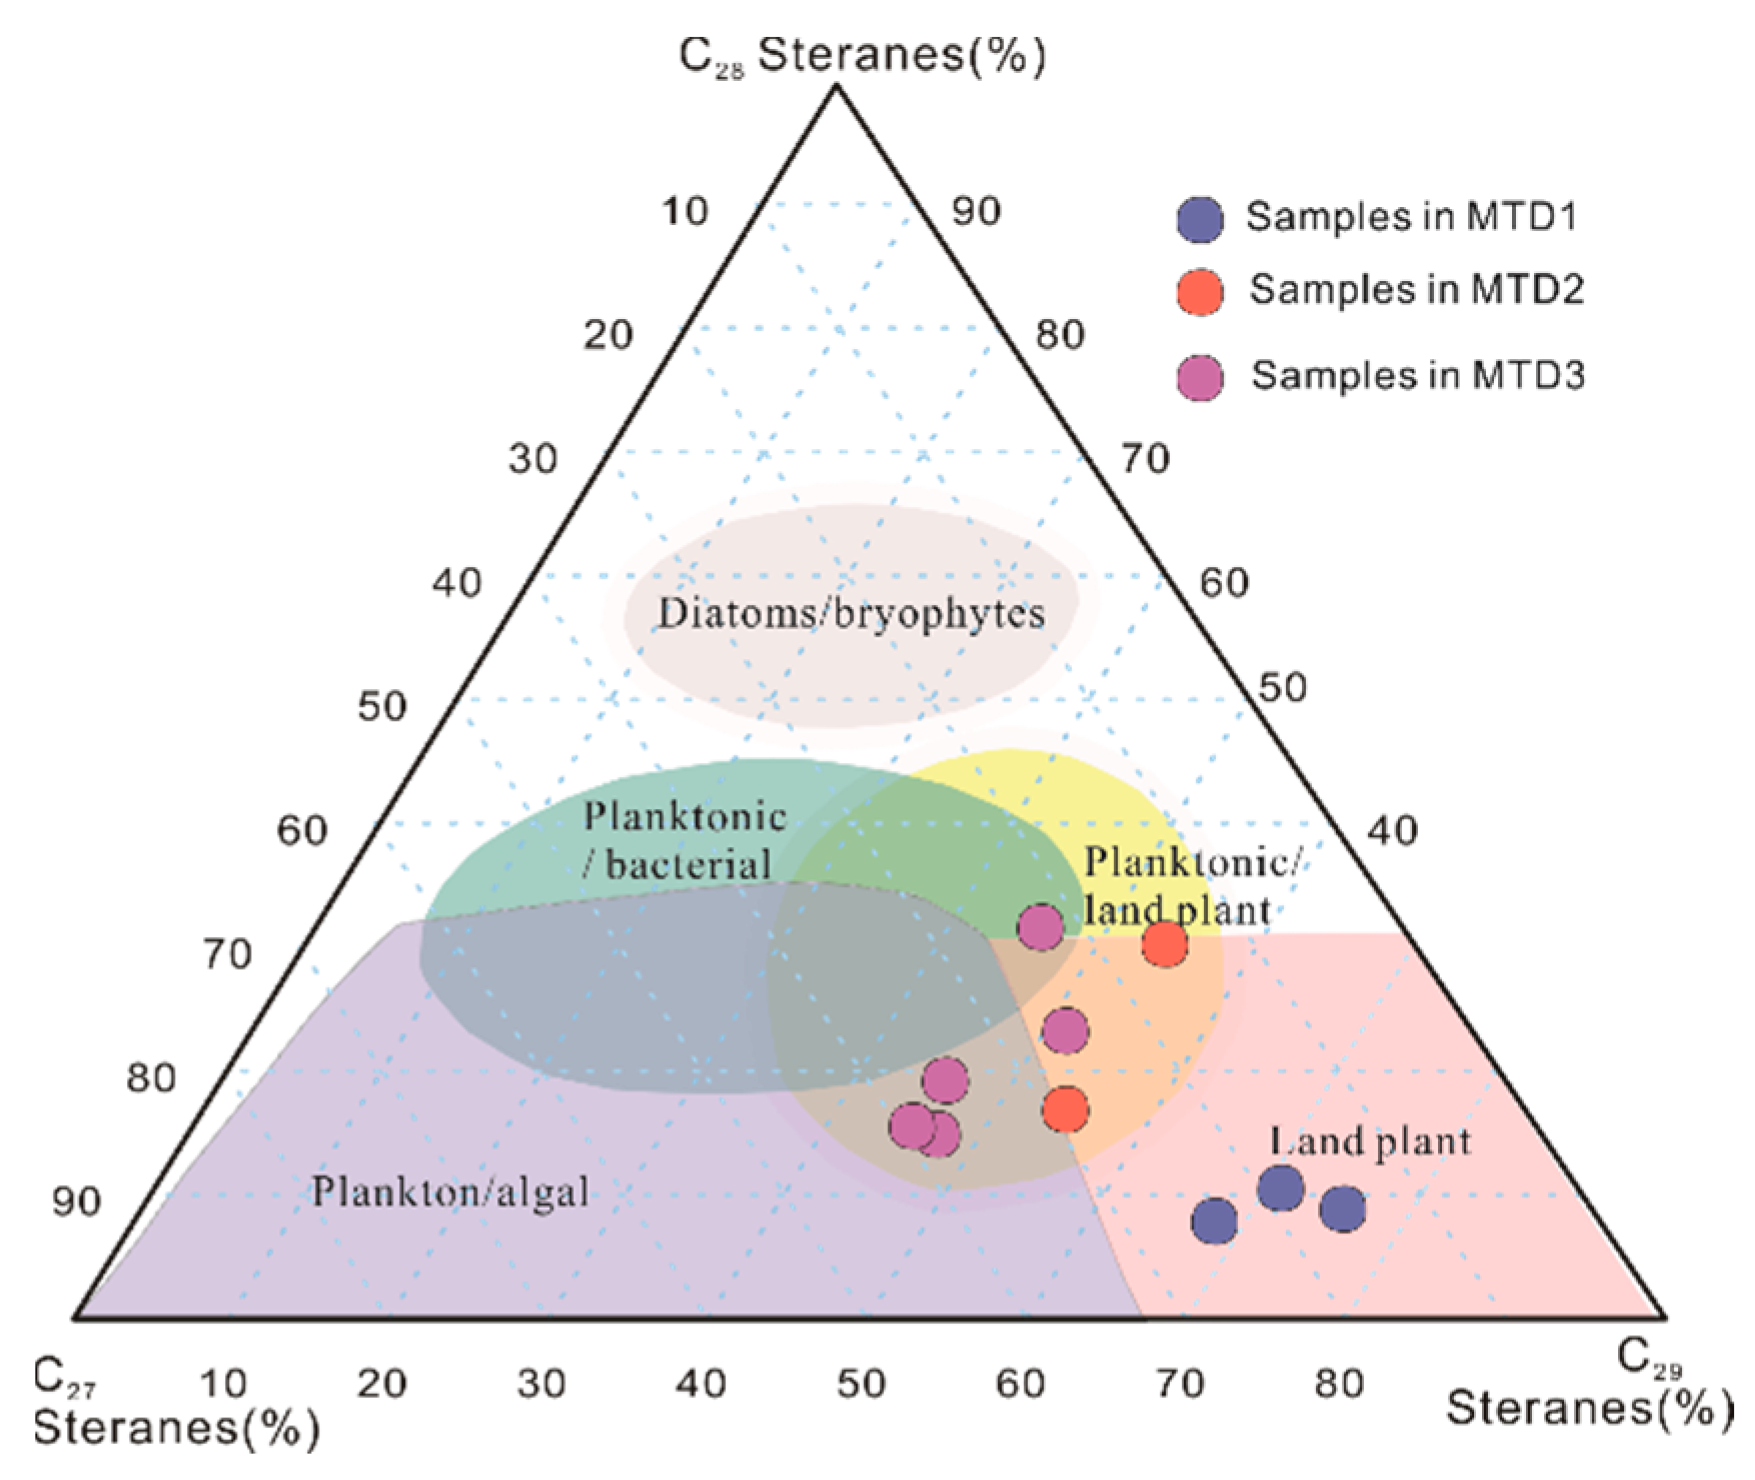
4.3.2. Tricyclic Terpanes, Hopanes, and Steranes

A series of tricyclic terpanes (TTs), tetracyclic terpanes (TeT) (Figure 3e–h), and hopane series (Figure 4a–d) in EOM are detected in the m/z 191 mass chromatograms. The ratios of C23TT to C21TT and C24TeT to C26TT range from 1.32 to 2.24 and 0.49 to 1.11, respectively (Table 3). Within the distribution patterns of the hopane series, a dominance of C30 hopane (C30H) and C29H, and a high abundance of biological configuration isomers 17β(H), 21β(H)-C29-31H (ββ-C29-31H) were observed (Figure 4a–d). In addition, the 18α(H)-22,29,30-trisnorhopane (Ts) is slightly less abundant than the 17α(H)-22,29,30-trisnorhopane (Tm), with Ts/(Ts + Tm) ratios ranging from 0.40 to 0.70 (Table 3). All the samples have an extremely low abundance of gammacerane (Ga), oleanane (OL), and C33–35 homohopanes (Figure 4a–d).
In the m/z 217 mass chromatograms (Figure 4e–h), numerous sterane homologues have been identified. The C27 diasteranes are present in relatively high abundance, with C27 diasteranes/C27 regular steranes ratios ranging from 0.29 to 0.75 and an average of 0.59 (Table 3). Furthermore, the distribution pattern of C27 to C29 regular steranes appears to follow a distinctive V-shaped to L-shaped trend (Figure 4e–h). The ααα C2920S/(20S + 20R) index and C29ββ/(ββ + αα) index vary between 0.27 to 0.58 and 0.27 to 0.47, respectively (Table 3).

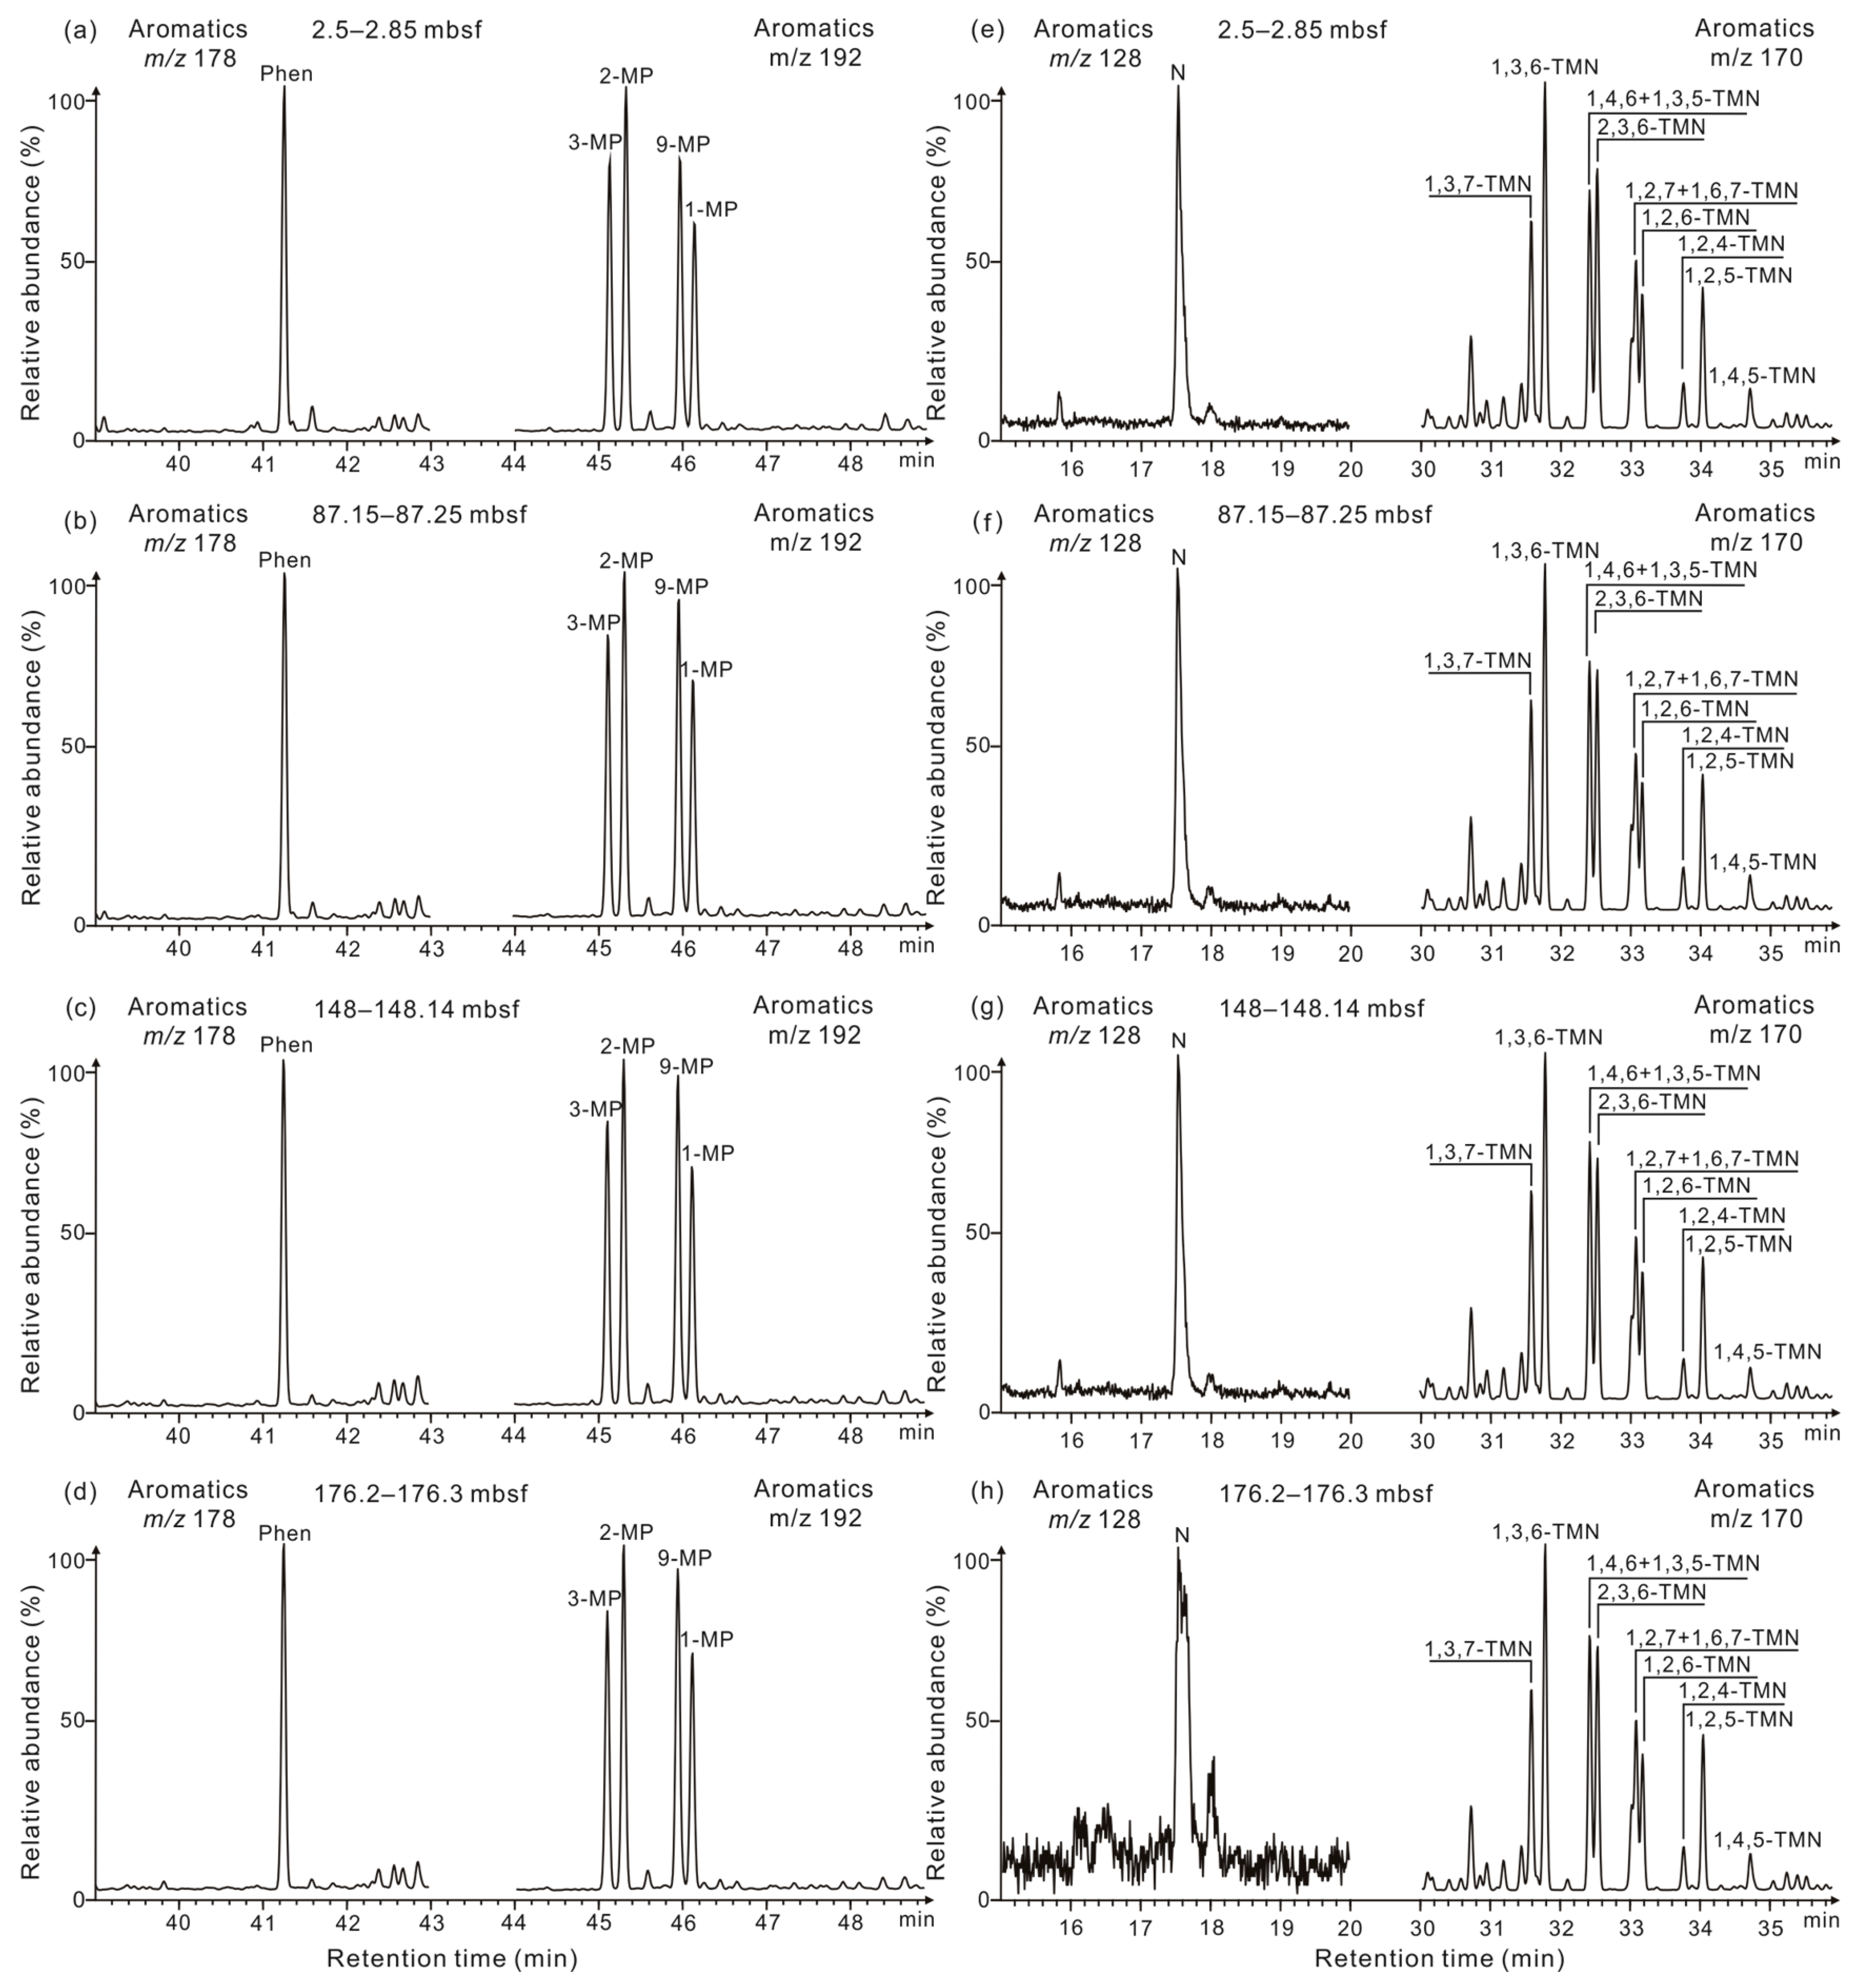
4.3.3. Aromatic Distributions

The aromatic hydrocarbons in sediment samples extract are mainly composed of phenanthrene (Phen) (m/z 178), methyl phenanthrenes (m/z 192) (Figure 5a–d), naphthalene (m/z 128), trimethyl naphthaleneon (m/z 170) (Figure 5e–h), chrysene, fluoranthene, perilene, and some other components were detected in all EOM of sediments. The equivalent vitrinite reflectance (%Rc and %Rcb), calculated based on the methylphenanthrene index (MPI-1) [40] and the trimethylnaphthalene ratio (TNR-2) [40], ranges from 0.79% to 0.86% and 0.77% to 0.80%, respectively (Table 4).
In addition, the ratios of (3- + 2-MP)/(2-MP + 3-MP + 1-MP + 9-MP) (F1) and 2-MP/(2-MP + 3-MP + 1-MP + 9-MP) (F2) [41] are relatively low, each measuring below 0.54 and 0.32, respectively (Table 4). The dibenzothiophenes to phenanthrene ratio (DBT/Phen) varies between 1.22 and 2.12.
Table 4. Selected biomarker parameters and ratios of the samples calculated from phenanthrene, methyl-phenanthrenes, trimethyl-naphthaleneon, methyl-phenanthrene, and dibenzothiophenes distributions at the site GMGS5-W08.
Depth (mbsf)MPI-1%RcTNR-2%RcbF1F2DBT/Phen
2.50–2.850.650.790.610.770.500.281.94
9.10–9.150.620.770.610.770.500.301.22
45.20–45.300.650.790.610.770.500.291.55
87.15–87.250.720.830.650.790.540.321.69
112.20–112.250.770.860.660.800.540.322.12
145.55–145.650.760.850.640.780.530.312.08
148.00–148.140.740.850.650.790.530.312.03
148.60–148.700.740.850.650.790.540.321.90
164.10–164.200.720.830.640.780.540.321.68
176.20–176.300.750.850.640.780.530.311.88
187.20–187.300.760.860.660.790.530.321.94
Note: MPI-1, the methylphenanthrene index, [1.5 × (2-MP + 3-MP)]/(P + 1-MP + 9-MP) [40]. MP, methyl-phenanthrenes. %Rc, calculated vitrinite reflectance, %Rc = 0.6 × MPI-1 + 0.4 [40]. TNR-2, the trimethylnaphthalene ratio, (1,3,7-TMN + 2,3,6-TMN)/(1,3,5-TMN + 1,3,6-TMN + 1,4,6-TMN). TMN, trimethyl-naphthaleneon. %Rcb = 0.4 + 0.6 × TNR-2. F1 = (2-MP + 3-MP)/(2-MP + 3-MP + 1-MP + 9-MP) [42]. F2 = 2-MP/(2-MP + 3-MP + 1-MP + 9-MP) [41]. DBT, dibenzothiophene. Phen, phenanthrene.

5. Discussion

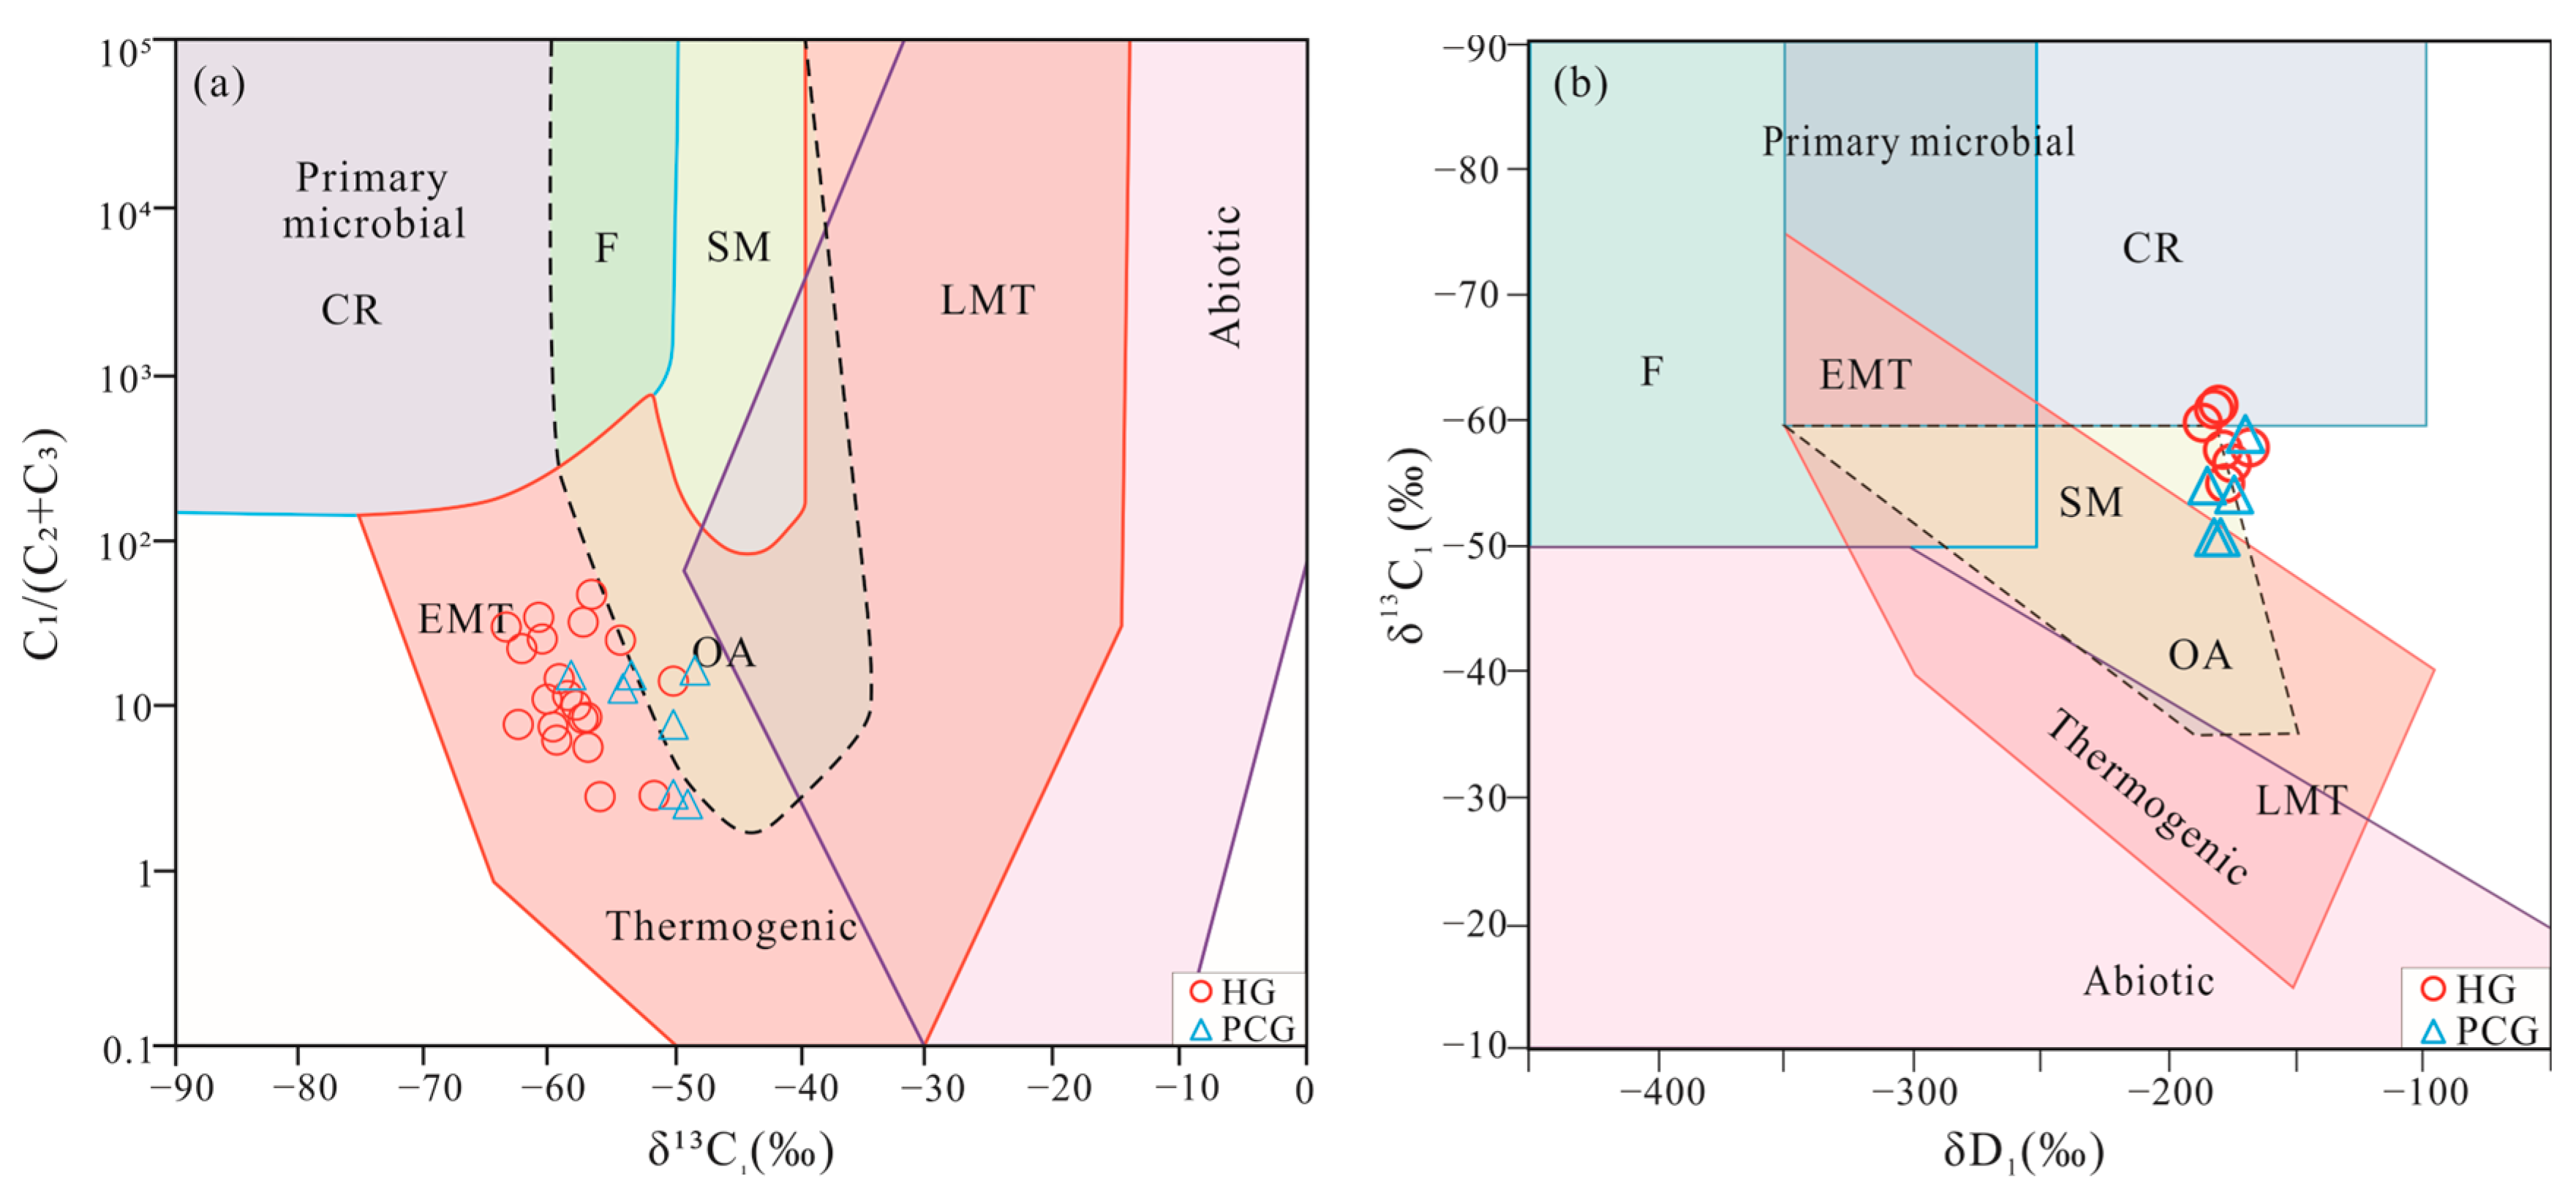
5.1. Origin of Gas Hydrates

The revised genetic diagrams of C1/(C2 + C3) versus δ13C1 and δ13C1 versus δD1 proposed by Milkov and Etiope [43] can be applied to divide types of natural gas hydrates. Figure 6 shows the gas hydrates and pressurized core degassing gas samples are mainly of early mature thermogenic gas.
All samples are primarily consisted of C1 (Table 1, Figure 7a), with varying amounts of C2 and C3, and trace amounts of C3+. The presence of C3 and C3+ gases in hydrate-related gas suggests a contribution from thermogenic gases, as microbes typically produce C1 exclusively. The highest C1 content in the samples was 97.7%, which contrasts with the C1 content of up to 99% in pure microbial gas from the Shenhu area in the South China Sea [15]. Interestingly, the proportion of C1 gradually decreases along the vertical profile (Figure 7a,b), while the δ13C1 values increase with increasing burial depth (Figure 7c). In contrast, δ13C2 and δ13C3 values remain stable with depth (Figure 7d,e). These features suggest that the contribution of microbial gas within the hydrate-related gas decreases with increasing burial depth from top to bottom. It is generally accepted that the δ13C1 values for microbial origin typically fall below −55‰, whereas thermogenic δ13C1 exhibits values higher than −55‰ [13,14,26,44,45]. Unlike the purely microbial gas in the Shenhu area, which has a maximum δ13C1 of −66‰, the range of δ13C1 within the samples is between 63.7‰ and −49.3‰ [15]. Therefore, it can be inferred that the vertical variations in natural gas composition and stable carbon isotopic are mainly caused by the different mixing ratios of microbial gas and thermogenic gas [13,14].
Based on the principle of mass conservation and stable carbon isotope fractionation of methane, the relative proportions of microbial and thermogenic gas in gas hydrates can be estimated [13,14,46]. In this study, we used the measured δ13C1 values of −28‰ for pure thermogenic C1 [32,47] and −80‰ for pure biogenic C1 [13,14] to calculate the contribution of microbial C1. The calculation results show that the proportion of microbial C1 in the gas samples from site GMGS5-W08 ranges from 40.96% to 60.58%, progressively decreasing with increasing burial depth (Figure 7f).
The C3+ gases, typically originating from thermogenic natural gas sources, play a crucial role in the formation of sII gas hydrates [11,48,49]. Variations in the proportion of microbial gases along the vertical profile influence the composition of gas hydrates, particularly C1 content. This leads to the formation of distinct zones with different gas hydrate crystal types along the depth profile. Pure sI and sII gas hydrates were found at depths of 8 mbsf and 145.65 mbsf, respectively, while a mixture of sI and sII gas hydrates was identified within the depth range of 58 to 144 mbsf. The gas sample taken at 8 mbsf exhibited high concentrations of C1 and C2 hydrocarbon gases but lacked C3 and C3+ hydrocarbons, with a δ13C1 value below −55‰. Conversely, the gas sample retrieved from a burial depth of 145.65 mbsf displayed a lower C1 content and higher C2+ content, with a δ13C1 value exceeding −55‰. Ultimately, based on the crystal structure of gas hydrates, the hydrate deposits can be divided into three zones from top to bottom: Zone sI (0–58 mbsf), Zone sI + sII (58–144 mbsf), and Zone sII (below 144 mbsf) (Figure 7). The boundaries between the zones are located at the bottom boundaries of MTD1 (58 mbsf) and MTD3 (144 mbsf).
In summary, the varying contribution rates of thermogenic gases along the vertical profile result in differences in the vertical distribution of sI and sII gas hydrates. The greatest variation in thermogenic gas proportions occurs at the bottom boundaries of MTD1 and MTD3. Below MTD3, thermogenic gases become the predominant component of hydrates. The distribution of gas components is evidently influenced by the presence of MTDs, indicating that the MTDs may play a sealing role in preventing gas migration upward.

5.2. Profile Variations in Geochemical Characteristics of EOM

5.2.1. Basic Geochemical Characteristics

Most sediment samples have TOC and HI values lower than 0.5% and 50 mg HC/g TOC, respectively (Table 2, Figure 8a). In addition, the values of the pyrolysis parameters S1 and S2 are extremely low (Table 2, Figure 8b), indicating a very low organic carbon in the indigenous sediments and a minor potential for microbial gas generation.
In contrast, the values of S3 are relatively high (Table 2), which represents the significant production of carbon dioxide during organic matter pyrolysis and reflects a high oxygen content in the organic materials. This is likely due to the low thermal maturation levels. The Tmax values are significantly low, ranging from 359 to 387 °C (Table 2, Figure 8c). Resins and asphaltics are the major components in the extracts of the eleven samples, ranging from 1.21% to 21.11% and 43.61% to 87.47%, respectively (Table 2). The Tmax values and percentage distribution of the four fractions indicate a very low thermal maturation level of the sediment samples.
In summary, the basic geochemical characteristics indicate that the abundance of EOM in the sediment is low and that the EOM is in an immature stage.

5.2.2. Organic Matter Source

The distribution of n-alkanes is a common method for tracing the origin of organic matter. Short-chain n-alkanes (<nC20) typically indicate contributions from algae and microorganisms, whereas long-chain n-alkanes (>nC25) are associated with terrigenous higher plants [50,51,52]. In this study, samples buried less than 58 mbsf predominantly exhibit long-chain n-alkanes (Figure 3a), while others show a prevalence of short-chain n-alkanes (Figure 3b–d). Near the seabed, we observe a bimodal distribution pattern (with maximum peaks around nC16, and nC31) (Figure 3a). In contrast, deeper-buried sediment samples display a unimodal pattern.
Furthermore, the TIC of saturated hydrocarbons demonstrates an even/odd predominance, particularly in the nC27-nC33 range, suggesting an origin from immature terrestrial organic matter. Additional n-alkane parameters, including nC22+/nC21− and the terrigenous/aquatic index (TAR), help identify the sources of organic matter (Table 3, Figure 9a,b). The TAR index is the ratio of (nC27 + nC29 + nC31)/(nC15 + nC17 + nC19), reflecting the contribution of leaf waxes and algae to n-alkanes, reveals the input of terrigenous organic matter (Table 3, Figure 3a–d and Figure 9). Higher nC22+/nC21− and TAR values within MTD1 compared to MTD3 (Figure 9) indicate an increasing contribution of marine aquatic organisms to organic matter with increasing burial depth.
These sediment samples consist of unconsolidated clays with relatively shallow burial depths (0–200 mbsf) and low in situ temperatures (3.5–21 °C) [8], indicating an immature diagenesis phase. Therefore, the immature terrigenous organic matter is likely sourced from the terrigenous organic matters.
In addition to immature EOM, our analysis revealed several biomarker compounds in mass chromatograms, originating from mature source rocks. These include isoprenoids (Figure 3a–d), tricyclic terpanes (Figure 3e–h), hopanes (Figure 4a–d), diasteranes, regular steranes (Figure 4e–h), and some other compounds. These biomarkers indicate the presence of allochthonous hydrocarbons in the extracts, helping identify the allochthonous hydrocarbons origin. The distribution of steranes is widely used to infer the input of organic matter sources. For example, high concentrations of C29 steranes suggest higher plant organic matter input, while C27 steranes indicate eukaryotic algae and animal sources [53,54]. We detected C27 to C29 regular steranes in all extracts, with high C27 and C29 abundance, implying contributions from terrigenous and aquatic organisms. The C27 to C29 sterane distribution shifts from a V-shaped (above 85 mbsf) to an L-shaped pattern (below 145 mbsf), indicating decreasing terrigenous influence with burial depth and a gradual reduction in terrestrial plant contributions.
The plot of Ph/nC18 versus Pr/nC17 (Figure 10) and the ternary diagram of C27–C29 regular steranes (Figure 11) depict the source of EOM in our samples. In MTD1, terrestrial higher plants are the primary source, whereas MTD2 and MTD3 samples contain a mix of EOM with a substantial contribution from aquatic organisms.
In summary, indigenous organic matter primarily comprises immature terrigenous material, while allochthonous hydrocarbons mainly originate from planktonic algae, bacteria, and other microorganisms. Moreover, the contribution of terrigenous organic matter decreases notably at the bottom boundary of MTD1 and MTD3 (Figure 9), coinciding with the presence of gas hydrates zones. Below the bottom boundary of MTD3, organic matter from mature source rocks and deeply buried thermogenic gas accumulate. Changes in the parameters of these source rocks along the depth profile indicate that MTDs obstruct the upward migration of allochthonous hydrocarbons and gas hydrates, especially thermogenic gas.

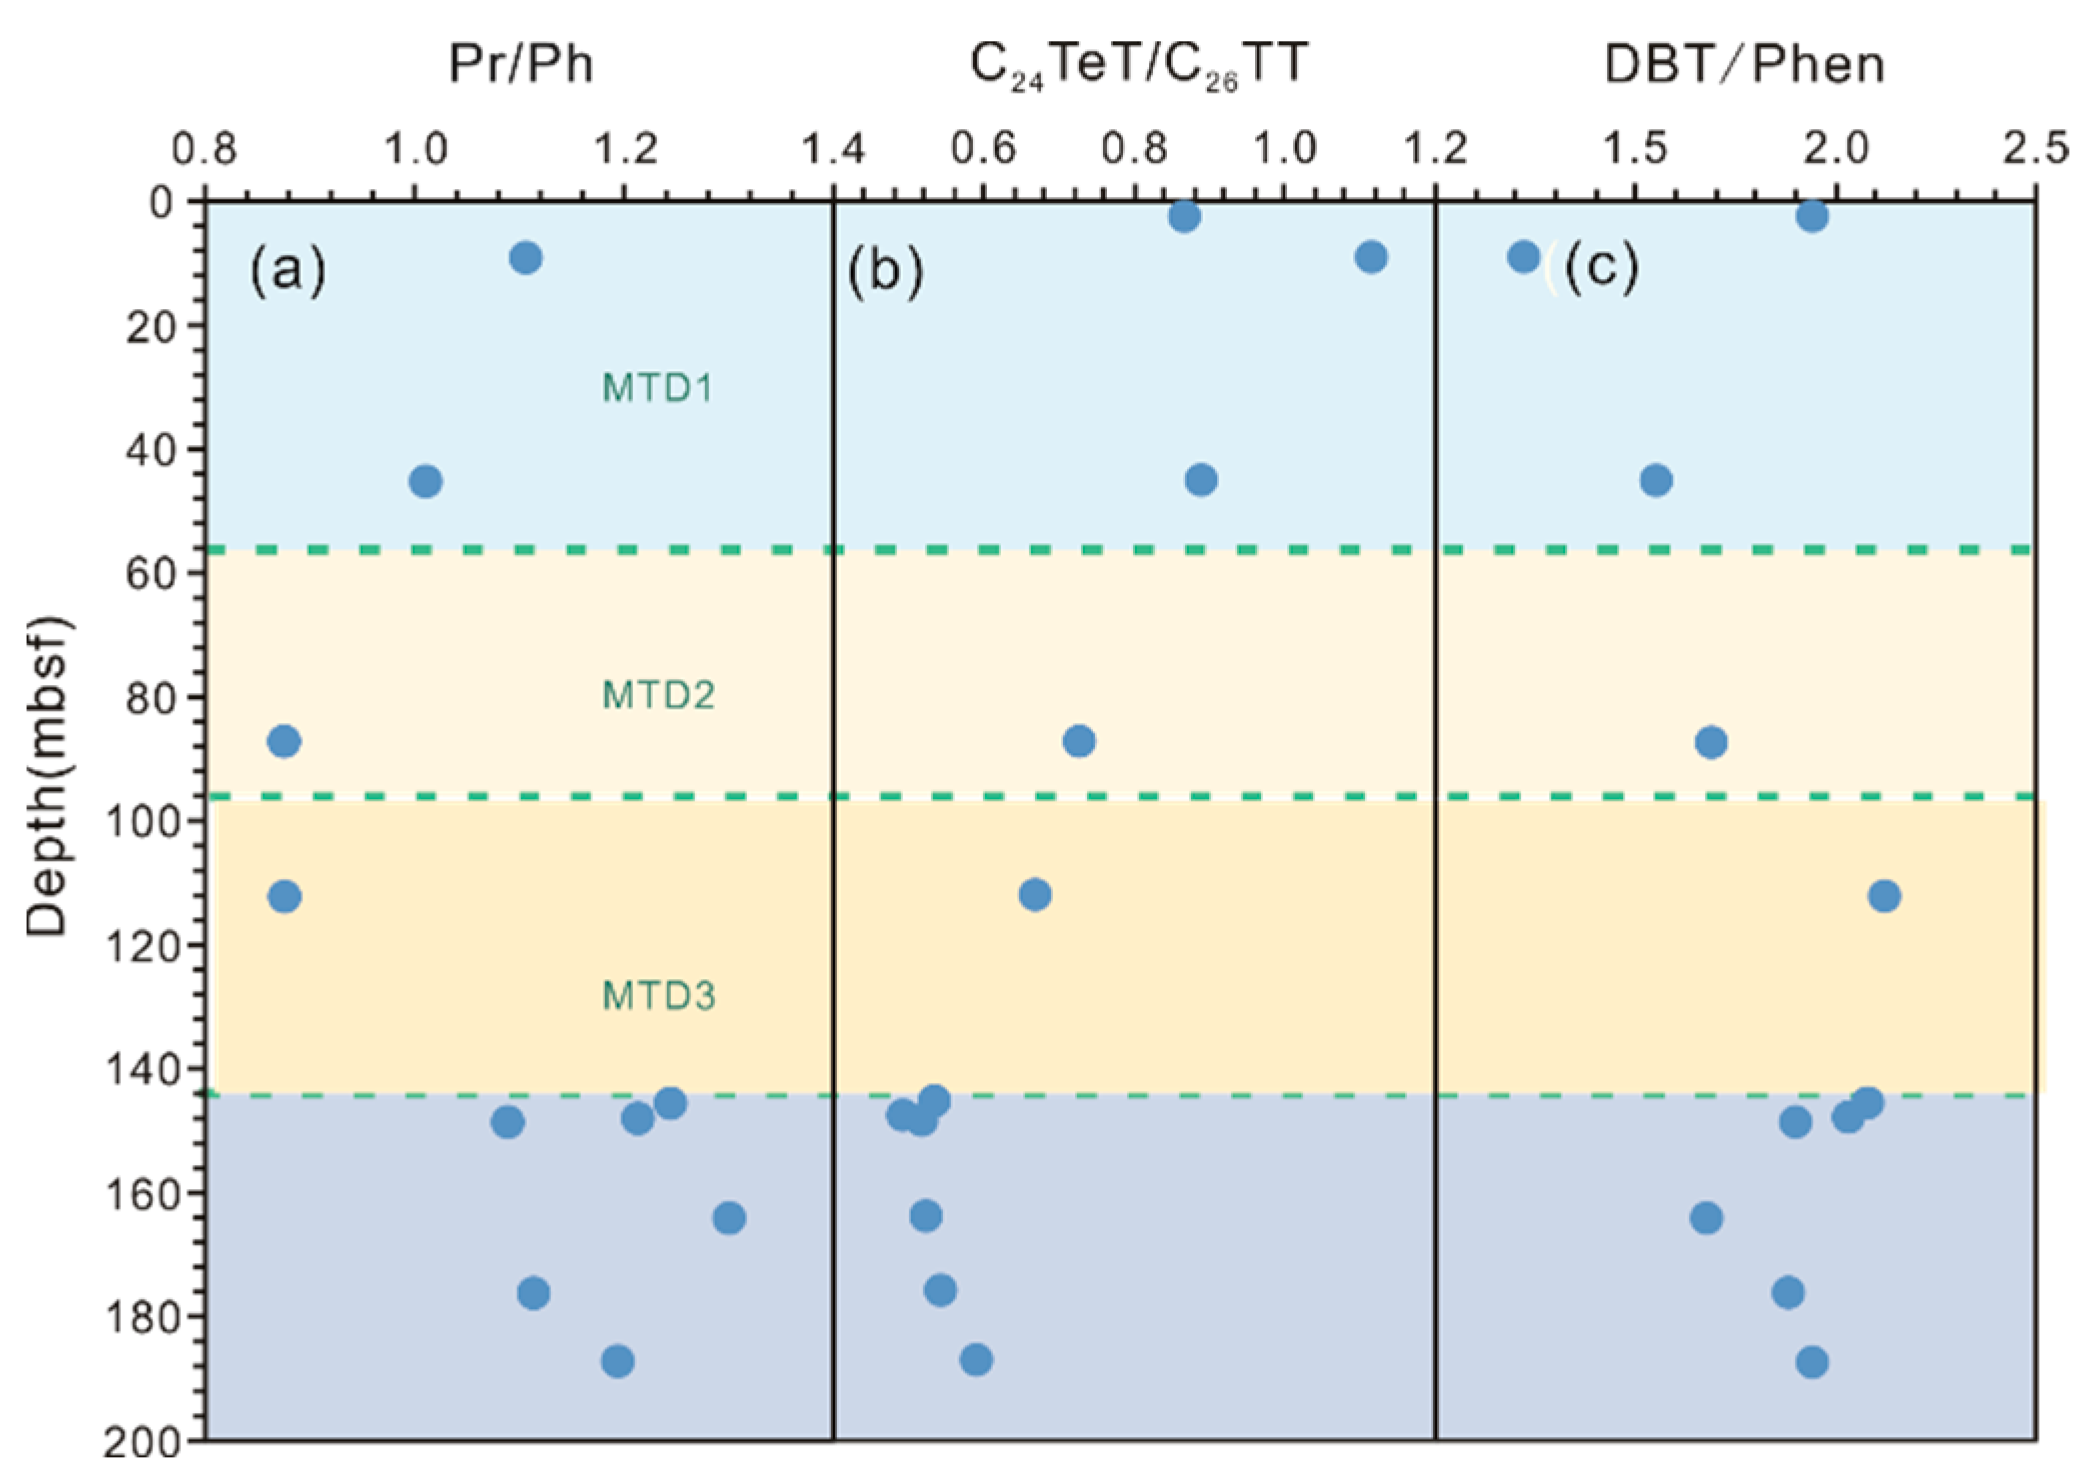
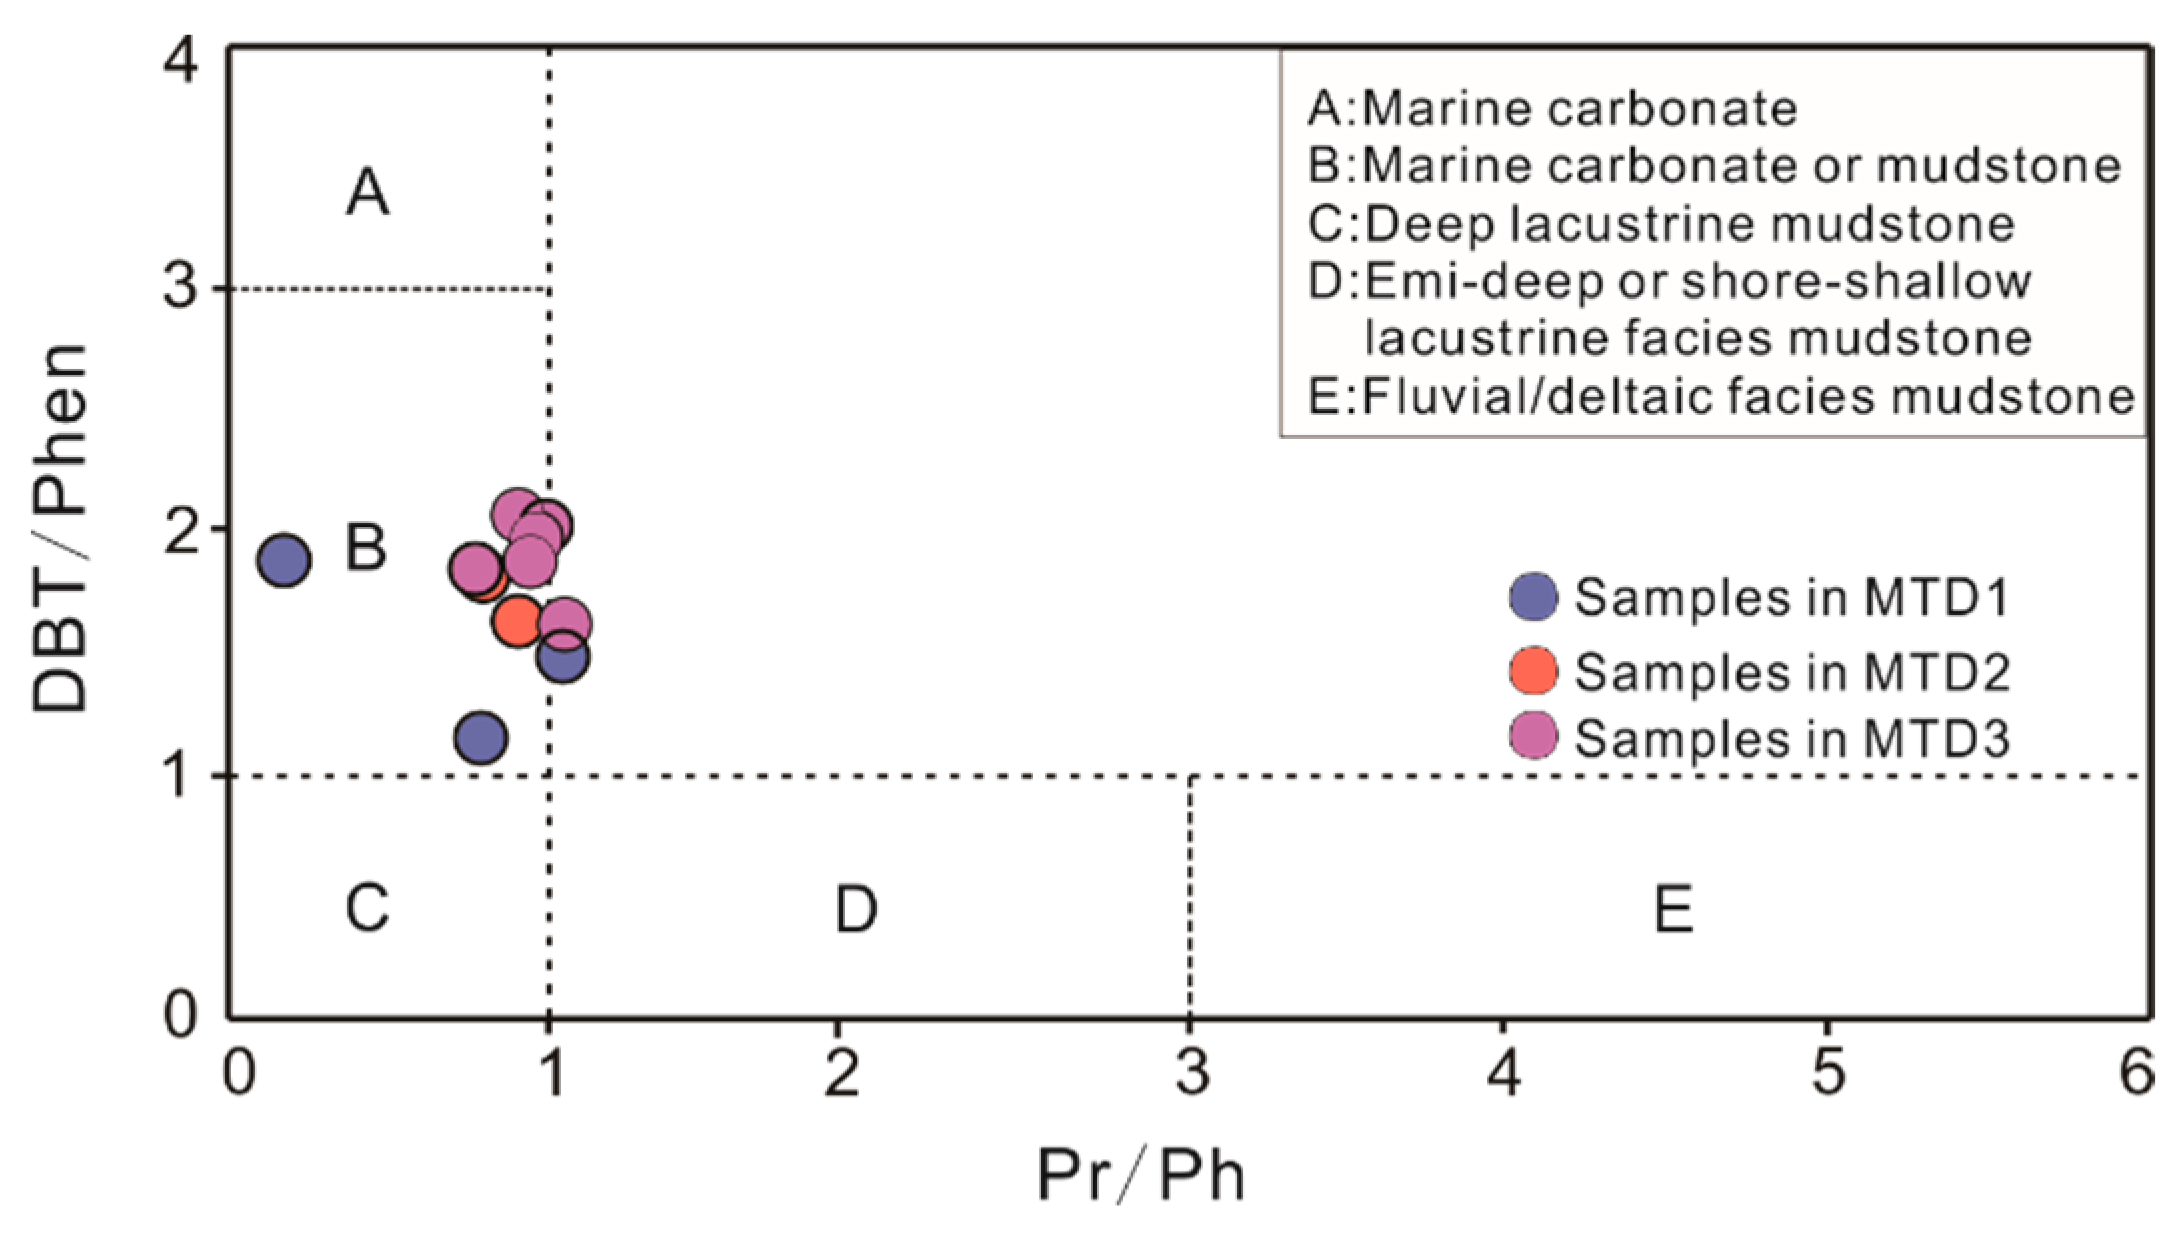
5.2.3. Depositional Environment of Organic Matter

Parameters derived from the distribution of TTs have historically played a pivotal role in assessing depositional environments and organic matter conditions [57,58,59]. In this study, all sediment samples exhibit a substantial abundance of C23TT, with C23TT/C21TT ratios consistently exceeding 1.2 (Table 3). This observation implies that EOM in the shallowly buried sediments of GMGS5-W08 predominantly originates from marine and saline environments, as opposed to terrestrial freshwater environments. In addition, C24TeT/C26TT ratios can be used to determine the depositional environment [60], with C24TeT/C26TT ratios consistently higher than 0.5 (Table 3, Figure 3b), suggesting an overfilled and balanced-fill marine depositional environment. Moreover, parameters such as Pr/Ph and DBT/Phen are commonly used to indicate the depositional environment. As shown in Figure 12, our results illustrate that reducing conditions within the depositional environment become more pronounced with increasing burial depth. Notably, significant variations in these ratios become apparent at the bottom of the MTDs boundaries.
The ternary diagram of C19+20TT, C21TT, and C23TT by Xiao et al. [59] (Figure 13) and the plot of Ph/Pr versus DBT/Phen (Figure 14) indicate that the EOM in the samples is sourced from marine sediments.
In summary, the biomarker parameters suggest that the allochthonous hydrocarbons in the extracts primarily originate from source rocks within marine depositional environments. Meanwhile, the parameters indicate an anoxic condition below the bottom boundary of MTD3 and a sub-anoxic condition above the bottom boundary of MTD1. These observations indicate a significant correlation between shifts in sedimentary environments and the MTDs.

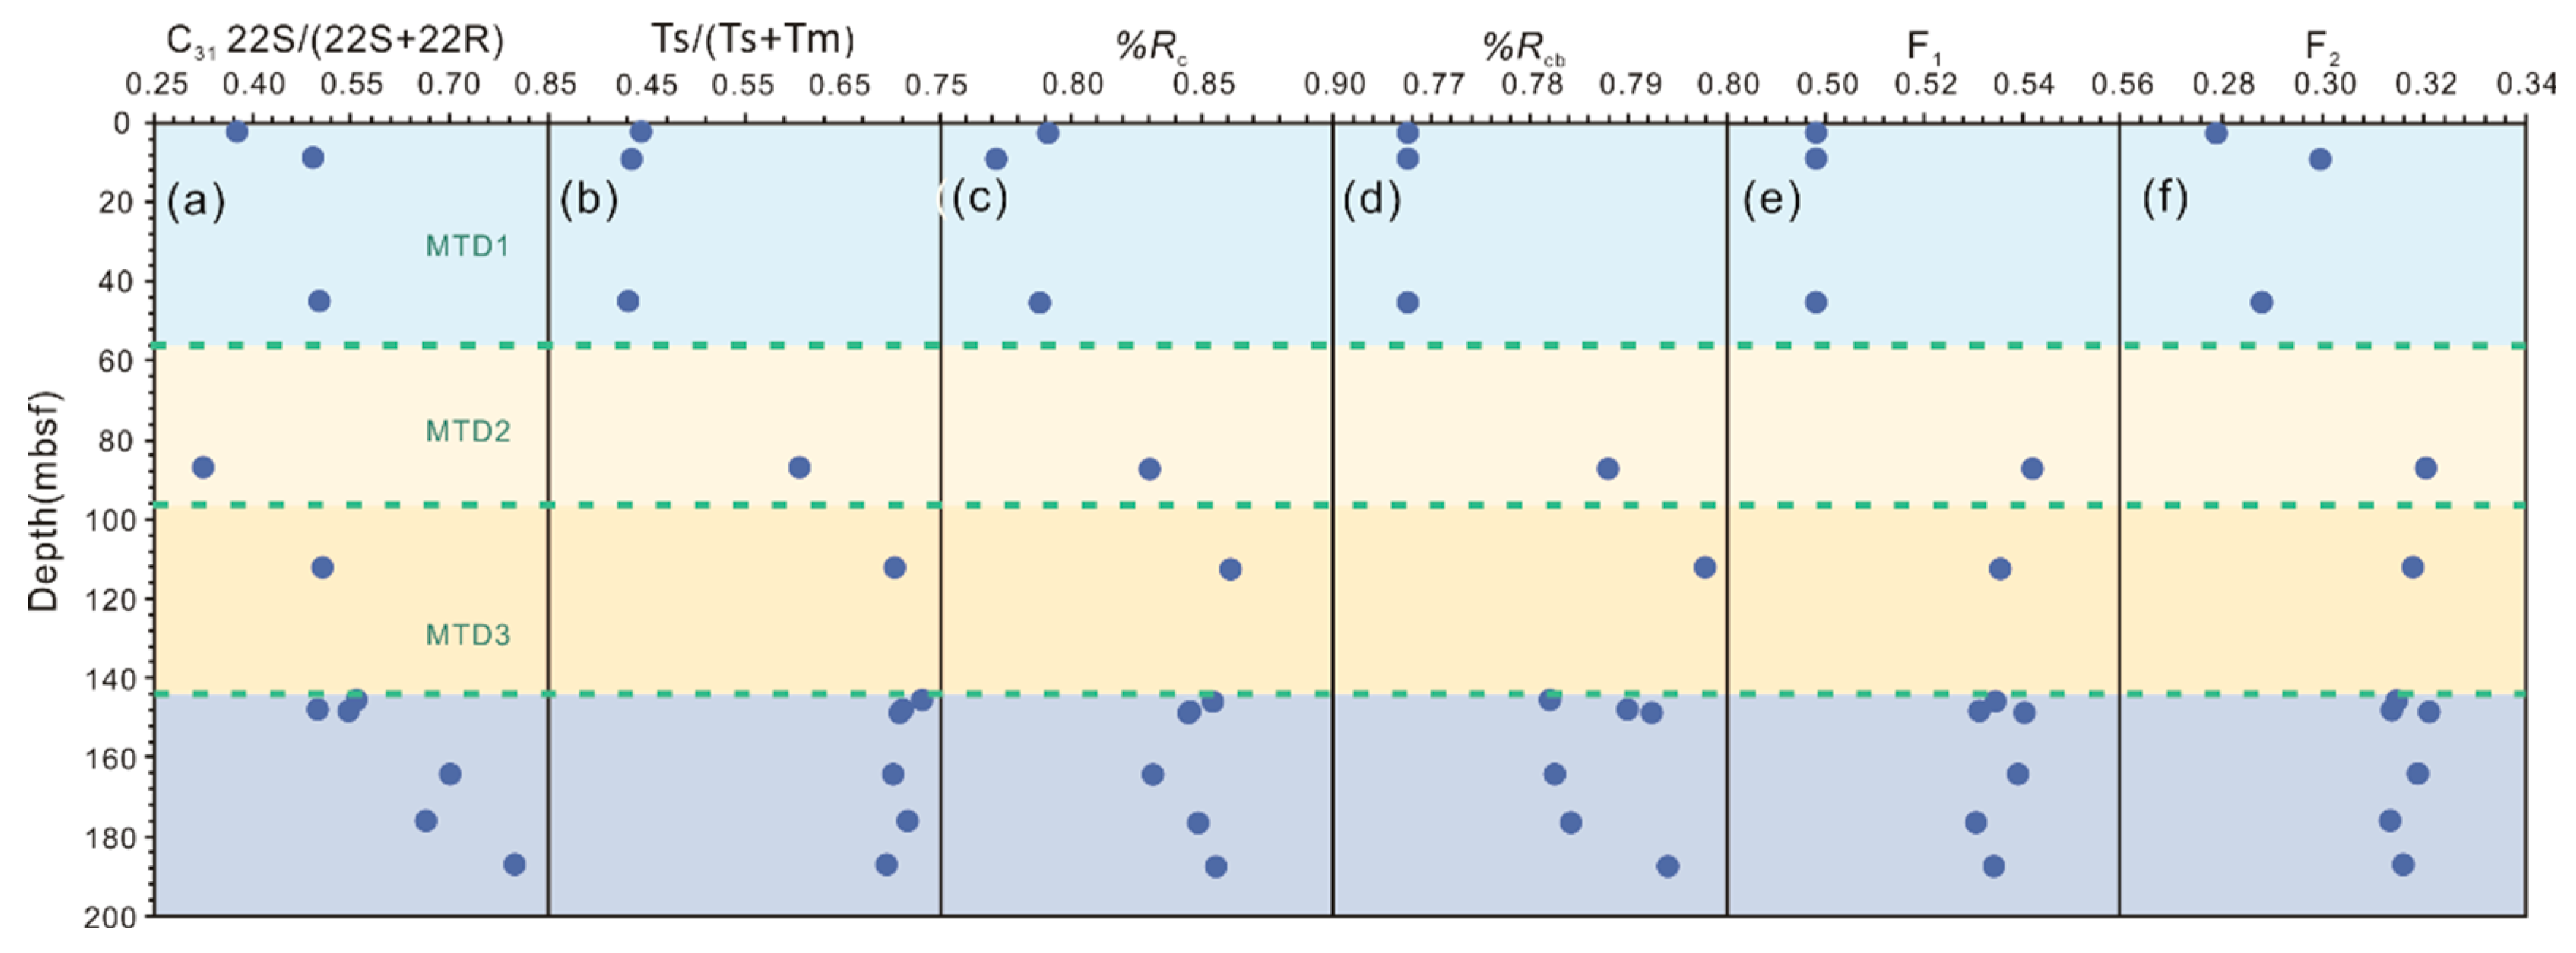
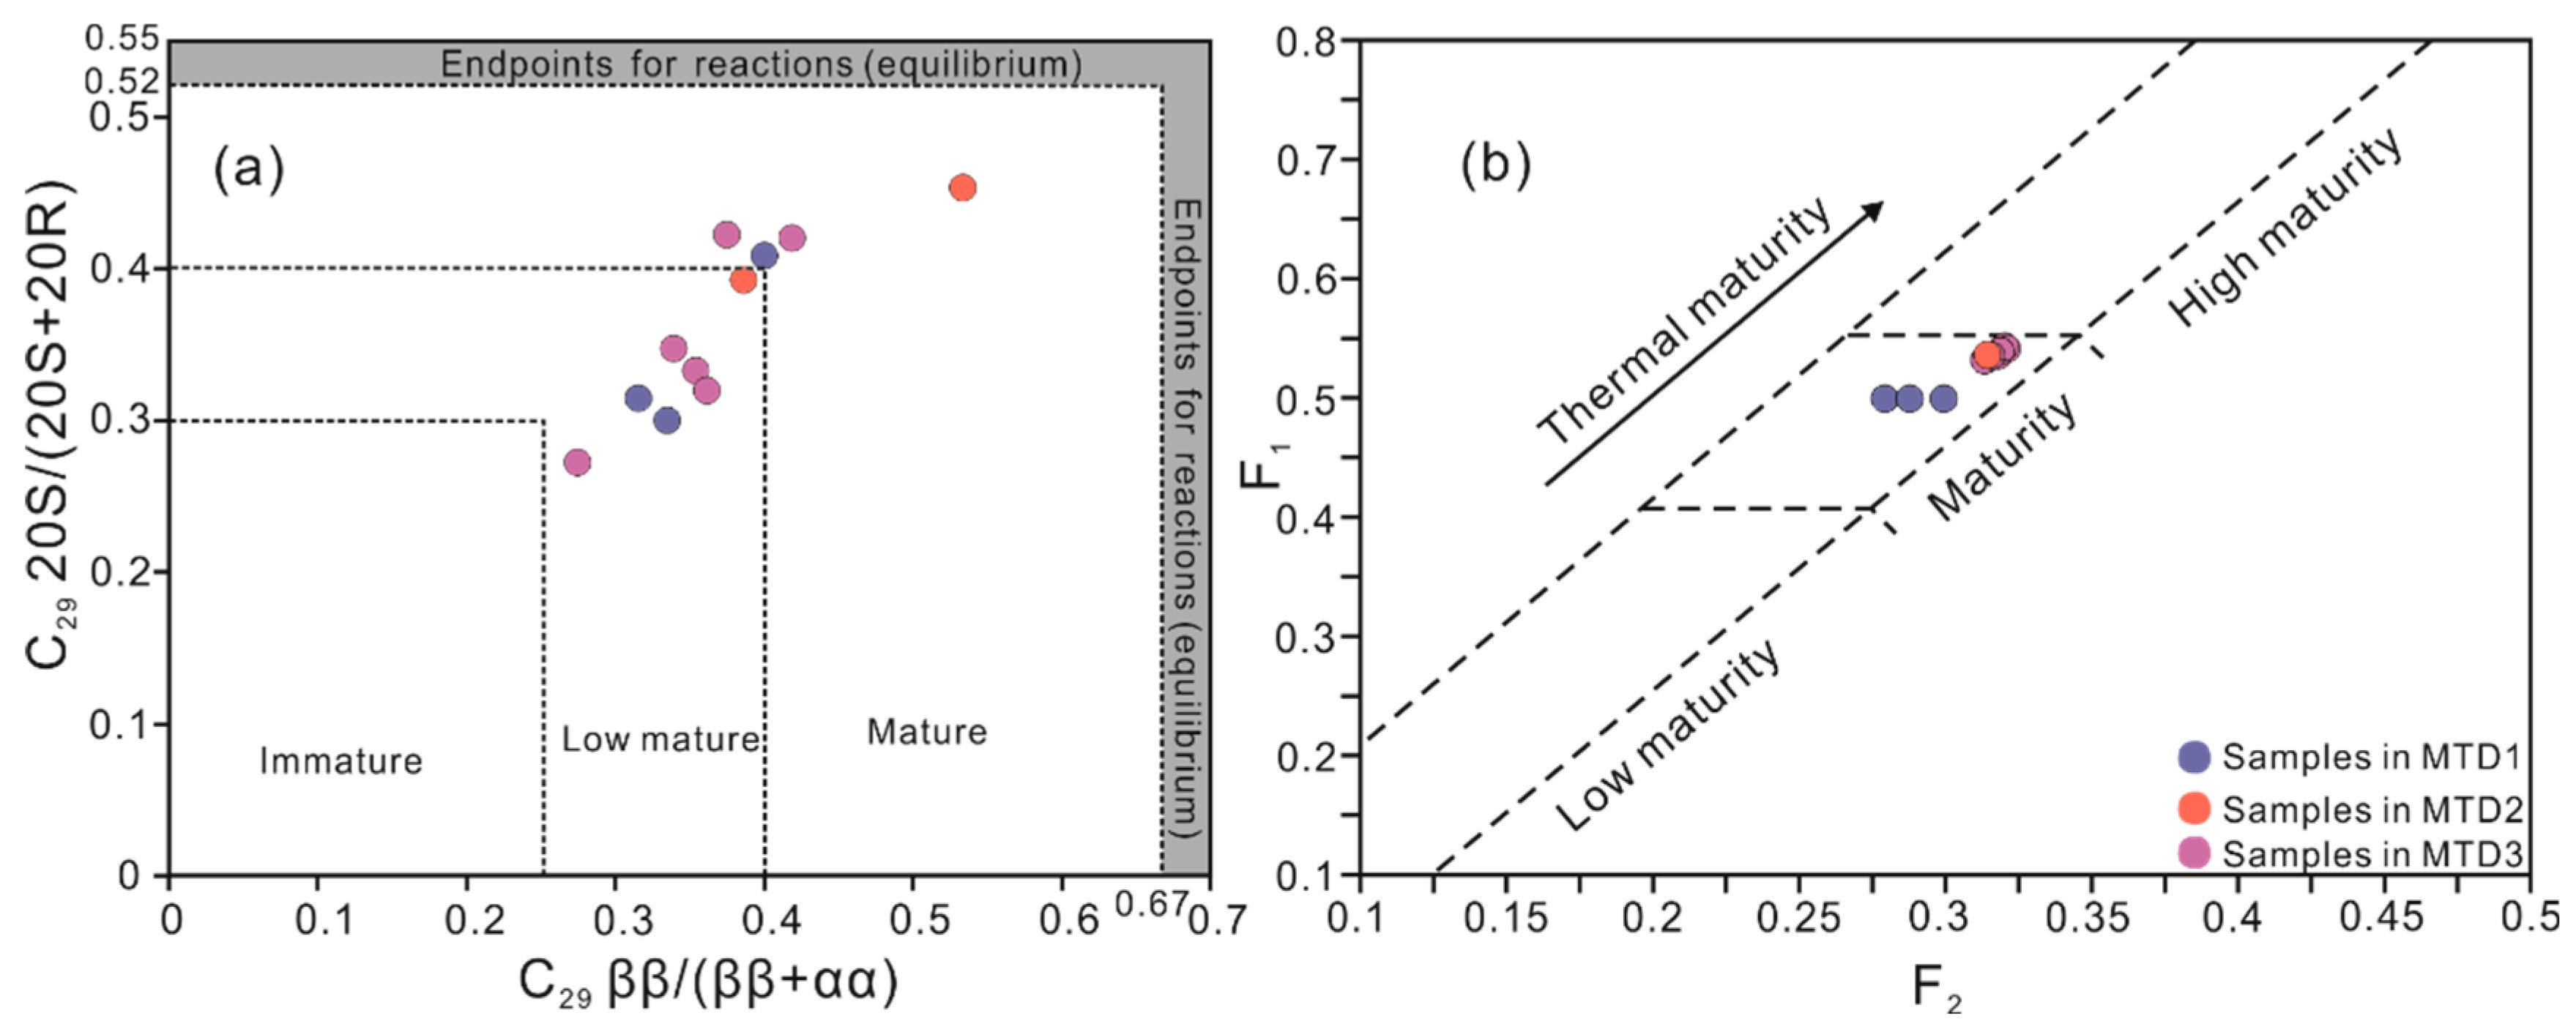
5.2.4. Maturity of Sediment Organic Matter

All samples exhibit immaturity, as evidenced by the Tmax values ranging from 359 °C to 382 °C (Table 2, Figure 8c). The moderate to high OEP, mostly higher than 1.5 (Table 3), indicates low thermal maturity. This is further supported by the presence of squalene, a high abundance of C29–C31 ββ-hopanes (Figure 5a–d), and relatively abundant C29–C31 moretanes (Figure 5a–d).
Moreover, a set of biomarker compounds from mature source rocks serves as valuable indicators of allochthonous hydrocarbons maturity. The thermal maturity indicators, including the C31 22S/(22S + 22R) ratio, Ts/(Ts + Tm) ratio, %Rc, %Rcb, F1, and F2, collectively confirm the presence of mature EOM sources. Furthermore, these six parameters demonstrate an increase in organic matter maturity with increasing burial depth, with significant variations observed at the bottom boundary of MTD1 and MTD3 (Figure 15). The six maturity parameters within MTD1 indicate that the EOM is in the immature-mature stage. The values of the maturity parameters increase with increase in depth of burial, and within MTD3 the EOM is in the mature stage. In addition, the pole ααα C2920S/(20S + 20R) versus C29 ββ/(ββ + αα) and F1 versus F2 present low-mature to mature level and mature level, respectively (Figure 16).
In general, the EOM within clay sediment extracts at relatively shallow burial depths (0–200 mbsf) is expected to be in an immature stage. However, certain biomarker parameters related to saturated and aromatic hydrocarbons exhibit distinct characteristics indicative of low to moderate organic matter maturity. This suggests the influence of allochthonous hydrocarbons sources originating from deeply buried source rocks. Variations in maturity parameters along the vertical profile suggest that MTDs serve as impediments, obstructing the upward migration of allochthonous hydrocarbons.
In summary, the proportion of thermogenic gas and biomarker parameters associated with source input, depositional environment, and organic matter maturity consistently display variations along the vertical profile. These observations strongly indicate the upward migration of gases and hydrocarbons sourced from deeply buried reservoirs, with MTDs playing a significant role as barriers impeding this migration process.

5.3. Implications for Gas Hydrate Exploration

The preliminary findings of this study indicate that MTDs act as barriers, hindering the upward migration of both gas and EOM. Our research indicates significant changes in the contribution of thermogenic gas in the hydrate-related gas and contributions of allochthonous hydrocarbons in hydrate-bearing sediment extracts at the bottom boundaries of MTD1 and MTD3. These variations become more pronounced with burial depth. Moreover, the proportion of thermogenic gas may affect the distribution of sII gas hydrates along the vertical profile. Below the boundary of MTD3, the proportion of thermogenic gas is over 50%, indicating a significant accumulation of sII gas hydrates.
In addition, allochthonous hydrocarbons are present in the sediment extracts. The geochemical characteristics of the allochthonous hydrocarbons in the extracts indicate that they are originated from marine source rocks of low to moderate maturity, and the organic matter is derived from mixed organic matter with a significant contribution from aquatic organisms. The distribution is influenced by the presence of MTDs. The highest concentration of allochthonous hydrocarbons is found at the bottom boundary of MTD3. Moreover, the indigenous organic matter within MTDs can significantly influence various geochemical parameters. Therefore, when evaluating gas source kitchens using geochemical indicators, it is crucial to consider the influence of indigenous sediment within MTDs.

6. Conclusions

Based on a series of detailed geochemical analyses of hydrate-related gases and hydrate-bearing sediments within GMGS5-W08 in the QDNB, the source of the thermogenic gas and the influence of sediments on hydrate-related gas migration were investigated. The main conclusions are as follows:
  • The decrease in C1 content and increase in δ13C1 with depth suggest an increasing proportion of thermogenic gas, indicating that the MTDs act as cap rocks, impeding the migration of gas from deep source rocks.
  • The varying thermogenic gas contributions result in distinct changes in the distribution of sI and sII gas hydrates along the depth profile. It is concluded that MTDs significantly influence the distribution of sII gas hydrates, with important implications for gas hydrate resource assessment and exploration.
  • Hydrate-bearing sediments contain both indigenous organic matter and allochthonous hydrocarbons, with the allochthonous hydrocarbons originating from marine source rocks of low to moderate thermal maturity. It is crucial to distinguish the influence of indigenous organic matter when determining the origin of hydrate-related gas sources.
  • The vertical distribution patterns of source input, depositional environment, and organic matter maturity parameters within hydrate sediments exhibit distinct trends. These variations at the interfaces closely align with the boundaries of the MTDs, indicating that MTDs prevent upward migration of allochthonous hydrocarbons from depth and have a significant impact on the distribution of organic matter.

Author Contributions

H.L. (Huaxin Liu): Investigation, Methodology, Formal analysis, Interpretation, Writing—original draft; Writing—review & editing; M.L.: Project administration, Interpretation, Writing—review & editing; H.L. (Hongfei Lai): Funding acquisition, Data curation, Writing—review & editing; Y.F. (Ying Fu): Methodology, Data curation, Validation; Z.K. and Y.F. (Yunxin Fang): Data curation, Software. All authors have read and agreed to the published version of the manuscript.

Funding

This research was funded by [Guangdong Basic and Applied Basic Research] grant number [2023A1515010913, 2022A1515110569], [Guangzhou Science and Technology Project] grant number [202201011396], [Guangdong Major project of Basic and Applied Basic Research] grant number [2020B0301030003] and [China Geological Survey Project] grant number [DD20221705, DD20221700].

Data Availability Statement

The original contributions presented in the study are included in the article material, further inquiries can be directed to the corresponding authors.

Acknowledgments

The authors are grateful for all participants of the sixth China National Gas Hydrate Drilling Expeditions (GMGS5). We are grateful to the anonymous editors and reviewers for their insightful comments and suggestions, which significantly enhanced the quality of this manuscript.

Conflicts of Interest

The authors declare no conflict of interest.

References

  1. Sloan, E.D. Gas Hydrates: Review of Physical/Chemical Properties. Energy Fuels 1998, 2, 191–196. [Google Scholar] [CrossRef]
  2. Paull, C.K.; Dillon, W.P. Natural Gas Hydrates: Occurrence, Distribution, and Detection; American Geophysical Union Geophysical Monograph Series: Washington, DC, USA, 2001. [Google Scholar]
  3. Sloan, E.D., Jr. Fundamental principles and applications of natural gas hydrates. Nature 2003, 426, 353–359. [Google Scholar] [CrossRef] [PubMed]
  4. Tréhu, A.M.; Long, P.E.; Torres, M.E.; Bohrmann, G.; Rack, F.R.; Collett, T.S.; Goldberg, D.S.; Milkov, A.V.; Riedel, M.; Schultheiss, P.; et al. Three-dimensional distribution of gas hydrate beneath southern Hydrate Ridge: Constraints from ODP Leg 204. Earth Planet. Sci. Lett. 2004, 222, 845–862. [Google Scholar] [CrossRef]
  5. Pytlak, L.; Gross, D.; Sachsenhofer, R.F.; Bechtel, A.; Gratzer, R.; Linzer, H.G. Generation, mixing and alteration of thermogenic and microbial gas in oil deposits: The case of the Alpine Foreland Basin (Austria). Mar. Petrol. Geol. 2016, 78, 575–592. [Google Scholar] [CrossRef]
  6. Makogon, Y.F. Natural gas hydrates—A promising source of energy. Nat. Gas Sci. Eng. 2010, 2, 49–59. [Google Scholar] [CrossRef]
  7. Wei, J.H.; Liang, J.; Lu, J.; Zhang, W.; He, Y.L. Characteristics and dynamics of gas hydrate systems in the northwestern South China Sea—Results of the fifth gas hydrate drilling expedition. Mar. Pet. Geol. 2019, 110, 287–298. [Google Scholar] [CrossRef]
  8. Ye, J.; Wei, J.H.; Liang, J.; Lu, J.; Lu, H.; Zhang, W. Complex gas hydrate system in a gas chimney, South China Sea. Mar. Pet. Geol. 2019, 104, 29–39. [Google Scholar] [CrossRef]
  9. Zhang, W.; Liang, J.; Wei, J.; Su, P.; Lin, L.; Huang, W. Origin of natural gases and associated gas hydrates in the Shenhu area, northern South China Sea: Results from the China gas hydrate drilling expeditions. Asian Earth Sci. 2019, 183, 103953. [Google Scholar] [CrossRef]
  10. Zhang, W.; Liang, J.Q.; Lu, J.A.; Meng, M.M.; He, Y.L.; Deng, W.; Feng, J. Characteristics and controlling mechanism of typical leakage gas hydrate reservoir forming system in the Qiongdongnan Basin, northern South China Sea. Nat. Gas Ind. 2020, 40, 90–99, (In Chinese with English abstract). [Google Scholar]
  11. Wei, J.; Wu, T.; Zhu, L.; Fang, Y.; Liang, J.; Lu, H.; Cai, W.; Xie, Z.; Lai, P.; Cao, J.; et al. Mixed gas sources induced co-existence of sI and sII gas hydrates in the Qiongdongnan Basin, South China Sea. Mar. Pet. Geol. 2021, 128, 105024. [Google Scholar] [CrossRef]
  12. Liang, J.Q.; Zhang, W.; Lu, J.A.; Wei, J.H.; Kuang, Z.G.; He, Y.L. Geological occurrence and accumulation mechanism of natural gas hydrates in the eastern Qiongdongnan Basin of the South China Sea: Insights from site GMGS5-W9-2018. Mar. Geol. 2019, 418, 106042. [Google Scholar] [CrossRef]
  13. Lai, H.F.; Fang, Y.X.; Kuang, Z.G.; Ren, J.; Liang, J.F.; Lu, J.A.; Wang, G.; Xing, C. Geochemistry, origin and accumulation of natural gas hydrates in the Qiongdongnan Basin, South China Sea: Implications from site GMGS5-W08. Mar. Pet. Geol. 2021, 123, 104774. [Google Scholar] [CrossRef]
  14. Lai, H.F.; Qiu, H.J.; Liang, J.Q.; Kuang, Z.G.; Fang, Y.X.; Ren, J.F.; Lu, J.A. Geochemical Characteristics and Gas-to-Gas Correlation of Two Leakage-type Gas Hydrate Accumulations in the Western Qiongdongnan Basin, South China Sea. Acta Geol. Sin. (Engl. Ed.) 2022, 2, 680–690. [Google Scholar] [CrossRef]
  15. Lai, H.F.; Deng, Y.N.; Yang, L.; Liang, J.Q.; Dai, L.R.; Li, L.; Fang, Y.X.; Liu, L.Y.; Kuang, Z.G. Origin of natural gas within the deep-sea uncompacted sediments of the Shenhu area, northern South China Sea: Geochemical and methanogenic cultivation results. Mar. Pet. Geol. 2023, 147, 106015. [Google Scholar] [CrossRef]
  16. Ding, W.W.; Wang, Y.M.; Chen, H.L.; Yang, S.F.; Wu, N.Y. Deformation characters and its tectonic evolution of the Southwest Taiwan Basin. J.-Zhejiang Univ.-Sci. Ed. 2004, 31, 216–220. [Google Scholar]
  17. Suess, E.; Huang, Y.; Wu, N.; Han, X.; Su, X. South China Sea continental margin: Geological methane budget and environmental effects of methane emissions and gas hydrates. In Ifm-Geomar, Kiel. Rv Sonne Cruise Report So; GEOMAR: Kiel, Germany, 2005; Volume 177. [Google Scholar]
  18. Tong, H.P.; Feng, D.; Cheng, H.; Yang, S.X.; Wang, H.B.; Min, A.G.; Edwards, R.L.; Chen, Z.; Chen, D. Authigenic carbonates from seeps on the northern continental slope of the South China Sea: New insights into fluid sources and geochronology. Mar. Pet. Geol. 2013, 43, 260–271. [Google Scholar] [CrossRef]
  19. He, Y.L.; Liang, J.Q.; Shi, W.Z.; Kuang, Z.; Deng, W.; Wang, R.; Xu, L.; Du, H. Influencing factors and accumulation modes of gas hydrate in the South low uplift and its surrounding area of Qiongdongnan Basin. Earth Sci. 2022, 47, 1711–1727, (In Chinese with English abstract). [Google Scholar]
  20. Fang, Y.X.; Wei, J.H.; Lu, H.L.; Liang, J.Q.; Lu, J.A.; Fu, J.; Cao, J. Chemical and structural characteristics of gas hydrates from the Haima cold seeps in the Qiongdongnan Basin of the South China Sea. Asian Earth Sci. 2019, 182, 103924. [Google Scholar] [CrossRef]
  21. He, Y.L.; Liang, J.Q.; Kuang, Z.G.; Deng, W.; Ren, J.F.; Lai, H.F.; Meng, M.M.; Zhang, W. Migration and accumulation characteristics of natural gas hydrates in the uplifts and their slope zones in the Qiongdongnan Basin, China. China Geol. 2022, 5, 234–250. [Google Scholar] [CrossRef]
  22. Meng, M.M.; Liang, J.Q.; Lu, J.A.; Zhang, W.; Kuang, Z.G.; Fang, Y.X.; He, Y.L.; Deng, W.; Wei, H. Quaternary deep-water sedimentary characteristics and their relationship with the gas hydrate accumulations in the Qiongdongnan Basin, Northwest South China Sea. Deep. Sea Res. Part I Oceanogr. Res. Pap. 2021, 177, 103628. [Google Scholar] [CrossRef]
  23. Zhu, W.L.; Huang, B.J.; Mi, L.J.; Wilkins, R.W.T.; Fu, N.; Xiao, X.M. Geochemistry, origin, and deep-water exploration potential of natural gases in the Pearl River Mouth and Qiongdongnan basins, South China Sea. AAPG Bull. 2009, 93, 741–761. [Google Scholar] [CrossRef]
  24. Zhang, Y.D.; Sun, Y.G.; Liu, Q. Distribution and carbon isotope composition of pregnane in carbonate-evaporitic rocks from the Bonan Sag, Bohai Bay Basin, Eastern China: Insights into sources and associated lake environments. Org. Geochem. 2021, 151, 104127. [Google Scholar] [CrossRef]
  25. Lei, C.; Ren, J.Y.; Pei, J.X.; Lin, H.T.; Yin, X.Y.; Tong, D.J. Tectonic Framework and Multiple Episode Tectonic Evolution in Deepwater Area of Qiongdongnan Basin, Northern Continental Margin of South China Sea. Earth Sci. 2011, 36, 151–162, (In Chinese with English abstract). [Google Scholar] [CrossRef]
  26. Huang, B.J.; Tian, H.; Li, X.S.; Wang, Z.F.; Xiao, X.M. Geochemistry, origin and accumulation of natural gases in the deepwater area of the Qiongdongnan Basin, South China Sea. Mar. Pet. Geol. 2016, 72, 254–267. [Google Scholar] [CrossRef]
  27. Su, A.; Chen, H.T.; Chen, X.; Liu, H.P.; Liu, Y.; Lei, M.Z. New insight into origin, accumulation and escape of natural gas in the Songdong and Baodao regions in the eastern Qiongdongnan basin, South China Sea. Nat. Gas Sci. Eng. 2018, 52, 467–483. [Google Scholar] [CrossRef]
  28. Liang, G.; Gan, J.; Li, X. Genetic types and origin of natural gas in Lingshui sag, Qiongdongnan Basin. China Offshore Oil Gas 2015, 27, 47–53. [Google Scholar]
  29. Xu, X.D.; Zhang, Y.Z.; Liang, G.; Xiong, X.F.; Li, X.; Guo, X.X.; Liu, H.Y. Hydrocarbon source condition and accumulation mechanism of natural gas in deepwater area of Qiongdongnan Basin, northern South China Sea. Nat. Gas Geosci. 2016, 27, 1985–1992. [Google Scholar]
  30. Huang, H.T.; Huang, B.J.; Huang, Y.W.; Li, X.; Tian, H. Condensate origin and hydrocarbon accumulation mechanism of the deepwater giant gas field in western South China Sea: A case study of Lingshui 17-2 gas field in Qiongdongnan Basin. Pet. Explor. Dev. 2017, 44, 409–417. [Google Scholar] [CrossRef]
  31. Zhu, Y.M.; Sun, L.T.; Hao, F.; Tuo, L. Geochemical composition and origin of Tertiary oils in the Yinggehai and Qiongdongnan Basins, offshore South China Sea. Mar. Pet. Geol. 2018, 96, 139–153. [Google Scholar] [CrossRef]
  32. Gan, J.; Zhang, Y.Z.; Liang, G.; Yang, X.B.; Li, X.; Yang, J.H.; Guo, X.X. On accumulation process and dynamic mechanism of natural gas in the deep water area of central canyon, Qiongdongnan Basin. Acta Geol. Sin. 2018, 92, 2359–2367, (In Chinese with English abstract). [Google Scholar]
  33. Xie, Y.H.; Zhang, G.C.; Sun, Z.P.; Zeng, Q.B.; Zhao, Z.; Guo, S.A. Reservoir forming conditions and key exploration technologies of Lingshui 17-2 giant gas field in deepwater area of Qiongdongnan Basin. Pet. Res. 2019, 4, 1–18. [Google Scholar] [CrossRef]
  34. Su, M.; Xie, X.N.; Wang, Z.F.; Jiang, T.; Zhang, C.; He, Y.L. Sedimentary evolution of the central canyon system in Qiongdongnan Basin, northern South China Sea. Acta Pet. Sin. 2013, 34, 467–478, (In Chinese with English abstract). [Google Scholar] [CrossRef]
  35. Wang, Z.F.; Sun, Z.P.; Zhang, Y.Z.; Guo, M.G.; Zhu, J.T.; Huang, B.J.; Zhang, D.J.; Jiang, R.F.; Man, X.; Zhang, H.Y. Distribution and hydrocarbon accumulation mechanism of the giant deepwater Central Canyon gas field in Qiongdongnan Basin, northern South China Sea. China Pet. Explor. 2016, 21, 54–64, (In Chinese with English abstract). [Google Scholar]
  36. Hao, S.S.; Huang, Z.L.; Liu, G.D.; Zheng, Y.L. Geophysical properties of cap rocks in Qiongdongnan Basin, South China Sea. Mar. Pet. Geol. 2000, 17, 547–555. [Google Scholar] [CrossRef]
  37. Espitalié, J.; Deroo, G.; Marquis, F. La pyrolyse Rock-Evaletses applications. Deuxième partie. Rev. L’institut Français Pétrole 1985, 40, 755–784. [Google Scholar] [CrossRef]
  38. Marzi, R.; Torkelson, B.E.; Olson, R.K. A revised carbon preference index. Org. Geochem. 1993, 20, 1303–1306. [Google Scholar] [CrossRef]
  39. Bourbonniere, R.A.; Meyers, P.A. Sedimentary geolipid records of historical changes in the watersheds and productivities of Lakes Ontario and Erie. Limnol. Oceanogr. 1996, 41, 352–359. [Google Scholar] [CrossRef]
  40. Radke, M.; Welte, D.H.; Willsch, H. Geochemical study on a well in the Western Canada Basin: Relation of the aromatic distribution pattern to maturity of organic matter. Geochim. Cosmochim. Acta 1982, 46, 1–10. [Google Scholar] [CrossRef]
  41. Bao, J.P.; Wang, T.G.; Zhou, Y.Q.; Yu, F.X.; Wang, J.Y.; Zhou, Q.L.; Chen, F.J. The relationship between methyl phenanthrene ratios and the evolution of organic matter. J. Jianghan Pet. Inst. 1992, 14, 8–13, (In Chinese with English abstract). [Google Scholar]
  42. Radke, M.; Rullkötter, J.; Vriend, S.P. Distribution of naphthalenes in crude oils from the Java Sea: Source and maturation effects. Geochim. Cosmochim. Acta 1994, 58, 3675–3689. [Google Scholar] [CrossRef]
  43. Milkov, A.V.; Etiope, G. Revised genetic diagrams for natural gases based on a global dataset of >20,000 samples. Org. Geochem. 2018, 125, 109–120. [Google Scholar] [CrossRef]
  44. Xu, Y.; Shen, P. A Study of Natural Gas Origins in China. AAPG Bull. 1996, 80, 1604–1614. [Google Scholar]
  45. Klauda, J.B.; Sandler, S.I. Global Distribution of Methane Hydrate in Ocean Sediment. Energy Fuels 2005, 19, 459–470. [Google Scholar] [CrossRef]
  46. Sassen, R.; Milkov, A.V.; Ozgul, E.; Roberts, H.H.; Hunt, J.L.; Beeunas, M.A.; Chanton, J.P.; Defreitas, D.A.; Sweet, S.T. Gas venting and subsurface charge in the Green Canyon area, Gulf of Mexico continental slope. Org. Geochem. 2003, 34, 1455–1464. [Google Scholar] [CrossRef]
  47. Chung, H.M.; Gormly, J.R.; Squires, R.M. Origin of gaseous hydrocarbons in subsurface environments: Theoretical considerations of carbon isotope distribution. Chem. Geol. 1988, 71, 97–104. [Google Scholar] [CrossRef]
  48. Kida, M.; Khlystov, O.; Zemskaya, T.; Takahashi, N.; Minami, H.; Sakagami, H.; Krylov, A.; Hachikubo, A.; Yamashita, S.; Shoji, H. Coexistence of structure I and II gas hydrates in Lake Baikal suggesting gas sources from microbial and thermogenic origin. Geophys. Res. Lett. 2006, 33. [Google Scholar] [CrossRef]
  49. Klapp, S.A.; Murshed, M.M.; Pape, T.; Klein, H.; Bohrmann, G.; Brewer, P.G.; Kuhs, W.F. Mixed gas hydrate structures at the Chapopote Knoll, southern Gulf of Mexico. Earth Planet. Sci. Lett. 2010, 299, 207–217. [Google Scholar] [CrossRef]
  50. Bray, E.E.; Evans, E.D. Distribution of n-paraffins as a clue to recognition of source beds. Geochim. Cosmochim. Acta 1961, 22, 2–15. [Google Scholar] [CrossRef]
  51. Eglinton, G.; Hamilton, R.J. Leaf Epicuticular Waxes: The waxy outer surfaces of most plants display a wide diversity of fine structure and chemical constituents. Science 1967, 156, 1322–1335. [Google Scholar] [CrossRef]
  52. Peters, K.E.; Walters, C.C.; Moldowan, J.M. The Biomarker Guide: Biomarkers and Isotopes in Petroleum Exploration and Earth History; The Press Syndicate of the University of Cambridge: Cambridge, MA, USA, 2005; Volume 2. [Google Scholar]
  53. Peters, K.E.; Peters, K.E.; Walters, C.C.; Moldowan, J.M. The Biomarker Guide; Cambridge University Press: Cambridge, MA, USA, 2005; Volume 1. [Google Scholar]
  54. Xiao, H.; Wang, T.G.; Li, M.J.; Cheng, D.; Yang, Z. Organic geochemical heterogeneity of the Cretaceous Abu Gabra Formation and reassessment of oil sources in the Sufyan sub-basin, Sudan. Org. Geochem. 2021, 162, 104301. [Google Scholar] [CrossRef]
  55. Shanmugam, G. Significance of coniferous rain forests and related organic matter in generating commercial quantities of oil, Gippsland Basin, Australia. AAPG Bull. 1985, 69, 1241–1254. [Google Scholar] [CrossRef]
  56. Huang, W.Y.; Meinschein, W.G. Sterols as ecological indicators. Geochim. Cosmochim. Acta 1979, 43, 739–745. [Google Scholar] [CrossRef]
  57. Ekweozor, C.M.; Strausz, O.P. Tricyclic terpanes in the Athabasca oil sands: Their geochemistry. Adv. Org. Geochem. 1981, 1983, 746–766. [Google Scholar]
  58. Xiao, H.; Wang, T.G.; Li, M.J.; Fu, J.; Tang, Y.J.; Shi, S.B.; Yang, Z.; Lu, X.L. Occurrence and Distribution of Unusual Tri- and Tetracyclic Terpanes and Their Geochemical Significance in Some Paleogene Oils from China. Energy Fuels 2018, 32, 7393–7403. [Google Scholar] [CrossRef]
  59. Xiao, H.; Li, M.J.; Yang, Z.; Zhu, Z.L. Distribution patterns and geochemical implications of C19–C23 tricyclic terpanes in source rocks and crude oils occurring in various depositional environments. Geochimica 2019, 48, 161–170, (In Chinese with English abstract). [Google Scholar]
  60. Bohacs, K.M.; Carroll, A.R.; Neal, J.E.; Mankiewicz, P.J. Lake-basin type, source potential, and hydrocarbon character: An integrated Sequence-Stratigraphic-Geochemical framework. AAPG Stud. Geol. 2000, 46, 3–34. [Google Scholar]
Figure 1. Regional geographic map of the northern South China Sea and Qiongdongnan Basin (QDNB). (a) Geographic location of the QDNB in the northwestern South China Sea and the location of gas hydrate drilling site GMGS5-W08 in this study [7,8,12,13]; (b) representative seismic profiles at site GMGS5-W08 [7,8,12,13], MTDn, mass transport deposit (n = 1–3); (c) well logging profiles of site GMGS5-W08; (df) representative core photos of gas hydrates at the site GMGS5-W08.
Energies 17 00412 g001
Figure 2. The representative seismic profiles crossing the site GMGS5-W08 showing the faults and stratigraphic sequences in the Qiongdongnan Basin.
Energies 17 00412 g002
Figure 3. (ad) n-alkanes distributions (total ion current, TIC) and (eh) tricyclic terpane distributions (m/z 191 mass fragmentograms) in saturated hydrocarbon fractions of some representative samples at the site GMGS5-W08. CnTT, Cntricyclic terpane. C24TeT, C24 Tetracyclic terpane, similarly to other compounds. R, S, the configuration of compounds.
Energies 17 00412 g003
Figure 4. (ad) Triterpane distributions (m/z 191 mass fragmentograms) and (eh) sterane distributions (m/z 217 mass fragmentograms) in saturated hydrocarbon fractions of representative samples at the site GMGS5-W08. C30H, C30Hopane, C29M, C29Moretane, similarly to other compounds. R, S, the configuration of compounds. C27St, Regular C27 Sterane, C28S, Regular C28 Sterane, C29St, Regular C29 Sterane.
Energies 17 00412 g004
Figure 5. (ad) Phenanthrene distributions (m/z 178 mass fragmentograms), methyl-phenanthrenes distributions (m/z 192 mass fragmentograms), (eh) naphthalene distributions (m/z 128 mass fragmentograms) and trimethyl-naphthaleneon distributions (m/z 170 mass fragmentograms) in aromatic hydrocarbon fractions of representative samples at the site GMGS5-W08. hen, phenanthrene, and 3-, 2-, 9-, 1-MP are the 3-, 2-, 9-, 1-methyl-phenanthrenes, respectively. N, naphthalene, and 1,3,7-, 1,3,6-, 1,4,6 + 1,3,5-, 2,3,6-, 1,2,4-, 1,2,5-, 1,4,5-TMN are the 1,3,7-, 1,3,6-, 1,4,6 + 1,3,5-, 2,3,6-, 1,2,4-, 1,2,5-, 1,4,5-trimethyl-naphthaleneon, respectively.
Energies 17 00412 g005
Figure 6. Genetic diagrams showing the genetic types of the hydrate-related gas samples at the site GMGS5-W08. (a) Plot of δ13C1 versus C1/(C2 + C3). The diagram is modified from [43] (b) plot of δD1 versus δ13C1. The diagram is modified from [43]. CR, CO2 reduction; F, methyl-type fermentation; SM, secondary microbial gas; OA, oil-associated thermogenic gas; EMT, early mature thermogenic gas; LMT, late-mature thermogenic gas.
Energies 17 00412 g006
Figure 7. Vertical variation in the geochemical characteristics of the hydrate-related gas samples at the site GMGS5-W08. (a) Vertical distribution of sample C1/C2+ values; (b) Vertical distribution of sample C1/(C2+ C3) values; (c) Vertical distribution of sample δC1(‰)values; (d) Vertical distribution of sample δC2(‰)values; (e) Vertical distribution of sample δC3(‰)values; (f) Microbial gas proportion = (δ13C mixed gas sample − δ13C pure thermogenic gas)/(δ13C pure primary microbial gas − δ13C pure thermogenic gas). The diagram is modified from [14].
Energies 17 00412 g007
Figure 8. Vertical variation in TOC and Rock-Eval pyrolysis of the hydrate-bearing sediments at the site GMGS5-W08. (a) Vertical distribution of sample TOC values; (b) Vertical distribution of sample S1 values and S2 values; (c) Vertical distribution of sample Tmax values.
Energies 17 00412 g008
Figure 9. Vertical changes in showing various EOM inputs at the site GMGS5-W08. (a) Vertical distribution of sample ∑nC22+/∑nC21− values; (b) Vertical distribution of sample TAR values.
Energies 17 00412 g009
Figure 10. Phytane to n-C18 alkane (Ph/nC18) versus pristane to n-C17 alkane (Pr/nC17) showing depositional conditions and type of organic matter at the site GMGS5-W08. The diagram is modified from [55].
Energies 17 00412 g010
Figure 11. Ternary diagram of regular steranes (C27, C28, and C29) at the site GMGS5-W08 showing the relationship between sterane compositions and organic matter input. The diagram is modified from [56].
Energies 17 00412 g011
Figure 12. Vertical variation in showing various organic matter depositional environment at the site GMGS5-W08. (a) Vertical distribution of sample Pr/Ph values; (b) Vertical distribution of sample C24TeT/C26TT values; (c) Vertical distribution of sample DBT/Phen values.
Energies 17 00412 g012
Figure 13. Ternary diagram of C19+20TT, C21TT, and C23TT to discriminate the various depositional environments at the site GMGS5-W08. The diagram is modified from [59].
Energies 17 00412 g013
Figure 14. DBT/Phen versus Pr/Ph to discriminate the various depositional environments at the site GMGS5-W08.
Energies 17 00412 g014
Figure 15. Vertical variation in maturity of the hydrate-bearing sediments at the site GMGS5-W08. (a) Vertical distribution of sample C3122S/(22S+22R) values; (b) Vertical distribution of sample Ts/(Ts+Tm) values; (c) Vertical distribution of sample %Rc values; (d) Vertical distribution of sample %Rcb values (e) Vertical distribution of sample F1 values; (f) Vertical distribution of sample F2 values.
Energies 17 00412 g015
Figure 16. Diagram showing the maturity of the hydrate-bearing sediments at the site GMGS5-W08. (a) Plot of C29 ββ/(ββ + αα) versus C29 20S/(20S + 20R). (b) Plot of F1 versus F2.
Energies 17 00412 g016
Table 1. Molecular and isotopic compositions of gas hydrates from GMGS5-W08.
Depth (mbsf)GaseousC1/(C2 + C3)Isotopic Composition (‰)Reference
Hydrocarbon Composition (%)Molar Ratio
C1C2C3C3+ δ13C1δ13C2δ13C3δD1
4597.282.590.050.0836.85 −58.3−25.1−20.2n.d.This study
81.2396.373.270.250.1127.38 −58.8−24.5−20.2n.d.
14685.1910.433.50.886.12 −51.2−26.6−22.7n.d.
897.52.20.050.2543.33−59.5−26−22.4−187Data from [14]
17.0796.952.60.10.3533.32−57.6−26.6−20.6−169
6095.63.40.70.323.32−60.9−28.4−24.6−181
63.1896.23.30.390.1126.07−54.6−22n.d.−178
7994.175.110.72016.15−58.6−25.1−21.6−170
112.394.225.020.750.0116.33−53.8−23.3−20.7−175
145.6573.6218.517.8702.79−49.3−27.5−23n.d.
15876.115.438.4803.18−50.4−26.9−22.2−183
187.189.226.714.0808.27−50.4−26.7−23.2−180
63.7396.72.70.40.231.19−63.7−28.8−23.7n.d.Data from [11]
64.797.22.50.20.136−61.1−29.2n.d.n.d.
170.272.512.111.34.13.1−52−27−24.4n.d.
87.3592.25.31.650.8513.27n.d.n.d.n.d.n.d.Data from [8]
89.6690.56.32.240.9610.6n.d.n.d.n.d.n.d.
90.2389.96.52.451.1510.04n.d.n.d.n.d.n.d.
142.3987.49.31.941.367.78n.d.n.d.n.d.n.d.
164.4970.117.69.882.422.55n.d.n.d.n.d.n.d.
Note: n.d., no data.
Table 2. Geochemical results of TOC, Rock-Eval pyrolysis and EOM of the hydrate-bearing sediments at the site GMGS5-W08.
Depth (mbsf)LithologyTOC
(wt.%)
Tmax
(°C)
S1
(mg/g)
S2
(mg/g)
S3
(mg/g)
HIOIPIOrganic Extracts (mg/g)Saturate
%
Aromatic
%
Resein
%
Asphaleten
%
2.50–2.85Silty clay0.633700.050.281.5044.11236.290.150.995.151.465.9287.47
9.10–9.15Silty clay0.713760.020.371.5752.26221.750.050.2321.6713.6121.1143.61
45.20–45.30Silty clay0.563870.080.341.4260.67253.390.190.2119.8317.5315.8046.84
87.15–87.25Silty clay0.553660.090.251.2345.45223.640.260.3325.4712.1712.1750.19
112.20–112.25Silty clay0.583590.120.231.3439.40229.570.340.2514.7816.3617.1551.72
145.55–145.65Silty clay0.363740.090.161.2644.26348.550.360.367.884.441.2186.46
148.00–148.14Silty clay0.453740.100.191.2442.53277.590.340.313.6811.958.2876.09
148.60–148.70Silty clay0.493740.100.191.1238.61227.600.340.2413.203.3716.5766.85
164.10–164.20Silty clay0.453730.100.181.1340.00251.110.360.2513.203.3716.5766.85
176.20–176.30Silty clay0.403750.090.161.2439.92309.380.360.3618.184.7111.4565.66
187.20–187.30Silty clay0.443820.110.201.1845.19266.610.350.3719.445.3013.1362.12
Note: TOC, total organic carbon content, wt.%. Tmax, the temperature at which the S2 yield reaches a peak. S1, the amount of free hydrocarbons (HC) in a sample before the analysis, mg HC/g rock. S2, the amount of hydrocarbons that result from cracking of kerogen in a sample, mg HC/g rock. S3, the amount of carbon dioxide produced by pyrolysis of organic matter in a sample. HI, hydrocarbon index, HI = S2/TOC × 100, mg HC/g TOC. OI, oxygen index, OI = S3/TOC × 100, mg CO2/g TOC. PI, production index, PI = S1/(S1 + S2).
Table 3. Selected biomarker parameters relative to the composition of n-alkanes, terpanes, and steranes of EOM of samples at the site GMGS5-W08.
Depth (mbsf)n-Alkanes and Isoprenoid Ratios Terpanes Steranes
Max. PeakPr/
Ph
Pr/
nC17
Ph/
nC18
nC22+/∑nC21−CPIOEPTARC23TT/
C21TT
C24TeT/
C26TT
Ts/
(Ts + Tm)
St.C3122S
/(22S + 22R)
St.C2920S/
(20S + 20R)
St.C29ββ/
(ββ + αα)
C27 Diasterane/St.C27
2.50–2.85nC16,
nC31
0.220.854.780.76 1.211.230.472.140.860.440.380.420.410.67
9.10–9.15nC16,
nC31
1.110.740.661.08 2.022.261.701.321.110.430.390.390.360.75
45.20–45.30nC16,
nC31
1.010.710.611.09 1.882.091.561.390.890.430.400.310.300.42
87.15–87.25nC16,
nC31
0.880.770.701.03 0.860.710.232.240.720.600.320.410.390.70
112.20–112.25nC16,
nC31
0.880.650.650.66 1.551.820.581.500.670.700.510.580.470.58
145.55–145.65nC171.240.830.720.64 0.830.650.131.630.530.730.500.320.350.59
148.00–148.14nC171.210.680.630.73 0.830.680.191.650.490.710.500.430.350.68
148.60–148.70nC171.090.730.730.75 1.812.190.751.450.510.700.530.330.340.64
164.10–164.20nC171.301.000.770.88 0.890.890.351.390.520.700.560.270.270.29
176.20–176.30nC171.110.730.660.49 1.371.560.291.380.540.710.540.300.340.52
187.20–187.30nC171.190.760.690.50 1.461.730.371.440.590.690.550.340.330.65
Note: Max. peak, the main (max.) peak of n-alkanes. Pr, pristane. Ph, phytane. CPI, carbon preference index, {[(nC23 + nC25 + nC27) + (nC25 + nC27 + nC29)]/(nC24 + nC26 + nC28)}/2 [38]. OEP, odd-to-even predominance, (nC25 + 6 × nC27 + nC29)/(4 × nC26 + 4 × nC28) [38]. TAR = (nC27 + nC29 + nC31)/(nC15 + nC17 + nC19) [39]. CiTT, Ci tricyclic terpane (i = 21–26). C24TeT, C24 tetracyclic terpane. Ts, 18α(H)-22,29,30-trisnorhopane. Tm, 17α(H)-22,29,30-trisnorhopane. St.C27–29, C27–29 regular sterane.
Disclaimer/Publisher’s Note: The statements, opinions and data contained in all publications are solely those of the individual author(s) and contributor(s) and not of MDPI and/or the editor(s). MDPI and/or the editor(s) disclaim responsibility for any injury to people or property resulting from any ideas, methods, instructions or products referred to in the content.

