Article

Wall Shading Losses of Photovoltaic Systems

School of Electrical Engineering, Tel Aviv University, Tel Aviv 6997801, Israel
*
Author to whom correspondence should be addressed.
Energies 2024, 17(20), 5089; https://doi.org/10.3390/en17205089
Submission received: 3 August 2024 / Revised: 8 October 2024 / Accepted: 10 October 2024 / Published: 13 October 2024

Abstract

:
The deployment of photovoltaic (PV) systems on rooftops in urban environments may encounter shading on the PV collectors from surrounding walls, acting adversely on the generated electricity of the PV systems. Most studies on the shading of PV systems do not deal analytically with the shading losses of PV collectors affected by walls, fences, and obscuring objects. The present article mathematically formulates shadow expressions for wall and inter-row shading on PV collectors and calculates the percentage of annual shading losses affected by wall heights and azimuth angles, the distances of walls to collectors, and the length and azimuth angles of collectors. This study indicates that the shading losses increase for shorter distances from the collector to the walls and for higher walls. Shading losses may reach 7 percent for wall heights of 4 m and at a distance of 2 m from the collectors to a wall. The results indicate that wall shading dominates inter-row shading.

1. Introduction

The deployment of solar photovoltaic (PV) systems on rooftops in urban environments is one of several approaches to utilize potential land areas for electricity generation. This approach may encounter shading on the PV collectors from surrounding buildings, acting adversely on the generated electricity of the PV system. Nearby obscuring buildings, casting shadows on adjacent PV systems, is one example; other cases are obscuring structures on rooftops near PV systems and ridges near PV plants on the ground. The term wall is used in the present study for all types of obscuring structures casting shadows on the PV systems. Wall shading losses refer to the incident solar radiation losses of the PV system caused by wall shading and depend on the height of the wall, the distance from the wall to the PV collectors, the orientation of the wall relative to the PV collectors, and collector azimuth angle. In addition, inter-row shading losses occur on the PV collectors stemming from shading on the second and the subsequent collector rows by the collector rows in front. These losses depend on the inter-row spacing, collector height, collector inclination, and azimuth angles. The term collector is used for a collector row. The combined shading (wall and inter-row) forms shading patterns on the PV collectors that may result in high shading losses and, thus, degrades the performance of the PV system. Unavoidable wall shading on existing PV system installations on rooftops may occur when a new building is erected near the PV system. Figure 1 shows the monitored in-plane solar radiation on an installed PV system after a new building on the east side of the PV system was added. The figure clearly shows the effect of the building shadow on the incident solar radiation in the morning hours.
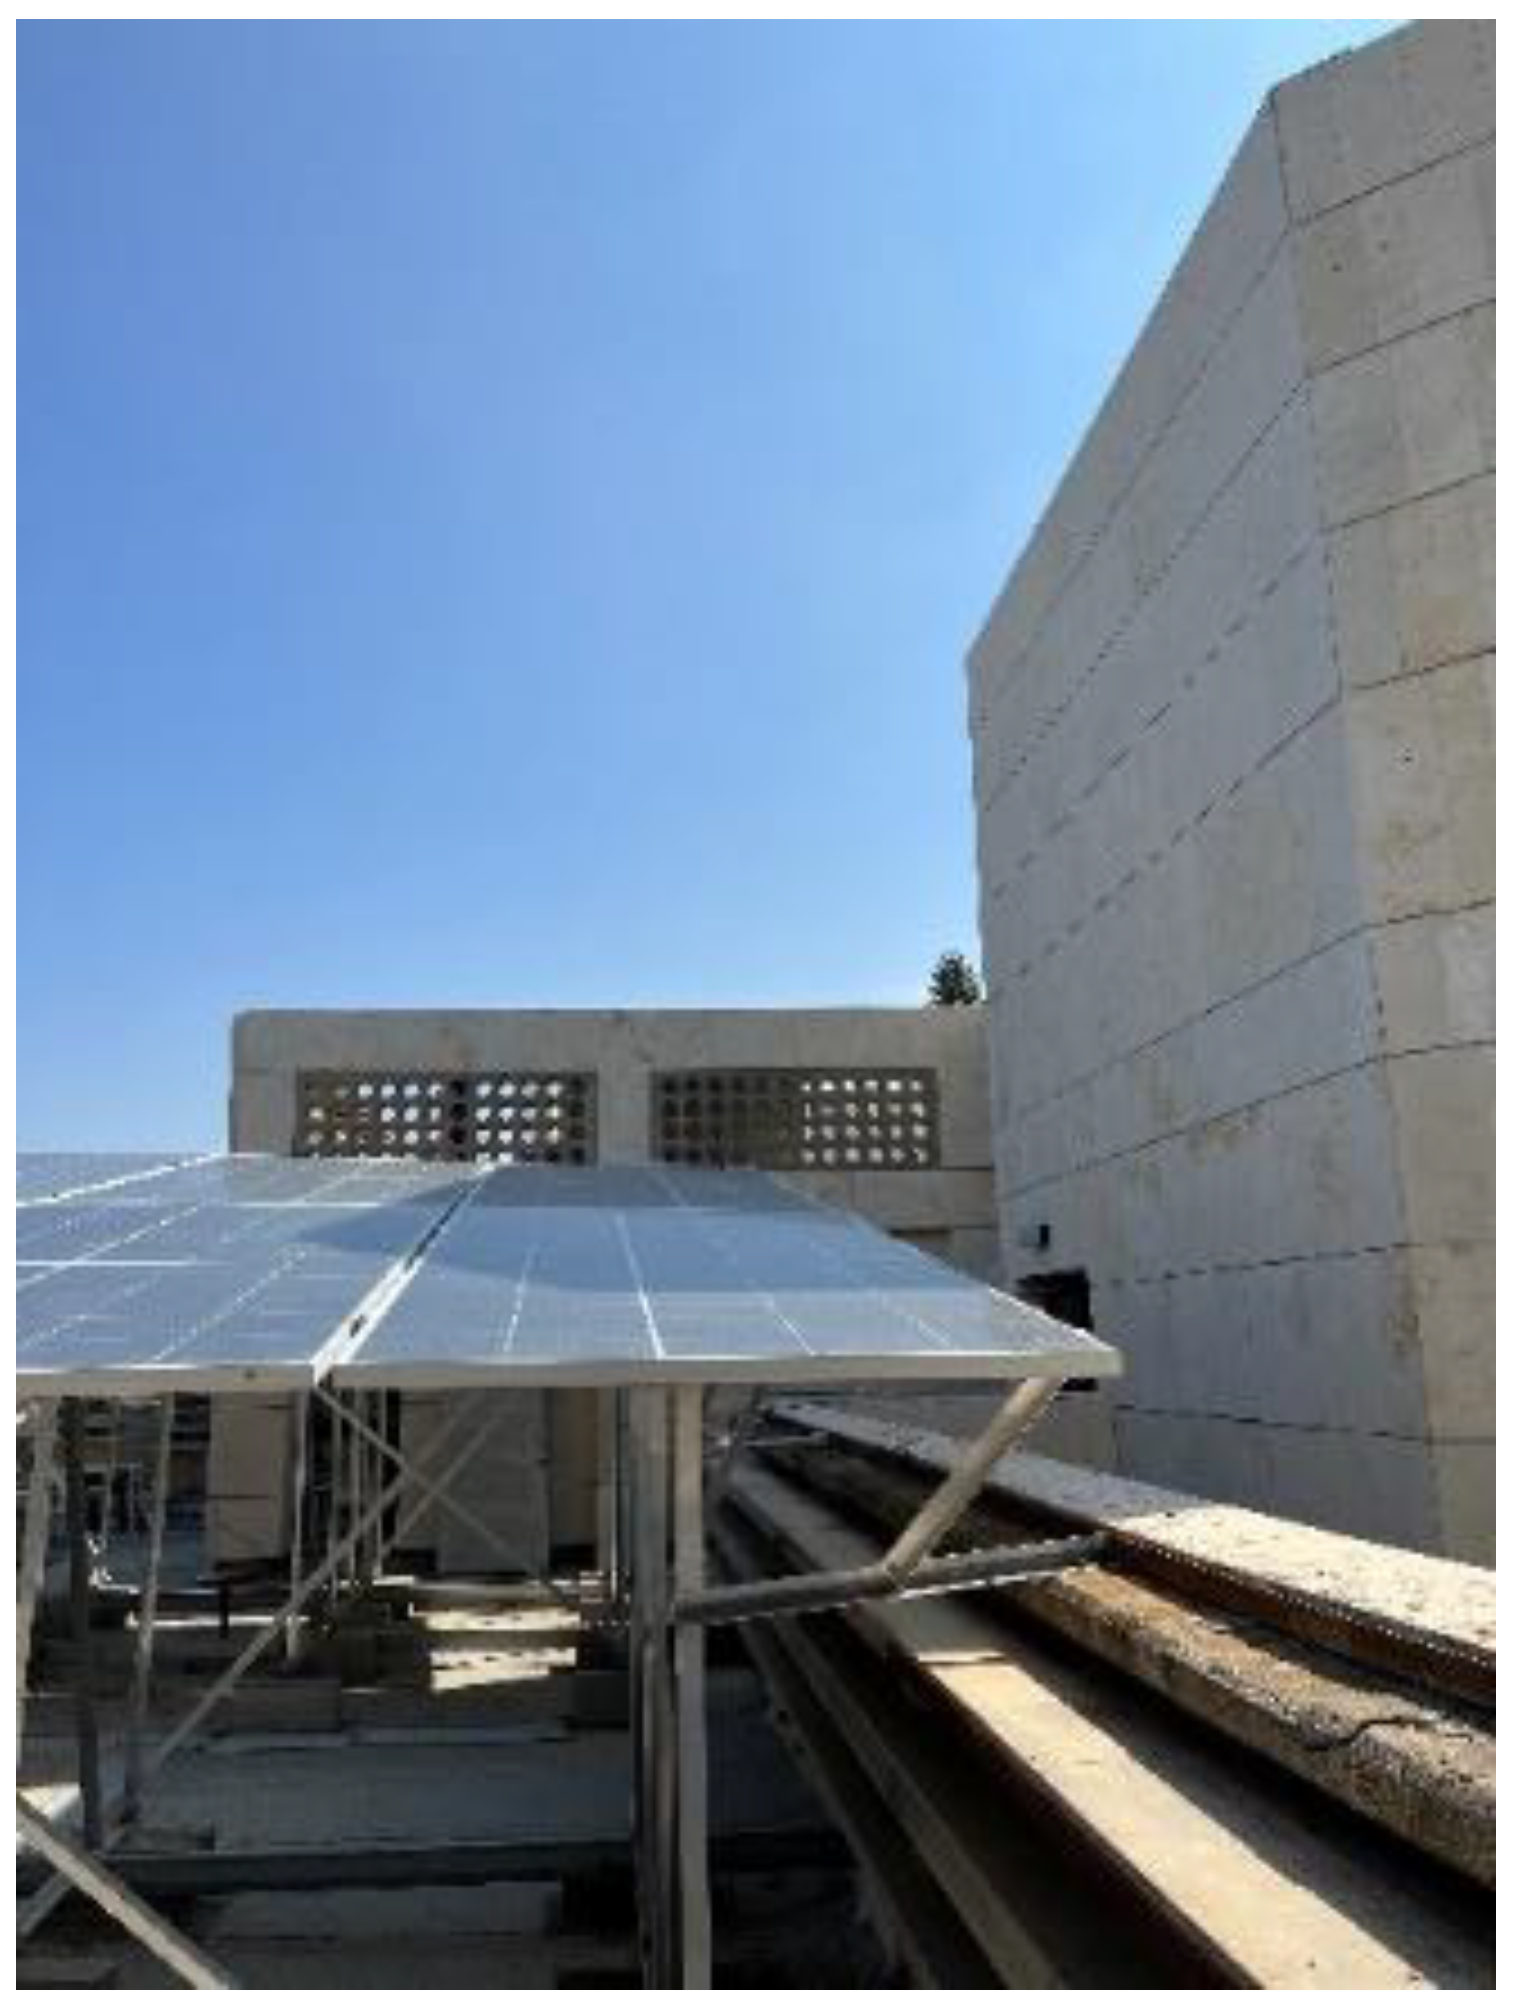
Figure 2 shows a new PV system installed on an existing rooftop near a projected eastern wall. On June 21, in the early morning hours, the wall cast shadows (dark area) on the PV collectors.
Numerous articles dealing with shading on PV systems in urban environments report on the reduction in the electric power outputs of existing installed PV systems caused by shading. A general overview of the parameters affecting the shading on PV systems in urban areas is reported in [1]. An analysis of shading factors using Solar Pro software estimates that the performance of a PV plant near a specific building size of 20 m by 20 m is in [2], considering the height of a building and its distance from the PV plant to obtain zero shading. The experimental effect of shading on the I-V characteristics of PV modules is reported in [3]. The potential of solar photovoltaic and thermal energies in urban areas is studied in [4] in relation to the effects of building aspect ratio, azimuth, and site coverage. A method that calculates shadow maps of roofs and facades for estimating the direct and diffuse solar radiation is presented in [5]. Estimating the electricity production of building integrated photovoltaics (BIPVs) under shadowing conditions is studied in [6]. Shading in PV fields is dealt with in an early study [7]. The shading effect on the PV output power described in [8] states that the energy yield of partially shaded PV systems is much lower than the related shaded area. A mathematical model based on experimental results for estimating the power reduction affected by shading is in [9]. The article in [10] investigates the effect of non-uniform radiation on the energy output of different interconnected configurations of PV arrays. The inter-row spacing and its effect on the collector shading are investigated in References [11,12]. The effect of the variation in the azimuth angle of collectors on the photovoltaic annual energy production is dealt with in Reference [13]. Analytical expressions for shadow height and length were outlined for flat, inclined, and saw-tooth roofs cast by adjacent collectors, including a shadow cast by a wall, are published in [14] and are fundamentally based on the early study in [15]. The simulations of the study in [14] deal mostly with the roof’s inclination angles. The studies in [3,4,5,6,7,8,9,10,11,12,13] deal mainly with the energy yield of partially shaded PV systems stemming from inter-row shading; however, they do not deal analytically with wall shading and their patterns on PV collectors installed near walls. Software programs for simulating the performance of PV systems are available, including those dealing with wall shading [2]; however, the algorithms (mathematical expressions) used in the programs are not apparent (“visible”) to the user. The derivations and sources of mathematical expressions in the open literature are important to the designer of PV systems. The present article extends the study in [14] and formulates mathematical expressions for shadows cast by nearby walls onto PV systems. The simulation study pertains to different wall heights and azimuth angles, different distances from the walls to the collectors, and different collector azimuths and lengths. The final aim of this study is to calculate the percentage of the incident solar radiation losses caused by shading on PV systems installed near walls, mainly in urban environments.

2. Methods and Materials

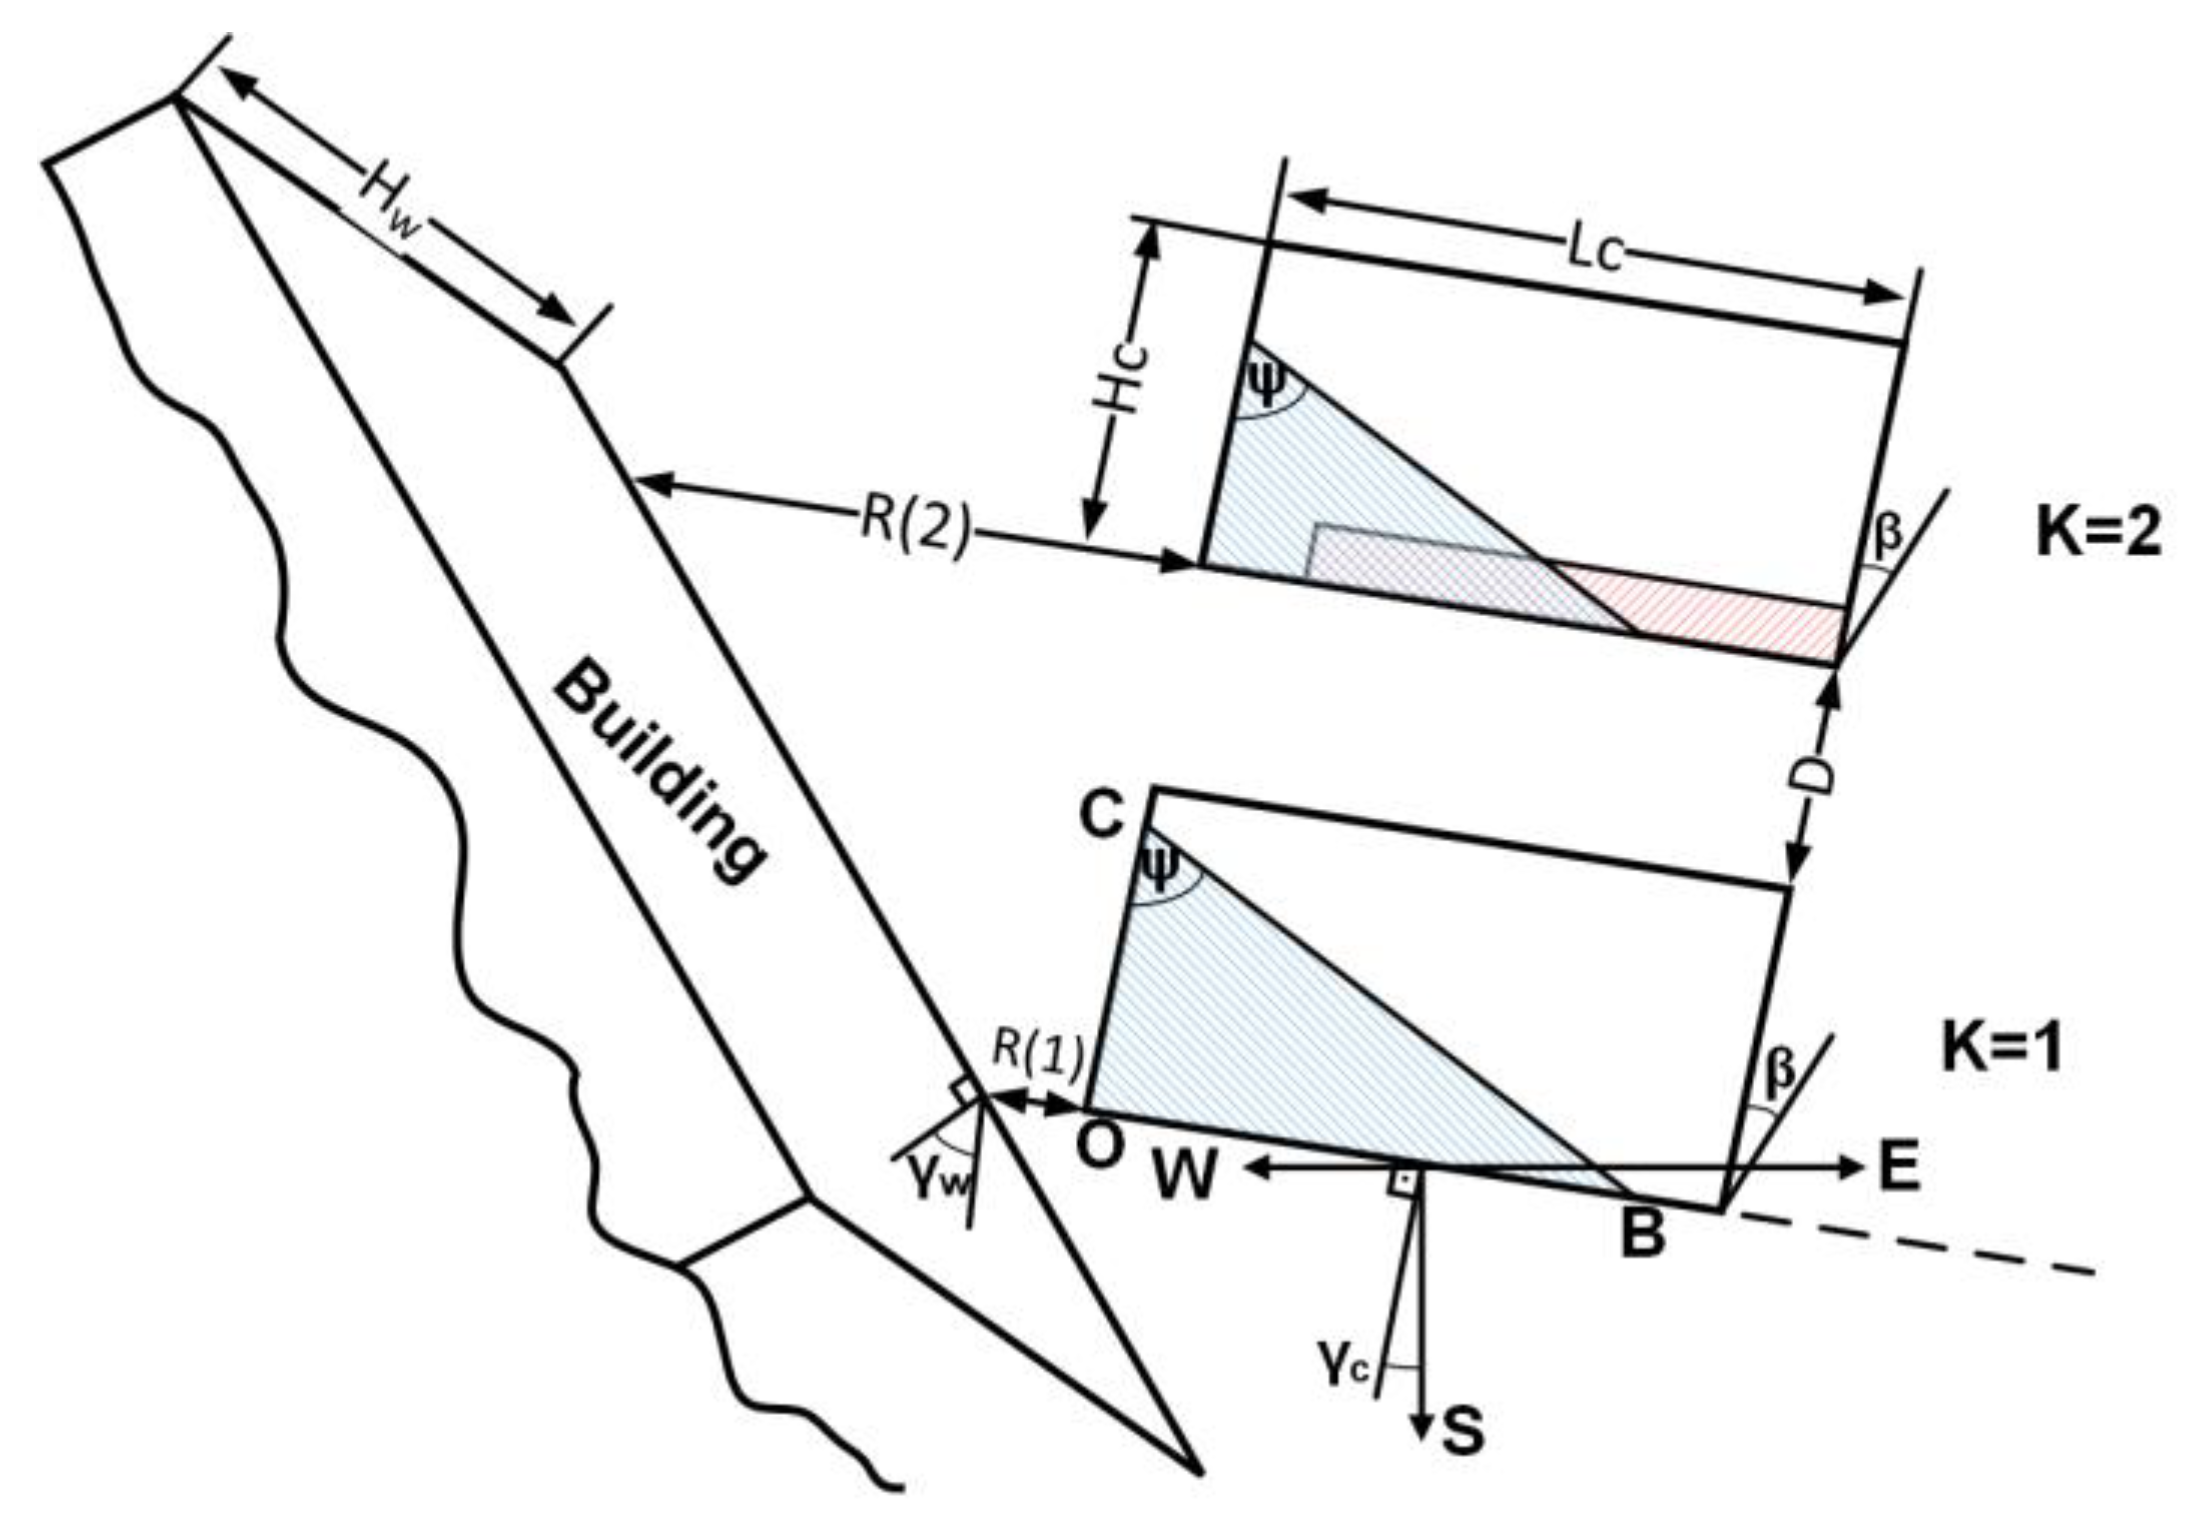
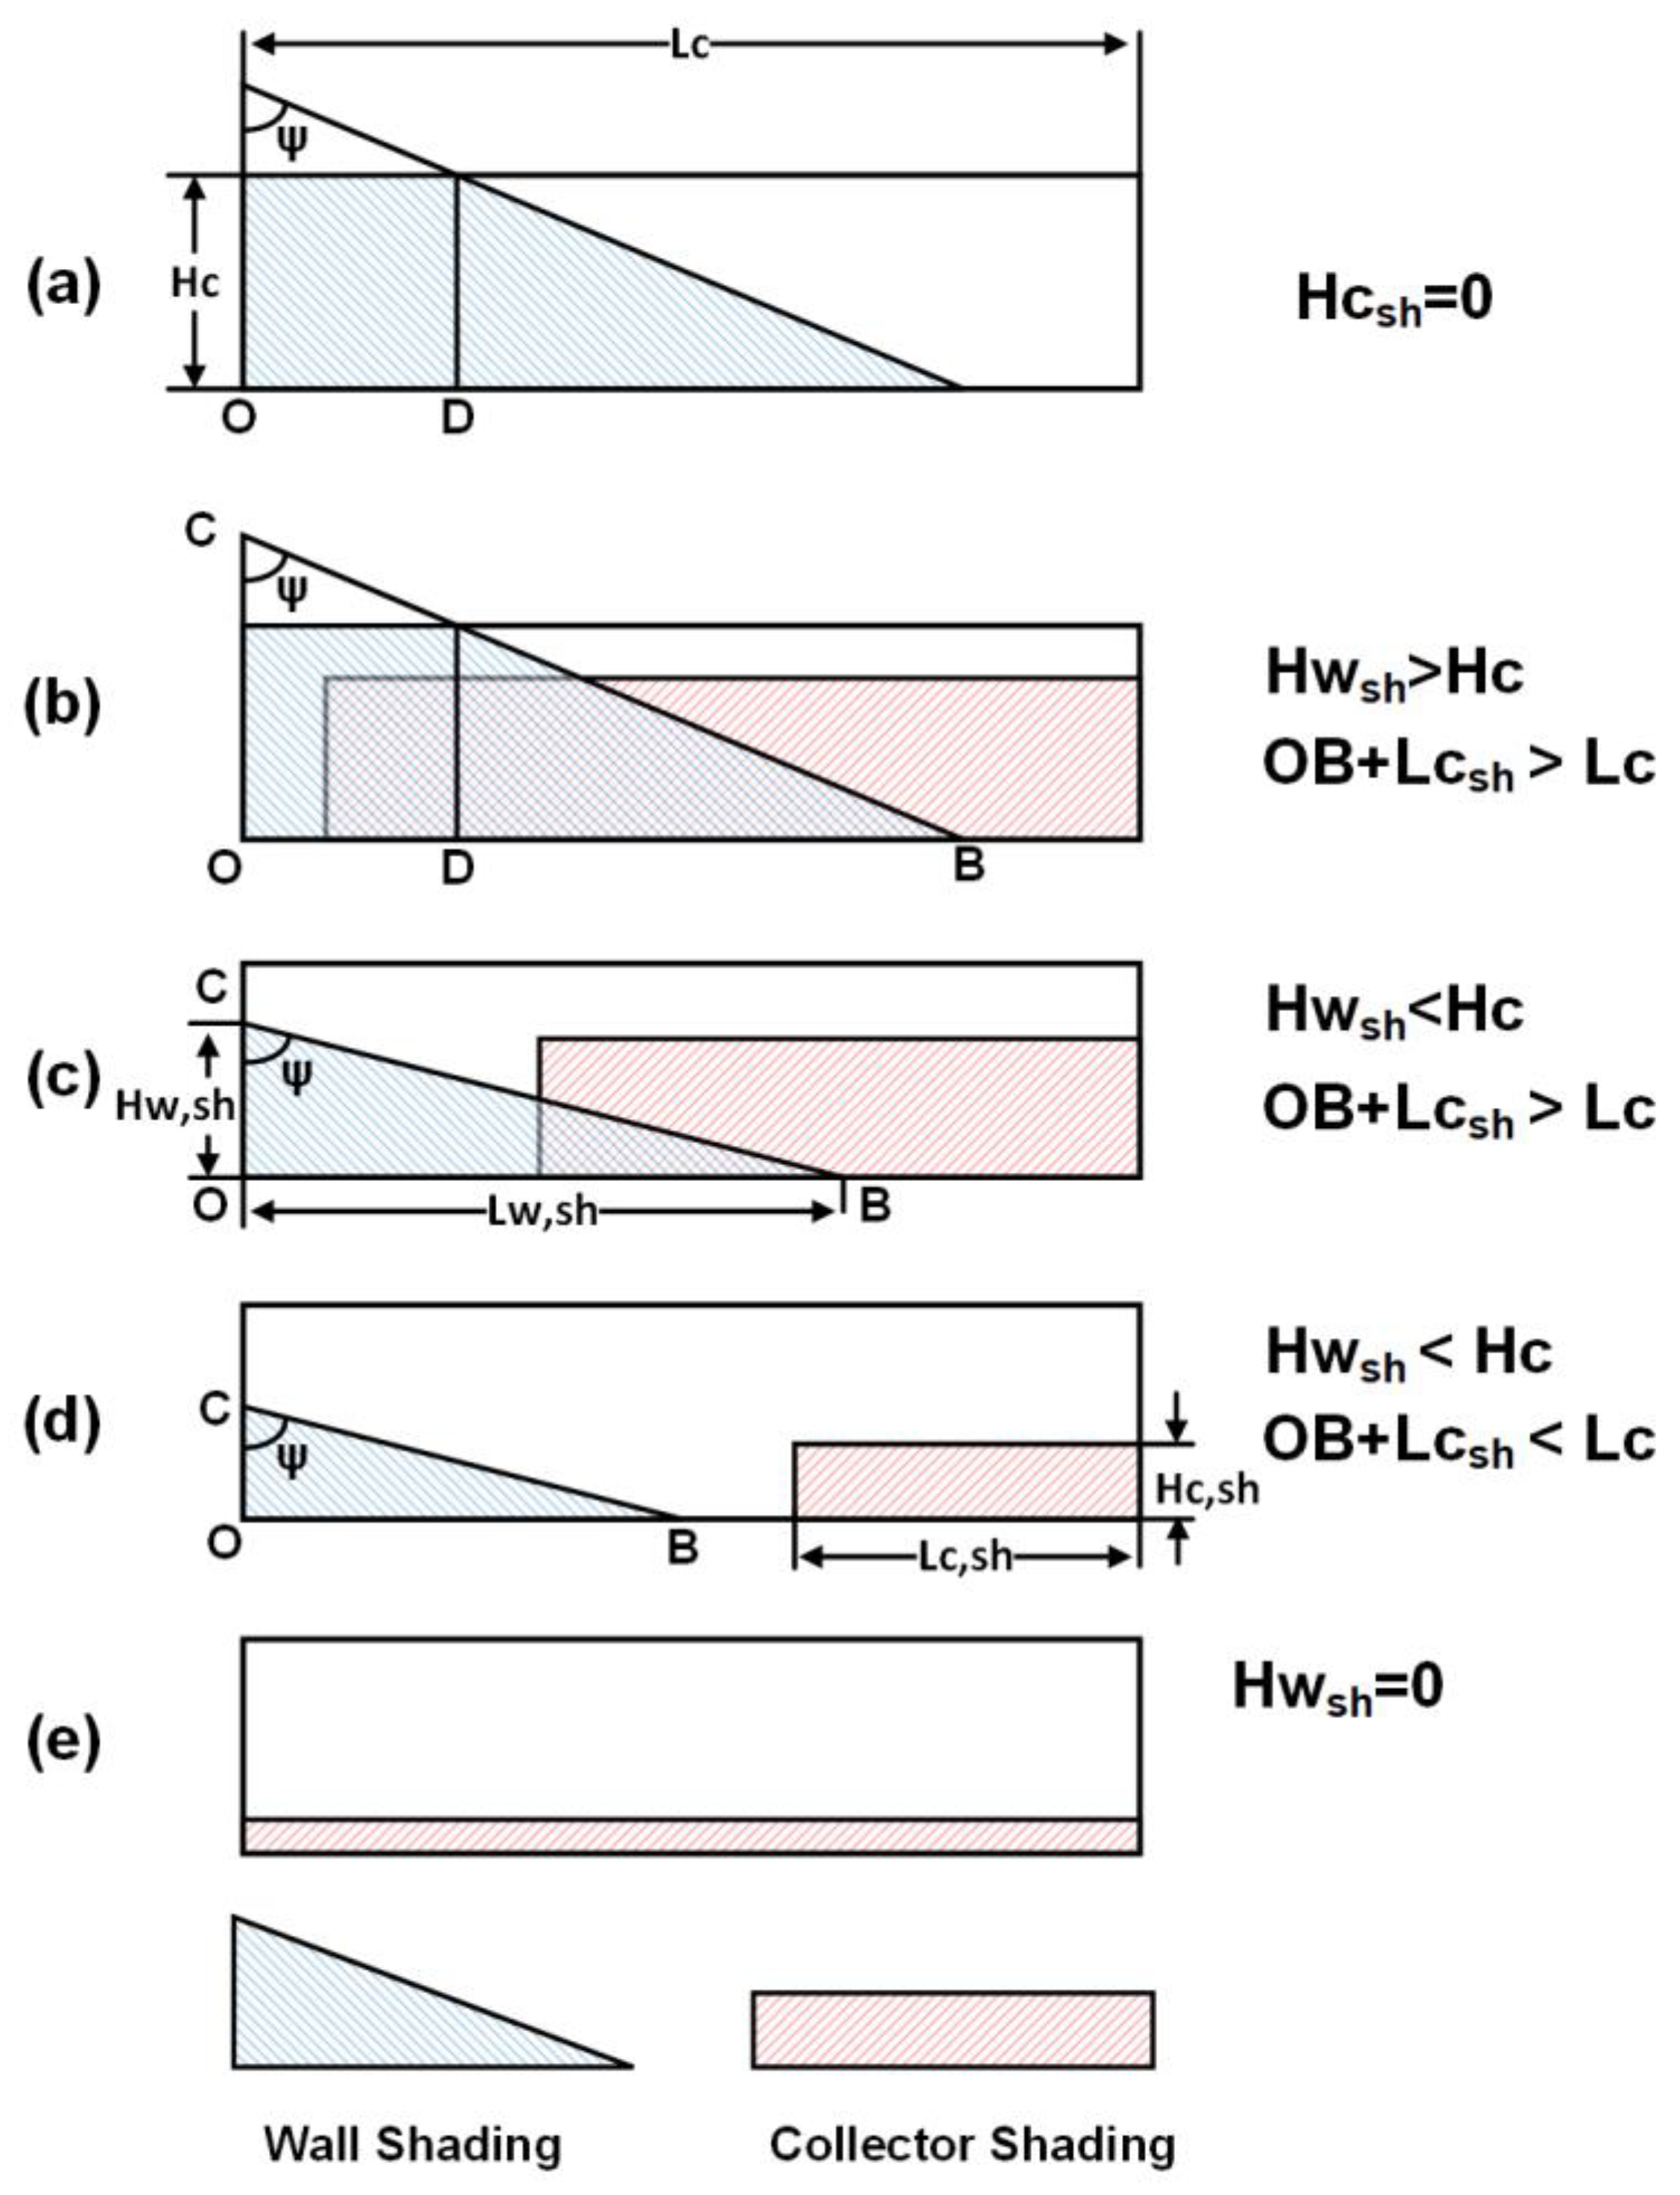
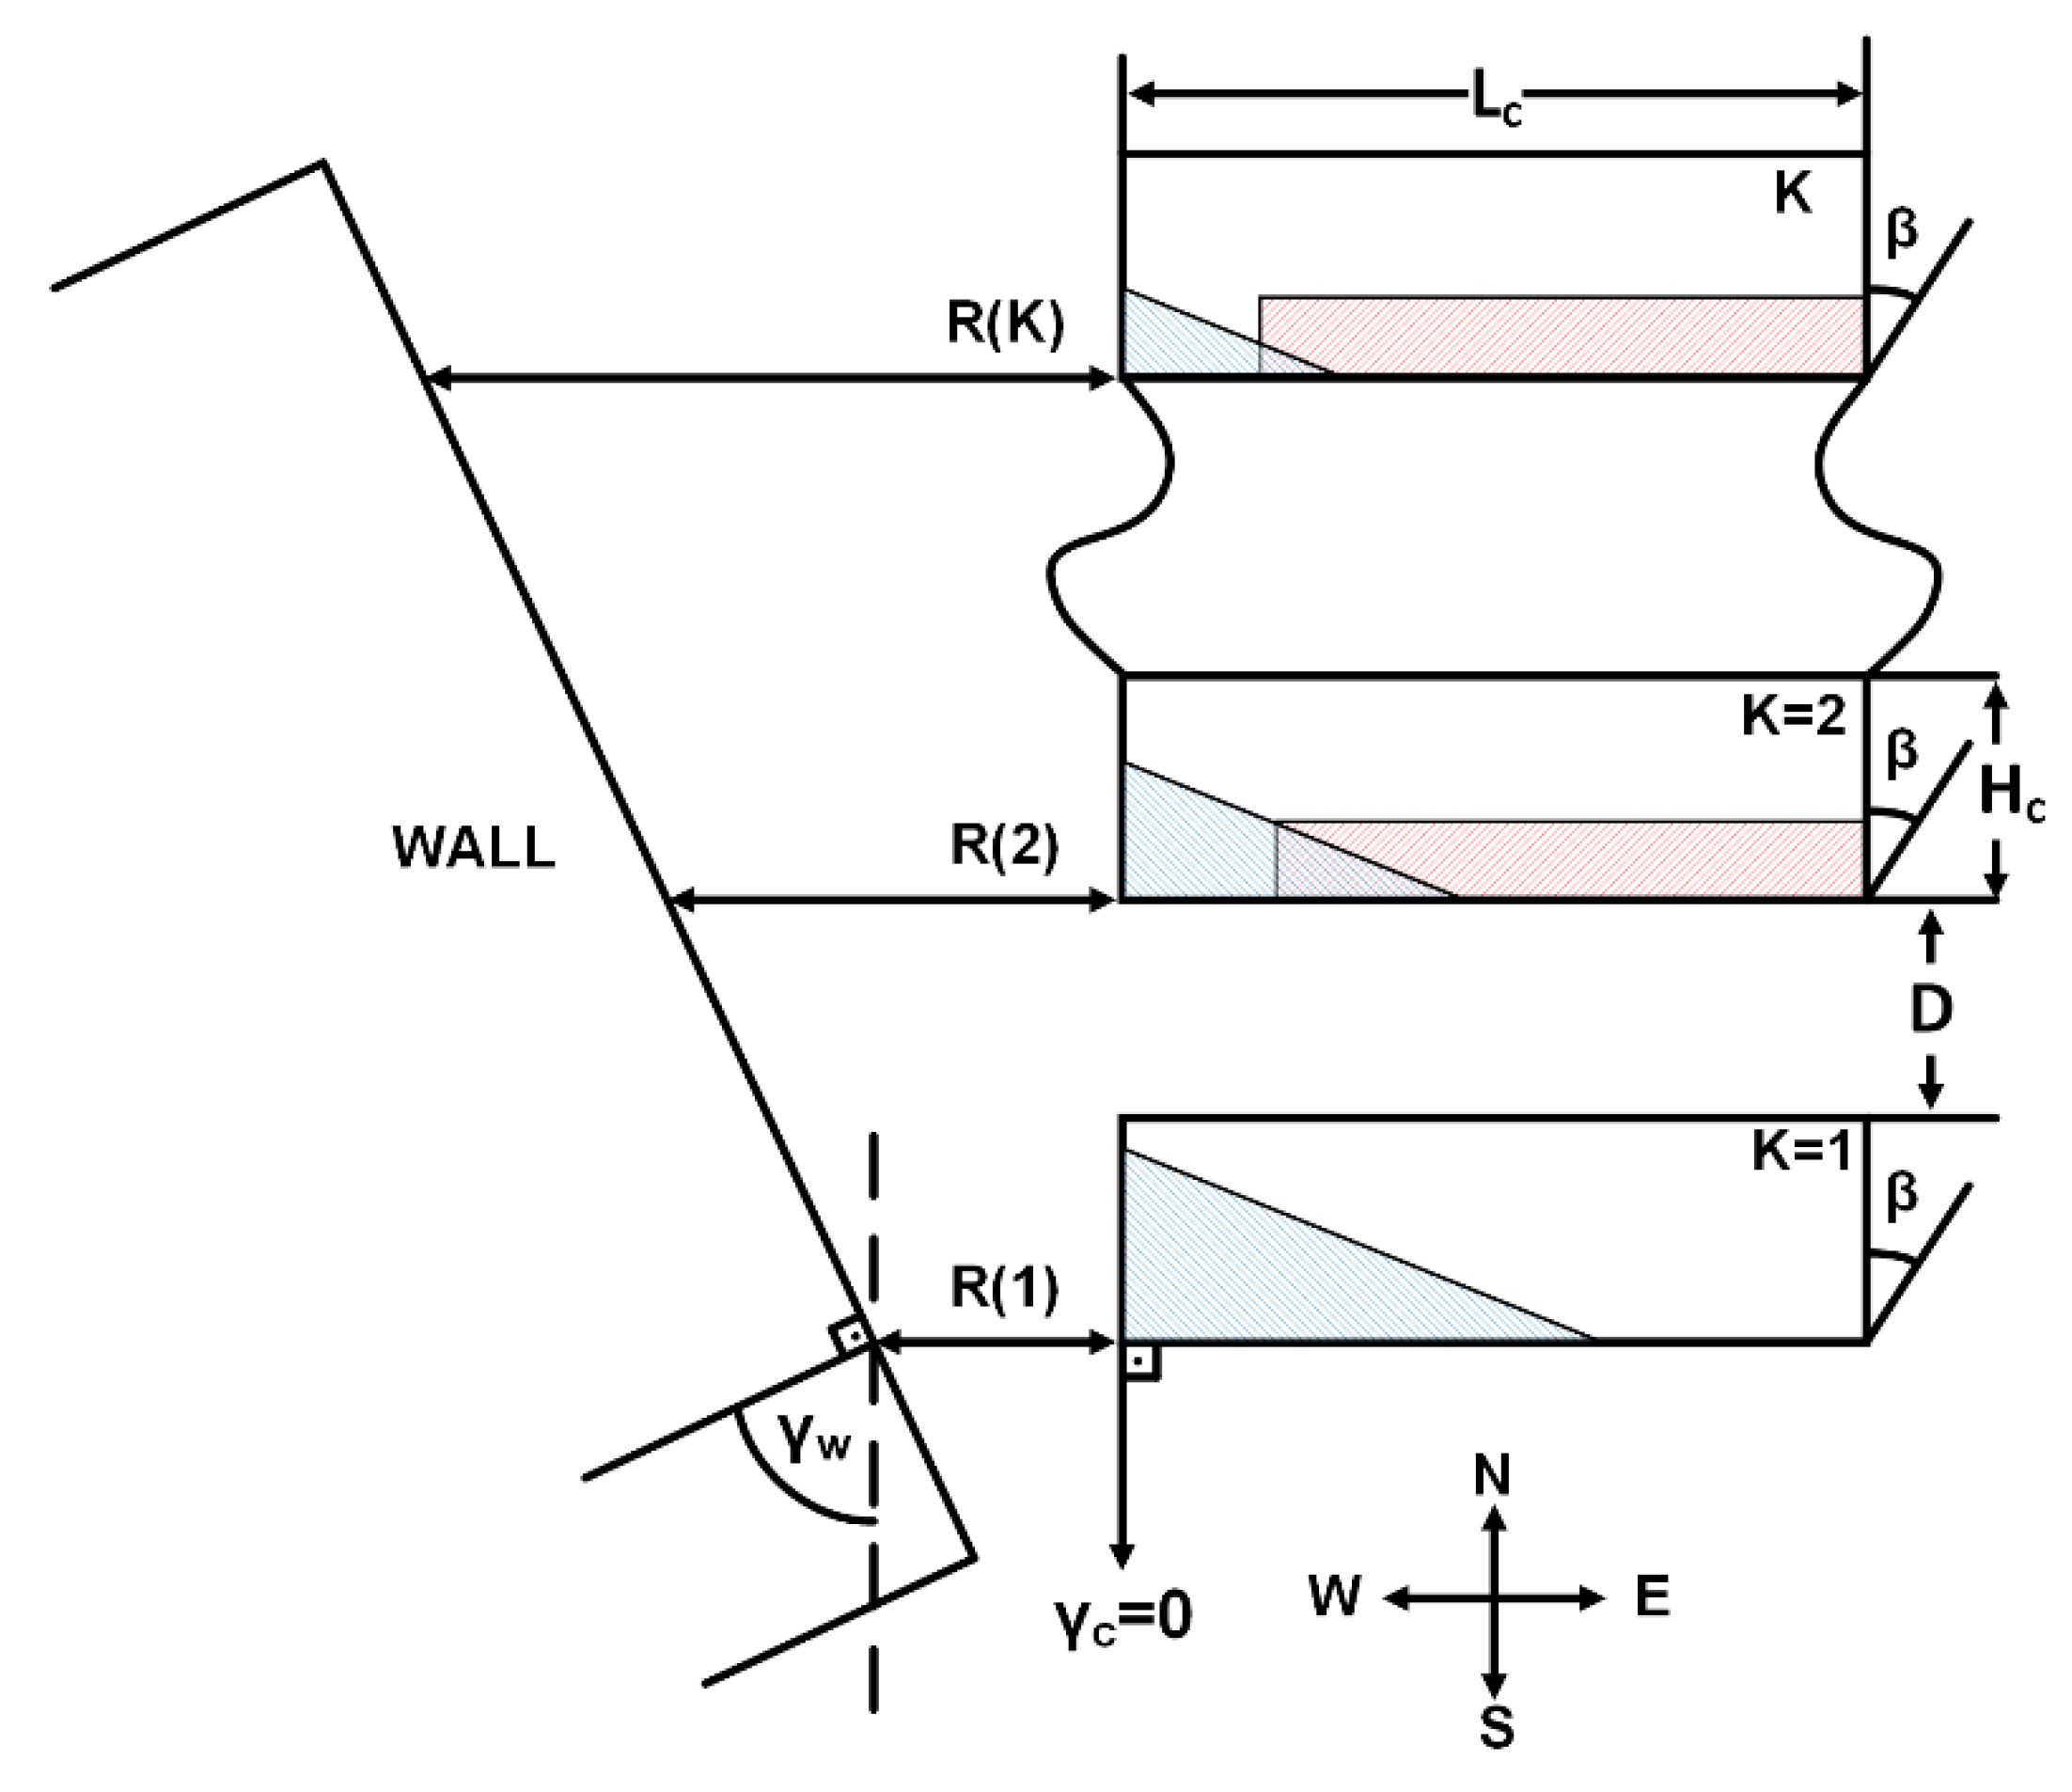
Wall shading losses of photovoltaic systems that were deployed near obscuring walls casting shadows on collectors are mathematically formulated and analyzed in the present study, with respect to shadow patterns cast by walls and by the inter-row shading, including variation in wall height, distance from the wall to the collectors, and collector length and azimuth angle. The analysis pertains to the northern hemisphere and wall dimensions that were larger than the dimensions of the PV system. Figure 3 describes the deployment of photovoltaic collectors on a horizontal solar field in the presence of a vertical wall of a building to the west side of the collectors. The collectors were of length L c and width H c , deployed in an east–west direction and facing a southern direction with an azimuth angle γ C with respect to the south and inclined with an inclination angle β with respect to a horizontal plane. A building of height H W was erected on the west side of the solar field in a south–north direction at a distance R ( 1 ) from the first collector and was oriented with an azimuth angle γ W with respect to the south. The wall cast a shadow on the first collector (wall shading), K = 1 , in a triangular shape with an angle ψ . The height of the shadow was O C and its length was O B . The first collector (front collector) cast a shadow on the second collector (inter-row shading), K = 2 , of length L c s h and height H c s h (see Figure 4). The inter-row shading on the second and on the subsequent collectors by the preceding collectors was independent of the position of the wall relative to the PV collectors; however, the shadow cast on the collectors by the wall ( H W , s h ,   L W , s h ) depends on the position of the wall relative to the collectors. Generally, both types of shadow patterns may take place during the day, and the shadows may overlap with each other. Figure 4 describes the shadow patterns cast by a western wall and by the inter-row shading on the PV collectors in the afternoon hours.
The shaded areas on the collectors were determined according to the marked areas listed in Figure 4. The wall height shading H W , s h may exceed the width H c of the collector and overlapping of the shaded areas (wall and inter-row shading) may take place during the day. The calculation of the shaded areas considers these events. The equation for the wall shadow angle ψ (Equation (1)) is valid for any distance from the wall to the collectors.

2.1. Wall Shading on the First Collector, K = 1

The shadow analysis of PV collectors in the presence of a wall is based on [15].
The shading angle ψ (see Figure 3) of the collectors is given by:
tan ψ = 1 tan γ W cos ( γ S γ C ) tan α sin β + sin ( γ S γ C ) tan α sin β
The shadow length O B is:
O B = H w cos ( γ S γ C γ W ) tan α sin γ W R ( 1 )
and the shadow height O C is:
O C = L w s h / tan ψ
where the sun’s altitude angle α is:
sin α = sin ϕ sin δ + cos ϕ cos δ cos ω
ϕ —collector latitude, δ —declination angle, γ S —solar azimuth angle, γ W —wall angle, ω —hour angle.

2.2. Inter-Row Shading on the Second Collector, K = 2

The equations for the inter-row shadow height and length, respectively, on the second and on the subsequent collectors cast by the preceding collectors are given in [14]:
H c s h = H c ( 1 D + H c cos β H c cos β + H c sin β cos ( γ S γ C ) / tan α )
L c s h = L c ( D + H c cos β ) sin β sin ( γ S γ C / tan α cos β + sin β cos ( γ S γ C ) / tan α

2.3. General Deployment of PV Collectors near a Wall

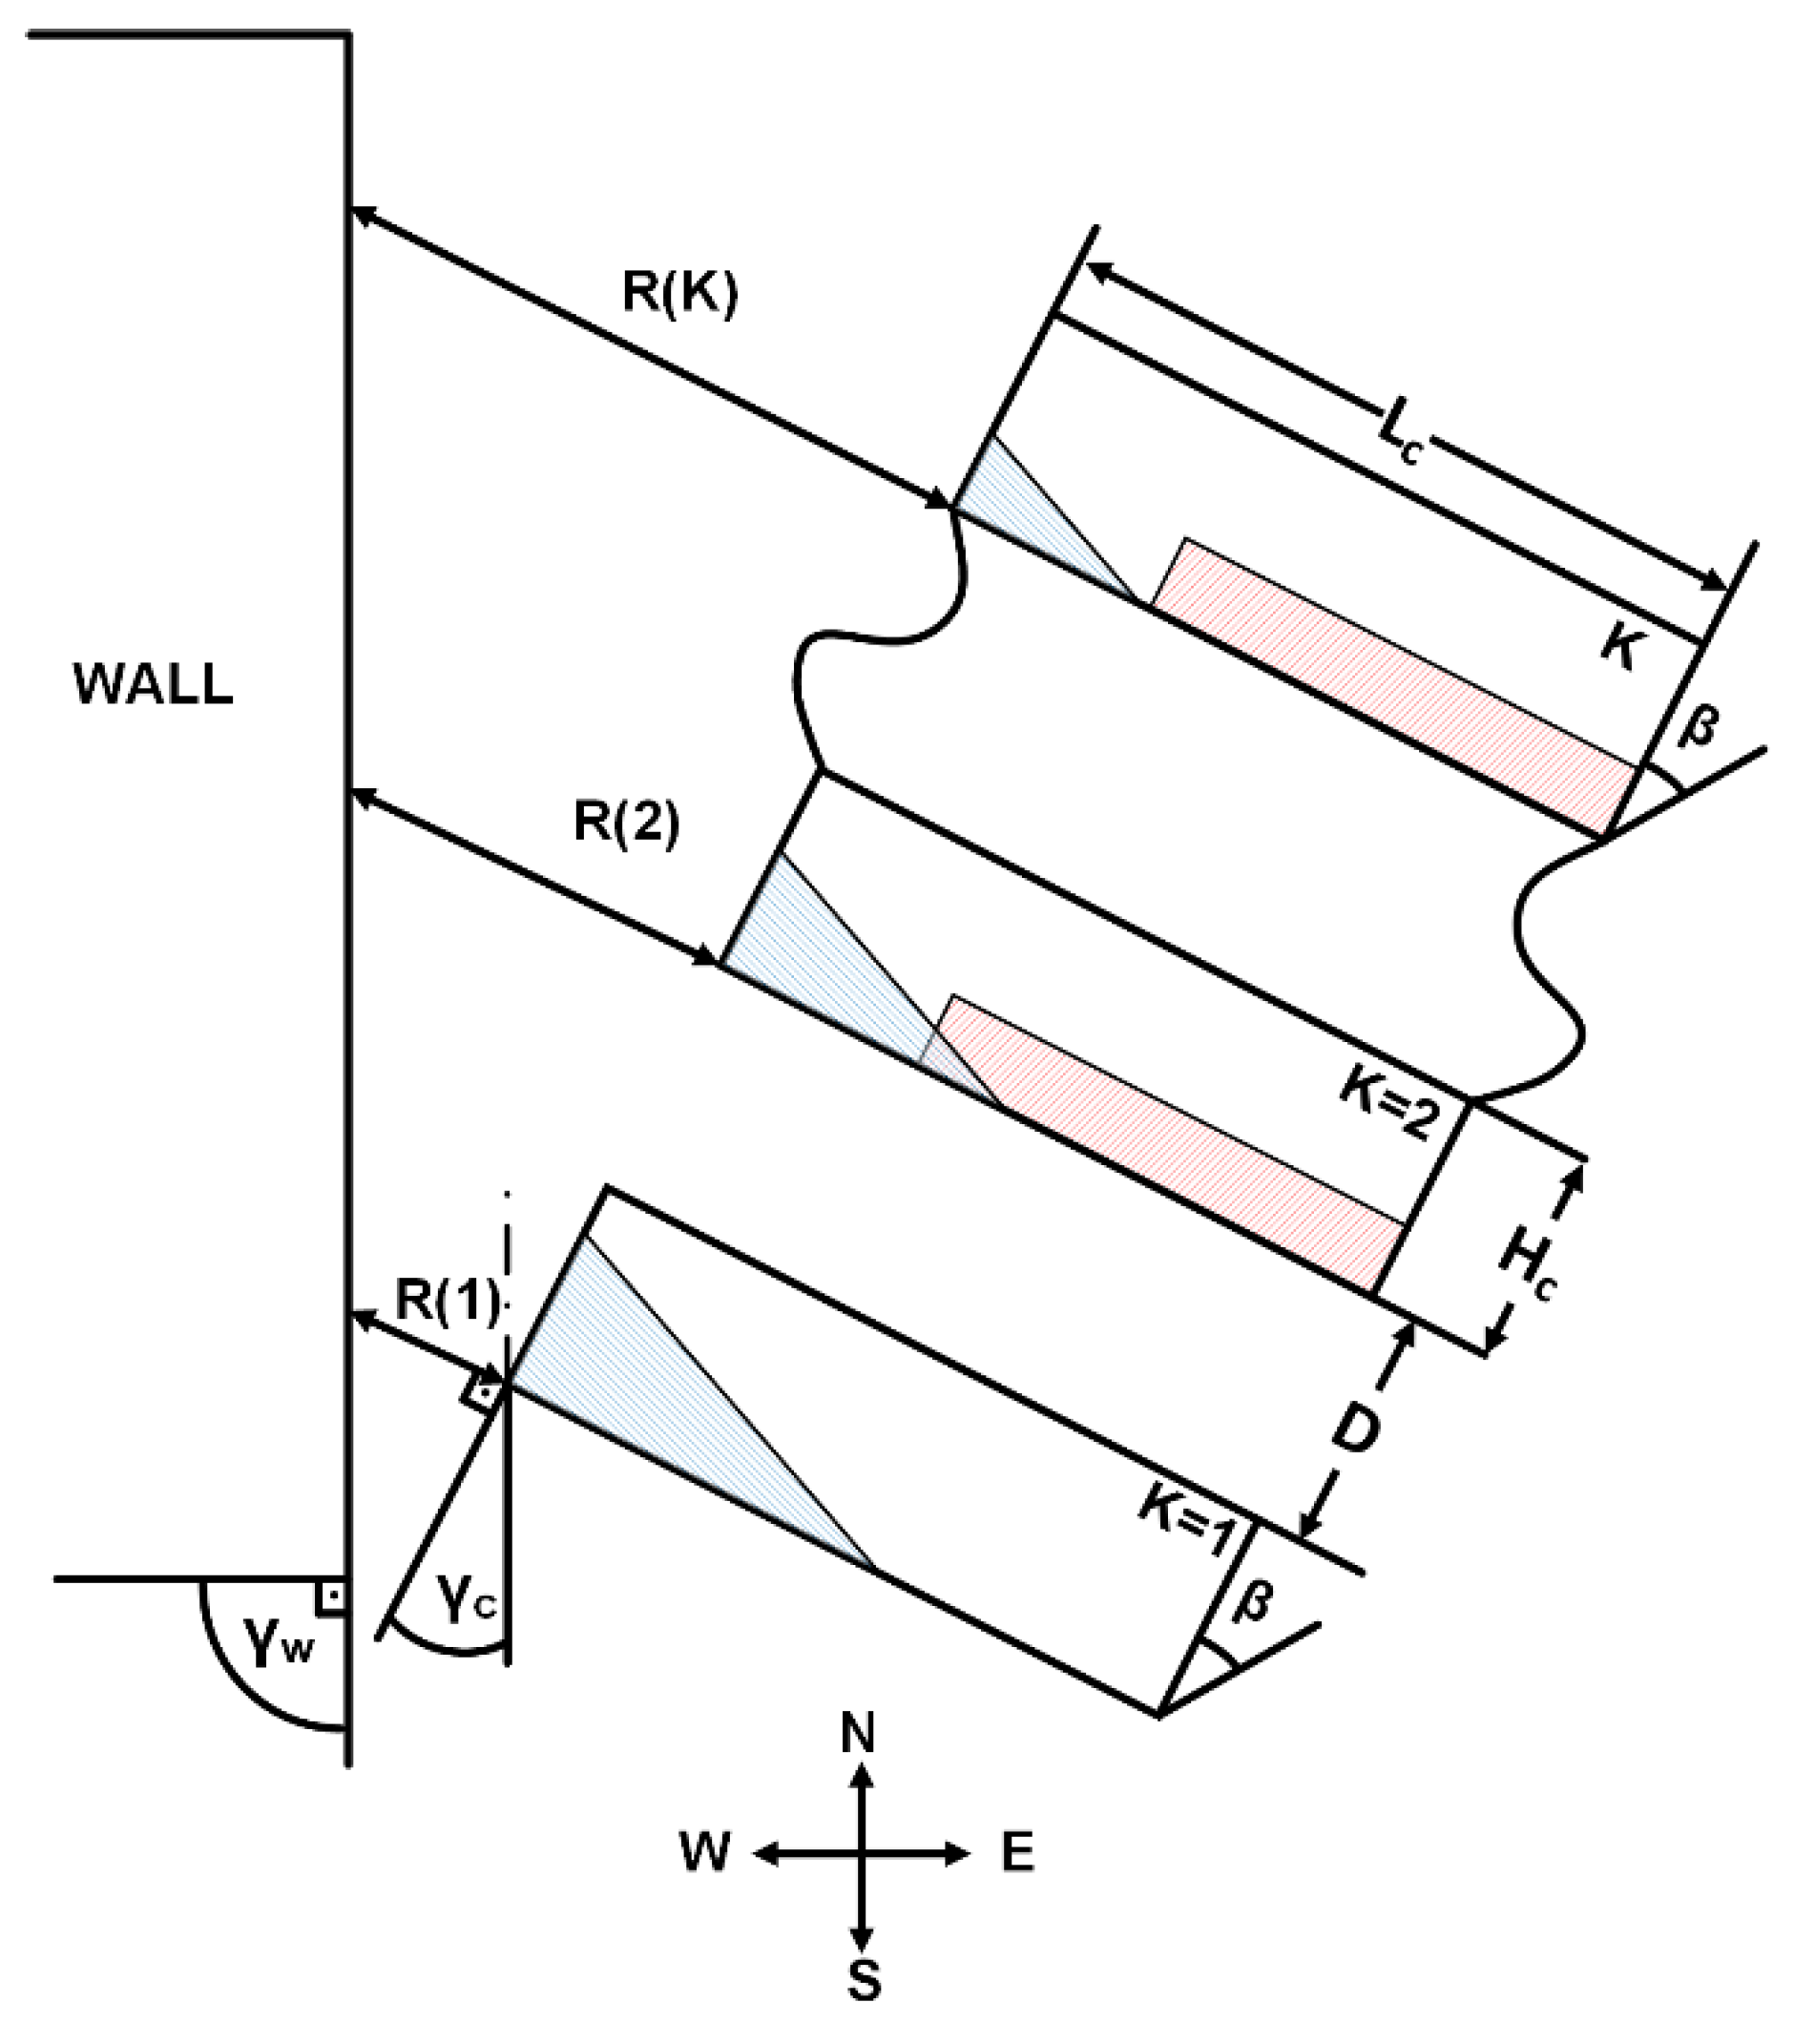
A general deployment of PV collectors near a wall is shown in Figure 5, where the azimuth of the collectors and the wall are γ C and γ W , respectively. The shadow length cast by the wall on a collector depends on the distance between the wall and the collector, see Equation (2); hence, a general expression is now developed for the distance R ( K ) (see Figure 5). The angle A C O   =   90 °   γ W and the angle B A O = A C O + γ C   =   90 °   γ W + γ C ; hence, A O = R ( 1 ) tan ( 90 ° γ W + γ C ) , R ( 2 ) = [ A O + ( H c cos β + D ) ] tan ( 90 ° γ W + γ C ) , finally resulting in:
R ( 2 ) = R ( 1 ) + ( H c cos β + D ) tan ( 90 ° γ W + γ C )
and hence,
R ( K ) = R ( 1 ) + ( K 1 ) ( H c cos β + D ) tan ( 90 ° γ W + γ C )
The wall shading length and height, see Equations (2) and (3), become:
L w s h = H w cos ( γ S γ C γ W ) tan α sin γ W R ( K )
H w s h = L w s h / tan ψ
The inter-row shading equations are given in Equations (5) and (6).

2.4. Combined Shading—Collectors Deployed in East–West Direction γ C = 0 ° , and a Vertical Wall in North–South Direction, ψ = 90 ° Shading on the Second Collector, Figure 6

The combined shading refers to the second and to the subsequent collector rows where the shading includes wall shading, Equations (11)–(13), and inter-row shading, Equations (5) and (6). Figure 6 shows PV collectors of height H c and length L c facing the south γ C = 0 ° , and a western wall of height H w was erected in the north–south direction γ W = 90 ° . Based on Equation (1), the shadow angle on the first collector row reduces to (since γ w = 90 ° ):
tan ψ = sin γ S sin β tan α
the shadow length becomes
L w s h = H w sin γ S tan α R
and the shadow height is:
H w s h = L w s h / tan ψ
The value of the inter-row spacing D is based on “no shading” on a winter solstice day at solar noon [16]:
D = H c sin β tan [ sin 1 ( cos ( ϕ δ 0 ) ) ]
The inter-row shading depends on the PV system parameters D ,   H c ,   β .

2.5. Combined Shading—Collectors Deployed in East–West Direction with an Angle γ C 0 and a Vertical Wall in North–South Direction, ψ = 90 ° , Shading on the Second Collector Row, Figure 7

Figure 7 shows the deployment of a PV collector facing the south with an azimuth angle γ C in the presence of a vertical wall with an azimuth angle γ W = 90 ° to the west side of the collectors. As the distance R ( K ) between the collectors and the wall increased, the amount of wall shading decreased accordingly. The inter-row shading depends on the PV system parameters D ,   H c ,   β .
Based on Equation (1), the shadow angle reduces to (since ψ = 90 ° ):
tan ψ = sin ( γ S γ C ) sin β tan α
and the shadow length on the first collector becomes
L w s h = H w sin ( γ S γ C ) tan α R ( K )
the shadow height is:
H w s h = L w s h / tan ψ
Based on Equation (8) γ W = 90 ° (see Figure 7), the distance between the wall and the collector R ( K ) is:
R ( K ) = R ( 1 ) + ( K 1 ) ( H C cos β + D ) tan γ C
The inter-row spacing D is based on Equation (14).

2.6. Combined Shading—Collectors Deployed in East–West Direction γ C = 0 ° and a Vertical Wall in North–South Direction with an Angle γ W with Respect to South, Figure 8, Shading on the Second and on the Subsequent Collector Rows

Figure 8 shows the deployment of a PV collector facing south γ C = 0 ° in the presence of a vertical wall with an azimuth angle γ W to the west side of the collectors. As the distance R ( K ) between the collectors and the wall increased, the amount of wall shading decreased accordingly. The inter-row spacing D is based on “no shading” on a winter solstice day at solar noon, Equation (14).
The inter-row shading depends on the PV system parameters D ,   H c ,   β . The shading angle ψ of the collectors is (see Equation (1) for γ C = 0 ° ):
tan ψ = 1 tan γ W cos γ S tan α sin β + sin γ S tan α sin β
The shadow length (see Equation (2)) is given by:
L w s h = H w cos ( γ S γ W ) tan α sin γ W R ( K )
the shadow height (see Equation (3)) is:
H w s h = L w s h / tan ψ
Based on Equation (8) γ C = 0 ° , the distance R ( K ) (see Figure 8) between the collector K and the wall is given by:
R ( K ) = R ( 1 ) + ( K 1 ) H c cos β + D tan γ W
The inter-row spacing D is based on Equation (14).

3. Results

The percentage of shading losses of a collector in a solar field is determined relative to the global incident solar radiation on an unshaded collector (no wall and no inter-row shadings).
The global radiation on an unshaded collector contains both the direct beam and the diffuse radiation. The diffuse incident irradiance G d on a single inclined collector with an angle β is the product of the sky view factor V F c s k y and the diffuse irradiance on a horizontal surface G d h , i.e., G d = V F c s k y × G d h where:
V F c s k y = ( 1 + cos β ) / 2 .
The shading losses in the present article are defined by:
S h a d i n g   l o s s e s   [ % ] = 100 u n s h a d e d   c o l l e c t o r   b e a m   r a d i a t i o n k W h / m 2 y e a r s h a d e d   c o l l e c t o r   b e a m   r a d i a t i o n k W h / m 2 y e a r u n s h a d e d   c o l l e c t o r   g l o b a l   r a d i a t i o n k W h / m 2 y e a r
The percentage of shading losses, Equation (24), in this study, is based on 10 min solar radiation data (direct beam and diffuse radiation, average data for years 2014–2023), Israel, Meteorological Service–IMS for Tel Aviv, latitude ϕ = 32 ° 6 N , longitude 34 ° 51 E .

3.1. Wall Shading—Vertical Wall in North–South Direction, ψ = 90 ° , Collectors Facing South, Figure 6

Table 1 summarizes the annual percentage of shading losses on a collector caused by a wall as a function of the collector length L c for the distance of R = 2   m and the wall heights H w = 2 ,   3 ,   4   m . The calculations are based on Equations (11) and (13) and for H c = 2.12   m , β = 20 ° , D = 1.05   m (Equation (14)). The table indicates that the percentage of wall shading losses decreases for longer collectors L c and for lower wall heights. The shading losses are more apparent for shorter collectors.
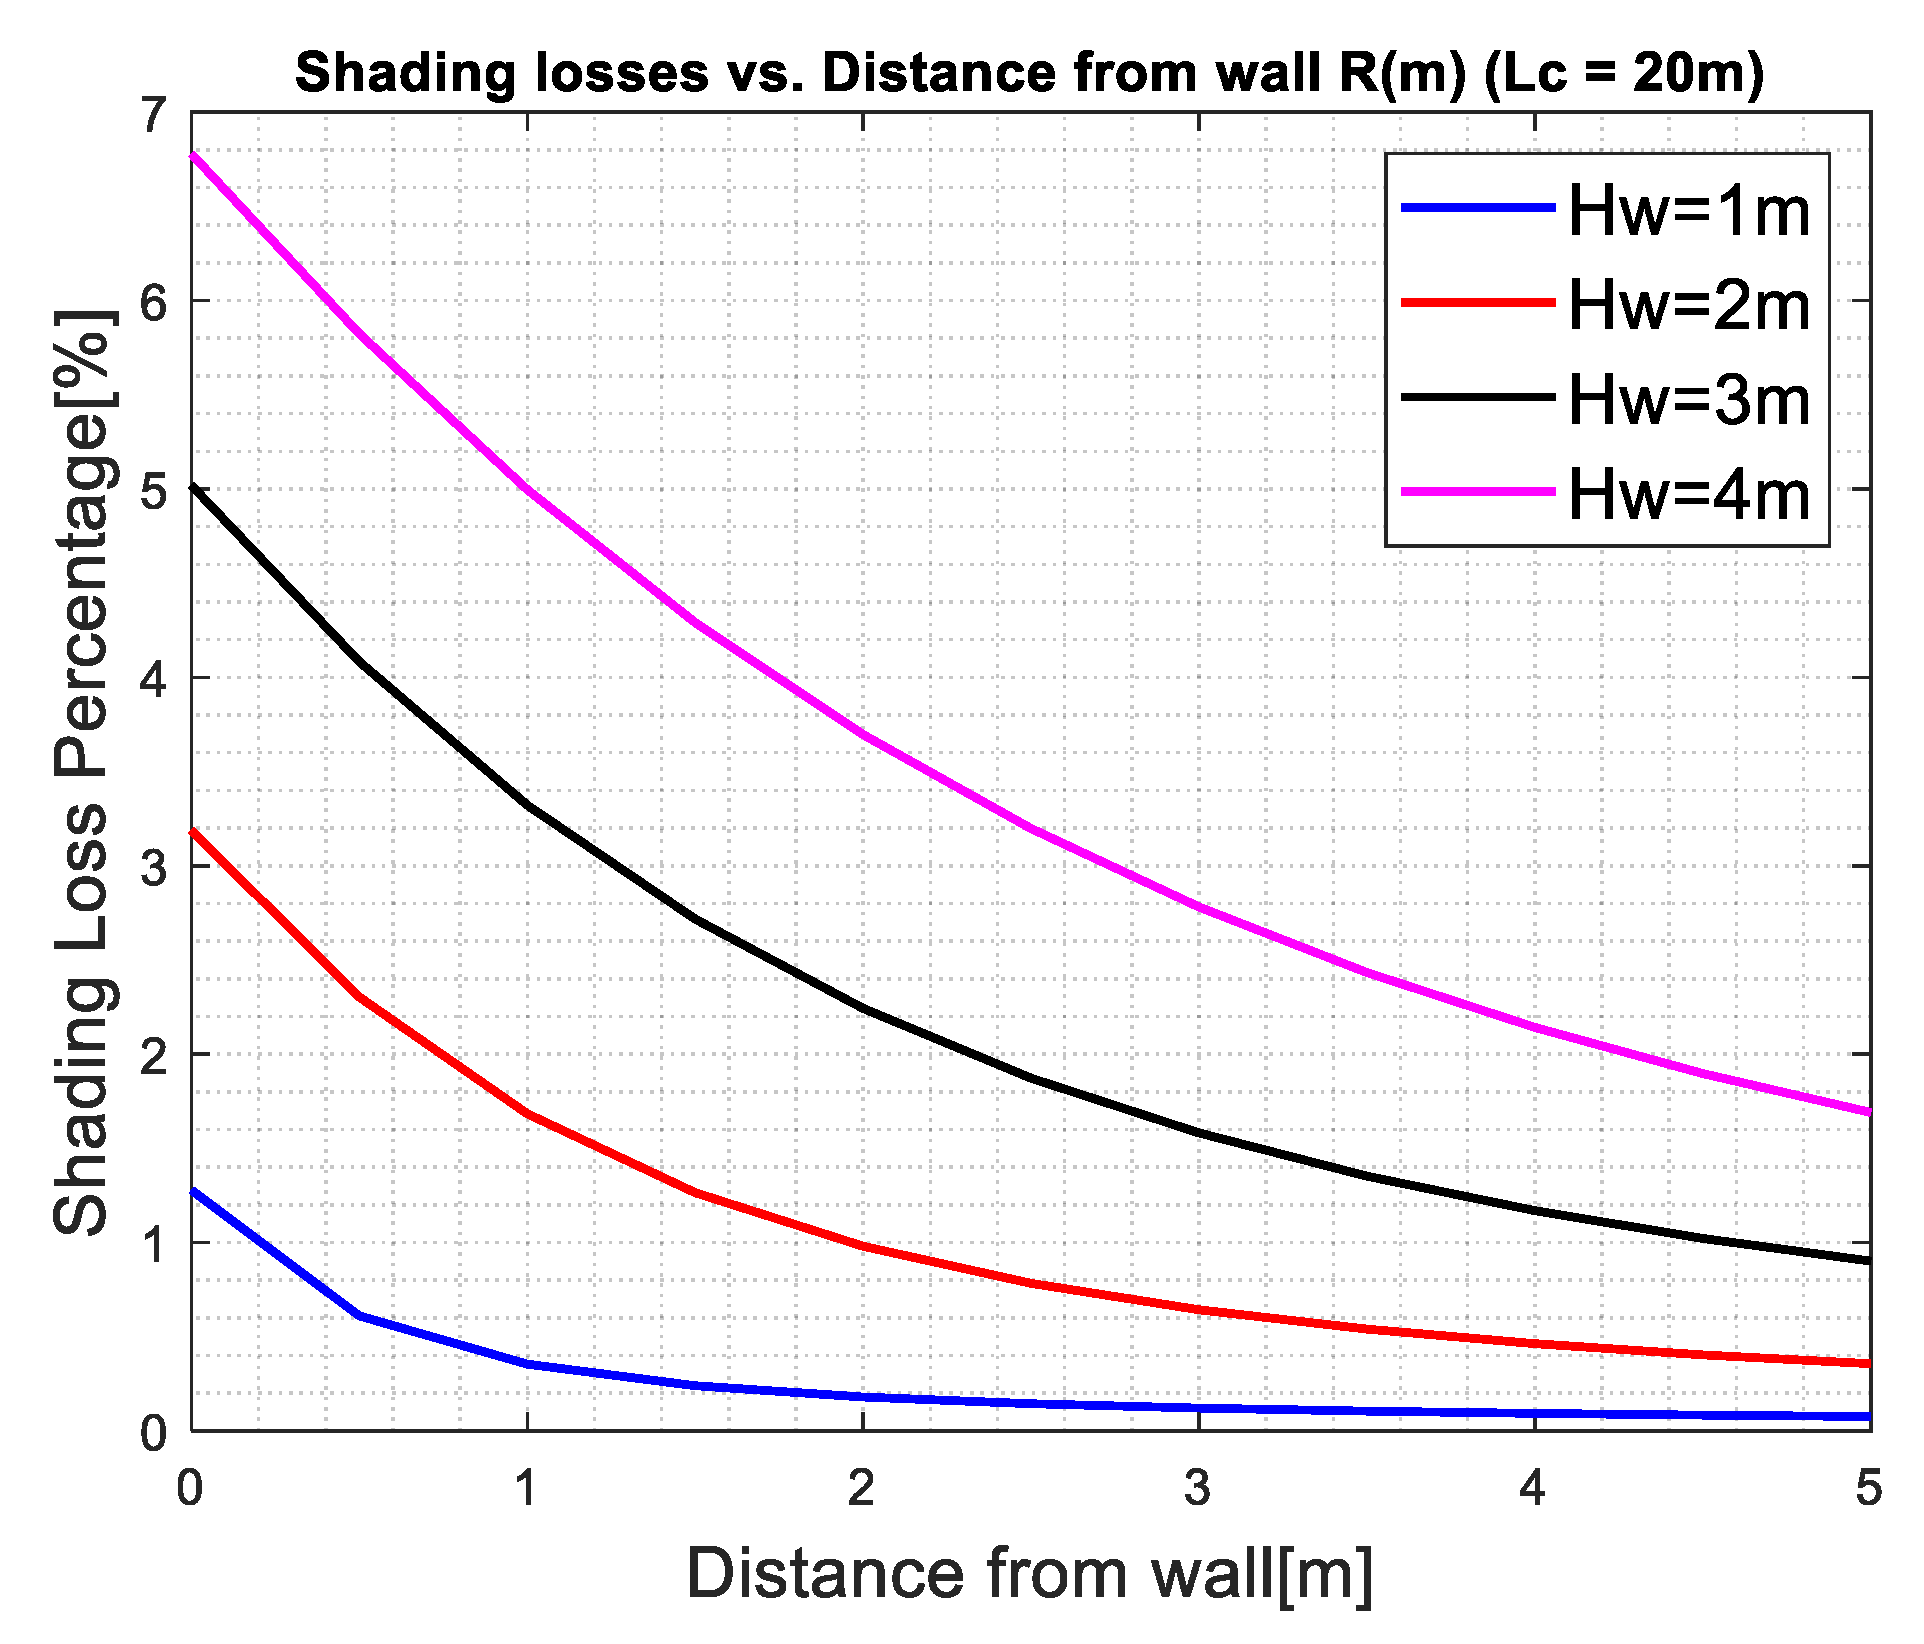
Figure 9 shows the annual percentage of wall shading losses on a collector cast by a wall as a function of the distance R of the collector from the wall for collector length L c = 20   m and wall heights H w = 1 , 2 ,   3 ,   4   m . The calculations are based on Equations (11)–(13) for H c = 2.12   m , β = 20 ° , D = 1.05   m . The figure indicates that the losses decrease for larger distances from the collector to the wall and for lower wall heights.

3.2. Inter-Row Shading—Collectors in East–West Direction, γ C = 0 ° , Figure 6, Shading on the Second Collector

Table 2 summarizes the annual percentage of inter-row shading losses of the second and the subsequent rows for different collector lengths L c . The calculation is based on Equations (5) and (6) for γ C = 0 , for D = 1.05   m ,   H c = 2.12   m ,   β = 20 ° . The table indicates that the percentage of inter-row shading losses increases slightly for longer collectors’ L c . Comparing the wall shading, Table 1, to the inter-row shading, Table 2, reveals that wall shading dominates the inter-row shading.

3.3. Combined Shading—Collectors in East–West Direction, γ C = 0 ° and a Vertical Wall in North–South Direction, γ W = 90 ° , Figure 6

Figure 10 depicts the annual percentage of shading losses of the second and the subsequent collector rows, caused by the combined inter-row and wall shadings, as a function of the collector length L c for the distance of R = 2   m and wall heights H w = 2 ,   3 ,   4   m . The calculations are based on Equations (5), (6) and (11)–(14), and for H c = 2.12   m , β = 20 ° , D = 1.05   m . The figure indicates that the combined shading losses decrease for longer collector rows and for lower wall heights. The shading losses are more apparent for shorter collectors.
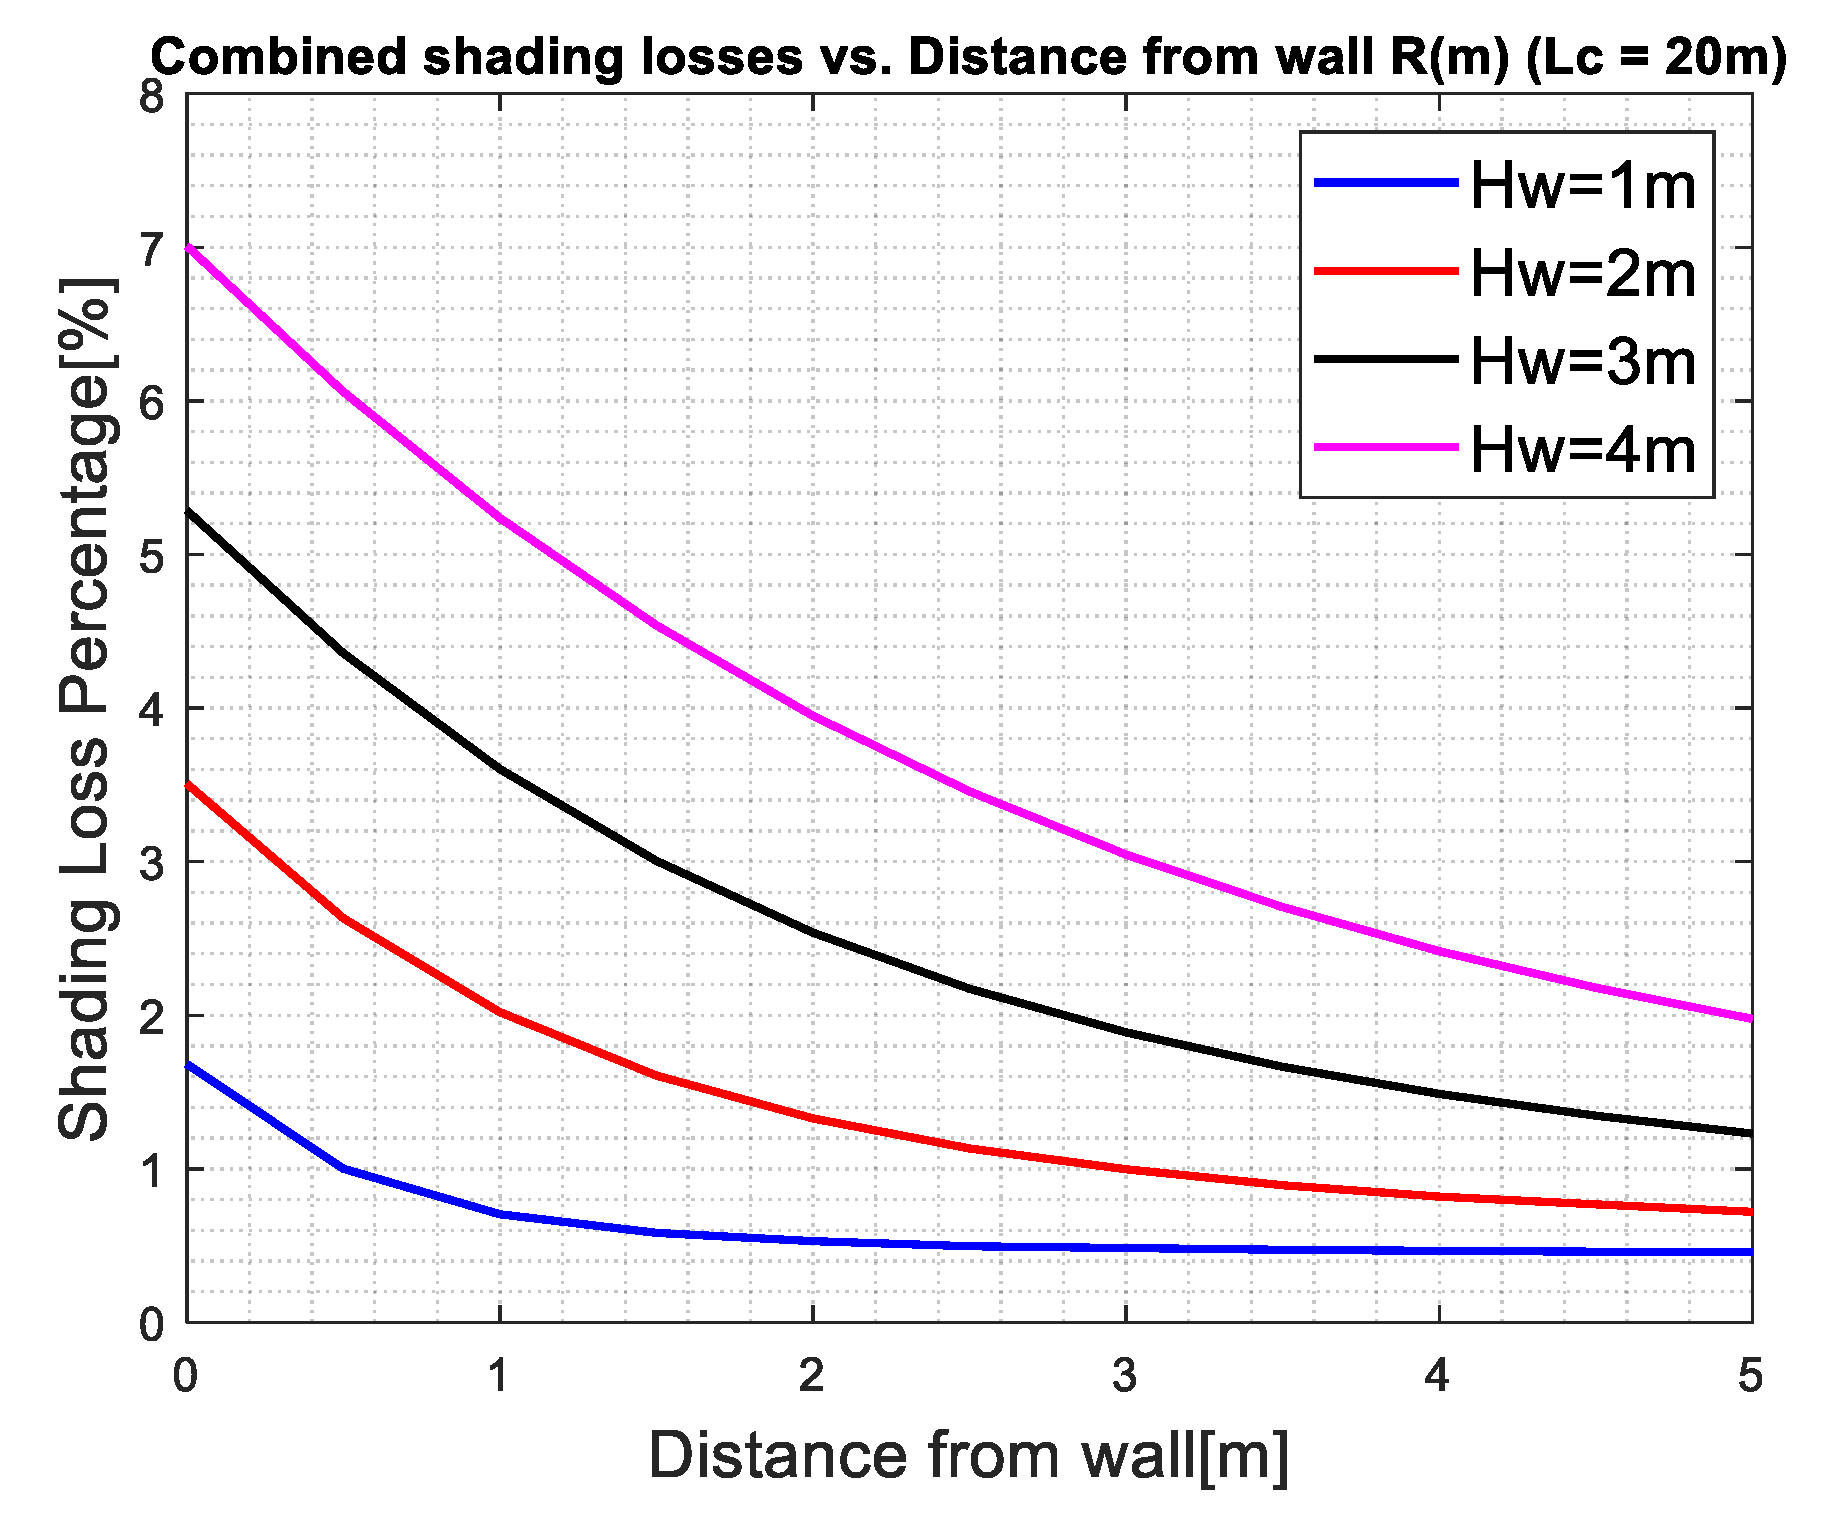
Figure 11 shows the annual percentage of shading losses of the second and subsequent collector rows, caused by the combined inter-row wall shading as a function of the distance R from the wall to the collector for H c = 2.12   m , β = 20 ° , D = 1.05   m , L c = 20   m and wall height H w = 1 , 2 ,   3 ,   4   m . The calculations are based on Equations (5), (6) and (11)–(14). The figure indicates that the combined shading losses decrease for larger distances from the wall and for lower wall heights. The effect of the wall height on the percentage of shading losses may also be determined from Figure 11; for a given distance R, the shading losses increase with the wall height H w .

3.4. Combined Shading, Collectors Deployed in East–West Direction Facing the South with an Azimuth Angle γ C 0 , and a Vertical Wall in North–South Direction γ W = 90 ° , Figure 7

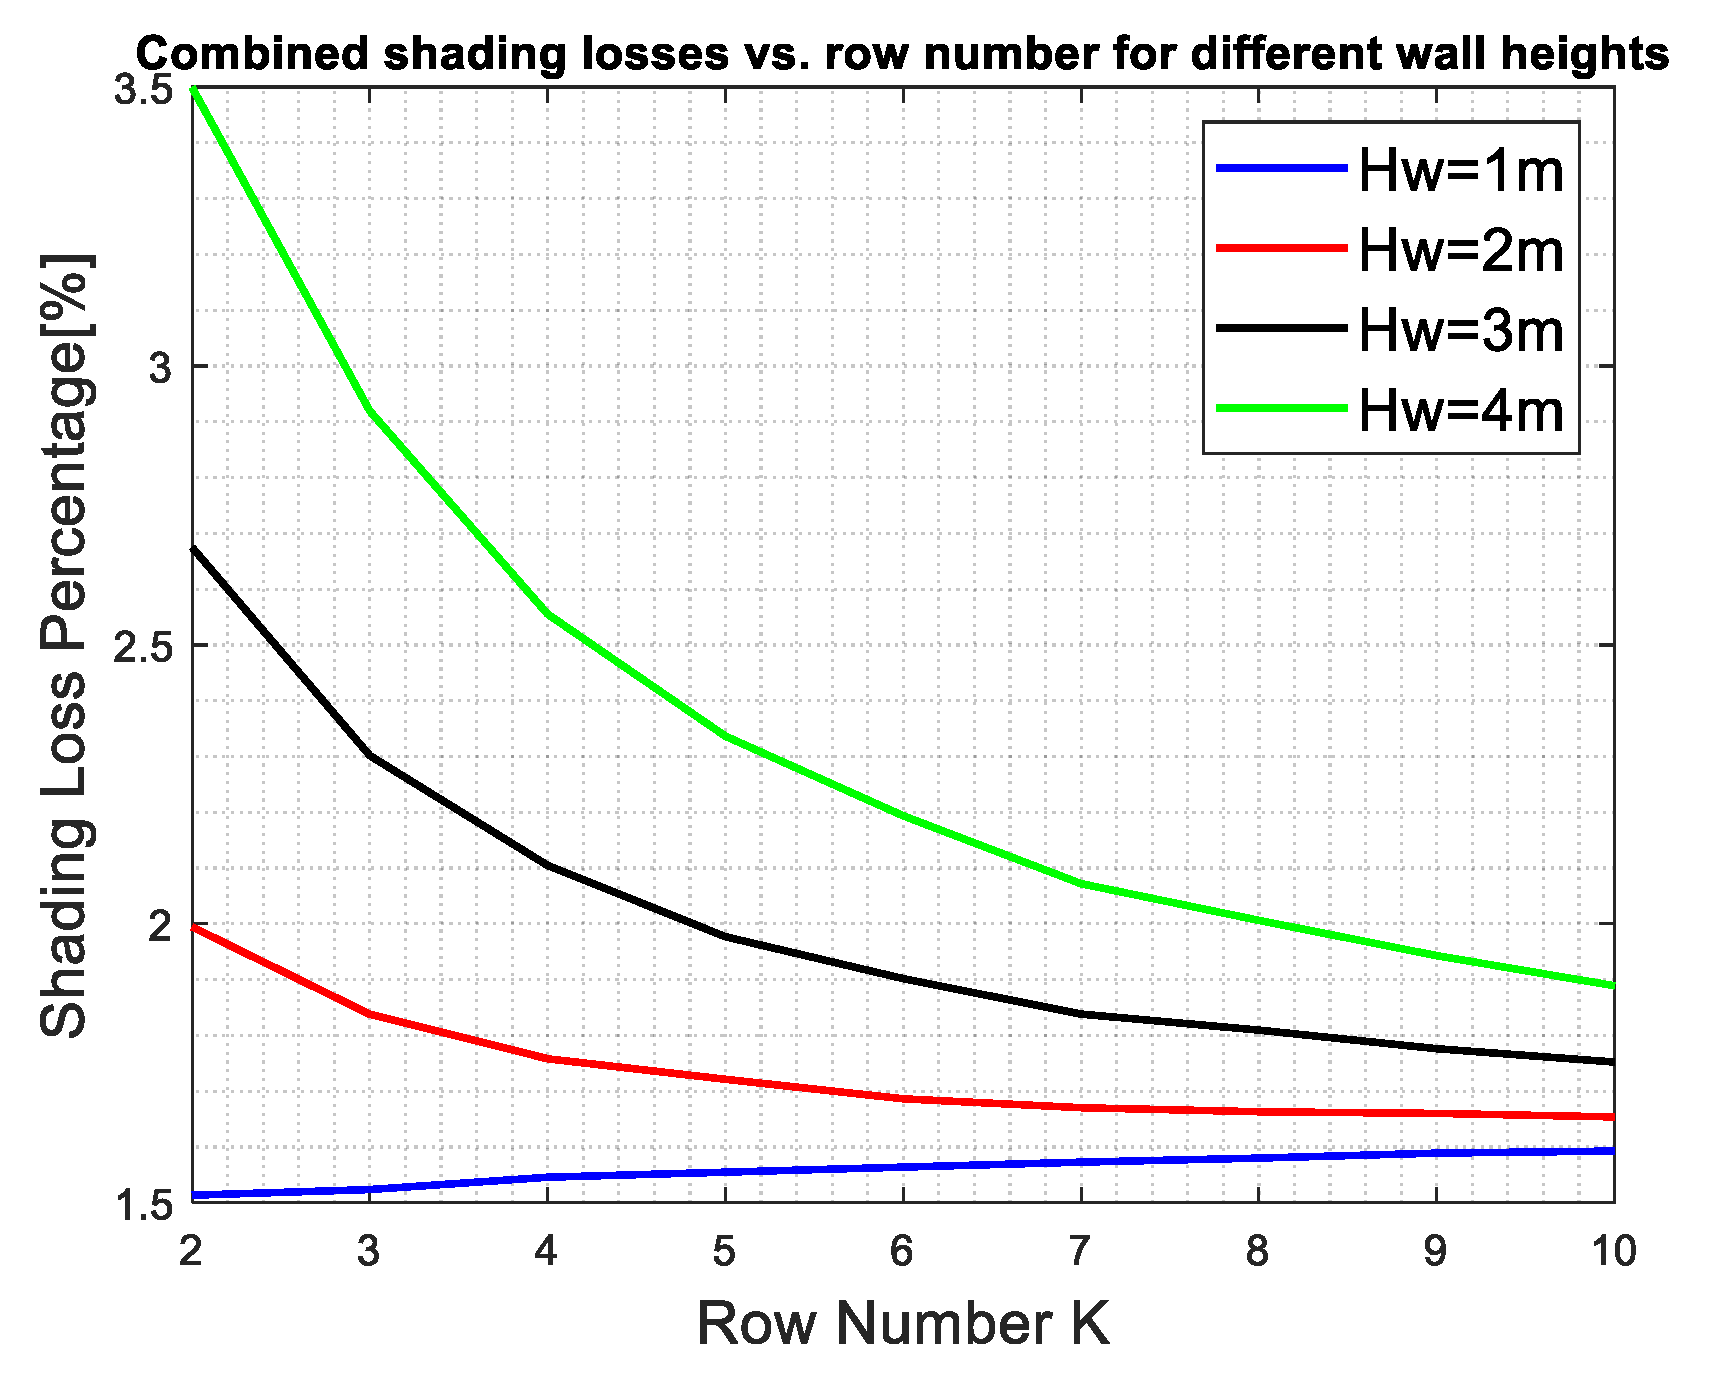
For collectors deployed with an azimuth angle γ C , see Figure 7, the distance R ( K ) of the collector along the width of the field to the vertical wall increases; therefore, the wall shading decreases. Figure 12 depicts the annual percentage of shading losses on the second and on the subsequent collector rows (K = 2 to 10) caused by the combined inter-row and wall shading for a distance R ( 1 ) = 2.0   m , wall heights H w = 1 ,   2 ,   3 ,   4   m , and the collector’s azimuth angle γ C = 30 ° . The calculations are based on Equations (5), (6) and (15)–(18) and for H c = 2.12   m ,   L c = 20   m , β = 20 ° , D = 1.05   m . The figure indicates that the losses decrease for lower wall heights and for larger distances R ( K ) (larger collector number K ) from the wall.
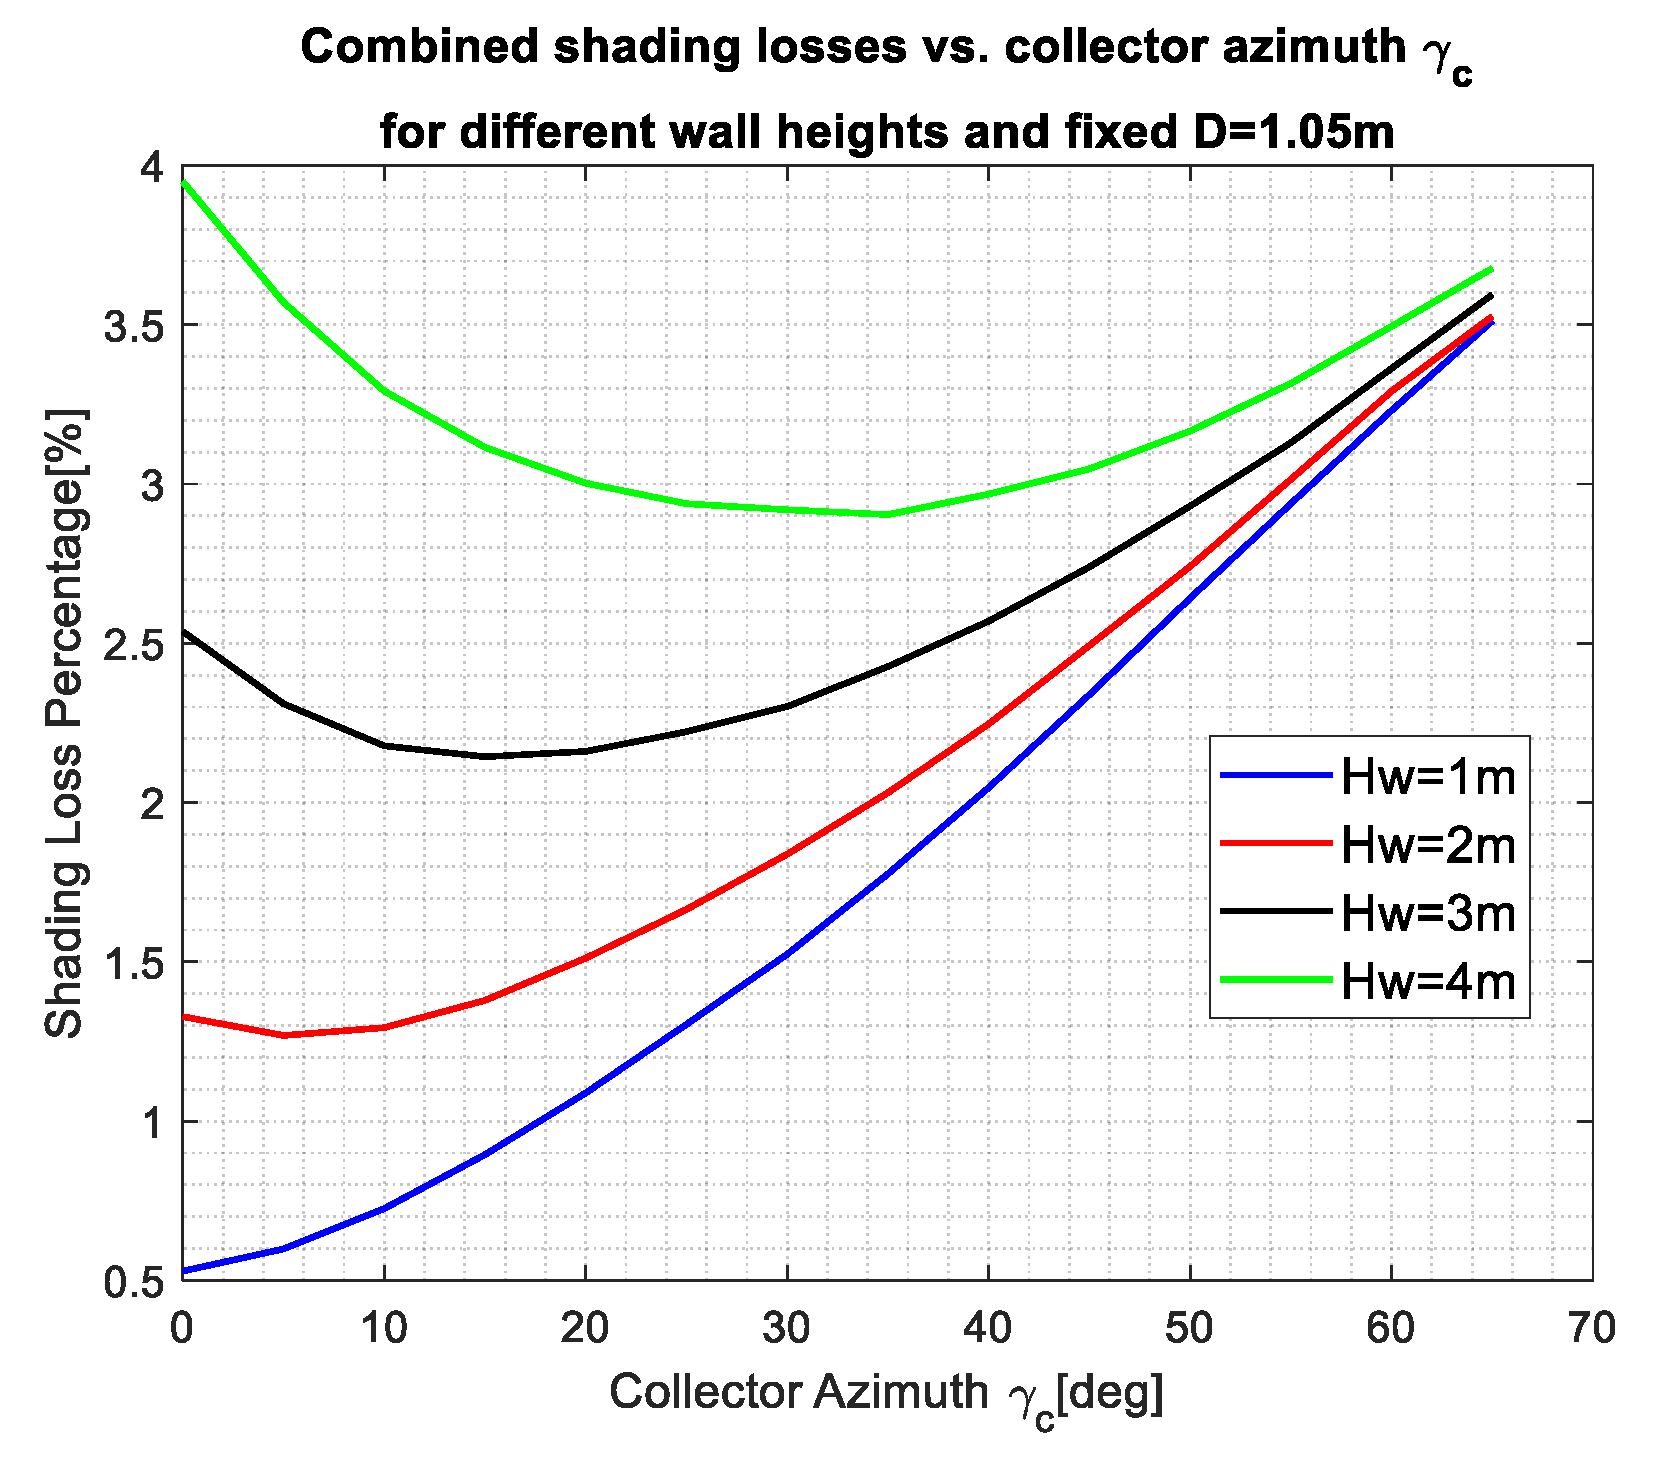
For the deployment in Figure 7, the collector’s azimuth angle γ C considerably affects the shading losses. The results are shown in Figure 13 for the collector number K = 3 and for inter-row spacing D = 1.05   m , as an example.
Reduced inter-row shading losses may be achieved for collectors deployed with an azimuth angle γ C 0 ° [16]. Figure 14 depicts the percentage of combined shading losses as a function of the collector’s azimuth angle γ C for the collector number K = 3 and for parameters L c = 20   m , H c = 2.12   m , β = 20 ° , R ( 1 ) = 2   m where the inter-row spacing is determined by Equation (25) for which the collectors are deployed at an azimuth angle equal to the solar azimuth angle, γ c = γ s [16], based on the criterion of “no shading” on a winter solstice day.
D = H c sin β tan ( α γ C = γ S )
Figure 14 reveals reduced shading compared to Figure 13.

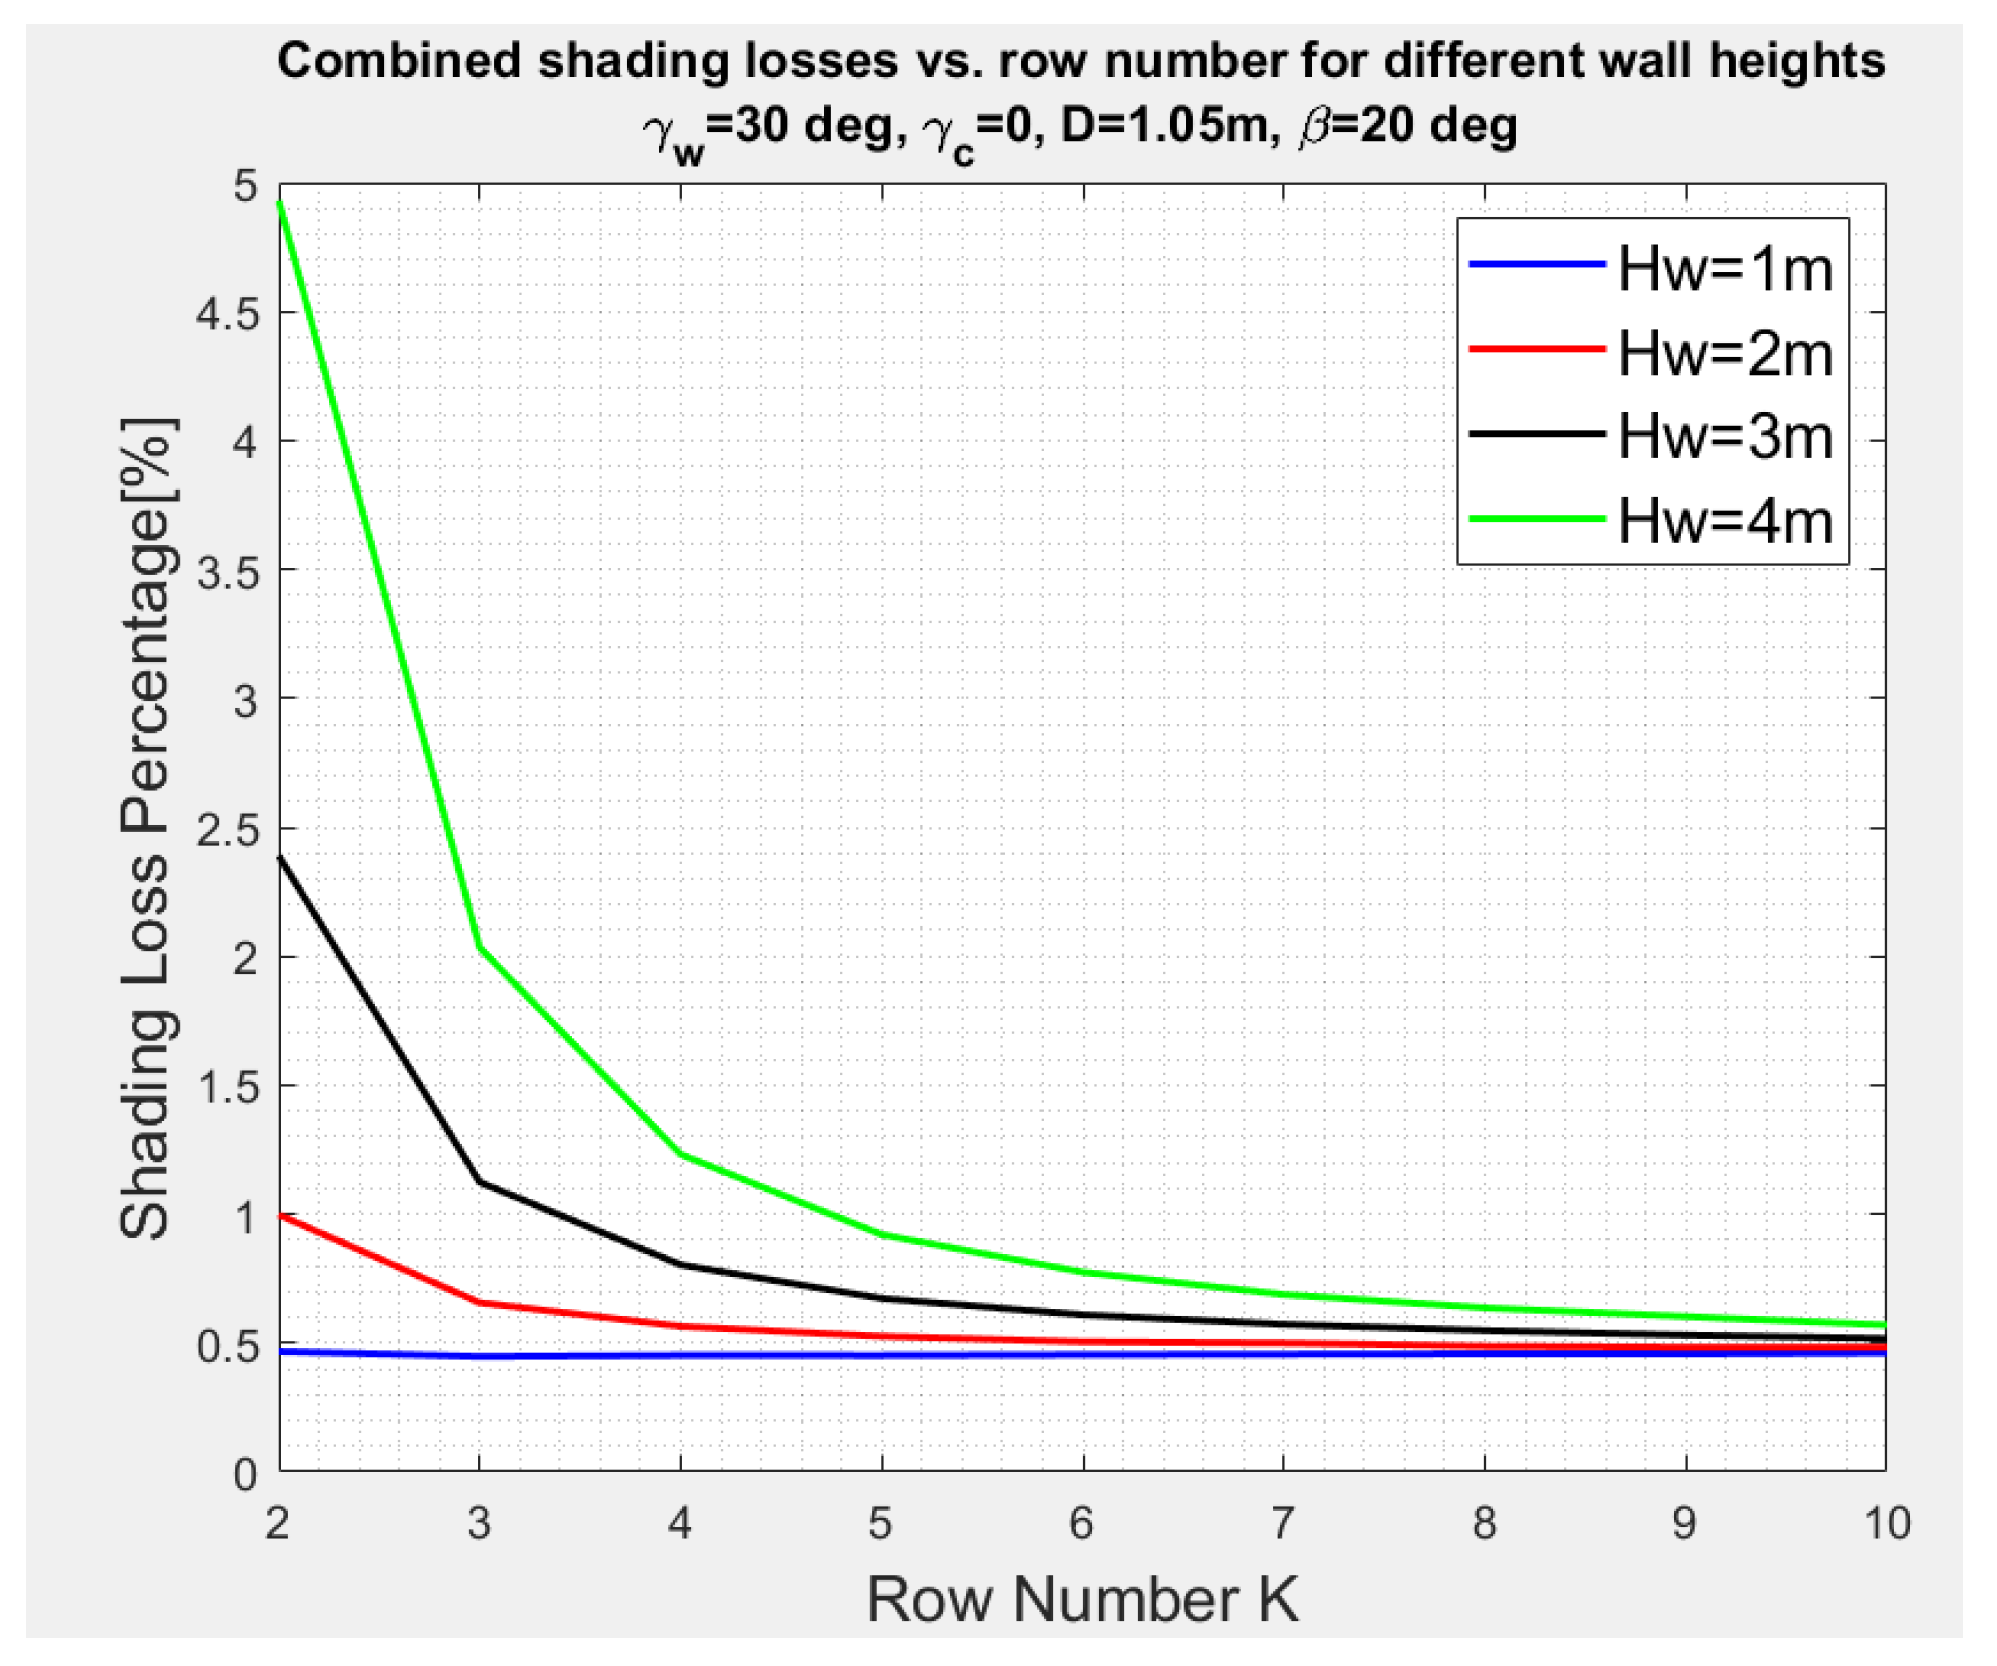
3.5. Combined Shading, Collectors Deployed in East–West Direction Facing the South with an Angle γ C = 0 , and a Vertical Wall in North–South Direction with an Azimuth Angle γ W = 30 ° , Figure 8

For collectors deployed with an azimuth angle γ C = 0 ° , see Figure 8, the distances R ( K ) from the collectors along the width of the field to the wall increase; therefore, the wall shading decreases.
Figure 15 depicts the annual percentage of the shading losses on the second and on the subsequent collector rows (K = 2 to 10) caused by the combined inter-row and wall shading for distance R ( 1 ) = 2.0   m , wall heights H w = 1 ,   2 ,   3 ,   4   m , collector’s azimuth angle γ C = 0 ° , and wall azimuth angle γ W = 30 ° . The calculations are based on Equations (5), (6) and (15)–(18) for H c = 2.12   m ,   L c = 20   m , β = 20 ° , D = 1.05   m . The figure indicates that the losses decrease for lower wall heights and for larger distances R ( K ) (larger collector number K ) from the wall.
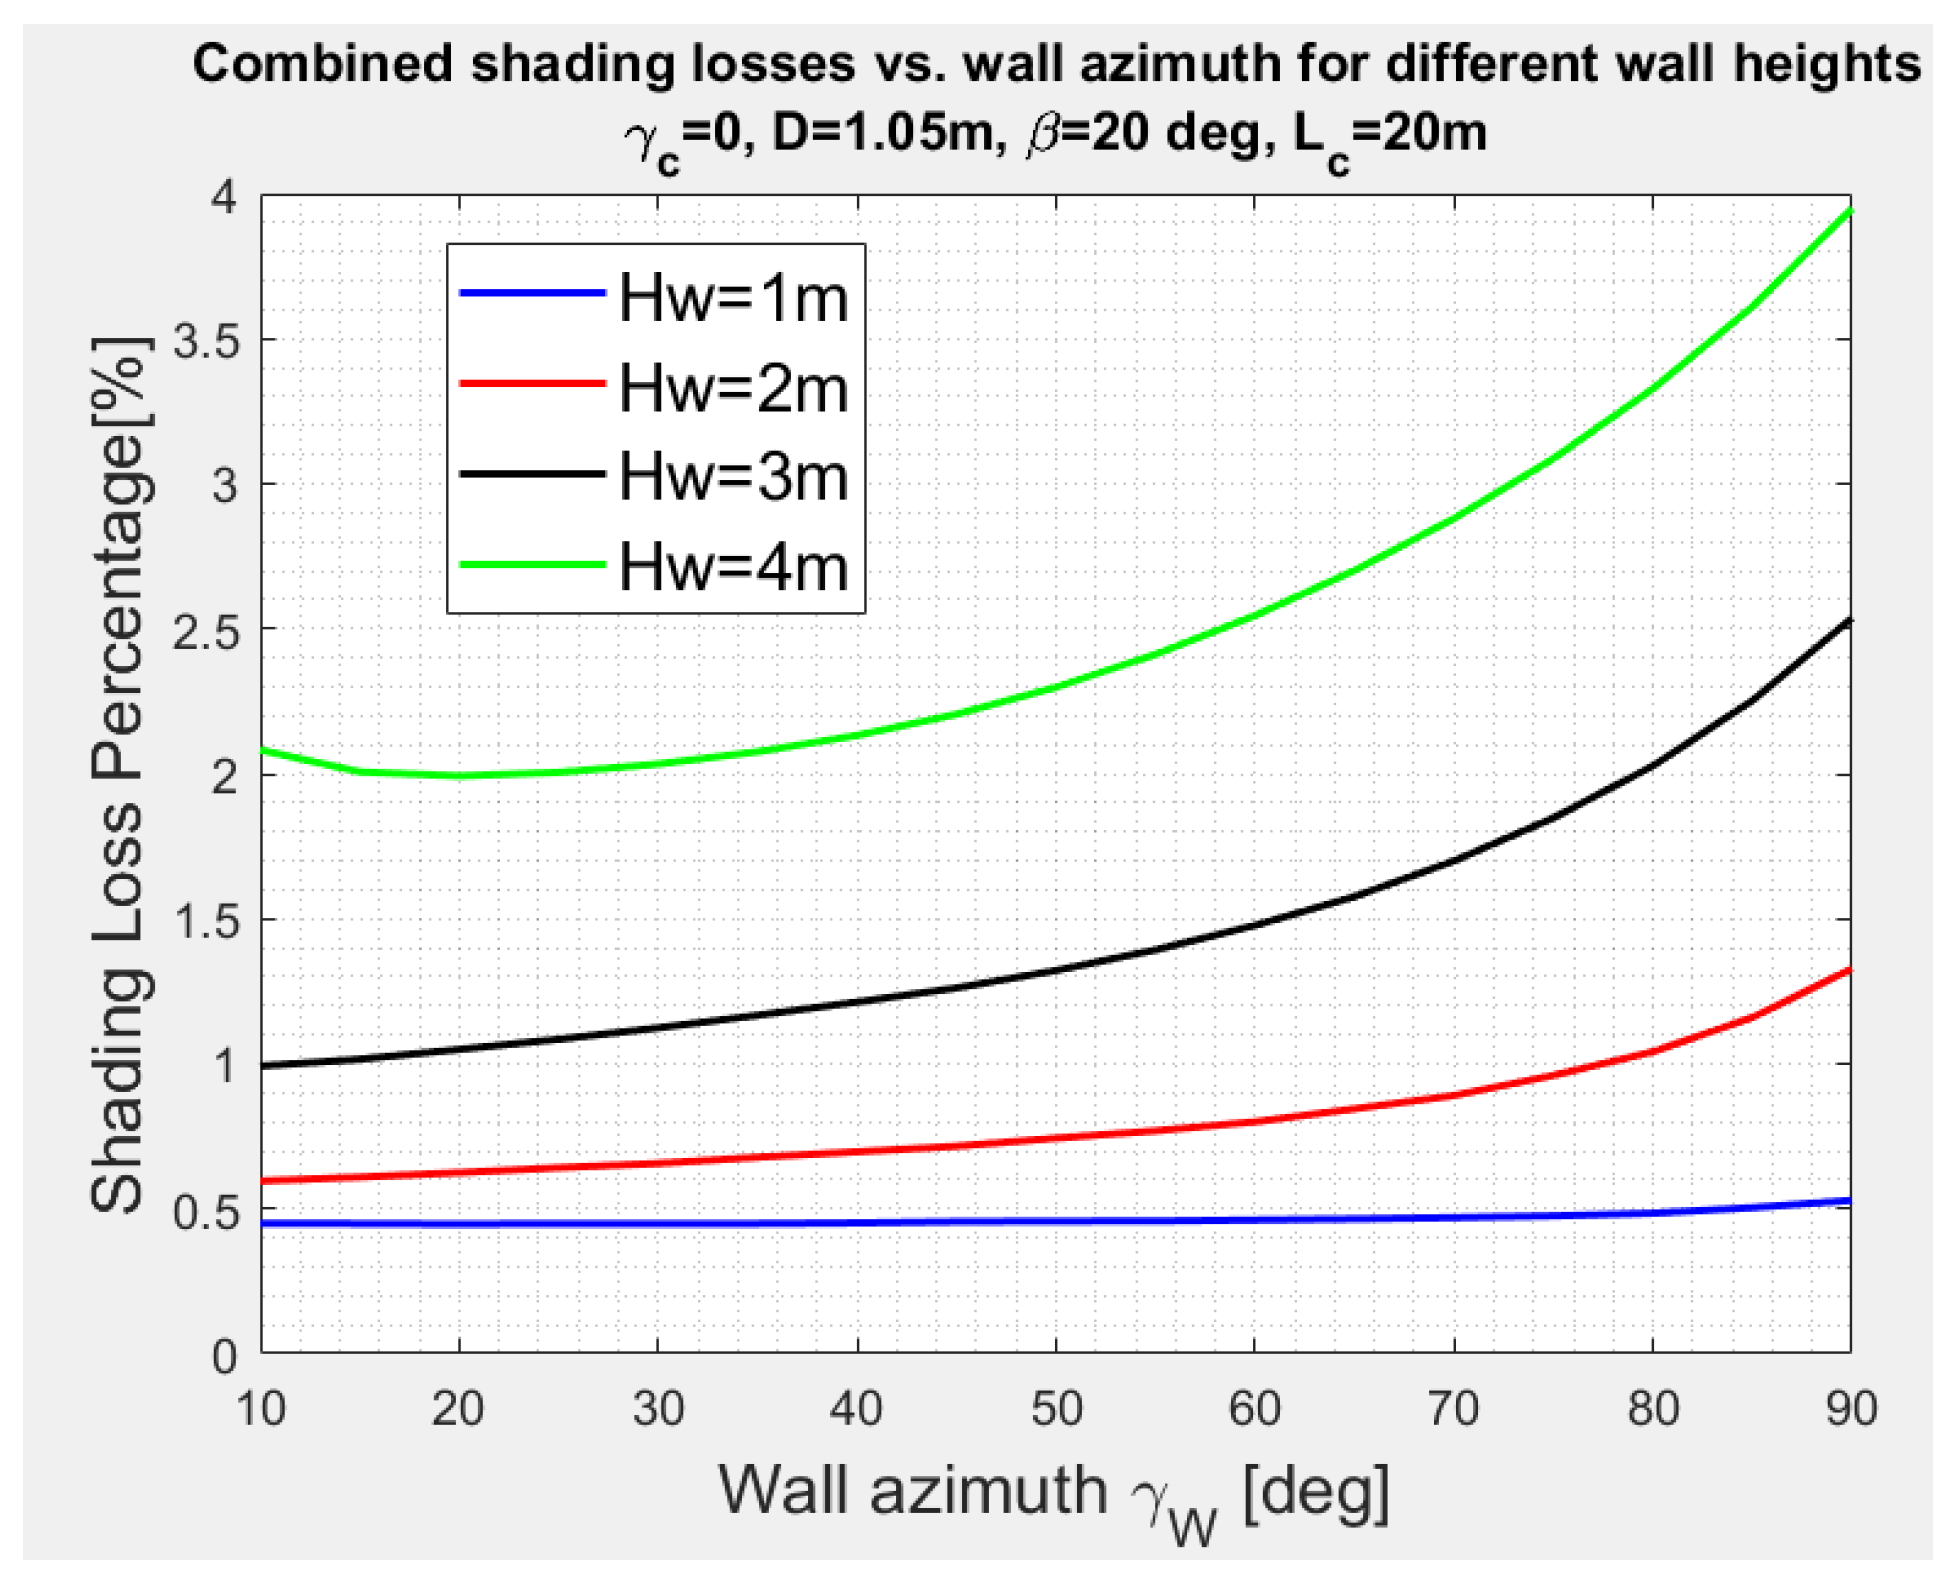
For the deployment in Figure 8, the wall’s azimuth angle γ W affects the shading losses. The results are shown in Figure 16 for the collector number K = 3 and for inter-row spacing D = 1.05   m , as an example.

4. Discussion and Conclusions

Most studies on the shading of PV systems do not deal analytically with the shading losses of PV collectors affected by walls, fences, and obscuring objects, especially those encountered in the deployment of PV systems on rooftops in urban environments. The present article formulates mathematical expressions for shadows caused by walls and by the mutual shading of collectors (combined shading losses) and calculates the percentage of annual shading losses affected by wall heights, distances from walls to collectors, and the length and azimuth angle of collectors. This study indicates that the shading losses increase for shorter distances of the collector to walls and for higher walls. Shading losses may reach 7 percent for wall heights of 4 m and for a distance of 2 m from the collectors to a wall. The results indicate that wall shading dominates inter-row shading. Lower shading losses may be obtainable for PV collector deployments not facing the equator. The shading losses pertain to losses of the incident solar radiation (in-plane solar radiation) on the collectors. The generated output energy of the PV system is, therefore, affected by the shading losses. The various numerical results of this study pertain to the solar radiation data and to the latitude at the site of study and indicate by how much (quantitatively) the shading losses depend on the wall height, the distance between the wall and the collector, and the effect of the wall and collector azimuths. Because the incident solar radiation is reduced by wall shading and, hence, reducing the generated electricity, the PV installation at the site may become economically unjustified, or the numerical results may indicate how far to move the PV collectors away from the wall for economically justifying the installation. The mathematically developed expressions (algorithms) for shading losses may be practical for any PV system design at any desired location in a built environment. This article analyses the shading losses for walls erected on the west side of the PV collectors; however, the analyses may also pertain to walls on the east side, as well as on both sides of the PV collectors.

Author Contributions

Conceptualization, J.A.; methodology, J.A.; software, A.P.; visualization, A.A.; All authors have read and agreed to the published version of the manuscript.

Funding

This research received no external funding.

Data Availability Statement

The original contributions presented in the study are included in the article, further inquiries can be directed to the corresponding author.

Conflicts of Interest

The authors declare no conflict of interest.

Nomenclature

H c Collector width
H c s h Shadow height on a collector for inter-row shading
H W Wall height
H w s h Shadow height on a collector for wall shading
K Number of collector rows
L c Collector length
L c s h Shadow length on a collector for inter-row shading
L w s h Shadow length on a collector for wall shading
R Distance between wall and collector
R ( K ) Distance between walls and collector number K
V F c s k y View factor of first collector
α Solar altitude angle
β Collector inclination angle
ϕ Collector latitude
δ Declination angle
γ c Collector azimuth angle
γ S Solar azimuth angle
γ W Wall angle
ω Hour angle
ψ Shading angle

References

  1. Sailor, D.J.; Anard, J.; King, R.R. Photovoltaics in the built environment: A critical review. Energy Build. 2021, 253, 111479. [Google Scholar] [CrossRef]
  2. Annathurai, V.; Gan, C.K.; Baharim, K.A.; Ghani, M.R.A. Shading analysis for the siting of solar PV power plant. APRN J. Eng. Appl. Sci. 2016, 11, 5021–5027. [Google Scholar]
  3. Sun, Y.; Li, X.; Hong, R.; Shen, H. Analysis on the Effect of Shading on the Characteristics of Large-scale on-grid PV System in China. Energy Power Eng. 2013, 5, 215–218. [Google Scholar] [CrossRef]
  4. Li, D.; Liu, G.; Liao, S. Solar potential in urban residential buildings. Sol. Energy 2015, 11, 225–235. [Google Scholar] [CrossRef]
  5. Redweik, P.; Catita, C.; Brito, M. Solar energy potential on roofs and facades in an urban landscape. Sol. Energy 2013, 97, 332–341. [Google Scholar] [CrossRef]
  6. Masa-Bote, D.; Caamaño-Martín, E. Methodology for estimating building integrated photovoltaics electricity production under shadowing conditions and case study. Renew. Sustain. Energy Rev. 2014, 31, 492–500. [Google Scholar] [CrossRef]
  7. Groumpos, P.P.; Kouzam, K.Y. A Generic approach to the shadow effect in large solar power systems. Sol. Cells 1987, 22, 29–46. [Google Scholar] [CrossRef]
  8. Hanitsch, R.E.; Schultz, D.; Siegfried, U. Shading effect on output power of grid connected photovoltaic generated systems. Rev. Energ. Ren. Power Eng. 2001, 93–99. Available online: https://www.cder.dz/download/upec-12.pdf (accessed on 2 August 2024).
  9. Martinez-Moreno, F.; Munoz, J.; Lorenzo, E. Experiment model to estimate shading losses on PV arrays. Sol. Energy Mater. Sol. Cells 2010, 94, 2298–2303. [Google Scholar] [CrossRef]
  10. Karatepe, E.; Boztepe, M.; Colak, M. Development of a suitable model for Characterizing photovoltaic arrays with shaded solar cells. Sol. Energy 2007, 81, 977–992. [Google Scholar] [CrossRef]
  11. Alsadi, S.Y.; Nassar, Y.F. A general expression for the shadow geometry for fixed mode horizontal, step-like structure and inclined solar fields. Sol. Energy 2019, 181, 53–69. [Google Scholar] [CrossRef]
  12. Varga, N.; Mayer, M.J. Model-based analysis of shading losses in ground-mounted photovoltaic power plant. Sol. Energy 2021, 216, 428–438. [Google Scholar] [CrossRef]
  13. Dhimish1, M.; Silvestre, S. Estimating the impact of azimuth-angle variations on photovoltaic annual energy production. Clean Energy 2019, 3, 47–58. [Google Scholar] [CrossRef]
  14. Aronescu, A.; Appelbaum, J. Shading on photovoltaic collectors on rooftops. Appl. Sci. 2020, 10, 2977. [Google Scholar] [CrossRef]
  15. Bany, J.; Appelbaum, J. The Effect of Shading on the Design of a Field of Solar Collectors. Sol. Cells 1987, 20, 201–228. [Google Scholar] [CrossRef]
  16. Aronescu, A.; Appelbaum, J. The Effect of Collector Azimuth on Inter-Row Shading in Photovoltaic Fields—A Comprehensive Point of View. Energies 2023, 16, 4876. [Google Scholar] [CrossRef]
Figure 1. Monitored in-plane solar radiation on a PV system blocked by an eastern building wall.
Energies 17 05089 g001
Figure 2. Shadow on PV collectors cast by an eastern wall.
Energies 17 05089 g002
Figure 3. General deployment of PV collectors near a west side building—shading on collectors.
Energies 17 05089 g003
Figure 4. Wall and inter-row shadow patterns. (a) Wall shading, no inter-row shading; (b) Wall shading and inter-row shading, the height of wall shading exceeds the width of the collector (c) Wall shading and inter-row shading, the height of wall shading is lower than the width of the collector; (d) Wall and inter-row shading length are shorter then the collector length; (e) No wall shading.
Energies 17 05089 g004
Figure 5. Deployment of PV collectors near a wall.
Energies 17 05089 g005
Figure 6. PV collectors deployed in an east–west direction facing the south, and a vertical wall in a north–south direction.
Energies 17 05089 g006
Figure 7. PV collectors deployed in east–west direction facing south with an azimuth angle γ C and a vertical wall in north–south direction ( γ W = 90 0 ).
Energies 17 05089 g007
Figure 8. PV collectors deployed in an east–west direction facing south, and a vertical wall in a north–south direction with an azimuth angle γ W .
Energies 17 05089 g008
Figure 9. Wall shading—variation in annual percentage of wall shading losses with wall distance R , for wall height H w = 1 , 2 ,   3 ,   4   m as a parameter, and for L = 20   m , H c =   2.12   m , β = 20 ° , D = 1.05   m .
Energies 17 05089 g009
Figure 10. Second and subsequent collectors—variation in combined annual percentage shading losses with collector length L c and height H w as a parameter, for R = 2   m and H c = 2.12   m , β = 20 ° , D = 1.05   m .
Energies 17 05089 g010
Figure 11. Second collector—variation in combined annual percentage shading losses with wall distance R , for wall height H w as a parameter, and for L c = 20   m , H c = 2.12   m , β = 20 ° , D = 1.05   m .
Energies 17 05089 g011
Figure 12. Variation in combined annual percentage shading losses with the collector row number K , for wall height H w as a parameter, and for L c = 20   m , H c = 2.12   m , β = 20 ° , D = 1.05   m ,   R ( 1 ) = 2   m , γ C = 30 ° .
Energies 17 05089 g012
Figure 13. Variation in combined annual percentage shading losses with collector azimuth angle for collector number K = 3 and a row spacing D = 1.05   m , for wall height H w as a parameter, and for L c = 20   m , H c = 2.12   m , β = 20 ° , D = 1.05   m , R ( 1 ) = 2   m .
Energies 17 05089 g013
Figure 14. Variation in the percentage annual shading losses with collector azimuth angle for collector number K = 3 , for wall height H w as a parameter, and varying the inter-row spacing determined by Equation (25), and for L c = 20   m , H c = 2.12   m , β = 20 ° , D = 1.05   m , R ( 1 ) = 2   m .
Energies 17 05089 g014
Figure 15. Variation in combined annual percentage shading losses with the row number K , for wall height H w as a parameter and for L c = 20   m , H c = 2.12   m , β = 20 ° , D = 1.05   m ,   R ( 1 ) = 2   m , γ C = 30 ° .
Energies 17 05089 g015
Figure 16. Variation in combined annual percentage shading losses with wall azimuth angle for collector number K = 3 and inter-row spacing D = 1.05   m , for wall height H w as a parameter and for L c = 20   m , H c = 2.12   m , β = 20 ° , D = 1.05   m , R ( 1 ) = 2   m .
Energies 17 05089 g016
Table 1. Annual percentage of wall shading losses for collector length L c and height H w , for R = 2   m , H c = 2.12   m , β = 20 ° , D = 1.05   m .
Annual Percentage of Wall Shading Losses
Collector Length [m]Hw = 2 mHw = 3 mHw = 4 m
101.84.16.8
201.02.33.7
300.71.62.6
400.51.22.0
Table 2. Annual percentage of inter-row shading losses for collector length L c , for H c = 2.12   m , β = 20 ° , D = 1.05   m .
Collector Length [m]Annual Percentage Inter-row Shading Losses [%]
100.39
200.47
300.50
400.51
Disclaimer/Publisher’s Note: The statements, opinions and data contained in all publications are solely those of the individual author(s) and contributor(s) and not of MDPI and/or the editor(s). MDPI and/or the editor(s) disclaim responsibility for any injury to people or property resulting from any ideas, methods, instructions or products referred to in the content.