Article

Exploratory Analysis of a Novel Modular Green Wall’s Impact on Indoor Temperature and Energy Consumption in Residential Buildings: A Case Study from Belgium

1
Renewable Energy Sources and Ecological Engineering, Faculty of Mechanical Engineering, University of Banja Luka, 78000 Banja Luka, Bosnia and Herzegovina
2
Building Physics and Sustainable Design, Department of Civil Engineering, KU Leuven, Ghent Campus, 9000 Ghent, Belgium
*
Authors to whom correspondence should be addressed.
Energies 2024, 17(21), 5267; https://doi.org/10.3390/en17215267
Submission received: 5 September 2024 / Revised: 18 October 2024 / Accepted: 21 October 2024 / Published: 23 October 2024
(This article belongs to the Special Issue Performance Analysis of Building Energy Efficiency)

Abstract

:
One possible solution that mitigates the effects of climate change is the implementation of vertical greenery systems, which have the potential to reduce the need for cooling and provide energy savings for heating. This paper evaluates the effects of an innovative modular green wall on indoor temperature and energy use in a residential case study building. This research was carried out on a residential house in the city of Ghent, Belgium, whose southwest facade is covered with a specific type of modular green wall (a structure with a specific substrate and plants that have the ability to purify water so that it can be reused in the house). The monitoring process included four different temperatures (in front of and behind the green wall, in the substrate, and on the wall without greenery) during winter and summer periods. To analyze the effect on the internal temperature and energy use, a DesignBuilder simulation model was built and validated against these experimental results. This green wall has proven to have the greatest effect during the hottest summer days by reducing the indoor temperature by up to 3.5 °C. It also effectively increases the indoor temperature by up to 1.4 °C on a cold winter day, leading to energy savings of 6% on an annual basis.

1. Introduction

1.1. The Impact of Climate Changes and Urban Heat Islands on Residential Buildings

Nowadays, cities face increasingly frequent occurrences of extreme changes in local climate conditions, making urban environments resistant to climate change a vision of the future [1]. The research results of Marschütz et al. (2020) have shown that the impact of historical events is large and embedded in local cultural memory, influencing how current and future climate change and climate action are interpreted and acted upon [1].
To ensure the quality of life for inhabitants of urban areas and to make the environment more suitable for living, working, and relaxation, it is necessary to constantly improve urban green infrastructure (UGI). This includes, among other things, vertical greenery systems, especially in densely built urban areas where there is not much space for building new alleys or parks. In such urban areas, the problem of urban heat islands (UHI) is becoming more pronounced. This means that the temperature in cities is higher than the ambient temperature, making living conditions during the summer period unbearable for the population. These temperature differences can sometimes reach up to 10–12 degrees during the night when cooling is significantly slowed down [2]. The main causes of this situation are the large percentages of built-up areas (concrete, asphalt, and metal) and the lack of green and water areas, which are caused by the intensive urbanization process, i.e., the impact of man [3]. The greatest effect is during the night when cities cool down slowly. This phenomenon can lead to serious consequences for human health [4,5], as well as an increased need for cooling buildings, which affects the increase in energy consumption [6,7].
Due to climate changes, Europe is experiencing hotter summers with more heat waves and more frequent droughts. Cities can become unpleasant for residents and visitors as many paved surfaces heat up and water evaporates too quickly. Also, there is not enough vegetation compared to rural or suburban areas. High summer temperatures can reduce water quality and threaten aquatic ecosystems. In addition, air pollution increases in warm weather conditions. The heat wave during the summer of 2019 showed how dangerous heat can be to public health, causing 1435 deaths in France, according to BBC News [8,9]. People are becoming increasingly aware of the importance of adapting to spatial heat stress in cities. Public spaces need to be reimagined to improve cities’ resilience to heat. This can be achieved by different measures: planting trees and shrubs, creating shaded spaces, installing green/living walls, and/or adding water features. These measures help cool cities, support biodiversity, protect against floods, and the like [8].
During the record heat wave of 2019, a very high Physiological Equivalent Temperature (PET > 50 °C) was reached during the day for the moderate climate of Ghent. It is expected that more extreme heat stress will occur in the future, according to climate projections. Extreme heat stress occurs most often in open spaces in the city and countryside. These results should be taken into account in urban planning with the aim to create climate-resilient Western European cities [10].
This is why it is necessary to improve buildings in urban areas and make them resilient to such changes by introducing more nature and materials on a natural basis, such as green walls and facades, into the urban infrastructure [11,12,13]. In the simulation study on a neighborhood courtyard, it was shown that by implementing the redesign proposal (pocket park), the average PET can be significantly reduced, and a large number of points above the courtyard will experience much greater thermal comfort. The final aim is to facilitate a wider range of human activities and to make the site more attractive [14].
In order to achieve positive effects on the aforementioned problems of excessive heating, one of the principles is the use of alternative ways of constructing buildings, taking into account microclimatic conditions, and passive systems for achieving energy efficiency [15]. Passive strategies significantly impact the systems’ energy efficiency of residential buildings. Bioclimatic architectural structures are built in such a way that during the winter period, they mitigate excessive cooling, and during the summer period, they mitigate excessive heating and enable adequate cooling [16]. A similar biophilic design framework can help conceptualize “nature” in architecture [17].

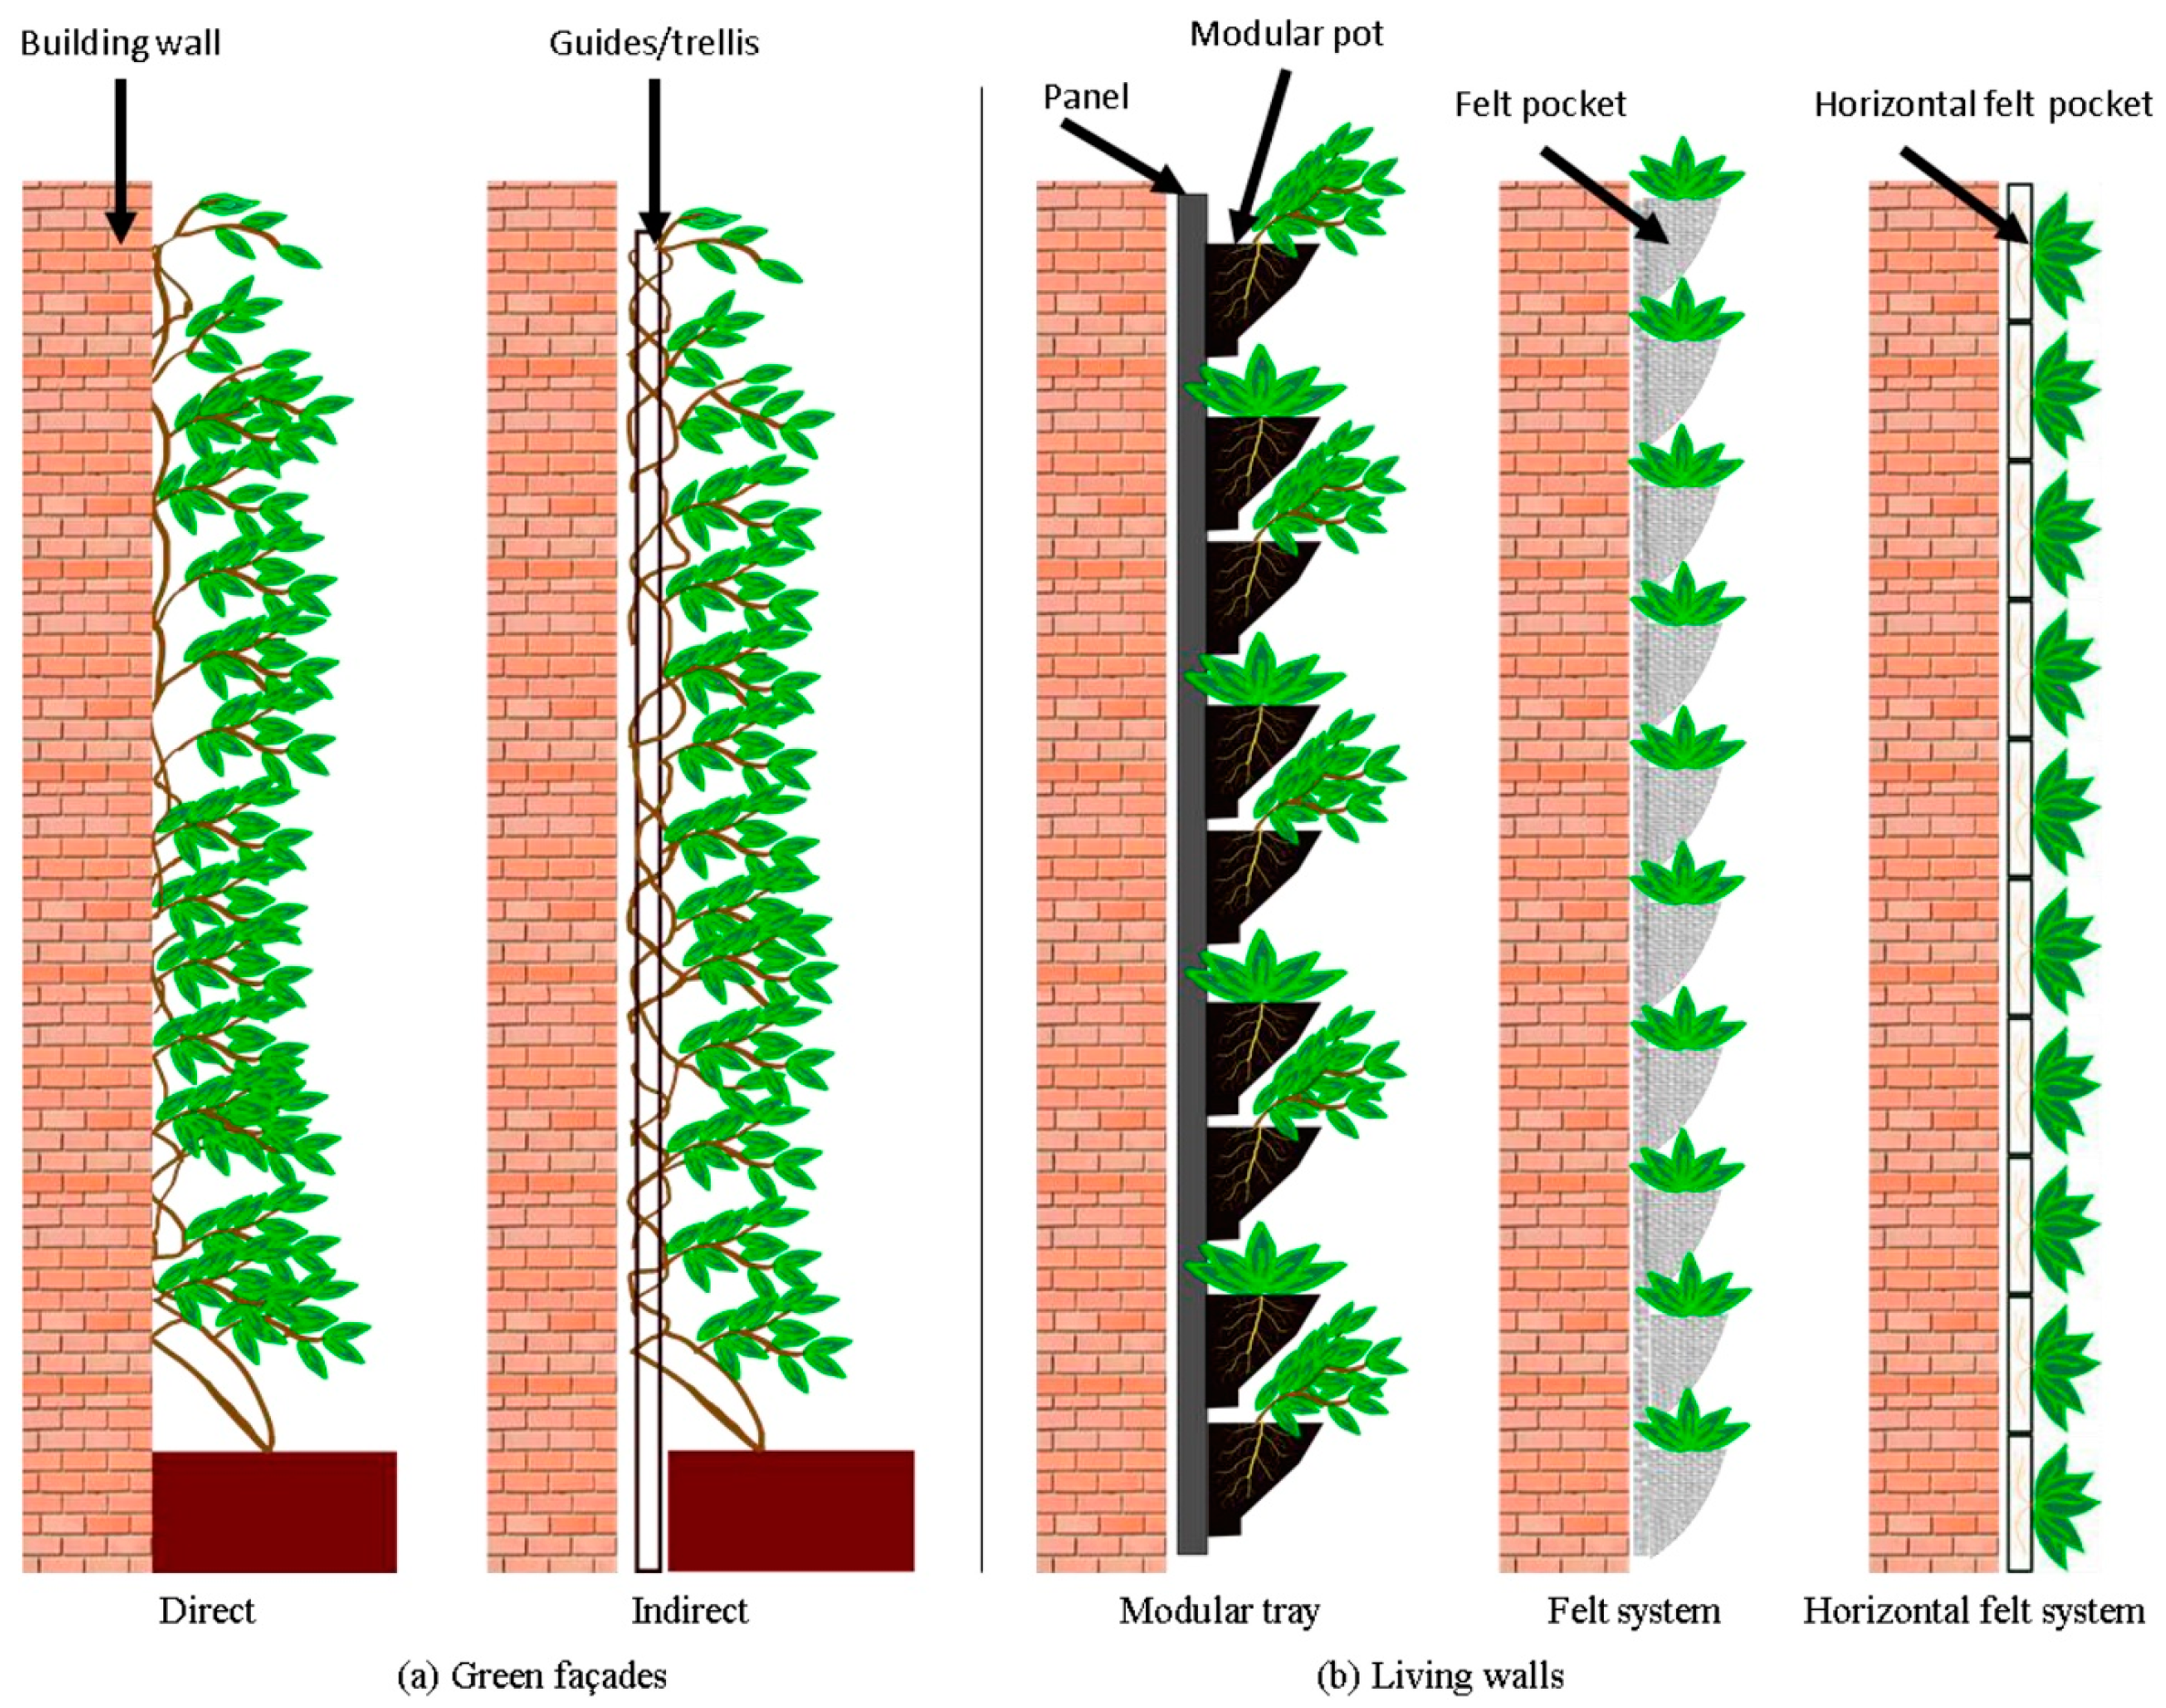
1.2. Vertical Greenery Systems (VGS)

Urban green infrastructure can help a lot in reducing the negative effects of climate change. It includes, in addition to treelines, shrubs, and hedges, green roofs, and vertical greenery systems. When it comes to vertical greenery systems, they include two basic categories: green facades (direct and indirect greening systems) and green walls (planting boxes, felt pockets, and horizontal felt systems) [18]. Figure 1 shows the different systems of vertical greenery. The main difference between facades and walls is that facades are two-dimensional systems in which plants grow by hanging directly on the facade or by means of a substructure (indirect), while green walls are three-dimensional systems with modular plant pots, planting pockets, or horizontal felt pockets.
The use of vegetation (green walls and green facades) in urban planning has become a necessary aspect due to the great and numerous advantages that these systems offer: improving building envelope thermal performance, reducing the heat island effect, CO2 sequestration, moisture retention, contributing to the increase of biodiversity, and improving the quality of the urban landscape [19,20]. Vertical greenery systems represent the most innovative representations of urban nature and powerful tools for bioclimatic design, especially when available space is very limited, as is the case in most densely built urban areas [19,21].
The green wall is an additional layer of insulation on the building, helping buildings cool down more slowly during the winter period and thus reducing energy consumption for heating. Research has shown that the green wall serves as protection during cold periods [8]. The substrate used for the installation of green walls represents a layer of insulation, so modular types of green walls have better insulating characteristics than green facades [8].
When it comes to summer cooling, research has shown that green walls can reduce the external wall temperature, internal air temperature, and external ambient air temperature, thus providing more favorable conditions for the residents and reducing the energy needed for cooling. For example, the peak temperature of a green wall is 15.4 °C lower than the peak value of a conventional wall, and the cooling load reduction in July is 11% for west-facing and 4.8% for south-facing green walls [22]. Green walls can reduce the energy demand of buildings by up to 37% in hot climates. These effects are key to determining the building cooling capacity that green walls have, including shading, evapotranspiration, insulation, and ventilation [23].
Certain studies have also shown that green walls have more insulating effects during the winter period. Although extreme weather conditions were found to be beneficial for winter, opposite findings were recorded for the cooling season, in which the plant layer was less effective due to the thermal performance conditions of the facade at a relatively higher temperature [24]. This study showed that a green wall or green facade does not respond equally in terms of energy savings. Although the weather has been shown to have a strong influence on annual efficiency, the functional pattern of the buildings, i.e., the occupancy schedule as well as the consequent HVAC operation, had a direct impact on the performance of the green wall [25].
In a study by Arenghi et al. [26] that included simulations of different types of green walls using DesignBuilder software (v 7.3.0.29), it was shown that the system with the best performance in winter is a green wall with PVC panels of 15 cm in its stratigraphy, with a lower thermal conductivity than the ground. This system provides better insulation than the other systems. In this research, it was shown that the operating temperature increases up to 4 °C compared to the wall without vegetation. Light systems and heavy systems increase the operating temperature by 1 °C and 2 °C, respectively. The soil of these systems provides thermal resistance, but on the other hand, it is almost always wet, so it does not have a low enough thermal conductivity to act as insulation. Green Coating Systems (GCS) have a very similar trend to the concrete model, and the Green Barrier Systems (GBS) trend coincides with the latter because they protect against the cold in winter but do not insulate the wall [26].
All the above-mentioned studies analyze “classic” systems of vertical greenery and compare the effects of facades and green walls on indoor temperature and energy consumption, mostly in hot and humid climates. In previous research on green walls, various modular systems that are used as insulation in summer and winter have been investigated. None of these systems were originally created with the function of purifying water and at the same time can have an effect on thermal performance.
In this study, an experimental and simulated evaluation of a specific modular green wall system, whose primary function is water purification, was performed in the moderate climate of the city of Ghent, Belgium. This system has a specific substrate composition suitable for different types of plants (with high levels of LAI) with the potential to absorb a lot of solar radiation in the summer. Its cooling effects and impact on indoor temperature decrease in the hottest period of the year, as well as its insulating effects and influence on indoor temperature increase and energy use reduction in the coldest period, were investigated.
The investigated modular system has a specific substrate of 10 cm in depth and it consists of 50% lava, 25% organic soil, and 25% biochar. The plants are 10–25 cm tall and contain species that have large leaf surfaces that contribute to increasing the process of evapotranspiration and, therefore, increase the relative humidity of the air, absorb more solar radiation, which prevents the penetration of heat into the interior of the building. Section 2.3 describes the details of the modular panels.
Regarding these aspects, this paper contributes to the experimental and simulated studies on green walls’ benefits by using a case study approach to examine the thermal performance of the green wall in a European city with a moderate climate. The focus is on a specific modular green wall structure that was implemented on a single-family house’s facade with the aim of purifying the gray water. In addition to the main function, it was presumed that this structure also has some influence on the thermal performance of the house, which was investigated by using experimental monitoring and software simulation. This green wall system and the experiment conducted in this study provide a new perspective in researching green walls that have different functions (such as gray water purification). Due to their performance, such systems can be used and have great advantages in cities with a moderate climate, such as Ghent. The research on the innovative green system can help to better understand its energy performance and have an impact on future research, from the aspect of energy savings for heating and cooling.
The paper includes four main sections with several subsections. In the introduction part, the impact of climate change and urban heat islands on residential buildings, as well as the vertical greenery systems (VGS), are described. The second section includes a description of the study area and case study, a modular green wall, monitoring process and equipment, local climate parameters, software simulation, and model validation. The section about results is divided into two main parts: monitoring and simulation results, with separate parts for the summer and winter periods. The last section summarizes all the results and the most important conclusions.

2. Materials and Methods

This section includes the following subsections. The first one is a description of the study area and its microclimatic conditions that are most important for this research, including Ghent’s urban heat island analysis. Then, a technical description of the residential building and the modular green wall, on which simulation and validation were performed, is provided. The monitoring equipment is shown with its main specifications, and the process of measuring temperature values on the wall without vegetation and on the green wall is described. Finally, local climate parameters that are relevant to this research and were taken from the reference weather station located 1 km from the case study location are analyzed.

2.1. Study Area

Ghent is a typical mid-size European city and it is located in the north of Belgium, at the confluence of the rivers Lys and Scheldt. It has a flat topography and is not a coastal city, which simplifies the interpretation of meteorological observations. The northern region of Belgium experiences a mild maritime climate. Average minimum temperatures are 1.1 °C and 6.7 °C in January. Average maximum temperatures are 13.4 °C and 23.4 °C in July. The warmest days (with a maximum temperature of minimum 25 °C) are in July and August, 10.3 and 8.8 respectively. In these months, there are also the most tropical days (with a maximum temperature of minimum 30 °C), 2.3 and 2.5 respectively [27].
The object of this research is a single-family house on which a modular green wall has been installed and it is located in Ghent, in the Brugse Poort neighborhood. “Brugse Poort is one of the twenty-five city districts of Ghent, situated northwest of the city centre. It developed in the early nineteenth century as some large textile mills and a steel-producing company set up shop in the district. As these factories attracted a mass of people willing to work, a process of unplanned and speculative urbanization ensued, leading to a chaotic urban tissue, a lack of green space, poor housing, and a high population density, some of which remain to this day” [28]. Since the 1990s, Brugse Poort has been subject to gentrification. This process was spontaneous at first, but from 1998 it became government-induced through the different planning strategies and the realization of an urban renewal project, named Oxygen for Brugse Poort [29].
As indicated in Figure 2, the Brugse Poort district is an urban area with compact low-rise buildings, located northwest of the city center. The average night-time temperature difference between Brugse Poort and the surrounding countryside ranges between 0.5 and 1.5 °C, based on the ALARO model–RMI [30].

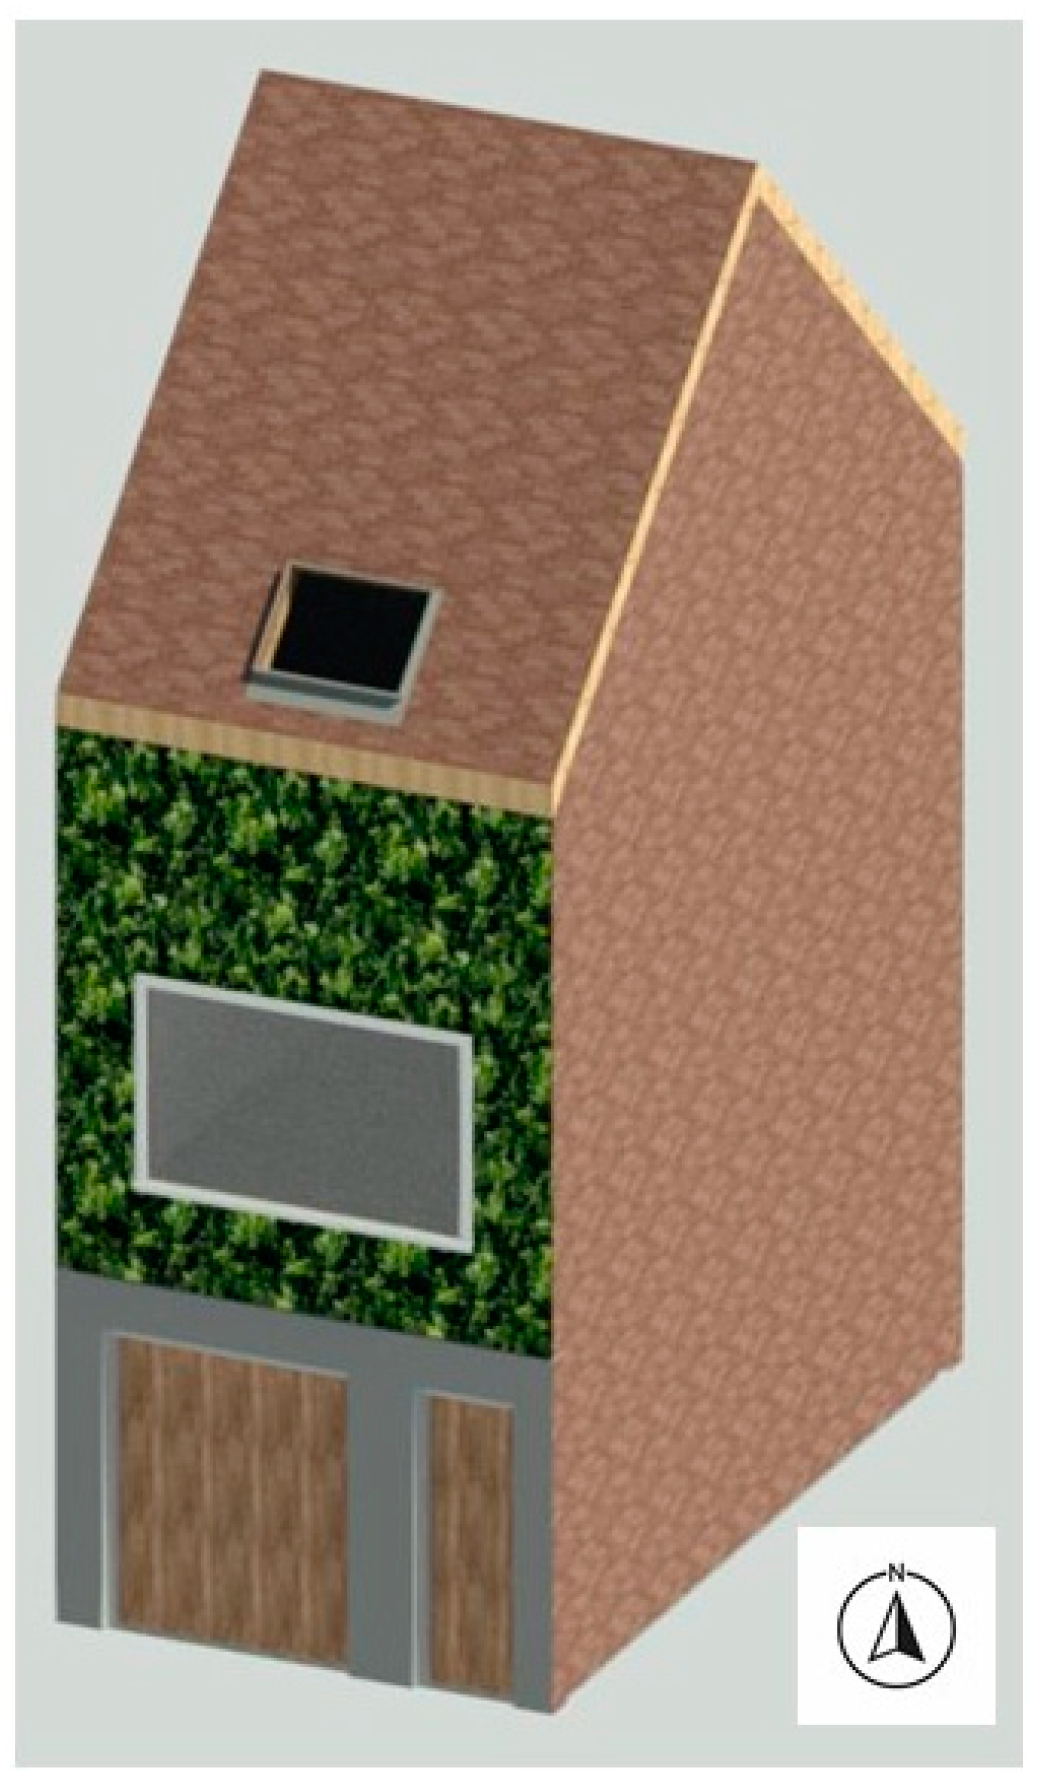
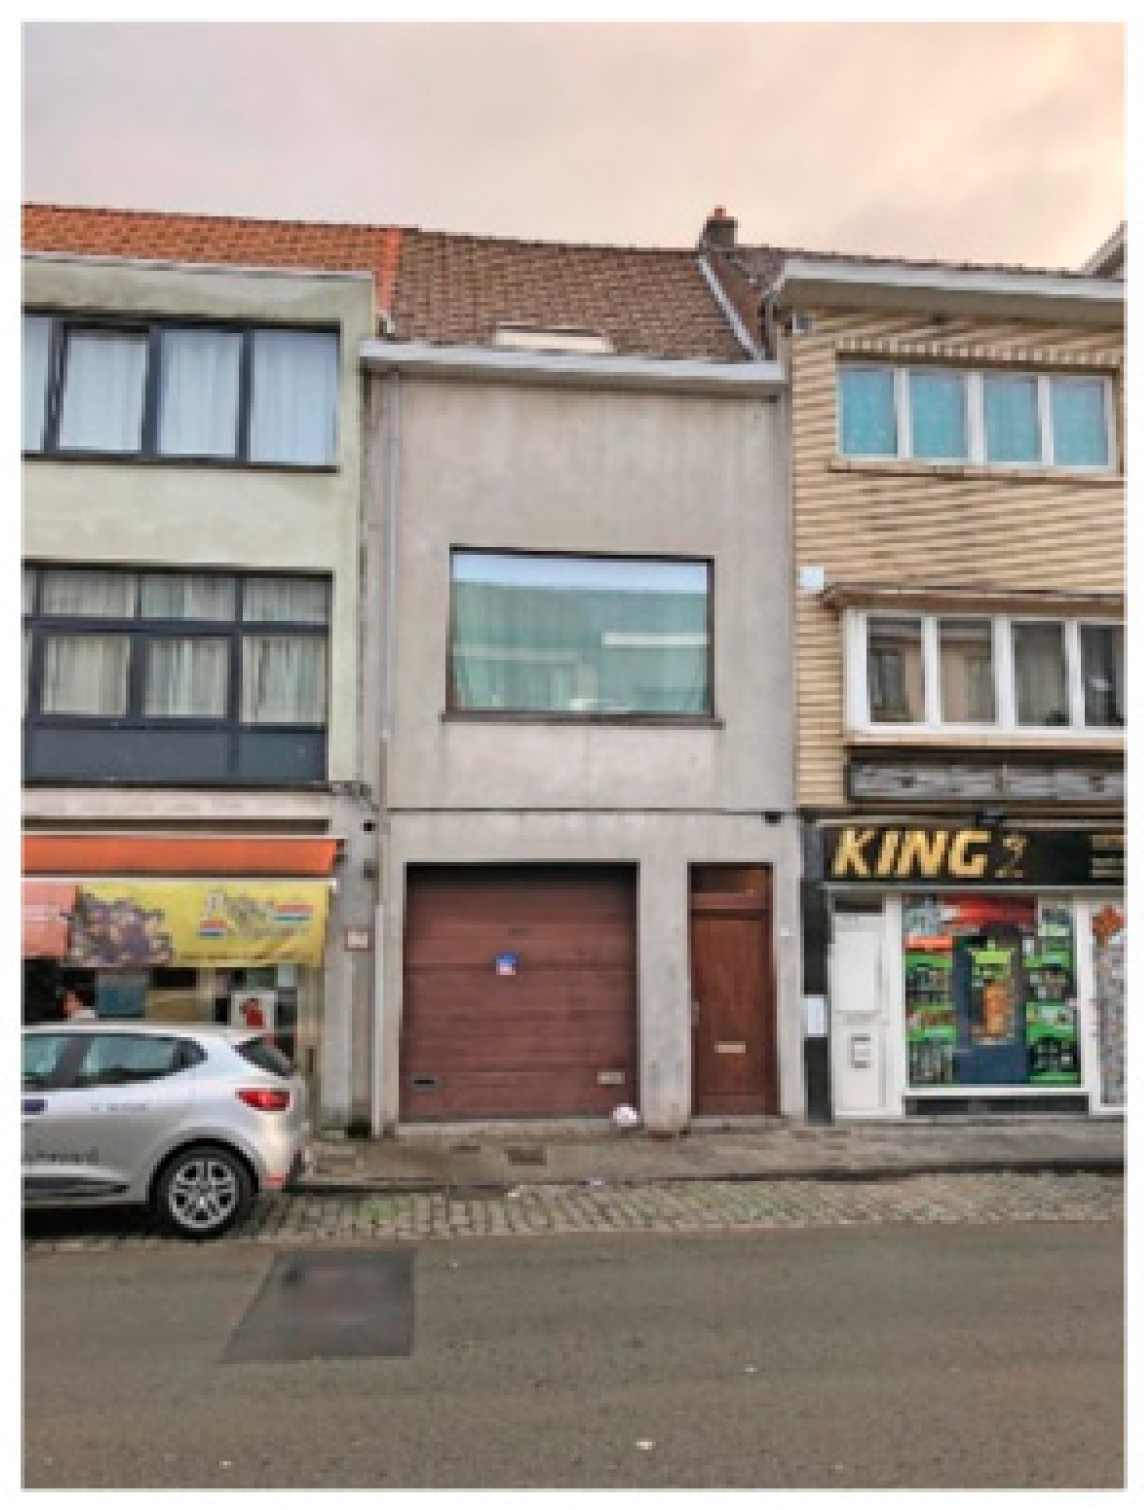
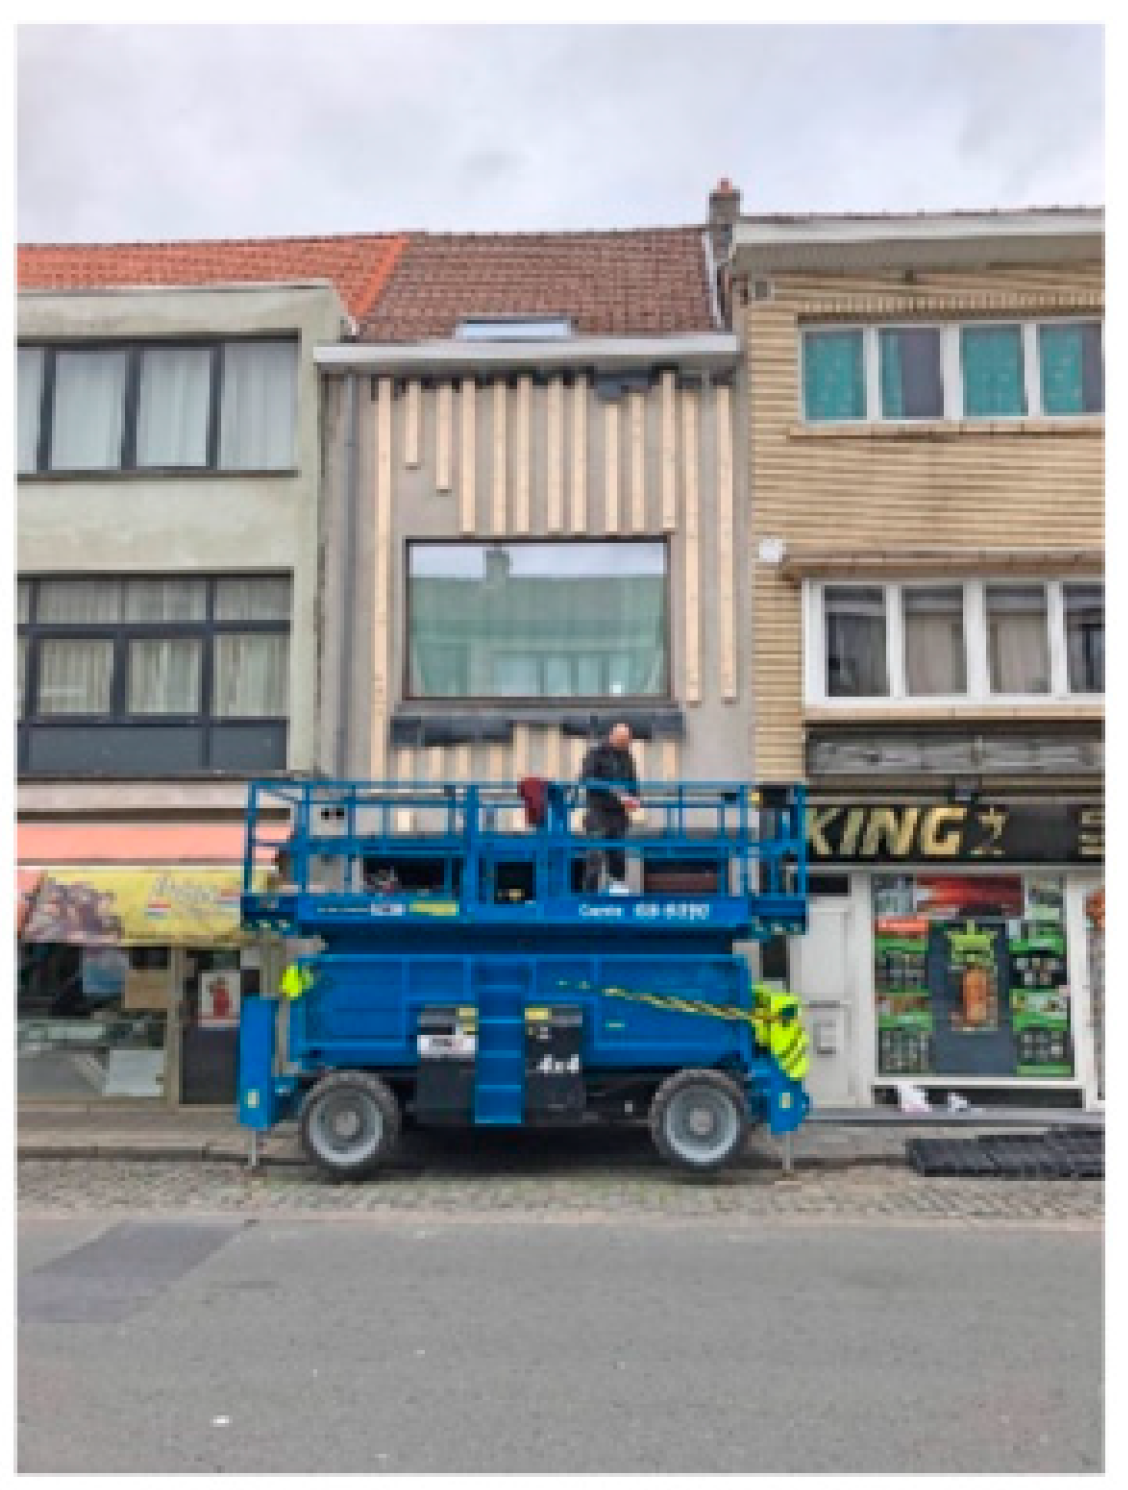
2.2. House Technical Description

The case study is a single-family house with two people living inside. Most of the day, they are not present during working hours. According to the EPC (Energy performance certificate), it was estimated that the consumption of gas in the house is lower than average, as well as the consumption of electricity.
Floor plans of the house with rooms indicated are shown in Figure 3. 3D models of the house before green wall installation and after it are shown in Figure 4 and Figure 5. On the first floor, behind the green wall, the living room with kitchen is located. On the second floor, the bedroom is located behind the green wall. Those are heated zones in the house; on the contrary, the garage (ground floor) is an unheated zone.
The house is built of brick, and it was renovated in 2019. Additional insulation on the external northeast wall was added, windows on the 1st floor were replaced, and the heating system was changed (a more effective gas boiler replaced the old one). The roof is not insulated, and the ground floor is in the same state as it was prior to the renovation. The cooling system is not installed, and the house has a natural ventilation system. In its original state prior to renovation, the annual consumption of primary energy totaled 31,804.49 kWh, or 297.24 kWh/m2. The characteristic annual consumption of primary energy is the amount of primary energy needed during the year for heating, hot water production, ventilation, and cooling. The calculation assumes a standard climate and standard use (EPC). The U-values of the exterior walls and fenestrations are given in Table 1, according to the EPC and manufacturer’s specifications.

2.3. Modular Green Wall (Total Value Wall)

The Total Value Wall is an innovative modular green wall with the primary function of rainwater and wastewater purification. It has a specific substrate and plants that have the ability to purify water so that it can be reused in the house [31]. In addition, it was assumed that this system also has many structural advantages in terms of heat and sound insulation. For the purposes of this research, this modular green wall was viewed as an insulating structure on the house, with the aim of quantifying its cooling and insulating effects, its impact on the indoor temperature, and consequently, the reduction of energy consumption for heating.
The researched green wall is installed on the southwest-oriented facade of the house and consists of 40 panels measuring 60 × 60 × 10 cm (Figure 6). Each panel consists of a steel mesh, i.e., a structural frame that is filled with geotextile bags with a substrate for planting plants. The process of TVW installation and the appearance of the house before, during and after installation are shown in Figure 7, Figure 8, Figure 9 and Figure 10.
The substrate is a mixture of 50% lava, 25% organic soil, and 25% biochar. This substrate has an approximate bulk density of 0.71 kg/L, so one panel contains about 25.6 kg of substrate [32]. The plants are 10–25 cm tall and contain different species: “Carex morrowii, Acorus gramineus, Mazus reptans, Ajuga reptans, Deschampsia cespitosa, Geum rivale, Heuchera hybrid, Houttuynia cordata, Campanula posharskyana, Geranium wlassovianum and Hemerocallis hybrid”. They are planted in planting pockets, i.e., slits on the geotextile. The panels are placed in two zones with 20 panels each, and each of them covers an area of 7.2 m2. Each zone has a drip irrigation system with drippers installed every 0.5 m to distribute wastewater evenly [32].

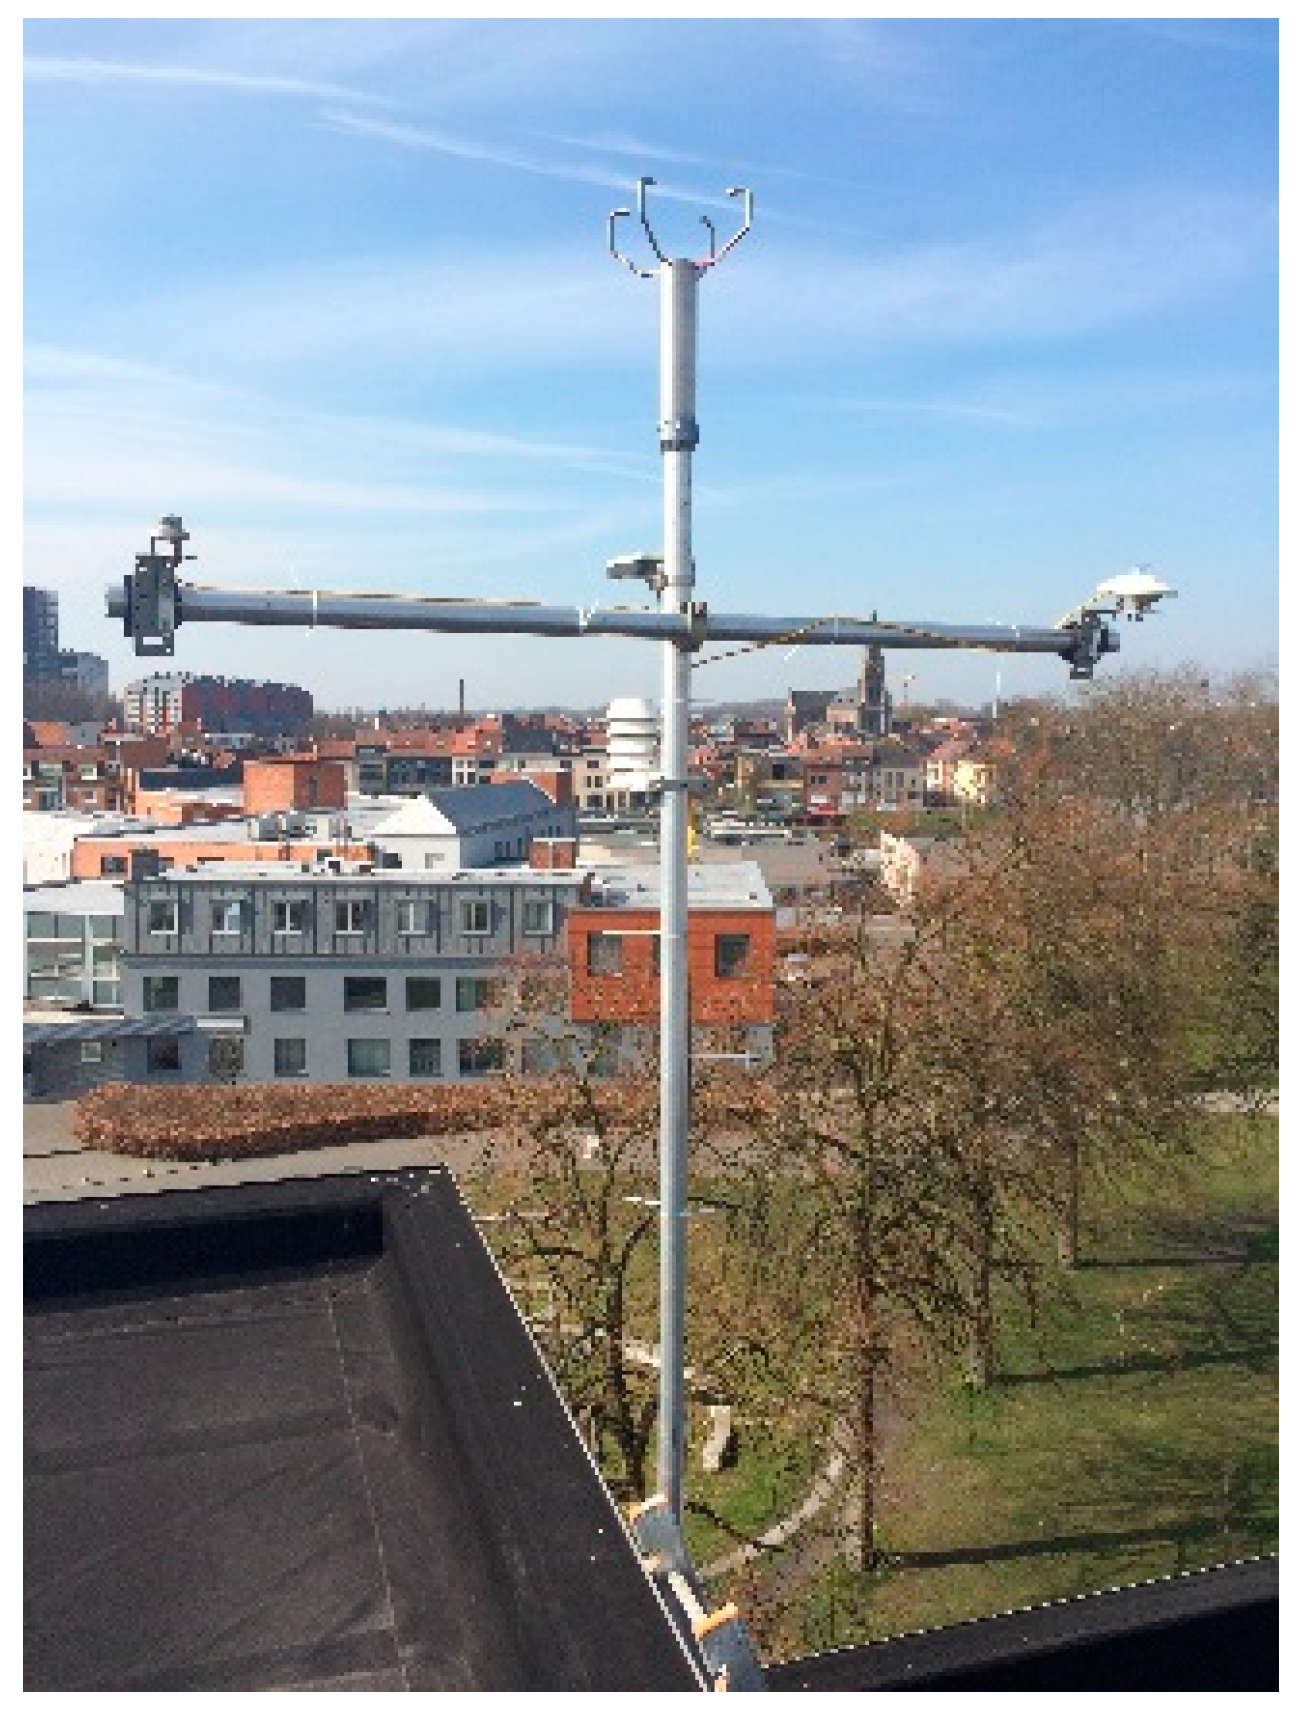
2.4. Monitoring Equipment

On the house, next to the green wall, monitoring equipment is installed (Figure 11). It contains a reporter for remote monitoring and a weather station with sensors for measuring CO2, wind speed, precipitation, and four different temperatures (in front of and behind the green wall, in the substrate, and on the wall without greenery). As the measurements are mostly carried out outdoors, a solar panel was chosen instead of mains power [33]. The reporter offers a real-time data connection to the cloud, measuring, storing, and transmitting sensor data every 30 min, according to the set configuration. Technical specifications of the sensors are given in Table 2.
The green wall monitoring data includes 4 different temperatures: temperature on the wall without greenery (Tref), temperature in front of the green wall (T1), substrate temperature (T2), temperature behind the green wall (T3), and climate parameters: wind speed and rainfall intensity. The relevant data for this research are primarily bare wall and green wall temperatures and they were analyzed for two periods: summer (the month of July as the hottest summer period) and winter (the month of January as the coldest period). The sensor positions are shown in Figure 12. The sensors are located on the southwest façade, underneath the roof. The approximate height of the location is cca 7.5 m from the ground level.
The reference climate parameters were taken from the weather station located at the KU Leuven Ghent Campus, on the roof of building E (Figure 13, Figure 14 and Figure 15). This weather station is located 1.0 km from the case study. The data is also displayed on the platform in real time, and the parameters are measured every minute and taken for the same periods (January and July) and include air temperature, relative humidity, precipitation intensity, solar radiation, direction, and wind speed (Table 3).

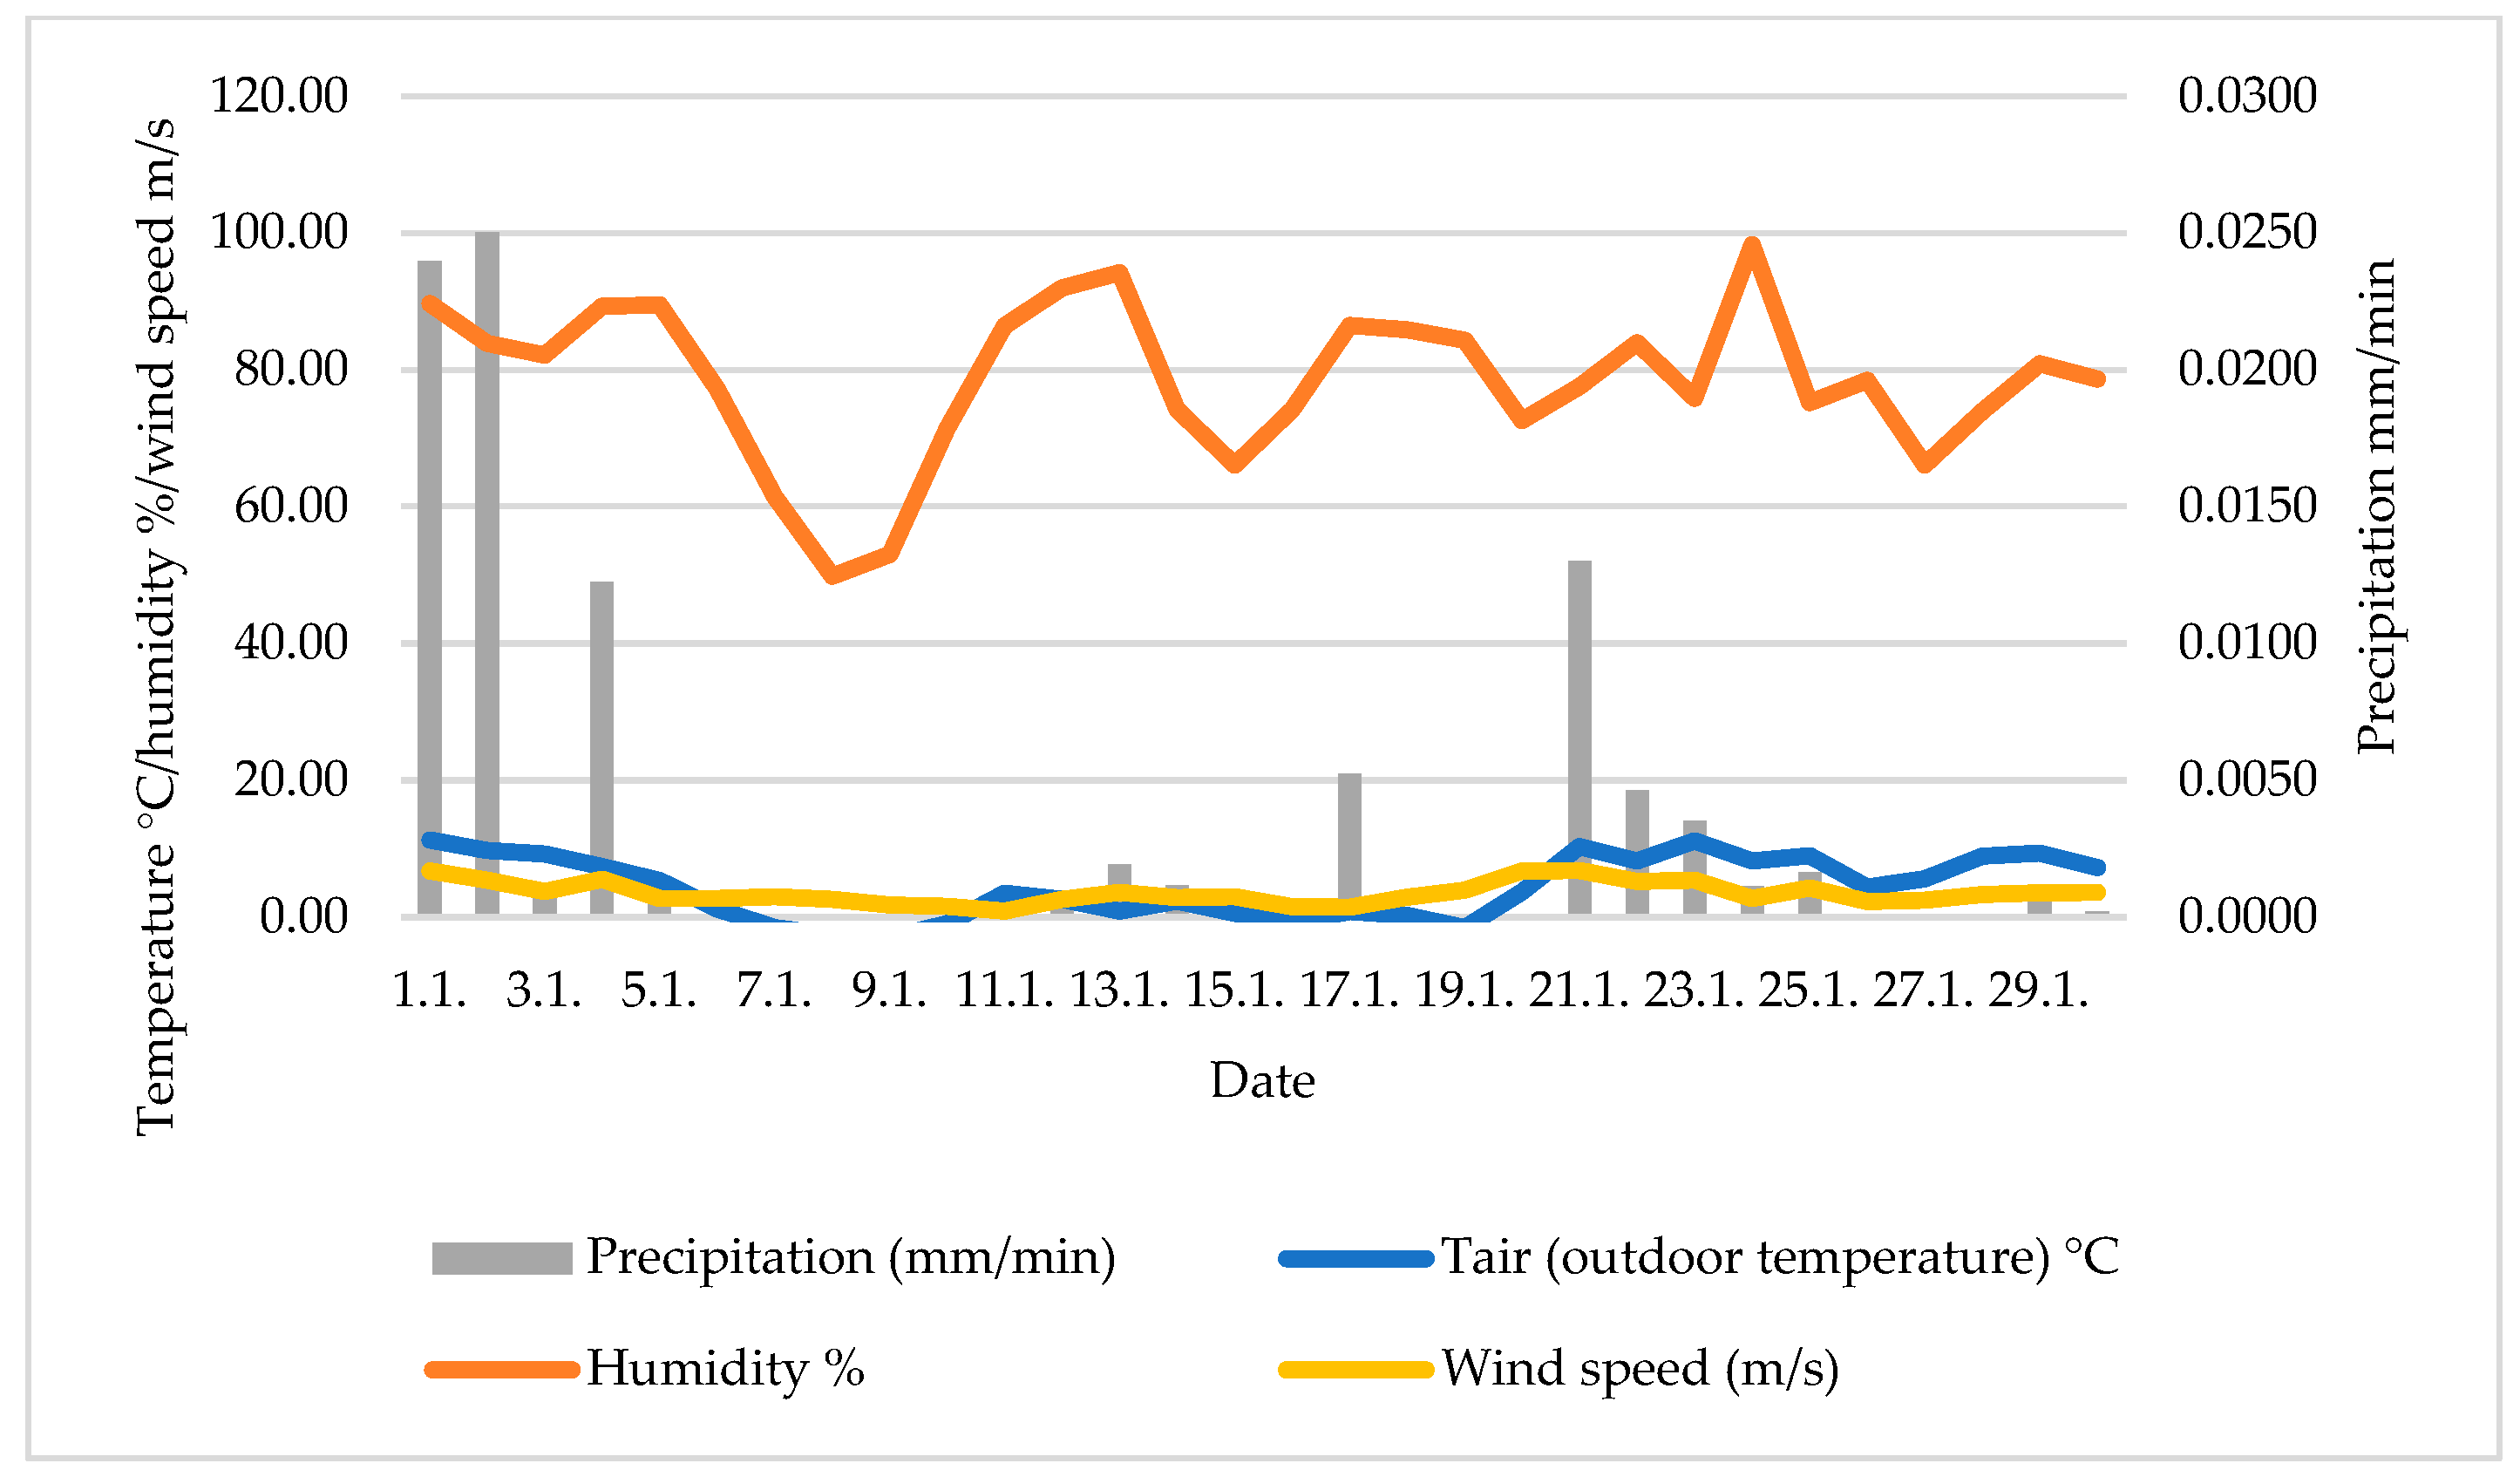
2.5. Local Climate Parameters Analysis

According to the reference weather station, data for winter (coldest month) 2024 and summer (hottest month) 2023 were analyzed. The coldest winter month was January, with a mean temperature of 4.4 °C, relative humidity of 78.6%, and mean global horizontal solar radiation of 34.9 W/m2. The coldest winter day was 10 January, with a daily mean temperature of −2.9 °C. The hottest summer month was July, with a mean temperature of 18.7 °C, relative humidity of 65.9%, and mean global horizontal solar radiation of 200.9 W/m2. The hottest summer day was 7 July, with a daily mean temperature of 26.3 °C. Weather conditions for the researched period are summarized in Figure 16, Figure 17 and Figure 18. Figure 16 describes the daily mean values of climatic parameters in July (outdoor temperature, relative humidity, precipitation, and wind speed). Figure 17 describes the same parameters for January, and in Figure 18, the daily mean values of global horizontal solar radiation for the winter and summer periods are shown.

2.6. DesignBuilder House and Green Wall Modeling

A BIM model of the house was created and used for energy analysis in the current state. House geometry with zones was created in DesignBuilder software, which was used for the simulation of indoor temperature and energy use for heating before and after green wall installation. All the required data was extracted from the designed drawings, material technical specifications, and the Energy performance certificate supplied by the house owner.
The house model is divided into two main categories of zones: heated and unheated. There are two unheated zones: the first one includes the main entrance and garage, and the second one is the zone under the roof. There are also two heated zones: the first one is on the first floor (living room and kitchen), and the second one is on the second floor (bedroom and bathroom) (Figure 3). All the heated zones are located on the first and second floors, behind the green wall. Construction materials with U-values indicated are input according to design documentation, EPC, and manufacturer’s specifications (Table 1).
For the purposes of this research, a new vertical structure was created on the southwest facade of the house, which represents the researched specific modular green wall with all the characteristics of the substrate and plants. The substrate properties used in the model were based on the manufacturers’ specifications and literature regarding vertical vegetation parameters. Green wall model specifications with the thermal properties of model components are given in Table 4.

2.7. DesignBuilder Green Wall Model Validation

After the experimental monitoring data were collected and analyzed, the case study was simulated in the DesignBuilder software, and its results were compared with experimental data to validate the simulation model. The green wall model used for simulation in this study is validated for the exterior temperature of a wall against the results of the experimental measurements for the study case (results shown in Section 3.1). Figure 19 and Figure 20 show the measured and modeled exterior wall temperature values of a facade with the green wall during a winter day (Figure 19) and a summer day (Figure 20).
The values of the standard deviation for the temperature differences are 0.31 for the winter day and 0.37 for the summer day. The differences for the winter day are in the range of 0.07–0.6 °C and for the summer day in the range of 0.1–0.6 °C. These small ranges show that simulation using DesignBuilder incorporating the self-developed green wall model can reasonably predict the indoor temperature and the energy savings of a residential building with a green wall implemented on its southwest facade.
The error bars on the measured temperature values are shown for every hour. The accuracies of the temperature sensors are ±0.5 °C (Table 2). As can be seen in Figure 19 and Figure 20, most of the simulated temperature values are within this range. As a consequence, the simulation model can be assumed as validated.

3. Results

This section includes the following subsections. First, the monitoring data are analyzed for the summer and winter periods. Then, the simulation results are described and discussed, also for the summer and winter. Those results include the cooling effects of the green wall during the hottest summer month and the insulating effects during the coldest winter month, and an analysis of the change in energy use for heating.

3.1. Monitoring Data Analysis

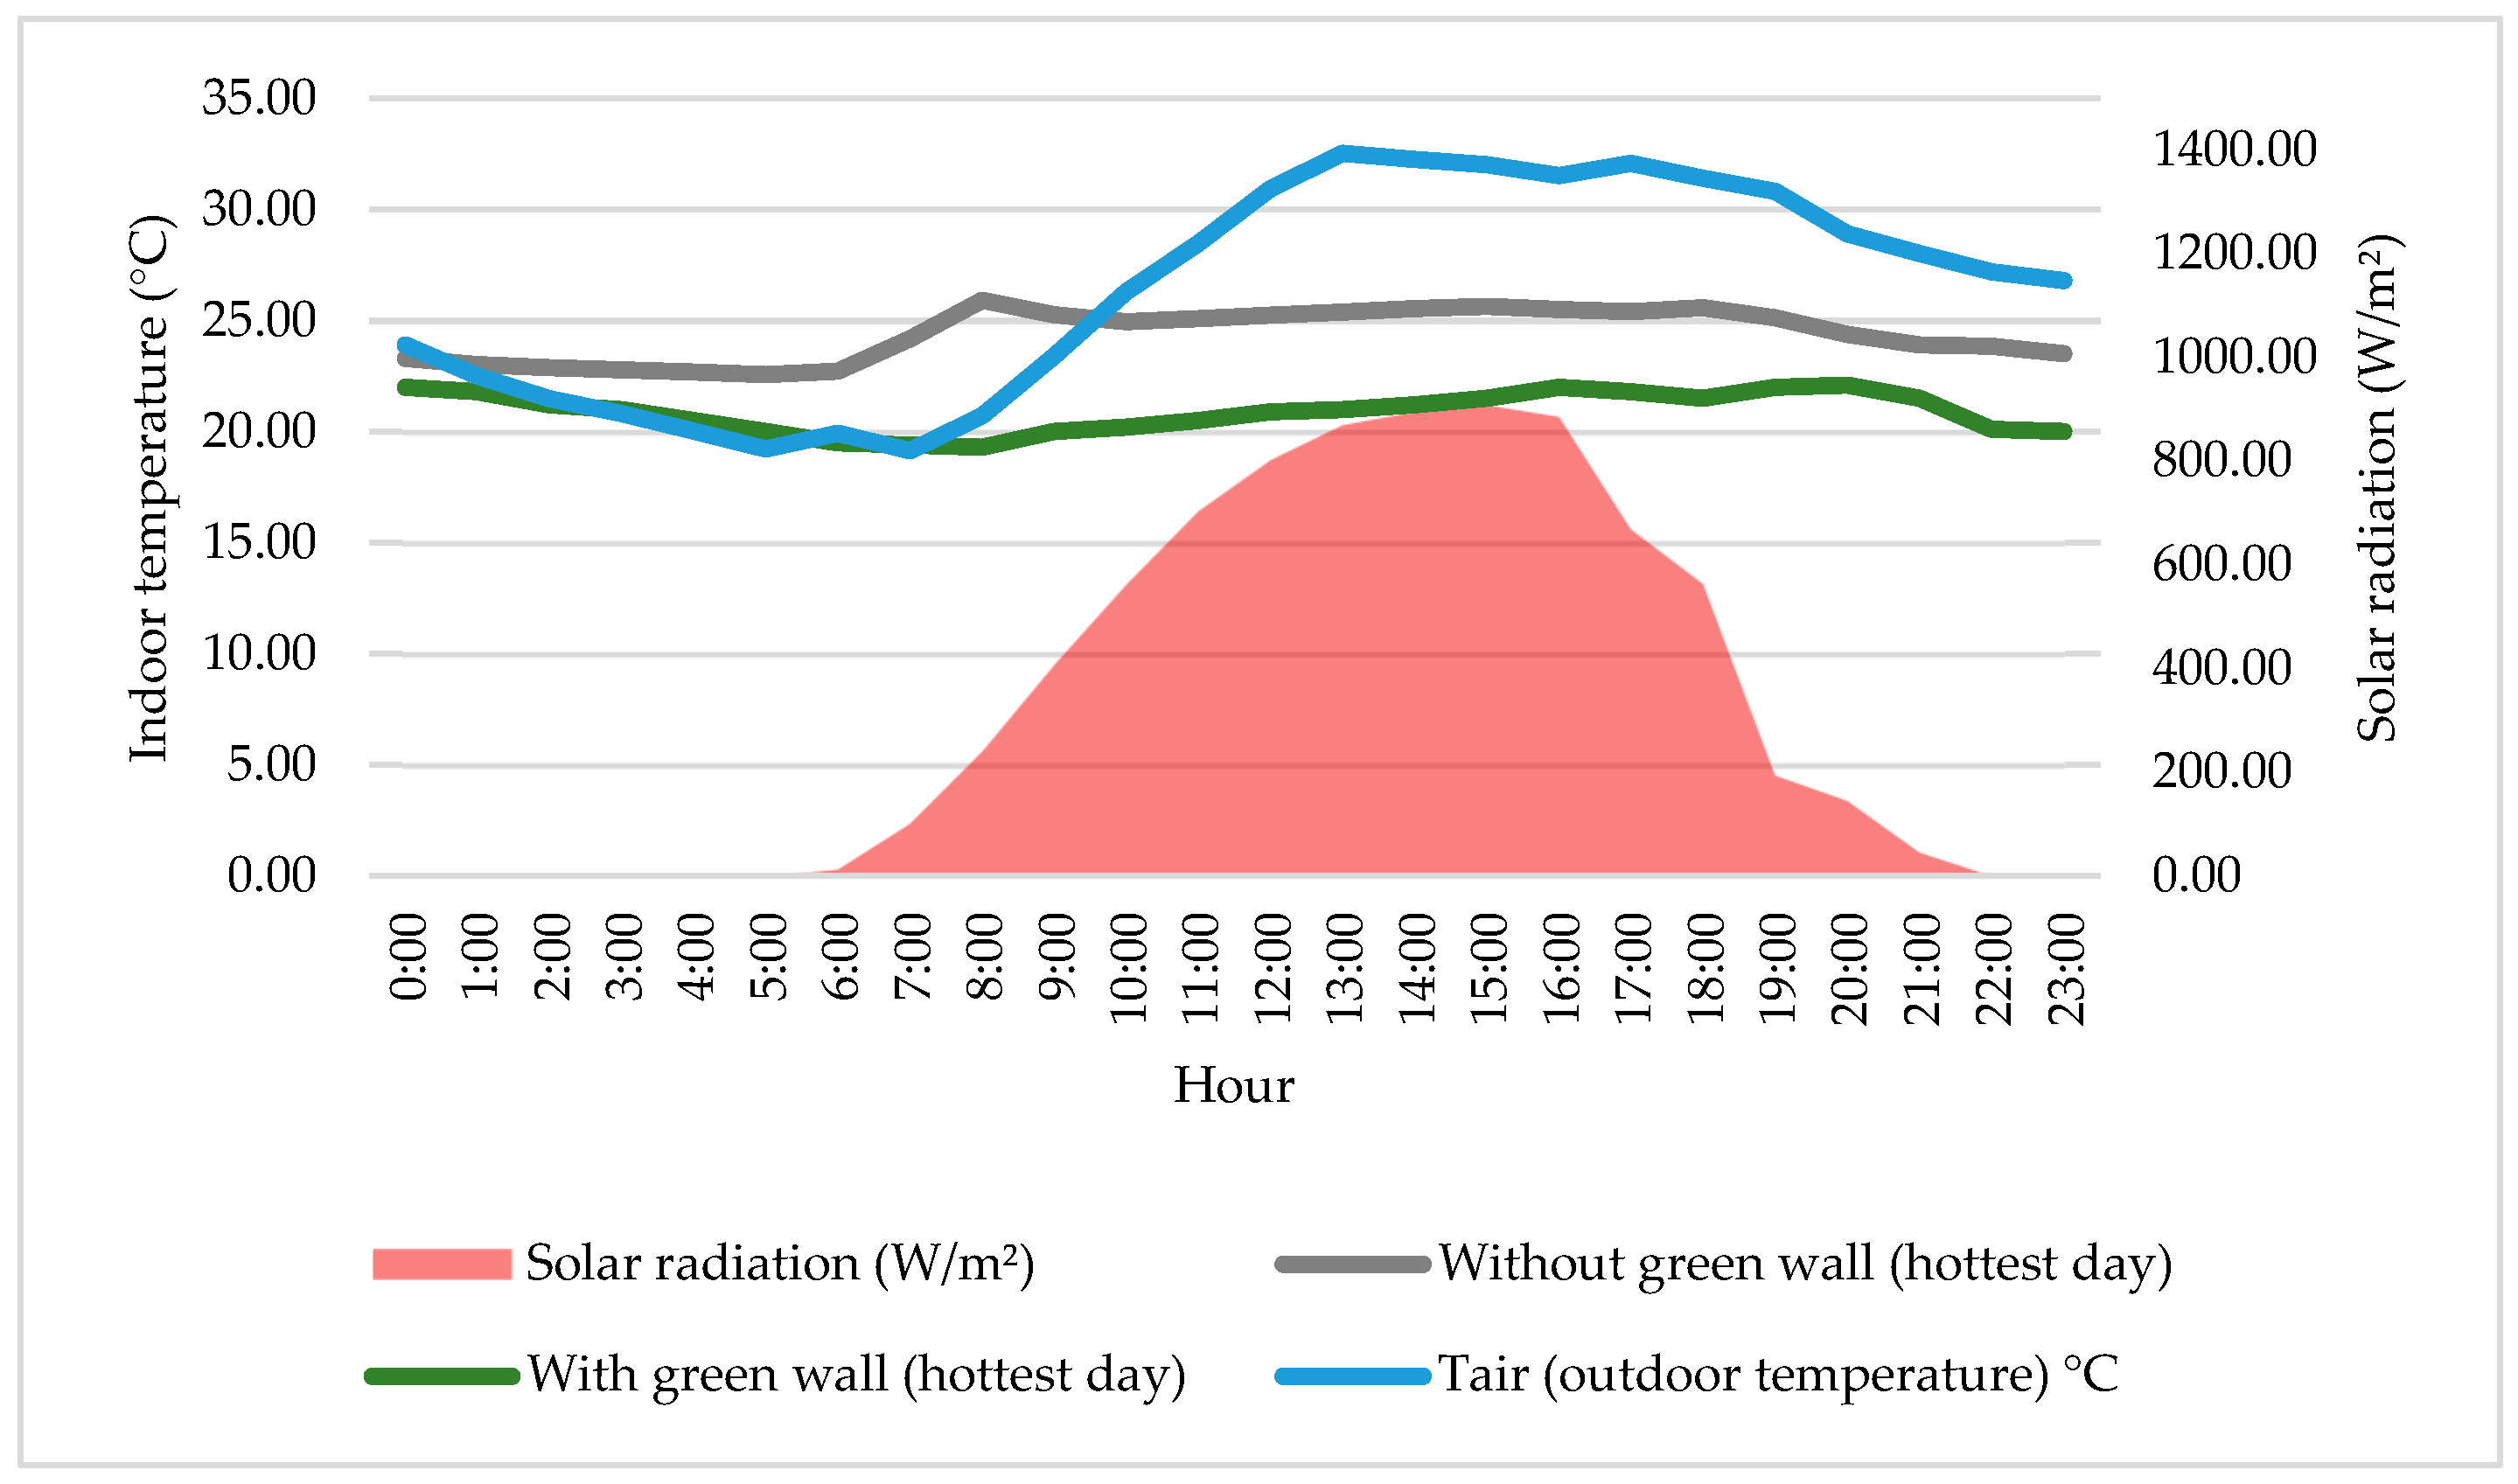
3.1.1. Summer Period

As for the summer period, the month of July was analyzed as the hottest summer month. The data on a daily basis as well as a monthly basis are shown and discussed (see Figure 21 and Figure 22).
Figure 21 shows the monitored temperatures of the green wall for the hottest summer day. The hottest summer day was 8 July 2023, when the recorded outdoor temperature at 1:30 p.m. was 33.02 °C and the daily mean outdoor temperature was 26.37 °C. When the external ambient temperatures and solar radiation are high during the day, the temperature in front of the green wall is lower by up to 5.3 °C. At the same time, the temperature behind the green wall is lower by up to 4.7 °C. Those results demonstrate how the green wall has the ability to reduce the exterior surface temperature of the wall during the day and increase it at night. However, the differences at night are smaller (up to 0.7 °C) compared to the differences during the day, when the solar radiation is high. The thermal difference between the reference wall and the green wall is also evident during the afternoon when variations of up to 5.7 °C can be reached between the temperature of the bare wall and the temperature behind the green wall.
Figure 22 shows the cooling effect of the green wall on a cloudy day, 31 July. The results are similar to the sunny day (Figure 21) but with smaller temperature differences. During the day, the reference wall has the highest temperature values. On the contrary, the surface behind the green wall has the lowest temperature values. The differences are up to 1.4 °C. The surface behind the green wall also has lower temperatures compared to the frontal side of the green wall, and those differences are up to 0.9 °C. During the night, the reference wall cools down quickly, and its temperature is the lowest (cca 15 °C). On the other hand, the space behind the green wall retains the temperature, and it does not drop below 17 °C.
Figure 23 shows the temperature differences in front of and behind the green wall for the whole month of July. Recorded air temperatures during the month of July in the hottest part of the day (1:30 p.m.) were: the highest, 33.02 °C on the 8th of July, and the lowest, 18.01 °C on the 25th of July. During the entire month, the daily minimum, maximum, and average temperatures behind the green wall (T3) were significantly lower compared to the temperatures in front of it (T1), showing a cooling effect of the green wall. As shown in Figure 23, the difference between the minimum and maximum temperature values in front of the green wall is in the range of 2.4 °C–12.3 °C. Daily temperature fluctuations behind the green wall are in the range of 2.8 °C–5.2 °C. The installation of a green wall helps to prevent significant temperature fluctuations. This structure also prevents the occurrence of high temperatures on the exterior surface of the building.

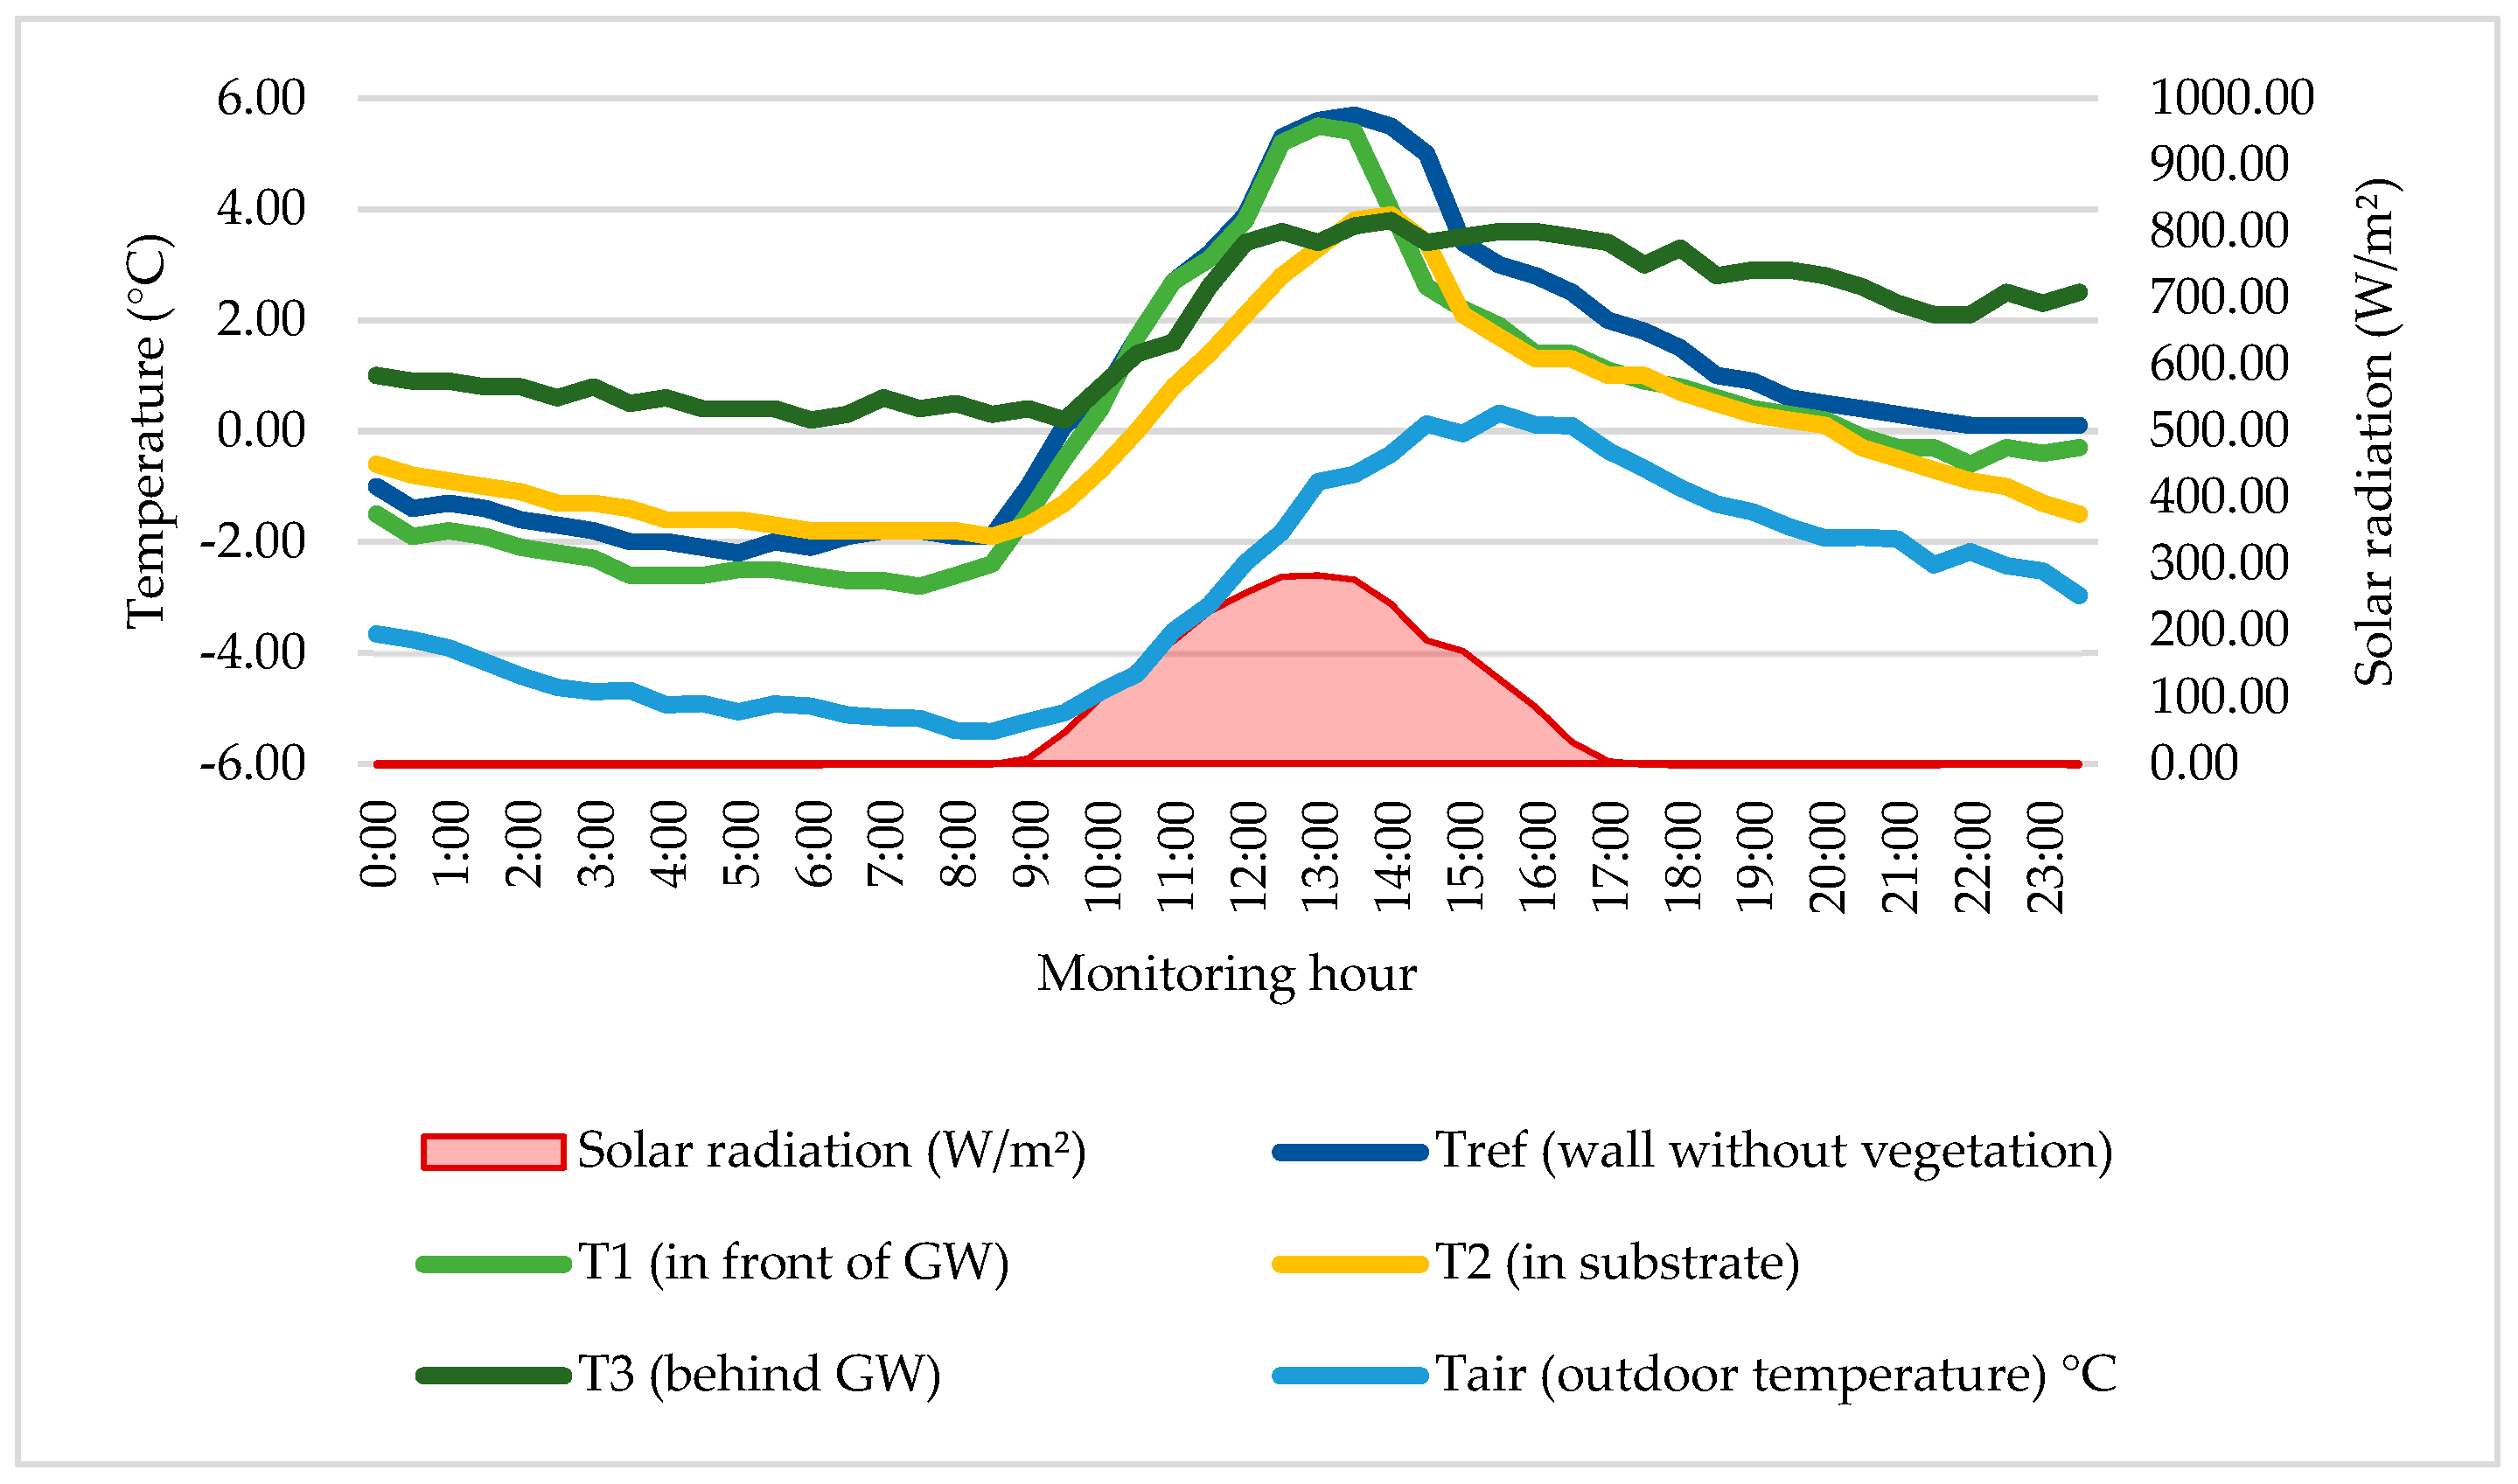
3.1.2. Winter Period

Regarding the winter period, the data on a monthly and daily basis were analyzed (Figure 24 and Figure 25). Temperature differences between the green wall, reference wall, and ambient air temperature for the whole month of January are analyzed, as well as temperature differences between day and night on a daily basis. The coldest day in the month of January was the 10th, so the data for this day is shown.
Figure 24 shows temperature values on the coldest winter day with high values of solar radiation. As can be seen, the temperature behind the green wall is higher during the night and morning hours up to 3.3 °C compared to the reference wall, which shows the insulating effects that this structure has during the winter period. In the hottest part of the day, the temperature is the highest in front of the green wall, due to the influence of solar radiation and the albedo (the surface of the geotextile layer without vegetation during the winter is black), compared with the light gray bare wall.
Solar radiation affects the increase in temperature of the reference wall and the frontal side of the green wall. On average, those surfaces stayed warmer than the wall behind the green wall for five hours during the day in January. During the day, from 10:30 until 3:00 p.m., when the solar radiation is the highest, the reference wall is warmer than the surface behind the green wall. The reference wall, warmed by solar radiation in the middle of the day, cools quicker in the evening and its temperature fell to its lower figure between 5:00 and 6:00 a.m. in the morning, resulting in an average diurnal temperature fluctuation of 6.5 °C in January. The temperature behind the green wall stayed within a range of 2.2 °C on average during the 24 h.
Figure 25 shows the temperature values on a cloudy winter day (2 January). The situation is different compared to a sunny day. During a day without high solar radiation, the space behind the green wall has the highest temperature values. It is up to 0.7 °C warmer than the reference wall and 1.0 °C warmer than the frontal side of the green wall. Even though there is not as much vegetation as there is during the summer, this modular structure has its insulating effects during the winter.
Figure 26 shows the daily minimum and maximum temperatures of the surface in front of and behind the green wall. Diurnal temperature fluctuations in front of the green wall are in a range of 1.4–11.6 °C. On the contrary, those fluctuations in the gap behind the green wall are in the range of 0.5–6.6 °C. The minimum temperature of T1 is −2.8 °C and the minimum temperature of T3 is 0.2 °C. The gap behind the green wall has positive temperature values during the entire winter period.

3.2. Simulation Results

The limitation of green wall monitoring was the lack of data on indoor surfaces and operative temperature, so software simulation was used to show and analyze those parameters. DesignBuilder simulations were used to show the impact of the green wall on the indoor temperature and energy use in a residential case study building. These parameters are quantified and discussed both for the summer period as well as for the winter (heating) period on the same dates as the experiment was performed.

3.2.1. Summer Period

The simulation of indoor operative temperature was performed for the living room with the kitchen on the first floor, which is located behind the green wall. Figure 27 shows the indoor operative temperature in this room with and without a green wall on the hottest summer day (8 July). The simulation results showed that the green wall has a significant effect on the indoor temperature, especially in the summer. It decreased by up to 3.5 °C, during the hottest day.
In summer, significant cooling effects occur due to the reduced solar gain from vegetation on the green wall. The effectiveness of the green wall in reducing indoor temperature is directly related to the thermal effects of plants on the facade. The green wall shading effects and, consequently, the surface temperature reduction are the main advantages during the summer season.

3.2.2. Winter Period

Figure 28 shows the temperature differences in the living room on the coldest winter day (10 January). The indoor operative temperature was increased by up to 1.3 °C during the coldest winter day, which shows the insulating effects of the modular green wall.
Figure 29 shows the monthly energy consumption for heating the house with and without the green wall. The total average annual energy consumption for heating in the analyzed zone (from January until April and from October until December) was 1930.00 kWh. After installing the green wall, the energy consumption decreased to 1814.00 kWh. Energy consumption is reduced by 6%.

4. Discussion

These results are in line with observations in the literature. Drops in temperature between 0.8 and 4.8 °C are observed at different distances from the active living wall and the cooling process was more efficient, according to the experiment in the Mediterranean climate of southern Spain [36]. In the research on green wall thermal effects [37], the authors examined whether the green wall impacts the interior temperature of the building during summer and winter. This research showed that during hot summer days, a cooling effect of 2–4 °C was observed. On the other hand, during cold winter days, the opposite effect was observed: the temperatures did not drop by much but provided an insulating effect 2–3 °C higher than for the control area.
The cooling potential from both VGS (facades and walls) is significant and those systems save energy for cooling in summer, in Mediterranean continental climatic conditions. The green wall system provided the highest cooling performance. It achieved savings of 58.9%, while the green facade presents a reduction of 33.8%, compared to the reference cubicle (internal temperature was 24 °C). The green wall cubicle, which is evergreen and opaque, showed a reduction in energy use during the heating period. That fact could be explained by their night radiative protection (insulation effect) supplied by vertical polyethylene modules that are filled with substrate [38].
The research of Arenghi et al. (2021) showed that the Mur Vegetal (a typical green wall by Patrick Blanc) has an influence on a reduction in peak temperatures of between 4 and 8 °C during the summer, and the Heavy System (green wall with a consistent substrate thickness) increased the operative temperature by about 1 and 2 °C during the winter [26].
The research of Raji et al. [39] shows that the maximum efficiency of vertical greenery systems was observed in the summer period. This is especially visible in areas with hotter summers and more sunny days with high solar radiation. In winter conditions, VGS can also reduce energy consumption for heating. Adding a layer of insulation can improve the energy performance of a building in areas with moderately mild winters.
The unique contribution of this research paper, by quantifying both the measured and simulated thermal performance of an innovative modular green wall system, is reflected primarily in the fact that this green structure has not been investigated for the purpose of increasing the thermal performance of residential buildings so far. The features that make this modular structure innovative are its modularity, material efficiency, and the way it integrates with building design. It is important to point out that this system can improve thermal performance in urban environments and contribute to sustainability goals, as the results showed.
Unlike other vertical greening systems, the Total Value Wall has a specific substrate that consists of 50% lava, 25% organic soil, and 25% biochar. The plants contain species that have the ability to purify polluting particles from gray water and air, without additional filters, which makes this green wall unique. All the plant species also have large leaf surfaces that contribute to increasing the process of evapotranspiration and, therefore, increase the relative humidity of the air, and absorb more solar radiation, which prevents the penetration of heat into the interior of the building.
The similarities of other VGS and TVW systems can be summarized in the following facts:
  • Both systems belong to the group of modular green walls with the aim of faster and easier installation on the building envelope.
  • Both systems consist of a substrate and different types of plants that can thrive vertically.
  • In both cases, the building envelope is upgraded with an additional insulating layer.
On the other hand, the important differences between other VGS and TVW as an innovative modular green wall are:
  • The TVW structure (substrate and plants) focuses on removing contaminants such as bacteria, heavy metals, and organic pollutants.
  • A higher LAI (leaf area index) on the TVW allows this system to affect a greater absorption of solar radiation and thus enables passive cooling of the building.
  • The water treatment system (TVW) uses materials that are resistant to corrosion and biofouling, which may not be a priority in other VGS applications, so this modular green wall has more functions and allows for achieving more effects in terms of energy, environment, and other aspects at the same time.

5. Conclusions

This research analyzed the impact of the specific green wall named Total Value Wall (TVW) on the thermal performance of a single-family house. Similar research confirmed that the green structure has cooling effects in summer and insulating effects in winter, which consequently impacts the energy savings for heating in areas with a moderate climate. The green wall represents a layer of insulation on the envelope of the building and affects its energy performance by preventing excessive heating during the summer when the air temperatures are high and helping the interior of the building cool down more slowly during the winter period.
This research was conducted on an example of a single-family house in Ghent, which is classified as a Cfb area (mild, moderately warm climate) according to the Köppen and Geiger classification.
The monitoring results during the summer showed the thermal contribution of the green wall in avoiding overheating and demonstrated how the application of the green wall could contribute to reducing the cooling load and consequently reducing energy demands for cooling in buildings. The data confirm that the green wall cools the air by decreasing temperatures, an effect that occurs because of the transpiration of the foliage and shading. Plants are known to absorb heat and emit water droplets into the atmosphere, which helps with cooling during hot periods, as the analysis of this data showed.
The influence of the green wall on heat retention, i.e., prevention of too rapid cooling of the house during the winter period, is also visible. The green wall reduced the influence of the outdoor climate by providing insulating effects during the winter season. It kept the temperature behind it higher than the reference wall and the surface in front of it for the majority of the winter period.
The simulation results showed that the green wall has a significant effect on the indoor operative temperature in the living room, especially in the summer. It increased by an average of 1.4 °C in winter and decreased by an average of 3.5 °C in summer. Software simulation also showed that 6% of energy consumption for heating during the winter can be saved on an annual basis if a green wall is installed on the southwest facade of the house, as demonstrated in this case study in Ghent. These results could be further investigated from the aspect of heat gain and heat loss through walls, which could be significantly reduced during summer and winter periods by covering the facade with the green wall. In addition, if energy consumption is reduced, greenhouse gas emissions are also reduced.
The implementation of green walls on buildings is a suitable passive method that leads to the replacement of reduced urban green spaces. It also reduces the effect of the urban heat island (UHI) and improves the energy performance of buildings. Green walls could help reduce the indoor temperature, create thermal insulation, and regulate humidity. Due to the shading and evaporative cooling effects, green walls have reduced energy consumption in the building compared to buildings without green walls.
This paper deals only with the energy aspect, not the economic one, so for further research, it would be interesting to include a cost-benefit analysis of the specific green wall. The energy savings should be compared to the initial investment and operational costs to analyze the economic profitability of the initial investment and the full effect of the implementation of this system.
It is also important to note that for this monitoring campaign, only three sensors within the green wall were used. This runs the risk of errors and local effects, so in future research, this needs to be improved.

Author Contributions

Conceptualization, M.R., A.V. and H.B.; methodology, M.R.; software, M.R.; validation, M.R. and H.B.; formal analysis, M.R.; investigation, M.R. and A.V.; resources, A.V. and H.B.; data curation, M.R., A.V. and H.B.; writing—original draft preparation, M.R.; writing—review and editing, A.V. and H.B.; visualization, M.R.; supervision, A.V. and H.B.; project administration, M.R., A.V. and H.B.; funding acquisition, A.V. and H.B. All authors have read and agreed to the published version of the manuscript.

Funding

This research received no external funding.

Data Availability Statement

The data that support the findings of this study are available from the corresponding author upon reasonable request.

Acknowledgments

This work was conducted in collaboration with Teun Depreeuw, CEO and founder of the Muurtuin company, who designed and built the TVW on a residential building in Ghent and provided the authors with access to the monitoring data on the Crodeon platform. Data on the TVW project is available on the web platform: https://www.totalvaluewall.com/en/ (accessed on 20 February 2024). Muurtuin is a Flemish SME known for its high-end systems supply for non-land-related green facades (i.e., living wall systems). More about the company and projects is available here: https://www.muurtuin.be/projecten (accessed on 12 February 2024). The software simulation process would not be possible without all the data on the house dimensions and materials. Design documentation, Energy performance certificate, additional works on insulation, and all the information about the occupancy and energy consumption were provided by the house owner, to whom we would also like to express our gratitude.

Conflicts of Interest

The authors declare no conflicts of interest.

Abbreviations

The following abbreviations are used in this manuscript:
VGS Vertical greenery systems
UGIUrban green infrastructure
UHI Urban heat islands
GWGreen wall
TVW Total Value Wall
PETPhysiological Equivalent Temperature
CO2 Carbon dioxide
HVACHeating, ventilation, and air conditioning
PVC Polyvinyl chloride
GCSGreen coating systems
GBS Green barrier systems
LAILeaf area index
RMI Royal Meteorological Institute of Belgium
EPC Energy performance certificate
BIMBuilding information modeling

Nomenclature

U-value Coefficient of thermal transmittance (W/m²K)
g-value Transmittance of solar gain through glazing and windows
ppmParts per million
TTemperature
W/(m-K)Conductivity
J/(kg-K)Specific heat

References

  1. Marschütz, B.; Bremer, S.; Runhaar, H.; Hegger, D.; Mees, H.; Vervoort, J.; Wardekker, A. Local narratives of change as an entry point for building urban climate resilience. Clim. Risk Manag. 2020, 28, 2020. [Google Scholar] [CrossRef]
  2. Pearlmutter, D.; O’Brien, L.; Krajter-Ostoic, S.; Sanesi, G.; del Amo, A. The Urban Forest: Cultivating Green Infrastructure for People and the Environment; Springer: Berlin/Heidelberg, Germany, 2017. [Google Scholar] [CrossRef]
  3. Memon, R.A.; Leung, D.Y.; Chunho, L. A review on the generation, determination and mitigation of urban heat island. J. Environ. Sci. 2008, 20, 120–128. [Google Scholar] [CrossRef] [PubMed]
  4. Robine, J.M.; Cheung, S.L.; Le Roy, S.; Van Oyen, H.; Griffiths, C.; Michel, J.P.; Herrmann, F.R. Death toll exceeded 70,000 in Europe during the summer of 2003. C. R. Biol. 2008, 331, 171–178. [Google Scholar] [CrossRef] [PubMed]
  5. Gabriel, K.M.A.; Endlicher, W.R. Urban and rural mortality rates during heat waves in Berlin and Brandenburg, Germany. Environ. Pollut. 2011, 159, 2044–2050. [Google Scholar] [CrossRef]
  6. Ottelé, M.; Perini, K.; Fraaij, A.L.A.; Haas, E.M.; Raiteri, R. Comparative life cycle analysis for green façades and living wall systems. Energy Build. 2011, 43, 3419–3429. [Google Scholar] [CrossRef]
  7. Perini, K.; Rosasco, P. Cost-benefit analysis for green façades and living wall systems. Build. Environ. 2013, 70, 110–121. [Google Scholar] [CrossRef]
  8. Available online: https://greentexx.com/en/blog/the-cool-towns-project-solutions-to-adapt-to-climate-change (accessed on 9 April 2024).
  9. European Environment Agency. Available online: https://www.eea.europa.eu/en/topics/in-depth/extreme-weather-floods-droughts-and-heatwaves (accessed on 9 April 2024).
  10. Top, S.; Milošević, D.; Caluwaerts, S.; Hamdi, R.; Savić, S. Intra-urban differences of outdoor thermal comfort in Ghent on seasonal level and during record-breaking 2019 heat wave. Build. Environ. 2020, 185, 107103. [Google Scholar] [CrossRef]
  11. Schröpfer, T.; Menz, S. Dense and Green Building Typologies: Design Perspectives; Springer Briefs in Architectural Design and Technology; Springer: Singapore, 2019. [Google Scholar] [CrossRef]
  12. Strobl, H.; Cachola Schmal, P.; Scheuermann, R. (Eds.) Einfach Grün—Greening the City; Deutsches Architekturmuseum (DAM): Frankfurt, Germany, 2021. [Google Scholar]
  13. VanderGoot, J. Architecture and the Forest Aesthetic: A New Look at Design and Resilient Urbanism; Routledge: London, UK, 2018. [Google Scholar] [CrossRef]
  14. Ngo, H.N.D.; Motoasca, E.; Versele, A.; Pham, H.C.; Breesch, H. Effect of neighbourhood courtyard design on the outdoor thermal comfort in a tropical city. IOP Conf. Ser. Earth Environ. Sci. 2022, 1078, 012035. [Google Scholar] [CrossRef]
  15. Manso, M.; Castro-Gomes, J. Green wall systems: A review of their characteristics. Renew. Sustain. Energy Rev. 2015, 41, 863–871. [Google Scholar] [CrossRef]
  16. Avgan, G.; Ashrafian, T. Bioclimatic Design and Advanced Strategies’ Impacts on Energy Performance of Residential Buildings. In Proceedings of the Clima 2022, Rotterdam, The Netherlands, 22–25 May 2022. [Google Scholar]
  17. Zhong, W.; Schroeder, T.; Bekkering, J. Designing with nature: Advancing three-dimensional green spaces in architecture through frameworks for biophilic design and sustainability. Front. Archit. Res. 2023, 12, 732–753. [Google Scholar] [CrossRef]
  18. Bustami, R.; Belusko, M.; Ward, J.; Beecham, S. Vertical greenery systems: A systematic review of research trends. Build. Environ. 2018, 146, 226–237. [Google Scholar] [CrossRef]
  19. Alexandri, E.; Jones, P. Temperature decreases in an urban canyon due to green walls and green roofs in diverse climates. Build. Environ. 2008, 43, 480–493. [Google Scholar] [CrossRef]
  20. Maas, J.; Verheij, R.A.; Groenewegen, P.P.; De Vries, S.; Spreeuwenberg, P. Green space, urbanity, and health: How strong is the relation? J. Epidemiol. Community Health 2006, 60, 587–592. [Google Scholar] [CrossRef] [PubMed]
  21. López-Rodríguez, G.; Pérez-Esteban, J.; Ruiz-Fernández, J.; Masaguer, A. Behavior and evolution of sustainable organic substrates in a vertical garden. Ecol. Eng. 2016, 63, 129–134. [Google Scholar] [CrossRef]
  22. Dahanayake, K.C.; Chow, C.L. Comparing reduction of building cooling load through green roofs and green walls by EnergyPlus simulations. In Building Simulation; Springer: Berlin/Heidelberg, Germany, 2018. [Google Scholar]
  23. Djedjig, R.; Bozonnet, E.; Belarbi, R. Modeling green wall interactions with street canyons for building energy simulation in urban context. Urban Clim. 2016, 16, 75–85. [Google Scholar] [CrossRef]
  24. Poddar, S.; Park, D.Y.; Chang, S. Simulation Based Analysis on the Energy Conservation Effect of Green Wall Installation for Different Building Types in a Campus. In Proceedings of the 8th International Conference on Sustainability in Energy and Buildings, SEB-16, Turin, Italy, 11–13 September 2016. [Google Scholar]
  25. Wang, W.; Zhou, X.; Wu, S.; Zhao, M.; Jin, Z.; Bei, K.; Zheng, X.; Fan, C. Vertical Green Wall Systems for Rainwater and Sewage Treatment. Sustainability. 2024, 16, 7593. [Google Scholar] [CrossRef]
  26. Arenghi, A.; Perra, C.; Caffi, M. Simulating and Comparing Different Vertical Greenery Systems Grouped into Categories Using EnergyPlus. Appl. Sci. 2021, 11, 4802. [Google Scholar] [CrossRef]
  27. Available online: https://www.meteo.be/resources/climatology/climateCity/pdf/climate_INS44021_9120_nl.pdf (accessed on 10 April 2024).
  28. Goossens, C.; Van Gorp, A. The myth of the phoenix: Progressive education, migration and the shaping of the welfare state, 1985–2015. Paedagog. Hist. 2016, 52, 467–484. [Google Scholar] [CrossRef]
  29. Oosterlynck, S.; Debruyne, P. Going beyond physical urban planning interventions: Fostering social innovation through urban renewal in Brugse Poort, Ghent. In The International Handbook on Social Innovation; Moulaert, F., MacCallum, D., Mehmood, A., Hamdouch, A., Eds.; Elgar: Cheltenham, UK, 2013; pp. 230–241. [Google Scholar]
  30. MOCCA (MOnitoring the City’s Climate and Atmosphere) Project. Available online: https://observatory.ugent.be/index_eng.html (accessed on 15 May 2024).
  31. Available online: https://www.totalvaluewall.com/en/ (accessed on 15 May 2024).
  32. Lakho, H.; Fida, J.V.; Khan, H.I.; Depuydt, V.; Depreeuw, T.; Van Hulle, S.; Rousseau, D. Total value wall: Full scale demonstration of a green wall for grey water treatment and recycling. J. Environ. Manag. 2021, 298, 113489. [Google Scholar] [CrossRef]
  33. Available online: https://www.crodeon.com/blogs/news/crodeon-measures-air-quality-and-insulating-performance-for-total-value-wall (accessed on 15 May 2024).
  34. Karimi, K.; Farrokhzad, M.; Roshan, G.; Aghdasi, M. Evaluation of effects of a green wall as a sustainable approach on reducing energy use in temperate and humid areas. Energy Build. 2022, 262, 112014. [Google Scholar] [CrossRef]
  35. Daemei, A.; Jamali, A. Experimental and simulation study on thermal effects and energy efficiency of a green wall in the humid condition of Rasht. J. Energy Manag. Technol. (JEMT) 2022, 6, 15–21. [Google Scholar] [CrossRef]
  36. Pérez-Urrestarazu, L.; Fernández-Cañero, R.; Franco, A.; Egea, G. Influence of an active living wall on indoor temperature and humidity conditions. Ecol. Eng. 2016, 90, 120–124. [Google Scholar] [CrossRef]
  37. Gouws, S.; Gouws, M. Thermally regulated green living wall. South Afr. J. Chem. 2022, 76, 91–96. [Google Scholar] [CrossRef]
  38. Coma, J.; Pérez, G.; de Gracia, A.; Burés, S.; Urrestarazu, M.; Cabeza, L. Vertical greenery systems for energy savings in buildings: A comparative study between green walls and green facades. Build. Environ. 2017, 111, 228–237. [Google Scholar] [CrossRef]
  39. Raji, B.; Tenpierik, M.; Dobbelsteen, A. The impact of greening systems on building energy performance: A literature review. Renew. Sustain. Energy Rev. 2015, 45, 610–623. [Google Scholar] [CrossRef]
Figure 1. Vertical greenery system classification [18].
Energies 17 05267 g001
Figure 2. Ghent’s Urban Heat Island map with the case study location [27].
Energies 17 05267 g002
Figure 3. Floor plans of the house.
Energies 17 05267 g003
Figure 4. House before green wall installation (Revit 3D model).
Energies 17 05267 g004
Figure 5. House after green wall installation (Revit 3D model).
Energies 17 05267 g005
Figure 6. 3D model of the modular green wall.
Energies 17 05267 g006
Figure 7. House before the TVW installation [31].
Energies 17 05267 g007
Figure 8. House during the TVW installation [31].
Energies 17 05267 g008
Figure 9. The TVW installation process [31].
Energies 17 05267 g009
Figure 10. House after the TVW installation [31].
Energies 17 05267 g010
Figure 11. Crodeon Reporter and weather station location on the green wall [33].
Energies 17 05267 g011
Figure 12. Sensor positions on the facade.
Energies 17 05267 g012
Figure 13. Reference weather station location in Ghent Campus (Google Maps).
Energies 17 05267 g013
Figure 14. Weather station on building E in Ghent Campus.
Energies 17 05267 g014
Figure 15. Weather station on building E in Ghent Campus.
Energies 17 05267 g015
Figure 16. Daily mean values of climatic parameters in January 2024.
Energies 17 05267 g016
Figure 17. Daily mean values of climatic parameters in July 2023.
Energies 17 05267 g017
Figure 18. Daily mean values of global horizontal solar radiation for winter and summer periods.
Energies 17 05267 g018
Figure 19. Measured and modeled exterior wall temperature values of a facade with the green wall (winter day).
Energies 17 05267 g019
Figure 20. Measured and modeled exterior wall temperature values of a facade with the green wall (summer day).
Energies 17 05267 g020
Figure 21. Temperature values on the hottest summer day (8 July).
Energies 17 05267 g021
Figure 22. Temperature values on a cloudy summer day (31 July).
Energies 17 05267 g022
Figure 23. The cooling effects of the green wall in July (daily min/max of T1 and T3, see Figure 12).
Energies 17 05267 g023
Figure 24. Temperature values on the coldest winter day (10 January).
Energies 17 05267 g024
Figure 25. Temperature values on a cloudy winter day (2 January).
Energies 17 05267 g025
Figure 26. The insulating effects of the green wall in January (daily min/max of T1 and T3, see Figure 12).
Energies 17 05267 g026
Figure 27. Indoor operative temperature in the living room with and without green wall (8 July).
Energies 17 05267 g027
Figure 28. Indoor operative temperature in the living room with and without green wall (10 January).
Energies 17 05267 g028
Figure 29. Monthly energy consumption for house heating (kWh).
Energies 17 05267 g029
Table 1. Thermal properties of building constructions.
Type/Position of Wall/OpeningSpecification/MaterialCoefficient of Thermal Transmittance U-Value (W/m²K)
Brick walls (NW, SW, SE)225 mm solid brick2.1
Brick + EPS (NE)EPS 032 (100 mm)0.3
Main entrance door (ground floor)Wood/glass3.0
Garage door (ground floor)Metal1.0
Courtyard door (ground floor)Wood/glass3.0
Courtyard window (ground floor)Wood/1-glass4.8 (g-value 0.7)
Living room window (1st floor)Sun-resistant glass0.5 (g-value 0.4)
Kitchen windows (1st floor)Wood/2-glass1.2 (g-value 0.5)
Skylights (2nd floor)Velux skylights 2-glass1.0 (g-value 0.5)
Table 2. Technical specifications of the sensors of the monitoring equipment (the accuracies are provided by the manufacturer).
Sensor TypeAccuracyRemarks
TemperatureDS18B20+/− 0.5 °C from −10 °C to +80 °C
DS18B20+/− 0.5 °C from −10 °C to +80 °C
CO2Sensirion SCD30+/− (30 ppm + 3% of the measured value)Range 0–40,000 ppm
Wind speedCrodeon weather stationWind speeds are calculated linearly from the average and the maximum speeds recorded during the measurement interval set by the user
PrecipitationPhysical tipping bucket sensor and a measurement area of 96 mm diameter±7%One tilt represents 400 mL of rain per square meter
Table 3. Technical specifications of the sensors of the referent weather station (the accuracies are provided by the manufacturer).
Sensor TypeAccuracyRemarks
Air temperaturePt1000 RTD Class F0.1 IEC 60751±0.3 °C at +20 °Cin radiation shield
Relative humidityVaisala INTERCAP±3%in radiation shield
Solar radiationCMP10 Pyranometer<±7 W/m² at 200 W/m2
Wind speedUltrasonic anemometer 2D±0.1 m/s rms (5 m/s)
±2% rms (5 … 85 m/s)
Resolution 0.1 m/s
PrecipitationPrecipitation transmitter (tipping bucket)±1% of measuring rangeResolution 0.1 mm
Table 4. Substrate properties and plant parameters of the green wall model.
ParameterValueReference
SubstrateThickness0.1 mmanufacturer
Density710.00 kg/m3manufacturer
Conductivity1.65 W/(m-K)[26]
Specific heat1225.00 J/(kg-K)[26]
VegetationHeight of plants0.25 mmanufacturer
LAI (leaf area index)5.0 (summer), 2.0 (winter)[22]
Leaf emissivity0.95[34]
Leaf reflectivity0.22[35]
Specific heat2232.00 J/(kg-K)[26]
Conductivity0.35 W/(m-K)[26]
Disclaimer/Publisher’s Note: The statements, opinions and data contained in all publications are solely those of the individual author(s) and contributor(s) and not of MDPI and/or the editor(s). MDPI and/or the editor(s) disclaim responsibility for any injury to people or property resulting from any ideas, methods, instructions or products referred to in the content.

