Article

Development of Operating Strategies for Return Fan in HVAC System Considering Differential Pressure

1
ENERGYX, Seoul 06128, Republic of Korea
2
R&D Center, BETECH, Daegu 41228, Republic of Korea
3
Architecture Research Institute, Yeungnam University, Gyeongsan 38541, Republic of Korea
4
School of Architecture, Yeungnam University, Gyeongsan 38541, Republic of Korea
*
Author to whom correspondence should be addressed.
Energies 2024, 17(21), 5289; https://doi.org/10.3390/en17215289
Submission received: 20 September 2024 / Revised: 10 October 2024 / Accepted: 16 October 2024 / Published: 24 October 2024
(This article belongs to the Section G: Energy and Buildings)

Abstract

:
The pressure difference in buildings causes indoor and outdoor airflow, significantly impacting the indoor thermal environment and building energy consumption due to the introduction of outdoor air. The pressure difference in buildings is highly variable, influenced by outdoor wind speed, indoor–outdoor temperature differences, and heating, ventilating and air conditioning (HVAC) system operation, making it difficult to consider this factor during general HVAC system operation, potentially leading to an imbalance in indoor and outdoor pressure differences. Therefore, this study proposes an appropriate operation strategy for HVAC system return fans considering indoor–outdoor pressure differences. The proposed strategy involves adjusting the return fan airflow to maintain a constant indoor airflow balance, thereby controlling the indoor–outdoor pressure difference, satisfying the indoor thermal environment, and reducing HVAC system energy consumption. To evaluate the proposed strategy, dynamic simulations using TRNSYS and TRNFLOW were utilized, targeting one floor of an office building equipped with a variable air volume (VAV) system. The evaluation results showed that the maximum pressure difference decreased from −142 Pa to −18 Pa compared to the existing strategy, and the total energy consumption of the HVAC system was reduced by 29%, highlighting the importance of considering pressure differences during HVAC system operation.

1. Introduction

The United Nations Environment Programme (UNEP) reported that approximately 38% of global greenhouse gas emissions were from buildings as of 2019 [1,2]. According to the U.S. Department of Energy (DOE), about 52% of building energy consumption is used for heating, cooling, and ventilation, emphasizing the importance of improving building energy efficiency [3]. Heating, ventilation, and air conditioning (HVAC) systems play a critical role in maintaining thermal comfort and indoor air quality, and they are a major factor in building energy consumption. Variable air volume (VAV) systems in HVAC systems are known to be effective in regulating airflow based on load variations to maintain a constant indoor temperature. In HVAC systems, the VAV damper position is adjusted based on the deviation between the indoor air temperature and the supply temperature, and the supply fan speed is controlled by signals to maintain the setpoint of the static pressure sensor installed in the duct [4]. At this time, the ventilation fan is typically controlled through a variable frequency drive (VFD) with a built-in PID controller to match the speed of the supply fan, ensuring the static pressure in the duct is maintained [5]. This operational strategy may not pose issues in single-story buildings where the stack effect is minimal, but in high-rise buildings where the stack effect is significant, pressure issues due to ventilation imbalances can arise. The pressure difference acting on the building envelope equals the sum of pressure differences caused by external airflow, stack effect, and HVAC system operation, as shown in Equation (1) [6]. Figure 1 illustrates the concept of building pressure difference, influenced by major factors and the total pressure difference in buildings. The arrow represents the force of air pushing.
Δ P T o t a l = Δ P S + Δ P W + Δ P V
Airtightness refers to the degree to which the building envelope resists airflow due to pressure differences [7]. Buildings with poor airtightness experience heat loss due to infiltration, consuming more energy to maintain indoor temperatures [8]. Generally, buildings with high airtightness can prevent unintended airflow, introducing only the required amount of outdoor air for proper ventilation, resulting in less heat loss and lower energy consumption compared to buildings with poor airtightness. Air enters through gaps in the building envelope, where the size and shape of the gaps are not uniform, preventing the development of turbulent airflow. Infiltration through the building envelope not only increases energy consumption but also causes issues in indoor thermal comfort, air quality, moisture diffusion leading to condensation, difficulty in door operation, and noise due to indoor airflow, causing overall operational problems in buildings. To mitigate infiltration, strategies to improve building airtightness are actively discussed [9]. Strategies to enhance airtightness are broadly categorized into architectural and mechanical approaches. Architectural strategies include strengthening the airtightness of the building envelope, adding partitions in spaces where pressure differences occur, installing revolving doors, and setting up airlock vestibules. These strategies need to be considered from the design and construction stages, as they involve measuring and reinforcing the airtightness of the building envelope and doors, making them difficult to apply to already operational buildings. Therefore, mechanical strategies like maintaining positive indoor pressure through HVAC systems should be considered to reduce infiltration impacts. The American Society of Heating, Refrigerating and Air-Conditioning Engineers (ASHRAE) suggests maintaining buildings at a positive pressure (1–20 Pa) through HVAC systems to reduce infiltration. The pressure difference in buildings is influenced by outdoor airflow, indoor–outdoor temperature differences, and HVAC system operation, with the amount of airflow proportional to the pressure difference.
If pressure difference changes are not considered during HVAC system operation, significant infiltration may occur, causing issues in indoor thermal comfort and energy consumption, necessitating research on HVAC system operation strategies that maintain positive indoor pressure. B Zheng [10] developed a virtual flow meter to measure the airflow required to maintain building pressure and applied volumetric tracking control, adjusting return fan speed to maintain a constant difference between supply and return airflow. The proposed control strategy reduced return fan speed, increased the indoor–outdoor pressure difference, and decreased return fan energy consumption. M Liu [11] developed a VSD volumetric track (VSDVT) strategy using VAV system fan variable speed drive (VSD) signals to control supply and return airflow. Simulations comparing the VSDVT strategy with the fan tracking (FT) strategy showed that the VSDVT strategy could maintain consistent outdoor and building pressure differences, reducing annual supply fan energy by up to 30% and return fan energy by up to 50%. SA Mumma [12] proposed pressurizing buildings with dedicated outdoor air systems (DOASs), finding that the appropriate pressurization airflow for office spaces to meet ASHRAE Standard 62.1 indoor air quality criteria was 70% of the total return airflow. Coogan [13] identified factors affecting indoor pressure control and developed a mathematical model for pressure control in specialized buildings with very low airtightness, like laboratories. J Guo [14] proposed a strategy to control pressure by adjusting airflow in VAV systems depending on door operation between negative pressure wards and isolation rooms. The study used Modelica simulation to implement a single isolation room and a negative pressure isolation ward with three zones, reducing the pressure difference by 9.98–25.75% when applying the control strategy. However, the control strategy results varied, as the airtightness values were based on design criteria rather than actual measurements, and pressure differences due to wind pressure and stack effect were ignored. Wang G [15] compared a building pressure passive (BPP) strategy controlling building static pressure with an exhaust damper and a building pressure active (BPA) strategy controlling ventilation plenum static pressure with an exhaust damper using a nonlinear network solution. BPP control resulted in high return fan speeds and energy overconsumption at high ventilation plenum pressure setpoints, failing to control building pressure at low return duct pressure setpoints, while BPA control-maintained ventilation plenum static pressure setpoints, controlling building pressure with lower return fan energy consumption. Shi, S [16] developed a physical model predicting VAV system airflow and pressure distribution for optimal control of multizone pressure, evaluated using a Python-based simulation platform. Compared to traditional fan static pressure reset strategies, the physical model reduced fan energy consumption by 6.71% and total system energy consumption by 7.91%. The model maintained a maximum indoor pressure of 0.05 Pa and a maximum indoor temperature deviation of 0.25 °C, satisfying requirements for indoor thermal environment control in multizone VAV systems. However, the evaluation used simplified hourly variables for dynamic environments like outdoor temperature and indoor occupancy, assuming time-independent parameters, which may cause uncertainties in real-time changing building environments [17].
Most previous studies developed and evaluated pressure control strategies for buildings related to occupant safety, such as hospitals and laboratories. While pressure differences in office and residential buildings do not directly impact occupant safety like in hospitals and laboratories, they can affect indoor thermal comfort and energy consumption. Additionally, most previous studies focused on controlling pressure using HVAC system supply airflow, which is challenging to control simultaneously with pressure differences due to indoor thermal environment operation, and did not account for building pressure control considering return fan airflow.
This paper proposes an operational strategy for adjusting the airflow of the return fan in HVAC systems to maintain the indoor–outdoor pressure difference. The contributions of the paper are as follows:
  • It analyzes the issues caused by the lack of consideration for pressure differences in traditional HVAC operation strategies and proposes a new operation strategy that takes pressure differences into account.
  • The strategy controls the return fan, rather than the supply fan, to satisfy the requirements for the indoor thermal environment while simultaneously controlling the pressure difference.
The proposed operational strategy effectively controls the indoor–outdoor pressure difference by considering external wind pressure and stack effect, which are significant in high-rise buildings, and it significantly reduces energy consumption.
This study aims to propose an HVAC system operation strategy to maintain a certain level of pressure difference in buildings and demonstrate the importance of considering pressure differences by comparing it with an operation strategy that does not consider pressure differences. The study theoretically examines the relationship between building pressure difference and airflow and derives return fan settings to maintain an appropriate level of indoor–outdoor pressure difference. A 42-story office building with an HVAC system installed on each floor was selected as the target space to evaluate the proposed strategy. The study used dynamic energy simulation tools Transient System Simulation Tool 17 (TRNSYS 17) and airflow analysis software TRNFLOW developed at the Solar Energy Laboratory (SEL) of the University of Wisconsin-Madison to model the building and system, analyzing indoor thermal comfort, indoor–outdoor pressure difference, infiltration amount, and HVAC system energy consumption under different operation strategies.

2. Methodology

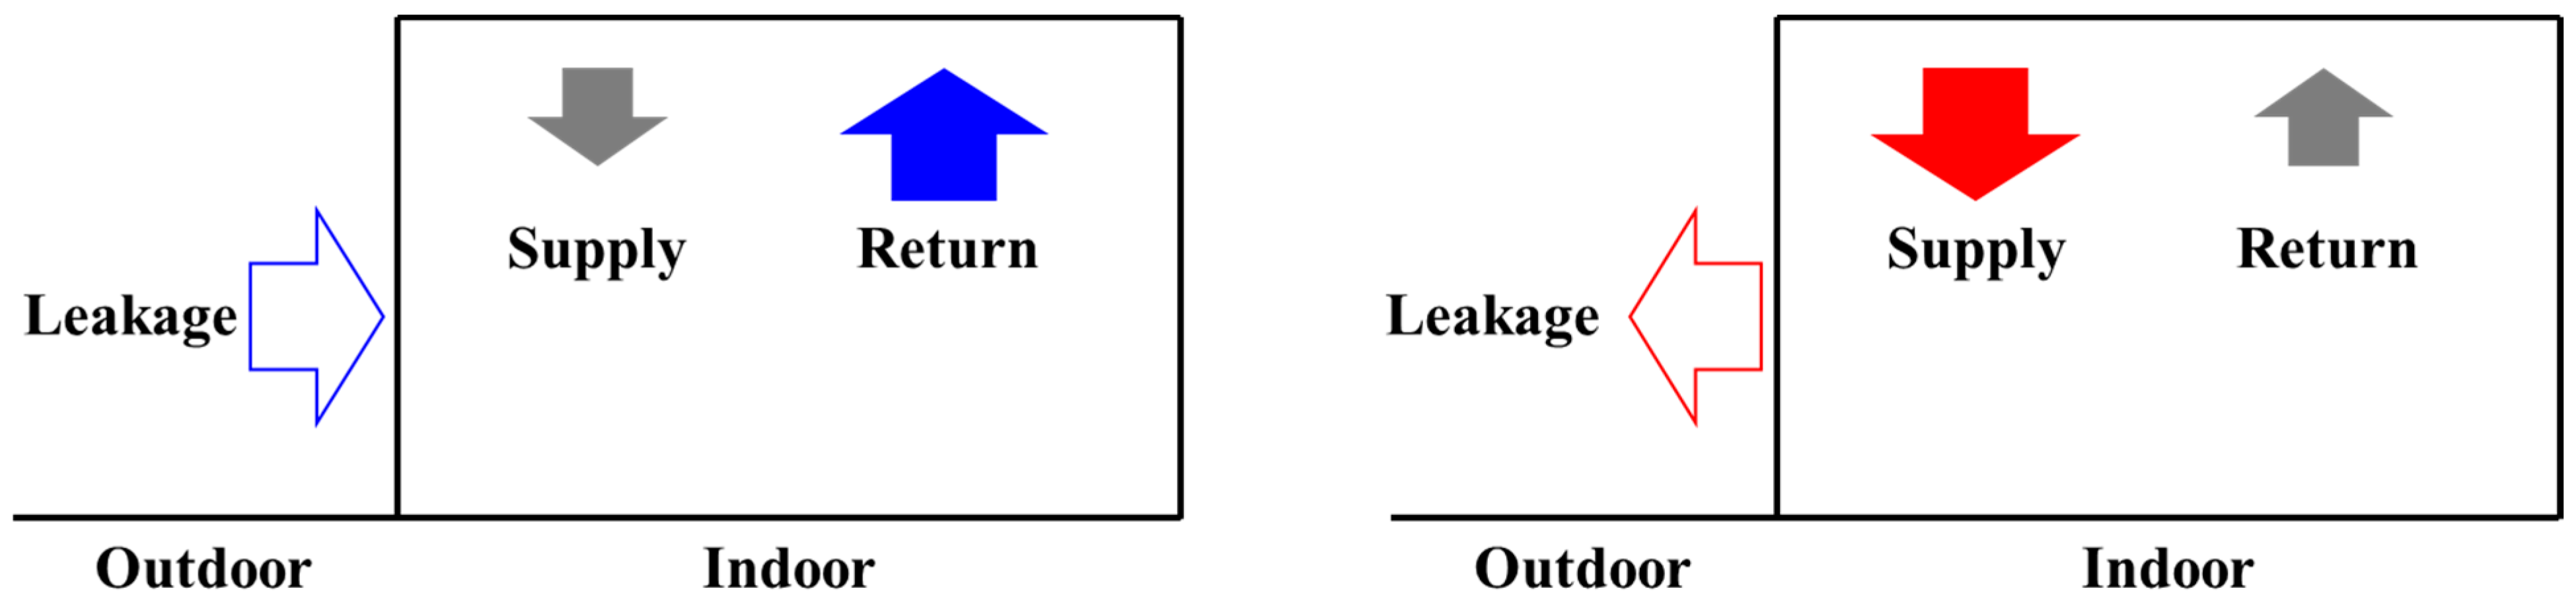
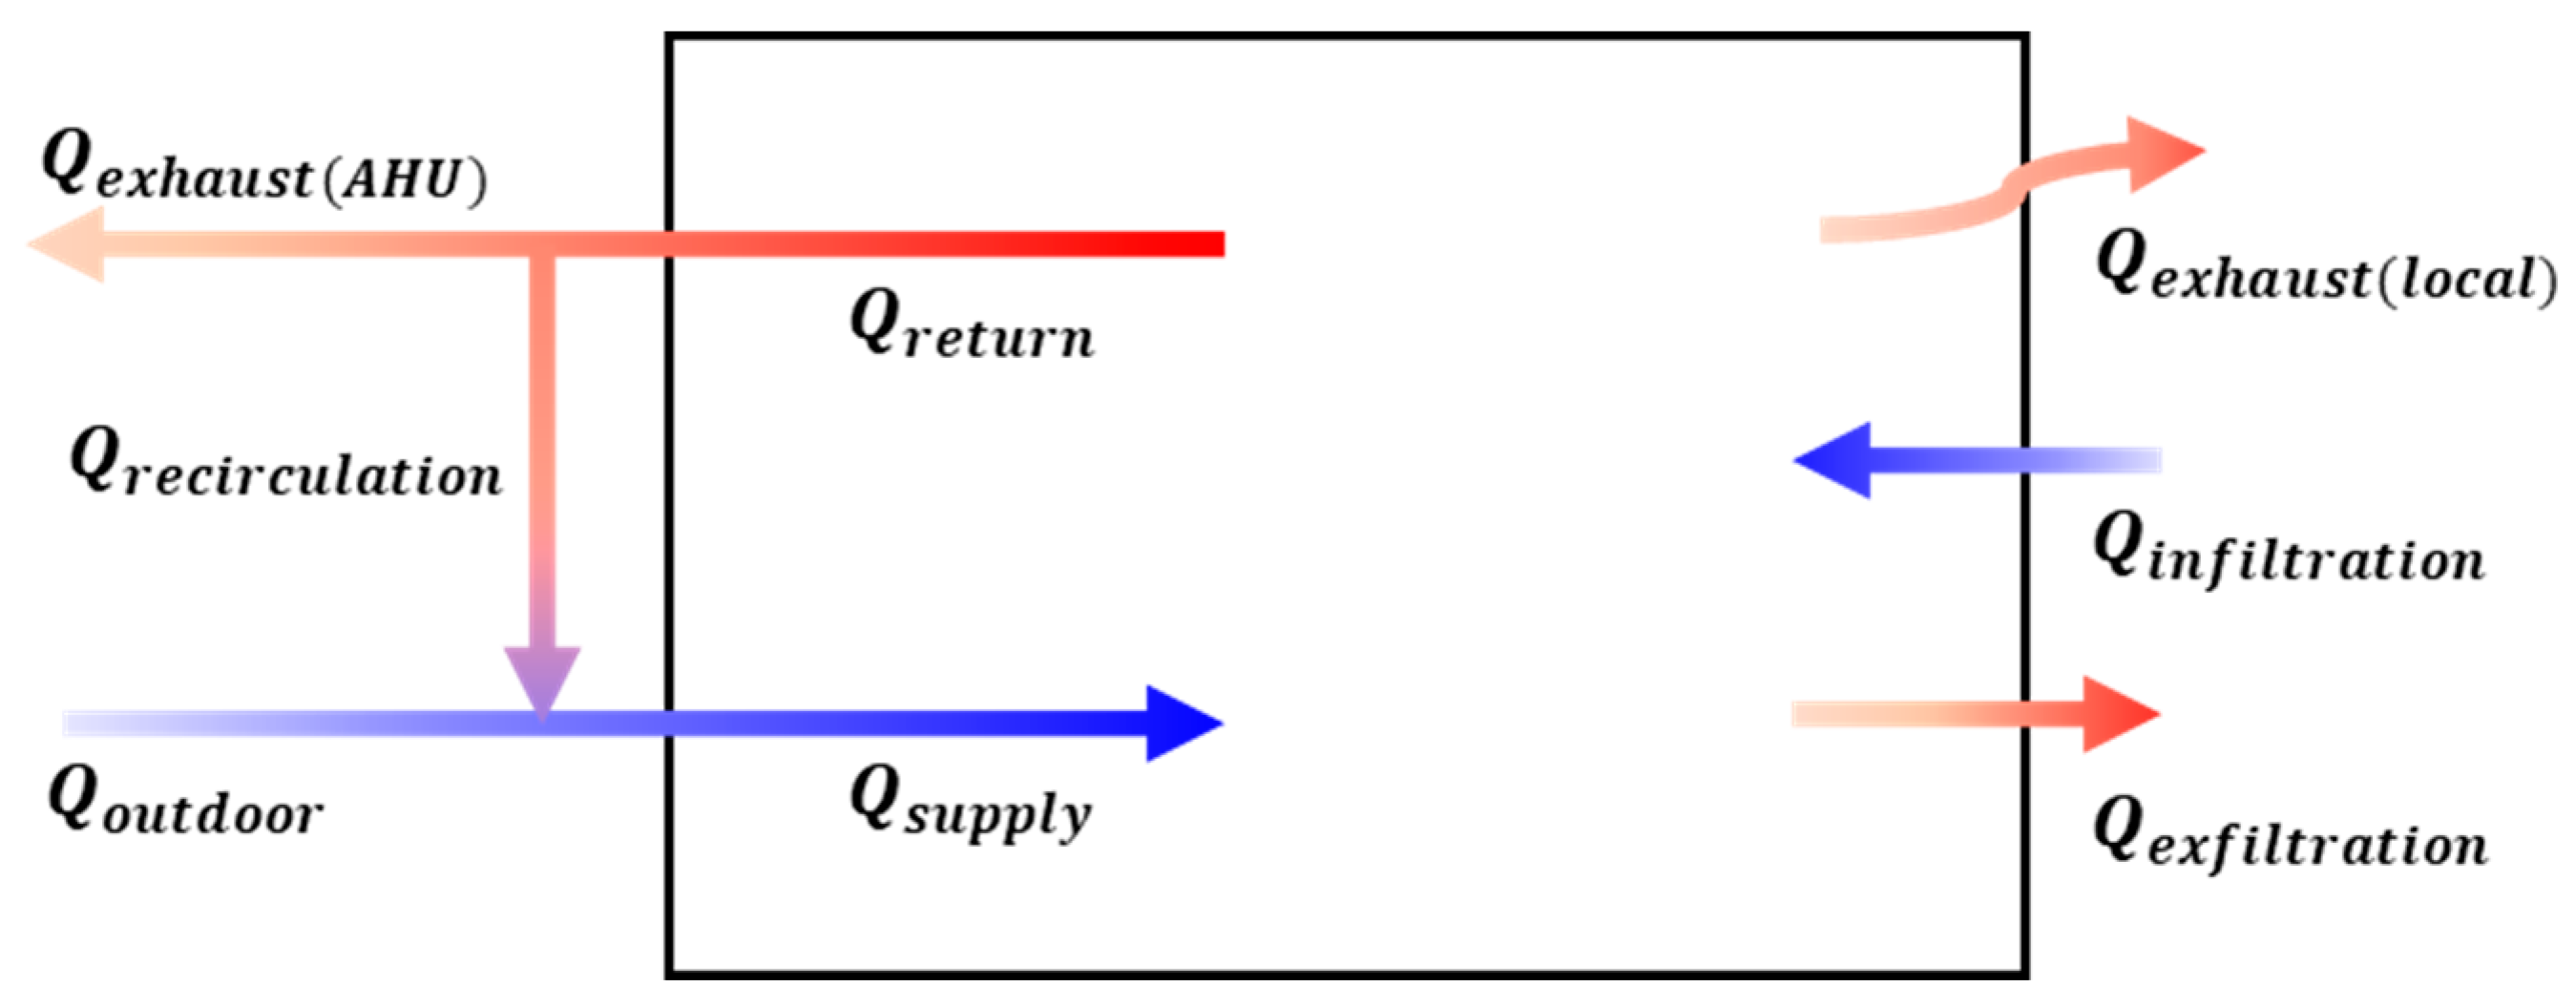
2.1. Pressure Control Using Return Fans

In the building operation phase, appropriate outdoor air is supplied through the HVAC system to satisfy requirements for indoor thermal comfort and air quality. During the process of supplying and exhausting air in the building, indoor–outdoor pressure differences occur, influenced by various factors such as building type and operation methods. Generally, if the supply airflow of the HVAC system is smaller than the return airflow, the indoor pressure is smaller than the outdoor pressure, allowing outdoor air to infiltrate. Conversely, if the supply airflow is greater than the return airflow, the indoor pressure is greater than the outdoor pressure, causing indoor air to exfiltrate. Improperly designed HVAC systems can create excessive pressure differences, leading to infiltration loads that impact indoor thermal environments and energy consumption, and outdoor particulate matter infiltrating, affecting indoor air quality. Figure 2 illustrates the concept of pressure difference caused by HVAC system operation. To maintain appropriate pressure under continuously changing pressure difference factors, building pressure control through the HVAC system is necessary. In VAV systems, return airflow can be adjusted to maintain building pressure within an appropriate range passively or actively.

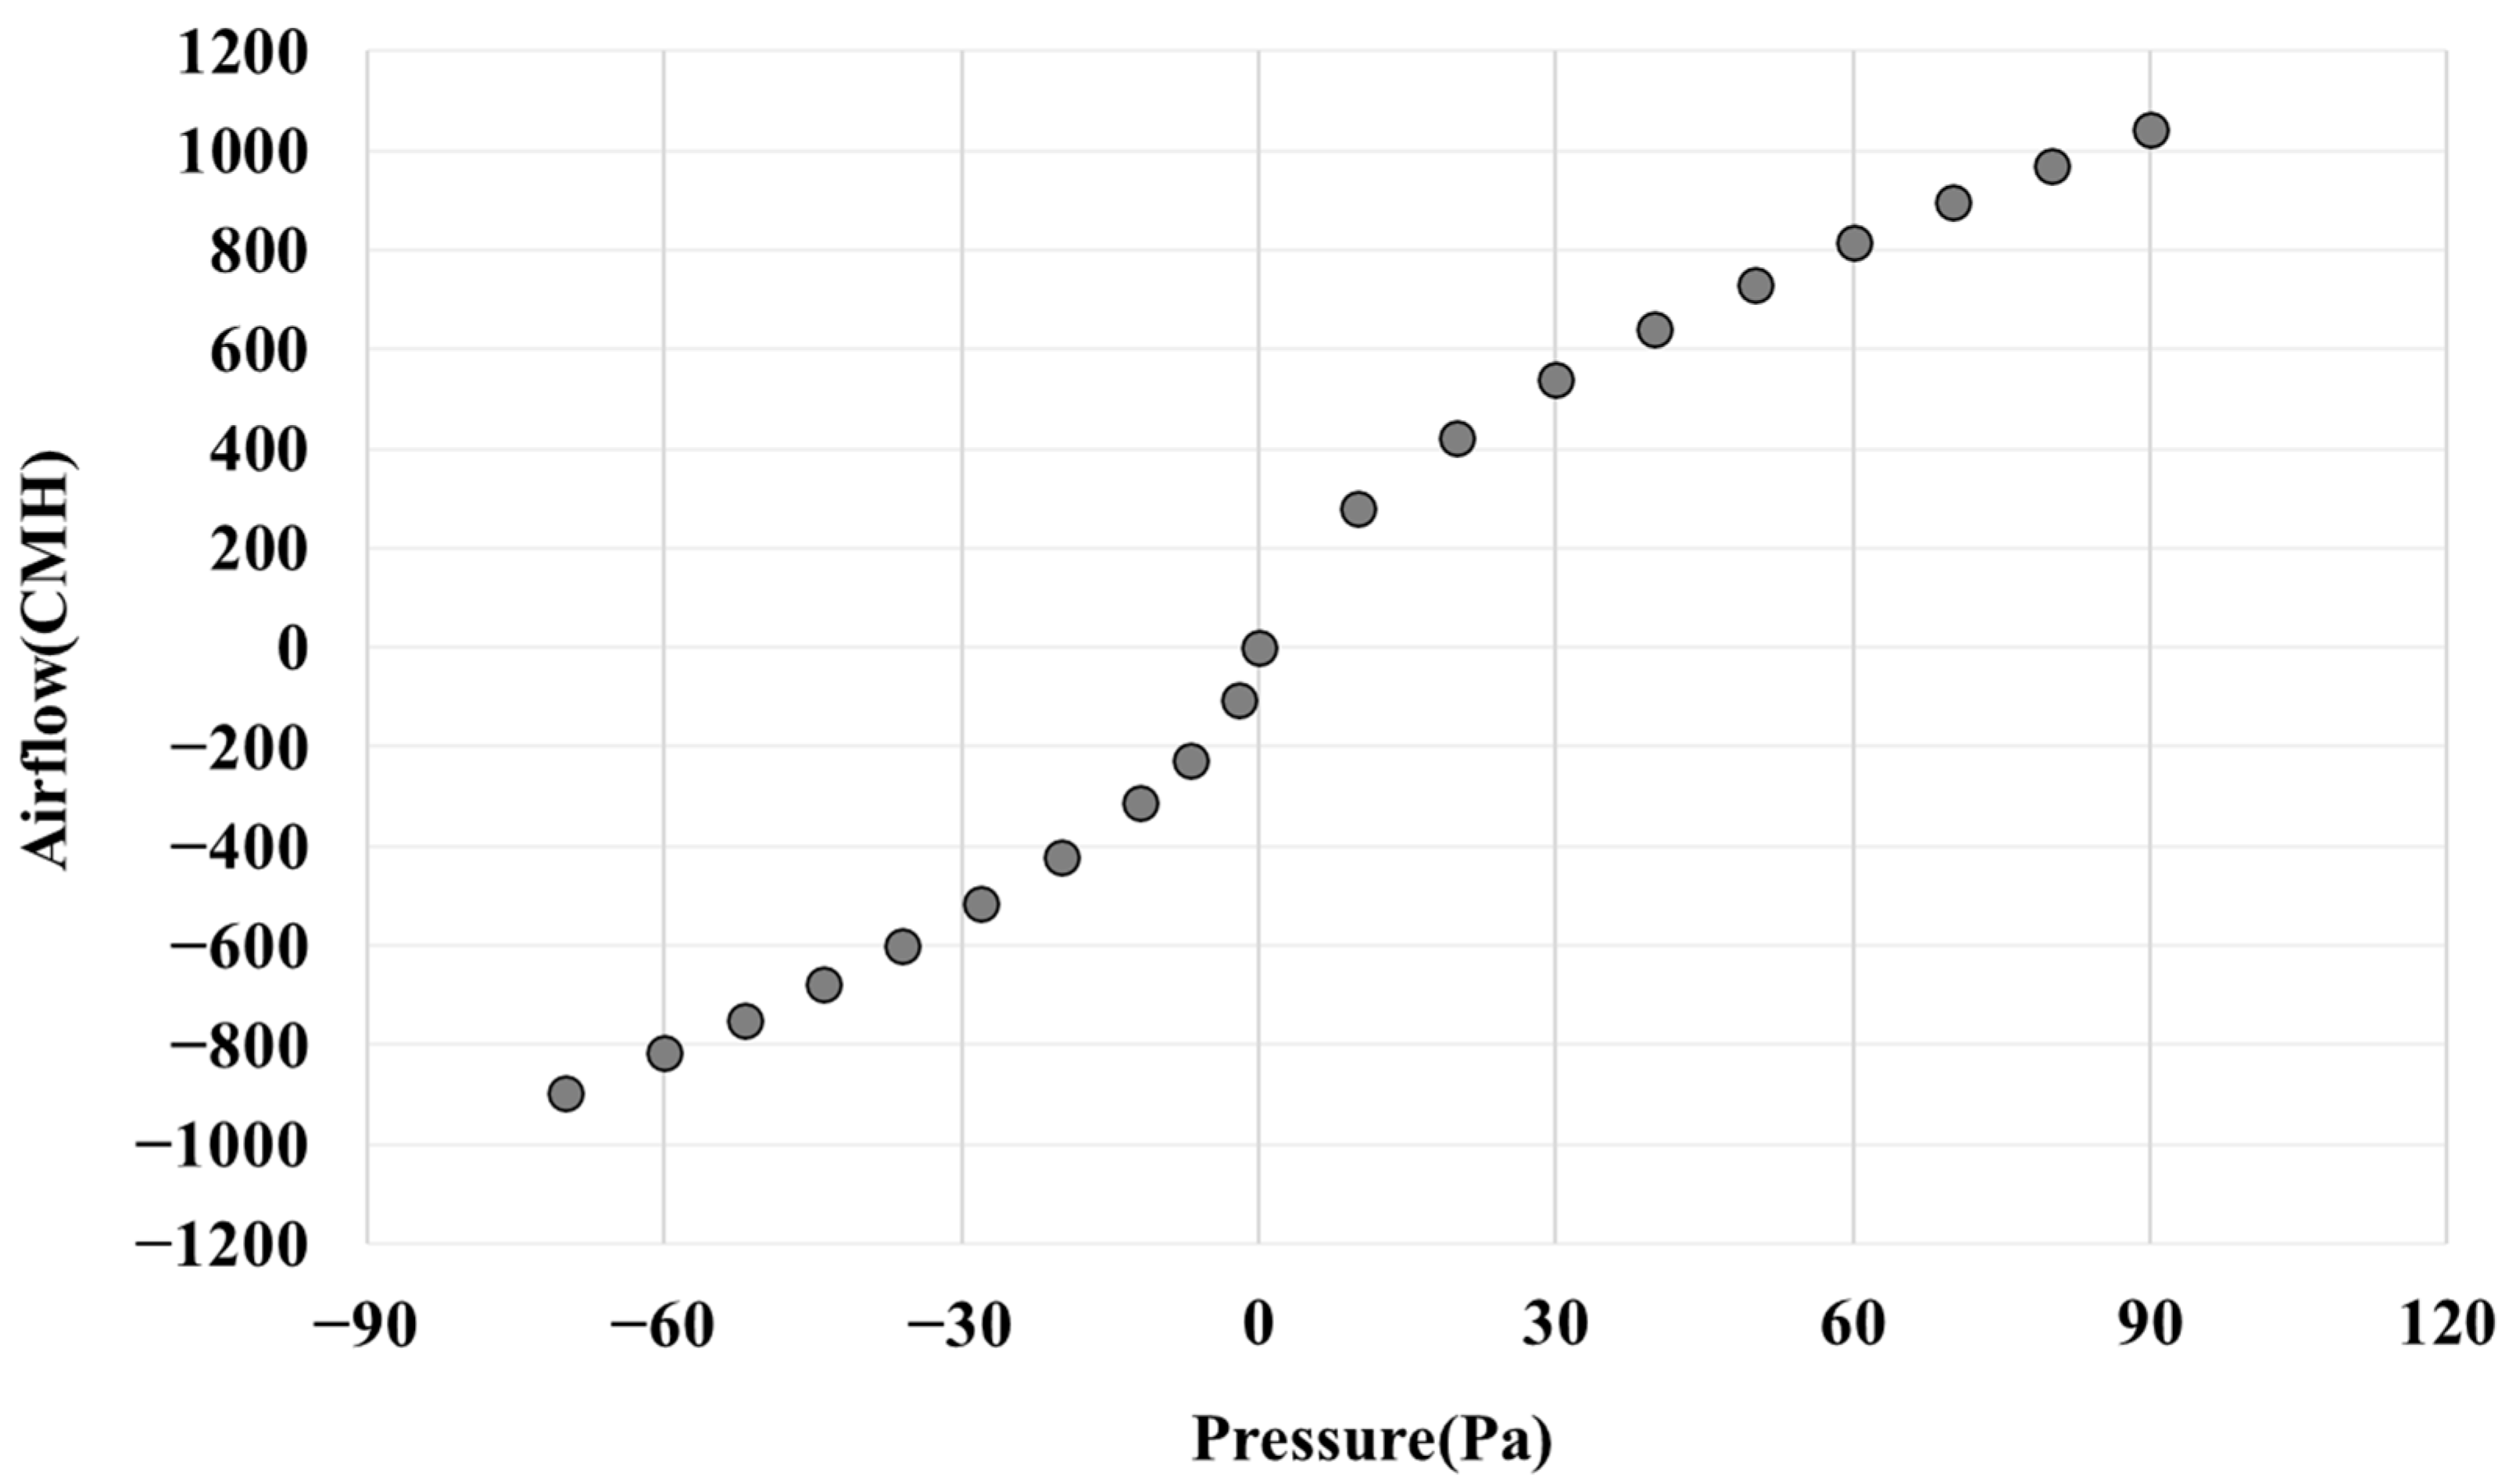
2.2. Relationship Between Airflow and Pressure Difference

Airtightness is an inherent building characteristic representing the relationship between airflow through the building envelope and pressure difference, expressed by the power law equation in Equation (2) [18]. Infiltration amount due to pressure difference is determined by the leakage coefficient ( C L ) and leakage exponent (n), which are fixed characteristics of the envelope, independent of outdoor conditions. The leakage exponent indicates the type of airflow through gaps, close to 1 for laminar flow and 0.5 for turbulent flow. The leakage exponent for typical concrete buildings ranges from 0.6 to 0.7 [19]. Assuming a leakage coefficient ( C L ) of 70 and a leakage exponent (n) of 0.6, the relationship between pressure difference and airflow is illustrated in Figure 3. When the indoor–outdoor pressure difference (ΔP) is 50 Pa, the infiltration amount is 732 CMH. Dividing this by the building volume gives the air changes per hour at 50 Pa pressure difference, known as ACH50, representing building airtightness.
Q = C L ( Δ P ) n
Equation (2) shows that airflow in buildings is determined by indoor–outdoor pressure difference, which is induced by external airflow, indoor–outdoor temperature differences, and HVAC system operation [20].

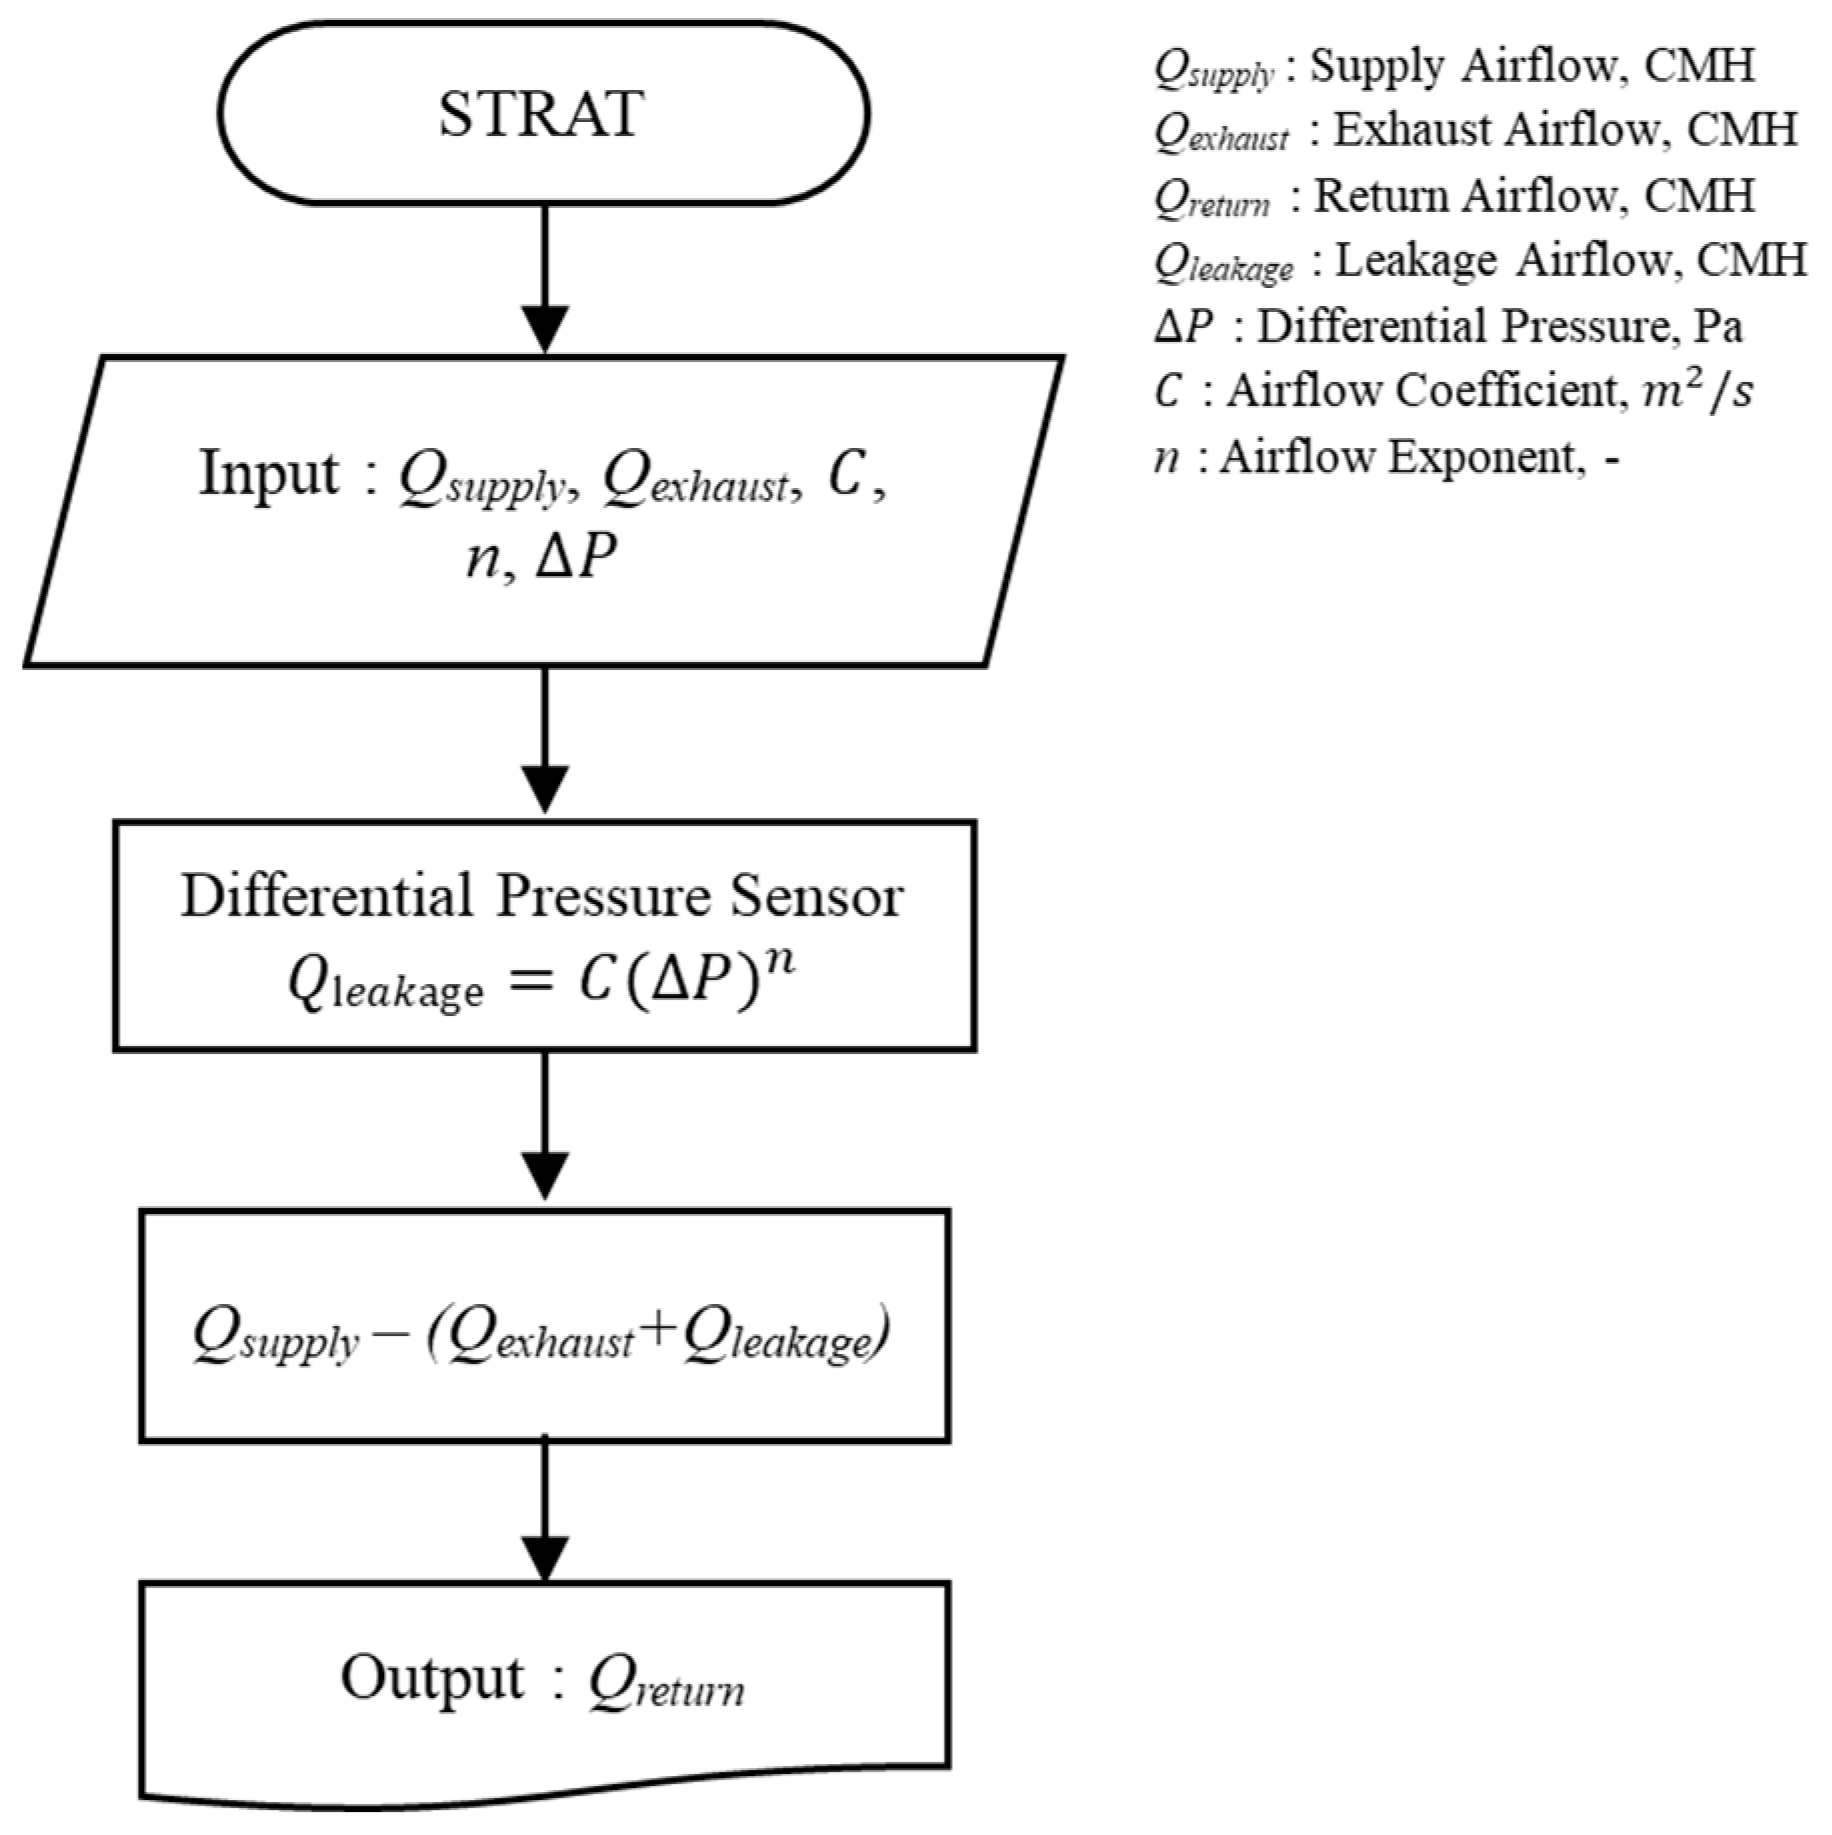
3. Return Fan Operation Strategy Considering Pressure Difference

Building pressure control through the HVAC system involves adjusting return fan speed to maintain indoor pressure higher than outdoor pressure based on monitored indoor–outdoor pressure differences. If indoor pressure is greater than outdoor pressure, return fan speed increases, and if indoor pressure is lower, fan speed decreases. When the return fan operates, return duct pressure (Pr) matches or exceeds supply duct pressure (Ps), reducing supply fan differential pressure, thereby decreasing supply fan speed or allowing smaller supply fan capacity. While exhaust fan systems do not operate during minimal outdoor air introduction periods like winter and summer, return fan systems always operate when the supply fan is in operation to maintain system pressure balance. Therefore, return fans have longer operating times compared to exhaust fans, resulting in higher operational costs and limited installation locations, as they need to be close to return ducts to respond to return duct pressure loss. Figure 4 shows a schematic and flow diagram of an HVAC system with return fans for building pressure control.
Building pressure differences can be maintained at positive pressure by adjusting HVAC system airflow, but general HVAC system operation does not consider pressure differences, leading to indoor air imbalance [21]. If indoor air imbalance persists, building pressure differences occur, causing increased indoor loads due to airflow through gaps and wasting heating and cooling energy to maintain indoor set temperatures [22]. Figure 5 illustrates ASHRAE’s building pressure model concept, showing potential airflow paths in buildings. According to the law of mass conservation, the sum of air inflow and outflow in a building is equal, expressed in Equation (3). This study proposes an HVAC system operation strategy to maintain appropriate positive indoor pressure by adjusting HVAC system airflow (Qsupply and Qreturn) to respond to continuously changing pressure differences induced by external airflow and indoor–outdoor temperature differences.
Q s u p p l y + Q i n f i l t r a t i o n = ( Q r e t u r n + Q e x h a u s t l o c a l ) + Q e x f i l t r a t i o n

4. Case Study

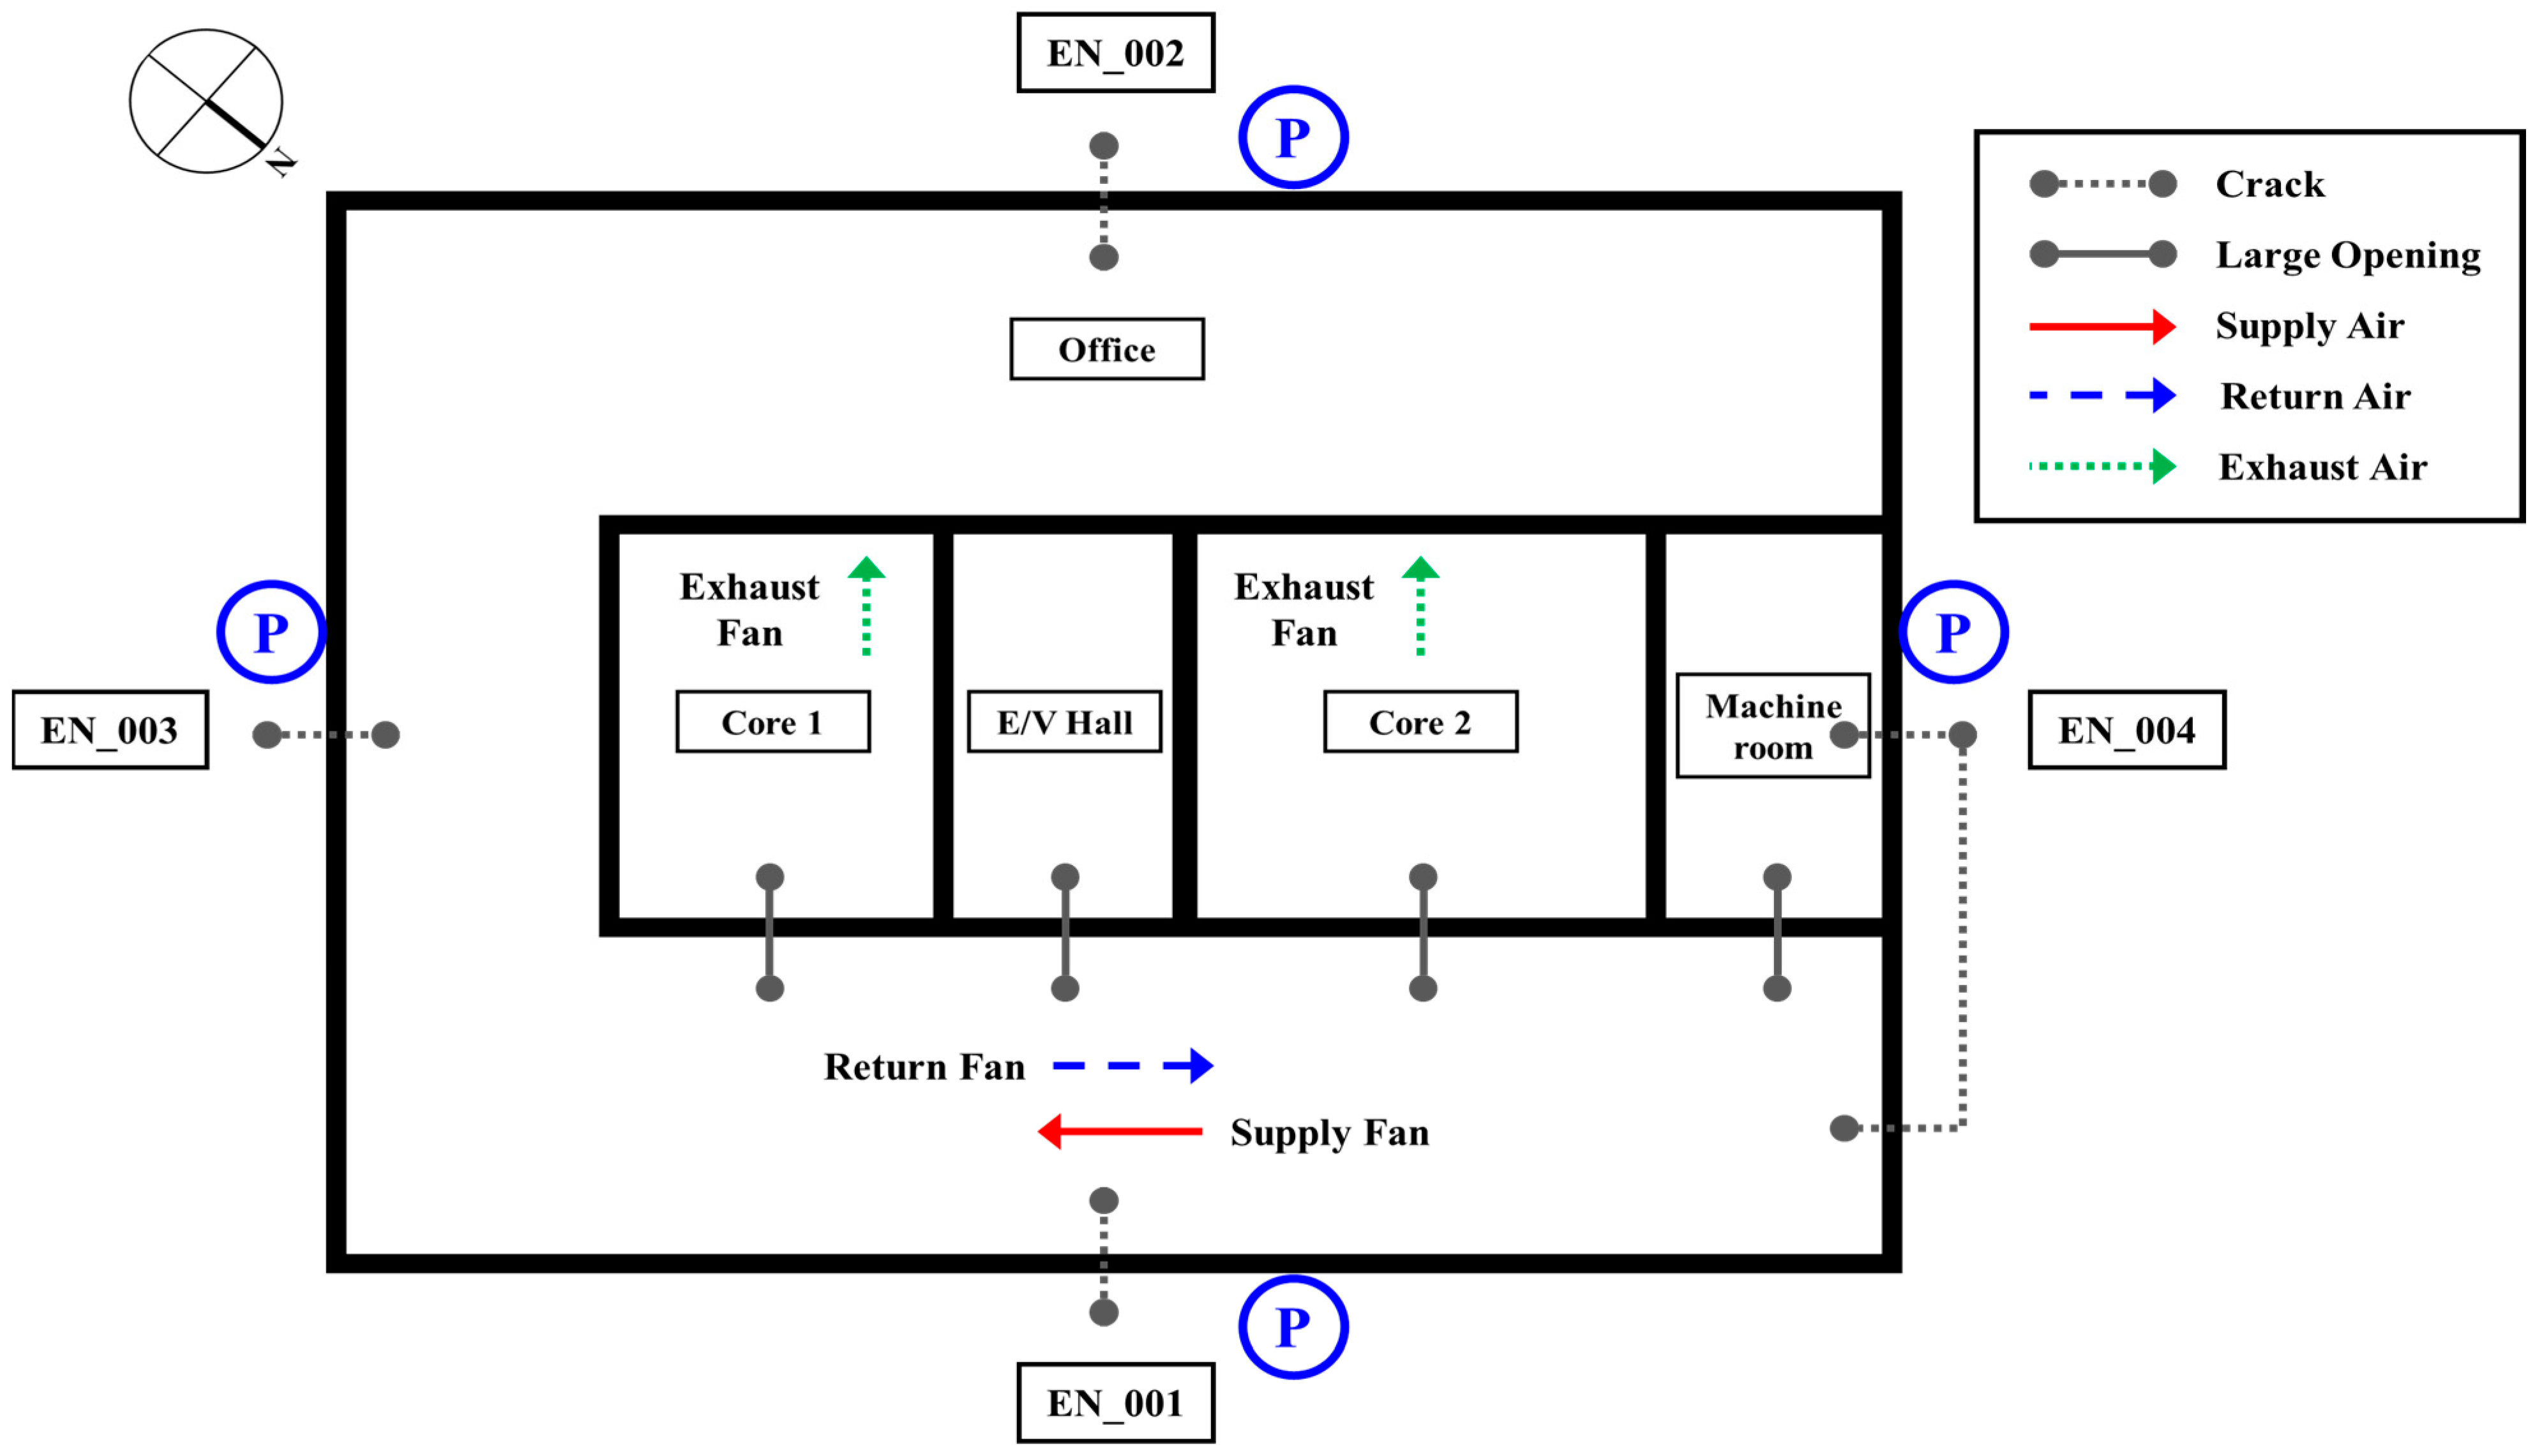
4.1. Overview of Target Building and System

The target building is a 42-story office building in Seoul, with a single-duct VAV system installed on each floor. The 10th floor was selected as a representative floor for evaluation among the 42 floors. The office space is a single zone without partitions and faces the exterior. Other areas like elevator shafts, restrooms, and HVAC rooms are located inside the office. The indoor set temperature is 24 °C, and the HVAC system operates 24 h a day. The occupancy is 275 people, with a metabolic heat load of 150 W/person for light office work in a seated position, according to ISO 7730 [23]. Outdoor data are based on Seoul’s standard weather data provided by the TRNSYS program. Table 1 shows the simulation conditions and material properties for the target space.
To propose and evaluate the HVAC system operation strategy considering building pressure differences, dynamic simulation software TRNSYS 17 was used. Building modeling was performed using Google SketchUp which is a 3D modeling software developed by Google, with detailed building information input into TRNBuild, building modeling software component of the TRNSYS. Airflow analysis was conducted using TRNFLOW, a simulation module linking Multizone Airflow Modeling(COMIS, Energy in Buildings and Communities Programme) and TRNSYS for airflow network modeling. Figure 6 shows the airflow network configuration for the target building. The target space is structured with a large office area surrounding the core, where P represents pressure sensors located at each orientation.

4.2. Existing Return Fan Operating Strategy

The existing HVAC system’s return fan operation measures airflow in supply and return ducts using flow meters, adjusting return fan speed to match supply airflow. Figure 7 shows the flowchart of the existing HVAC system operation with return fans.
Winter results for the existing return fan operation strategy are shown in Figure 8. Indoor–outdoor pressure differences of about 140 Pa occur, with infiltration amounts of about 10,200–10,400 CMH. Supply airflow operates to maintain the indoor thermal environment, and return airflow matches the supply airflow. Reducing return airflow to pressurize the HVAC system when infiltration occurs due to pressure differences decreases the overall building pressure difference. Therefore, an operation strategy that adjusts return fan airflow according to pressure differences is necessary.

4.3. Proposed Return Fan Operating Strategy for HVAC System

The proposed return fan operation strategy adjusts return fan airflow in response to real-time pressure differences. Implementing the proposed HVAC system operation strategy requires differential pressure sensors to monitor indoor–outdoor pressure differences. Differential pressure sensors should be installed in locations with minimal impact from rapid pressure changes, avoiding areas with significant airflow like doorways. Multiple sensors are used outdoors to offset wind pressure effects, using average values [24]. Building pressure differences are monitored on the four sides of the building envelope facing the exterior. Figure 9 shows indoor–outdoor pressure differences for each envelope side in winter, indicating varying pressure differences for each side. An HVAC system cannot address varying pressure differences for each side, so a reference pressure difference needs to be selected when applying the return fan operation strategy considering pressure differences. The average value of the pressure differences on the four sides maintains a consistent value, with less impact from momentary increases due to external airflow.
Figure 10 shows the flowchart of the proposed HVAC system return fan operation strategy. The proposed strategy applies the average monitored pressure differences to the leakage function to estimate infiltration amount and adjusts return airflow according to supply airflow to maintain a consistent positive pressure difference.
Simulation results obtained using the proposed return fan operation strategy in winter are shown in Figure 11. The return airflow of the HVAC system differs by 10,000–10,400 CMH from the supply airflow considering pressure differences, with a maximum pressure difference of 4 Pa and infiltration amounts of 0–280 CMH. The decrease in return airflow due to pressure differences reduced the pressure differences and infiltration amounts.

5. Results and Discussion

The traditional HVAC system operation method involves running the return fan at the same airflow rate as the supply fan. In contrast, the proposed HVAC system operation method in this study adjusts the return fan airflow based on the indoor–outdoor pressure differential, considering the building pressure difference. We compared and analyzed indoor thermal comfort, HVAC system airflow, pressure differential, infiltration amount, and energy consumption between the traditional and proposed HVAC system operation methods. Table 2 shows the simulation cases.
Figure 12 depicts the indoor thermal environment of Case 2. The annual indoor temperature ranges from 23.3 to 25.5°C, meeting the set indoor temperature target of 24°C ± 1°C, similarly to the traditional HVAC system operation method, and the humidity remains within 60%.
Figure 13 shows the supply and return airflow rates for Case 2. When the pressure differential is positive, the return airflow matches the supply airflow. When the pressure differential is negative, the return airflow changes according to the infiltration amount due to the pressure differential.
Figure 14 presents the average indoor–outdoor pressure differential for Case 1 and Case 2. The indoor–outdoor pressure differential for Case 1 ranges from −142 Pa to −5 Pa, while for Case 2, it ranges from −18 Pa to 17 Pa, showing a significant difference between the two control methods.
Figure 15 illustrates the airflow between the exterior walls and the interior, as well as the load caused by the airflow for Case 1 and Case 2. In this case, infiltration represents the total sum of the airflow occurring on all four sides of the building in contact with the outdoor air. For Case 1, the infiltration amount is proportional to the indoor–outdoor pressure differential, with a maximum infiltration amount of 10,593 CMH, a minimum of 1072 CMH, and an average of 6744 CMH. This indicates an average ventilation rate of 1.28 ACH (air changes per hour) due to the building envelope infiltration. For Case 2, the maximum infiltration amount is 2682 CMH, the minimum is −2557 CMH (exfiltration), and the average is 113 CMH, indicating an average ventilation rate of 0.22 ACH due to the building envelope infiltration. The average ventilation rate due to external infiltration decreased by 82.8%, from 1.28 ACH to 0.22 ACH. On the y-axis, negative values indicate heating loads due to infiltration, and positive values indicate cooling loads due to infiltration. For Case 1, the maximum heating load due to infiltration is 487.45 MJ/h, with an average of 128.26 MJ/h. For Case 2, the maximum heating load due to infiltration is 75.87 MJ/h, and the average load is −3.00 MJ/h, a reduction of approximately 98% compared to Case 1. The traditional HVAC system operation method (Case 1) resulted in significant heating energy consumption due to winter infiltration. However, the proposed method (Case 2) reduced the return airflow considering the infiltration amount due to the pressure differential, thereby reducing the infiltration amount and the load due to infiltration.
Figure 16 compares the annual HVAC energy consumption for different operation methods. The proposed return fan operation method adjusts the return airflow to maintain positive pressure and does not consider an economizer. The cooling coil energy consumption decreased by 164.6 GJ, a reduction of 16%. The energy consumption of the return fan decreased by 92.7 GJ, a reduction of 62%, due to reduced airflow. The supply fan consumed 25.1 GJ more energy under the proposed method than the traditional method, likely due to increased indoor loads from reduced infiltration, requiring more fan energy to provide the necessary airflow.
Figure 17 compares the annual reheat coil energy consumption for different operation methods. The traditional method resulted in reheat coil energy consumption of 1660 GJ, while the proposed method reduced it to 647 GJ, a reduction of 61%. This reduction is attributed to decreased indoor loads from reduced infiltration, reducing reheat energy consumption compared to the traditional method.
Figure 18 shows the annual total HVAC system energy consumption, including AHU system energy and reheat coil energy. Case 1’s energy consumption was 3124 GJ, while Case 2’s was 2217 GJ, a reduction of 29% compared to Case 1. This demonstrates the effectiveness of the proposed operation method in reducing energy consumption.

6. Conclusions

Infiltration due to building pressure differentials affects the indoor thermal environment and energy consumption. To reduce the impact of infiltration, the indoor pressure should be maintained positive relative to the outdoor pressure. This study proposed an HVAC system operation method that adjusts the return fan airflow based on the pressure differential to maintain positive pressure. The indoor thermal environment, pressure differential, infiltration amount, and energy consumption of the proposed operation method were evaluated using the dynamic simulation program TRNSYS 17 and the airflow analysis program TRNFLOW.
(1)
The proposed method uses the return fan to maintain positive pressure in the building by adjusting the return airflow according to the supply airflow and infiltration amount due to external conditions. The average pressure differential of the four building facades was used as the basis, considering wind pressure and stack effect.
(2)
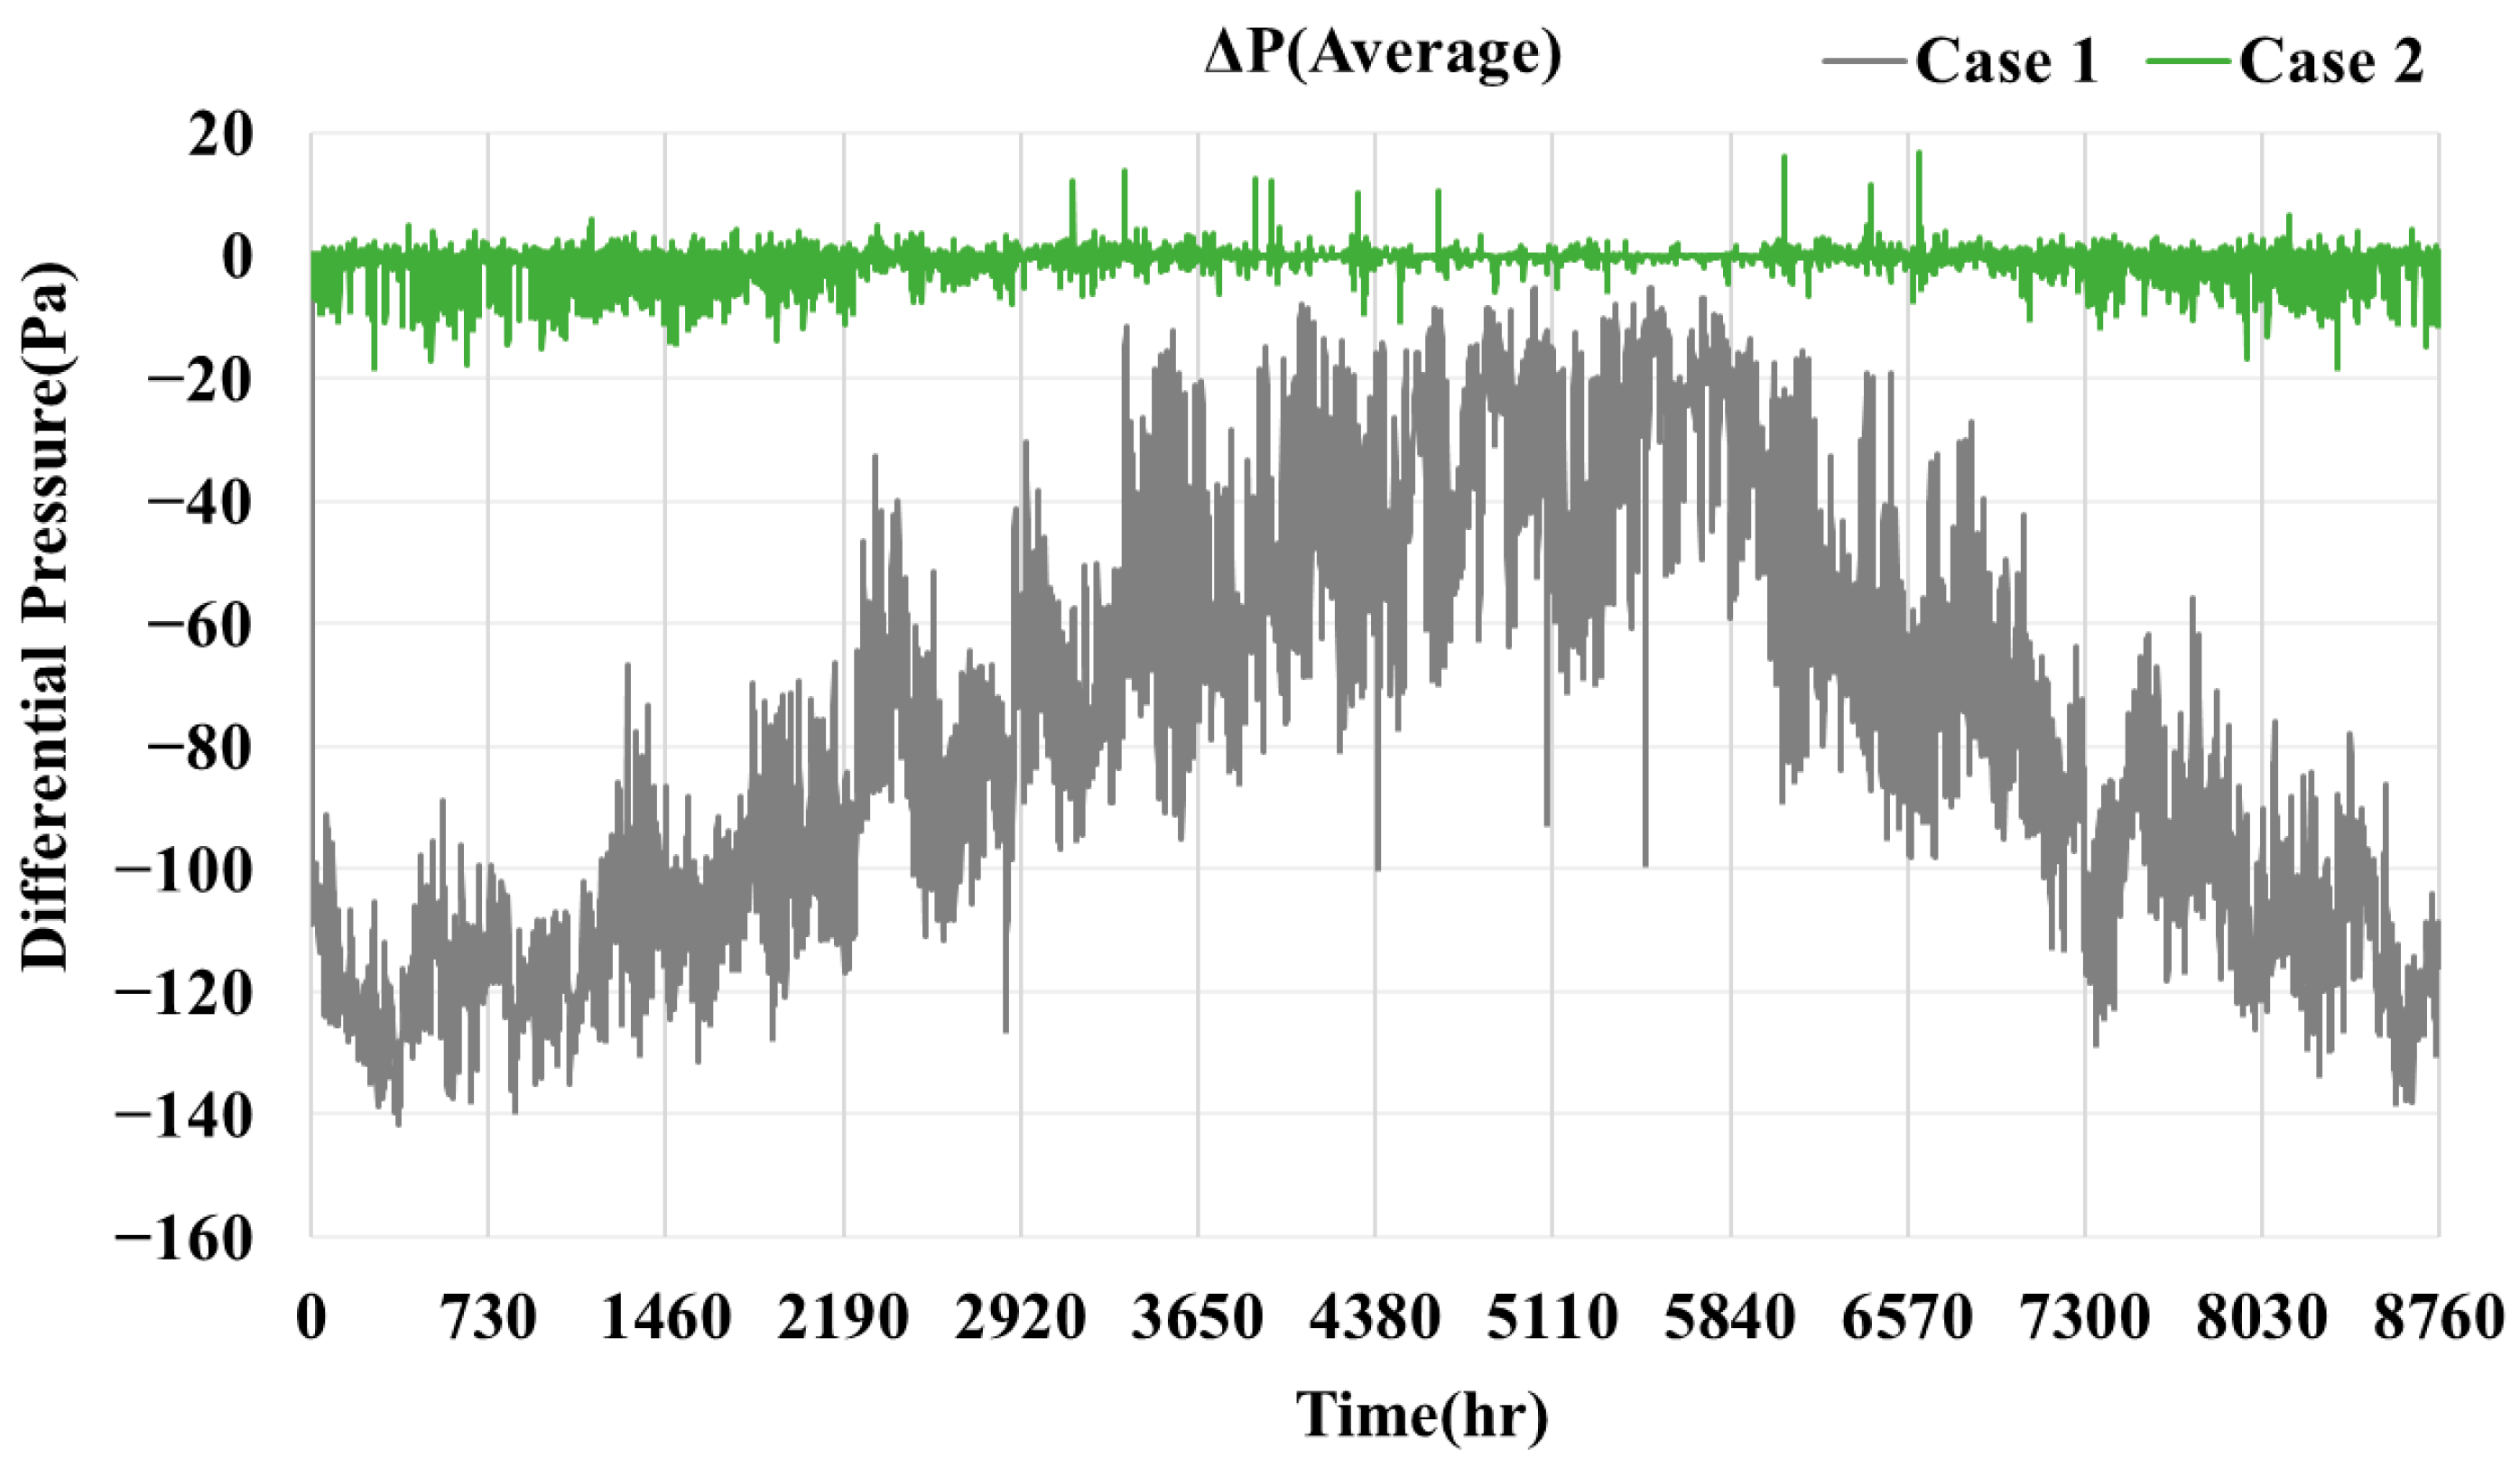
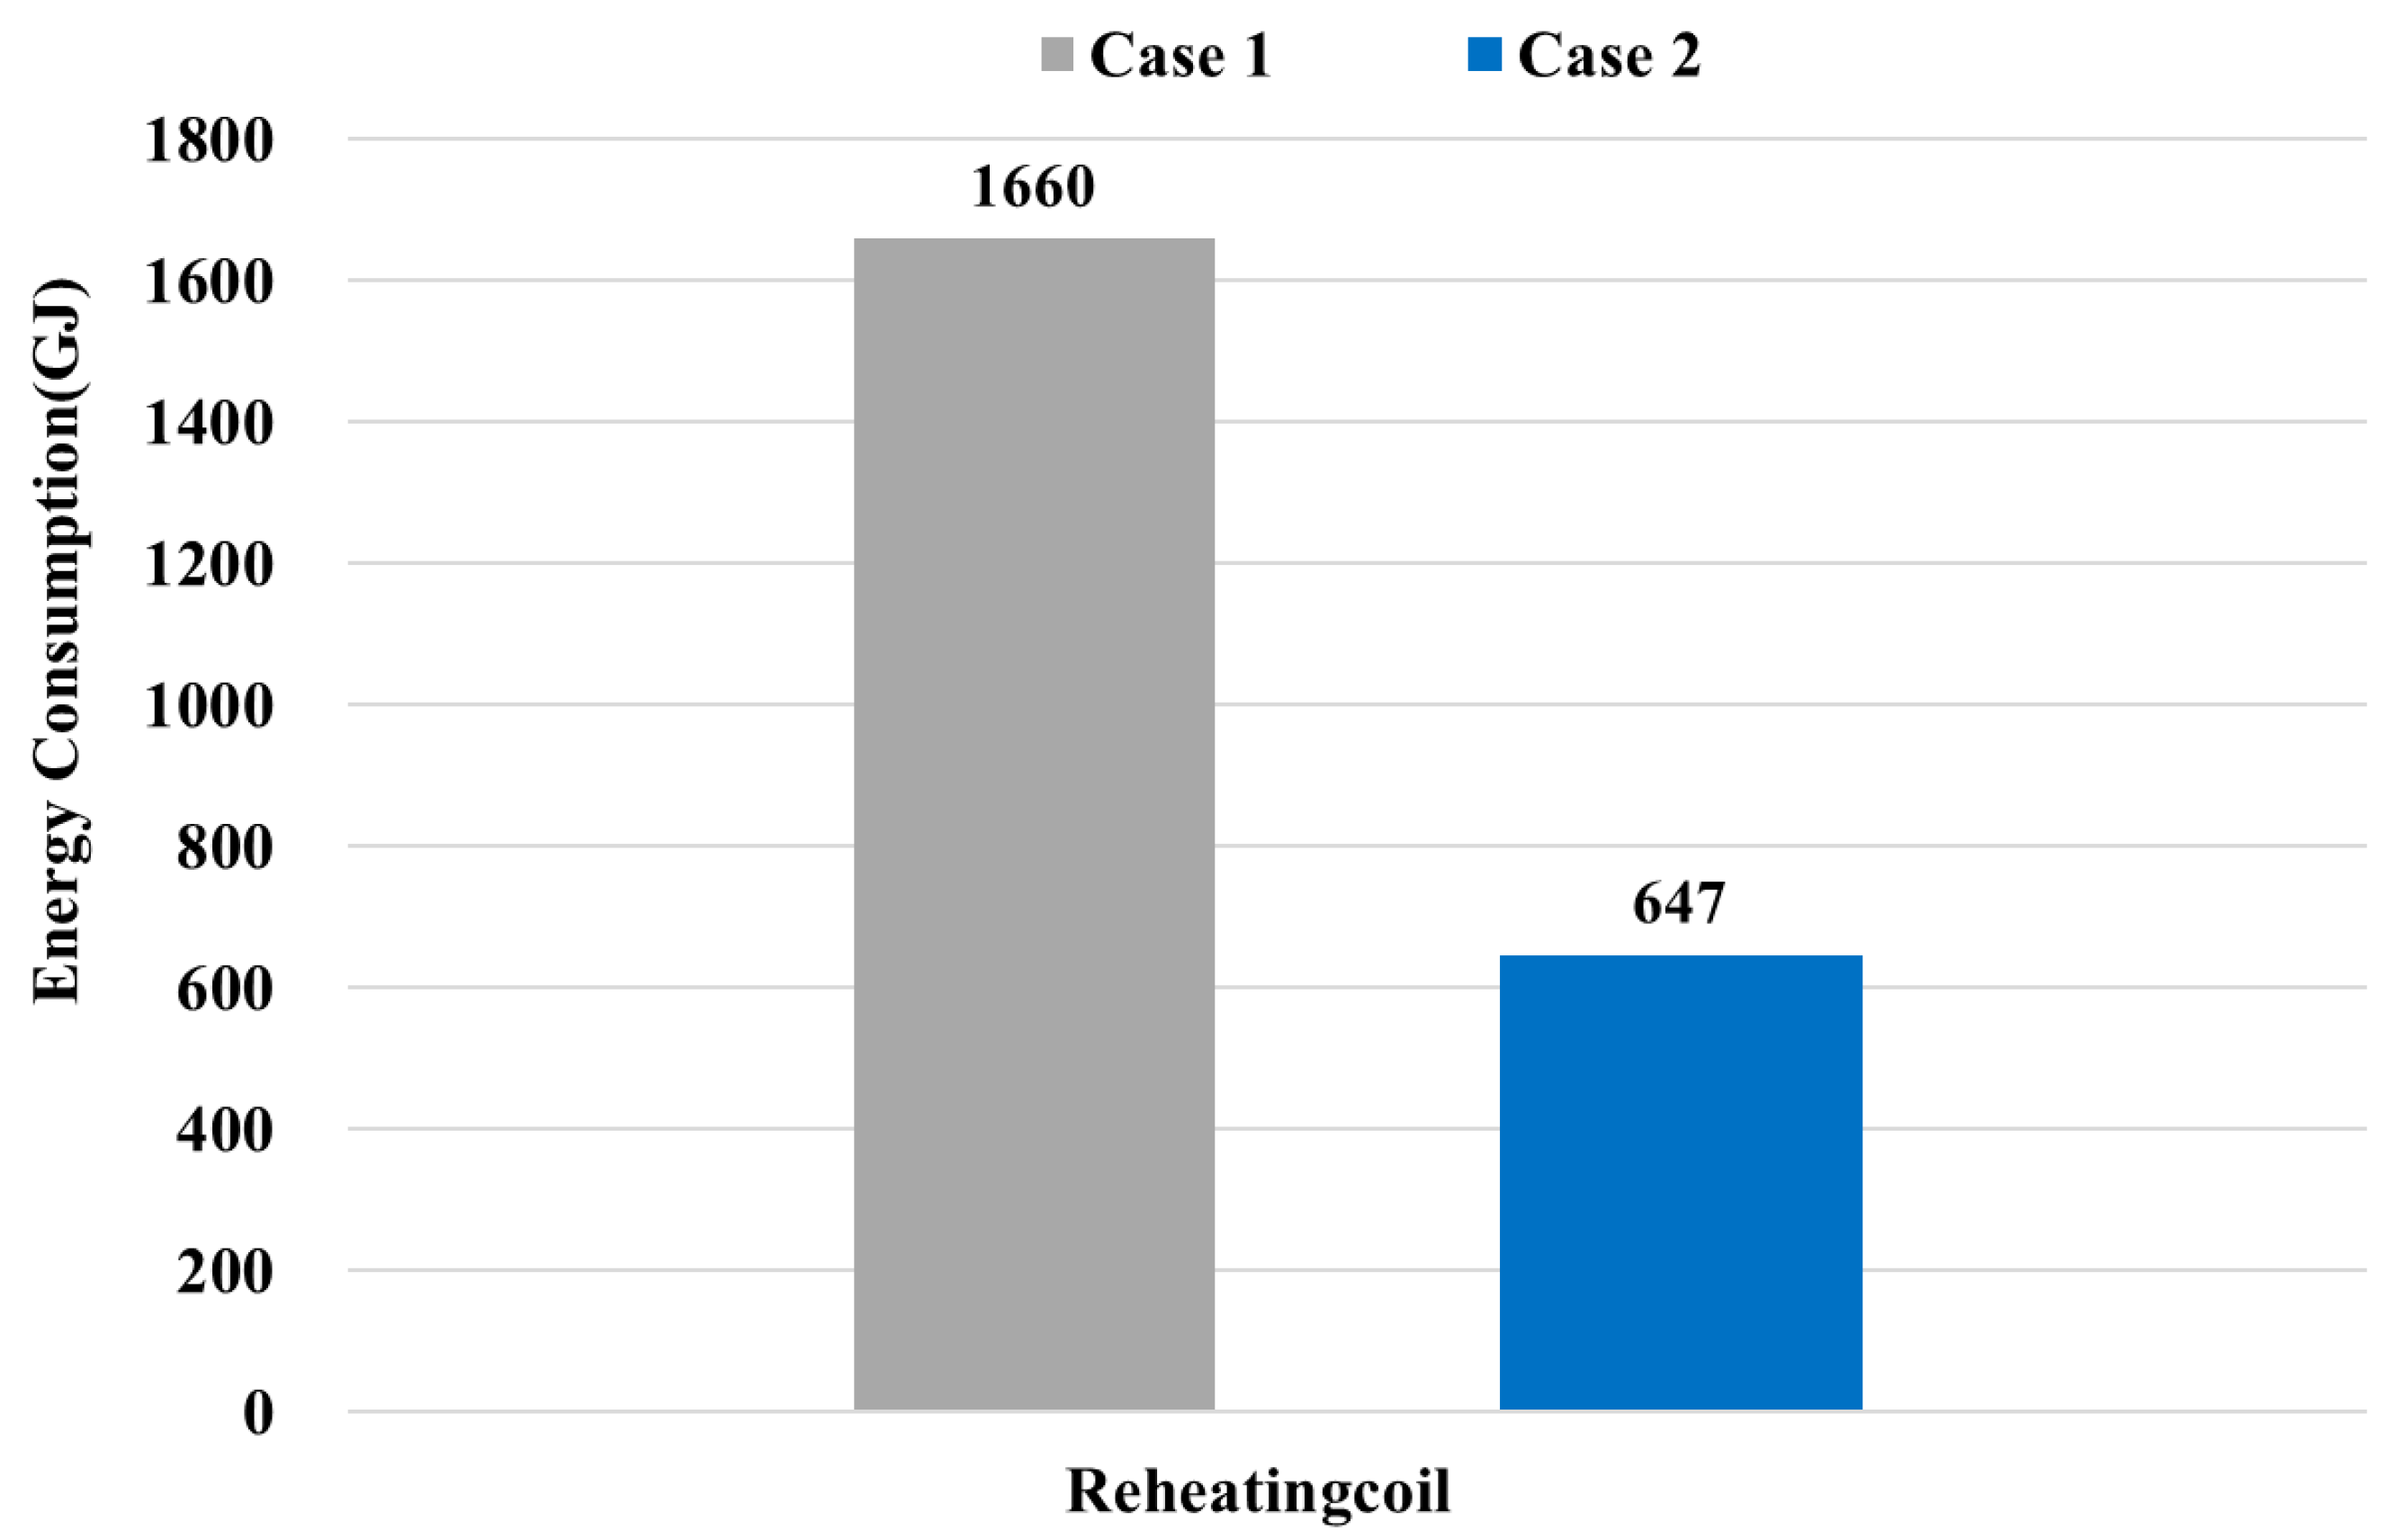
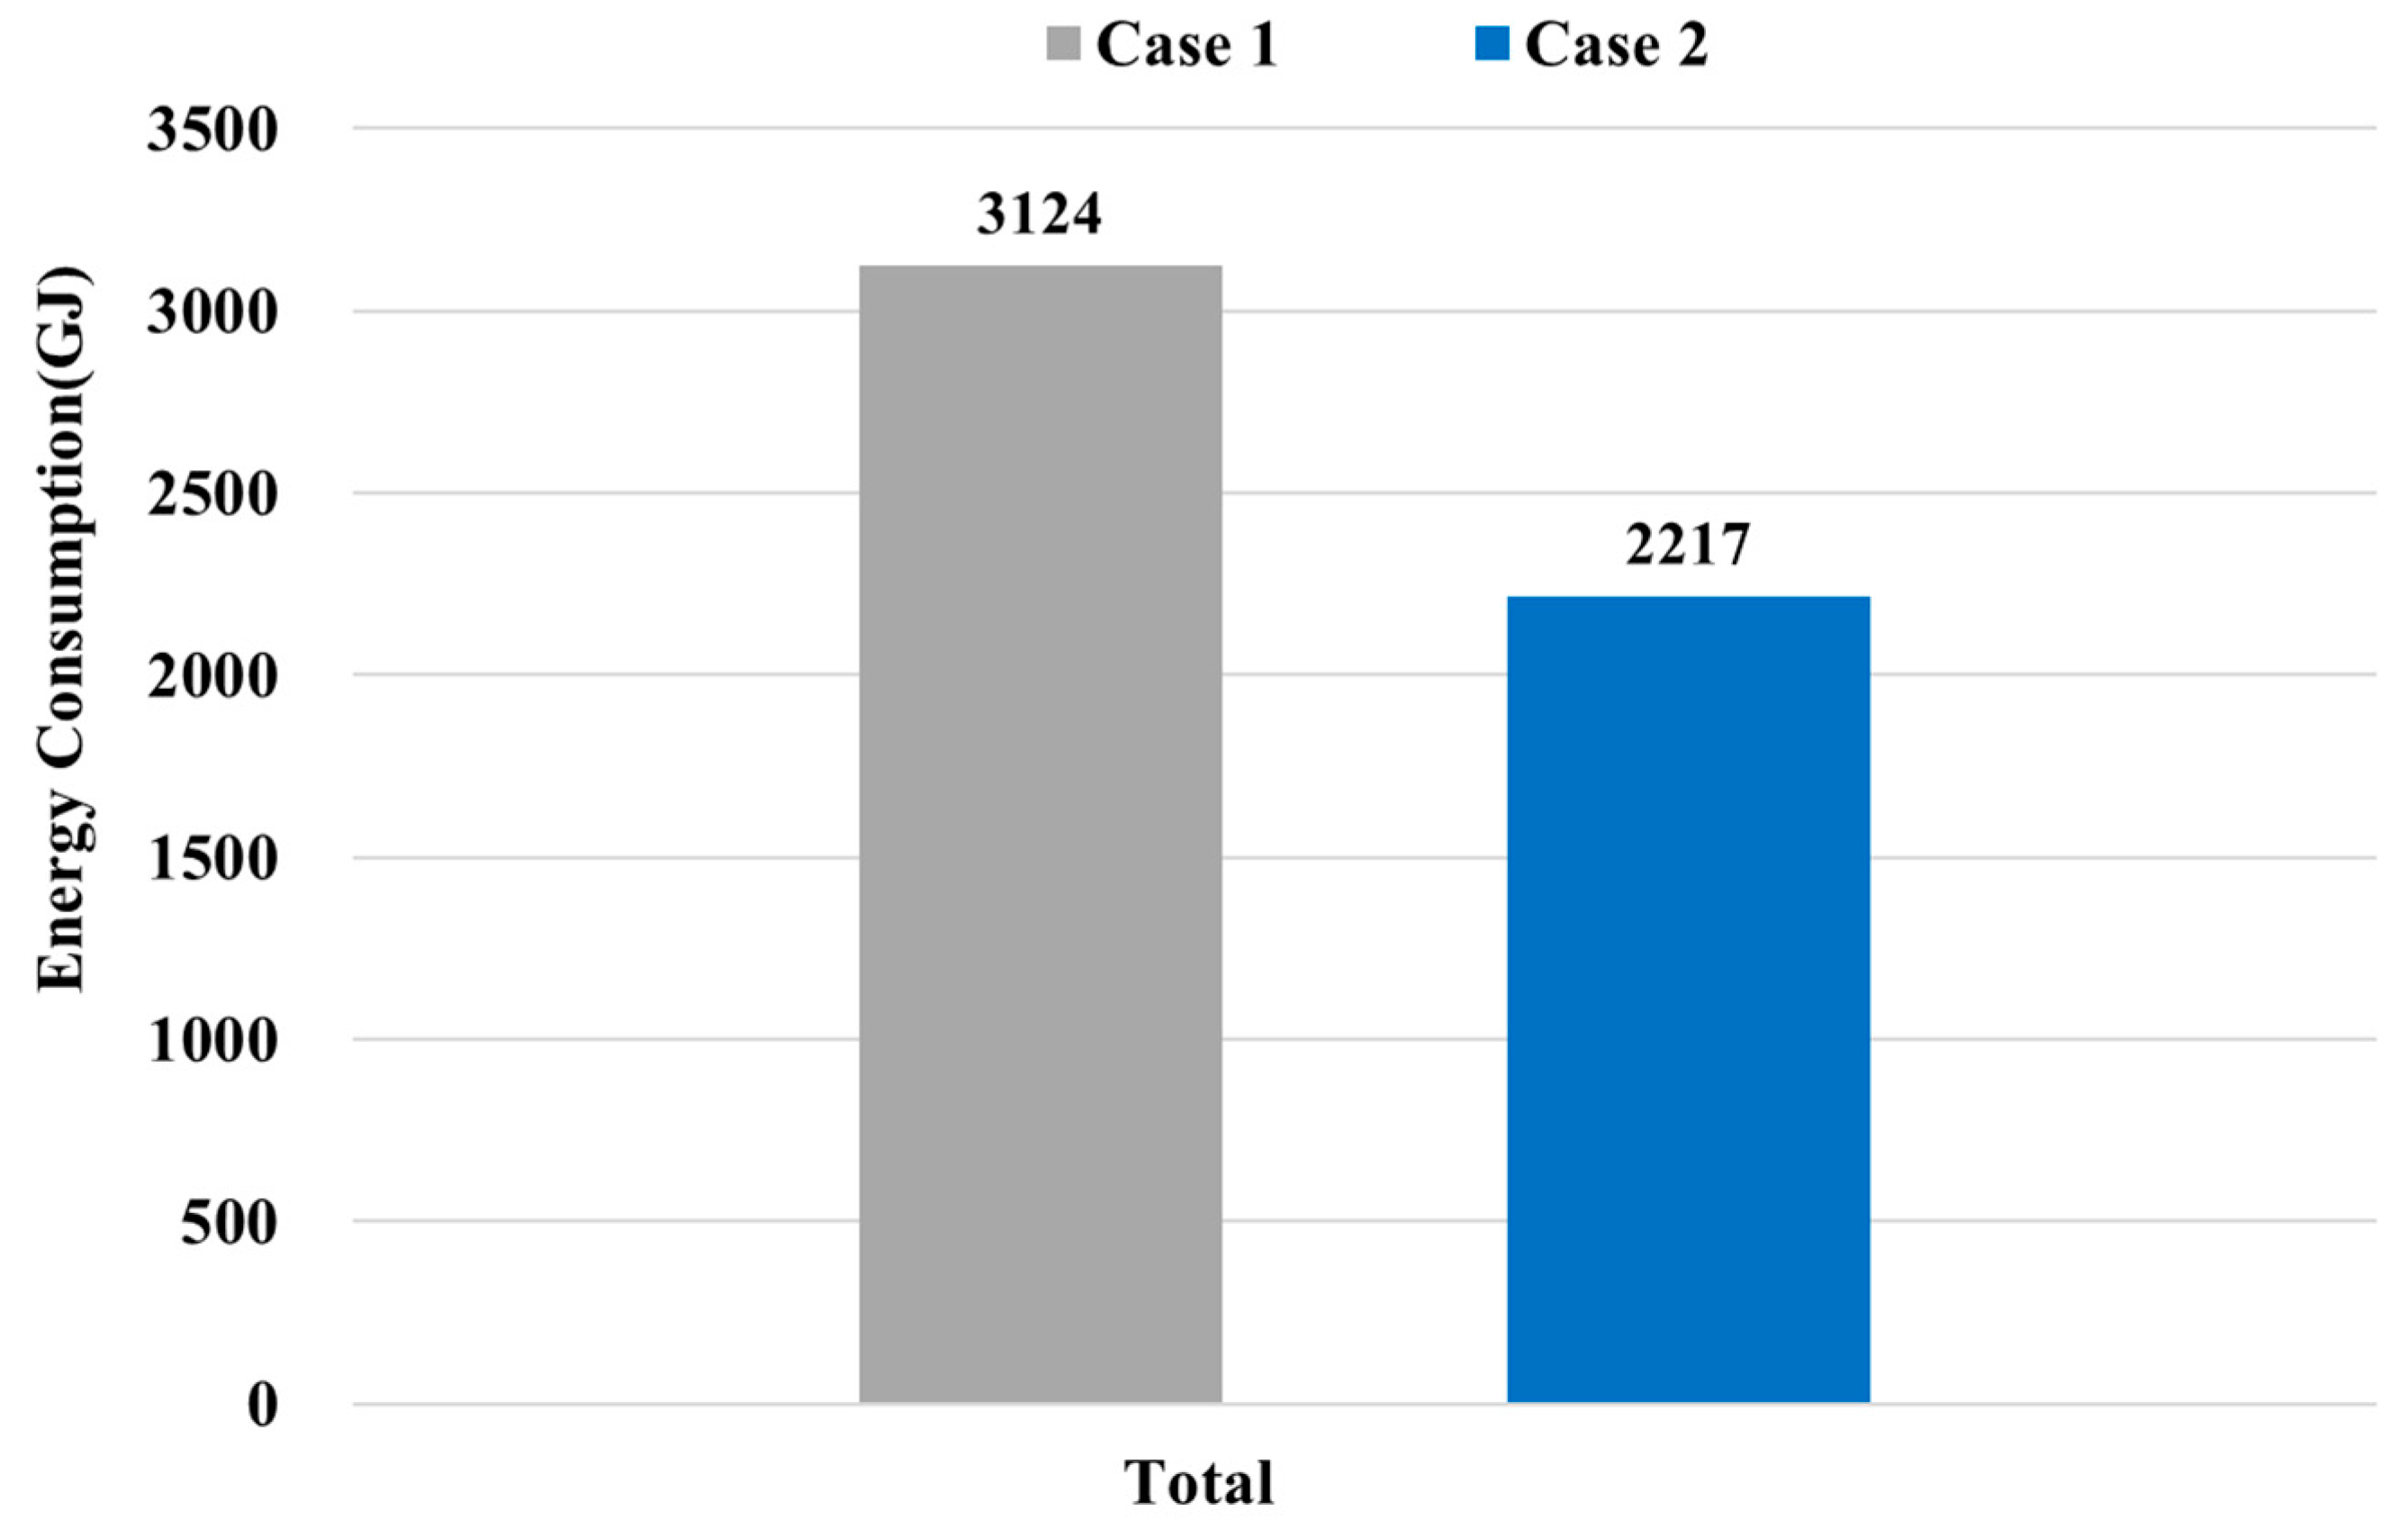
An office building with a variable air volume (VAV) system was selected for evaluation. Using TRNSYS’s Simulation Studio and TRNFLOW, the traditional operation method (Case 1) and the proposed method (Case 2) were compared and analyzed. Both methods met the indoor set temperature target of 24 °C. In terms of pressure differential and infiltration amount, the maximum indoor–outdoor pressure differential was 142 Pa for Case 1 and 18 Pa for Case 2, an 84% reduction. The average infiltration amount was 6744 CMH for Case 1 and 113 CMH for Case 2, a 98% reduction. In terms of energy consumption, the return fan energy consumption decreased by 62%, and reheat coil energy consumption decreased by 61% due to reduced infiltration. The total HVAC system energy consumption was reduced by approximately 29% compared to Case 1.
The results indicate that the proposed method is superior to the traditional method in terms of pressure differential control and building energy savings. However, several limitations of the proposed method should be addressed in future research:
(1)
While the proposed method aims to maintain positive pressure to minimize energy consumption, it has limitations in adjusting airflow solely through the return fan. Future research should explore methods for simultaneously controlling supply and return airflow based on pressure differentials to maintain positive pressure and achieve further energy savings while satisfying requirements for the indoor thermal environment.
(2)
The proposed method, considering a single zone and external pressure differential, may be too simplistic for multi-zone buildings. Future research should address pressure control methods for VAV systems in multi-zone buildings.
In situations with high occupancy, inadequate ventilation due to reduced outdoor air intake may increase CO2 levels. Future research should evaluate whether indoor air quality remains clean despite reduced return airflow and infiltration when applying the proposed method.

Author Contributions

Conceptualization and methodology: H.-I.L., H.-J.K., J.-H.L. and Y.-H.C.; writing—original draft preparation, H.-I.L.; writing—review and editing, H.-J.K., J.-H.L. and Y.-H.C.; visualization, H.-I.L.; funding acquisition, H.-J.K. and Y.-H.C. All authors have read and agreed to the published version of the manuscript.

Funding

This work was supported by the 2022 Yeungnam University Research Grant (222A380129), and by the National Research Foundation of Korea (NRF) grant funded by the Korean government (MSIT) (No. 2022R1C1C2010251).

Data Availability Statement

The original contributions presented in the study are included in the article, further inquiries can be directed to the corresponding author.

Conflicts of Interest

Author Hye-In Lee was employed by the company ENERGYX. Author Hyo-Jun Kim was employed by the company BETECH. The remaining authors declare that the research was conducted in the absence of any commercial or financial relationships that could be construed as a potential conflict of interest.

Abbreviations

Δ P T o t a l Total Differential Pressure, Pa
Δ P S Differential Pressure from stack effect, Pa
Δ P W Differential Pressure from wind, Pa
Δ P V Differential Pressure from ventilation, Pa
Q Airflow through opening, m 3 / s
Δ P Differential Pressure across building envelope, Pa
C L Flow Coefficient, m 3 / ( s · P a n )
n Pressure Exponent, -
Q s u p p l y HVAC system supply airflow, m 3 / h
Q r e t u r n HVAC system return airflow, m 3 / h
Q e x h a u s t l o c a l Local exhaust airflow, m 3 / h
Q i n f i l t r a t i o n Outdoor infiltration airflow, m 3 / h
Q e x f i l t r a t i o n Indoor exfiltration airflow, m 3 / h

References

  1. United Nations Environment Programme (UNEP). 2020 Global Status Report for Buildings and Construction: Towards a Zero-Emission, Efficient and Resilient Buildings and Construction Sector; United Nations Environment Programme: Nairobi, Kenya, 2020. [Google Scholar]
  2. Gholipour, H.F.; Arjomandi, A.; Yam, S. Green property finance and CO2 emissions in the building industry. Glob. Financ. J. 2022, 51, 100696. [Google Scholar] [CrossRef]
  3. US Department of Energy. Commercial Buildings Energy Consumption Survey; US Department of Energy: Washington, DC, USA, 2018. [Google Scholar]
  4. McIntosh, R. Savings with variable speed control. Energy Eng. 2014, 111, 7–31. [Google Scholar] [CrossRef]
  5. Okochi, G.S.; Yao, Y. A review of recent developments and technological advancements of variable-air-volume (VAV) air-conditioning systems. Renew. Sustain. Energy Rev. 2016, 59, 784–817. [Google Scholar] [CrossRef]
  6. American Society of Heating, Refrigerating and Air-Conditioning Engineers (ASHRAE). Design and Application of Controls. In ASHRAE Handbook Application; Chapter 47; ASHRAE: Peachtree Corners, GA, USA, 2020. [Google Scholar]
  7. Guyot, G.; Schild, P.G.; Carrié, R. Stimulation of Good Building and Ductwork Airtightness Through EPBD; Air Infiltration and Ventilation Centre: Flanders, Belgium, 2010. [Google Scholar]
  8. Park, S.; Park, S.; Song, D. Applicability and evaluation of airtightness prediction method using pressure differences under actual climate conditions. J. Build. Eng. 2023, 78, 107628. [Google Scholar] [CrossRef]
  9. Phalak, K.; Wang, G. Minimum outdoor air control and building pressurization with lack of airflow and pressure sensors in air-handling units. J. Archit. Eng. 2016, 22, 04015017. [Google Scholar] [CrossRef]
  10. Zheng, B.; Pang, X.; Liu, M.; Joo, I. Using a Fan Air Flow Station to Control Building Static Pressure in a Variable Volume Air Conditioning System. In Proceedings of the International Solar Energy Conference, Orlando, FL, USA, 6–12 August 2005; Volume 47373, pp. 581–587. [Google Scholar]
  11. Liu, M. Variable speed drive volumetric tracking for airflow control in variable air volume systems. J. Sol. Energy Eng. 2003, 125, 318–323. [Google Scholar] [CrossRef]
  12. Mumma, S.A. Dedicated outdoor air systems and building pressurization. Am. Soc. Heat. Refrig. Air-Cond. Eng. Trans. 2010, 116, 143. [Google Scholar]
  13. Coogan, J. Control of space pressurization for sealed or tight rooms. Am. Soc. Heat. Refrig. Air-Cond. Eng. Trans. 2012, 118, 450–458. [Google Scholar]
  14. Guo, J.; Liu, J.; Tu, D.; Zhang, J.; Xu, J.; Xue, P. Multizone modeling of pressure difference control analyses for an infectious disease hospital. Build. Environ. 2021, 206, 108341. [Google Scholar] [CrossRef]
  15. Wang, G.; Phalak, K. Reverse Relief Airflow Prevention and Building Pressurization with a Decoupled Relief Air Damper in Air Handling Units. Am. Soc. Heat. Refrig. Air-Cond. Eng. Trans. 2016, 122, 354–366. [Google Scholar]
  16. Shi, S.; Miyata, S.; Akashi, Y.; Momota, M.; Sawachi, T.; Gao, Y. Model-based optimal control strategy for multizone VAV air-conditioning systems for neutralizing room pressure and minimizing fan energy consumption. Build. Environ. 2024, 256, 111464. [Google Scholar] [CrossRef]
  17. Yang, S.; Wan, M.P.; Chen, W.; Ng, B.F.; Zhai, D. An adaptive robust model predictive control for indoor climate optimization and uncertainties handling in buildings. Build. Environ. 2019, 163, 106326. [Google Scholar] [CrossRef]
  18. Berge, A. Analysis of Methods to Calculate Air Infiltration for Use in Energy Calculations. Master’s Thesis, Chalmers University of Technology, Göteborg, Sweden, 2011. [Google Scholar]
  19. American Society of Heating, Refrigerating and Air-Conditioning Engineers (ASHRAE). Ventilation and Infiltration. In ASHRAE Handbook Fundamentals; Chapter 16; ASHRAE: Peachtree Corners, GA, USA, 2021. [Google Scholar]
  20. Spitler, J.D. Load Calculation Applications Manual, 2nd ed.; American Society of Heating, Refrigerating and Air-Conditioning Engineers: Atlanta, GA, USA, 2014. [Google Scholar]
  21. Yu, J.Y.; Song, K.D.; Cho, D.W. Resolving stack effect problems in a high-rise office building by mechanical pressurization. Sustainability 2017, 9, 1731. [Google Scholar] [CrossRef]
  22. The Society of Air-Conditioning ad Refrigerating Engineers of Korea. Engineering Equipment Manual; The Society of Air-conditioning ad Refrigerating Engineers of Korea: Seoul, Republic of Korea, 2011; Volume 2. [Google Scholar]
  23. ISO 7730-2005; Ergonomics of the Thermal Environment-Analytical Determination and Interpretation of Thermal Comfort Using Calculation of the PMV and PPD Indices and Local Thermal Comfort Criteria. International Organization for Standardization: Geneva, Switzerland, 2005.
  24. Trane. Commercial Building Pressurization. Trane Eng. Newsl. 2002, 31, 2. [Google Scholar]
Figure 1. Differential pressure from main sources of building pressurization.
Energies 17 05289 g001
Figure 2. Leakage Airflow Caused by HVAC System Operation.
Energies 17 05289 g002
Figure 3. Differential pressure versus airflow rate.
Energies 17 05289 g003
Figure 4. Schematic diagram of HVAC system with return fan for building pressure control.
Energies 17 05289 g004
Figure 5. Building pressure model.
Energies 17 05289 g005
Figure 6. Airflow network of the analyzed building.
Energies 17 05289 g006
Figure 7. Existing return fan operating strategy algorithm.
Energies 17 05289 g007
Figure 8. Simulation result using existing return fan control method in winter.
Energies 17 05289 g008
Figure 9. Indoor–outdoor pressure differences for each envelope side in winter.
Energies 17 05289 g009
Figure 10. Proposed return fan control strategy algorithm.
Energies 17 05289 g010
Figure 11. Simulation results obtained using proposed return fan control strategy in winter.
Energies 17 05289 g011
Figure 12. Thermal comfort of proposed return fan control strategy.
Energies 17 05289 g012
Figure 13. Relationship between supply airflow and return airflow using proposed return fan control strategy in winter.
Energies 17 05289 g013
Figure 14. Differential pressure according to control strategy.
Energies 17 05289 g014
Figure 15. Infiltration airflow according to control strategy.
Energies 17 05289 g015
Figure 16. Comparison of the AHU energy consumption according to control strategy.
Energies 17 05289 g016
Figure 17. Comparison of the reheating energy according to control strategy.
Energies 17 05289 g017
Figure 18. Comparison of the total energy consumption according to control strategy.
Energies 17 05289 g018
Table 1. Simulation conditions.
ListsContents
BuildingsLocationSeoul, Republic of Korea
UseOffice
SystemsVAV terminal unitVAV terminal unit with reheat system
Air Handling Unit
(AHU)
Supply fanDesign airflow34,400 CMH
Design static pressure1065 Pa
Design power5.5·4 kW
Return fanDesign airflow34,400 CMH
Design static pressure1065 Pa
Design power5.5·4 kW
Exhaust fanDesign airflow4100 CMH
Operation conditionSchedule24 h
Set point temperature24 °C
Load conditionsOccupantSeated, light work, typing: 150 W/person
Equipment30 W/m2
Light15 W/m2
Material properties
U-value
Outdoor wall0.310 W/m2·K
Indoor wall0.508 W/m2·K
Floor0.09 W/m2·K
Ceiling0.316 W/m2·K
Table 2. Simulation cases.
CaseControl LogicClassification
Case 1
(Existing strategy)
Supply airflow trackingReturn airflow = Supply airflow
Case 2
(Proposed strategy)
Differential pressure trackingReturn airflow = Supply airflow − Leakage airflow
Disclaimer/Publisher’s Note: The statements, opinions and data contained in all publications are solely those of the individual author(s) and contributor(s) and not of MDPI and/or the editor(s). MDPI and/or the editor(s) disclaim responsibility for any injury to people or property resulting from any ideas, methods, instructions or products referred to in the content.

