Abstract
Demand response (DR) enhances building energy flexibility, but its application in hybrid heating systems with dynamic pricings remains underexplored. This study applied DR via heating setpoint adjustments based on dynamic electricity and district heating (DH) prices to a building heated by a hybrid ground source heat pump (GSHP) system coupled to a DH network. A cost-effective control was implemented to optimize the usage of GSHP and DH with power limitations. Additionally, four DR control algorithms, including two single-price algorithms based on electricity and DH prices and two dual-price algorithms using minimum heating price and price signal summation methods, were tested for space heating under different marginal values. The impact of DR on ventilation heating was also evaluated. The results showed that applying the proposed DR algorithms to space heating improved electricity and DH flexibilities without compromising indoor comfort. A higher marginal value reduced the energy flexibility but increased cost savings. The dual price DR control algorithm using the price signal summation method achieved the highest cost savings. When combined with a cost-effective control strategy and power limitations, it reduced annual energy costs by up to 10.8%. However, applying the same DR to both space and ventilation heating reduced cost savings and significantly increased discomfort time.
1. Introduction
Buildings are responsible for nearly 30% of global energy consumption [1]. The buildings sector plays a crucial role in improving energy efficiency [2] and providing energy flexibility [3]. Among building energy consumptions, heating, ventilation, and air conditioning (HVAC) occupy the largest share, accounting for 38% of buildings’ consumption [4]. As one of the most efficient solutions for heating and cooling, ground source heat pumps (GSHPs) have gained popularity in the European market [5]. GSHPs can be used in different environments, even in cold climates. In Finland, GSHPs are experiencing rapid growth. In 2023, over 2000 units of large-scale GSHPs with a heating capacity exceeding 26 kW were sold in the Finnish market [6]. A typical GSHP system in Finland comprises a borehole field, a compression heat pump, and a hot water tank, which can be integrated or installed separately [7]. The borehole field can also provide free cooling, meeting a significant share of the cooling demand [8].
However, in cold regions, conventional GSHPs face challenges in long-term operation. Since the heating demand far exceeds the cooling demand, a significant thermal imbalance in the ground can occur, potentially depleting ground thermal energy and deteriorating GSHP performance over time. Additionally, high levels of heating loads can cause the need for oversized boreholes, significantly increasing investment costs and making the system less economically feasible. In this context, hybrid GSHP systems, which combine GSHPs with auxiliary heating sources like electrical boilers or district heating (DH), provide a practical solution [9]. The integration of two or more heating energy sources enables the implementation of advanced control strategies in the system to optimize the distribution of the heating load and achieve cost savings [10,11,12].
On the other hand, electric heat pumps, as a technology that converts electricity to heating or cooling, contribute to the variable electricity demand of building. The growing demand during peak load hours necessitates a demand response (DR), which is a critical and effective measure to activate the demand side resources to improve energy flexibility [13]. DR refers to adjustments in energy consumption patterns by energy users in response to energy price variations (price-based DR) or incentive programs (incentive-based DR) in order to reduce energy use when energy prices are expensive or when system reliability is at risk [14]. The aim of DR is to reduce carbon emissions by integrating more renewable energy into an electricity network and to enhance security by shifting peak loads to off-peak times. However, DR can also bring economic benefits to building owners by reducing energy costs.
Short-term thermal energy storage, including thermal storage tank and building thermal mass, are widely recognized as effective ways to work with electric heat pumps in DR for load-shifting. One method for load-shifting is by modifying the on-off schedule of the heat pump—in other words, by shutting down the heat pump system and using the energy stored in the building thermal mass or water tank during peak periods [15,16,17,18,19]. It has been demonstrated that this DR method can maintain an acceptable interior temperature even in the absence of a thermal storage tank in heating distribution systems with high thermal inertia, including floor heating systems [16,20]. Arteconi et al. [16] investigated the impacts of a DR strategy on an air source heat pump in operation with different heating distribution systems (floor heating system or water radiator system). Based on the time of use (TOU) price, the DR strategy required turning off the heat pump during peak-price hours (16:00–19:00). The results showed that the electricity cost could be effectively reduced by DR control. Additionally, a floor heating system can maintain room comfort while the heating is shut off even without any thermal storage tank. However, a water radiator system cannot ensure the comfort temperature level in 12% of the operation time if no storage tank is installed. Yu [20] devised a model predictive control method (MPC) to optimize the scheduling of a GSHP couple with a floor heating system for load shifting. The findings demonstrate that the MPC significantly increased the consumption of surplus electricity generated by renewable energy, and by optimizing the time intervals on the prediction horizon, the negative effects of load shifting on indoor temperature can be minimized.
A thermal storage tank is more often used in conjunction with optimized on-off schedules of heat pumps for improving the flexibility of heating systems [21]. It has been proved that by optimizing the charging schedule of water tanks, the electricity costs for operating heat pumps can be significantly reduced in many studies [19,22,23,24]. D’Ettorre et al. [19] evaluated a cost-optimal control strategy developed for an air-source heat pump integrated with a water thermal storage system. A gas boiler was used directly for back-up heating. According to the results, configuration with a storage tank can save the total energy cost up to 8% and reduce the primary energy consumption up to 13% compared to configuration without the tank.
Apart from modifying the on-off schedule of heating, another way to shift peak demand is by adopting different control strategies for temperature setpoints—in other words, by preheating the building with higher indoor temperature setpoints during off-peak times and lowering the setpoints during peak times within a comfortable temperature range. The modulation potential of heating power through changing indoor air temperature setpoints is subject to various factors, such as insulation level, heating distribution type, climate conditions, etc. [13]. Le Dréau and Heiselberg [13] assessed the modulation potential of heating power for two residential buildings with various levels of insulation and air tightness. The findings revealed that the poorly-insulated building modulated a large amount of heat within a short period, while the well-insulated building modulated less heat but had a longer heat modulation period.
Various control strategies for regulating indoor air temperature setpoints have been investigated in previous studies. Yoon et al. [25] developed a momentary DR control algorithm for a single family house in Austin, USA. DR control changed indoor air temperature setpoints for heating and cooling based on the relationship between the real-time price and threshold price. The results showed the developed DR control reduced the electricity consumption by about 12% and 21% in the coldest and hottest month, respectively, and reduced the annual electricity cost by 14%. Alimohammadisagvand et al. [26] examined the impacts of four rule-based DR control algorithms on heating energy consumption and energy cost in a Finnish detached house. The four DR control algorithms include one momentary DR control algorithm based on dynamic electricity price and three predictive DR control algorithms using different methods to define the variation trends of future electricity prices. The findings showed that the predictive DR control algorithm using the sliding-maximum subarray method led to the highest savings of 15% in the annual heating energy and annual energy costs.
Some studies used model predictive control (MPC) to consider both the electricity price signal and the customers’ preference of indoor comfort in DR control. Avci et al. [27] developed a DR control strategy based on MPC, collectively minimizing the electricity cost and the deviation between the indoor air temperature and the occupant’s preferred temperature. They proposed a temperature setpoint assignment (TSA) algorithm to select indoor air temperature setpoints according to electricity price ranges and the discomfort tolerance index of occupants. The results revealed that the developed DR control strategy decreased the energy consumption by 8% and saved the related costs by 13% with a neutral discomfort tolerance index. Baniasadi et al. [28] proposed an MPC control with DR based on real-time pricing for a GSHP coupled with a water storage tank and fan coil units. They designed a dynamic temperature setpoint control algorithm that considered the electricity price range and the user’s preference of cost reduction or thermal comfort. They compared it with a momentary temperature setpoint control based on threshold electricity price and found that the new temperature control algorithm realized a 79% reduction in peak-time power consumption.
Although DR has been extensively studied for the electric power sector, there is also growing attention to DR programs in district heating (DH) systems. DH is a popular heating method in Nordic countries. In Finland, DH accounts for a great share (45%) of the Finnish heating market, which is far more than the share of heat pumps (16%) [29]. The variation in heating demand leads to differences between demand and production sides. In energy production, high heating demand requires the usage of heat-only-boilers, which increases CO2 emissions. Additionally, peak heating loads may cause high circulating mass flow rates with consequent high pumping energy or even congestion issues [30]. In this context, implementing DR programs also becomes crucial for the DH system.
The positive effects of DR on urban DH systems and individual buildings have been examined in many studies. For instance, on the urban DH system level, Dominkovi’c et al. [8] investigated the thermal storage potential of building thermal mass in DH systems in Sønderborg, Denmark. Their study revealed that utilizing building thermal mass for storage could contribute to 5.5–7.7% of the total DH demand. Additionally, due to the thermal storage of building, the DH system can effectively utilize more solar thermal energy. Cai et al. [31] developed a DR mechanism for the urban DH network in Copenhagen, incorporating space heating and domestic hot water (DHW) models to enhance system efficiency and address congestion issues. Their findings indicated that the proposed DR mechanism could reduce energy costs by up to 11%. Ju at al. [32] implemented a price-based DR in a district heated building. They used three configurations: only building thermal mass, only a thermal storage tank, and both building thermal mass and a thermal storage tank. They also analyzed the effect of limiting the maximum district power on cost savings. The findings indicated that implementing DR control with both building thermal mass and a thermal storage tank, along with peak power limiting, could achieve 22.3% cost savings.
However, the aforementioned studies mostly investigated DR algorithms based on the dynamic price of a single type of energy product, either electricity or DH. Based on the authors’ best knowledge, there is a gap in the knowledge on conducting DR in hybrid heat pump systems under scenarios of dual dynamic prices of electricity and DH. The novelty of this study lies in investigating rule-based control for DR by regulating temperature setpoints based on dynamic electricity and DH prices. As heating is supplied by either a heat pump or DH, the regulation of temperature setpoints in hybrid heating systems is more complex than the one using a single energy product. This study investigated the four different DR algorithms for a building heated by a hybrid GSHP system integrated with a DH network. The hybrid GSHP system and the building were modeled using IDA Indoor Climate and Energy (IDA ICE) 4.8. The cost-effective control algorithm from the previous study [33] was used for optimizing the operation of the hybrid GSHP system. Based on the cost-effective control, four different DR control algorithms were then applied to space heating: two single-price DR control algorithms, one based entirely on DH price and the other on electricity price; two dual-price DR control algorithms using the minimum heating price method and the price signal summation method, respectively. Additionally, two different marginal prices were used for the sensitivity analysis of these DR control algorithms. The impacts of the various algorithms on energy flexibility, cost savings, and indoor air temperature were examined. Finally, the optimal DR algorithm for cost savings was applied to both space heating and ventilation heating, and its performance was compared with the results of using it only for space heating.
2. Methodology
2.1. Descriptions of Simulation Tool and Simulation Process
The simulation was carried out by the building simulation tool IDA ICE 4.8 [34]. It was developed for multi-zone and dynamic building simulations with variable time steps. It can simulate indoor environments and energy consumptions in various buildings. Several studies have conducted validation work of this simulation tool with respect to different standards [35,36,37].
The building model and the hybrid GSHP system model were developed separately and then combined for the simulations. In order to boost the speed of computation, the borehole field model was decoupled from the combined building and hybrid GSHP system model. The simulations of the borehole field model and the combined model were performed concurrently with data exchange at each time step. The borehole model, building model, and hybrid GSHP system model were validated in previous studies [33,38,39].
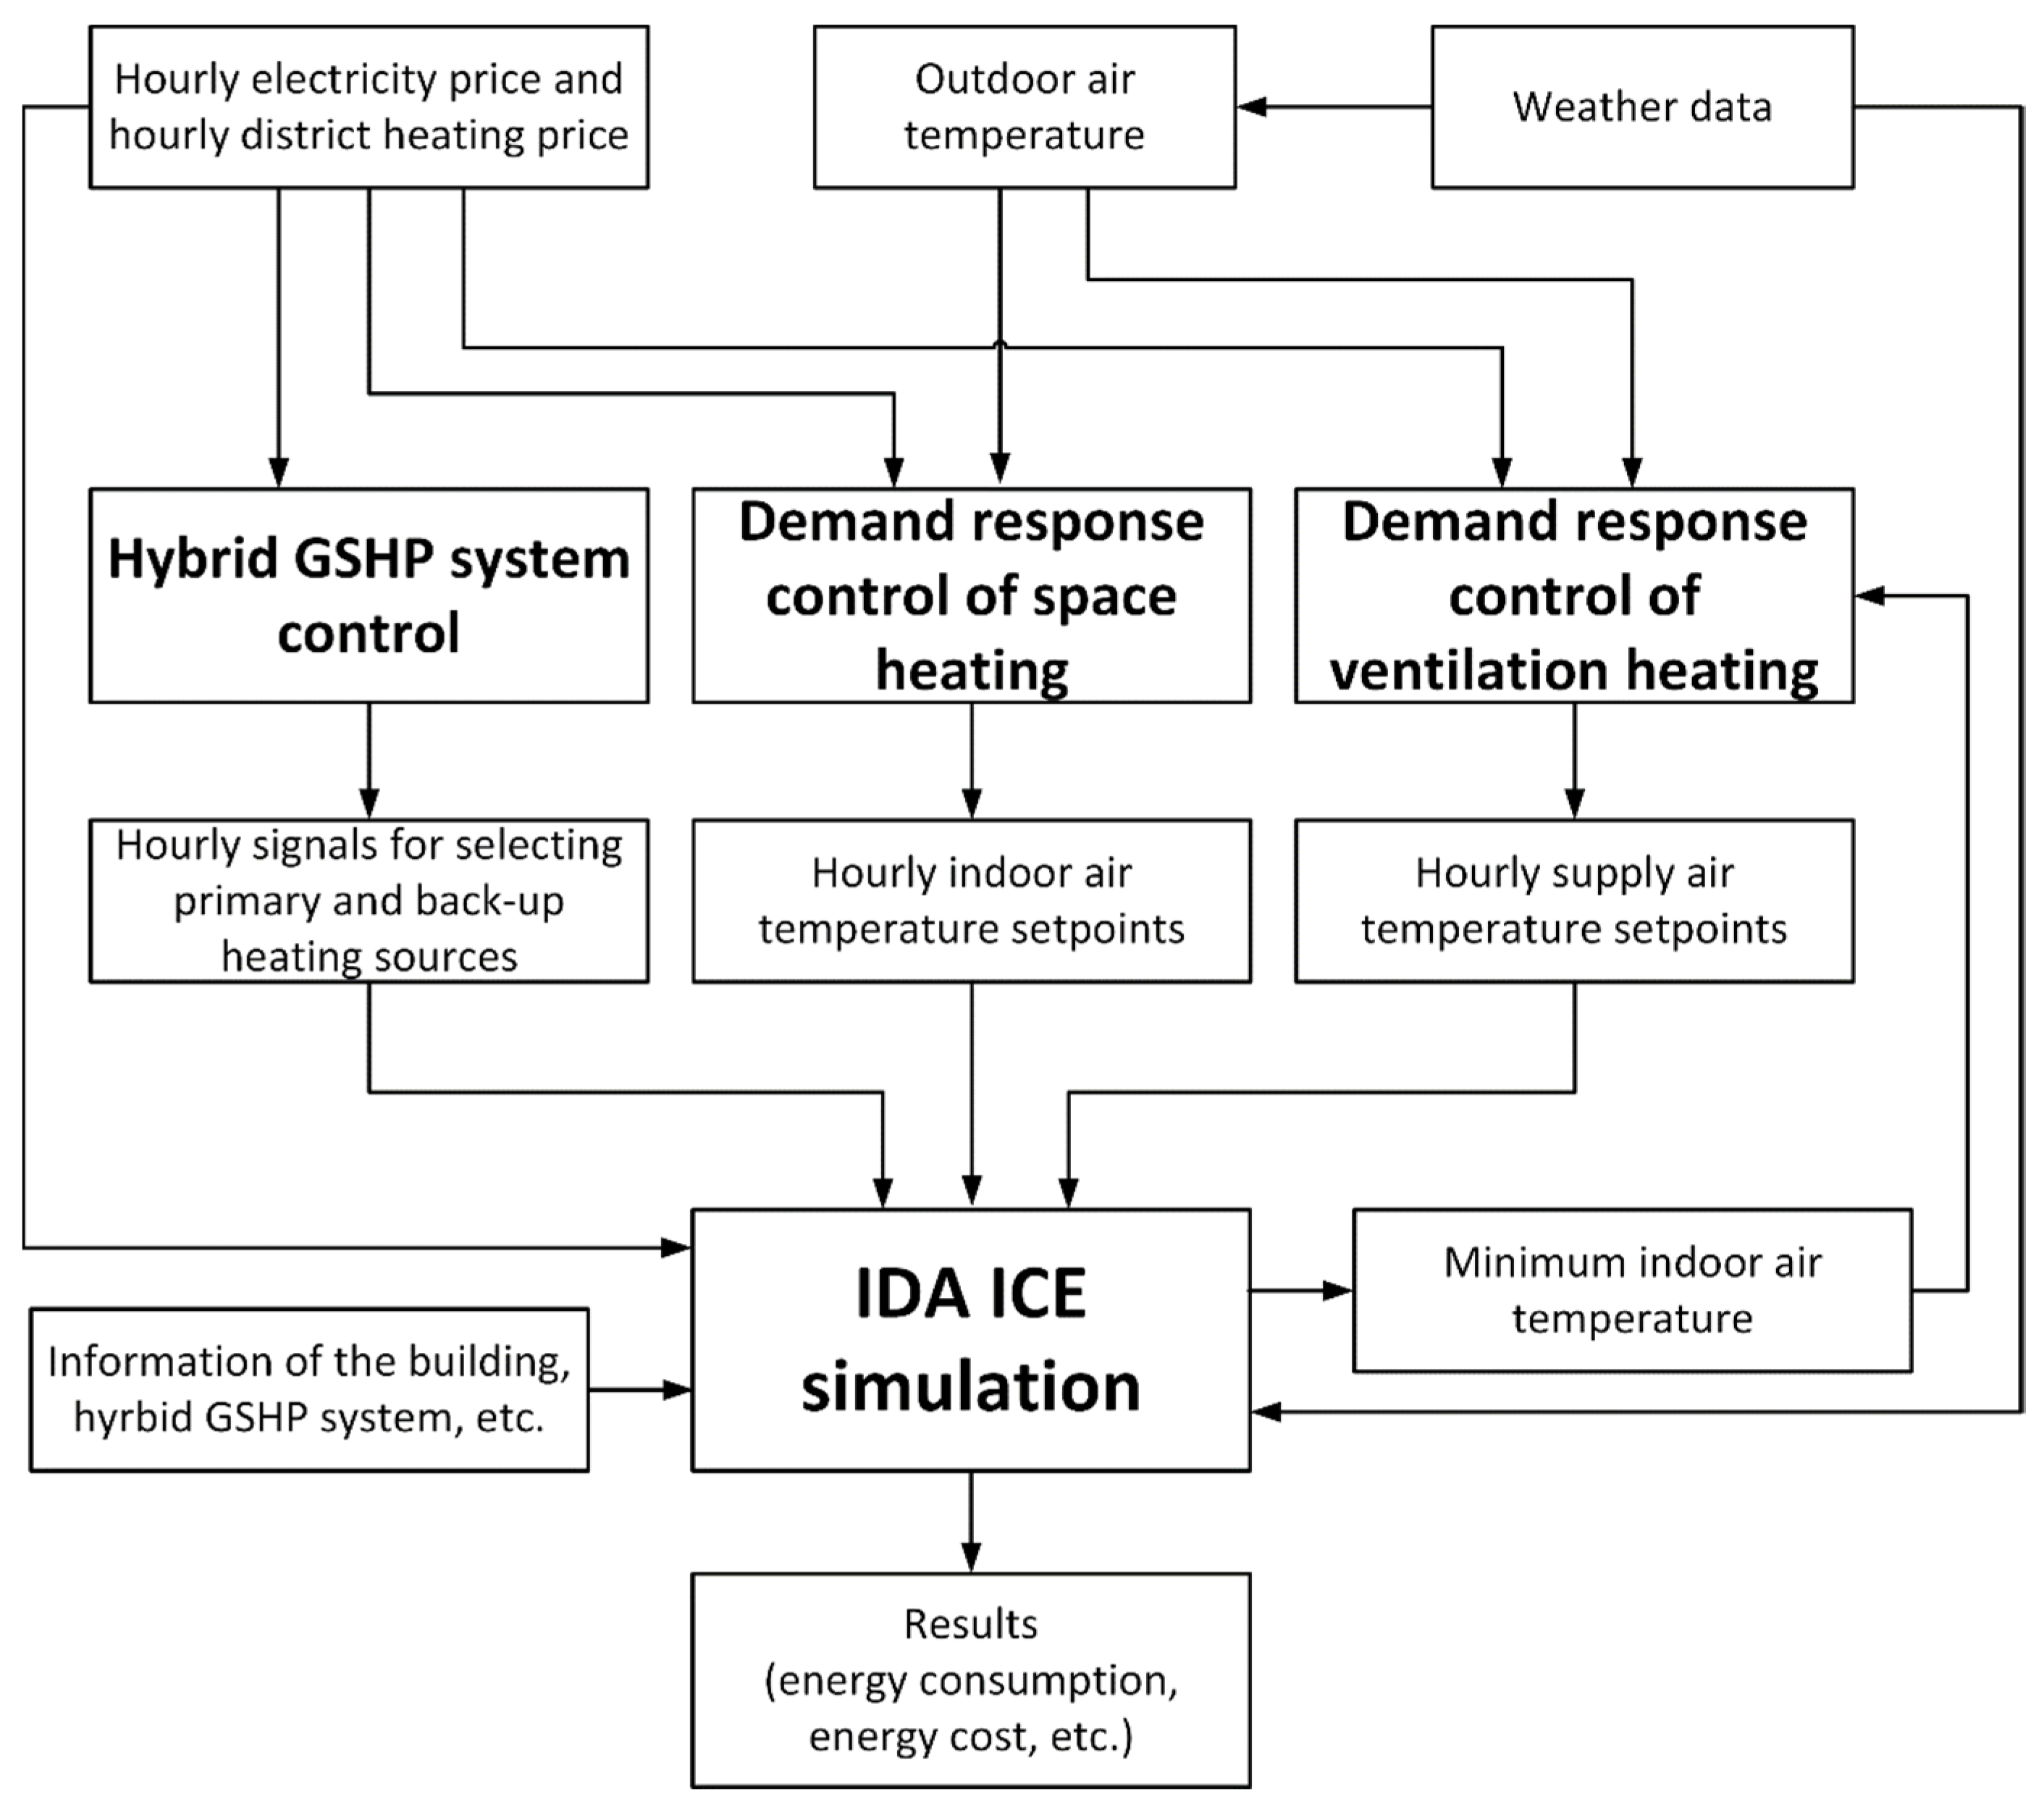
Figure 1 illustrates a flow chart describing the simulation process. The main input parameters to the IDA ICE model include weather data, energy prices, and information of the building and the hybrid GSHP system. Apart from these, there are three control strategies used in this study: hybrid GSHP system control, DR control of space heating, and DR control of ventilation heating. The hybrid GSHP system control is used to determine whether the GSHP or DH is used for primary heating. DR control of space heating selects the indoor air temperature heating setpoint. DR control of ventilation heating is used for modulating the supply air temperature heating setpoint. By receiving the input parameters and control signals from the control algorithms, IDA ICE carries out the simulation and compute final results.
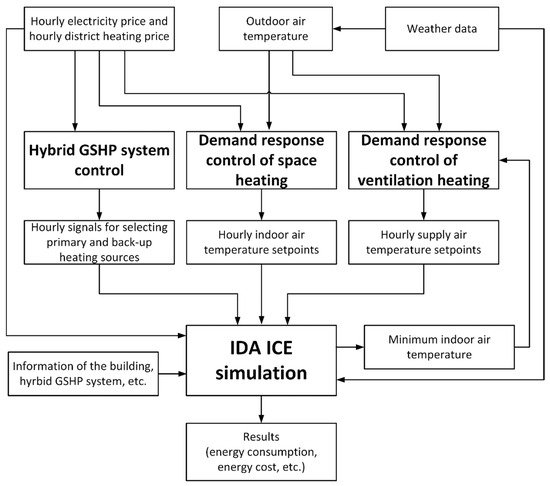
Figure 1.
Flow chart of simulation process.
2.2. Building Description
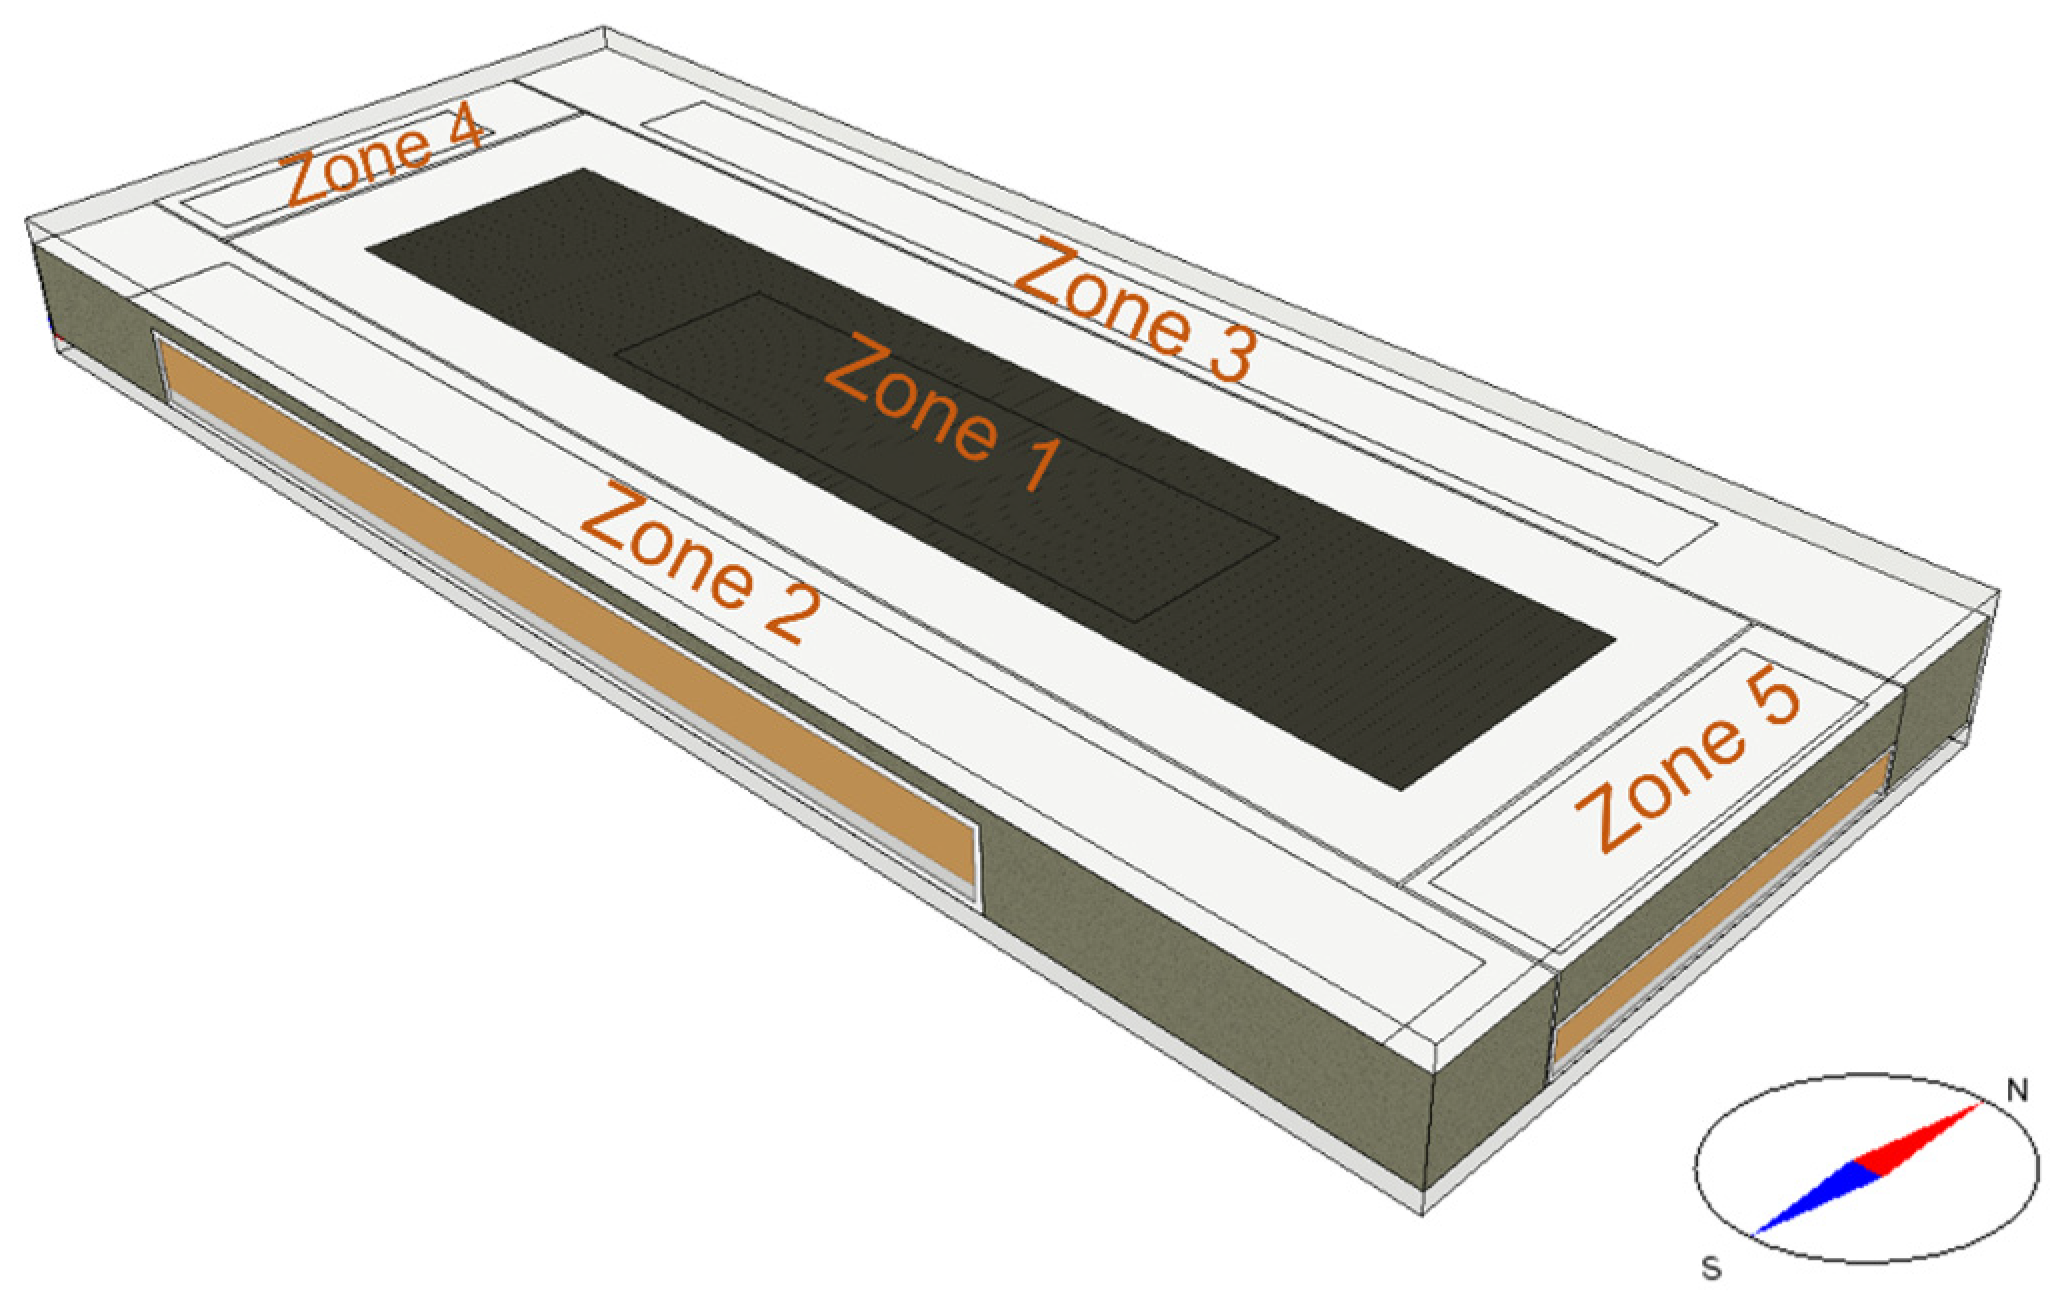
The building used for this study is a large educational building complex located in Espoo, Finland. It features an irregular shape and comprises five floors. The building contains various functioning spaces, including restaurants, office rooms, cafeterias, educational spaces, supermarkets, shops, and a metro station. The building’s heated net floor area is 47,500 m2. The building layout was modelled by using a rectangular and single-story layout with a height of 4.6 m for all rooms. The interior space was divided into five zones. To match the real net floor area, the size of the building model was scaled by a factor of 18.3. The diagram of the simplified building model is illustrated in Figure 2. Information about the building’s construction details is provided in Table 1. The building was designed by a Finnish consultancy company in Espoo, Finland in compliance with the Finnish building code [40]. The validation of the simplified building model was performed in a prior study [33].
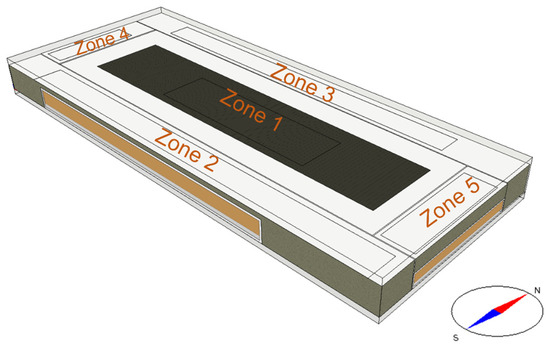
Figure 2.
Diagram of the simplified building model [33].

Table 1.
Details of the building model.
A hydronic four-pipe radiant ceiling panel system is utilized to distribute both space heating and cooling. For space heating, the design supply and return water temperature are 49 °C and 30 °C, respectively, with a design indoor air temperature heating setpoint of 21 °C and an outdoor temperature of −26 °C. During the transition and cooling seasons, the indoor air temperature heating setpoint ranges between 21 and 24 °C. The supply heating water temperature is regulated based on the outdoor air temperature. For space cooling, the supply and return temperature are 15 °C and 18 °C, respectively, with a design indoor air cooling setpoint of 25 °C. However, the indoor air temperature cooling setpoint was decreased to 23 °C by the building owner for enhancing borehole free cooling to mitigate the underground thermal imbalance. In addition, the heating setpoints in the transition and cooling seasons were modified as 21–22 °C. In this study, the modified indoor air temperature setpoints for heating and cooling were used for the reference simulation case. And an annual heating energy demand of 7.5 kWh/m2 was set for the annual domestic hot water (DHW).
Due to the various functioning areas in the building, two different groups of occupancy densities and lighting and equipment heat gains were assigned to zones 1–3 and zones 4–5 in the building model. The occupants’ heat gains were defined based on a clothing level of 0.85 ± 0.25 clo and an activity level of 1.0 MET. Table 2 lists the details of occupancy density, lighting, and equipment heat gains.

Table 2.
Settings of internal heat gains.
A mechanically balanced constant air volume (CAV) ventilation system is installed in the building. The ventilation system was modelled using two air handling units (AHUs) with a heat recovery efficiency of 70%. The design supply and return water temperatures for AHU heating are 45 °C and 30 °C, respectively, with the supply water temperature regulated based on the outdoor air temperature. The design supply and return water temperatures for AHU cooling are 10 °C and 16 °C, respectively. The supply air temperature setpoint ranges from 16 °C to 18 °C in the whole year. The effect of fans and ducts are considered in the simulation, leading to a 1 °C increase in the supply air temperature. The AHU fan operation follows a certain schedule. On weekdays, the fan operates at 20% of its maximum speed between 23:00 and 4:00. From 4:00 to 7:00, the fan speed gradually increases until reaching its maximum, which is then maintained from 7:00 to 19:00. Later, the fan speed gradually decreases back to 20% until 23:00. Table 3 provides the specific air flow rate parameters.

Table 3.
Settings of ventilation air flow rates.
2.3. Hybrid GSHP System
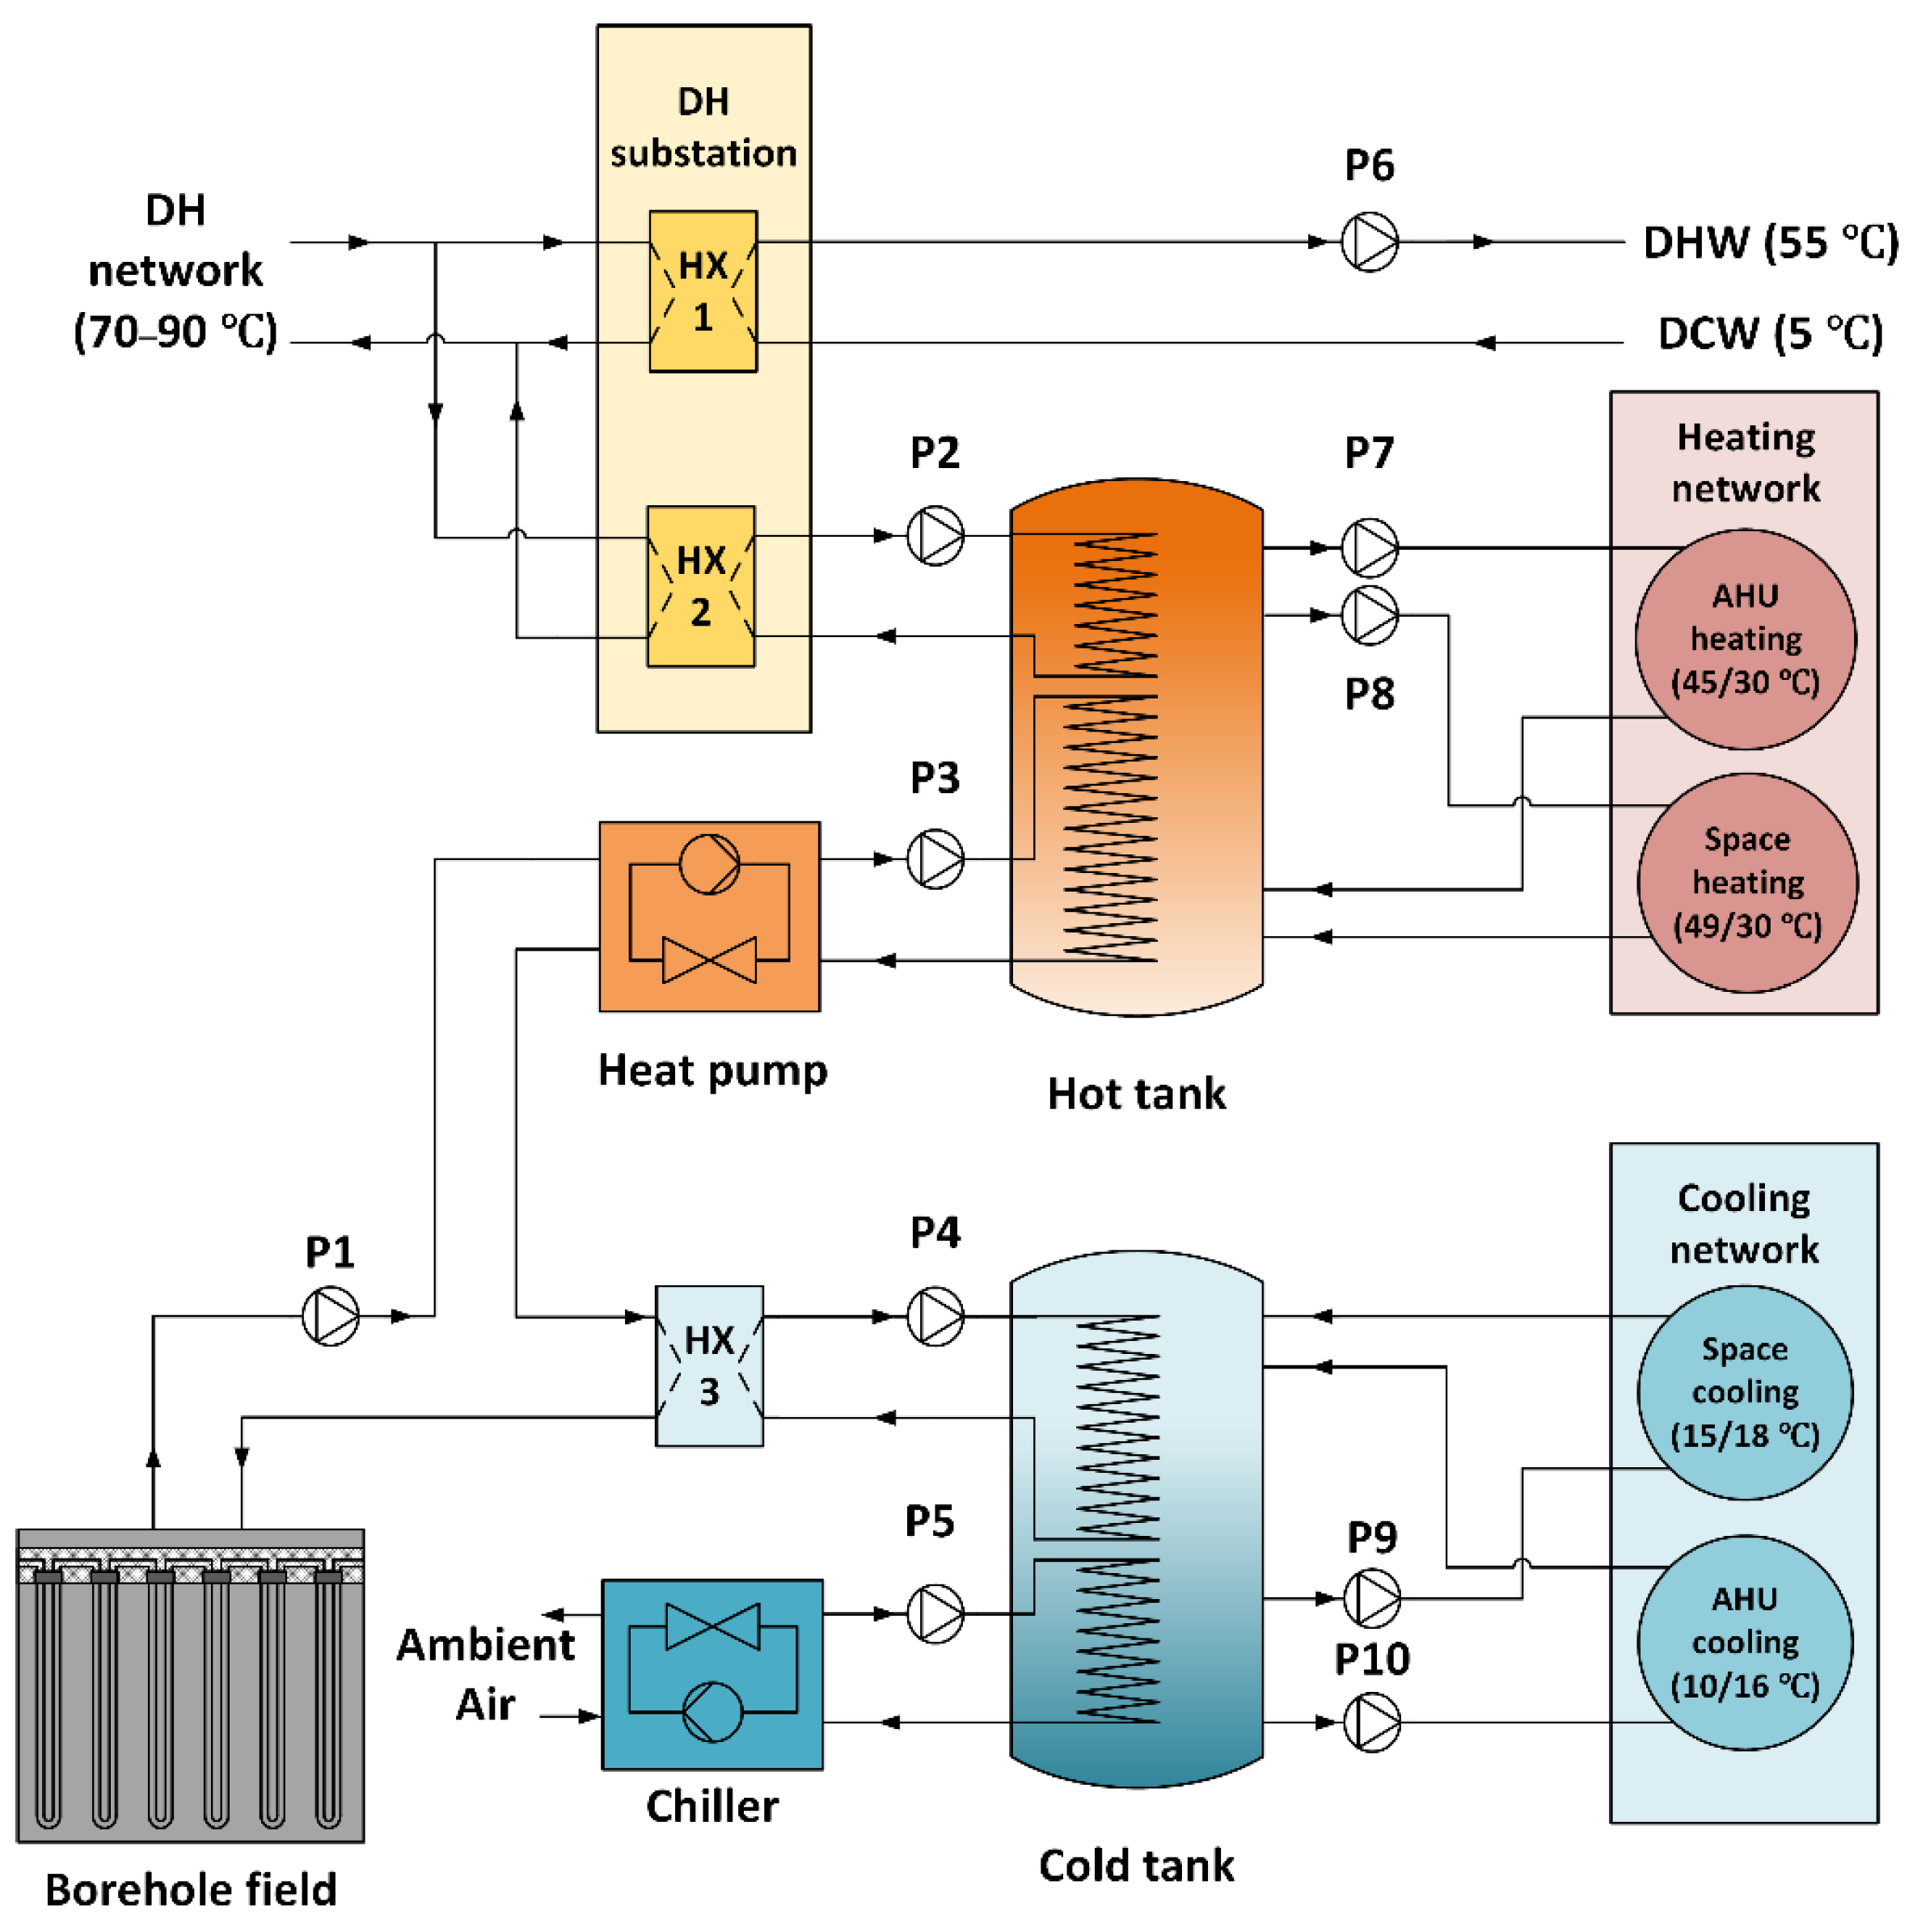
The heating and cooling are both supplied by the hybrid GSHP system, comprising a borehole field, heat pumps, a DH substation, a chiller, and cold and hot water storage tanks. The hybrid GSHP system was modeled in the IDA ICE plant model. A simplified schematic diagram of the hybrid GSHP system model is shown in Figure 3. A hot tank, heated by the heat pump or the DH, provides hot water to the heating network. A cold tank, cooled by borehole free cooling or the air-cooled chiller, supplies cold water to the cooling network. Additionally, the DHW is directly heated via the DH network.
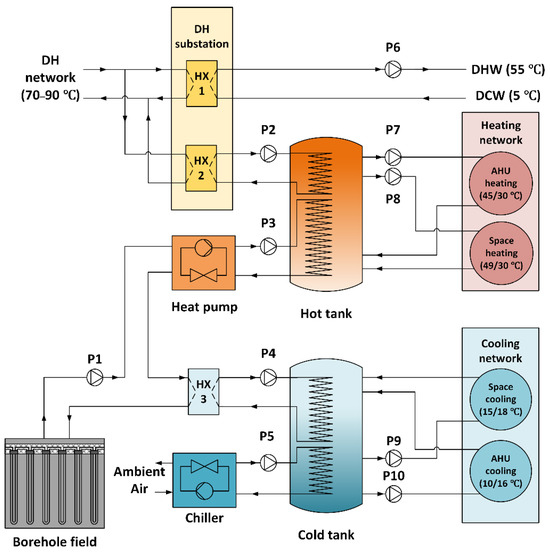
Figure 3.
Simplified schematic diagram of the hybrid GSHP system model [33].
The GSHP was designed for base heating. There are in total nine heat pump units, which collectively provide a total heating power of 790 kW with a coefficient of performance (COP) of 3.94 under rating conditions of 35/0 °C. For modelling simplicity, these nine heat pump units were modeled as a single brine-to-brine heat pump in IDA ICE 4.8.
The borehole field was modelled with an IDA-ICE borehole model extension, which is developed based on the finite difference method. The borehole field comprises 74 groundwater-filled boreholes drilled into the granite-dominated bedrock, which is covered by 10 m of soil. The average length of borehole is 310 m. The borehole heat exchangers are single U-tubes made from plastic, with a working fluid of 28% ethanol–water solution. The input parameters of the borehole field are given in Table 4.

Table 4.
Input parameters for borehole field model.
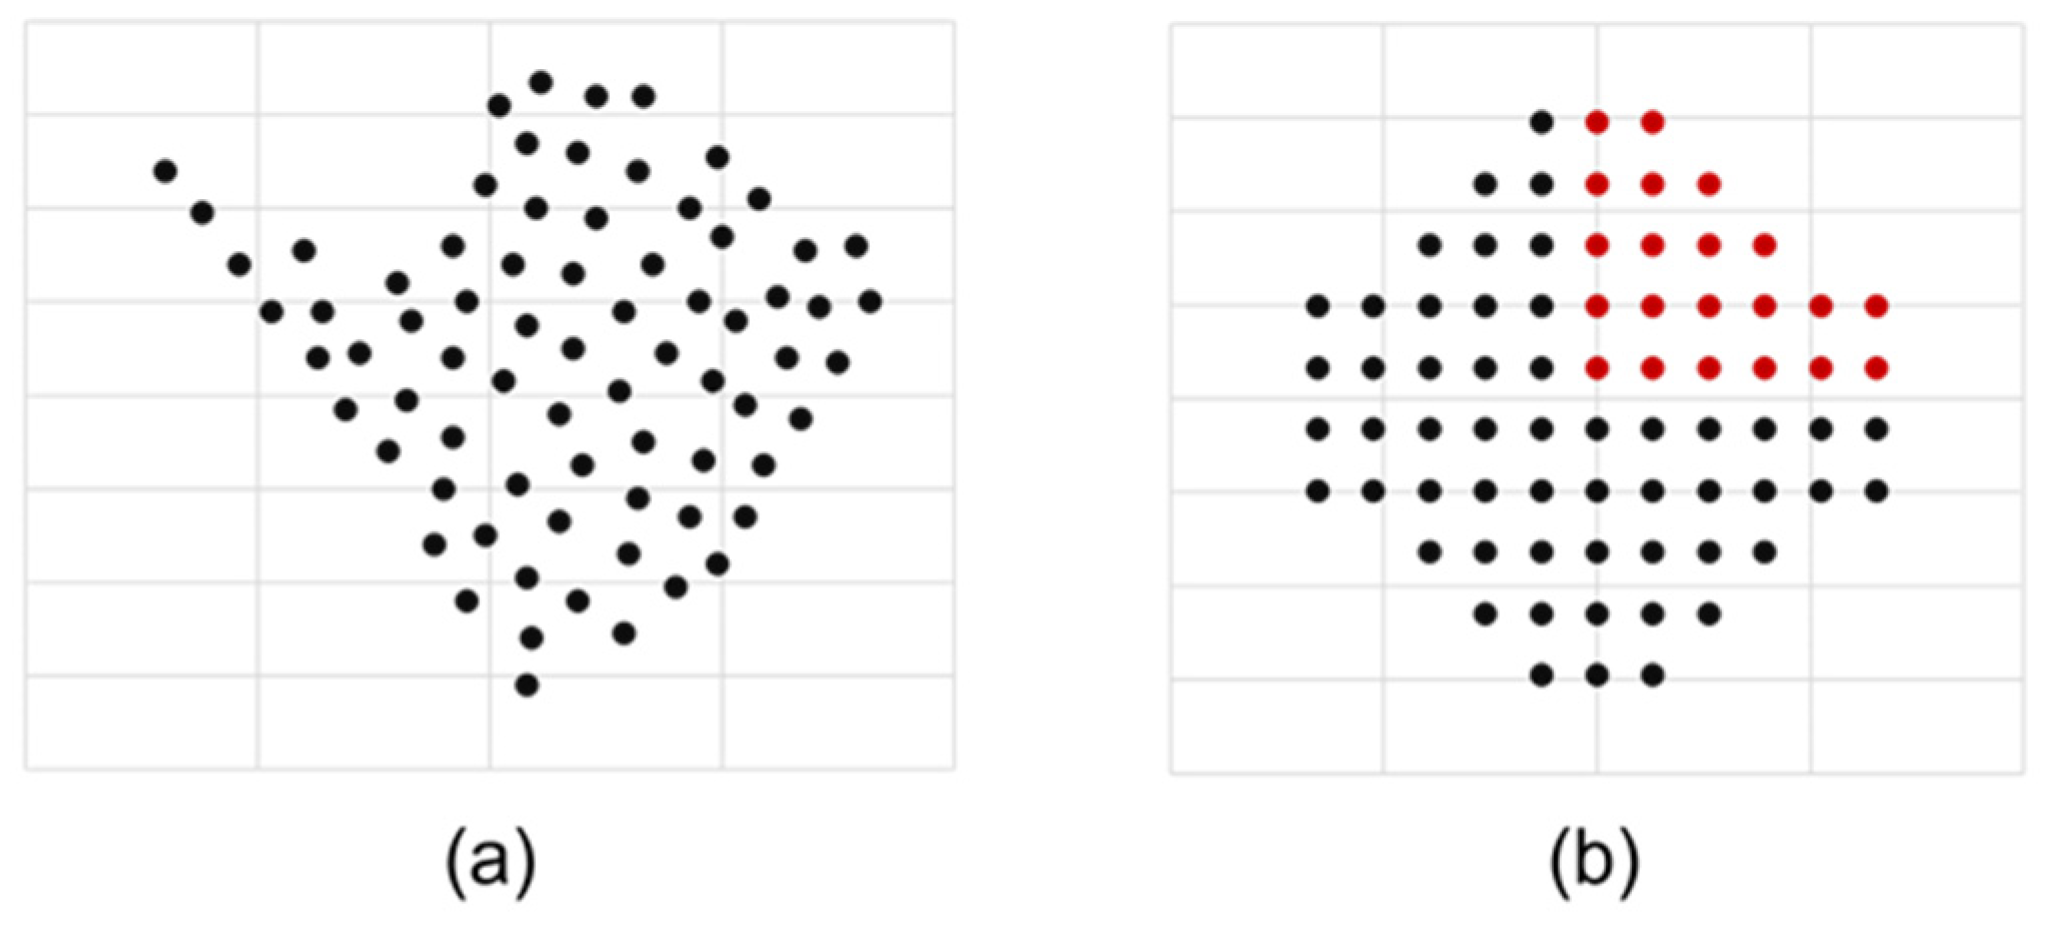
The boreholes are arranged in an irregular layout, as shown in Figure 4a. For modelling simplicity, the original irregular layout of the borehole field was simplified into a double-symmetry configuration, as illustrated in Figure 4b. The final simulation results were derived from 21 simulated boreholes, represented as red dots in Figure 4b. The simplified borehole field model was validated against the on-site measurements in a prior study [38].
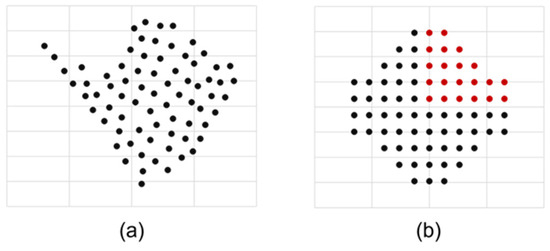
Figure 4.
Borehole field layouts: (a) original layout; (b) simplified layout [38].
DH and the air-cooled chiller were designed as back-up equipment for heating and cooling networks, respectively. The maximum DH power for backup heating is 1680 kW. The heat exchanger efficiency of the DH substation was set as 97%. The supply temperature of DH were regulated between 70 °C and 90 °C based on the outdoor temperature in accordance with Finnish guidelines [41]. The air-cooled chiller has a nominal cooling capacity of 1300 kW with an energy efficiency ratio (EER) of 3.04.
A non-ideal tank model was used for both the cold and hot storage tanks. The cold storage tank is 2.0 m high and has a volume of 3 m3. The hot storage tank is 2.2 m high and has a volume of 5 m3. Each tank is divided into eight vertical layers. The bottom layer of the cold storage tank and the top layer of the hot storage tank, respectively, are installed with temperature sensors. The water in the bottom layer of the cold storage tank is cooled by 2 °C below the minimum supply water temperature setpoint for the cooling network (). The water in the top layer of the hot storage tank is heated by 2 °C higher than the maximum supply water temperature setpoint for the heating network ().
2.4. Hybrid GSHP System Control
For heating purposes, the operational sequences of the GSHP and DH were decided by the hybrid GSHP system control. In this study, two control algorithms, GSHP-prioritized control and cost-effective control, were used for comparison.
The GSHP-prioritized control algorithm, as the name suggests, always uses the GSHP for primary heating and uses DH for back up heating. Back-up heating is put into use when the GSHP is running at maximum capacity, and the measured water temperature of the hot storage tank, , drops below the hot storage tank setpoint of .
In the cost-effective control algorithm, the operational sequence of GSHP and DH were optimized according to the hourly electricity and DH prices during the heating season from October to April. In other months, the control of the operational sequence of GSHP and DH were the same as the GSHP-prioritized control. During the heating season, the hourly specific heating prices of GSHP and DH, denoted respectively as and , are compared to generate the primary heating source signal, CS, to select the primary heating equipment at each hour. The primary heating source signal, CS, is calculated by Equation (1). If the specific heating price by using GSHP, (), is less than or equal to the one by using DH (), the CS value is set as one and the GSHP is used for primary heating. Otherwise, the CS value is set as zero, and DH is used for primary heating. Based on the findings of a previous study [33], a recommended value of 3.6 was identified to maximize cost savings and enhance the long-term operation safety of the borehole field. This value was adopted in the current study. The DH substation efficiency, , was set as 0.97. After the primary heating equipment is identified, the secondary heating source is activated in case the primary heating equipment is unable to supply enough heat to the hot storage tank.
where is the hourly electricity price, €/MWh, is the heat pump COP value used for control, is the monthly DH price, €/MWh, is the efficiency of DH substation, and is the primary heating source signal.
For cooling purposes, in both the GSHP-prioritized control and cost-effective control strategies, the borehole free cooling energy is always used in priority. The temperature difference between the inlet and outlet brine of the borehole heat exchanger was set as 5 °C. The chiller is put into use for backup cooling when the mass flow rate of the brine pump P1 (see Figure 3) operates at its maximum and the measured water temperature of the cold storage tank exceeds the setpoint temperature .
2.5. Demand Response Control
In this study, four different DR control algorithms are used in conjunction with the cost-effective control algorithm for hybrid GSHP operation. These DR control algorithms are single-price DR control based on DH, single-price DR control based on electricity, dual-price DR control using the price signal summation method, and dual price DR control using minimum heating price method. DR is used in the heating season, spanning from October to April.
2.5.1. Single Price DR Control Algorithm
District Heating-Based DR Control
The DH-based single price DR control algorithm only takes the hourly DH price trend into account and neglects the variation trend of hourly electricity price. The DH price trend signal () was used for DR control. The was calculated by Equation (2), which is derived from the Behrang-Sirén method [42]. The price trend was defined as increasing, decreasing, and flat, corresponding to the values of +1, −1, and 0, respectively. The marginal value in the equation may affect the sensitivity of the increasing trend signals. Low marginal values can lead to more frequent increasing trend signals in judgments, and high marginal values can result in less frequent increasing trend signals.
where is the DH price trend signal, is the hourly DH price, €/MWh, and is the average DH price of the future 24 h, €/MWh.
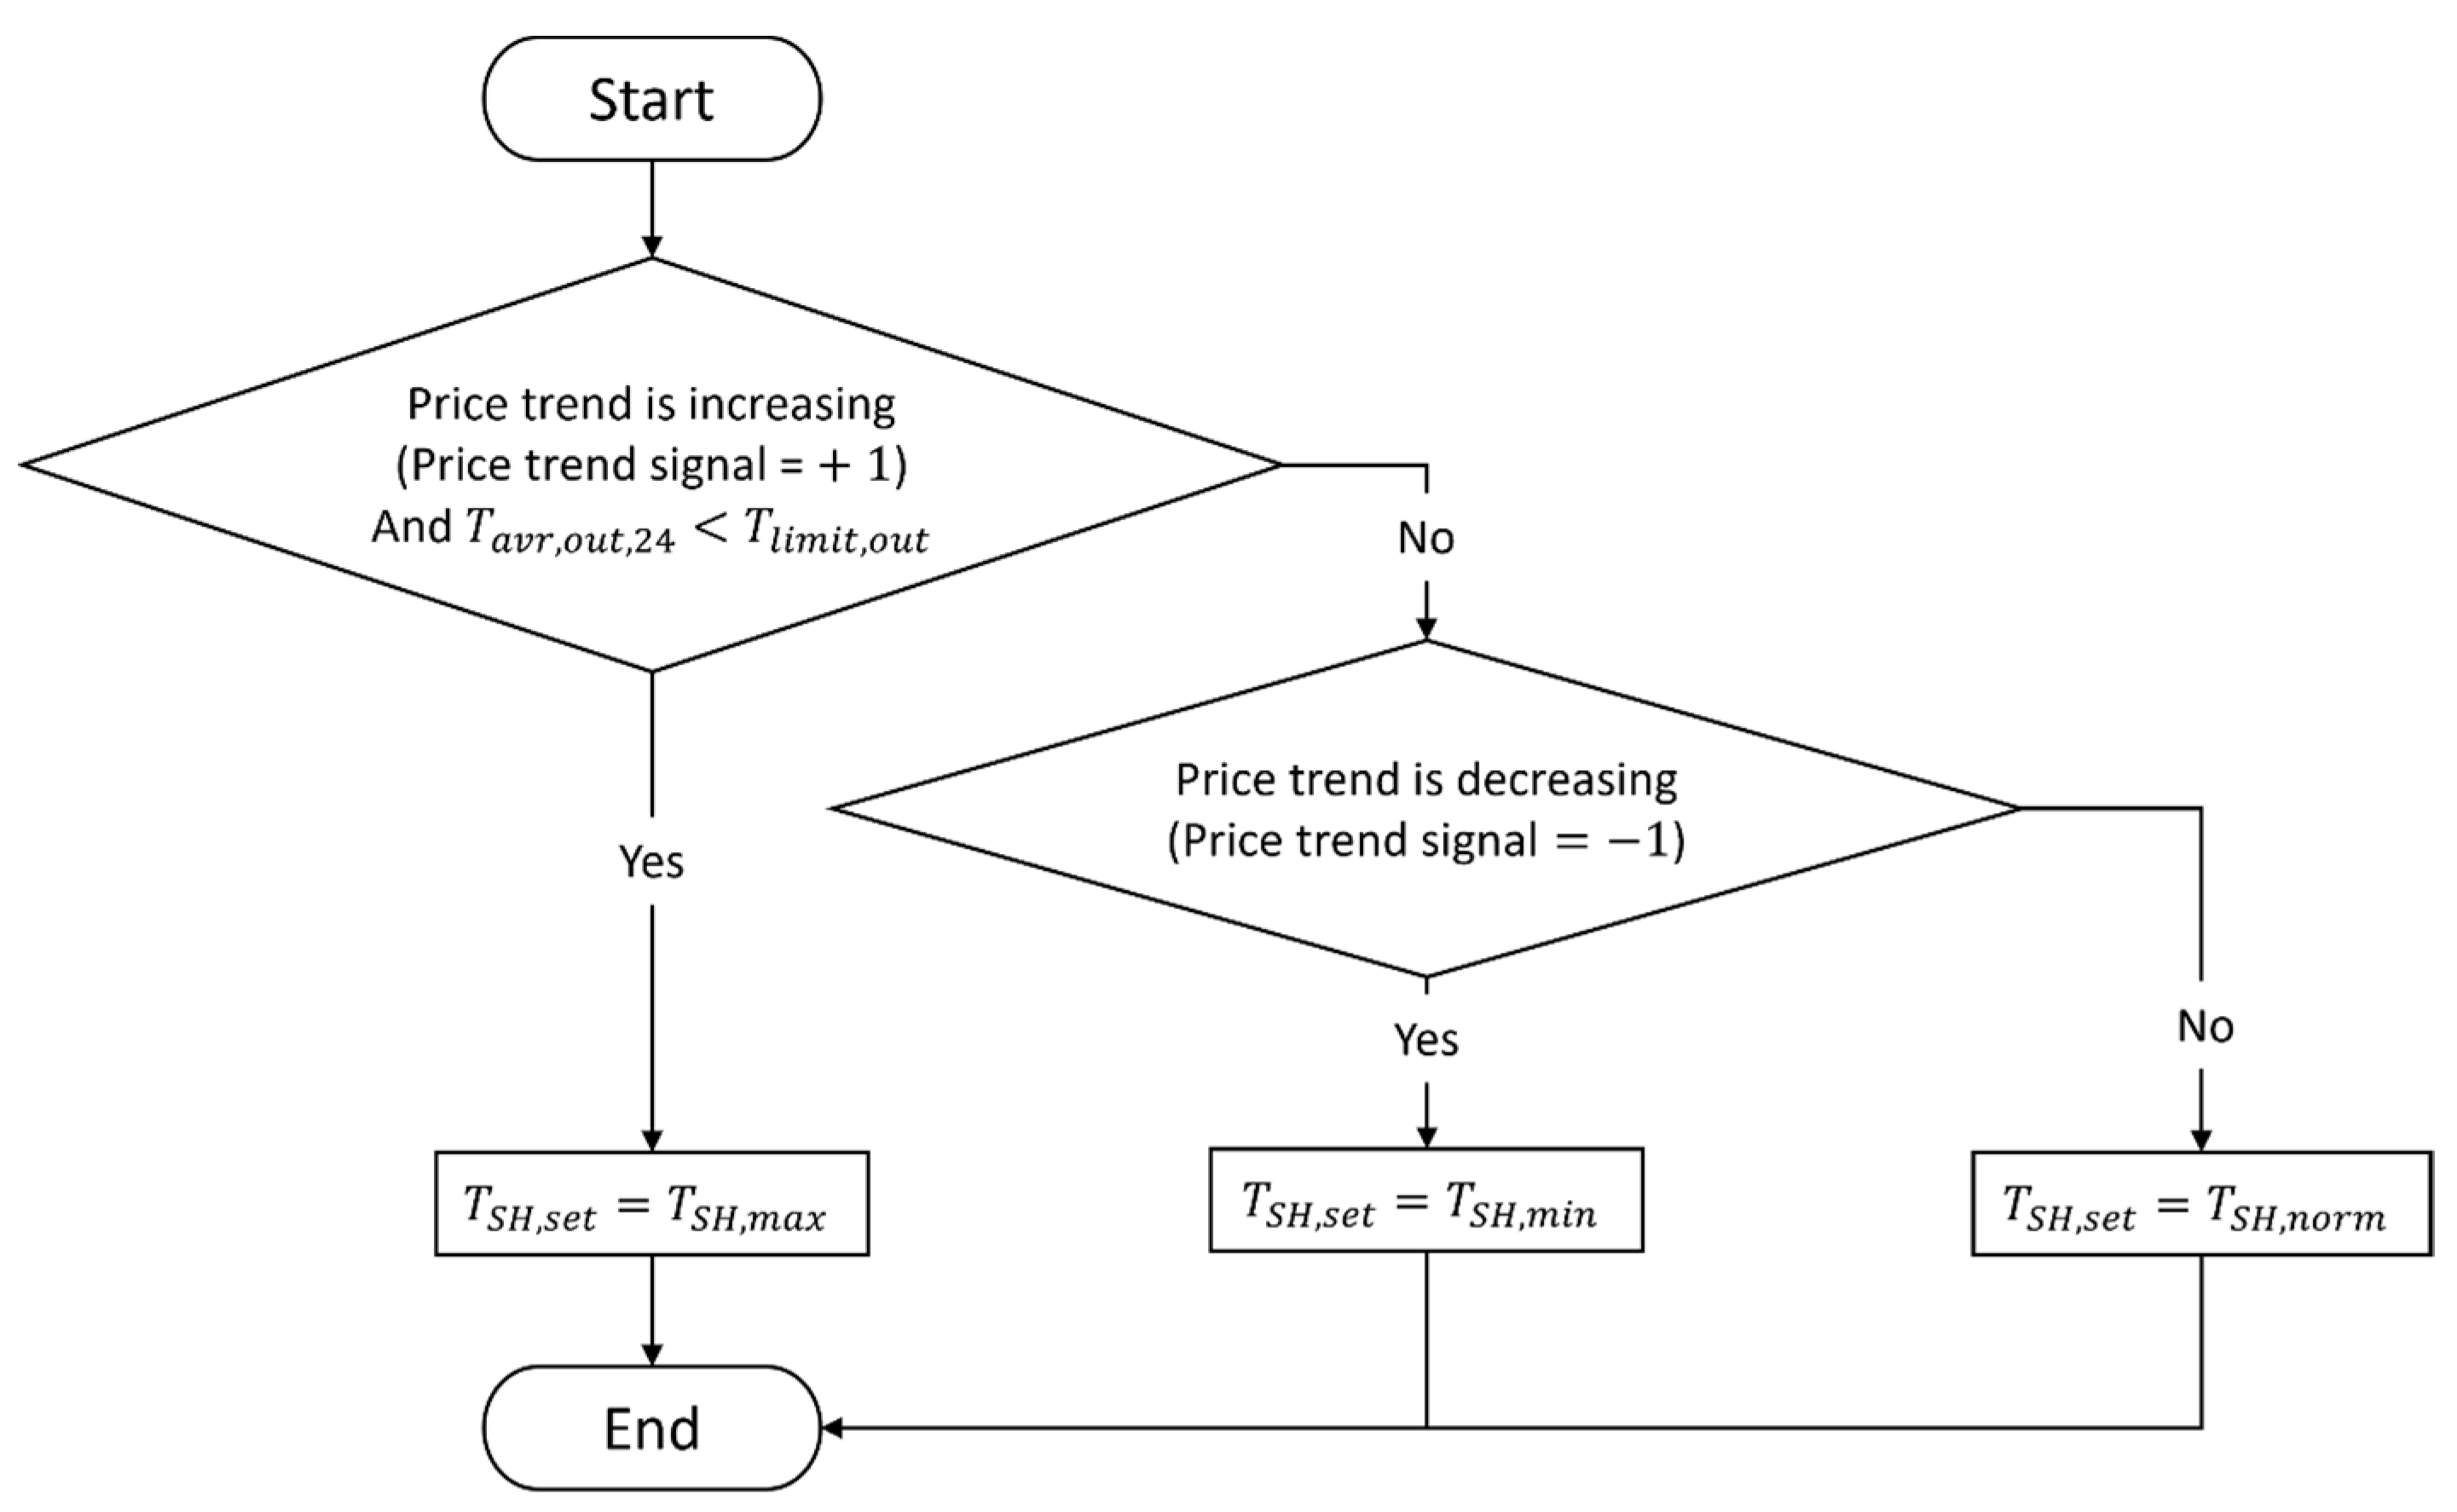
The indoor air temperature setpoint is determined based on the price trend signal and the outdoor air temperature. Figure 5 shows the flowchart of DR control of space heating. DR control was only used from October to April. When the price trend was increasing (i.e., the current price is lower than the future price) and the average outdoor temperature of the previous 24 h () was below the limiting outdoor temperature (, 0 °C [32]), the maximum indoor air temperature setpoint (, 22 °C) was used for preheating the building mass. For the decreasing price trend (i.e., the current price is higher than the future price), the minimum indoor air temperature setpoint (, 20 °C [43]) was used to reduce energy consumption during peak price periods. For the flat price trend, the normal indoor air temperature setpoint (, 21 °C) was used. The eventual temperature setpoints were processed by using the setpoint smoothing method [44] to avoid the rebound effect. The mass flow rate of the supply water to the heating panels was adjusted to maintain the required indoor air temperature.
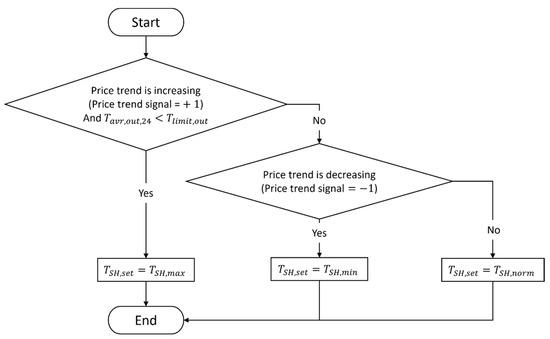
Figure 5.
Flowchart of DR control of space heating.
Electricity-Based DR Control
This electricity-based single price DR control algorithm considers only the hourly electricity price trend. The electricity price trend signal () was used for DR control. The was calculated by Equation (3). The temperature setpoints for space heating were assigned based on the procedure shown in Figure 5.
where is the electricity price trend signal, is the hourly electricity price, €/MWh, and is the average electricity price of the future 24 h, €/MWh.
2.5.2. Dual Price DR Control Algorithm
Minimum Heating Price Method
Unlike the single-price DR control algorithm, the dual-price DR control algorithm defines charging and discharging time based on both dynamic electricity and DH prices. In the minimum price method, the specific heating prices of GSHP () and DH () are used in the price trend signal processing. First, the hourly minimum specific heating price and the corresponding heating device efficiency were calculated by Equations (4) and (5), respectively. The average of hourly minimum specific heating price of the future 24 h is defined by Equation (6). The minimum heating price trend signal () was finally generated by Equation (7) for DR control of space heating. The values of +1, −1, and 0 represent the increasing, decreasing, and flat price trends, respectively. The temperature setpoints for space heating were assigned based on the procedure shown in Figure 5.
where is the hourly minimum specific heating price, €/MWh, is the efficiency of the heating device with the minimum specific heating price, is the average of hourly minimum specific heating price of the future 24 h, €/MWh, and is the minimum heating price trend signal.
Price Signal Summation Method
In the price signal summation method, first the electricity price trend signal () and the DH price trend signal () are calculated by Equations (2) and (3), respectively. Then, the dual energy price trend signal () is calculated by Equation (8), which is the sum of the two price trend signals. The is used for DR control of space heating and ventilation. The values of +1, −1, and 0 indicate the increasing, decreasing, and flat price trends, respectively. Once the was generated, the temperature setpoints for space heating were assigned based on the procedure shown in Figure 5.
where is the DH price trend signal, is the electricity price trend signal, and is the dual energy price trend signal.
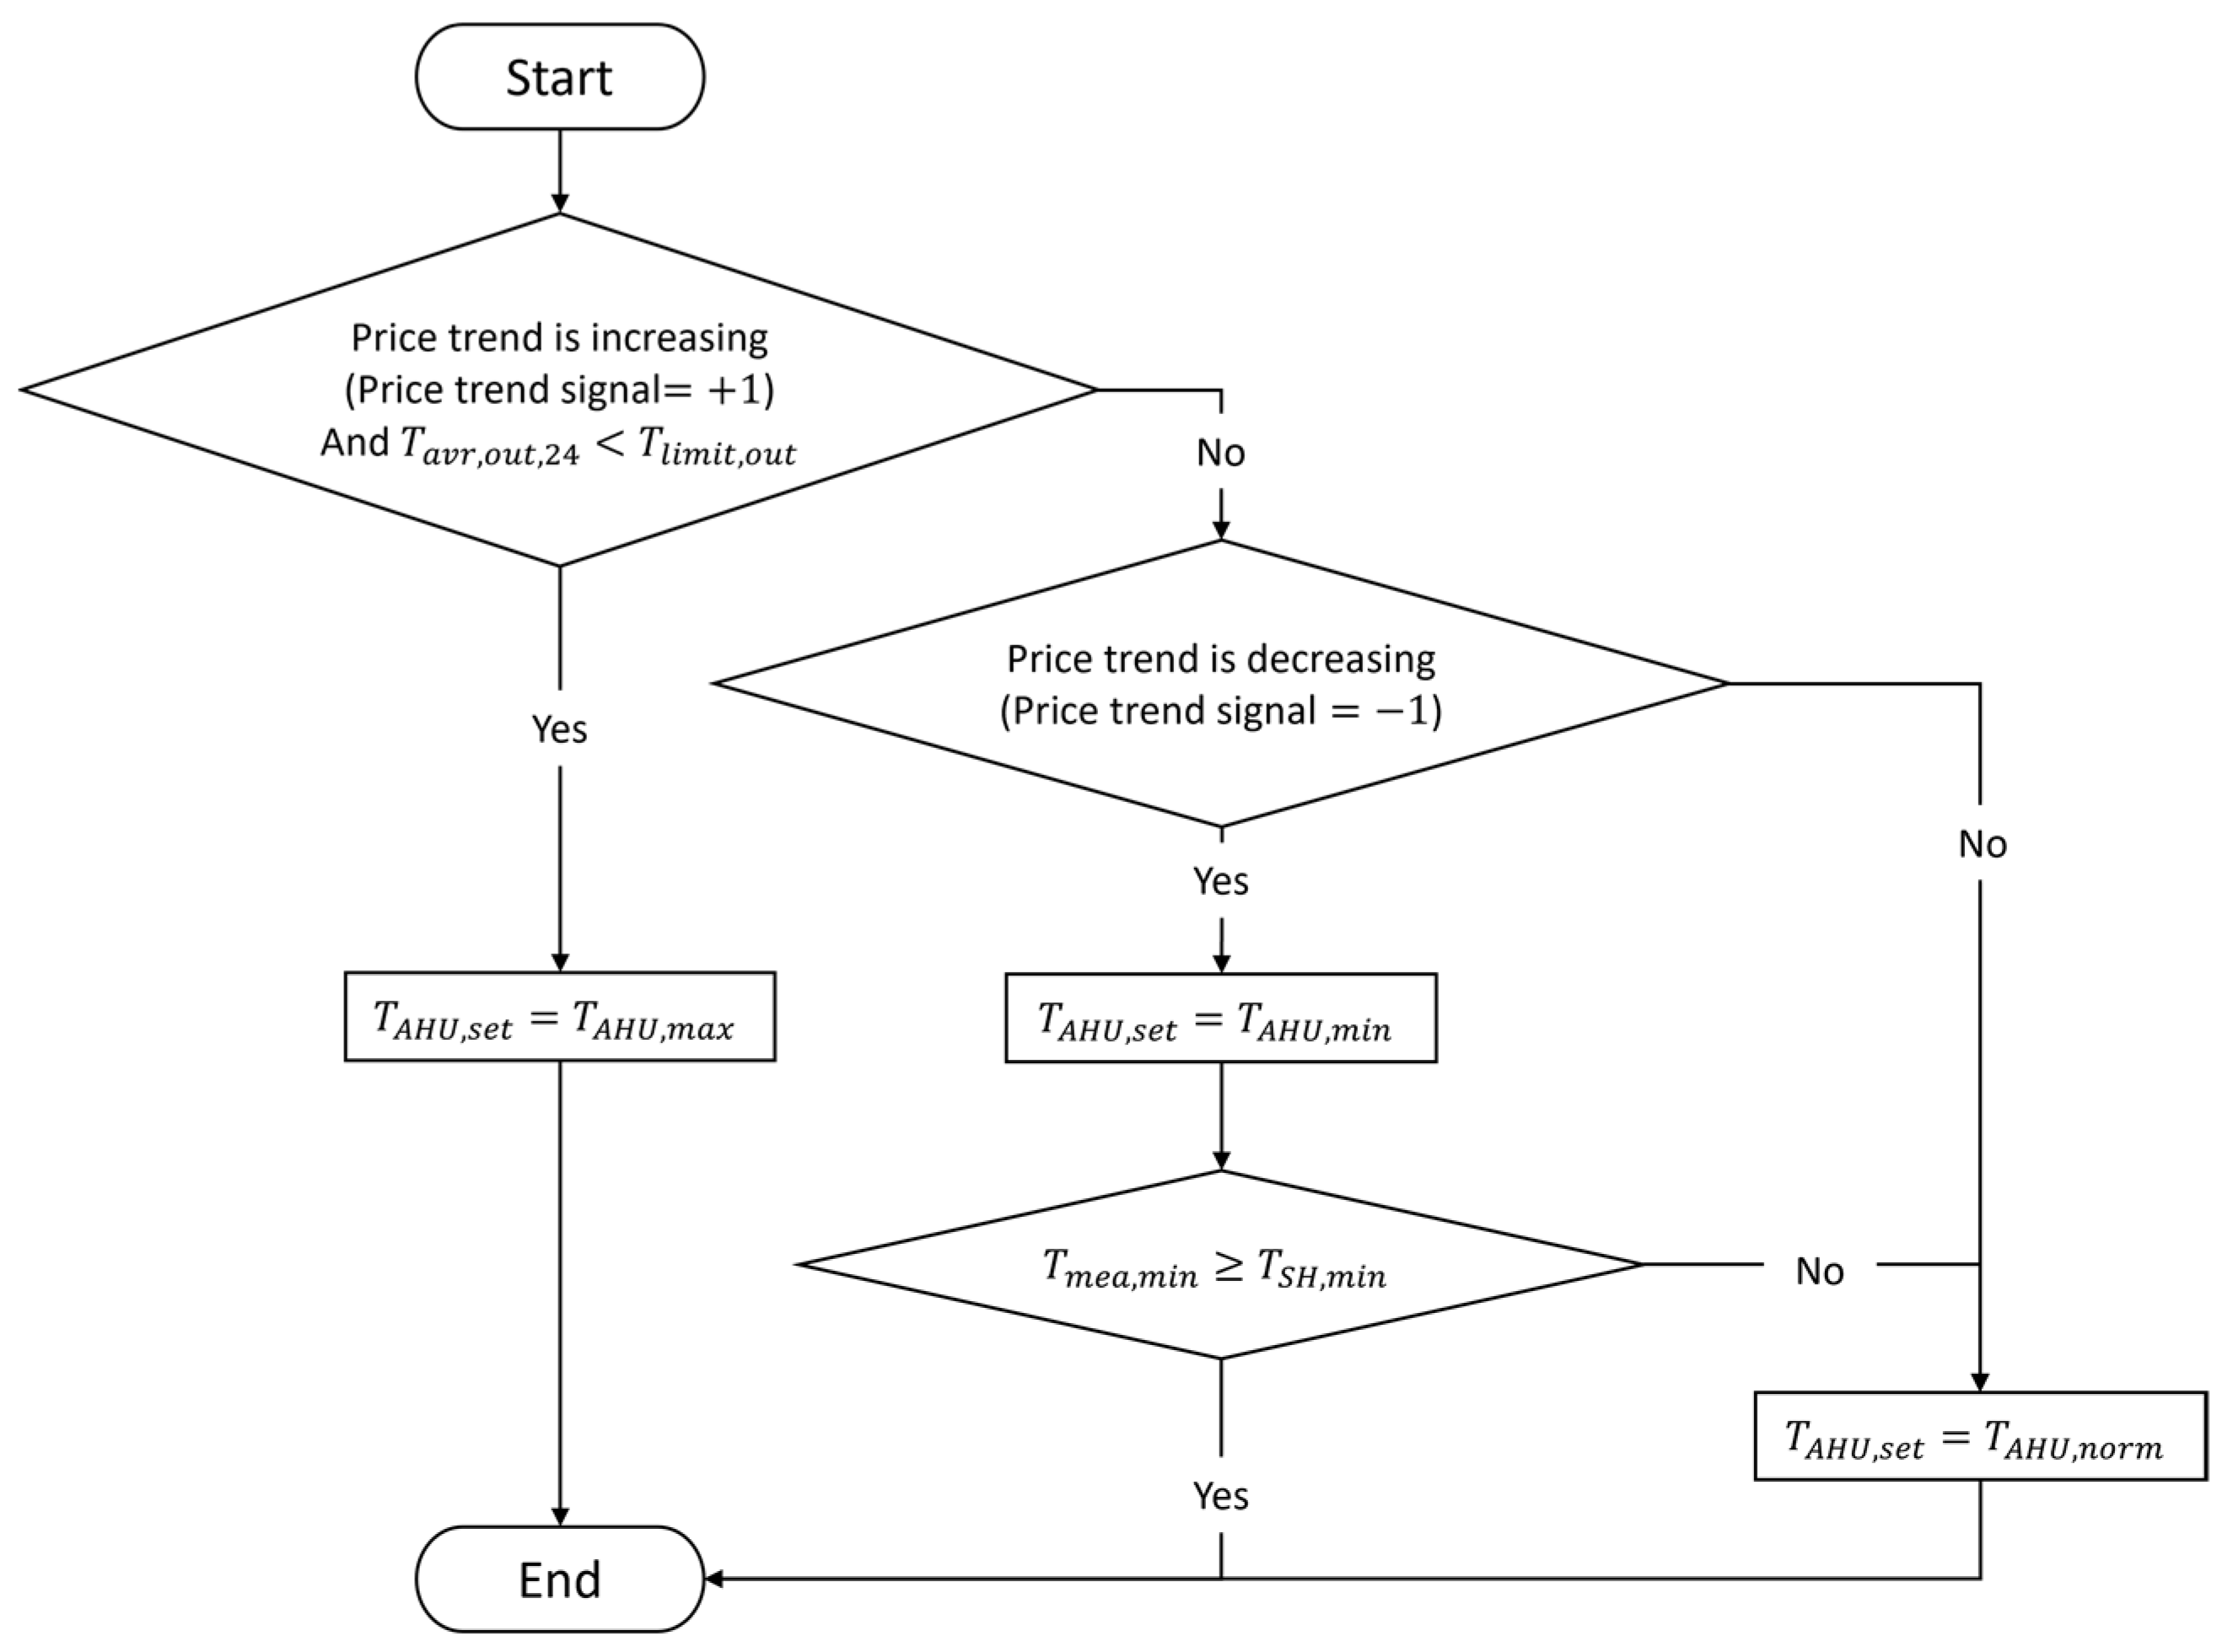
The dual price DR control using the price signal summation method was also used for regulating the supply air temperature in ventilation. The supply air temperature setpoint is controlled in a similar way as the indoor air temperature setpoint. Figure 6 shows the flowchart of DR control of ventilation. During the heating season (October to April), when the price trend was increasing and the average outdoor temperature of the previous 24 h () was below the limiting outdoor temperature (, 0 °C), the supply air temperature was set to the maximum supply air temperature setpoint (, 20 °C). For the decreasing price trend, the minimum supply air temperature setpoint (, 16 °C) was used. However, if the indoor air temperature of the coldest zone () was below the minimum indoor air temperature setpoint (, 20 °C), the supply air temperature was set back to the normal setpoint (, 18 °C). For the flat price trend, the normal supply air temperature setpoint was used. The mass flow rate of the supply of hot water to the AHU heating coils was adjusted to achieve the supply air temperature setpoints.
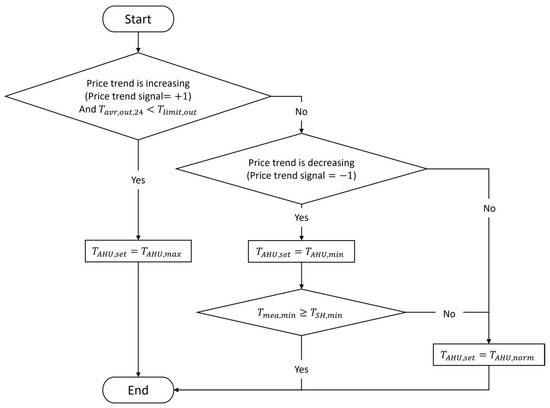
Figure 6.
Flowchart of DR control of ventilation.
2.6. Energy Tariffs
The energy cost only considers the electricity consumption and back-up DH consumptions in the hybrid GSHP system. The energy consumptions for fans, lighting, equipment, and DHW production were not considered in this study, as they were not affected by DR controls.
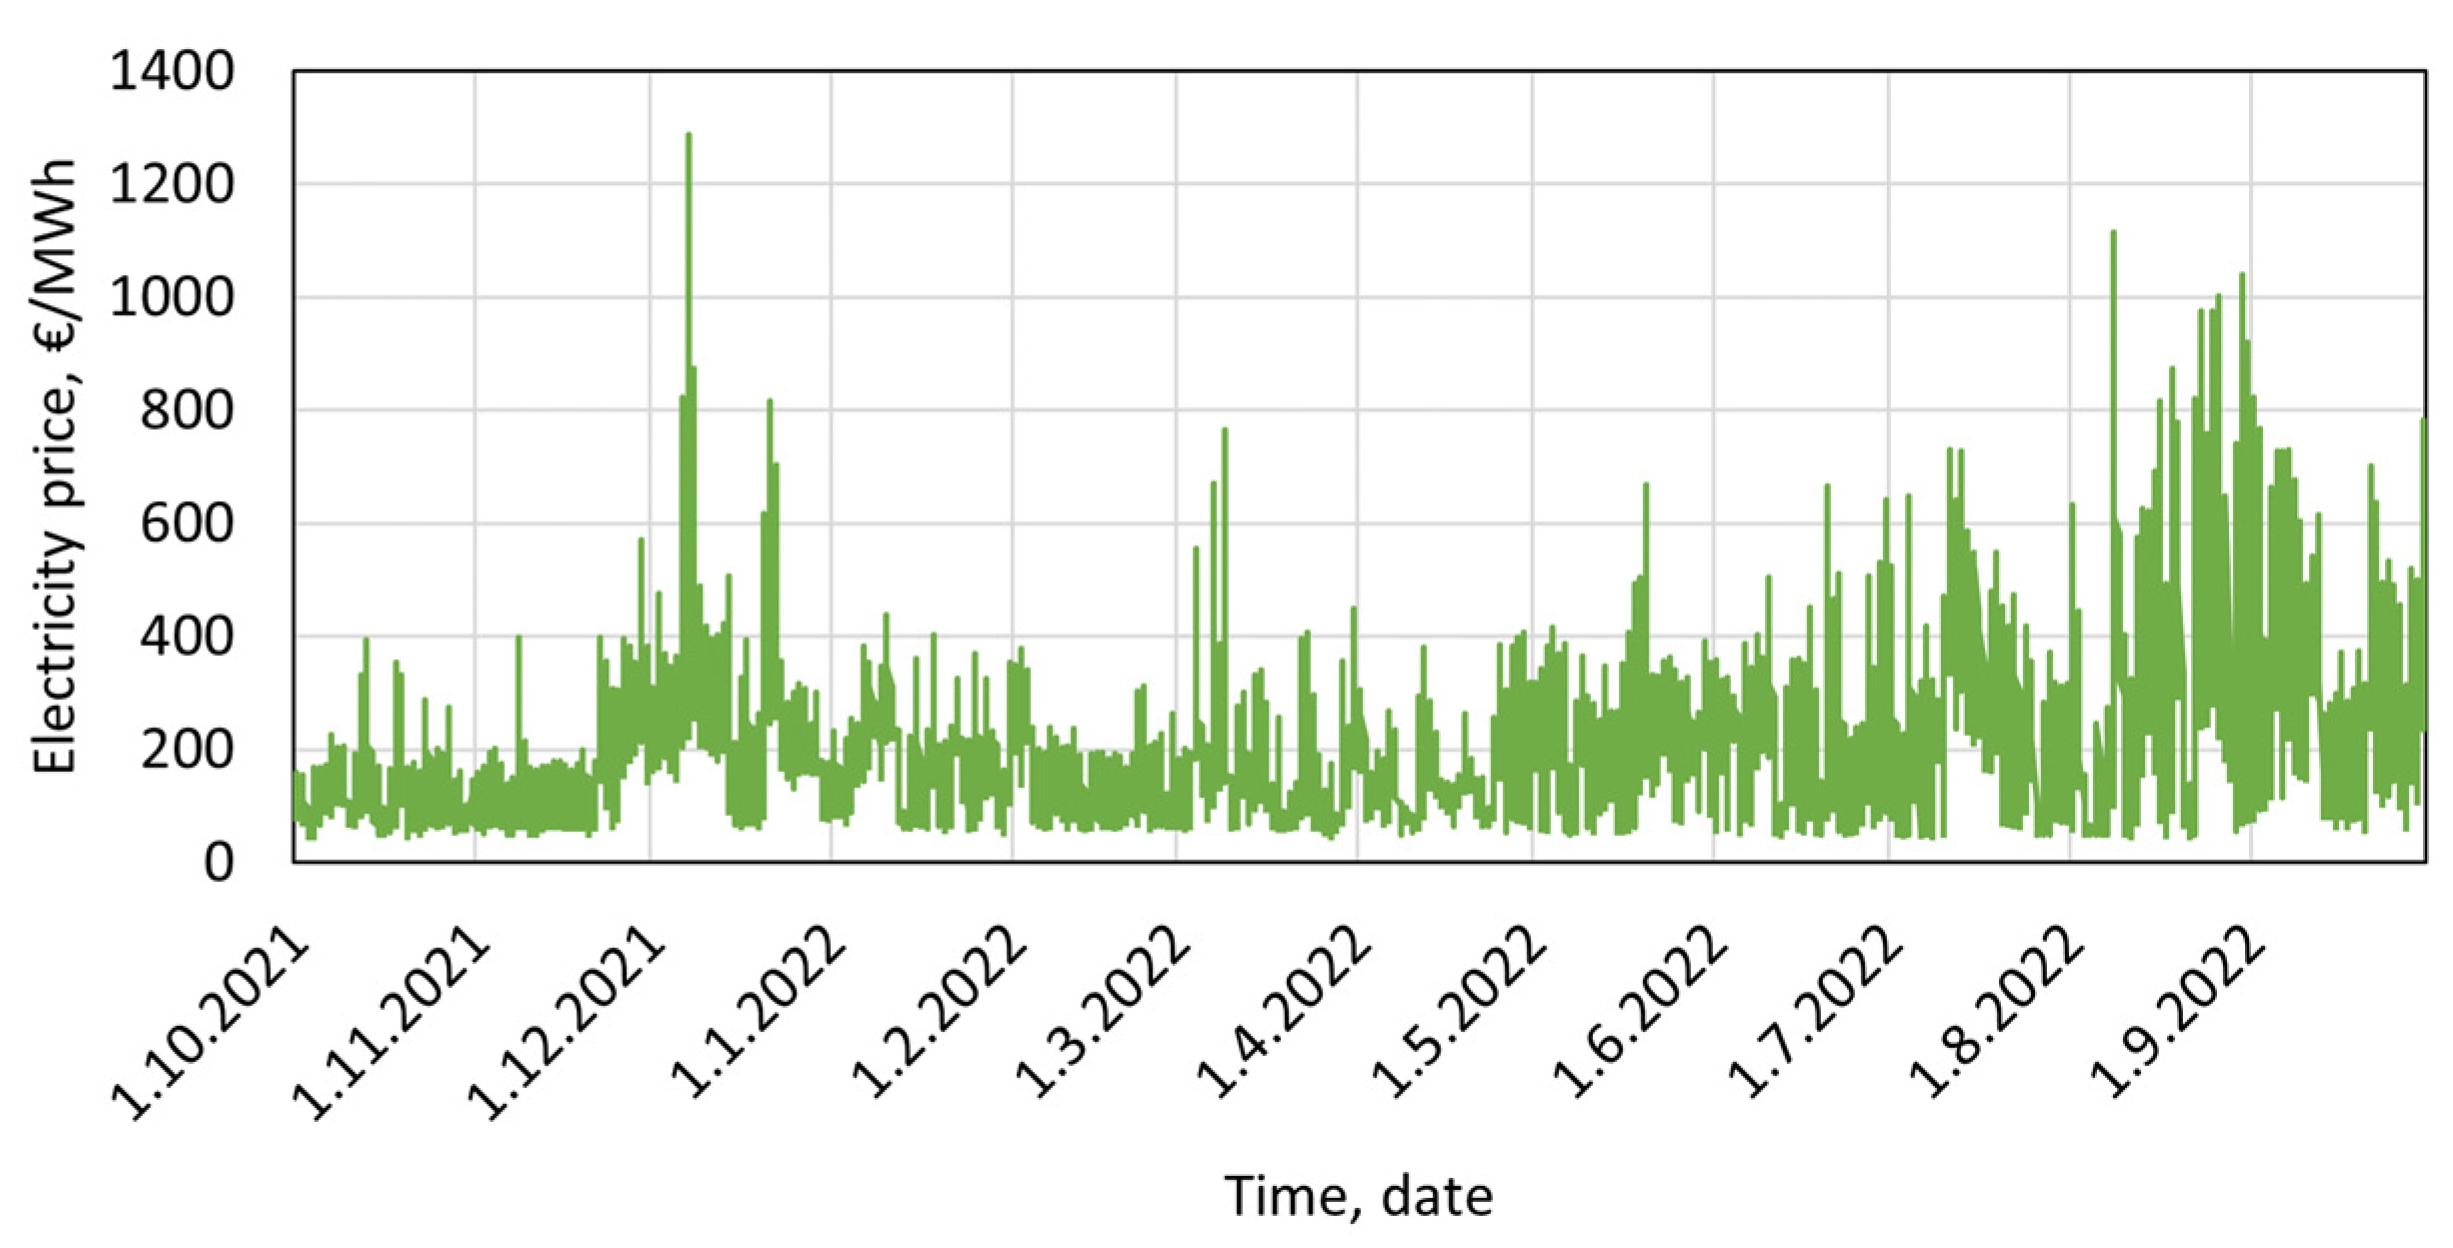
The cost of electricity comprises the cost of electricity energy and electricity power. The cost of electricity energy was determined by the hourly electricity consumption and the hourly electricity price. The hourly electricity price was the sum of the marginal price, the real-time electricity price from Nord Pool [45], and hourly distribution fee. Figure 7 shows the hourly electricity price including all taxes in the simulation period. The cost of electricity power was determined by the monthly basic fee and the sum of power fees for monthly peak electricity powers. The distribution and power fees of electricity are listed in Table 5.
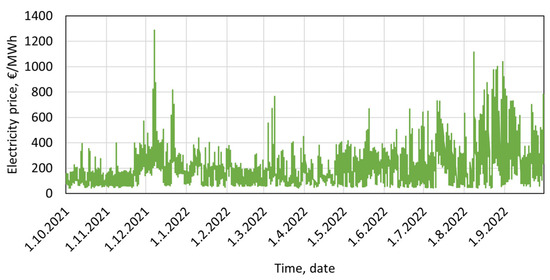
Figure 7.
Hourly electricity price (including all taxes) in the simulation year.

Table 5.
Distribution and power fees (including all taxes).
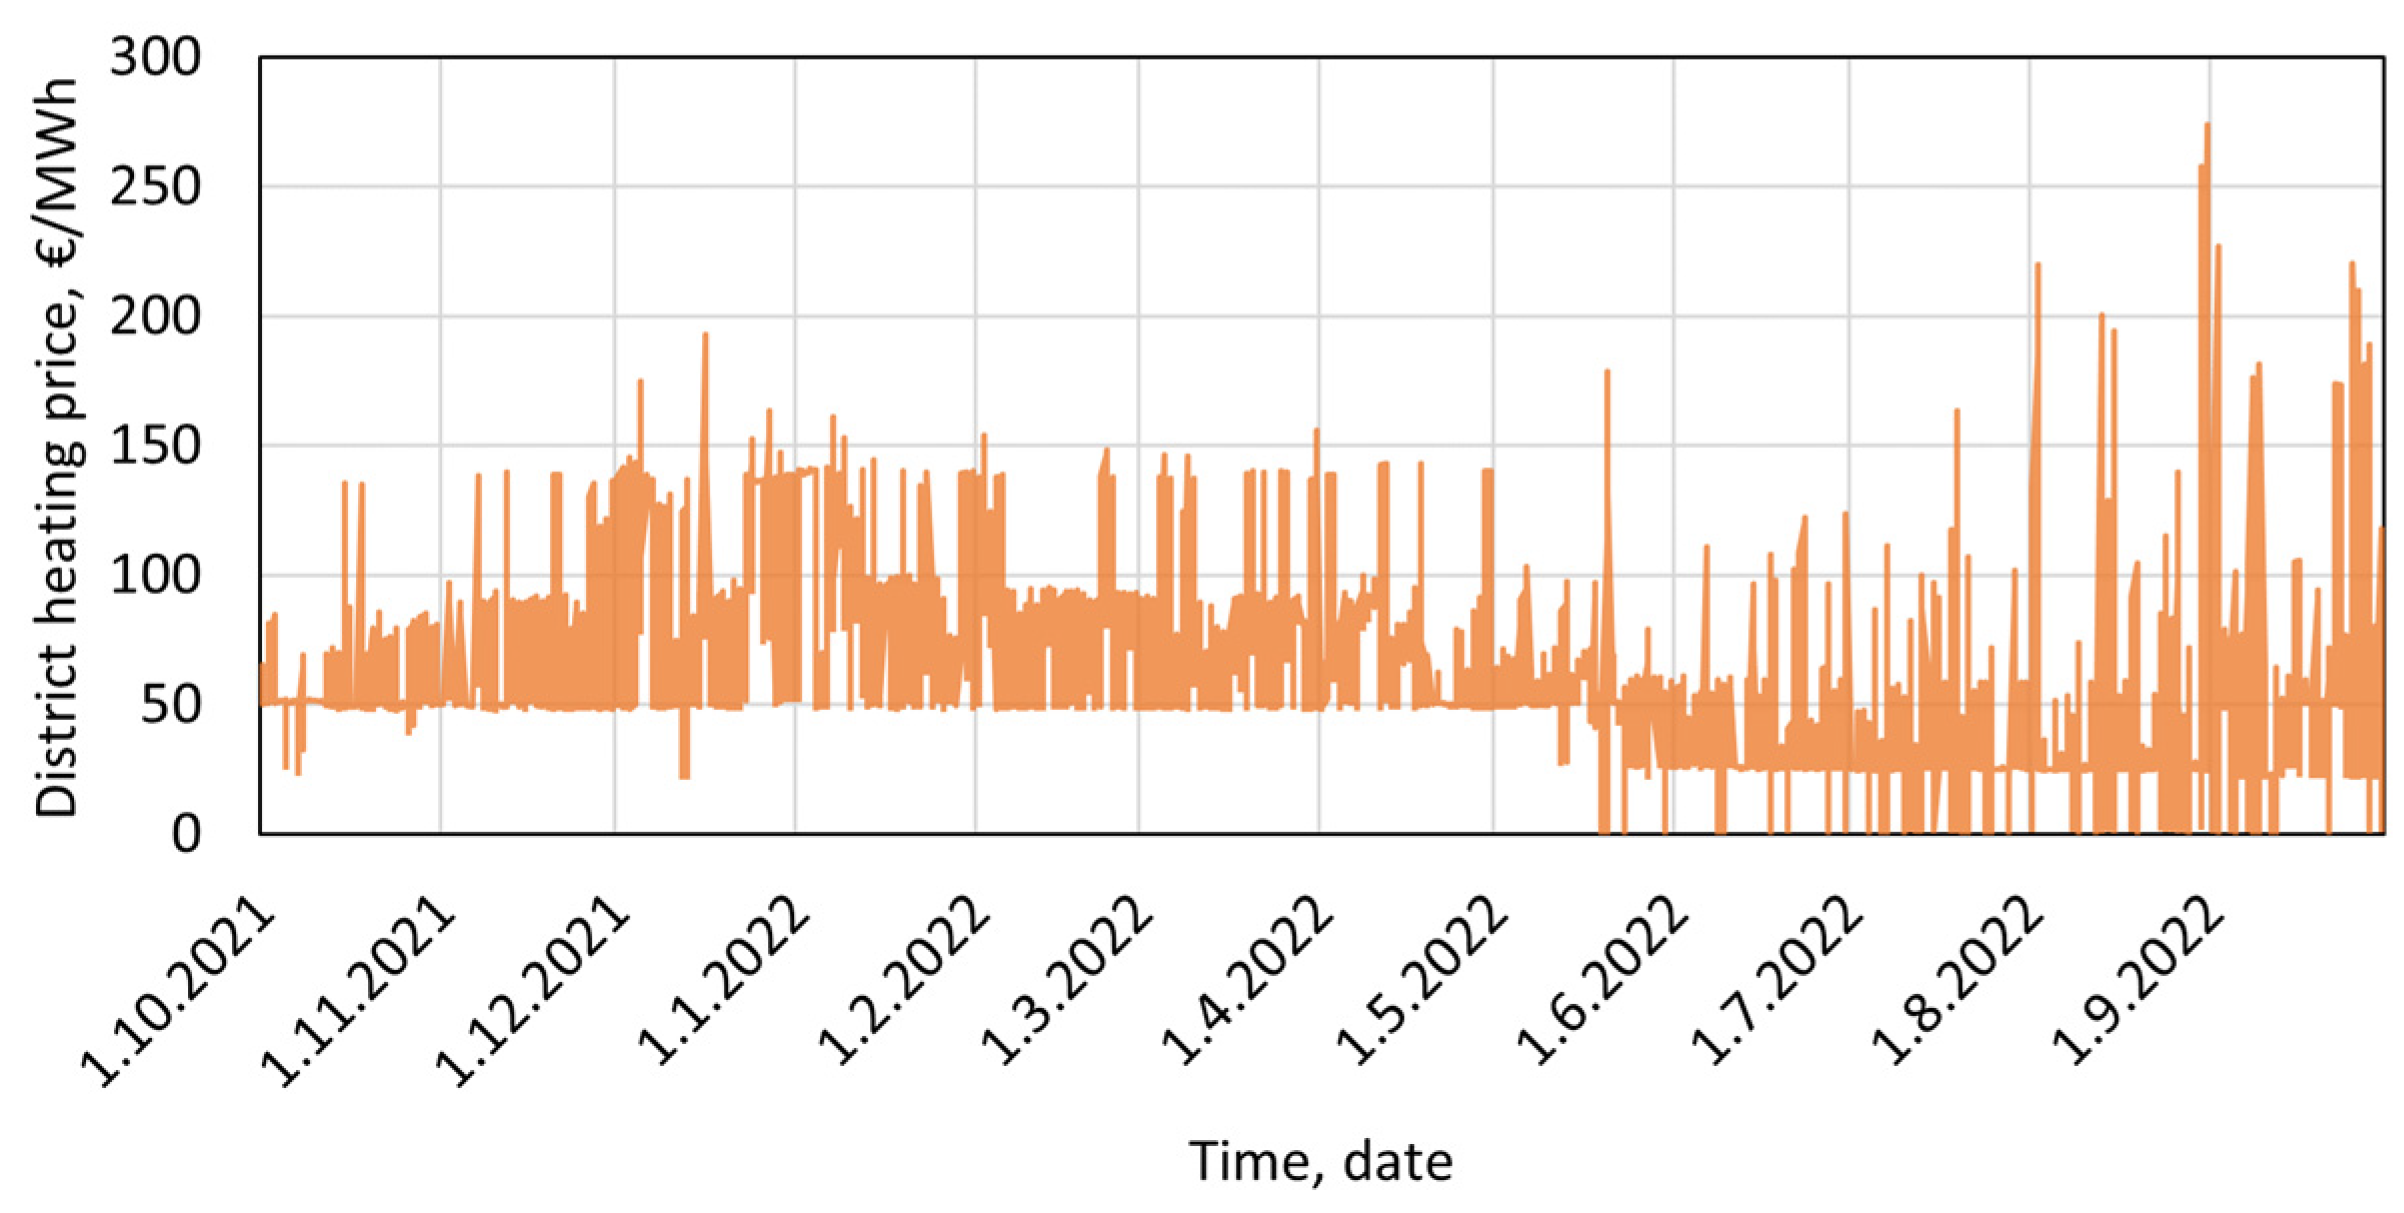
The cost of DH also consists of the cost of DH energy and DH power. The DH energy cost was determined by the hourly DH consumption and the hourly DH price. The hourly DH price was derived from the DH system in the study by Ju et al. [32]. The DH system consists of three combined heat and power (CHP) units, heat pumps employing the waste heat of sewage water, heat-only boilers, and a thermal energy storage (TES) unit. The heat production combination of each hour was generated from the EnergyPRO model of the DH system. The hourly DH price was determined by the marginal costs of DH productions. The pumping costs of the network and the network losses were also considered in the dynamic DH price. Additionally, to ensure the annual revenues of DH company are realistic by using the dynamic price, the marginal costs were scaled so that the weighted annual average DH price is equal to that of the DH company. More detailed information about the dynamic DH price can be found in [32]. Figure 8 shows the hourly DH price including all taxes in the simulation period. The DH power cost consists of the basic power fee and the peak power fee for the annual maximum used DH power. The details of distribution and power fees including all taxes are presented in Table 5.
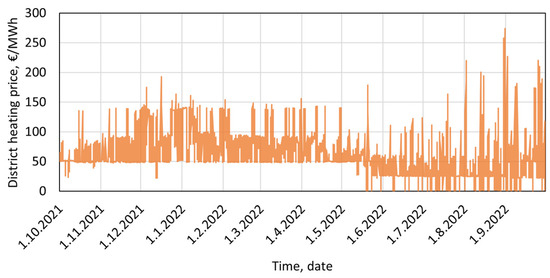
Figure 8.
Hourly DH price (including all taxes) in the simulation year.
2.7. Energy Flexibility Factors
Various flexibility indicators have been introduced for quantifying the operational flexibility in different building energy systems [14]. In this study, the indicator, known as the energy flexibility factor, is used to evaluate the flexibility achieved through DR control. The definition of the energy flexibility factor is based on the work by Ju et al. [44]. To quantify the flexibility of heating energy demand and the associated flexibilities of electricity and DH consumptions, three groups of energy flexibility factors are utilized. Each group comprises two components: the charging flexibility factor and the discharging flexibility factor.
The flexibility factors of total heating energy, and , are calculated by Equations (9) and (10), which quantify the charging and discharging flexibilities of the total heating energy from the GSHP and DH to the hot storage tank, respectively. The flexibility factors of DH consumption, and , are defined by Equations (11) and (12), which quantify the charging and discharging flexibilities of DH consumption in the hybrid GSHP system, respectively. The flexibility factors of electricity consumption, and , are defined by Equations (13) and (14), which quantify the charging and discharging flexibilities of electricity consumption in the hybrid GSHP system, respectively.
where , , are the charging flexibility factors of the total heating energy, DH consumption, and electricity consumption, respectively, , , and are the discharging flexibility factors of the total heating energy, DH consumption, and electricity consumption, respectively, , , and are the hourly heating power, hourly district heating consumption, and hourly electricity consumption, respectively, during the charging period in the DR case, kW, , , and are the hourly heating power, hourly DH consumption, and hourly electricity consumption, respectively, during the discharging period in the DR case, kW, , , and are the hourly heating power, hourly DH consumption, and hourly electricity consumption, respectively, in the reference case, kW, and is the number of hours of the heating season, h.
2.8. Simulation Period and Weather Data
The simulations period was 1 year from October 2021 to September 2022. The input weather data for simulation was the measured data from the nearest weather stations of the Finnish Meteorological Institute. The time resolution of the weather data is 1 h. The weather data includes relative humidity of air (%), dry-bulb temperature (°C), speed of wind (m/s), direction of wind (°), direct normal irradiance (W/m2), and diffuse horizontal irradiance (W/m2). During the simulation period, the minimum and the maximum outdoor temperature are −19.8 °C to 28.9 °C. The sum of heating degree days of the simulation period is 3681 based on a presumed indoor temperature of 17 °C [46].
2.9. Description of Simulated Cases
Table 6 presents 14 simulated cases, divided into two main groups: reference cases (first four cases) and DR cases (other cases). Cases GP-Ref21 and CE-PL-Ref21 are reference cases with a constant indoor heating setpoint of 21 °C. Case GP-Ref21 utilizes the GSHP-prioritized control algorithm for hybrid GSHP operation without power limits on the heat pump and DH. Case CE-PL-Ref21 implements the cost-effective control algorithm with power limits (60% of the full DH capacity and 80% of the full GSHP capacity), which was derived from the recommended case in the previous study [33]. The study found that power limits on DH and GSHP can significantly reduce the DH power costs and improve the GSHP long-term operation security for the studied hybrid GSHP system. Cases GP-Ref20 and CE-PL-Ref20 mirror cases GP-Ref21 and CE-PL-Ref21, respectively, but with a constant indoor heating setpoint of 20 °C.

Table 6.
Descriptions of simulated cases.
The DR cases all use the cost-effective control algorithm with power limitations for optimizing the hybrid GSHP system operation. These cases can be grouped by two different marginal prices: 15 €/MWh for and 75 €/MWh. For each marginal value, there are four cases (referred to as DRS) applying DR to space heating and one case (referred to as DRSV) applying DR to both space and ventilation heating. Cases SDRS-DH-15 and SDRS-DH-75 use the single-price DR control algorithm based on the dynamic DH price. Cases SDRS-Elec-15 and SDRS-Elec-75 use the single-price DR control algorithm based on the dynamic electricity price. Cases DDRS-Min-15 and DDRS-Min-75 employ the dual-price DR control algorithm using the minimum heating price method. Cases DDRS-Sum-15 and DDRS-Sum-75 use the dual-price DR control algorithm based on the price signal summation method. Cases DDRSV-Sum-15 and DDRSV-Sum-75 apply the dual-price DR control algorithm based on the price signal summation method to both space heating and ventilation heating.
3. Results
3.1. Power and Energy Consumptions
Table 7 lists the peak heating power for the studied cases. In the reference case GP-Ref21, with a constant indoor air heating setpoint of 21 °C, the peak total heating power is 2158 kW, consisting of 824 kW from the GSHP and 1334 kW from the DH. When the indoor air heating setpoint is reduced to 20 °C (case GP-Ref20), the peak total heating power decreases by 6.8%, compared to the reference case GP-Ref21. In cases CE-PL-Ref21, the power limitations on GSHP and DH reduce the peak total heating power by 20.1%, compared to the reference case GP-Ref21. Similarly, in cases CE-PL-Ref21, these power limitations reduce the peak total heating power by 13.9 percentage points compared to the reference case GP-Ref20. In the DR cases, the peak district heating power is restricted to 1000 kW. However, the peak GSHP heating power slightly variates from case to case, leading to differences in peak total heating power. This could be due to the dynamic outlet brine temperature from the borehole field varying with the charging and discharging behaviors under different DR controls.

Table 7.
Peak heating power.
Table 8 shows the supplied annual heating and cooling energy to the hot and cold tanks, respectively. The reference case GP-Ref21 shows an annual heating energy of 3413 MWh and an annual cooling energy of 1332 MWh. The annual heating energy is reduced by 0.4% in case CE-PL-Ref21 due to the power limitations on GSHP and district heating. When the indoor heating setpoint is decreased to 20 °C, the annual heating energy is reduced by 11.5% in the reference case GP-Ref20 without power limitations and by 11.8% in the reference case CE-PL-Ref20 with power limitations compared to the reference case GP-Ref21. For the DR cases, the higher marginal value leads to more heating energy reduction. However, the maximum decrease in annual total heating energy for the DR cases is less than the reference case CE-PL-Ref20. The maximum reduction of annual heating demand is 6.1%, which occurs in case DDRS-Sum-75 using the dual-price DR control based on the price signal summation method with a high marginal value.

Table 8.
Annual heating and cooling energy.
It is noteworthy that the annual cooling is also affected by changing the indoor heating setpoint during the heating season. The cooling demand in the heating season can be attributed to high internal heat gains in the building’s interior zones during occupied periods. Compared to the reference case GP-Ref21, when the indoor heating setpoint is decreased to 20 °C in case GP-Ref20, the annual cooling energy is reduced by 3.3%. In cases CE-PL-Ref21 and CE-PL-Ref20, the power limitations hardly affect the annual cooling energy. However, the different DR control algorithms result in variable relative differences in annual cooling energy compared to the reference case GP-Ref21, ranging from −2.6% to 1.0%. The effect on the annual cooling energy may be due to the number of cooling hours during the heating season impacted by the changing of the indoor heating setpoint.
Table 9 shows the annual electricity and DH consumptions. The GSHP is the primary contributor to the electricity consumption of the hybrid GSHP system, accounting for 81.7% of the total electricity use in the reference case (GP-Ref-21). Consequently, even though the electricity consumption of the pumps and chiller is also affected by cost-effective control and DR control, the overall variation in electricity consumption among other cases is primarily driven by changes in the electricity consumption of GSHP.

Table 9.
Annual electricity and DH consumptions.
In terms of total electricity and DH consumptions, compared to the reference case GP-Ref21, the cost-effective hybrid GSHP control algorithm with limited DH and GSHP power reduces the annual electricity consumption by 24.0% while increasing the DH consumption by 340% in case CE-PL-Ref21. In case CE-PL-Ref20, where the indoor heating setpoint is lowered to 20 °C, both electricity and DH consumption are reduced compared to case CE-PL-Ref21. Specifically, electricity consumption decreases by 6.0 percentage points, while DH consumption drops significantly by 54.0 percentage points.
The DR control algorithms perform differently on electricity and DH consumptions. For example, compared to the reference case CE-PL-Ref21, in case SDRS-DH-15, the electricity consumption is reduced by 2.2 percentage points. In contrast, the DH consumption is increased by 8.0 percentage points. When using a high marginal value, the DR control algorithms tend to result in less electricity and DH consumptions. The minimum electricity consumption among all the DR cases occurs in case SDRS-DH-75, which is reduced by 3.6 percentage points compared to the reference case CE-PL-Ref21. The minimum DH consumption occurs in case DDRS-Min-75, which is reduced by 64.0 percentage points compared to the reference case CE-PL-Ref21.
3.2. Energy Costs
Table 10 shows the annual energy costs for all studied cases and the relative cost savings compared to reference case GP-Ref21. Compared to reference case GP-Ref21, case CE-PL-Ref21, using the cost-effective hybrid GSHP control algorithm with limited DH and GSHP power, can already reduce the total energy costs by 6.4%. The maximum cost savings in the total energy costs is 12.9%, which appears in case CE-PL-Ref20 with a constant indoor heating setpoint of 20 °C instead of in the DR cases.

Table 10.
Annual energy costs.
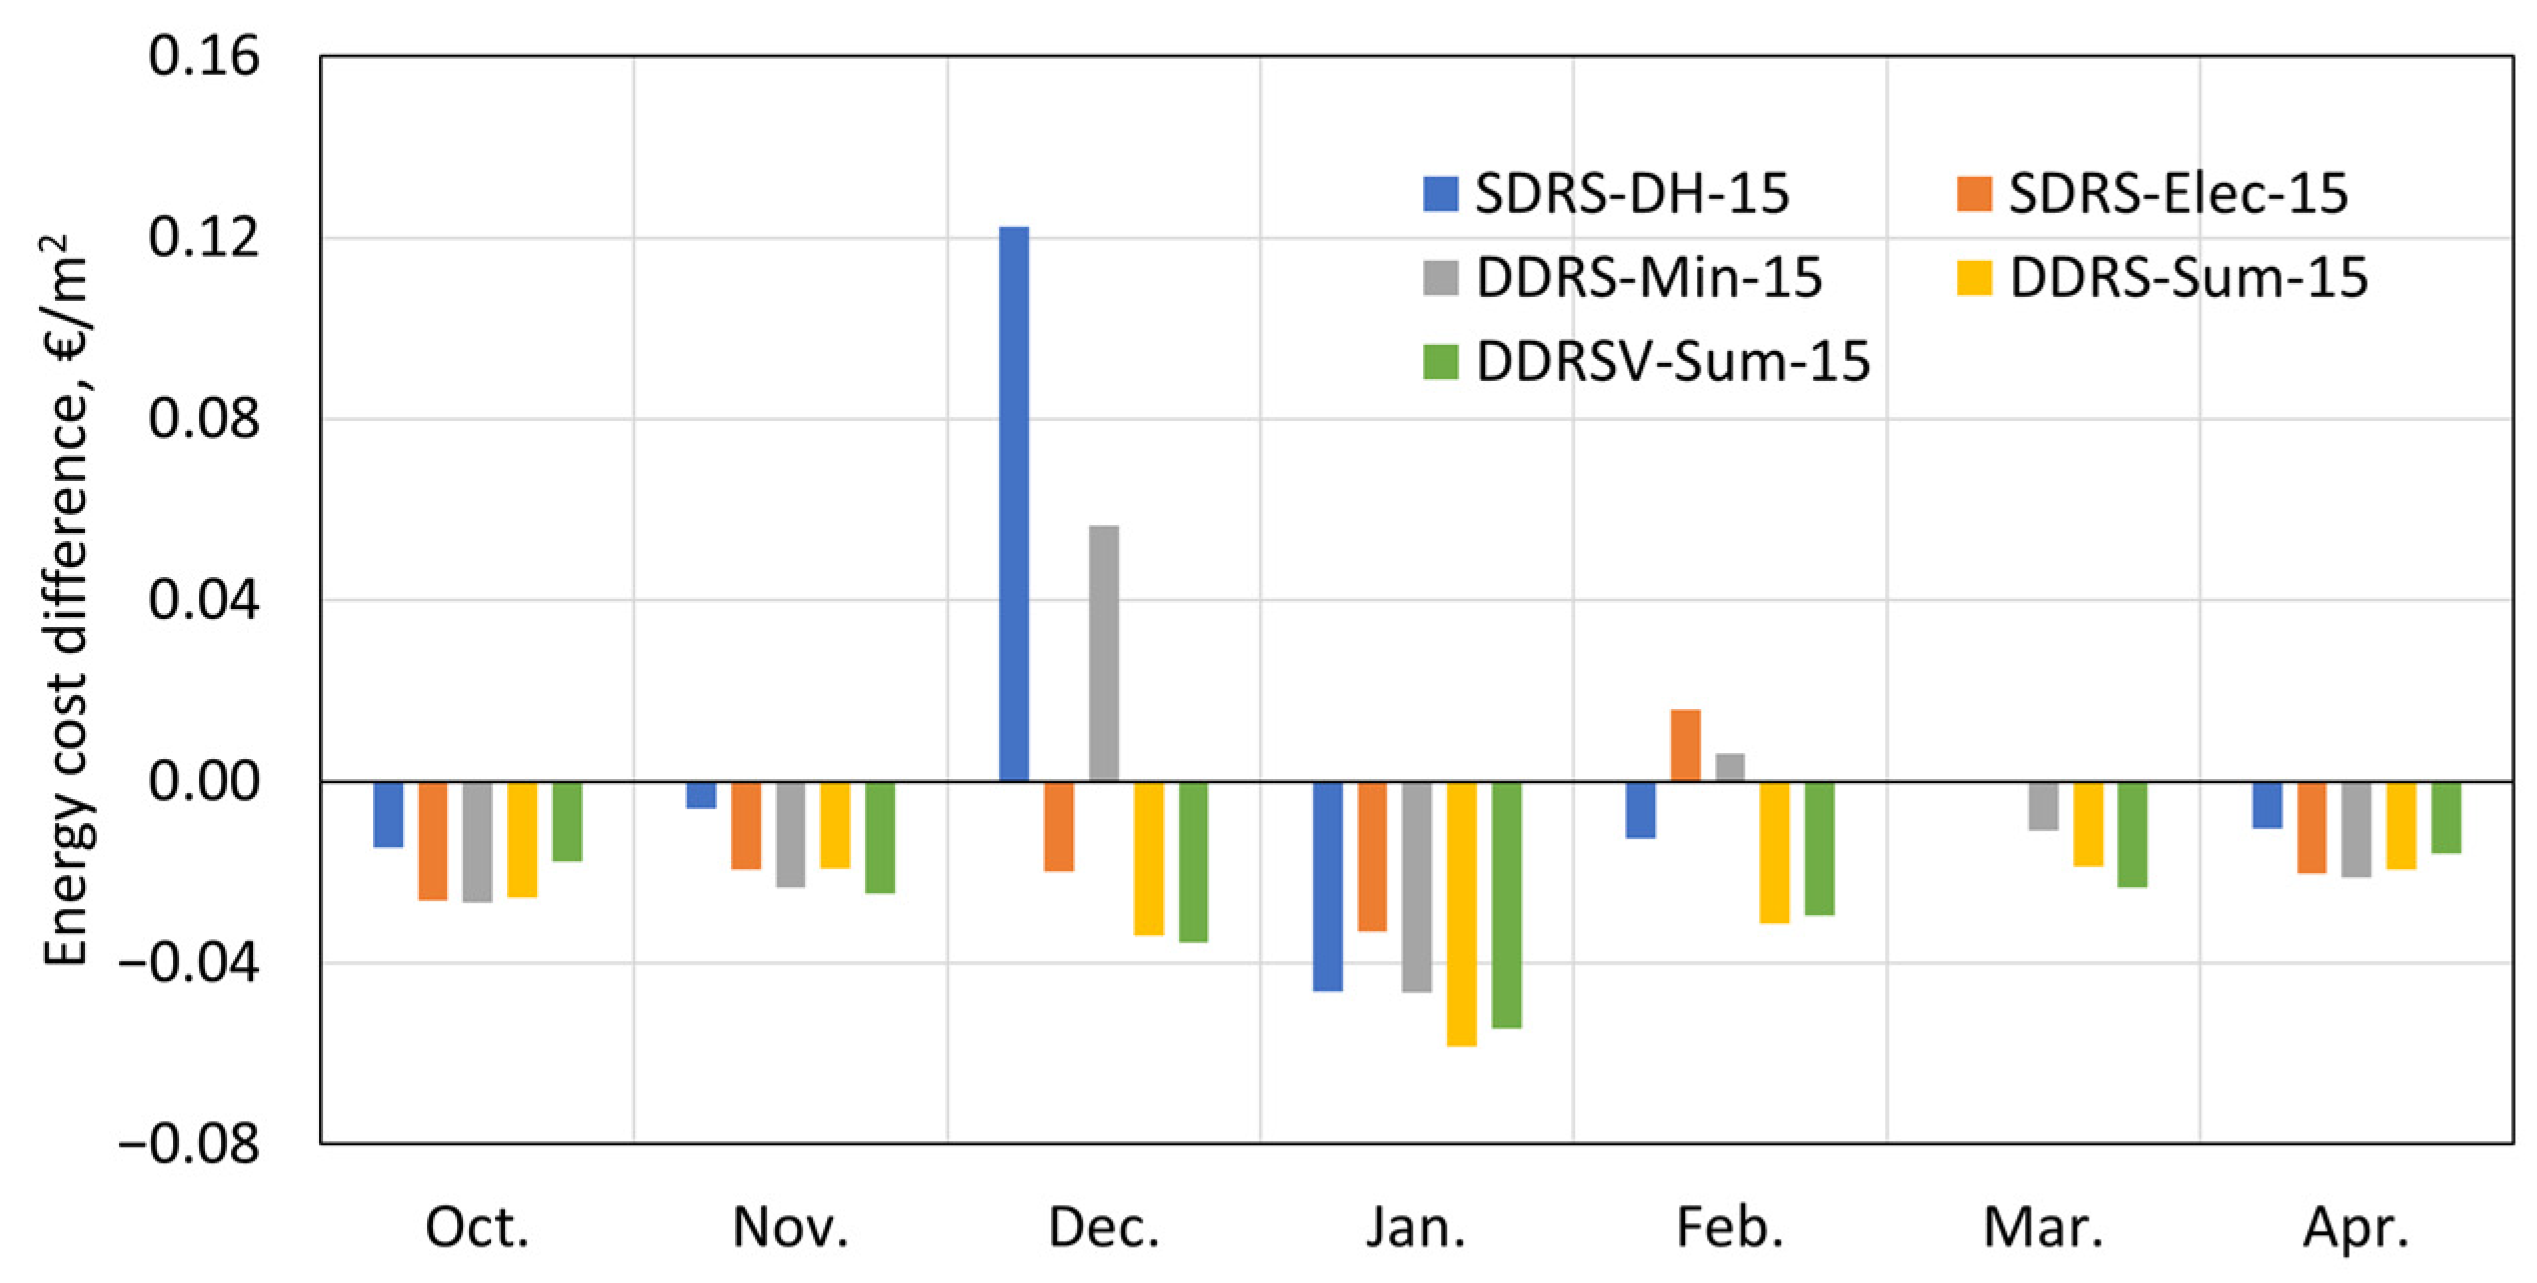
In the DR cases, due to the power limitations, the power costs of DH and electricity remain almost unchanged compared to the reference case CE-PL-Ref21. The difference in annual total energy costs is mainly attributed to the difference in consumed energy costs during the heating season. Figure 9 shows the difference in consumed energy cost (excluding power cost) between the DR cases with a low marginal value and the reference case CE-PL-Ref21. The maximum energy cost savings appear in different DR control cases month by month.
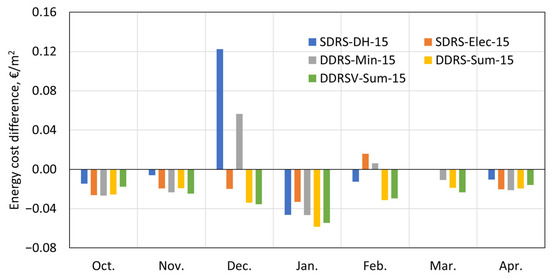
Figure 9.
Differences in monthly consumed energy costs (excluding power costs) between DR cases with a marginal value of 15 €/MWh and the reference case CE-PL-Ref21.
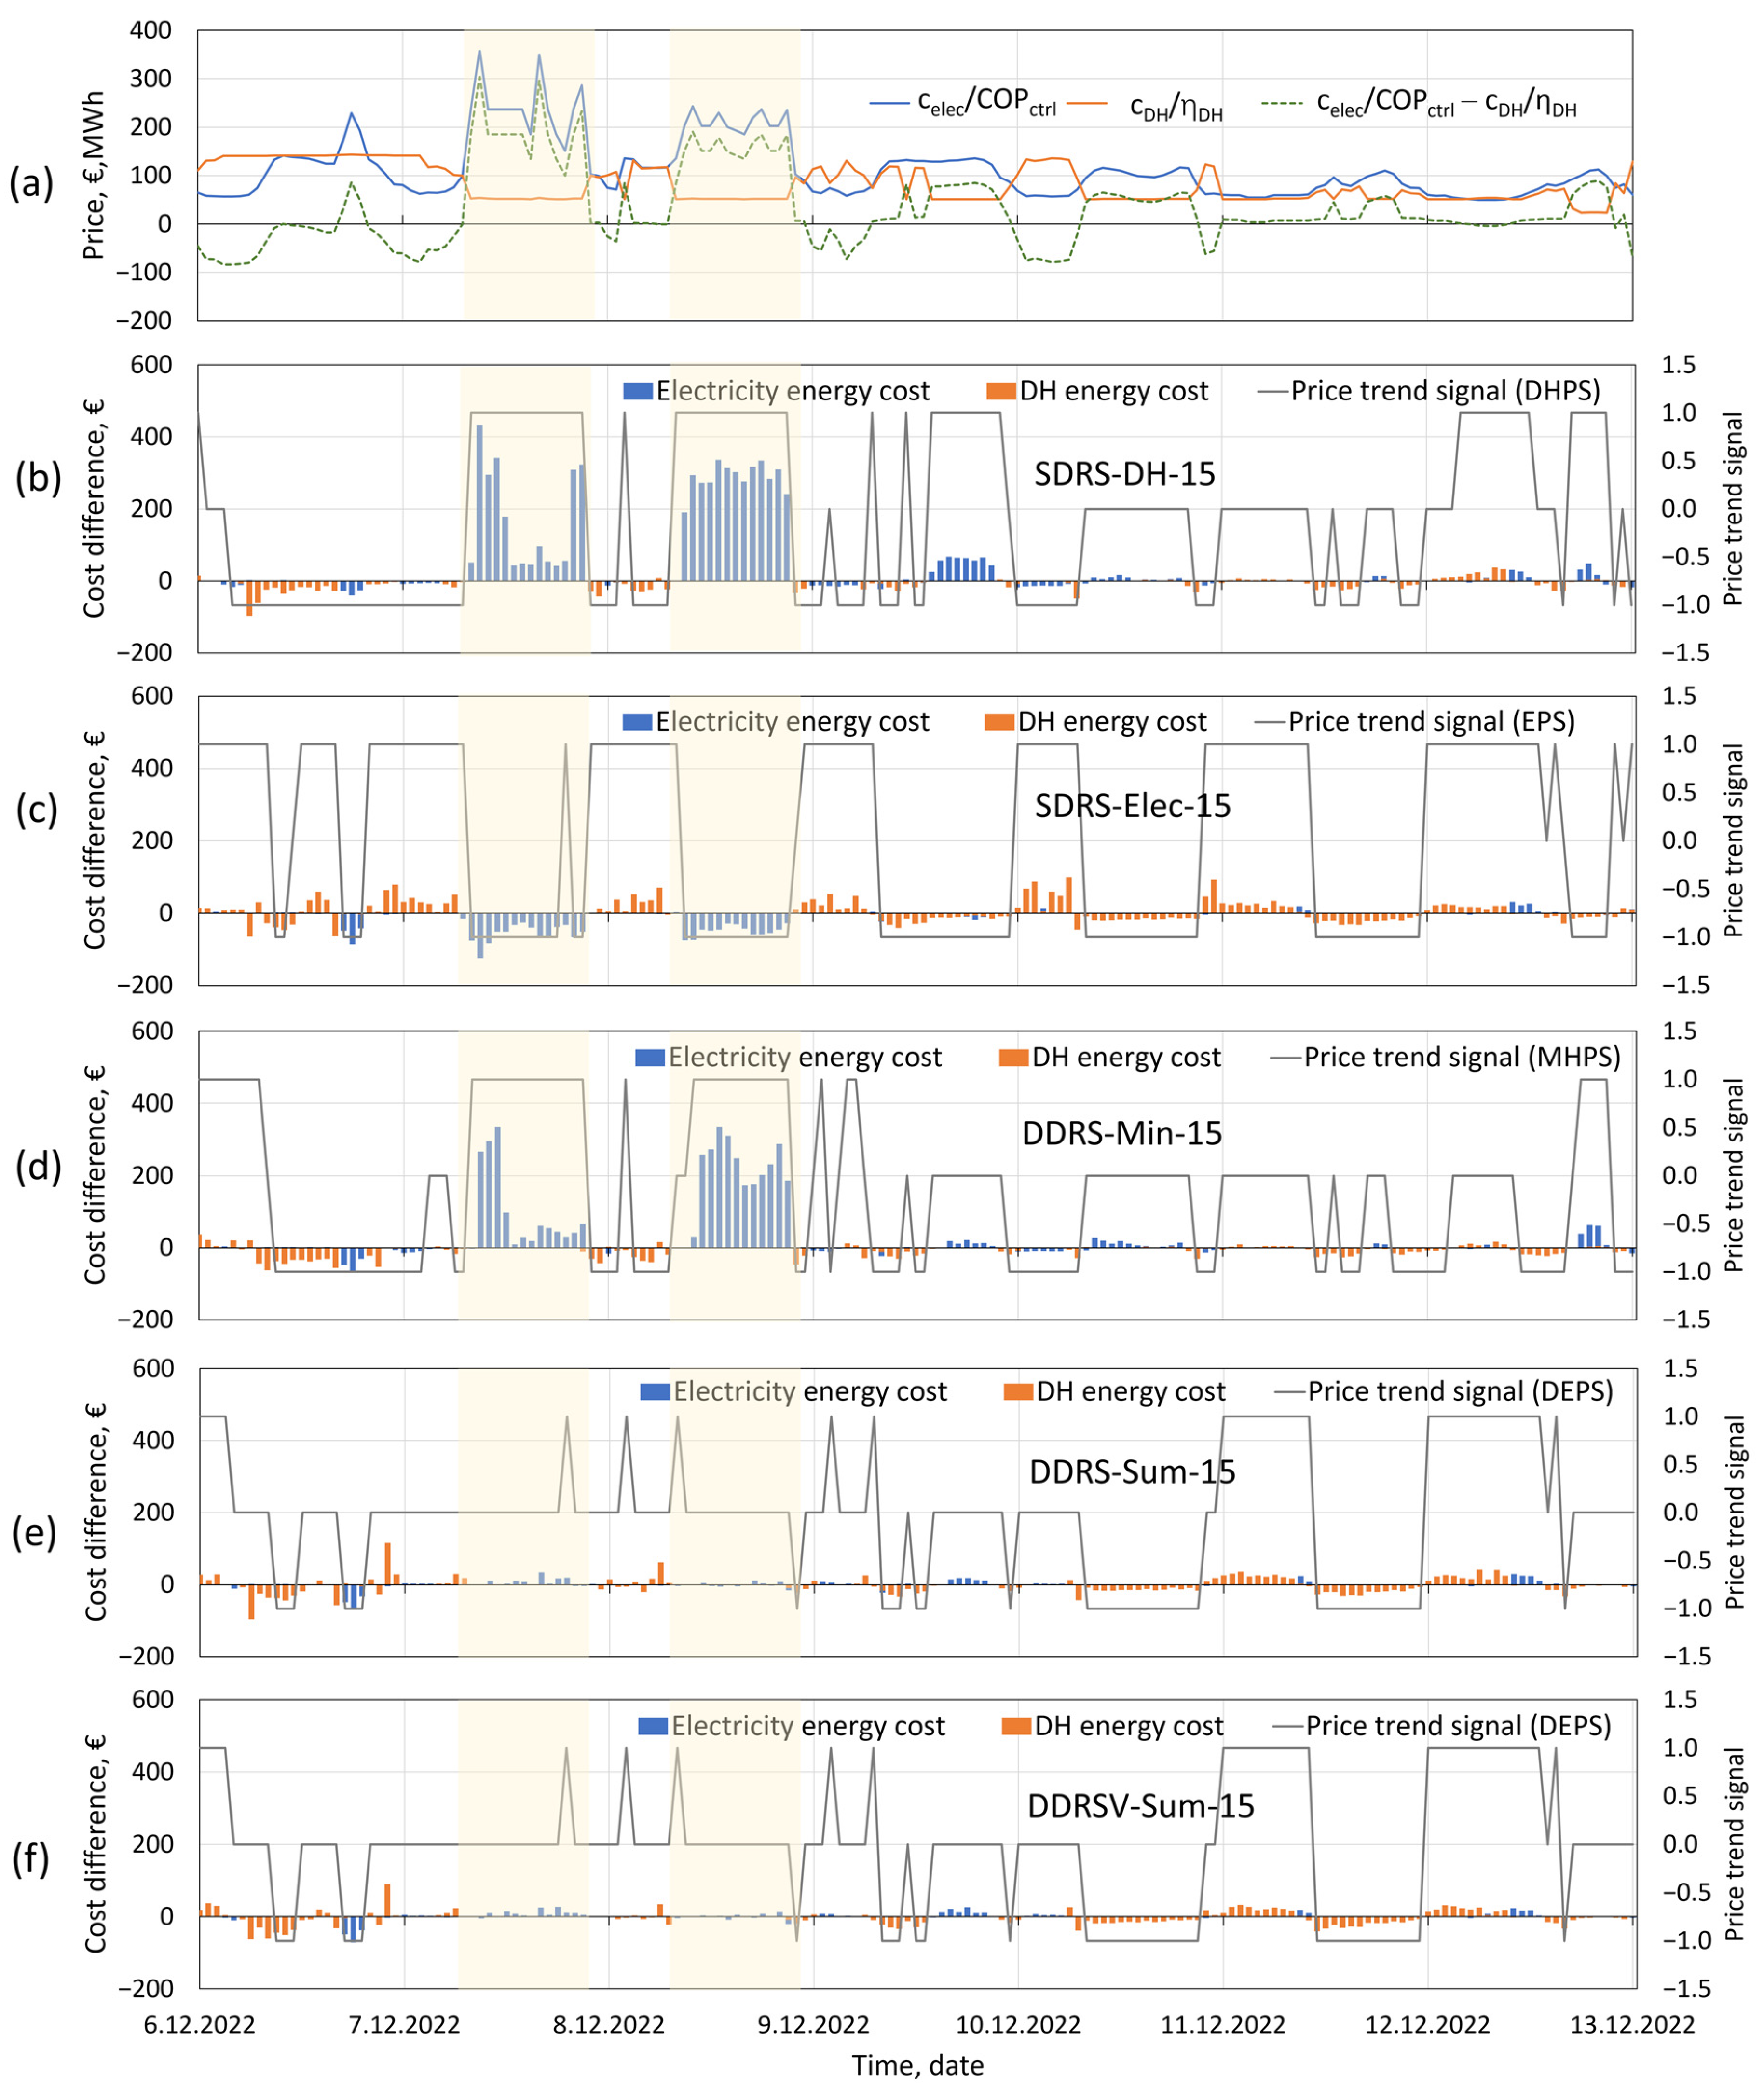
However, it can be seen that the two single-price DR control algorithms (SDRS-DH-15 and SDRS-Elec-15) and the dual-price DR control algorithm (DDRS-Min-15) can cause undesirable cost increases in December or February. These unwanted cost increases can be due to some short periods of significantly overused electricity/DH in December or February. For example, Figure 10 shows the difference in hourly consumed energy costs between the DR cases with a low marginal value and the reference case CE-PL-Ref21 during the week with the highest electricity price in December. It is evident that on 7th and 8th December from 7:00 to 21:00 (see the shaded areas in Figure 10a), the difference between the hourly specific heating prices of GSHP () and DH () is more significant than at other times. Given that the specific heating price of DH () is lower than that of GSHP (), GSHP is used for back-up heating, responding to the DR control signals before DH. This explains why the cost difference is mostly attributed to the electricity cost changes during these two time slots.
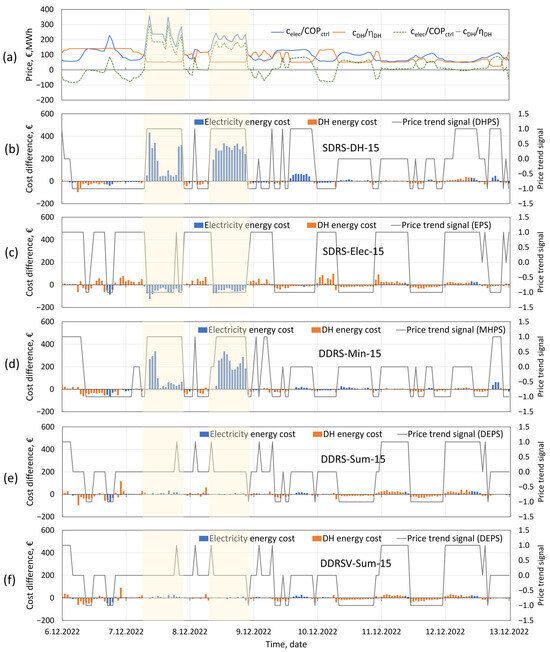
Figure 10.
(a) Specific heating prices of DH () and GSHP (), and specific heating price difference, (b–f) price trend signals, and consumed energy cost differences between DR cases with a marginal value of 15 €/MWh and the reference case CE-PL-Ref21 during the week with the highest electricity price in December.
However, in these two time slots, the five DR cases present obviously different energy cost changes. The two single-price DR control algorithms (SDRS-DH-15 and SDRS-Elec-15) present opposite price trend signals. There is an increasing DH price trend in the DH-based DR control (SDRS-DH-15) as shown in Figure 10b, leading to a charging action. But it misleads to an increase in the electricity cost, indicating a mismatch between the price trend signal and reacted energy usage. In contrast, a decreasing electricity price trend appears in the electricity-based DR control (SDRS-Elec-15) as shown in Figure 10c, resulting in a discharging action and correctly reducing the electricity cost.
It is interesting to notice that the increased cost in case SDRS-DH-15 is more obvious than the decreased cost in case SDRS-Elec-15 on 7th and 8th December from 7:00 to 21:00. This could be due to two factors. First, the indoor heating setpoint can influence heat recovery in the AHU. A lower indoor heating setpoint reduces heat recovery in the AHU, thereby causing more ventilation heating energy demand. As a result, even though the indoor heating setpoint is adjusted by 1 °C during both the charging and discharging phases, the reduction in heating energy in discharging action can be less than the increase in heating energy in charging action. Another factor could be the part-load performance of the GSHP. When the heat pump capacity is increased beyond its optimal capacity range, the COP may decrease, leading to higher electricity consumption.
In the dual-price DR cases, the minimum heating price method (DDRS-Min-15) also results in an increasing price trend signal of the minimum heating price from 7:00 to 20:00 on 7 and 8 December as shown in Figure 10d. Thus, it also causes a remarkable electricity cost increase. In contrast, the price signal summation method (DDRS-Sum-15 and DDRSV-Sum-15) leads to a flat dual energy price trend signal, as shown in Figure 10e,f, which has an insignificant impact on energy costs during these periods.
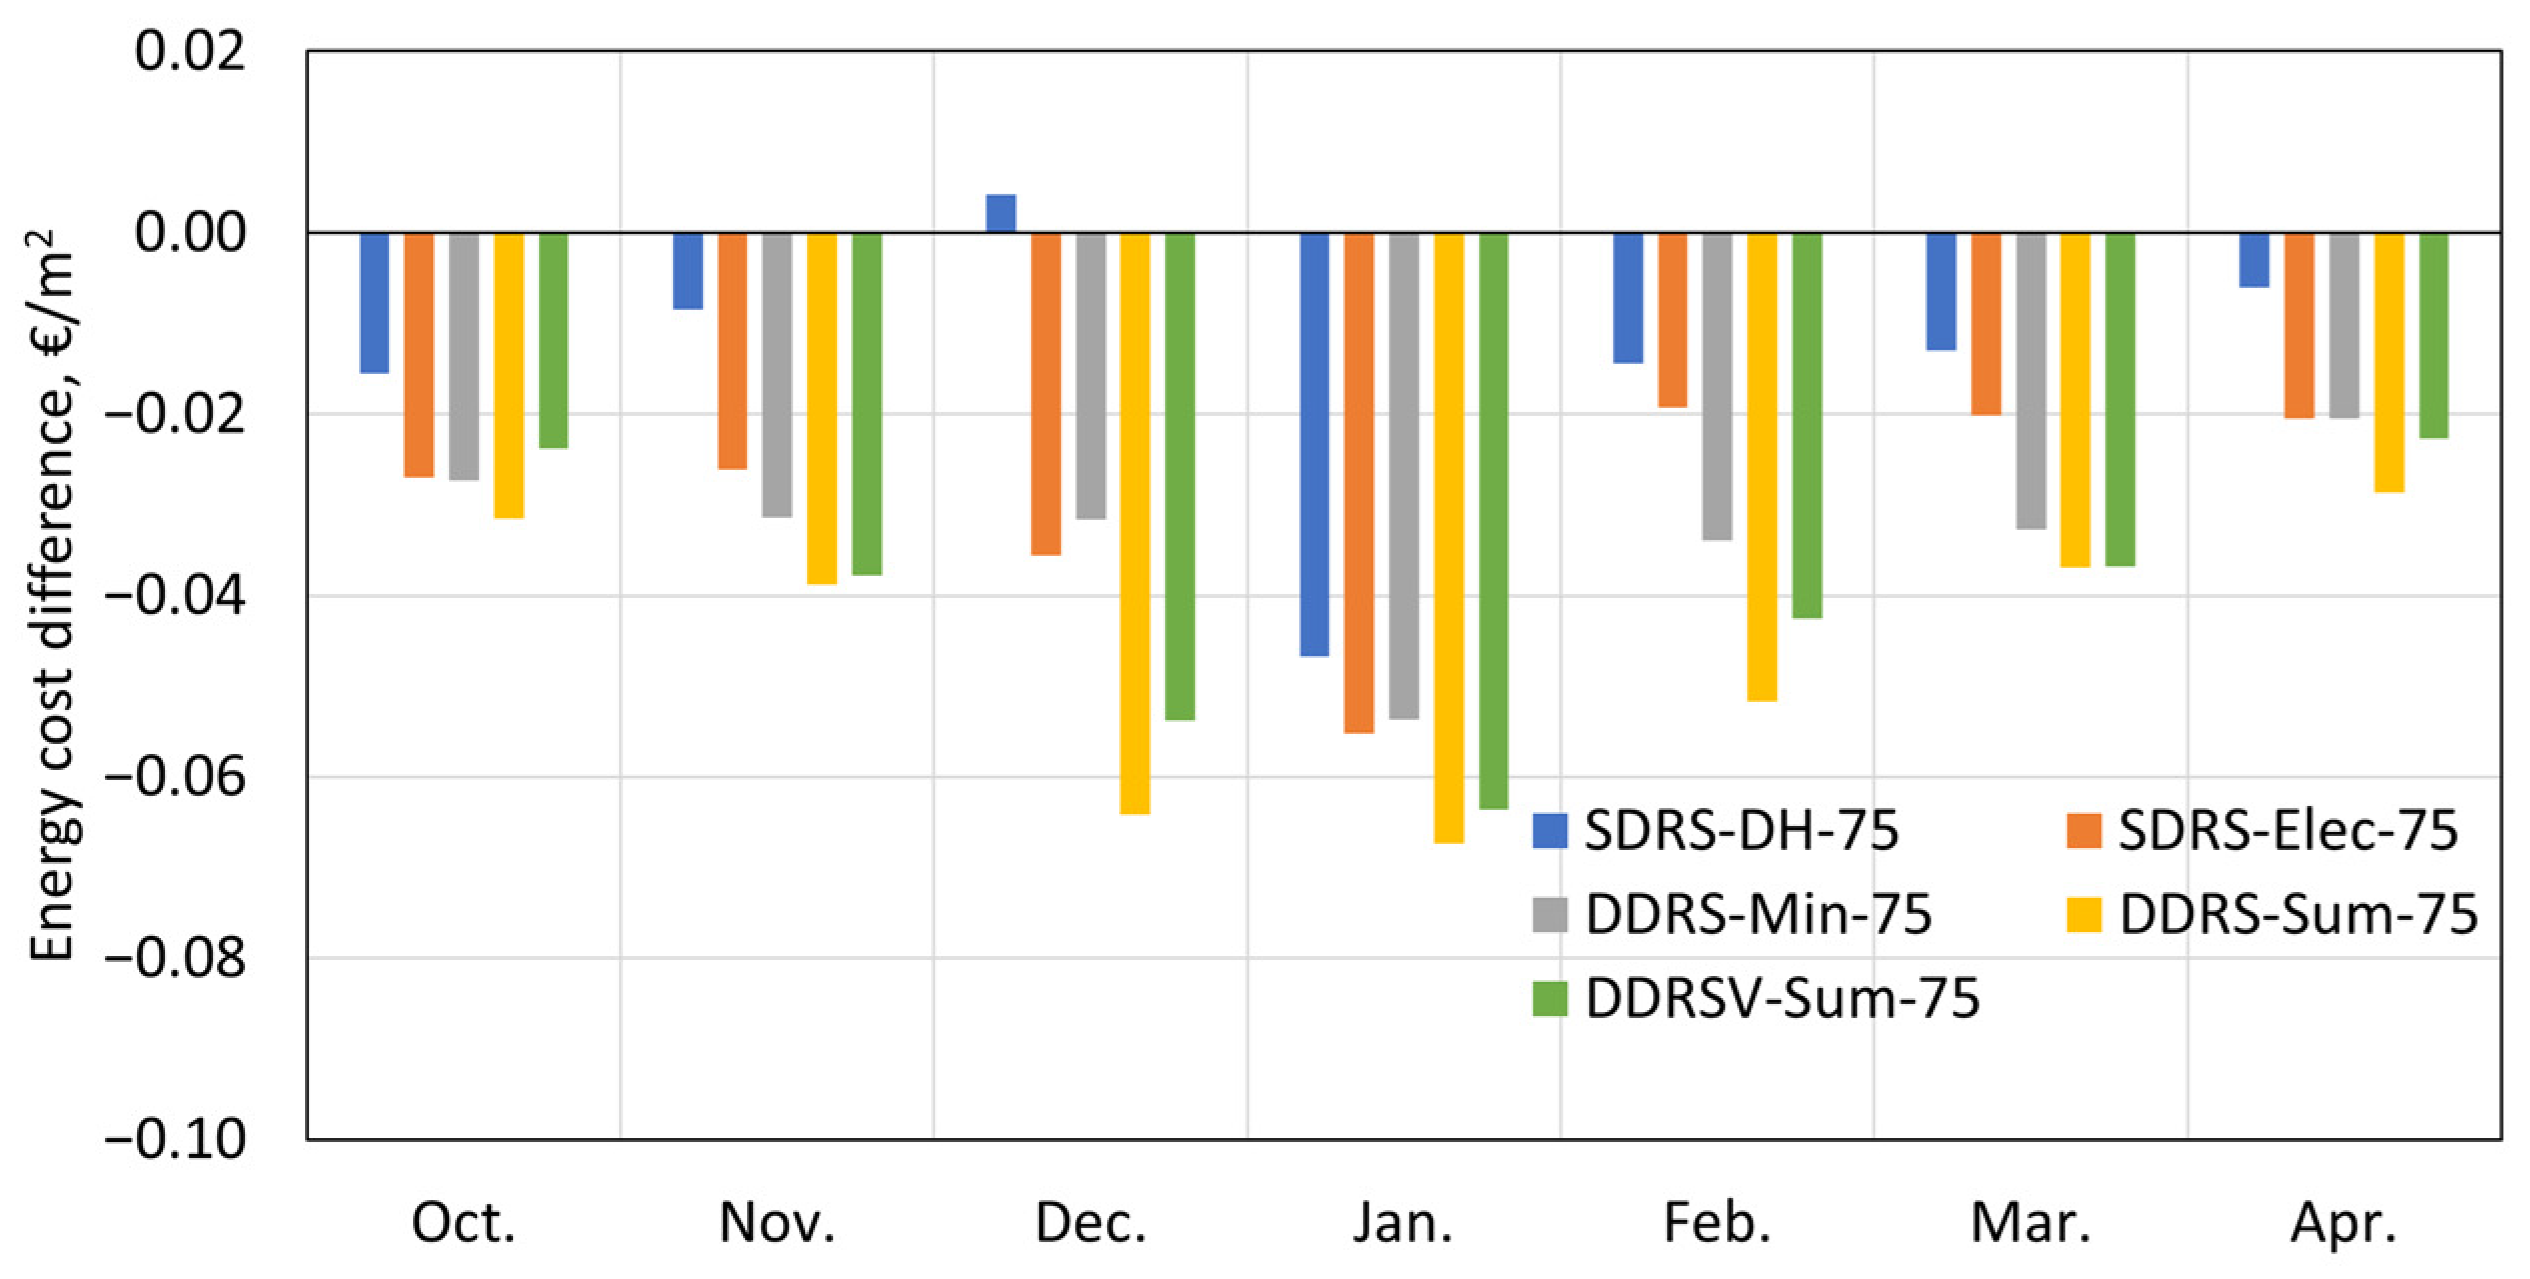
Figure 11 shows the differences in monthly consumed energy cost (excluding power cost) between the DR cases with a marginal value of 75 €/MWh and the reference case CE-PL-Ref21. The high marginal value makes DR control algorithms tend to be more cost-effective. It reduces the cost increase in December for the DH-based DR control (SDRS-DH-75) and even eliminates the cost increase in December for the dual price DR control using the minimum heating price method (DDRS-Min-75), the cost increase in February for the electricity-based DR control (SDRS-Elec-75), and the dual price DR control using the minimum heating price method (DDRS-Min-75). The case applying the dual price DR control using price signal summation method (DDRS-Sum-75) to space heating results in the highest cost savings in every month.
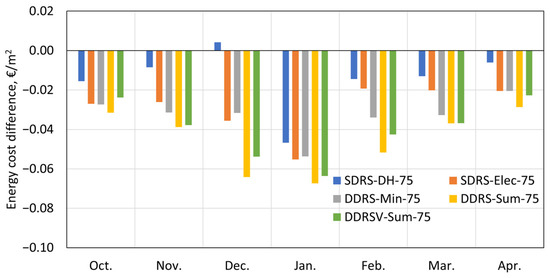
Figure 11.
Differences in monthly consumed energy costs (excluding power costs) between DR cases with a marginal value of 75 €/MWh and the reference case CE-PL-Ref21.
In terms of annual cost savings, the dual price DR control algorithm using price signal summation method overperforms other DR control algorithms, regardless of low and high marginal values. As shown in Table 10, the cases DDRS-Sum-15 and DDRS-Sum-75 applying the dual price DR using the price signal summation method to space heating achieve cost savings of 9.1% and 10.8%, respectively. However, when the same control is applied to ventilation heating as well, the total energy cost savings decrease. With a low marginal value, using DR for both space heating and ventilation (DDRSV-Sum-15) results in a reduction of 0.1 percentage points in cost savings compared to using DR only for space heating (DDRS-Sum-15). Similarly, with a high marginal value (DDRSV-Sum-75), the cost savings are reduced by 0.5 percentage points. The reduction in cost savings could be attributed to increased space heating energy demands (see Table 9) due to the low supply air temperatures in cases DDRSV-Sum-15 and DDRSV-Sum-75.
3.3. Energy Flexibility
Compared to the reference cases using constant heating setpoints, the studied DR cases can increase the flexibility of energy systems. Table 11 lists the hours of different indoor air temperature setpoints in the DR cases during the heating season. When using a low marginal value, the electricity-based DR control (SDR-Elec-15) results in a longer total charging time of 937 h compared to the DH-based DR control (SDR-DH-15, 515 h). The dual-price DR control using the minimum heating price method (DDRS-Min-15) presents a total charging time of 757 h, which falls between the electricity-based DR control (SDR-Elec-15) and the DH-based DR control (SDR-DH-15). The dual-price DR control using the price signal summation method (DDRS-Sum-15) reveals the minimum total charging time (307 h) among the four studied DR control algorithms. For discharging, the electricity-based DR control (SDR-Elec-15), DH-based DR control (SDR-Elec-15), and dual-price DR control using the minimum heating price method (DDRS-Min-15) result in similar total discharging hours (2394 h, 2393 h and 2429 h), while the dual-price DR control using the price signal summation method (DDRS-Sum-15 and DDRSV-Sum-15) presents the minimum total discharging time (1925 h) among the four studied DR control algorithms.

Table 11.
The number of hours and percentage of hours of different indoor air temperature setpoints in DR cases.
When the high marginal value was used, the total charging time was reduced significantly in all the DR cases. The total discharging time is not affected much in cases using single-price DR control algorithms (SDR-DH-75 and SDR-Elec-75) and the dual-price DR control with the minimum heating price method (DDRS-Min-75). However, the total discharging time is increased significantly to 3645 h by using the dual-price DR control with the price signal summation method (DDRS-Sum-75 and DDRSV-Sum-75). In cases DDRSV-Sum-15 and DDRSV-Sum-75, the number of hours of supply air temperature setpoints for charging and discharging are the same as the number of hours of indoor air temperature setpoints for charging and discharging as shown in Table 11.
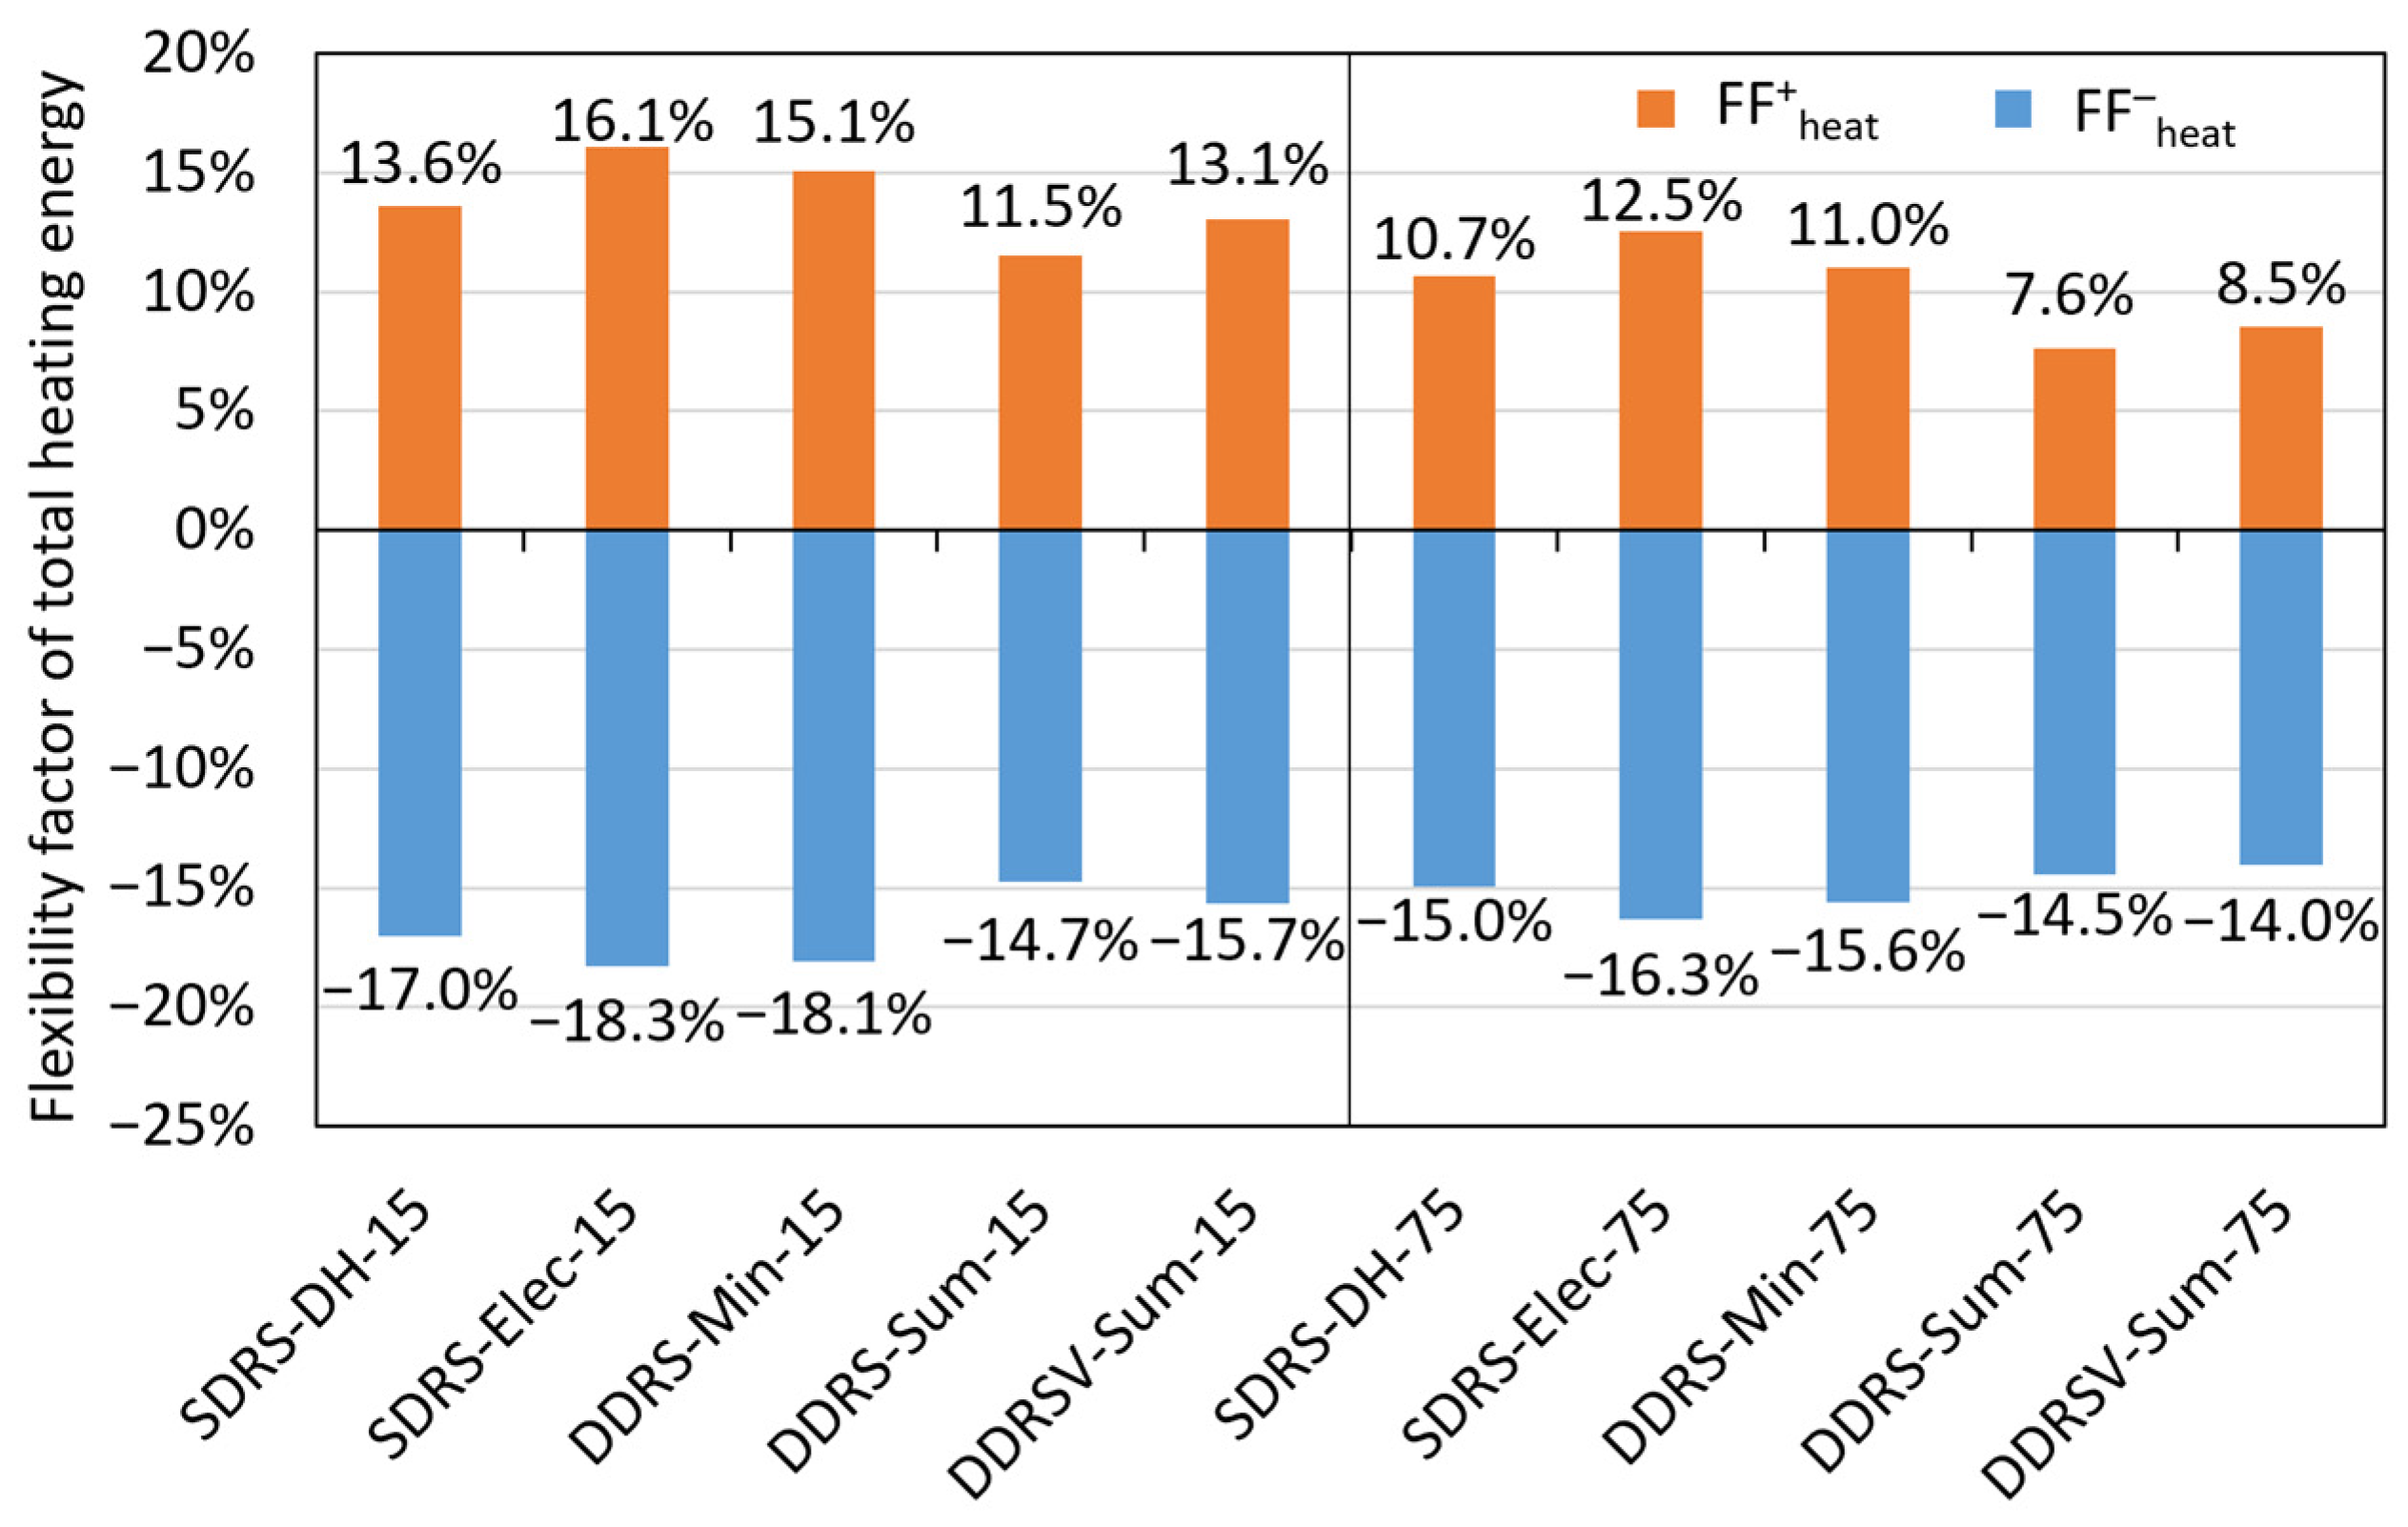
Figure 12 shows the flexibility factor of the total heating energy in the DR cases. The flexibility factors were calculated according to Equations (9)–(14), using the case CE-PL-Ref21 as the reference case. It can be seen that the values of are lower than in all the DR cases. And increasing the marginal value reduces the heating energy flexibility.
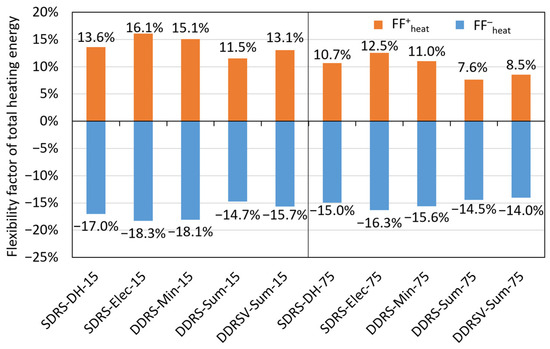
Figure 12.
Flexibility factors of total heating energy during the heating season (October–April).
Among cases using different DR control algorithms on space heating, for a low marginal value, the level of corresponds to the duration of charging time. The electricity-based single price DR control (SDRS-Elec-15) results in the highest of 16.1%, followed by the dual price DR control using the minimum heating price method (DDRS-Min-15) with a of 15.1% and then by the DH-based single price DR control (SDRS-DH-15) with a of 13.6%. The dual price DR control using the price signal summation method (DDRS-Sum-15) leads to the lowest of 11.5%. As for , it seems that the level of from different DR controls is in line with the level of instead of the discharging time. This could be due to the effect of energy reduction from the heat stored in the building’s thermal mass during the non-charging period prevailing over the effect of decreasing the indoor heating setpoint. Therefore, the highest (−18.3%) occurs in the electricity-based single price DR control case (SDRS-Elec-15), and the lowest (−14.7%) falls in the dual price DR control case using the price signal summation method (DDRS-Sum-15). When a higher marginal value is used, the and are both reduced in the space heating DR cases, while the ranking of and among the space heating DR cases are not impacted. The highest (12.5%) and (−16.3%) are observed in the electricity-based single price DR control (SDRS-Elec-75) and the lowest (7.6%) and (−14.5%) occur in the dual price DR control case using the price signal summation method (DDRS-Sum-15).
When dual-price DR is applied to both space heating and ventilation heating, the marginal value impacts the and differently. For both high and low marginal values, the values are higher when DR control is implemented on ventilation heating (13.1% in DDRSV-Sum-15 and 8.5% in DDRSV-Sum-75) compared to when it is not implemented (11.5% in DDRS-Sum-15 and 7.6% in DDRS-Sum-75). This increase occurs may be due to the increase in ventilation heating energy demand exceeding the reduction in space heating energy demand during the charging period in DDRS-Sum-15 and DDRS-Sum-75. However, the effect on varies depending on the marginal value. With a low marginal value, is higher in DDRSV-Sum-15 (−15.7%) than in DDRS-Sum-15 (−14.7%). This is attributed to the less discharging time for ventilation heating than the total time of the normal and charging periods. As a result, the reduction in ventilation heating energy demand due to the lower supply air temperature outweighs the increase in space heating energy demand required to warm the supply air to the desired room temperature. In contrast, with a high marginal value, the is smaller in DDRSV-Sum-75 (−14.0%) than in DDRS-Sum-75 (−14.5%), as the discharging time for ventilation heating significantly exceeds the sum of the normal and charging periods, leading to a greater increase in space heating energy demand than the reduction in ventilation heating energy demand.
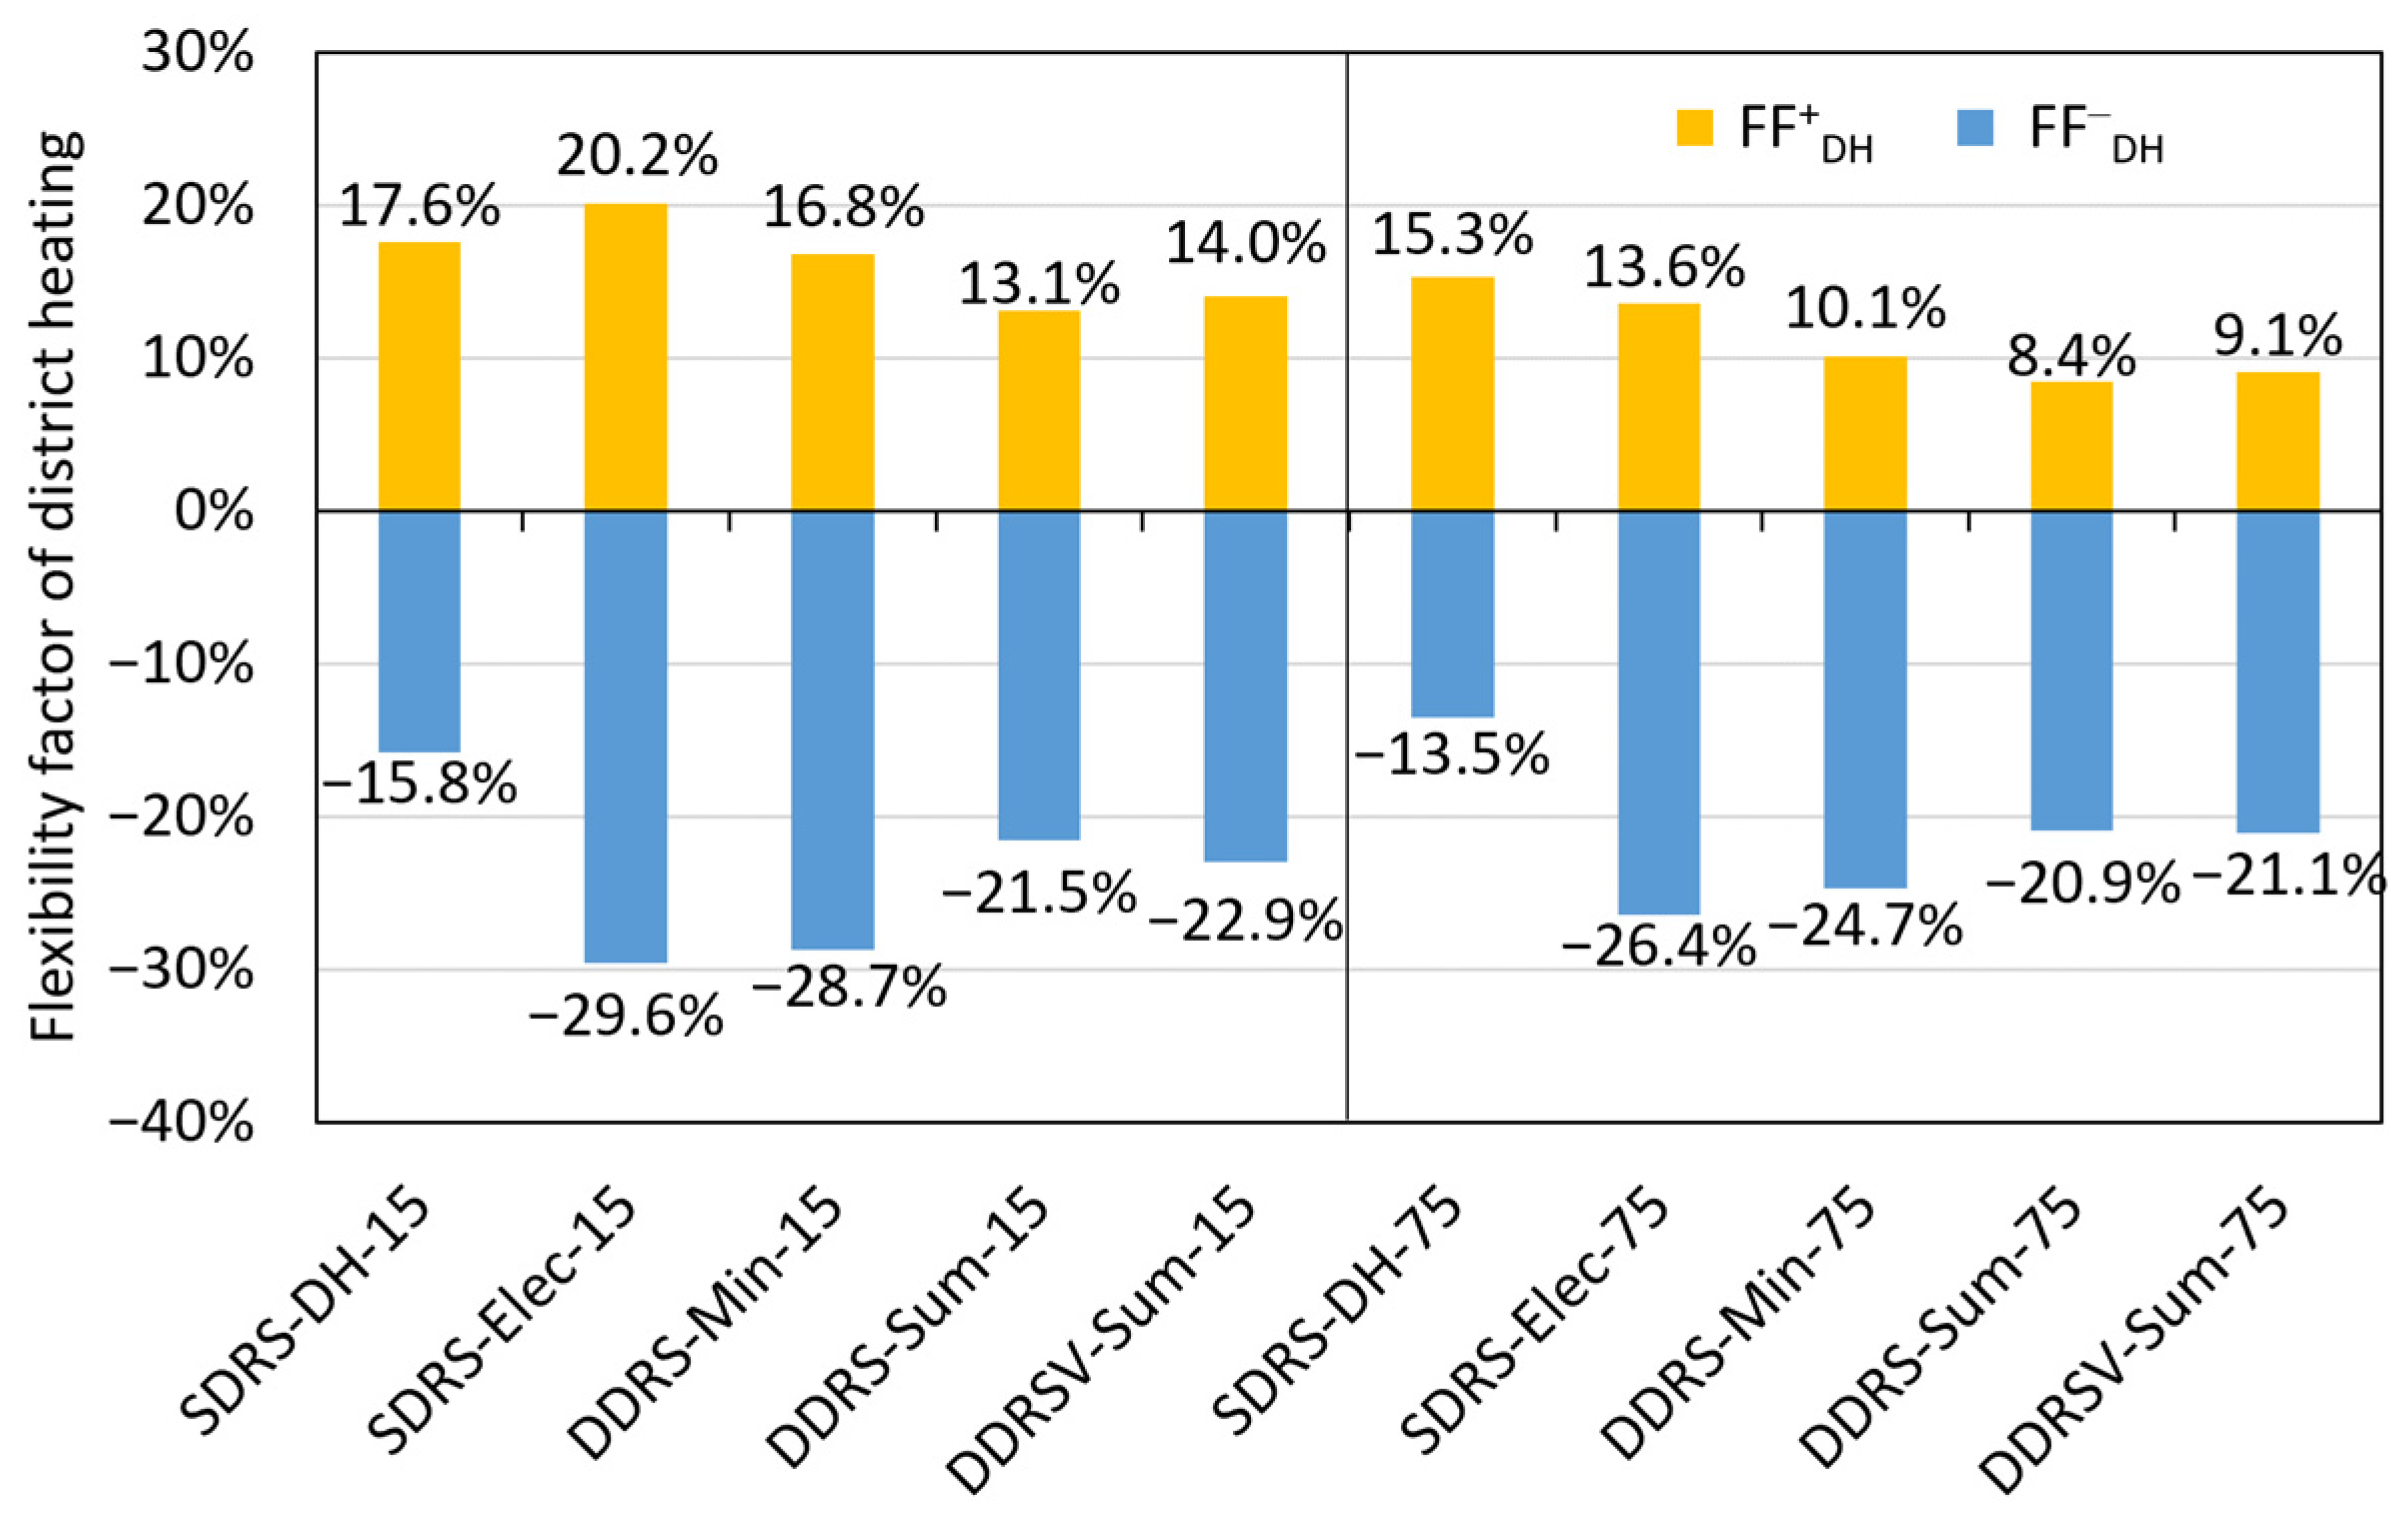
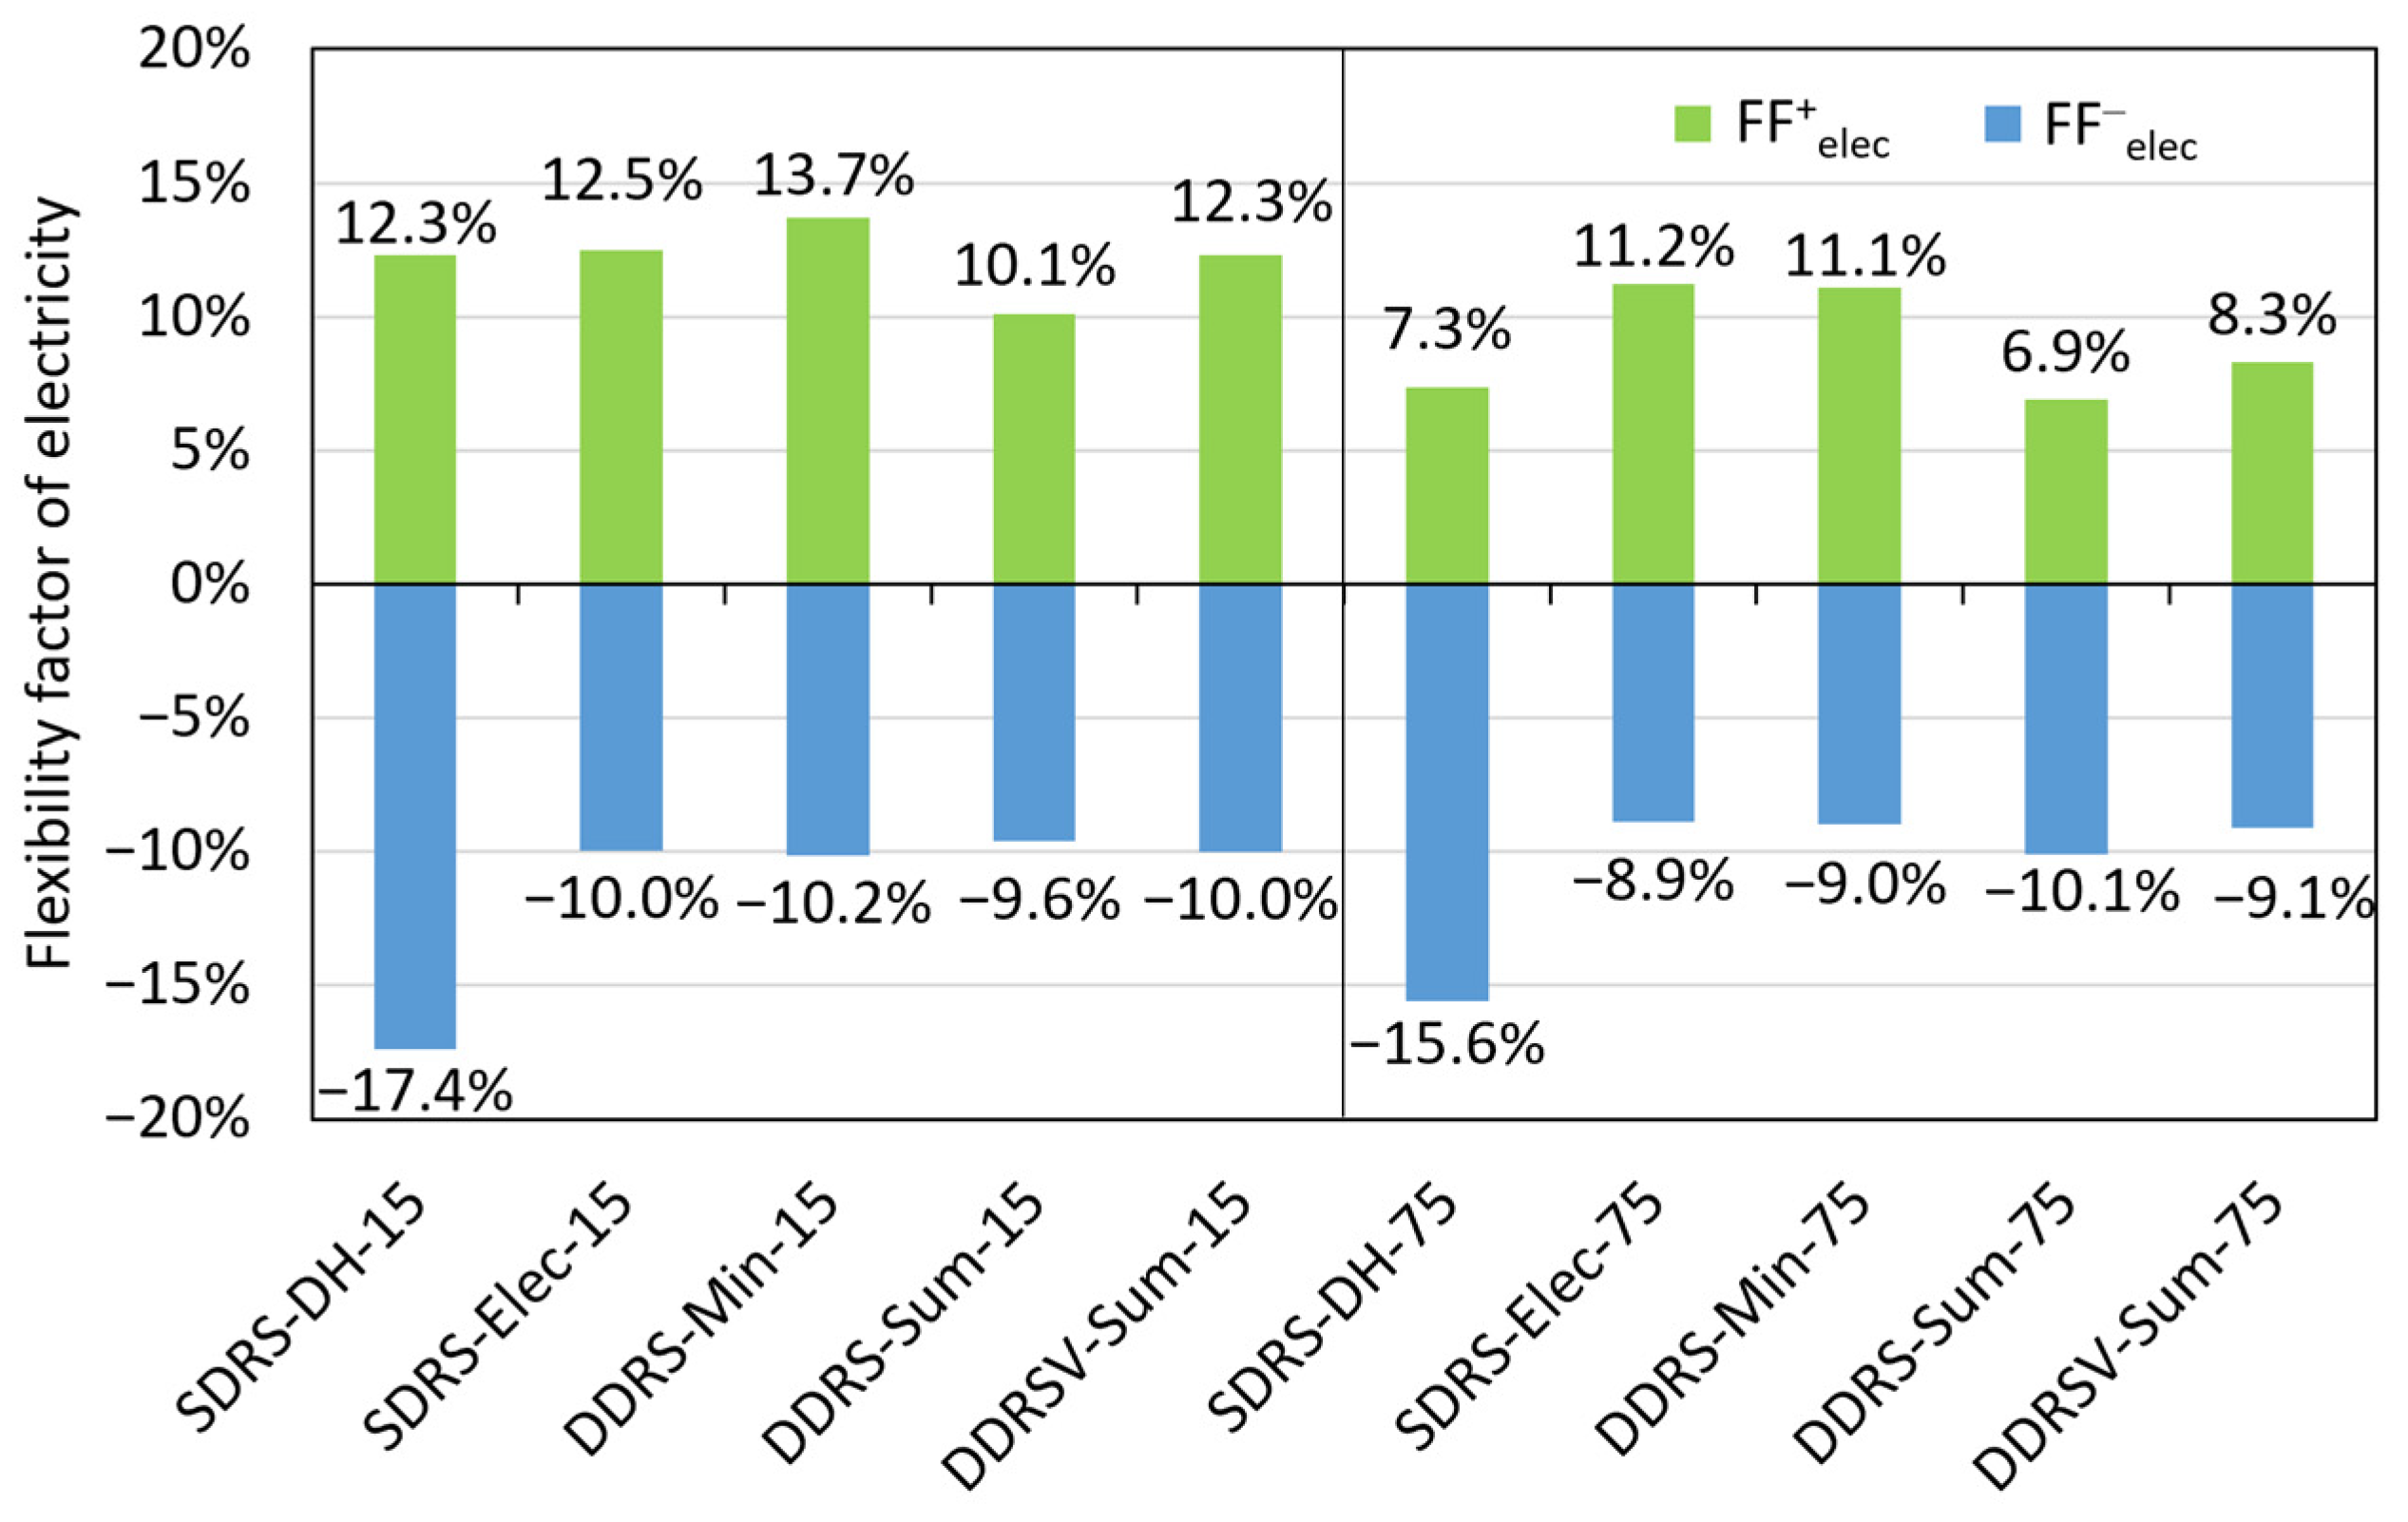
Figure 13 and Figure 14 show the flexibility factors of DH consumption and electricity consumption, respectively, which demonstrate the effects of different DR control algorithms on the overused/saved DH and overused/saved electricity. The electricity flexibility factors range from 6.9 to 13.7% for charging and from −8.9 to −17.4% for discharging. The DH flexibility factors vary between 8.4 and 20.2% for charging and between −13.5 and −29.6% for discharging. It can be seen that the single-price DR and dual-price DR both provide flexibility in DH and electricity consumption. However, a higher may not correspond to a larger and the same for and . For example, when a low marginal value is used, the maximum and maximum both occur in case SDRS-Elec-15, and the maximum and maximum fall in case DDRS-Min-15 and case SDRS-DH-15, respectively. Whereas, when a high marginal value is used, the maximum and maximum are achieved in case SDRS-DH-75 and case SDRS-Elec-75, respectively, and the maximum and maximum occur in an opposite way.
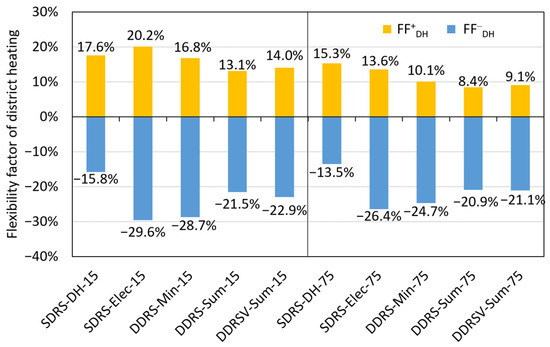
Figure 13.
Flexibility factors of DH consumption during the heating season (October–April).
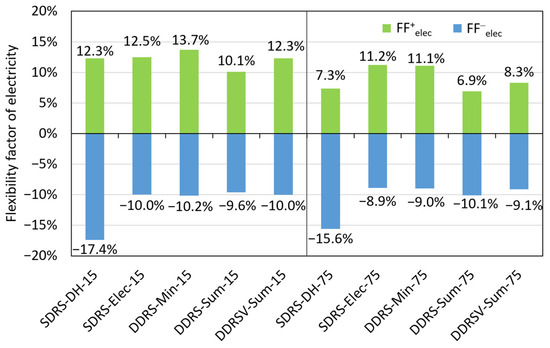
Figure 14.
Flexibility factors of electricity consumption during the heating season (October–April).
3.4. Indoor Air and Supply Air Temperatures
Table 12 lists the number of hours, percentage hours, and degree hours below 20 °C and 21 °C during the heating season of the building’s coldest zone (Zone 1 shown in Figure 1). In the reference case GP-Ref21, the indoor air temperature drops below 21 °C for 24 h, accounting for 1.3% of the total occupied time in the heating season. The degree hours below 21 °C is 1.6 °Ch. In the reference case CE-PL-Ref21, where cost-effective hybrid GSHP control is implemented with limited DH and GSHP power, the duration of indoor air temperatures below 21 °C only slightly increases to 35 h (1.8%), with 2.4 °Ch below 21 °C. However, when using a constant setpoint of 20 °C, the power limit does not increase the number of hours below the chosen minimum indoor air temperature. The hours of the indoor air temperature below 20 °C are 13 h (0.7%) in case GP-Ref20 and 6 h (0.3%) in the reference case CE-PL-Ref20.

Table 12.
The number of hours, percentage of hours, and degree hours below 20 °C and 21 °C during the occupied time in the heating season (October–April).
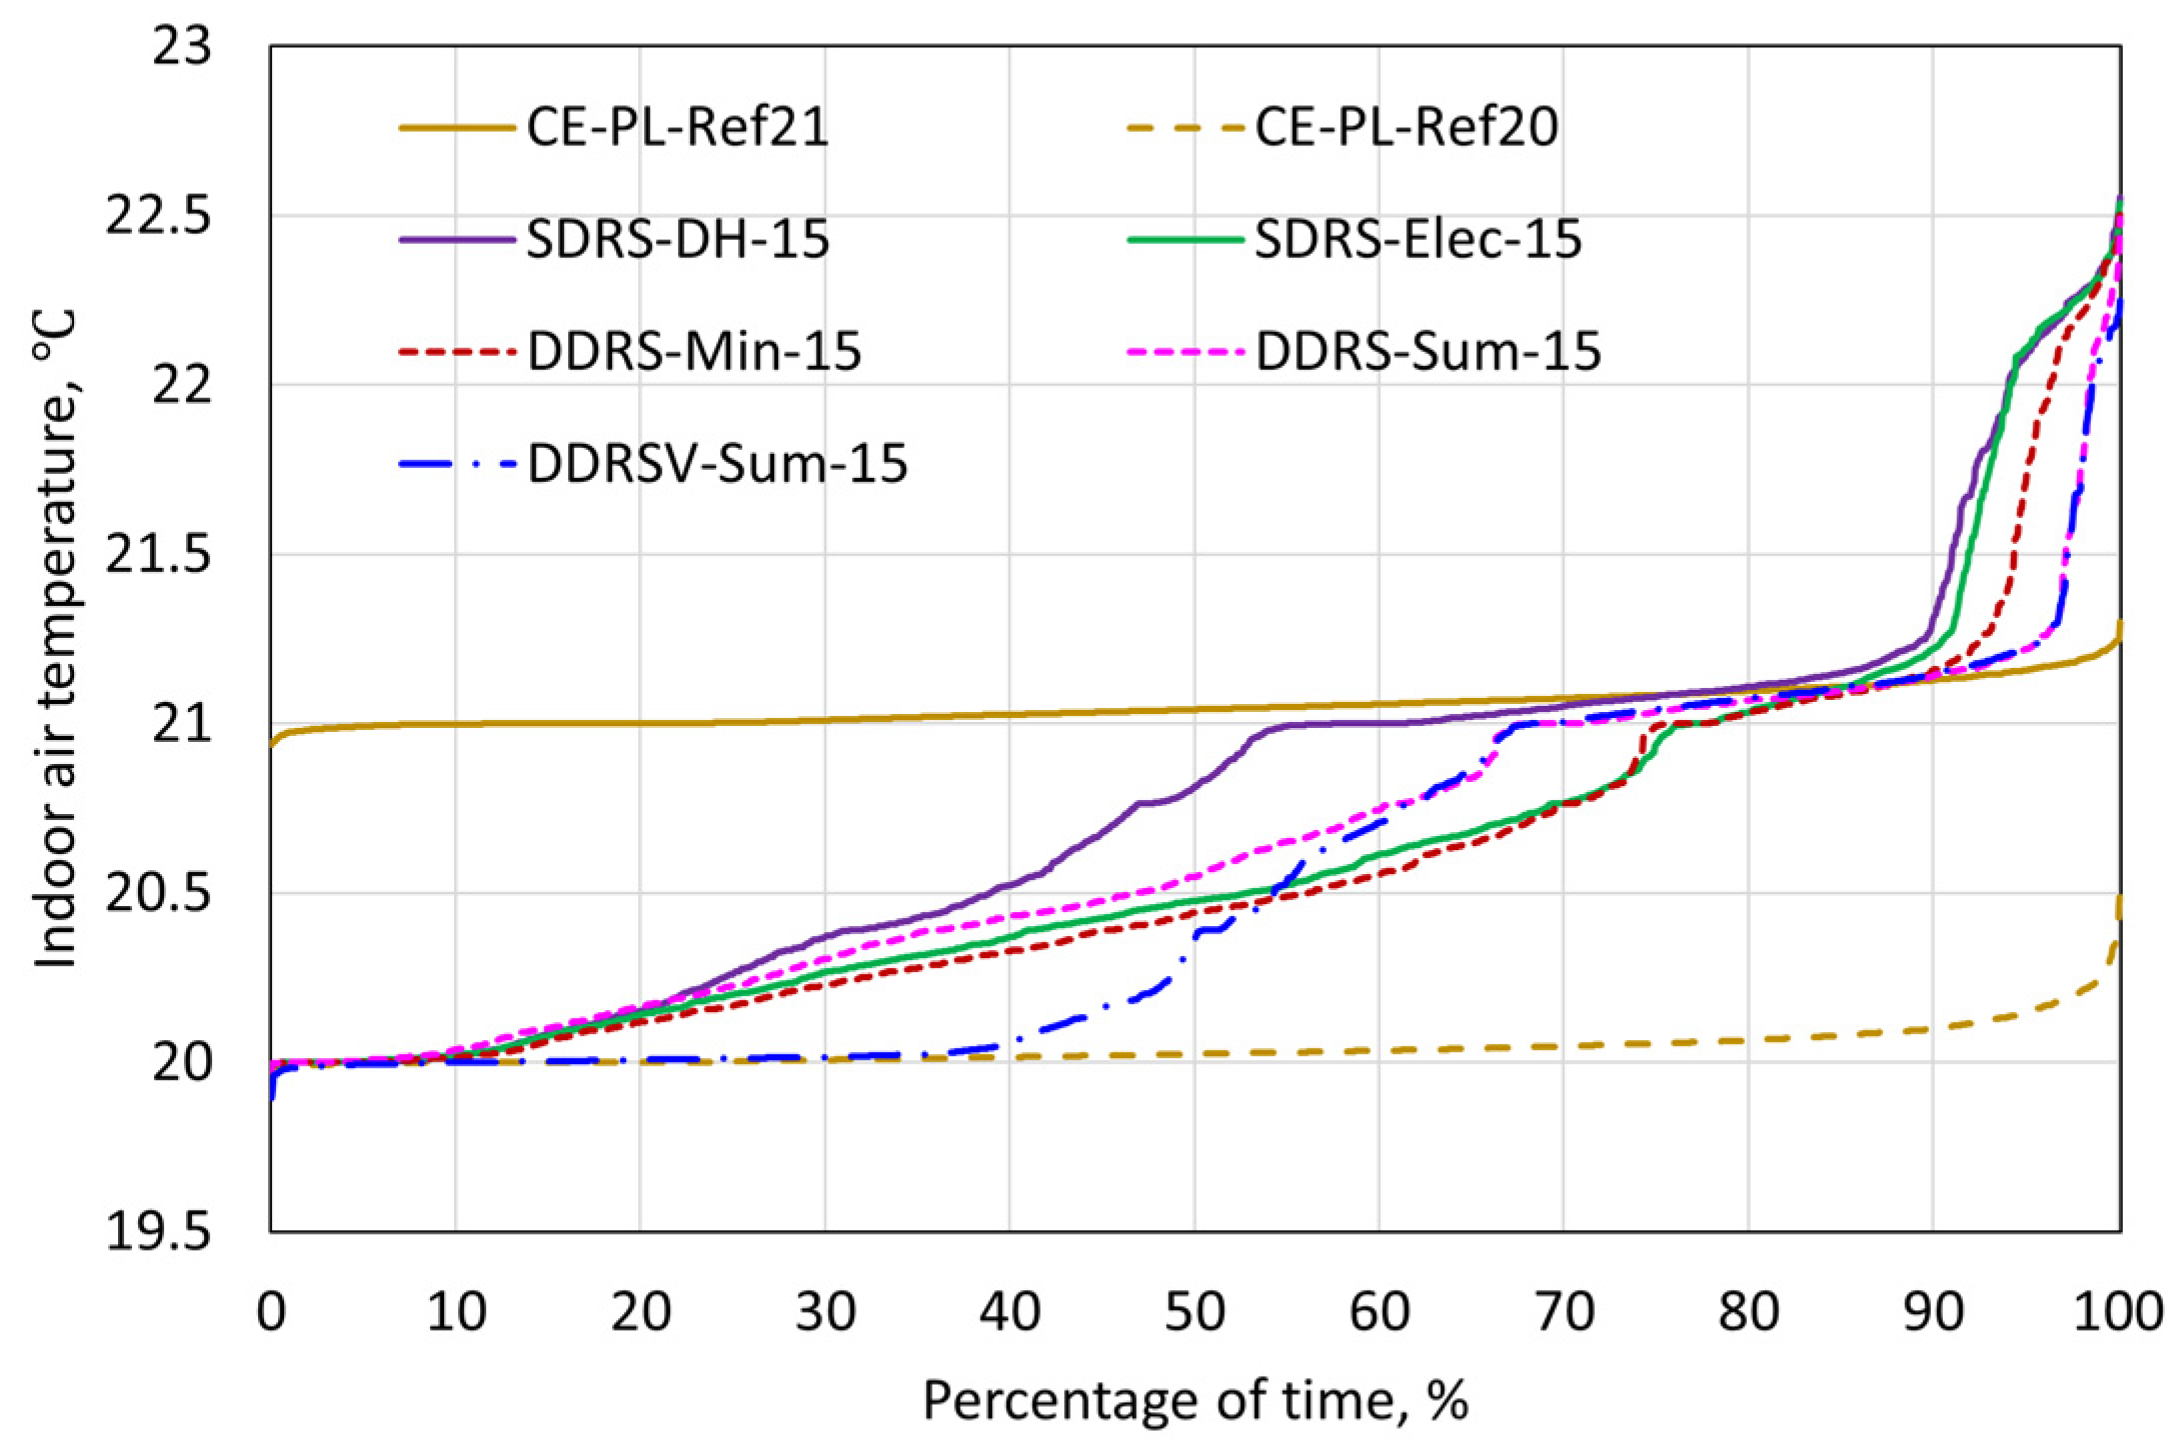
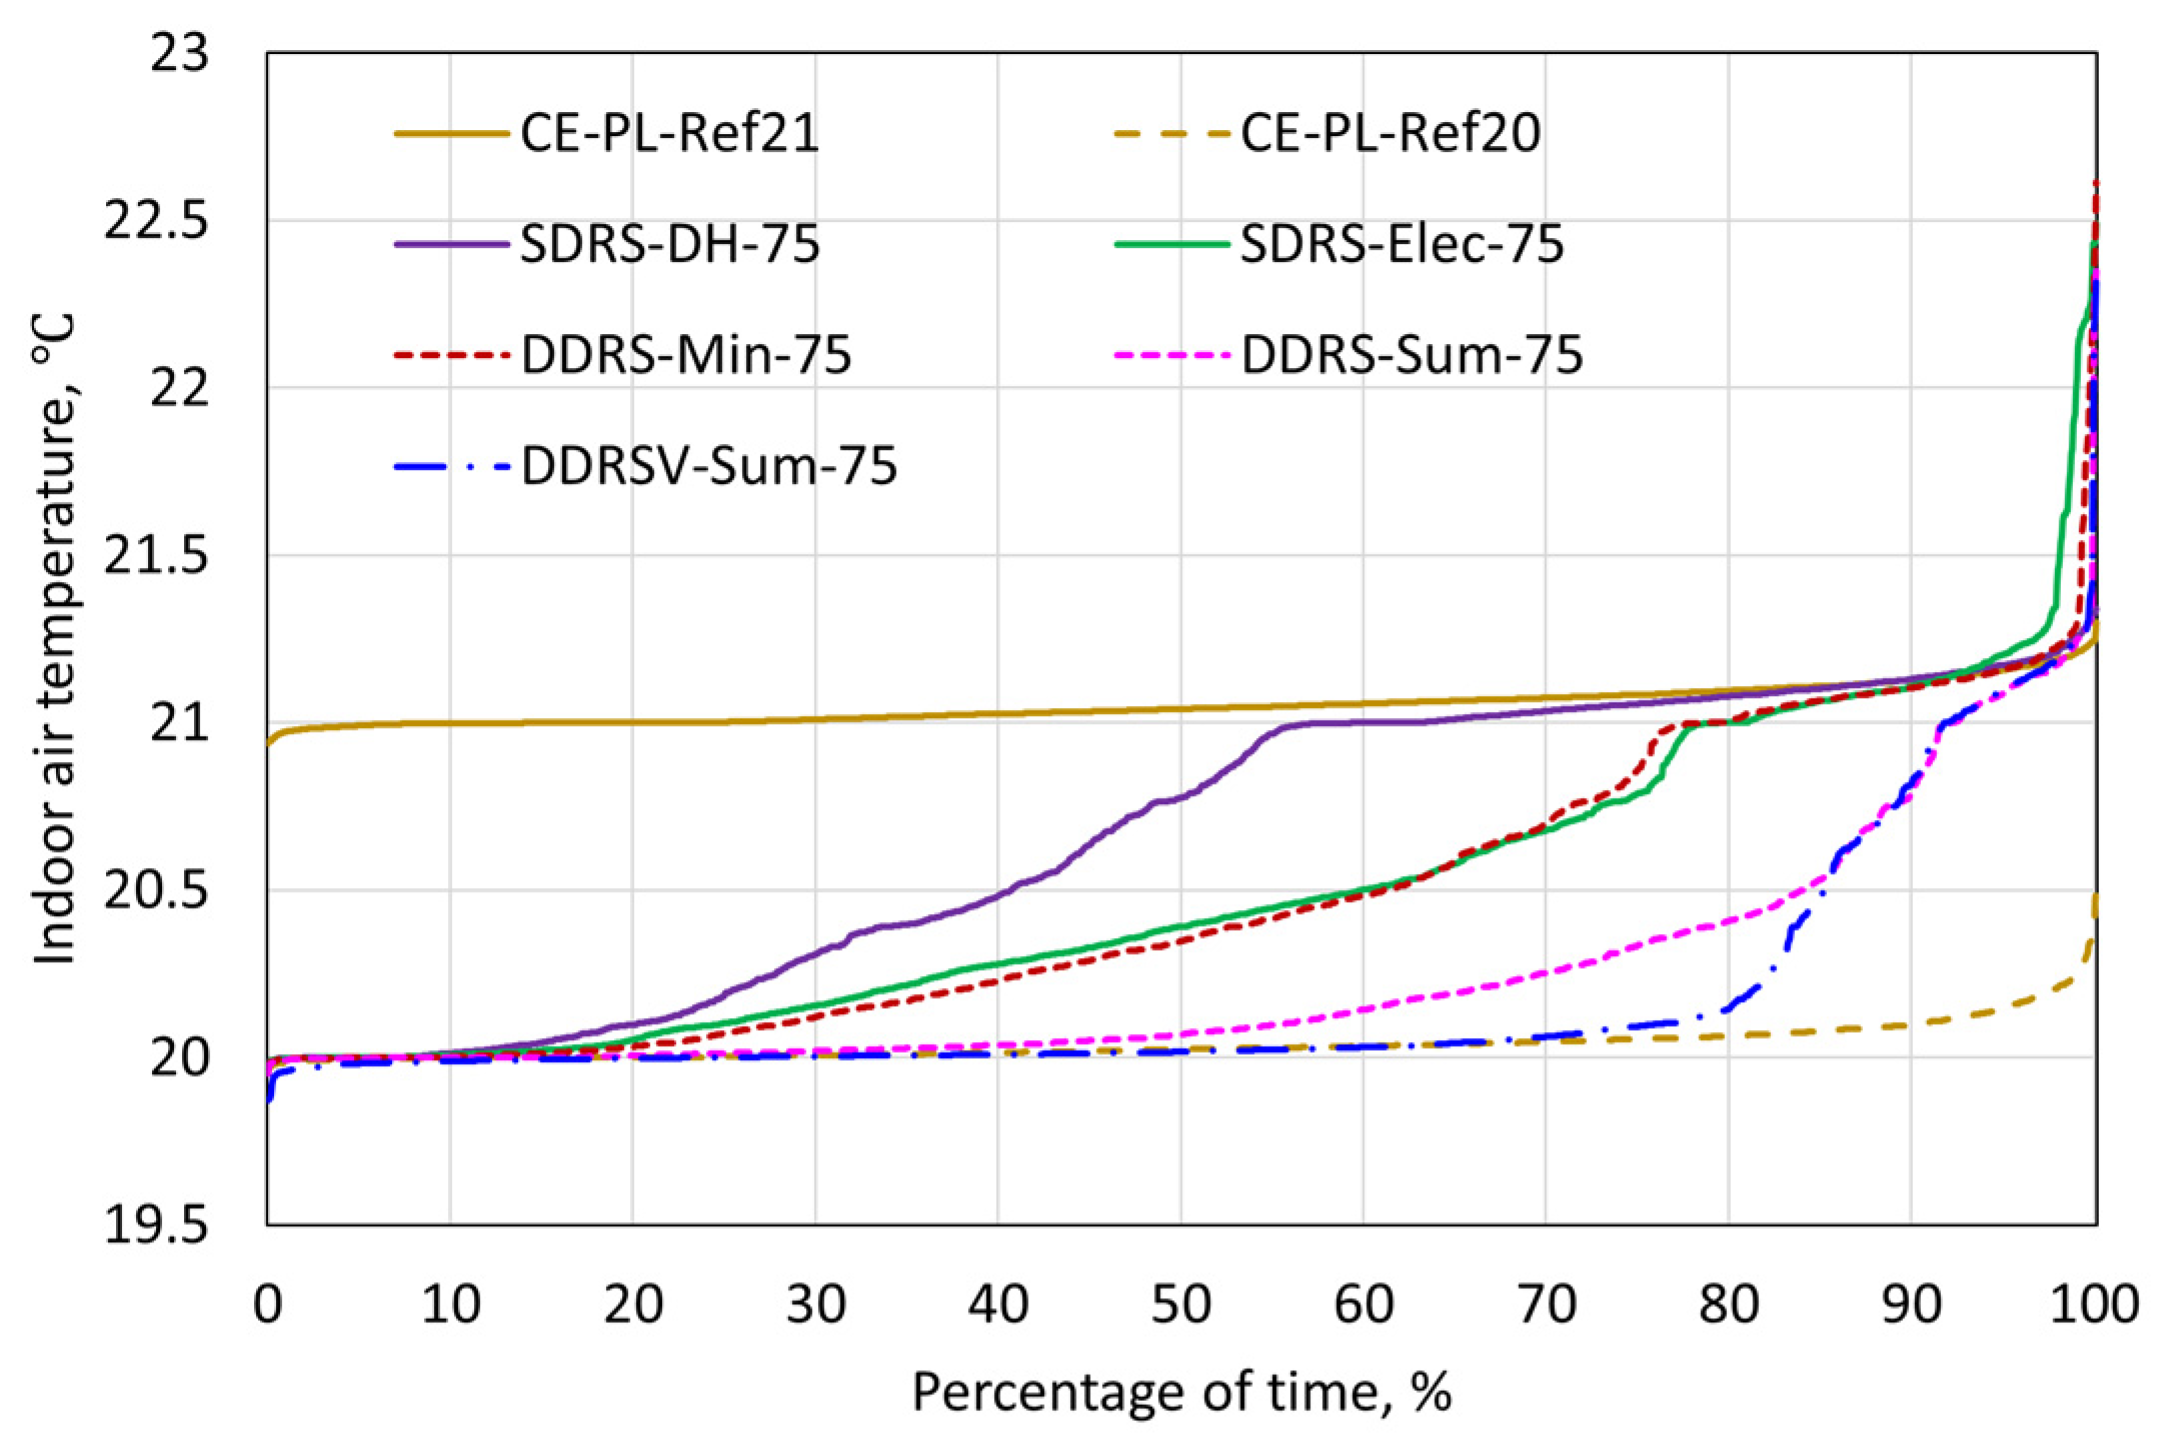
It is noteworthy that all the DR cases show fewer hours with indoor temperatures below 21 °C compared to the reference case CE-PL-Ref20. With a low marginal value, the percentage of hours below 21 °C ranges from 54% in case SDRS-DH-15 to 75.7% in case SDRS-Elec-15. With a high marginal value, it ranges from 55.4% in case SDRS-DH-75 to 91.4% in cases DDRS-Sum-75 and DDRSV-Sum-75. However, applying DR to space heating and AHU heating have different effects on the duration of indoor air temperatures falling below 20 °C. Compared to the reference case CE-PL-Ref20, applying DR only to space heating reduces the duration of indoor air temperatures falling below 20 °C. In cases where DR is applied to space heating, the number of hours with indoor air temperatures below 20 °C is limited to 2 h (0.1% in Case DDRS-Sum-75). In contrast, applying DR to both space and ventilation heating increases these hours, with indoor air temperatures falling below 20 °C for up to 78 h (4.1% in Case DDRSV-Sum-75).
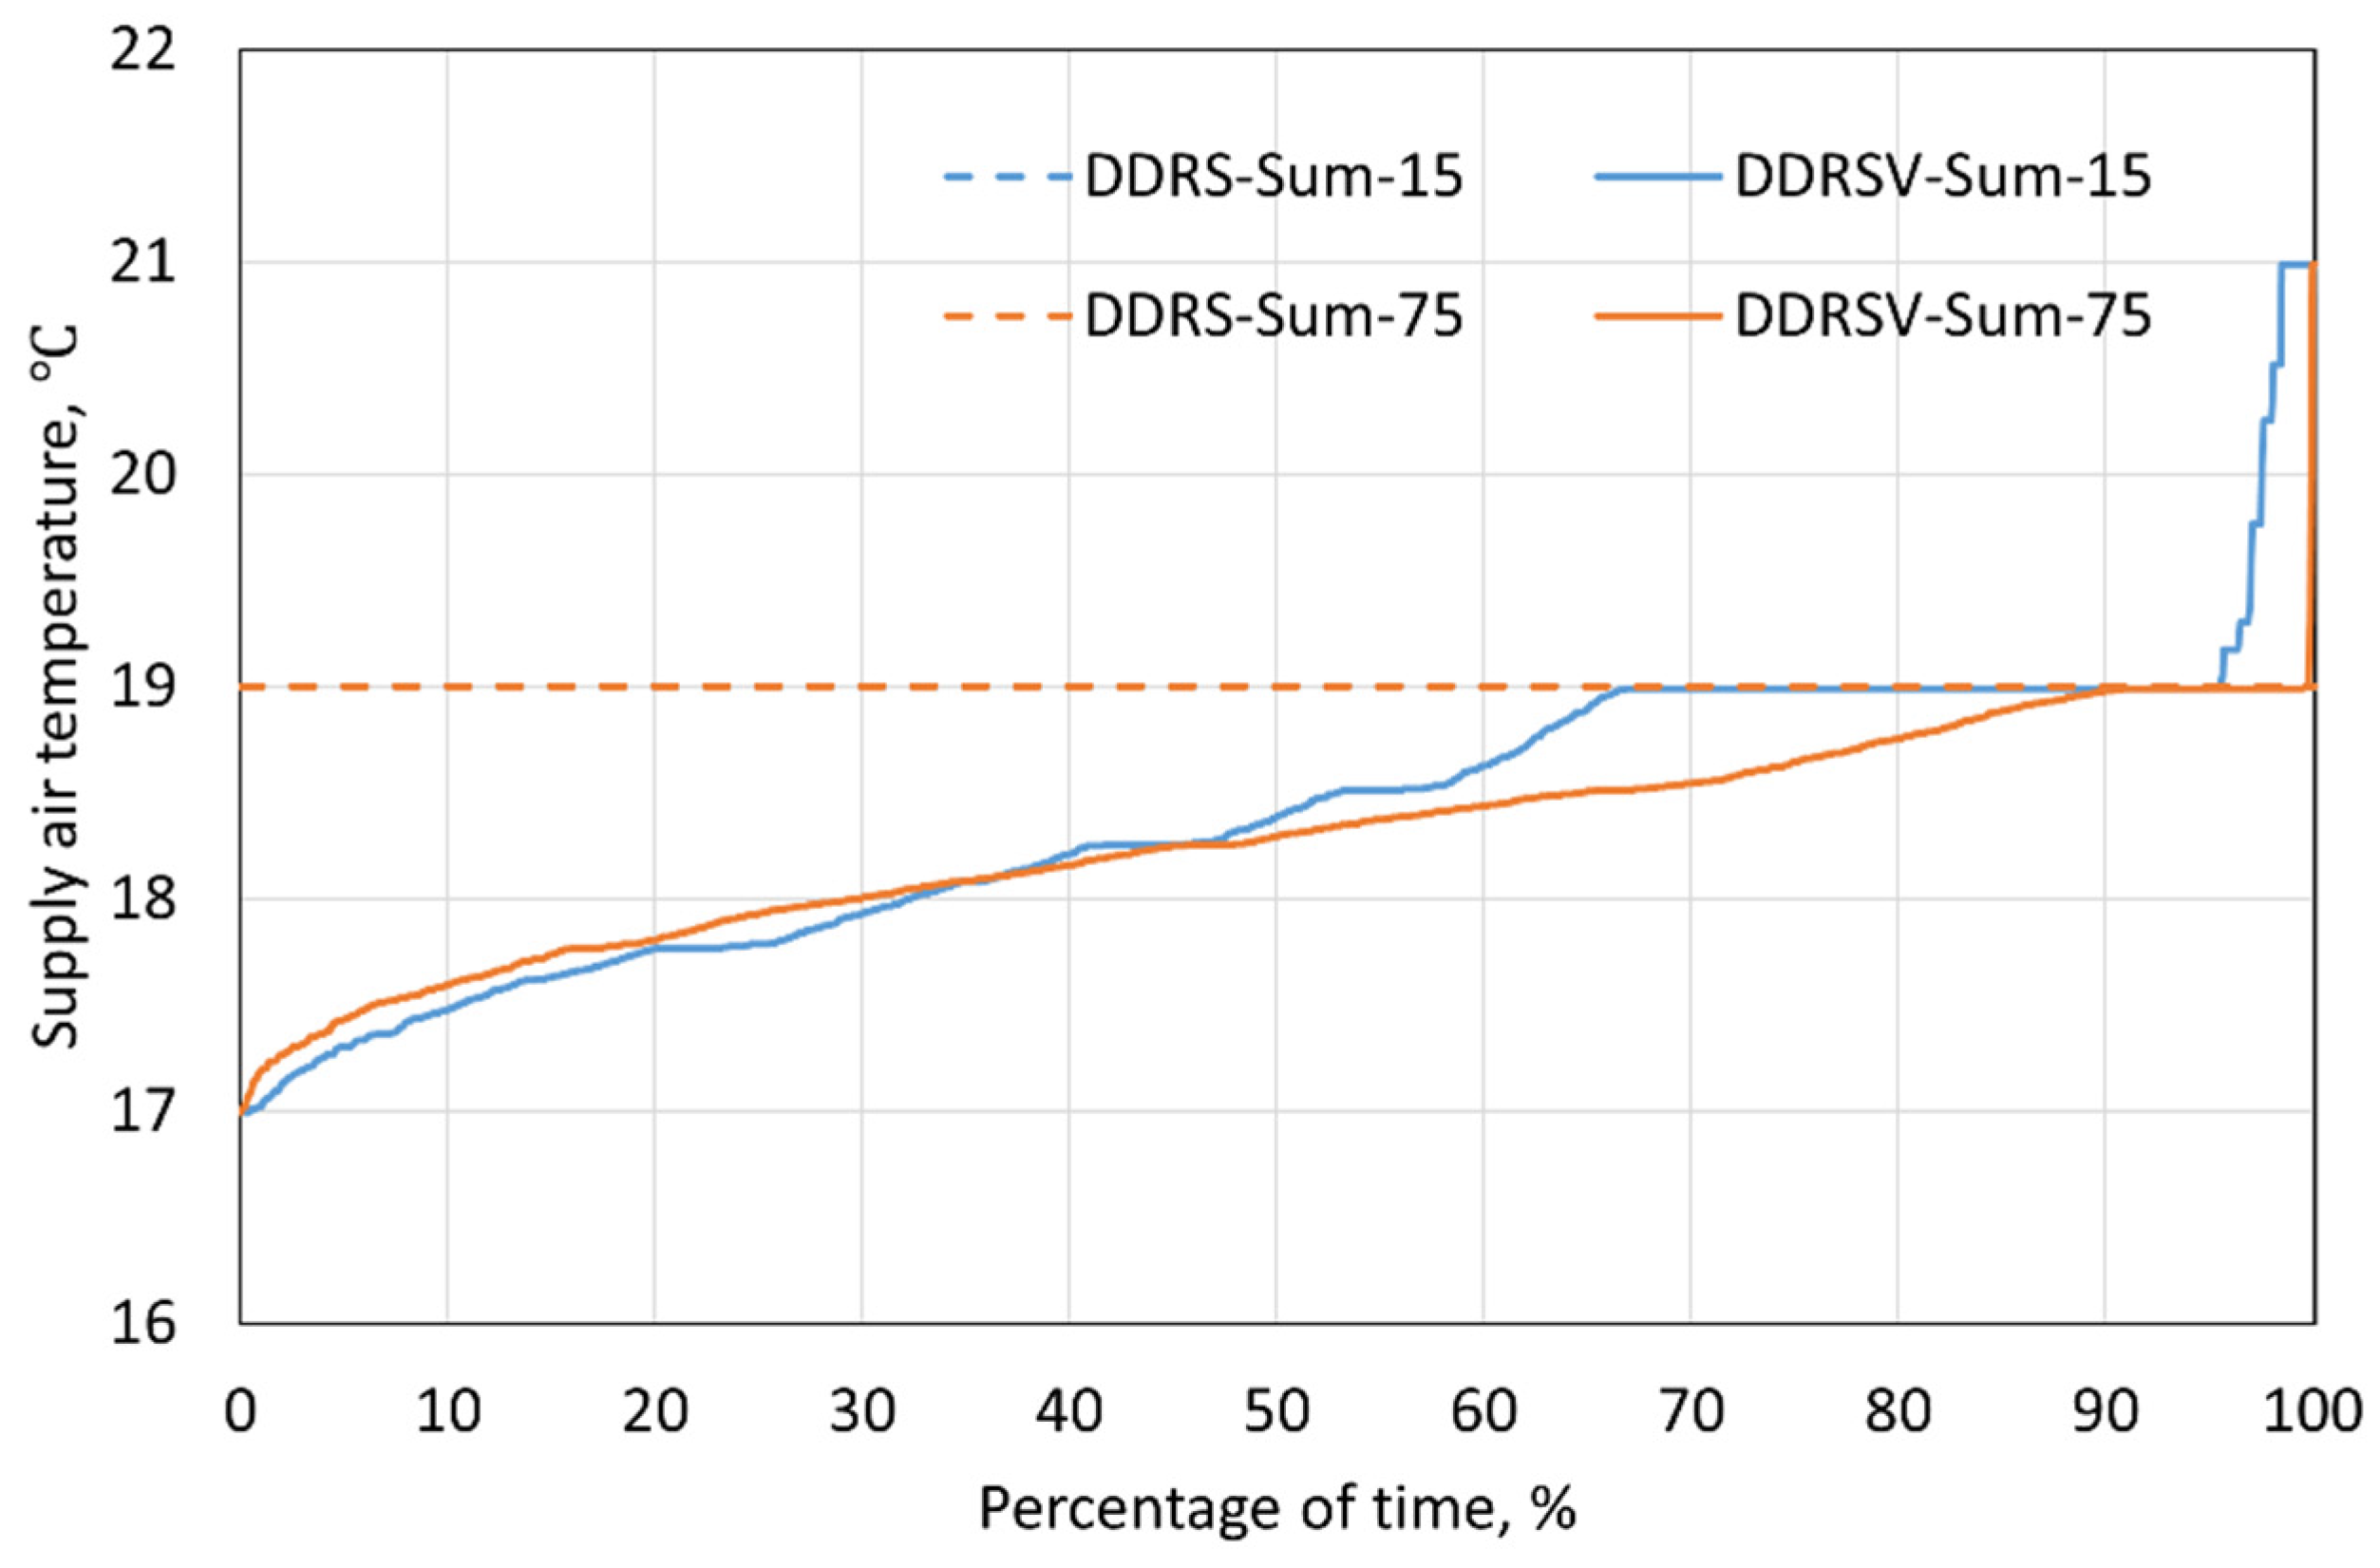
Figure 15 and Figure 16 visualize the duration of indoor air temperature of the coldest zone (Zone 1 shown in Figure 1) for low and high marginal values, respectively. Among the DR control algorithms, the DH-based DR control (SDRS-DH-15 and SDRS-DH-75) consistently results in the fewest hours with indoor temperatures below 21 °C, regardless of whether low or high marginal values are applied. In addition, it is evident that applying DR only to space heating results in more comfortable indoor conditions compared to applying DR to both space and ventilation heating. With a low marginal value, it can be observed that for more than 65% of the occupied time, the indoor air temperature is lower when DR is applied to both space heating and ventilation heating (DDRSV-Sum-15) compared to when it is applied only to space heating (DDRS-Sum-15). With a high marginal value, this extends to over 85% of the occupied time. This finding could be explained by the observation that the supply air temperature is below the normal setpoint of 19 °C for most of the occupied time as shown in Figure 17.
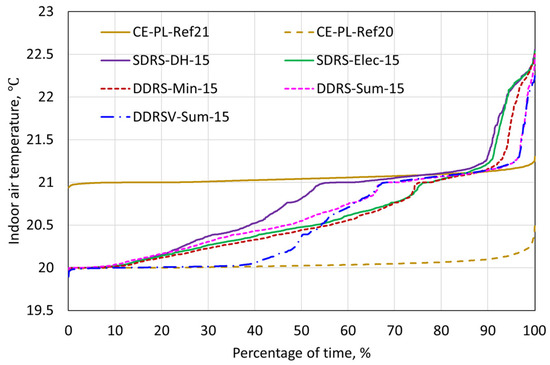
Figure 15.
Duration curves of indoor air temperature of reference cases and DR cases (marginal value of 15 €/MWh) during the occupied time in the heating season (October–April).
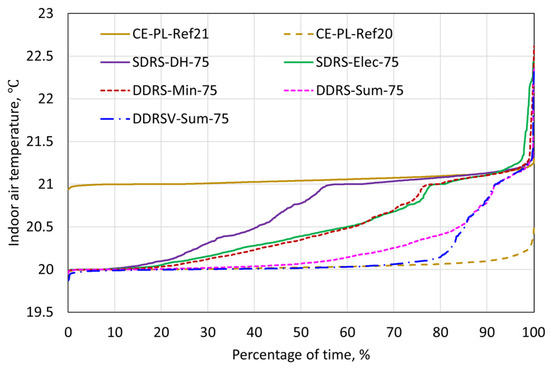
Figure 16.
Duration curves of indoor air temperature of reference cases and DR cases (marginal value of 75 €/MWh) during the occupied time in the heating season (October–April).
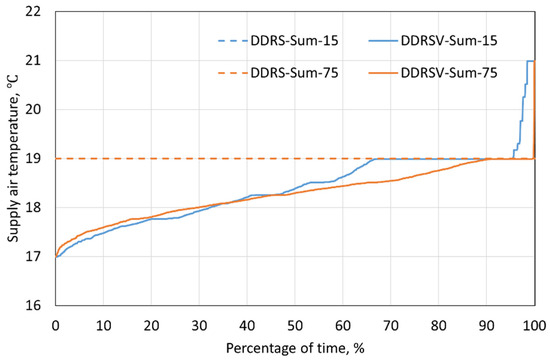
Figure 17.
Duration curves of supply air temperature in cases with and without DR in ventilation during the occupied time in the heating season (October–April).
4. Discussion
For building owners, the primary motivation to participate in DR programs may be the potential for cost savings. However, the goal of DR programs extends beyond reducing energy costs to include enhancing energy flexibility while preserving indoor thermal comfort as much as possible. The results showed that the highest cost savings (12.9%) can be achieved in the case using minimum indoor heating setpoints of 20 °C without using price-based DH control, which is the most beneficial approach for building owners from the economic point of view. However, this case only maintains the minimum acceptable indoor comfort condition for occupants. In additions, it does not provide energy flexibility to the electricity/DH network, which is not preferable from the aspect of energy producers. Given this conflict, the cost-optimal DR control case (DDRS-Sum-75) provides compromised solutions in terms of cost savings, indoor comfort, and energy flexibility.
To encourage building owners to participate in DR programs, energy producers could offer additional compensation or rewards. Since price-based DR depends on fluctuations in electricity and DH prices, it may sometimes result in minimal savings or even higher costs, which can deter participation. To address this, energy producers could provide rewards during periods when price-based DR control enhances energy flexibility or when it results in minimal savings or increased costs for building owners.
This study provides examples of implementing ruled-based DR based on dynamic pricing of electricity and DH in a hybrid heating system combining GSHP and DH. The proposed rule-based DR control algorithms are easier to implement for building owners compared to model-based or data-based DR control algorithms. However, this study also revealed the limitations of the developed rule-based DR control algorithms. Since rule-based control cannot predict the dynamic distribution of heat pumps and DH, charging and discharging signals are generated only based on energy price. In single-price DR control algorithms, the heating equipment’s response might not align with price trend signals. For example, in DH-based DR control, the GSHP might be used for charging in response to an increasing DH price trend. If the electricity price also rose, this charging action could be profitable. However, if the electricity price remained flat or decreased, the charging action would become unprofitable and could introduce unwanted flexibility to the electricity network. A similar unprofitable charging issue also occurred in the dual-price DR control algorithm using the minimum heating price method. In contrast, the price signal summation method effectively reduced the frequency of unprofitable charging and prevented unreasonable cost increases. However, this method might also miss opportunities for discharging that could lead to cost savings. To fully address the issue, additional rules need to be incorporated into the dual-price DR control algorithm. This can be explored in the future work.
The calculation of the energy flexibility factor introduces the interference effects from the setpoint smoothing and dynamic simulation. Setpoint smoothing is essential for DR to prevent the creation of additional power demand peaks [44]. By applying setpoint smoothing, the indoor setpoint was increased gradually for several hours instead of soaring abruptly in the next hour. When the original indoor air temperature setpoints were suddenly shifted from the minimum value (20 °C) to the maximum value (22 °C) in the next hour, the smoothing method could set a couple of setpoints between the minimum (20 °C) and normal setpoints (21 °C) for several hours. And these hours were recognized as discharging hours in the flexibility factor calculation. In addition, dynamic simulation may generate subtle differences in the results between the reference and DR cases regardless of the same temperature setpoint. These differences were also calculated as charging or discharging energy.
In this study, temperature setpoint regulation is limited to adjustments within a deadband of 1 °C and 2 °C based on a reference indoor heating setpoint of 21 °C and a reference supply air temperature of 18 °C, respectively. More sensitivity analyses could be carried out for different DR deadbands and reference temperature setpoints in the future. Additionally, as this study only tested DR control algorithms for a specific building insulation level and airtightness, future work could focus on a sensitivity analysis of DR benefits with varying levels of insulation and airtightness.
This study did not investigate DR control on borehole fields. The results indicate adjusting heating setpoints can affect not only the heating energy demand but also the cooling energy demand. This may affect the ground thermal imbalance and brine temperature recovery, potentially impacting the long-term performance of the GSHP system. Future research could explore more details regarding the long-term impact of DR control on hybrid GSHP systems.
5. Conclusions
This study investigated the effects of implementing DR control for a building heated by a hybrid GSHP system coupled to DH. A cost-effective control algorithm with power limitations on the GSHP and DH was used to optimize the operational sequencing of the GSHP and DH based on the dynamic electricity and DH prices. Four DR algorithms, a single-price algorithm based on DH, a single-price algorithm based on electricity, a dual-price algorithm using the minimum heating price method, and a dual-price algorithm using the price signal summation method, were compared for the application to space heating. In addition, the optimal DR algorithm regarding cost savings was also applied to both space and ventilation heating. The effects of two marginal values, 15 and 75 €/MWh, were tested for the DR control algorithms. The key findings are summarized below.
- The cost-effective control algorithm with power limitations can be applied for saving energy costs with minimal effects on indoor thermal comfort. Compared to the GSHP-prioritized control algorithm, the cost-effective control algorithm with power limitations can reduce the annual energy cost by 6.4%.
- The application of proposed four DR control algorithms to space heating significantly enhanced both electricity and DH flexibilities without compromising indoor comfort. The electricity flexibility factors range from 6.9 to 13.7% for charging and from −8.9 to −17.4% for discharging. The DH flexibility factors vary between 8.4 and 20.2% for charging and between −13.5 and −29.6% for discharging.
- A higher marginal value in the DR control algorithm reduced the duration of charging actions, resulting in decreased energy flexibility but more cost savings.
- Among the proposed DR control algorithms, the dual-price DR control algorithm using the price signal summation method achieved the highest cost-savings. When this control algorithm was applied to space heating in conjunction with cost-effective control and power limitations, the annual cost savings can be reduced by up to 10.8% compared to the reference case using GSHP-prioritized control without DR.
- When the dual-price DR control algorithm using the price signal summation method was extended to both space and ventilation heating, the annual cost savings was slightly reduced compared to when it was used only in space heating. Additionally, the duration for indoor air temperatures below the minimum setpoint was increased significantly.
Author Contributions
Conceptualization, T.X., J.J. and R.K.; methodology, T.X., J.J. and R.K.; soft-ware, T.X., J.J. and R.K.; validation, T.X., J.J. and R.K.; formal analysis, T.X.; investigation, T.X.; resources, J.J. and R.K.; data curation, J.J. and R.K.; writing—original draft preparation, T.X.; writing—review and editing, J.J. and R.K.; visualization, T.X.; supervision, J.J. and R.K.; project administration, R.K.; funding acquisition, R.K. and J.J. All authors have read and agreed to the published version of the manuscript.
Funding
This study was financially supported by the China Scholarship Council (No. 202006370019) and Aalto University Campus & Real Estate (No. 411086). Moreover, funding was provided by the B2RECoM project (No. 10784/31/2022), supported by Business Finland.
Data Availability Statement
Data are contained within the article.
Acknowledgments
The authors would like to appreciate Aalto University Campus & Real Estate (ACRE) for providing the technical information of the hybrid GSHP system. Additionally, the authors would like to specially thank Yuchen Ju and Pauli Hiltunen for their expert support related to the marginal production costs of district heating.
Conflicts of Interest
The authors declare no conflicts of interest.
References
- Tracking Buildings 2022. Available online: https://www.iea.org/energy-system/buildings (accessed on 11 January 2024).
- United Nations Environment Programme. 2022 Global Status Report for Buildings and Construction: Towards a Zero-emission, Efficient and Resilient Buildings and Construction Sector. 2022. Available online: https://wedocs.unep.org/20.500.11822/41133 (accessed on 11 January 2024).
- Jurjevic, R.; Zakula, T. Demand Response in Buildings: A Comprehensive Overview of Current Trends, Approaches, and Strategies. Buildings 2023, 13, 2663. [Google Scholar] [CrossRef]
- González-Torres, M.; Pérez-Lombard, L.; Coronel, J.F.; Maestre, I.R.; Yan, D. A review on buildings energy information: Trends, end-uses, fuels and drivers. Energy Rep. 2022, 8, 626–637. [Google Scholar] [CrossRef]
- Menegazzo, D.; Lombardo, G.; Bobbo, S.; De Carli, M.; Fedele, L. State of the Art, Perspective and Obstacles of Ground-Source Heat Pump Technology in the European Building Sector: A Review. Energies 2022, 15, 2685. [Google Scholar] [CrossRef]
- SULPU. Available online: https://www.sulpu.fi/english/ (accessed on 11 January 2024).
- Majuri, P. Technologies and environmental impacts of ground heat exchangers in Finland. Geothermics 2018, 73, 124–132. [Google Scholar] [CrossRef]
- Arghand, T.; Javed, S.; Trüschel, A.; Dalenbäck, J.O. Control methods for a direct-ground cooling system: An experimental study on office cooling with ground-coupled ceiling cooling panels. Energy Build. 2019, 197, 47–56. [Google Scholar] [CrossRef]
- Xu, L.; Pu, L.; Zhang, S.; Li, Y. Hybrid ground source heat pump system for overcoming soil thermal imbalance: A review. Sustain. Energy Technol. Assess. 2021, 44, 101098. [Google Scholar] [CrossRef]
- Atam, E.; Patteeuw, D.; Antonov, S.P.; Helsen, L. Optimal Control Approaches for Analysis of Energy Use Minimization of Hybrid Ground-Coupled Heat Pump Systems. IEEE Trans. Control Syst. Technol. 2016, 24, 525–540. [Google Scholar] [CrossRef]
- Figueroa, I.C.; Picard, D.; Helsen, L. Short-term modeling of hybrid geothermal systems for Model Predictive Control. Energy Build. 2020, 215, 109884. [Google Scholar] [CrossRef]
- Puttige, A.R.; Andersson, S.; Östin, R.; Olofsson, T. Modeling and optimization of hybrid ground source heat pump with district heating and cooling. Energy Build. 2022, 264, 112065. [Google Scholar] [CrossRef]
- Le Dréau, J.; Heiselberg, P. Energy flexibility of residential buildings using short term heat storage in the thermal mass. Energy 2016, 111, 991–1002. [Google Scholar] [CrossRef]
- Chen, Y.; Xu, P.; Gu, J.; Schmidt, F.; Li, W. Measures to improve energy demand flexibility in buildings for demand response (DR): A review. Energy Build. 2018, 177, 125–139. [Google Scholar] [CrossRef]
- Schibuola, L.; Scarpa, M.; Tambani, C. Demand response management by means of heat pumps controlled via real time pricing. Energy Build. 2015, 90, 15–28. [Google Scholar] [CrossRef]
- Arteconi, A.; Hewitt, N.J.; Polonara, F. Domestic demand-side management (DSM): Role of heat pumps and thermal energy storage (TES) systems. Appl. Therm. Eng. 2013, 51, 155–165. [Google Scholar] [CrossRef]
- Arteconi, A.; Costola, D.; Hoes, P.; Hensen, J.L.M. Analysis of control strategies for thermally activated building systems under demand side management mechanisms. Energy Build. 2014, 80, 384–393. [Google Scholar] [CrossRef]
- Carvalho, A.D.; Moura, P.; Vaz, G.C.; De Almeida, A.T. Ground source heat pumps as high efficient solutions for building space conditioning and for integration in smart grids. Energy Convers. Manag. 2015, 103, 991–1007. [Google Scholar] [CrossRef]
- D’Ettorre, F.; De Rosa, M.; Conti, P.; Testi, D.; Finn, D. Mapping the energy flexibility potential of single buildings equipped with optimally-controlled heat pump, gas boilers and thermal storage. Sustain. Cities Soc. 2019, 50, 101689. [Google Scholar] [CrossRef]
- Yu, Y.J. Demand-Side-Management with Heat Pumps for Single Family Houses. In Proceedings of the 13th Conference of the International Building Performance Simulation Association, Chambery, France, 26–28 August 2013. [Google Scholar]
- Osterman, E.; Stritih, U. Review on compression heat pump systems with thermal energy storage for heating and cooling of buildings. J. Energy Storage 2021, 39, 102569. [Google Scholar] [CrossRef]
- Finck, C.; Li, R.; Zeiler, W. Optimal control of demand flexibility under real-time pricing for heating systems in buildings: A real-life demonstration. Appl. Energy 2020, 263, 114671. [Google Scholar] [CrossRef]
- Loesch, M.; Hufnagel, D.; Steuer, S.; Fabßnacht, T.; Schmeck, H. Demand side management in smart buildings by intelligent scheduling of heat pumps. In Proceedings of the 2014 IEEE International Conference on Intelligent Energy and Power Systems (IEPS), Kyiv, Ukraine, 2–6 June 2014; pp. 209–214. [Google Scholar] [CrossRef]
- Fitzpatrick, P.; D’Ettorre, F.; De Rosa, M.; Yadack, M.; Eicker, U.; Finn, D.P. Influence of electricity prices on energy flexibility of integrated hybrid heat pump and thermal storage systems in a residential building. Energy Build. 2020, 223, 110142. [Google Scholar] [CrossRef]
- Yoon, J.H.; Baldick, R.; Novoselac, A. Dynamic demand response controller based on real-time retail price for residential buildings. IEEE Trans. Smart Grid. 2014, 5, 121–129. [Google Scholar] [CrossRef]
- Alimohammadisagvand, B.; Jokisalo, J.; Sirén, K. Comparison of four rule-based demand response control algorithms in an electrically and heat pump-heated residential building. Appl. Energy 2018, 209, 167–179. [Google Scholar] [CrossRef]
- Avci, M.; Erkoc, M.; Rahmani, A.; Asfour, S. Model predictive HVAC load control in buildings using real-time electricity pricing. Energy Build. 2013, 60, 199–209. [Google Scholar] [CrossRef]
- Baniasadi, A.; Habibi, D.; Bass, O.; Masoum, M.A.S. Optimal Real-Time Residential Thermal Energy Management for Peak-Load Shifting With Experimental Verification. IEEE Trans. Smart Grid. 2018, 10, 5587–5599. [Google Scholar] [CrossRef]
- Finnish Energy. Energy Year 2023 District Heating. 2024. Available online: https://energia.fi/en/statistics/statistics-on-district-heating/ (accessed on 11 January 2024).
- Guelpa, E.; Verda, V. Demand response and other demand side management techniques for district heating: A review. Energy 2021, 219, 119440. [Google Scholar] [CrossRef]
- Cai, H.; Ziras, C.; You, S.; Li, R.; Honoré, K.; Bindner, H.W. Demand side management in urban district heating networks. Appl. Energy 2018, 230, 506–518. [Google Scholar] [CrossRef]
- Ju, Y.; Hiltunen, P.; Jokisalo, J.; Kosonen, R.; Syri, S. Benefits through Space Heating and Thermal Storage with Demand Response Control for a District-Heated Office Building. Buildings 2023, 13, 2670. [Google Scholar] [CrossRef]
- Xue, T.; Jokisalo, J.; Kosonen, R. Cost-Effective Control of Hybrid Ground Source Heat Pump (GSHP) System Coupled with District Heating. Buildings 2024, 14, 1724. [Google Scholar] [CrossRef]
- Sahlin, P. Modeling and Simulation Methods for Modular Continuous Systems in Buildings. Ph.D. Thesis, Royal Institute of Technology, Stockholm, Sweden, 1996. Available online: https://www.equa.se/dncenter/thesis.pdf (accessed on 11 January 2024).
- Kropf, S.; Zweifel, G. Validation of the Building Simulation Program IDA-ICE According to CEN 13791 “Thermal Performance of Buildings—Calculation of Internal Temperatures of a Room in Summer Without Mechanical Cooling—General Criteria and Validation Procedures”. Available online: http://www.equaonline.com/iceuser/validation/ICE_vs_prEN%2013791.pdf (accessed on 11 January 2024).
- EQUA Simulation A., B. Validation of IDA Indoor Climate and Energy 4.0 with respect to CEN Standards EN 15255-2007 and EN 15265-2007. 2010. Available online: http://www.equaonline.com/iceuser/validation/CEN_VALIDATION_EN_15255_AND_15265.pdf (accessed on 15 March 2024).
- EQUA Simulation A. B. Validation of IDA Indoor Climate and Energy 4.0 Build 4 with Respect to ANSI/ASHRAE Standard 140-2004. 2010. Available online: http://www.equaonline.com/iceuser/validation/ASHRAE140-2004.pdf (accessed on 15 March 2024).
- Xue, T.; Jokisalo, J.; Kosonen, R.; Vuolle, M.; Marongiu, F.; Vallin, S.; Leppäharju, N.; Arola, T. Experimental evaluation of IDA ICE and COMSOL models for an asymmetric borehole thermal energy storage field in Nordic climate. Appl. Therm. Eng. 2022, 217, 119261. [Google Scholar] [CrossRef]
- Xue, T.; Jokisalo, J.; Kosonen, R. Design of High-Performing Hybrid Ground Source Heat Pump. Buildings 2023, 13, 1825. [Google Scholar] [CrossRef]
- Ministry of Environment. Decree (1010/2017) on the Energy Performance of the New Building. Helsinki. Finland. 2017. Available online: https://ym.fi/en/the-national-building-code-of-finland (accessed on 22 May 2024).
- Publication K1/2021. Rakennusten kaukolämmitys-Määräykset ja Ohjeet-Julkaisu K1/2021(District Heating of Buildings-Regulations and Guidelines-Publication K1/2021). 2021. Available online: https://energia.fi/julkaisut/rakennusten-kaukolammitys-maaraykset-ja-ohjeet-julkaisu-k1-2021/ (accessed on 15 March 2024).
- Alimohammadisagvand, B.; Jokisalo, J.; Kilpeläinen, S.; Ali, M.; Sirén, K. Cost-optimal thermal energy storage system for a residential building with heat pump heating and demand response control. Appl. Energy 2016, 174, 275–287. [Google Scholar] [CrossRef]
- SFS-EN 16798-1; Energy Performance of Buildings. Ventilation for Buildings. Part 1: Indoor Environmental Input Parameters for Design and Assessment of Energy Performance of Buildings Addressing Indoor Air Quality, Thermal Environment, Lighting and Acoustics. Module M1-6. Finnish Standards Association: Helsinki, Finland, 2019.
- Ju, Y.; Jokisalo, J.; Kosonen, R.; Kauppi, V.; Janβen, P. Analyzing power and energy flexibilities by demand response in district heated buildings in Finland and Germany. Sci. Technol. Built Environ. 2021, 27, 1440–1460. [Google Scholar] [CrossRef]
- Nord Pool. Market Data. 2023. Available online: https://data.nordpoolgroup.com/auction/day-ahead/prices?deliveryDate=latest¤cy=EUR&aggregation=DeliveryPeriod&deliveryAreas=AT,FI (accessed on 11 January 2024).
- Finnish Meteorological Institute. Heating Degree Days. 2024. Available online: https://en.ilmatieteenlaitos.fi/heating-degree-days?7r87D3pXt5h3S3AkDpM0uF_q=y%253D2018 (accessed on 9 September 2024).
Disclaimer/Publisher’s Note: The statements, opinions and data contained in all publications are solely those of the individual author(s) and contributor(s) and not of MDPI and/or the editor(s). MDPI and/or the editor(s) disclaim responsibility for any injury to people or property resulting from any ideas, methods, instructions or products referred to in the content. |
© 2024 by the authors. Licensee MDPI, Basel, Switzerland. This article is an open access article distributed under the terms and conditions of the Creative Commons Attribution (CC BY) license (https://creativecommons.org/licenses/by/4.0/).

