Abstract
This research presents a solution for improving energy efficiency in convenience stores by implementing a building energy management system (BEMS) that uses new logic control in air conditioning and refrigeration systems. These systems currently consume the most energy in convenience stores. Implementing this system not only reduces the energy consumption of the compressors in both systems but also minimizes energy loss due to low desired temperatures in the sale area while maintaining the cabinet temperature at the same level. An experiment was conducted at a 314-square-meter convenience store that was open from 6:00 a.m. to 11:00 p.m., and we demonstrated a 4.4-year payback period by controlling AC units close to the desired sale-area temperature of 25 degrees Celsius and increasing the suction pressure at a medium-temperature CDU by 0.3 bar or 31 kPa. This resulted in energy savings of 7.1 kilowatt-hours per day, or 2591.5 kilowatt-hours per year, for the air conditioning system and 2.8 kilowatt-hours per day, or 1022.0 kilowatt-hours per year, for the refrigeration system, resulting in a total energy savings of 9.9 kilowatt-hours per day, or 3613.5 kilowatt-hours per year. The convenience store can use the results of this research to improve the energy efficiency of its cooling system, which includes air conditioning and refrigeration systems, thereby promoting sustainable energy conservation.
1. Introduction
The national energy plan for Thailand is to achieve carbon neutrality by 2065. One of the challenging issues that a nation confronts is energy conservation, which is of great importance. Thailand’s energy consumption has been increasing annually, particularly in the area of electrical energy, and in 2023, the business sector in Thailand was responsible for approximately 40.0% of all electricity consumption [1]. Thus, a challenge was issued to enhance energy efficiency in the business sector, despite a 5.5% decrease in final energy consumption since 2019. This decrease was a result of the COVID-19 pandemic and a worldwide economic deceleration, which also had a direct impact on European nations in 2020 [2]. The energy consumption of the business sector in Thailand has consistently risen every year, with retail business being a significant contributor. Furthermore, during the past decade, there has been significant growth in the number of supermarkets, including smaller ones known as convenience stores, which are characterized by their high energy usage intensity (EUI). In 2023, there were over 20,090 convenience stores in Thailand, and these stores are expected to continue increasing in number each year [3,4,5]. Additionally, 80% of these stores operate 24 h a day, 7 days a week, consuming more energy than residential buildings [6]. Convenience stores, as a part of the retail business sector, rank fourth in terms of energy consumption in Thailand. The energy consumption of convenience stores in Taiwan is determined by factors such as the business area, store size, equipment quantity (particularly refrigeration and freezers), and the running hours of the store equipment. This is similar to the situation in the UK [7,8]. Moreover, in Thailand, the primary power usage in convenience stores is attributed to air conditioning systems, lighting systems, thermal heating systems, and refrigeration [9]. In this research, we focused on energy reductions at convenience stores, which are a part of the business sector and are increasing in number every year [4,5]. Because the consumer lifestyle in Thailand has changed to a comfortable and easy way of life with access to convenience stores, most convenience stores are located in community centers or roadside commercial buildings and sell various cheap consumer goods. They are located in both rural and urban centers in each community. The energy used by convenience stores in Thailand is ranked from high to low as follows: air conditioning systems use 46.2%, equipment (for heating and refrigeration purposes) uses 34.6%, and lighting uses 19.2% [10]. Convenience stores in Taiwan are similar to those in Thailand. Their energy usage is ranked as follows: air conditioners use 32.88%, freezers and refrigerators use 24.53%, lighting equipment uses 20.03%, heating equipment uses 19.3%, and other equipment uses 3.26% [7].
In addition, previous studies found that air conditioning and refrigeration systems consume the most energy at convenience stores. Therefore, this research aimed to reduce the energy consumption of these systems in convenience stores. It focused on a proposed strategy for operating air conditioning and refrigeration systems, using energy management systems (EMSs) and IoT systems concepts to manage and control the systems.
2. Related Work
This section reviews previous research in three specific areas: EMSs in many fields and energy-saving strategies for air conditioning and refrigeration systems.
2.1. Energy Management Systems
An energy management control system (EMCS) is a centralized system designed to efficiently operate the equipment of a building. These systems are also referred to by several alternative terms, such as “energy management systems” (EMSs) or “smart building controls”. A typical system consists of a central computer, programmable spread-out controllers, and a digital communication system. The communication system can facilitate direct transmission of signals between the computer and the controlled equipment, or it may include multiple levels of connection. EMSs have been employed in diverse domains encompassing residential, commercial, industrial, and communal settings and have also been integrated into numerous applications.
2.1.1. Home Energy Management Systems (HEMSs)
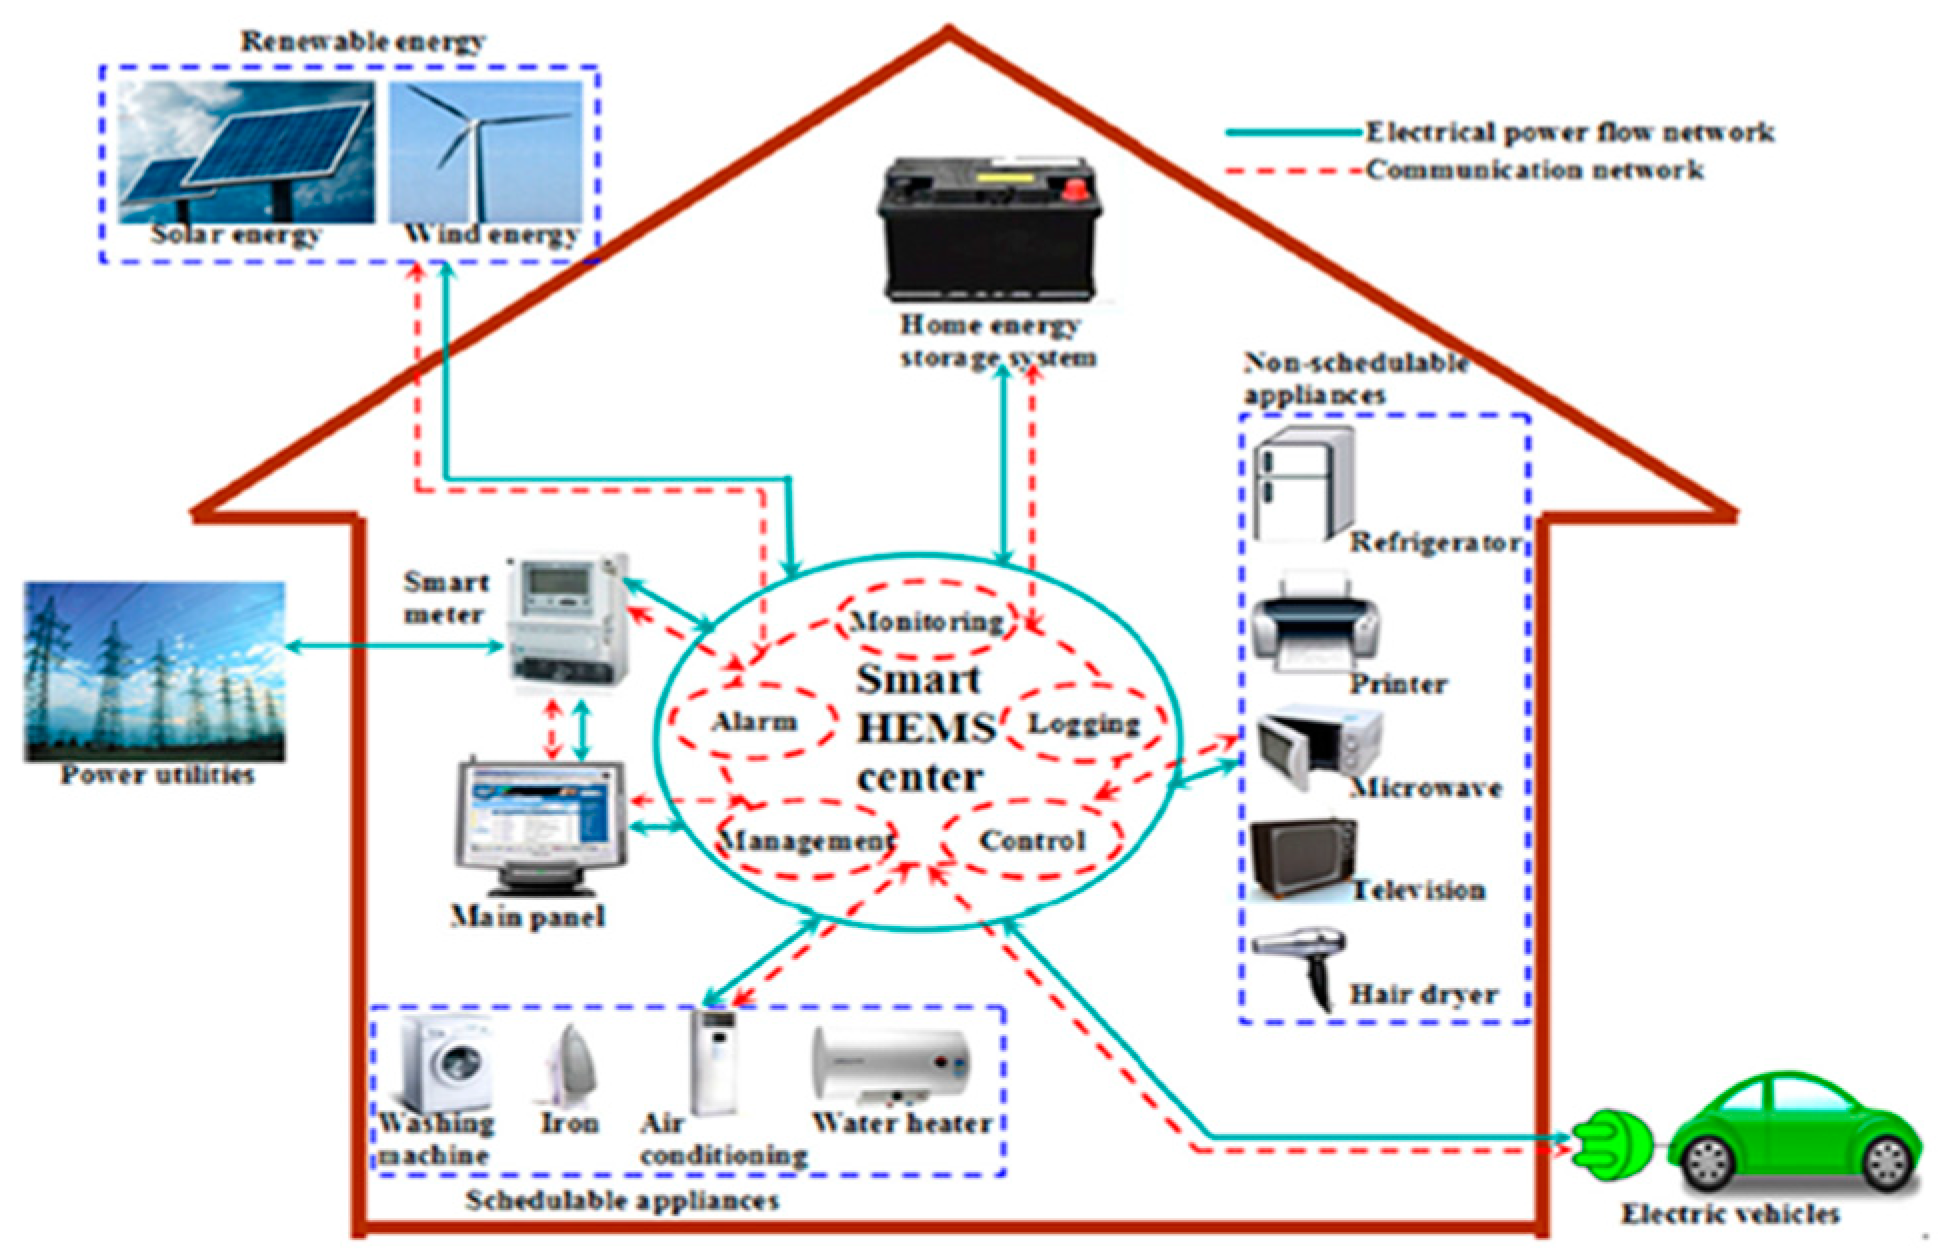
The influence of modern technologies on people’s daily lives is under consideration. I would like my home to be clever. An HEMS is an intelligent network control system that combines electricity generation, consumption, and administration. It attempts to increase customers’ power efficiency and enable communication with the grid, allowing for two-way energy flow [11]. The first HEMS applications were launched in several countries, including the USA, Germany, Italy, Britain, the Netherlands, Denmark, Japan, and China. Most of them were executed through the installation of smart meters [12]. HEMSs usually consist of modules that include monitoring, recording, logging, control, management, and alarm capabilities. These modules are made up of interconnected sensors, monitors, interfaces, appliances, and devices. These technologies facilitate the process of automation and provide the ability to control the household environment, both locally and remotely [13]. The monitoring module tracks energy use in real time and displays the operational statuses of appliances. The recording or logging module captures and stores data on power usage, including information on home appliances, distributed energy, and the statuses of energy storage systems (ESSs). The control module is divided into two categories: direct control and remote control. This allows users to view the usage modes and equipment statuses of home appliances online. The alarm module was designed to detect and report any problematic circumstances. When an alarm is triggered, it is generated and transmitted to the HEMS interface. The management module offers many services to enhance the efficiency of power consumption and optimize the operation of residential households [11,12]. Figure 1 illustrates a design that integrates renewable energy generation and home energy storage systems with an HEMS. The HEMS center’s design consists of a centralized smart controller that offers the owner monitoring modules and control functionalities through a home communication network or wireless data communication [14]. The primary panel of a smart HEMS may collect real-time data on electricity use from all appliances in a home, including those that can and cannot be scheduled. This information may then be utilized to ensure appropriate demand dispatch. In practice, a house gateway, such as a smart meter, may also operate as an interactive communication connection between power utilities and a smart house. An electric vehicle (EV) is a specific type of load that may be planned. They not only use energy from power grids to suit residents’ mobility demands; they also supply emergency power to other home loads inside smart community environments.
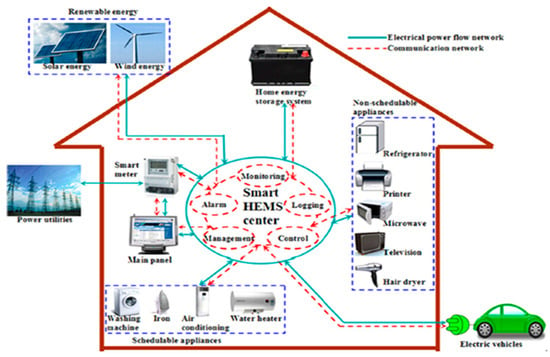
Figure 1.
The overall architecture of a representative HEMS [11].
The main benefits of an HEMS are its capacity to decrease energy costs or energy invoices, as well as to offer grid services such as reducing peak energy demand and providing demand flexibility. Nevertheless, the presence of uncertainty in domestic energy systems poses a substantial problem and has the potential to diminish the advantages of an HEMS for both homeowners and grid operators [15]. However, it is important for HEMSs to align with the goal of offering comfort and convenience to occupants [16]. HEMSs observe the patterns of energy consumption in their residences. The researchers’ contribution to the field of HEMSs involved proposing a model to effectively control and manage energy consumption. This was achieved by optimizing load scheduling, integrating renewable power generation, and utilizing energy storage systems (EESs). The optimization problem was addressed using mathematical models such as mixed-integer linear programming (MILP) [17,18]; a linear regression model, which resulted in energy savings of 19% [19]; Particle Swarm Optimization (PSO); and a Genetic Algorithm (GA). These approaches successfully achieved reductions in energy consumption of 27.32% and 31.42%, respectively [20]. Additionally, redistributing the load from peak to off-peak periods helps to minimize costly time periods [16,17,21,22,23]. The devices within a household are linked to the Internet of Things (IoT) system to facilitate surveillance and management. The energy usage of a residence is directly proportional to the amount of power stored in a battery from a solar power supply during periods of increased power usage. A system will efficiently manage reserve power consumption, particularly at peak times, such as when a vehicle battery is being charged or when there is high power consumption from home appliances. A meter records all energy consumption. This enables the identification of people’s energy consumption patterns and facilitates the development of innovative ways to decrease energy usage by regulating equipment operation. Additionally, it has the potential to stabilize energy consumption costs. Furthermore, certain studies have examined the field of energy management in smart houses, specifically investigating the organizational structures and methodologies employed in local communities. The evaluated system depends on a range of demand-side management or demand response algorithms, as well as scheduling of household appliances and generation and storage devices [24]. When a house is larger, has more equipment, and has rooms that are proportional to a large building, an energy management system developed for use in the building is called a building energy management system.
2.1.2. Building Energy Management Systems (BEMSs)
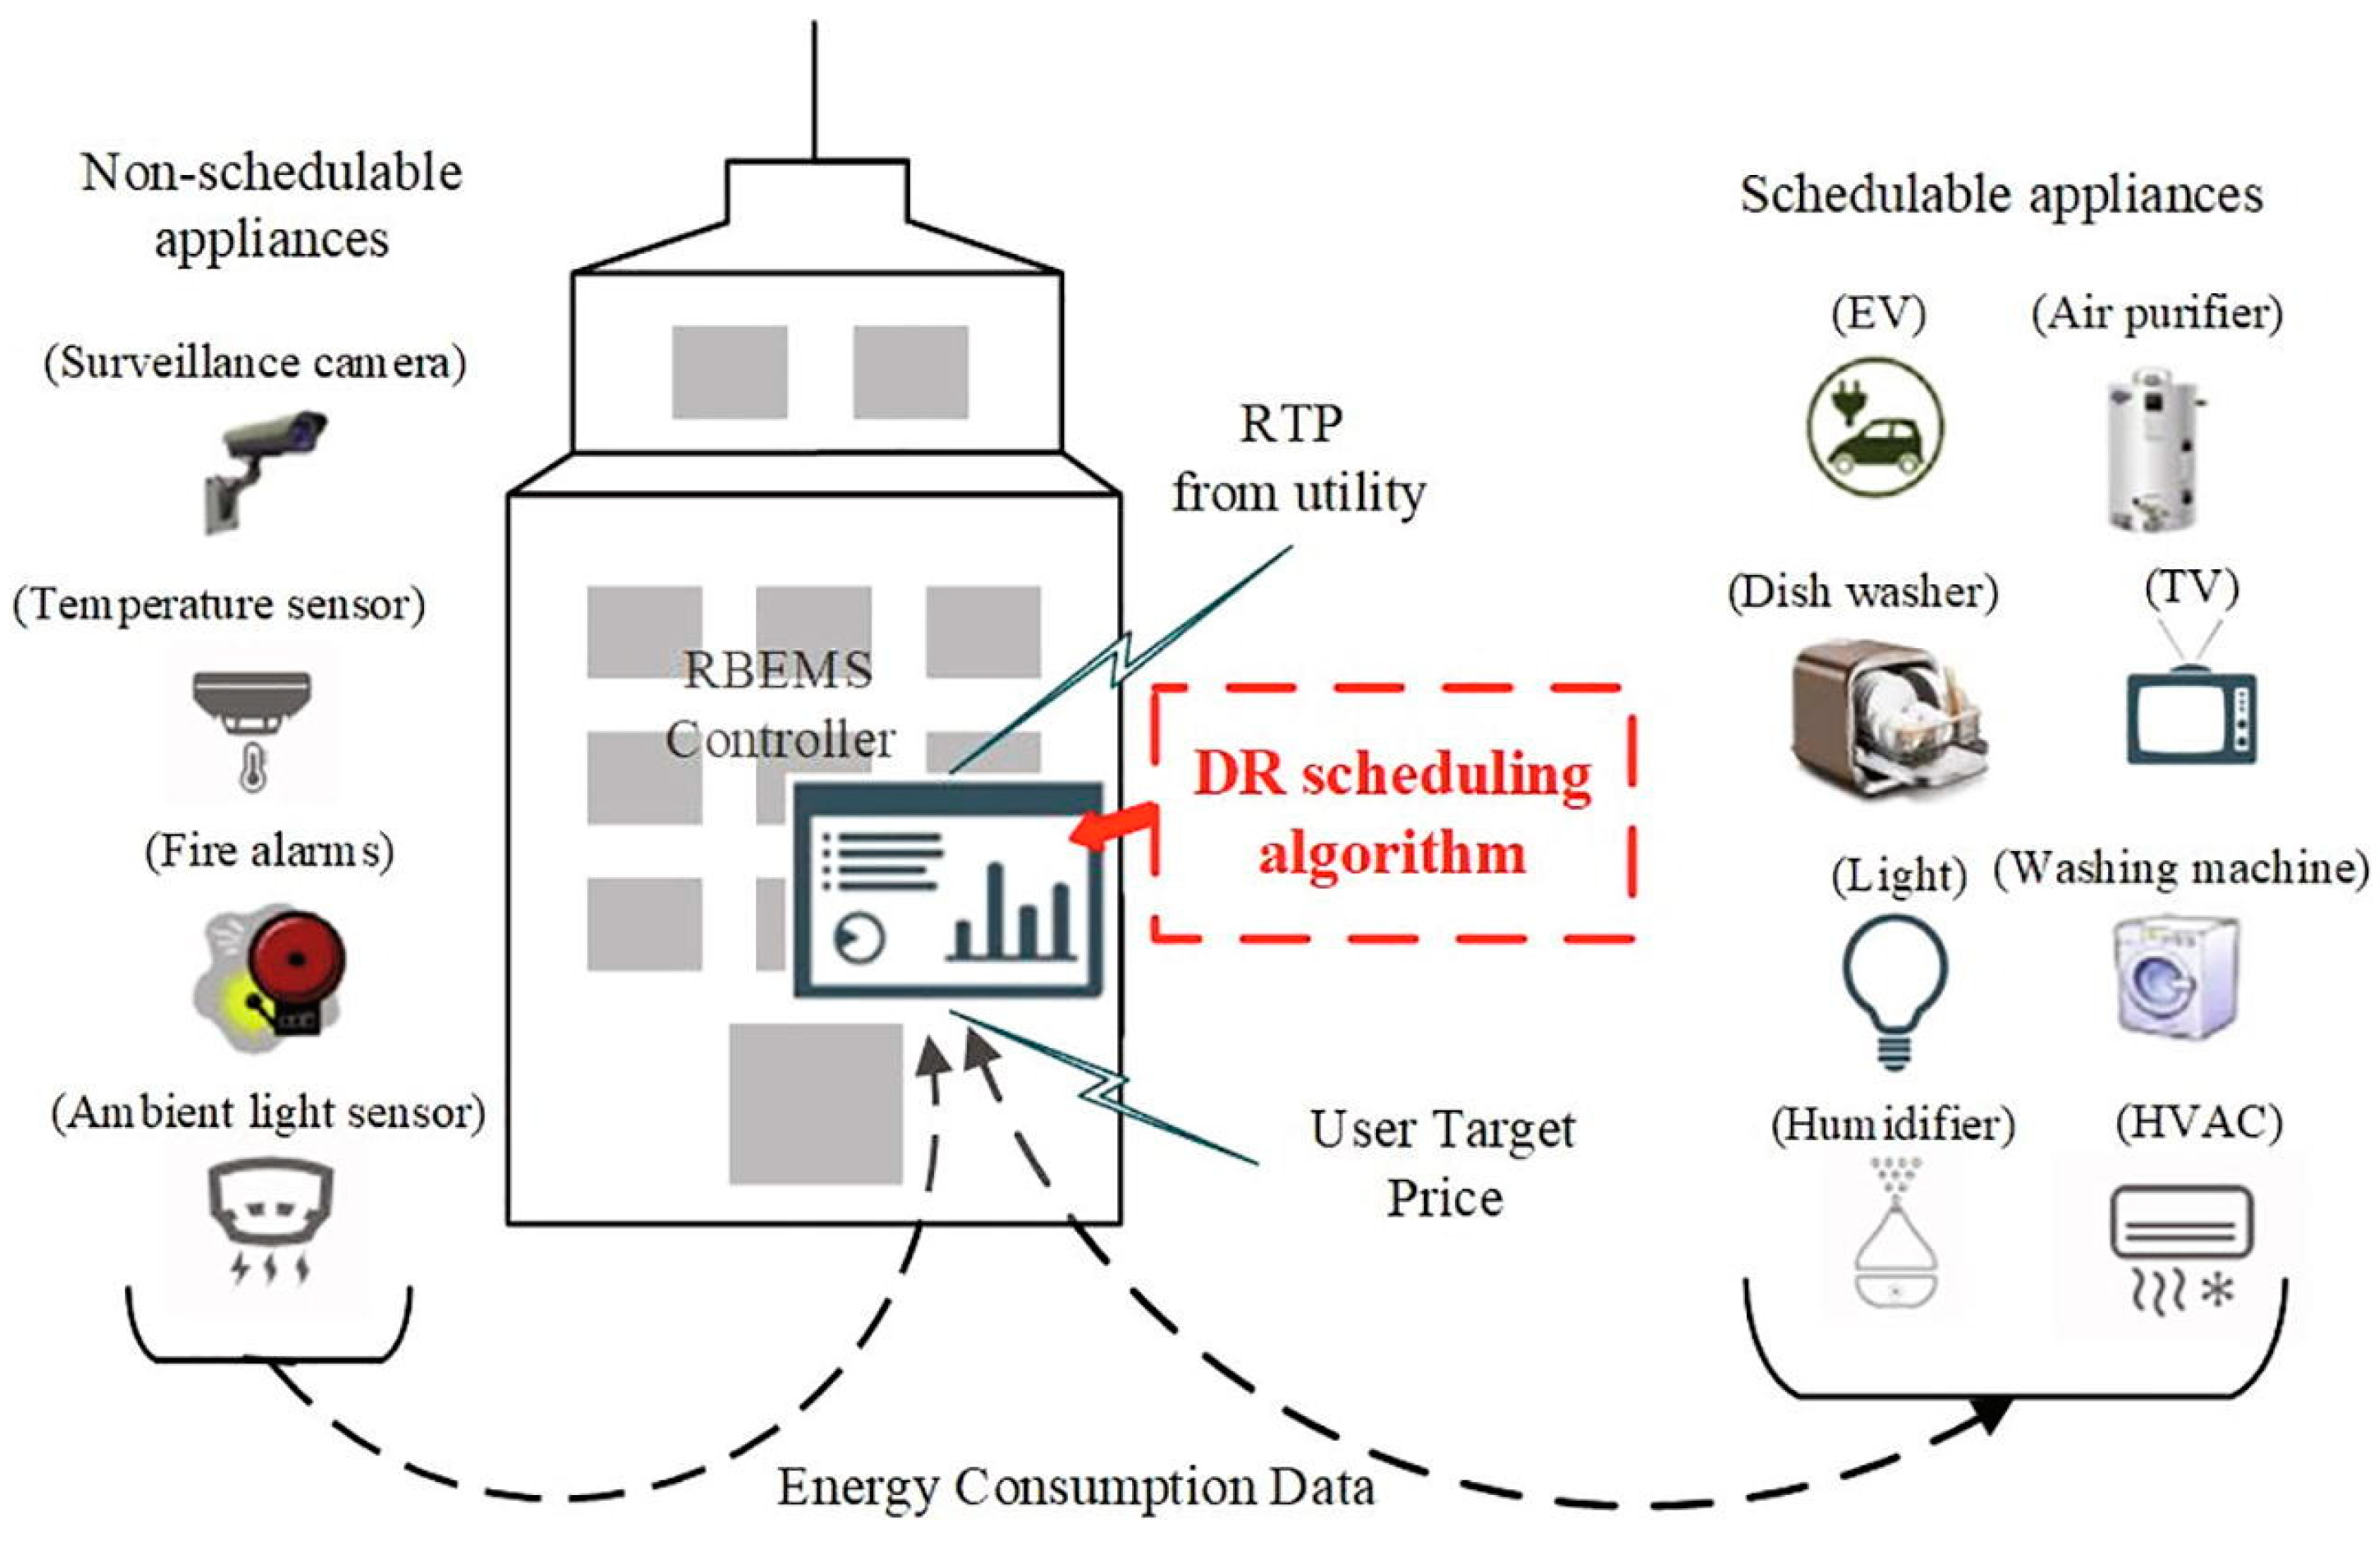
Currently, commercial buildings utilize around 19% of the primary energy used in the building sector, which accounts for over 41% of global energy consumption [25]. The authors intended to investigate methods for minimizing energy usage in structures with BEMSs, which are a widely used technology that assists facility managers in efficiently monitoring energy use and making decisions for building management. The primary goal of BEMSs is to monitor, control, and manage energy use in buildings, with the aim of achieving higher efficiency compared to traditional systems and satisfying the Nearly Zero-Energy Building (NZEB) goal [26]. An optimal BEMS enhances the comfort of occupants of structures. A BEMS typically incorporates IoT technology to link and utilize smart meters and sensors for monitoring purposes. A controller unit, a crucial component of an EMS, enables communication and facilitates the exchange of commands to accomplish energy reduction. In this section, we conduct a comparison between the HEMS from Section 2.1.1 and a BEMS. While there may be several operating controls, the primary devices and their performance remain consistent. BEMSs are typically implemented in large buildings that house many machines and appliances, such as heating, ventilation, and air conditioning systems (HVAC). An HVAC system in a huge building, including chillers, is regulated to accommodate many rooms and different types of power reserves. Similarly, production of cold water can be regulated by storing cold water in an HVAC system through heat recovery during periods of low demand or at night. This can effectively decrease the amount of electricity consumed during peak hours or during the day. Figure 2 depicts a schematic diagram of an energy management system for residential buildings with a BEMS controller as its central component. Buildings seek to incorporate demand response scheduling into the controller. This process involves distributing limited energy to appliances based on energy consumption data, the user’s target price (UTP), and real-time electricity prices provided by utility suppliers. The system controls the functioning of all devices in the buildings by adjusting when appliances and machinery are turned on and off based on changes in electricity prices to avoid times when energy costs are high, resulting in a potential reduction of 15.1% in overall energy expenses [27]. The appliances in a building can be categorized into schedulable and non-schedulable appliances. BEMSs are building energy management systems. They are equipment that can be adjusted to operate during periods with low power prices. However, it is also important to consider the comfort index of the inhabitants [28].
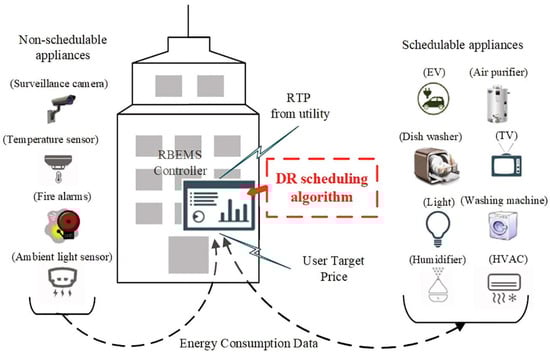
Figure 2.
Building energy management system (BEMS) [27].
However, the challenge of lowering energy usage while still ensuring comfortable conditions in buildings is a common optimization problem that necessitates intelligent system design [29]. Artificial intelligence (AI) approaches are applied to control systems in order to assess their outputs. These techniques are utilized to find the optimal balance between energy consumption in HVAC systems and the desired comfort levels of occupants. A study revealed that the use of this technology resulted in average energy savings ranging from 21.18% to 44.36% and average improvements in comfort ranging from 21.67% to 85.77% [30].
2.1.3. Factory Energy Management Systems (FEMSs)
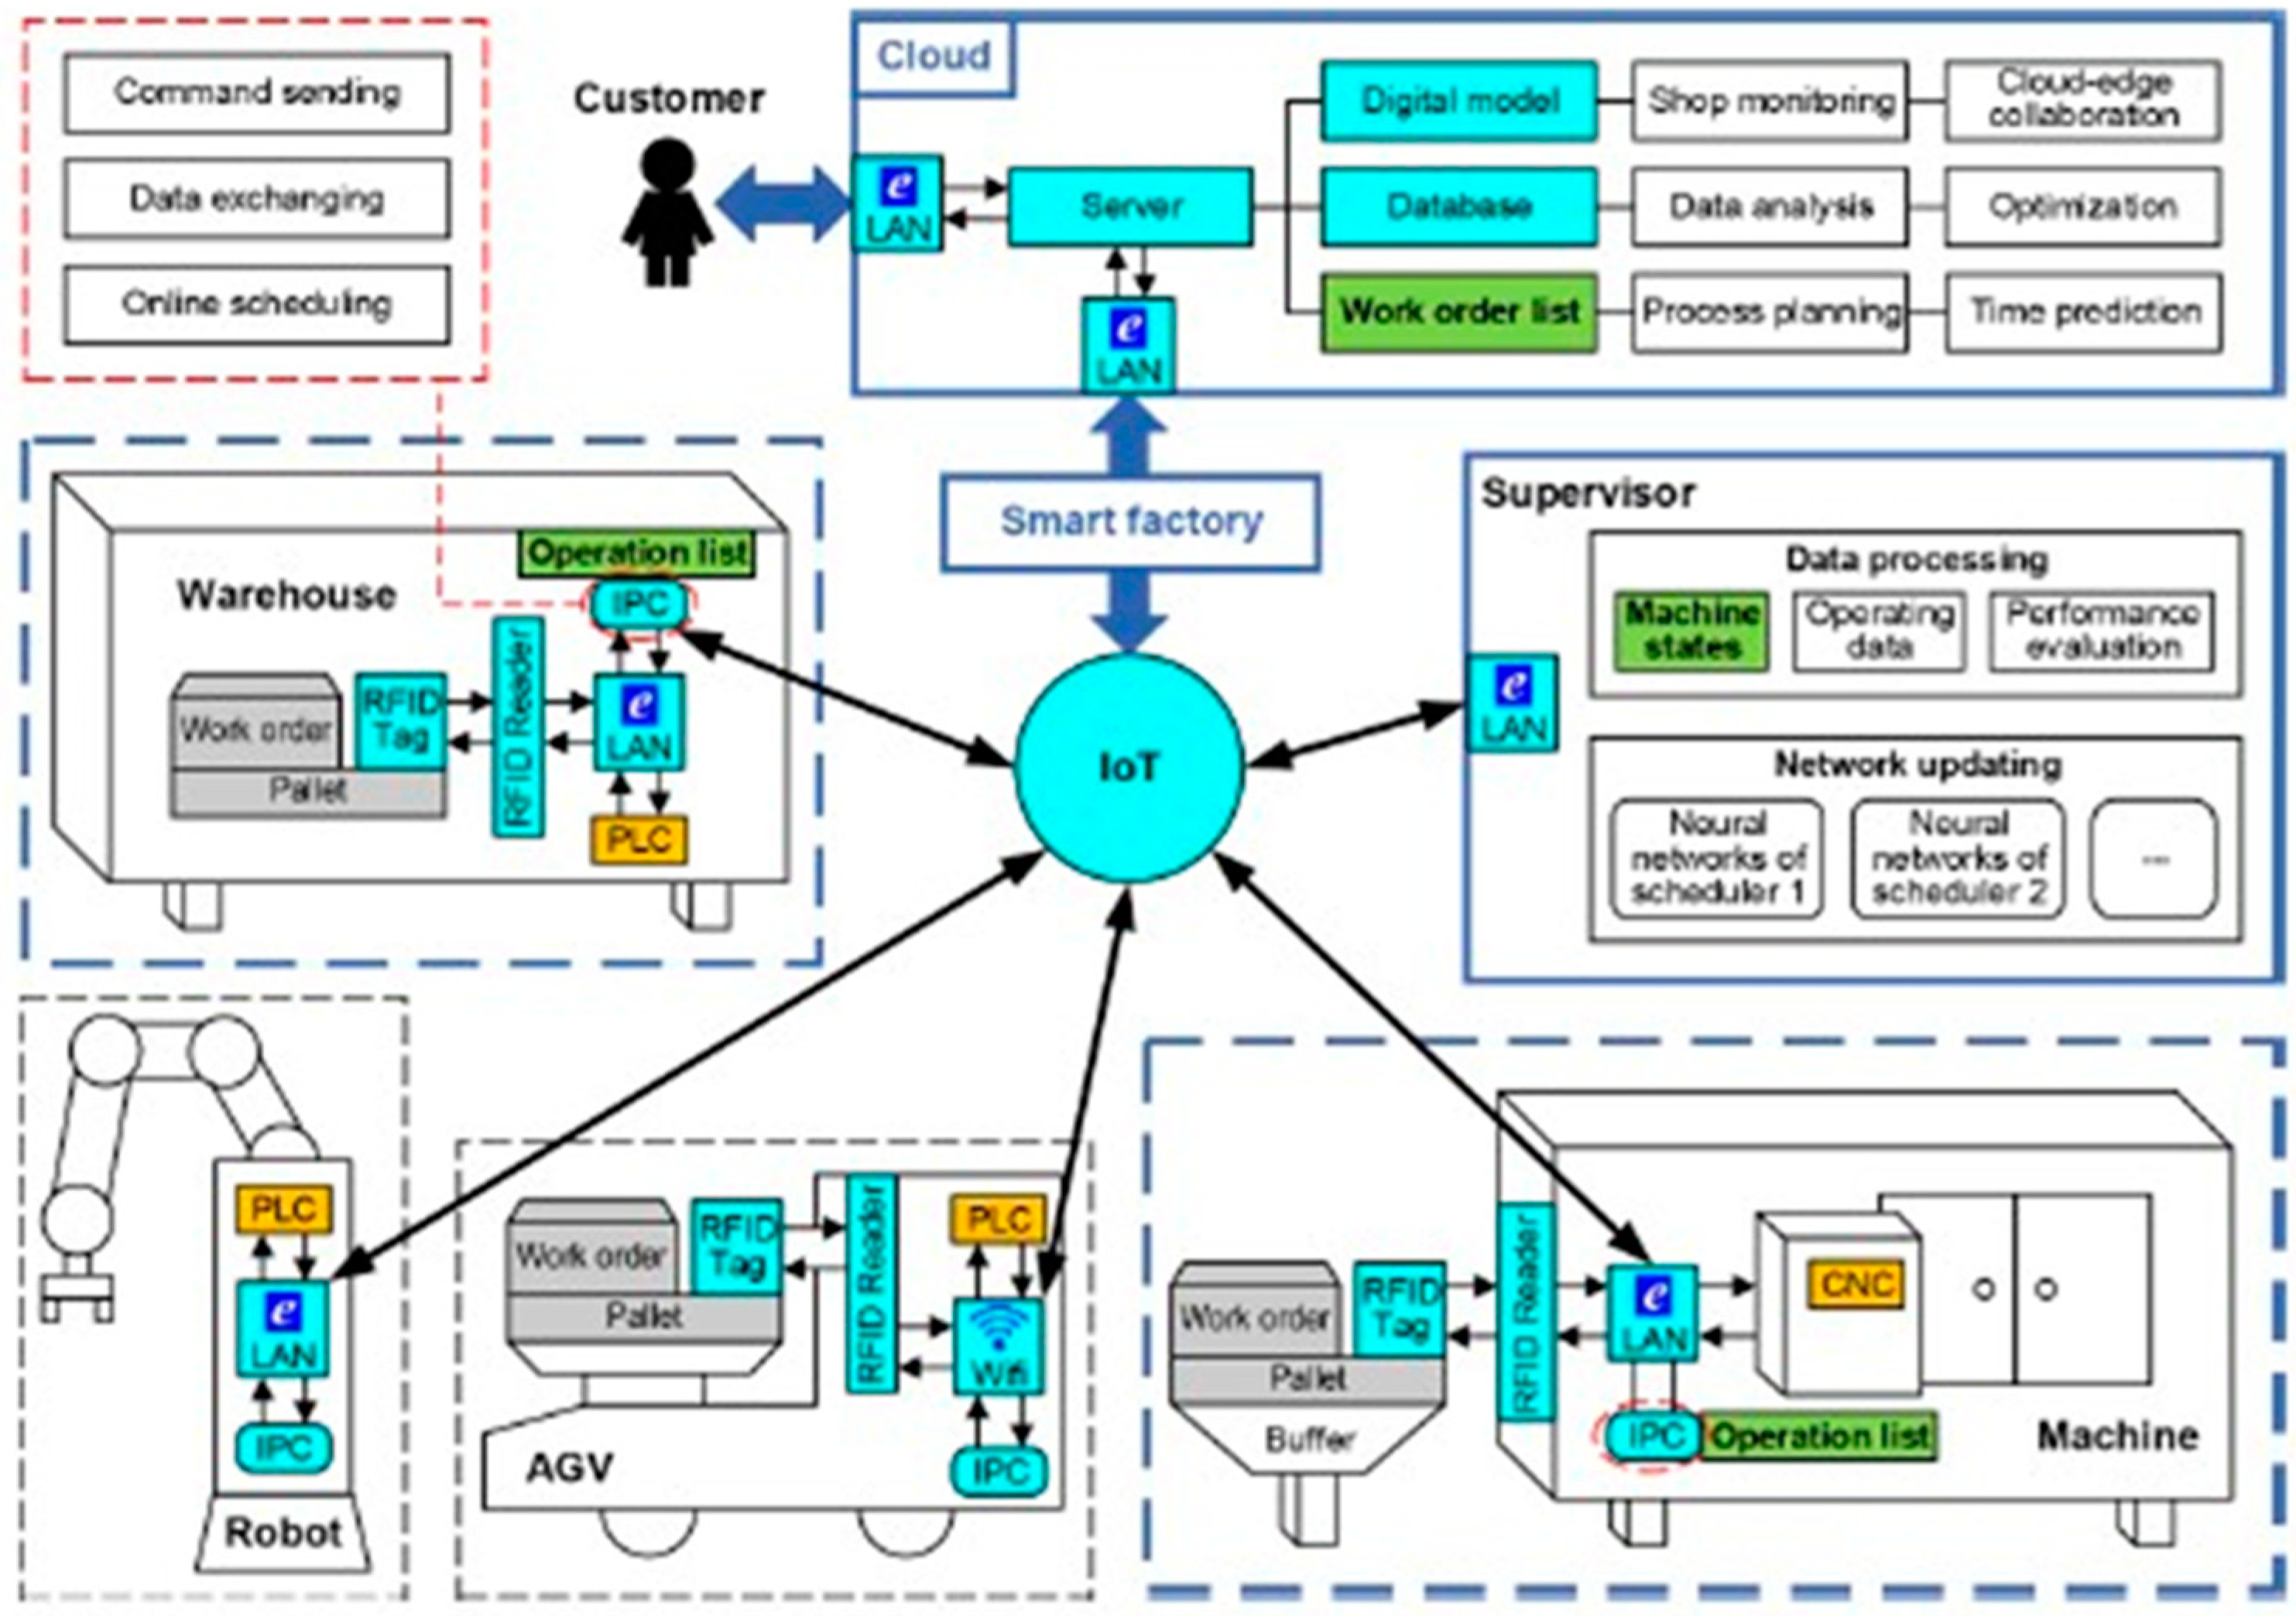
Similarly, there are FEMSs, as depicted in Figure 3. However, they are distinguished from HEMSs and BEMSs by the presence of various high-powered machines in factories, such as foam injection machines, injection molding machines, boilers, and other machinery. Management of energy-intensive processes can be optimized by aligning them with production schedules, thus minimizing avoidable energy losses. Additionally, shifting energy-intensive production processes to nighttime hours can help mitigate excessive power consumption during peak periods while still achieving the same results as cold-water production. Smart factories commonly employ and include Internet of Things (IoT) technologies to efficiently schedule and coordinate their resources, thereby reducing process costs. FEMSs assist them in the process of redesigning and optimizing scheduling. The energy consumption of the operational processes in a smart factory is minimized by implementing FEMSs (Flexible Manufacturing Systems), which primarily aim to manufacture products for low-volume–high-mix orders.
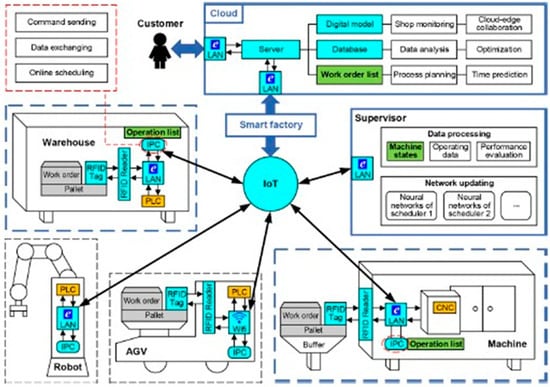
Figure 3.
Factory energy management system (FEMS) [31].
HEMSs and FEMSs efficiently apply the best methods for integrating renewable resources into the utility grid. This integration is intended to lower operating costs for both residential and industrial microgrids. As a result of the changing paradigm of solar photovoltaics in low-voltage distribution networks, utilities have established net metering and feed-in tariff (FiT) programs. These incentives encourage household and industrial customers to actively engage in energy production. A detailed comparison of on-grid and off-grid models was performed. The data implied that implementing the suggested on-grid method results in an average daily savings of about 32% [32].
2.1.4. Community Energy Management Systems (CEMSs)
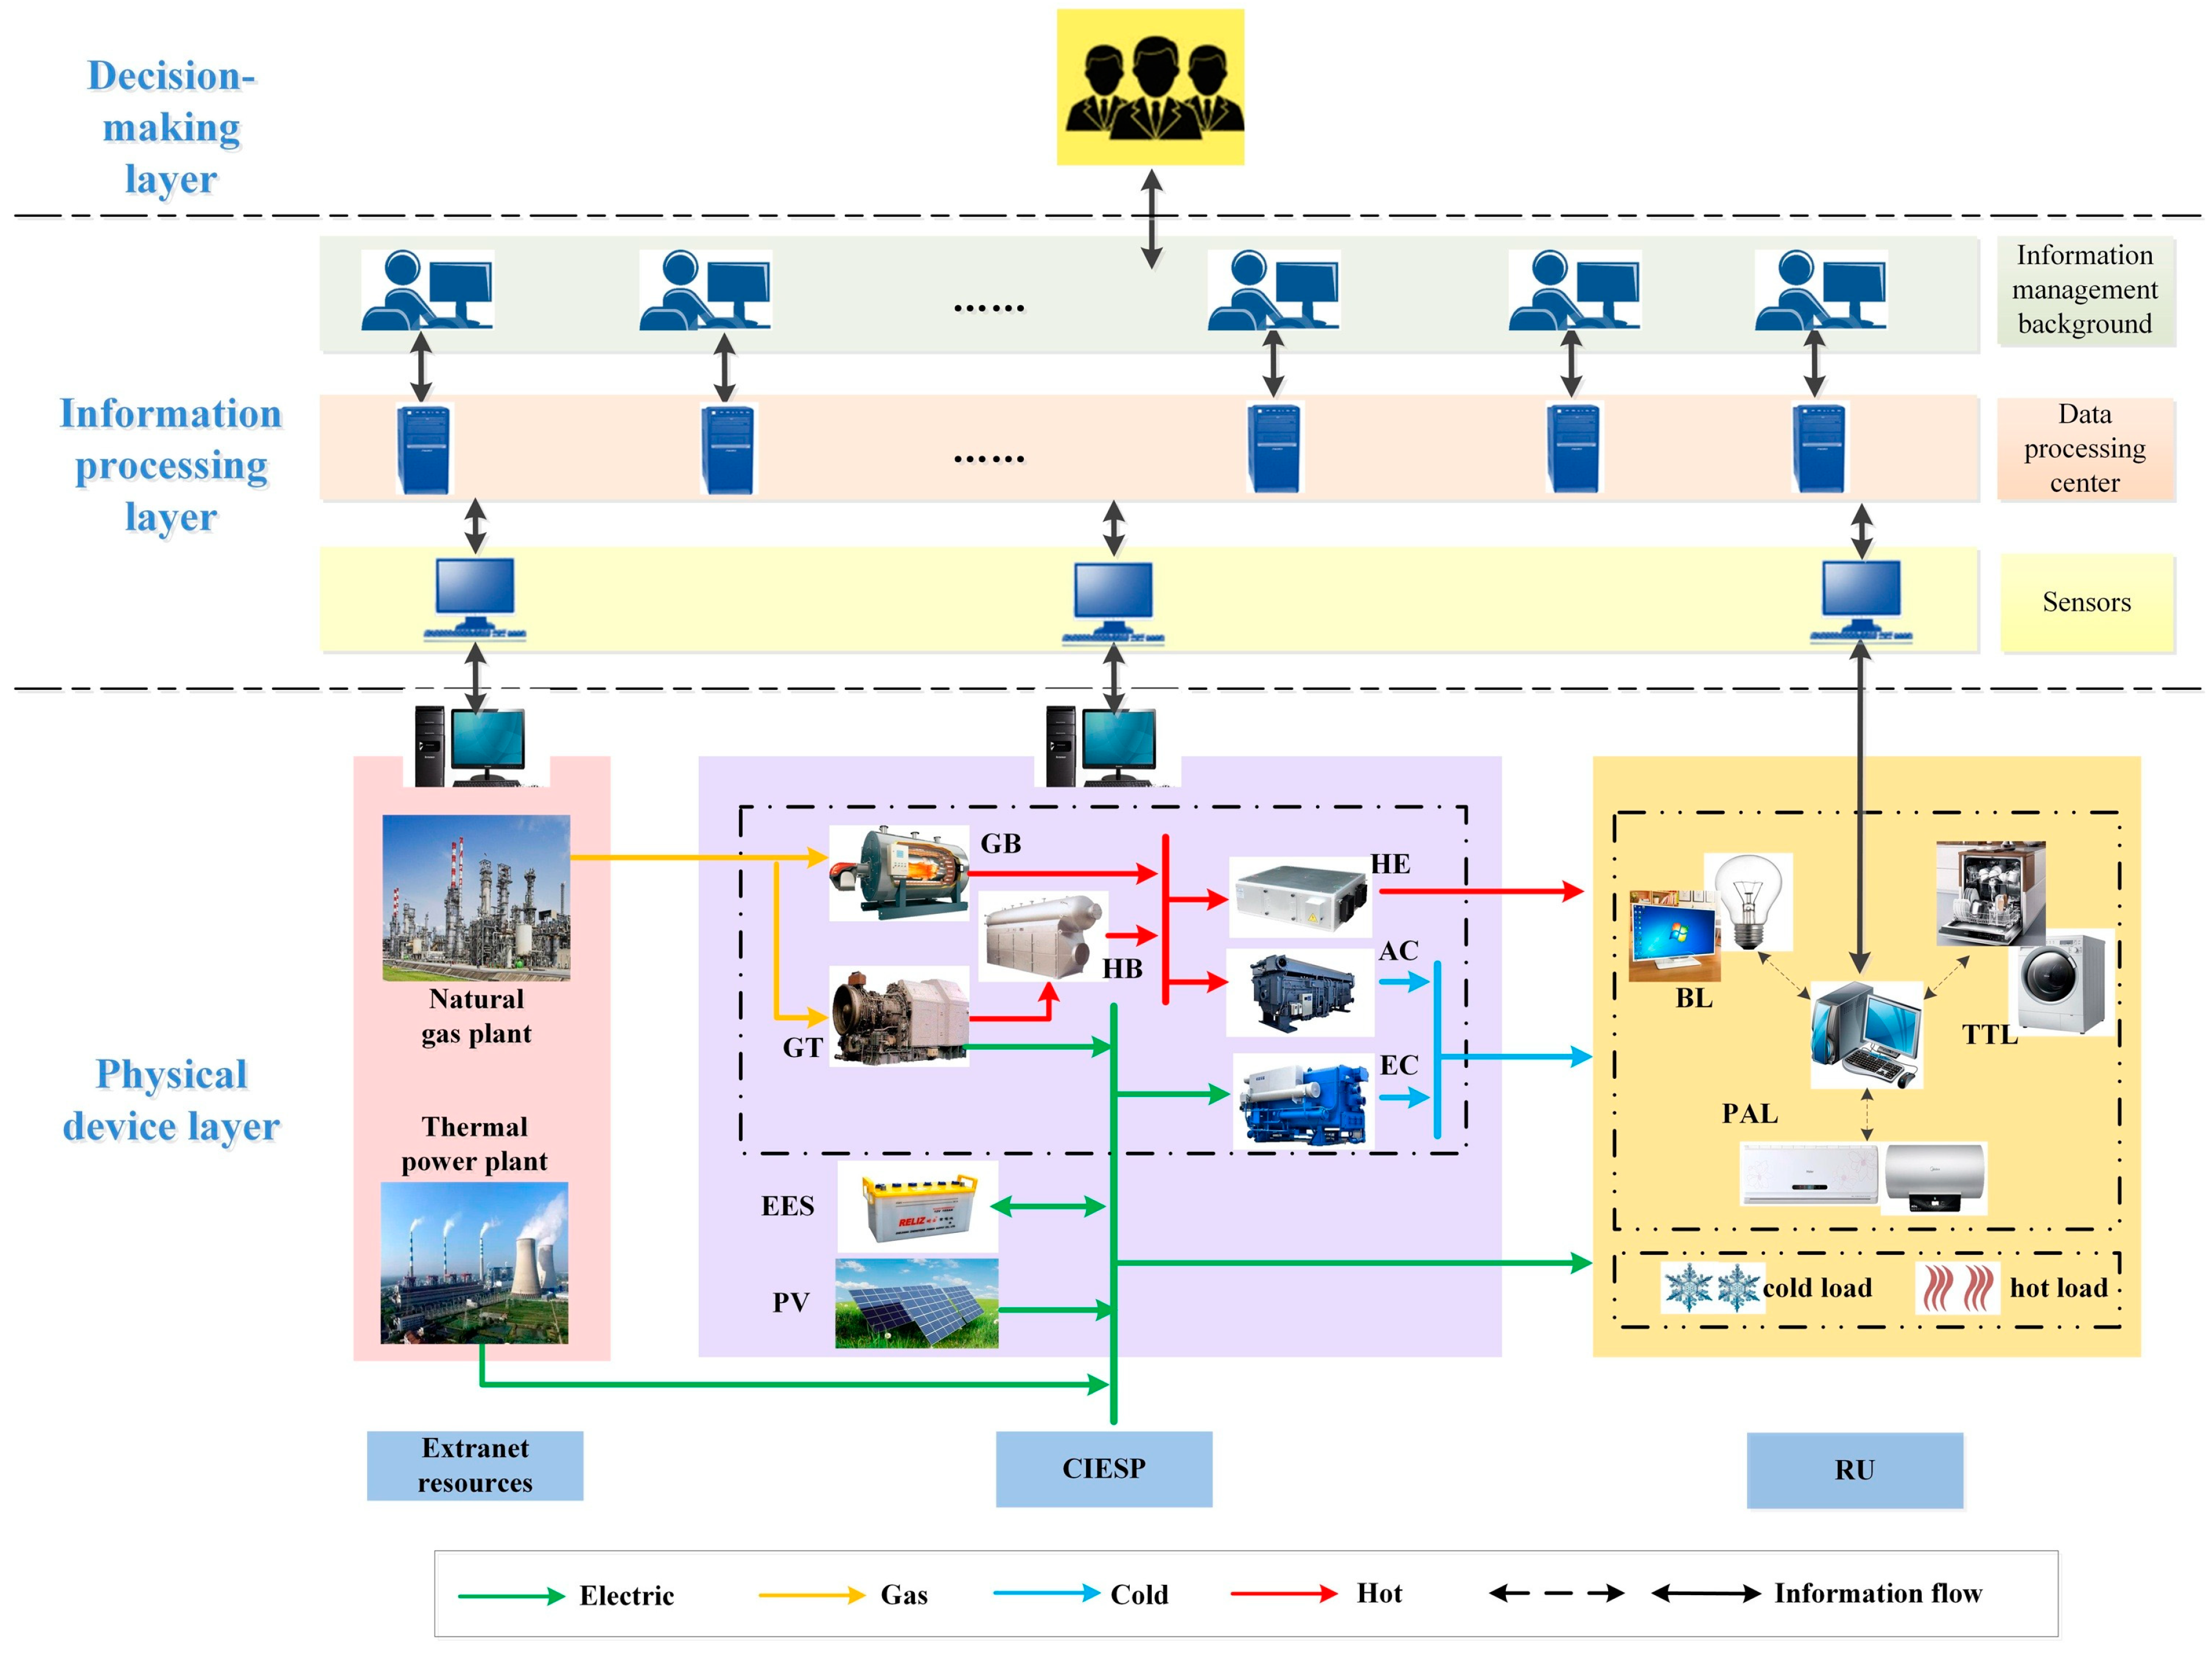
Energy management systems encompass several components, such as the residential, commercial, and industrial sectors, which aid in the efficient management of energy. The CEMS seen in Figure 4 was designed to efficiently manage and control the energy usage within a wide area. This system enables tracking and analysis of the behavior of individual communities. The backup power in each community is crucial due to the need for careful planning in national power generation. The high costs of fuel have a substantial effect on electricity generation expenses. By incorporating backup power from renewable energy sources and utilizing various fuels for initial refueling, a CEMS can make precise predictions. A community energy management system is a large piece of infrastructure that encompasses diverse energy sources, including electricity, heat, cold, and natural gas, as well as energy-related processes such as production, conversion, storage, and distribution. Additionally, it involves the active participation of numerous individuals. Numerous energy utilization strategies are implemented, each with distinct optimization goals, to attain optimal energy efficiency and cost reductions within the community.
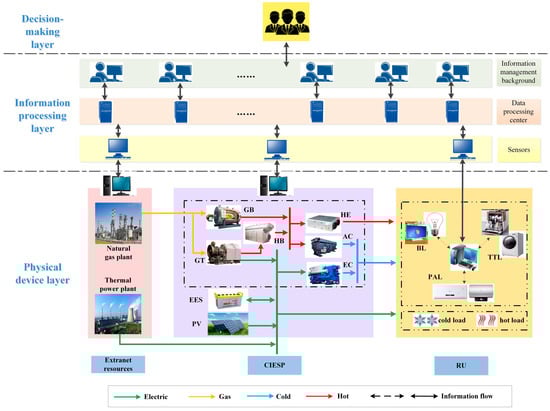
Figure 4.
Community energy management system (CEMS) [33].
Figure 4 depicts the framework of a community energy management system (CEMS) that consists of three layers: the physical device layer, the information processing layer, and the decision-making layer.
2.1.5. Internet of Things (IoT)
A network of physical objects, also referred to as “things,” that are outfitted with sensors, software, and various other technologies is referred to as the Internet of Things (IoT). The purpose of these objects is to communicate and share data with other systems and devices that are connected to the internet. When people talk about the IoT, they are primarily referring to devices that are not typically assumed to have an internet connection and are able to communicate with the network on their own without the need for human intervention [33]. Nowadays, the IoT is being utilized in energy management systems (EMSs) for a wide range of applications. Several of these uses are depicted in Figure 5. Currently, only a portion of them have been fully implemented. Additional intelligent applications will be developed for residential areas, urban environments, businesses, and industrial facilities. The Internet of Things can gather, organize, and transmit data. In addition, it can evaluate data and perform actions in the EMS of a Thai supermarket. A prior investigation into EMSs in retail establishments employed the IoT to link devices with RS485 communication wiring for data storage, analysis, and processing. Artificial intelligence subsequently regulated and directed these devices to optimize the energy efficiency of the air conditioning system [34,35]. The authors also considered using the IoT concept in this research.
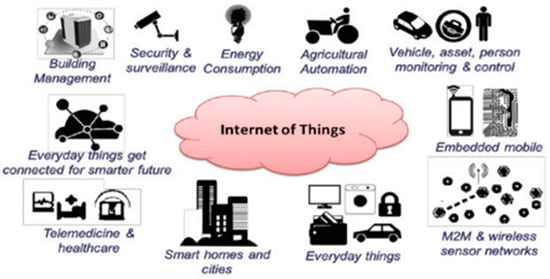
Figure 5.
Application domains of Internet of Things [36].
Moreover, the Internet of Things is currently highly sought-after due to its widespread utilization in diverse applications such as home energy management systems, building energy management systems, factory energy management systems, and city energy management systems. “Energy management system” has transitioned from being a mere buzzword to becoming a tangible reality. These systems now effectively integrate smart home devices into a cloud-centric IoT system [37,38]. IoT technology has been implemented in HVAC monitoring platforms specifically designed for intelligent industries. The proposed system model aims to optimize energy consumption in a smart factory by efficiently managing heating, ventilation, and air conditioning (HVAC) systems. This model enables real-time monitoring, precise control, and significant energy savings [39].
2.2. Energy Management System for a Data-Driven Air Conditioning System
An EMS is a control system used to manage and control energy in many applications and to reduce power consumption and energy costs in residential areas, commercial buildings, industrial facilities, and local communities. Research conducted in the most recent decade has demonstrated that EMSs can monitor and control energy usage to achieve optimal energy efficiency and reduce costs for customers. The primary method employed by EMSs to reduce energy consumption is to transfer the load or schedule the operation of appliances from peak to off-peak periods when energy prices are high. Smart thermostats are commonly used in smart homes to reduce energy consumption by air conditioning systems. These thermostats provide continuous learning, remote scheduling, and control of indoor temperatures [40,41]. Occasionally, energy conservation can be facilitated by a proposed system that is specifically engineered to activate an air conditioner when the temperature drops and a fan when humidity levels rise, resulting in reduced energy usage and offering consumers customized comfort [42,43,44].
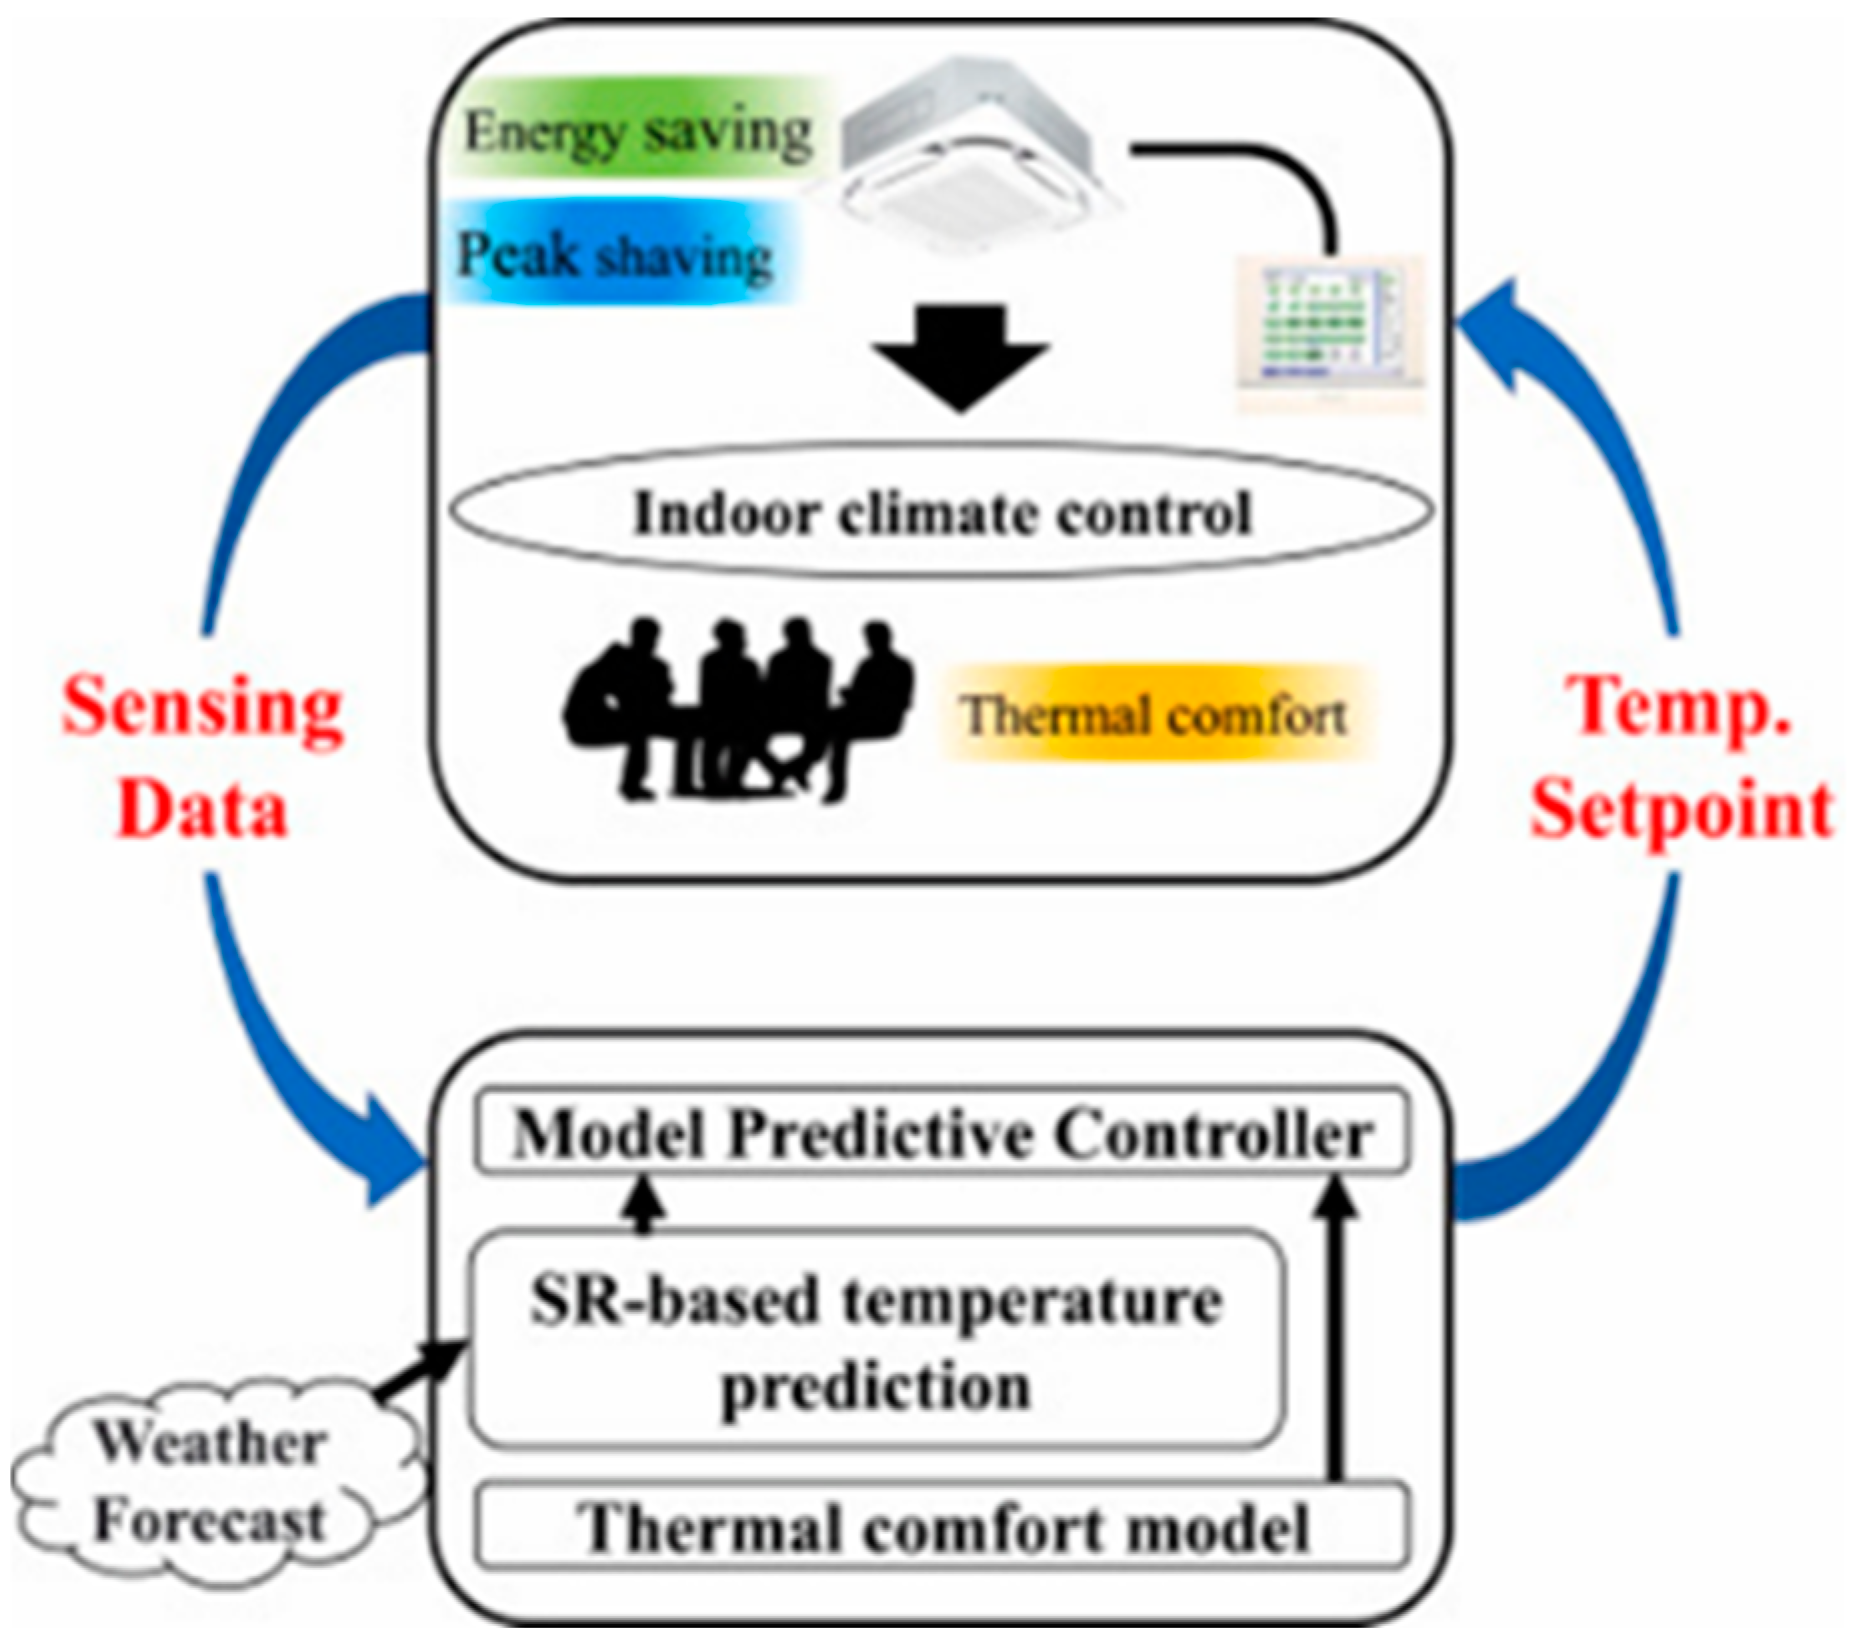
This research aimed to reduce energy consumption at convenience stores using EMSs. As presented in many research papers, it was found that EMSs have always focused on heating, ventilation, and air conditioning (HVAC) systems because these systems are some of the largest energy consumers in buildings. Therefore, research related to energy-saving technology is essential [45]. Data-driven online energy management for HVAC systems involves streamlining the modeling process and improving the accuracy of temperature estimation, as shown in Figure 6. It also formulates a model predictive control (MPC)-based HVAC scheduling strategy to optimize HVAC operations and reduce energy consumption and peak power demand. Using such a strategy, the total energy consumption in HVAC cooling and heating operations was found to decrease by 4.9% and 30.2%, respectively [46].
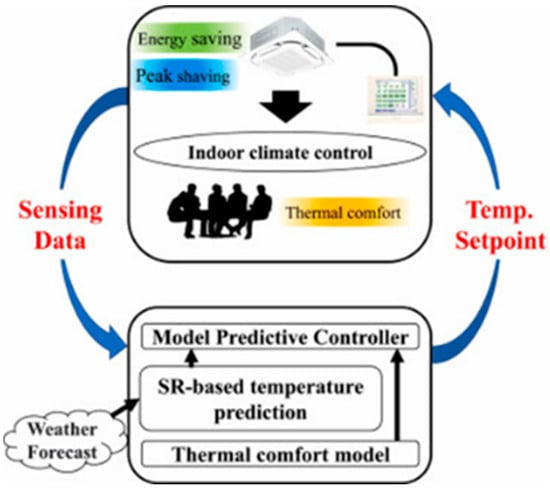
Figure 6.
Overview of HVAC energy management framework [46].
With a 3 °C reduction in the preferred upper limit of the temperature range, an adaptive temperature control approach achieved 9.98% energy savings compared to the current standards while improving the thermal comfort of workplace occupants. Energy usage was further decreased by this algorithm [47,48]. By integrating data-driven MPC into an existing BEMS, a prior study proposed a control modification strategy that is lightweight and replicable to increase the energy efficiency of HVAC systems in existing buildings. The average daily energy usage of the system was lowered by 24.5% [49]. In addition, model predictive control (MPC) proved to be the most efficient approach for enhancing the energy efficiency of air conditioners equipped with variable-speed drives (VSDs). The proportional–integral–derivative (PID) control method yielded an energy efficiency ratio (EER) of 5.7. Using MPC, an AI system hosted on the cloud was able to enhance the EER value to 6.22. Energy efficiency improvements of up to 9.12% were attained [50]. An EMS that adjusts cooling levels based on occupancy can effectively reduce energy use in unoccupied rooms. A research study [51,52,53] was conducted using battery-powered wireless sensor nodes. After evaluating a ten-room initial deployment, the authors concluded that their choice of sensors and their occupancy detection algorithm could accurately detect the presence of inhabitants. By employing these occupancy data as inputs for a building simulation model, they obtained decreases in HVAC energy consumption ranging from 10% to 15%. Commercial buildings include chillers in their air conditioning systems, which can effectively decrease energy consumption. To assess the potential for energy improvement, design builder software was connected with Energy Plus simulation software for accurate energy simulation modeling. By implementing energy-efficient optimization techniques, assessing energy savings realized by retrofitting water-cooled chillers, and employing enhanced control tactics, energy consumption was decreased by 62% [54].
In addition, a study was conducted at a typical supermarket in Spain, which included two entrance doors and a sales area measuring 950 m2. The study compared the results of a conventional duct installation and an energy-efficient installation by analyzing energy usage patterns throughout the year. Implementing high-efficiency air conditioning systems in supermarkets led to electricity consumption reductions of 56% to 62% [55]. In another study, a power consumption model of a large shopping mall in Northern China was constructed and examined. The model showed high accuracy, robustness, and generalization capacity. As a result of optimization, the overall system energy consumption was lowered by 15.19% [56]. A study on a supermarket in Thailand demonstrated that implementing a retail energy management system and the IoT for data storage and analysis, alongside artificial intelligence to optimize the air conditioning system, resulted in a 17% reduction in energy consumption compared to the existing system [35,36].
Currently, utilizing AI-driven solutions can facilitate the monitoring, forecasting, and reduction in energy consumption, resulting in significant cost savings and enhanced energy efficiency. Integrating Industry 4.0 and the IoT into smart buildings offers a substantial opportunity to improve energy management through advanced technologies [57]. HVAC systems utilize artificial intelligence to enhance energy efficiency, potentially resulting in energy savings of 5–10% [58,59].
2.3. Energy Improvement Solution for Refrigeration System
Building energy consumption accounts for more than 30% of total global energy usage and contributes to 26% of global energy-related emissions. Furthermore, building operations account for approximately 55% of worldwide electricity usage [60]. Supermarkets, along with convenience stores, are part of a cluster of buildings. In the context of commercial supermarkets, the process of freezing and refrigerating food requires a significant amount of energy that makes up approximately 50% of their total energy consumption. Consequently, this results in high energy usage and the release of substantial carbon emissions [61]. Estimates indicate that a medium-sized supermarket in the USA consumes approximately 500 kilowatt-hours of energy per square meter on an annual basis, with refrigeration systems responsible for around 60% of this energy usage [62]. Therefore, strategies to decrease energy consumption in this sector are very important. The primary source of energy consumption in supermarkets is refrigeration. Therefore, one can reduce energy consumption by implementing energy management strategies or using high-performance equipment [63]. There are several ways to achieve energy savings in a typical refrigeration system. These include reducing heat loads; minimizing temperature differences in the refrigeration plant; using efficient compressors and operating them optimally; optimizing defrost controls; using appropriately sized evaporators and condensers that operate at the lowest condensing temperature and highest effective evaporating temperature; installing variable-frequency drives (VFDs) on evaporators, condensers, and compressors; using high-efficiency motors on compressors, condensers, evaporators, and pumps; implementing computer controls to improve and optimize operating strategies; and recovering heat from the condenser for process or domestic hot water usage [64]. Using an electronic expansion valve to regulate the flow of refrigerant is closely linked to the temperature of the evaporating superheat and has a direct impact on the coefficient of performance [65].
The coefficient of performance (COP) plays a crucial role in enhancing the energy efficiency of refrigeration systems and has a direct impact on energy consumption. A typical refrigeration cycle comprises a single compression stage, a variable-speed compressor, an electronic expansion valve, two heat exchangers, an evaporator, and a condenser. One of the control objectives is to ensure the provision of the intended cooling capacity. The COP is the ratio of the desired cooling power to the compression power [66]. Thus, the COP can be enhanced by either decreasing the amount of power required for compression or increasing the amount of cooling power desired. Nevertheless, the compressor is responsible for the majority of the energy consumption in a refrigeration system [67]. A previous study employed an iterative approach to determine the equivalent performance of a centrifugal compressor under different operating conditions, specifically considering the impact of the suction parameter [68]. The study revealed that the system exhibited higher power consumption during operations with low inlet pressure. Implementing optimal load control for the refrigeration compressor units resulted in a 6.78% reduction in energy consumption [69]. Moreover, previous research revealed that raising the evaporator pressure results in a corresponding increase in the COP. On the other hand, if the condenser pressure increases, the COP decreases [70]. Increasing the evaporation temperature by a factor of two can enhance the COP by approximately 3–4.2% [71].
2.4. Research Gap
Overall, the majority of EMS studies have predominantly regarded HVAC systems and demand-side management (DSM) as their Building Support Systems (BSSs) and have implemented strategies primarily focused on residential buildings, where energy demand is most significant [72,73]. In particular, EMSs have predominantly employed a model and mathematical techniques to demonstrate methods for minimizing energy consumption by predicting energy savings outcomes. In addition, few EMSs have been implemented in real convenience stores to decrease energy consumption in air conditioning and refrigeration systems. Utilizing the IoT to collect and analyze data for controlling and managing energy usage in convenience stores has also been rare. Therefore, this study aimed to fill this knowledge gap by proposing a solution to reduce energy consumption using an EMS in real convenience stores. The solution entailed regulating and supervising air conditioners and refrigeration cabinets to minimize energy usage. These two systems account for most of the energy consumption in stores. Furthermore, this study aimed to improve sustainable energy practices and recommend new energy-saving measures for future implementation in convenience stores in Thailand and around the world.
3. Materials and Methods
This study utilized BEMS equipment to improve the energy efficiency of a convenience store’s air conditioning and refrigeration systems. The objective was to determine whether the proposed logic control using BEMS could effectively reduce energy consumption. The store operated as a standalone shop in the central region for 17 h per day, 7 days a week, and had a sales area of 314 square meters. This store had the distinction of being the most convenient in Thailand. The authors selected this specific store for the experiment. Moreover, the store had three cassette-type split-type inverter air conditioner units that operated at 36,000 Btu/h and remote-type refrigeration for five types of goods kept in chilled cabinets (beverages, dairy, sausages, ready-to-cook products, and meat), which allowed their effect on energy consumption to be studied.
The main BEMS hardware equipment consisted of digital power meters that measured the energy consumption of the air conditioning and refrigeration systems, outdoor and indoor temperature sensors, an interface card for the air conditioning system, a programmable logic controller (PLC), a master controller with a Linux server, and an uninterruptible power supply (UPS). Table 1 displays specific information about the primary equipment used in this research.

Table 1.
Specifications of equipment used in this research.
All primary hardware components were interconnected and performed specific roles inside each piece of equipment, as outlined below:
- The indoor temperature (Tin) was measured near the center of the sale area as a reference.
- The outdoor temperature (Tamb) in front of the store was measured with a duct temperature sensor. It could not come in direct contact with sunlight because it was measuring ambient temperature.
- A digital energy meter measured the power (kW) and energy consumption (kWh) of the air conditioning and refrigeration systems.
- The interface card of the air conditioning system communicated commands for operating control between the programmable logic controller and the air conditioning unit, which communicated via Modbus RTU (RS485) or DIII-Net.
- The programmable logic controller (PLC) needed to send commands to control the air conditioning unit and the CDU of refrigeration per the user’s requirements. This equipment was a Modbus RTU.
- The master controller with Linux was a datalogger that could collect all energy data and record all commands from the Modbus RTU equipment. At the same time, it used the IoT to connect with the cloud through the internet.
- The uninterruptible power supply (UPS) was an electrical device that supplied emergency power to a load in the event of a failure or outage of the input power source or mains power.
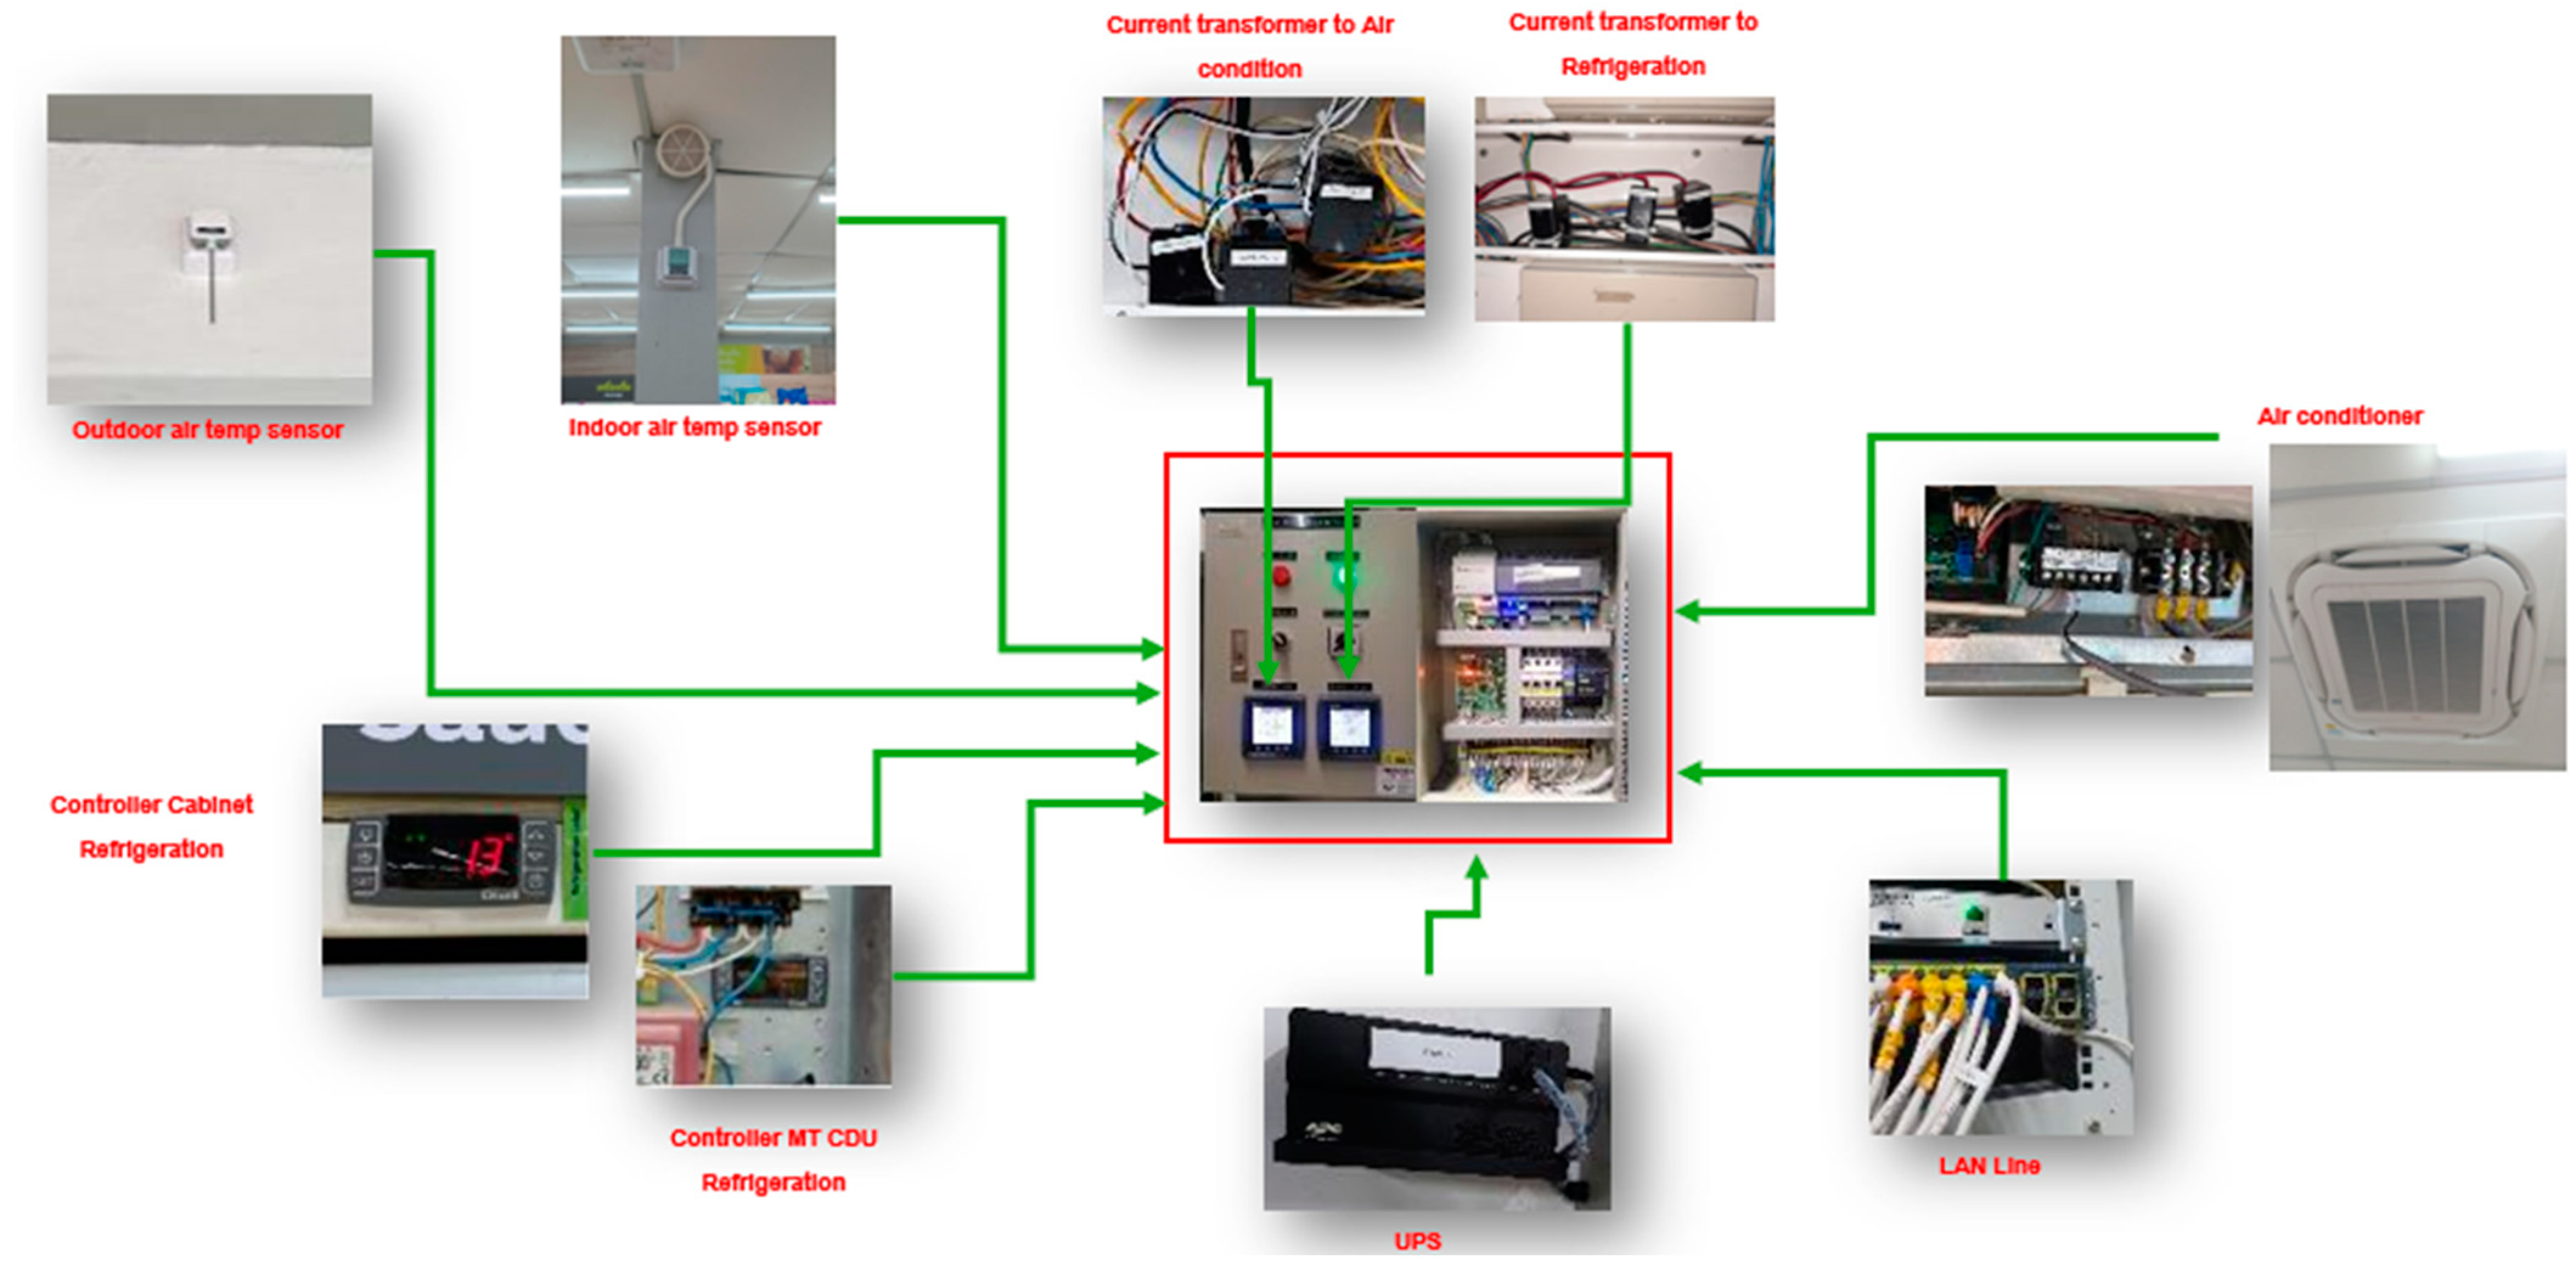
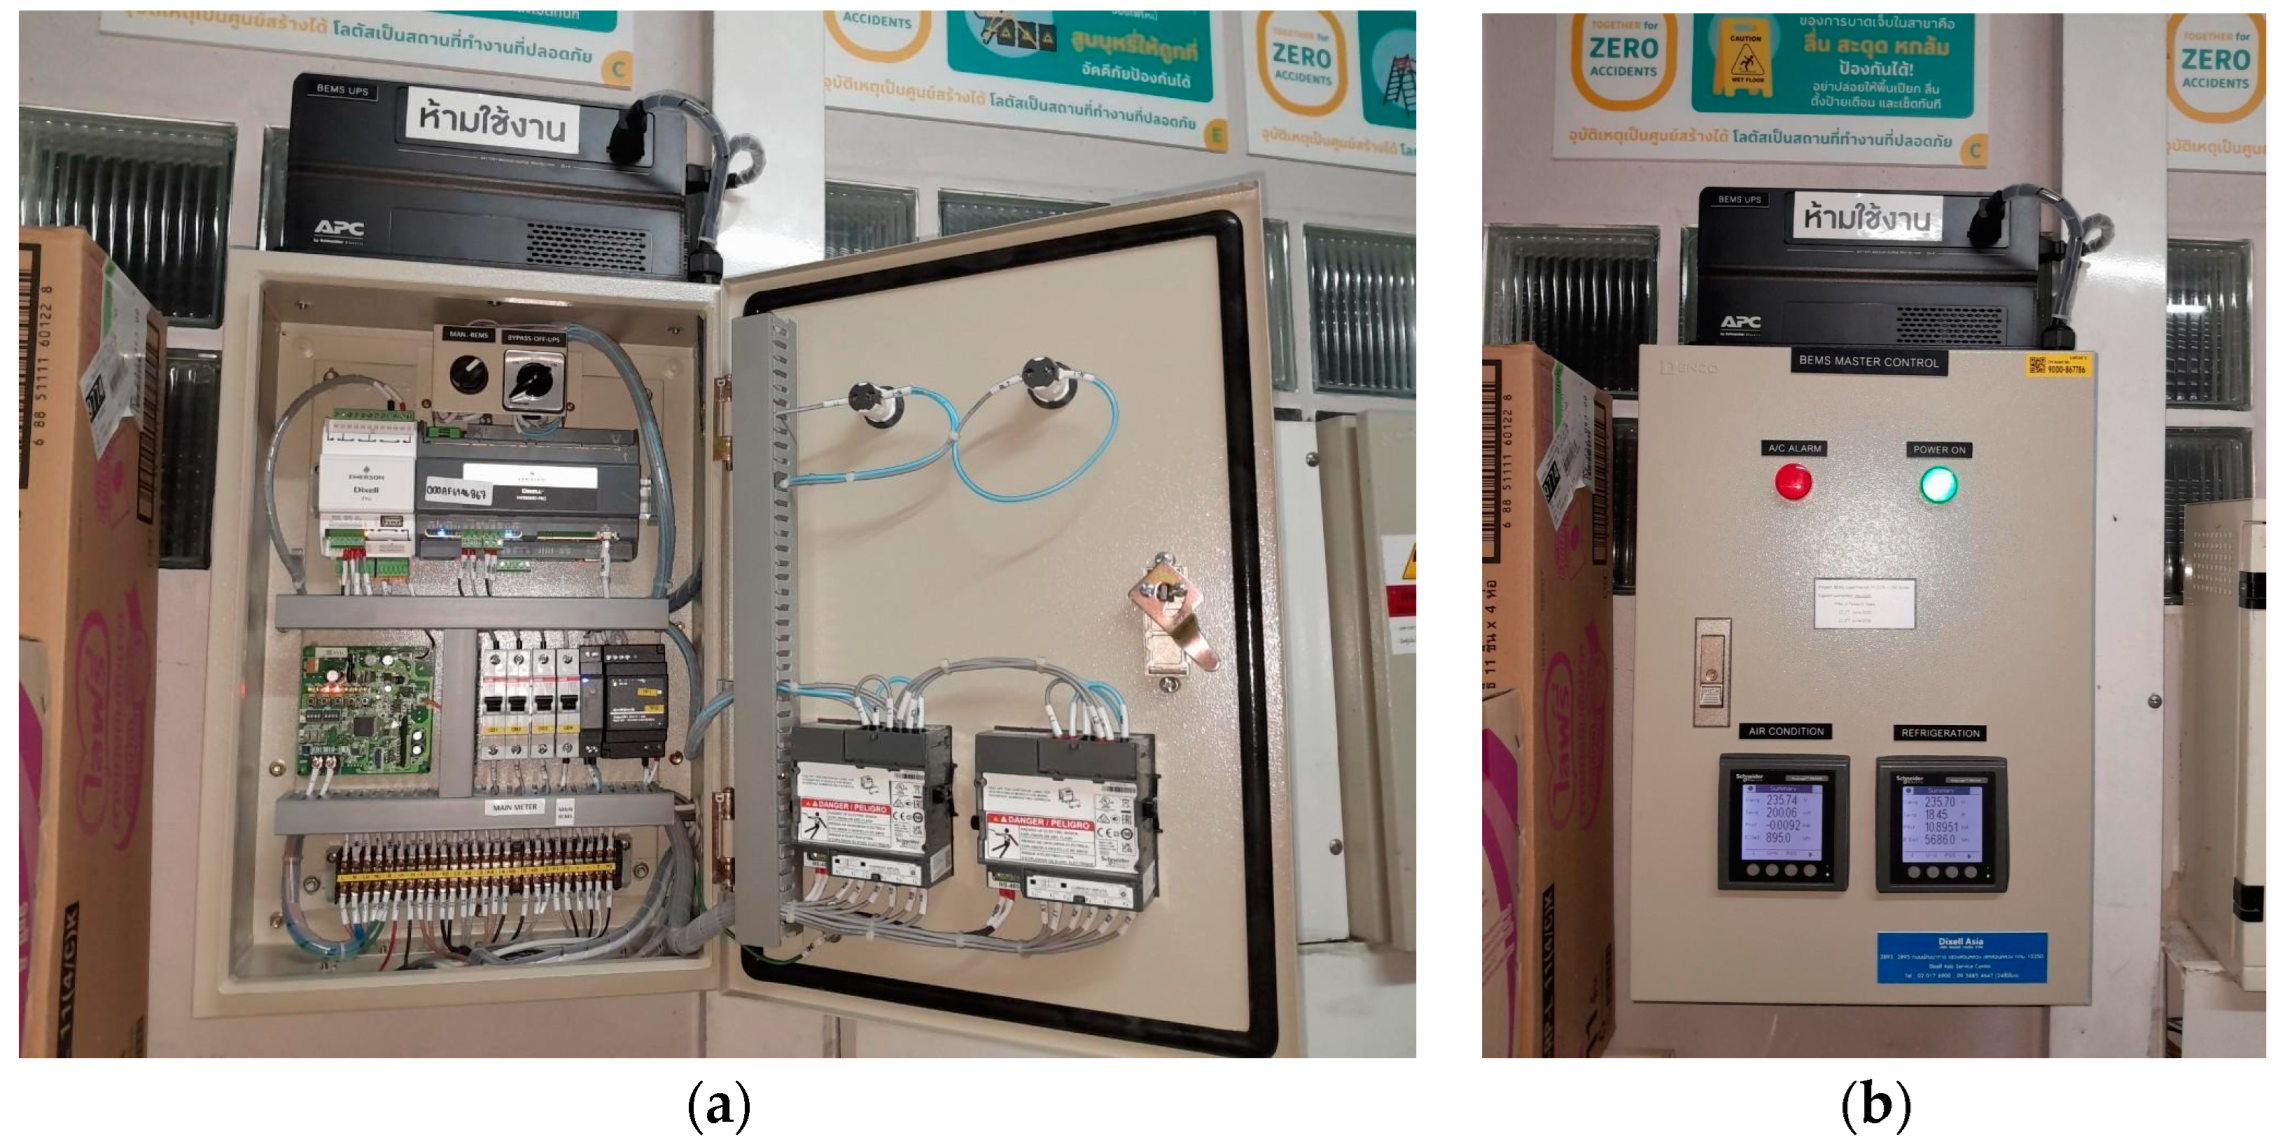
Each piece of equipment in the building energy management system was connected via RS-485 communication wiring [35,36]. An overview of the layout is shown in Figure 7, and Figure 8 provides details of the BEMS master controller cabinet, which was a significant part of this research.

Figure 7.
An overview of the layout of the building energy management system.

Figure 8.
(a) Inside and (b) outside BEMS master controller cabinet with monitors for digital meters.
3.1. Air Conditioning System
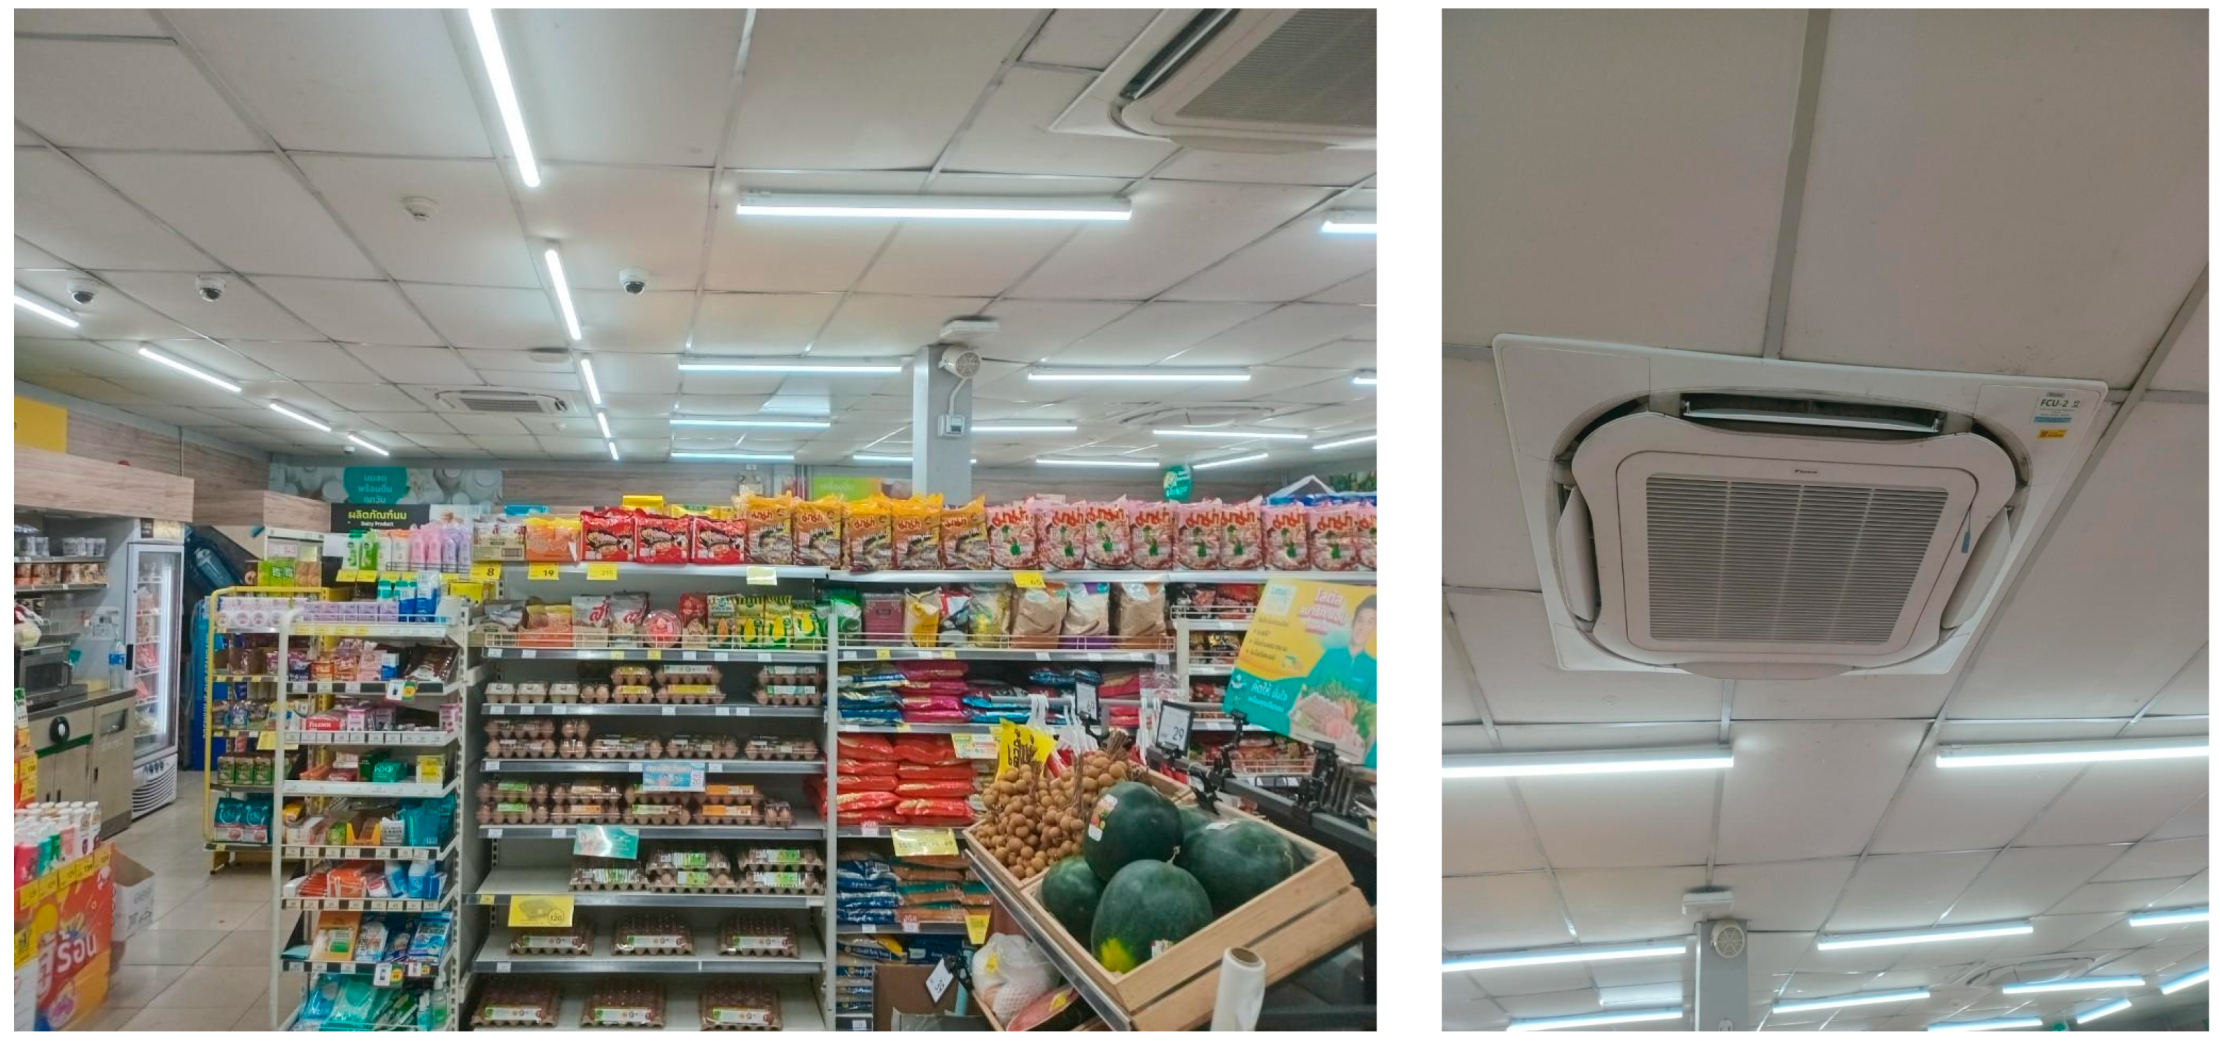
The convenience store in this study utilized a cassette-type split-type air conditioning system equipped with inverter technology, as shown in Figure 9. The system consisted of three units with a cooling capacity of 36,000 Btu/h each. The desired temperature set point was 25 degrees Celsius and was a reference for the thermal comfort of the customers [74,75,76]. The air conditioning system ran for a total of 17 h each day, starting at 6 a.m. and ending at 11 p.m. We investigated by installing software and proposing a building energy management system (BEMS) to decrease the operation of the air conditioning (AC) system. The authors implemented logic control for the air conditioning units in the store. Possible cost reductions that could be achieved were analyzed by implementing EMS software with this model. We deployed the software on a programmable logic controller (PLC). The software, named Logic Control, included a flowchart that outlined the most efficient way to operate AC systems. This flowchart is depicted in Figure 10.

Figure 9.
Air conditioning units in store.
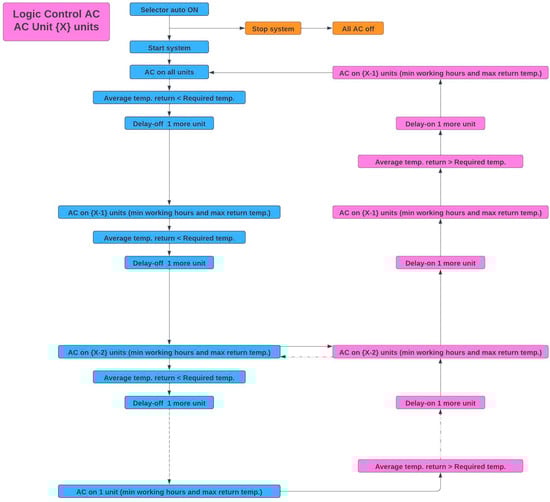
Figure 10.
Proposed BEMS logic control for air conditioning system at convenience store.
It is explained by the following steps:
- Selector BEMS is turned on. All AC units turn on and run in cooling mode.
- The interface card measures the return temperature in each AC unit and averages them at all times.
- If the average return temperature (Tavg,Return) is under the required temperature (25 degrees Celsius), the PLC sends a command to the interface card to adjust AC No. 1 from cooling to fan mode.
- After that, the system averages the return temperature again in real time, which is under the required temperature of 25 degrees Celsius. If the average return temperature compared with the required temperature is not different within 5 min, the PLC does not send any command to change the mode of the air conditioning units. If it changes, the PLC sends a command to the interface card to adjust AC No. 2 from cooling to fan mode. The system checks by looping until it finds that the average return temperature is over the required temperature (25 degrees Celsius). The PLC sends a command to the interface card to adjust AC No. 1 from fan to cooling mode.
- To avoid concerns about the heat load and the thermal comfort experience of the occupants, the system operates an AC unit in cooling mode at all times.
- When the system must change from cooling to fan mode, it selects the AC unit that has the maximum working hours and the minimum return temperature.
The average return temperature of the AC system in this study was determined using Equation (1) as follows:
- Tavg,Re is the average return temperature of the AC system (°C);
- TRe,AC1 is the return temperature of AC unit number 1;
- TRe,ACn is the return temperature of AC unit number n;
- n is the number of AC units in the store.
The authors utilized the Internet of Things to automatically monitor and collect experimental data from the cloud. This was performed using an internet system due to the advantages offered by the IoT. Data were gathered, including the indoor and outdoor temperatures, as well as the average return temperature of the air conditioning units. Additionally, the statuses of the air conditioning units (whether they were in cooling or fan mode) were recorded. These data were then used to verify the logic control and measure the energy (in kilowatts) and consumption (in kilowatt-hours) of all digital meters. Once the installation was finished, data were gathered for the existing system and the BEMS using the energy management strategy described by the authors to determine the energy savings achieved using this model and compare the sale-area temperatures with the existing system and after implementation of the BEMS. Furthermore, the BEMS in this research has a maintenance benefit. It can enable an alarm on the AC system that directs the staff of the store to request a technician to fix it.
3.2. Refrigeration System
Refrigeration systems are significant contributors to energy consumption in convenience stores. This study examined strategies to simultaneously decrease energy consumption and enhance energy efficiency. A notable illustration of energy conservation in refrigeration systems involves reducing the power consumed by compressors, as they are the primary components that consume the highest amount of energy. This system regulated the refrigeration cabinets in the store’s sales area. They used a remote-type system that utilized copper pipes and operated with R407F refrigerant. The medium-temperature condensing unit (MT CDU) utilized a Digital Scroll compressor equipped with a variable-speed fan motor capable of operating in both unloaded and full-load conditions. Furthermore, the system was regulated by the desired evaporator temperature (Tev) of −10.4 degrees Celsius, the desired condenser temperature (Tcd) of 45 degrees Celsius, and the desired superheat temperature (Tsh) of 0 degrees Celsius [64,77].
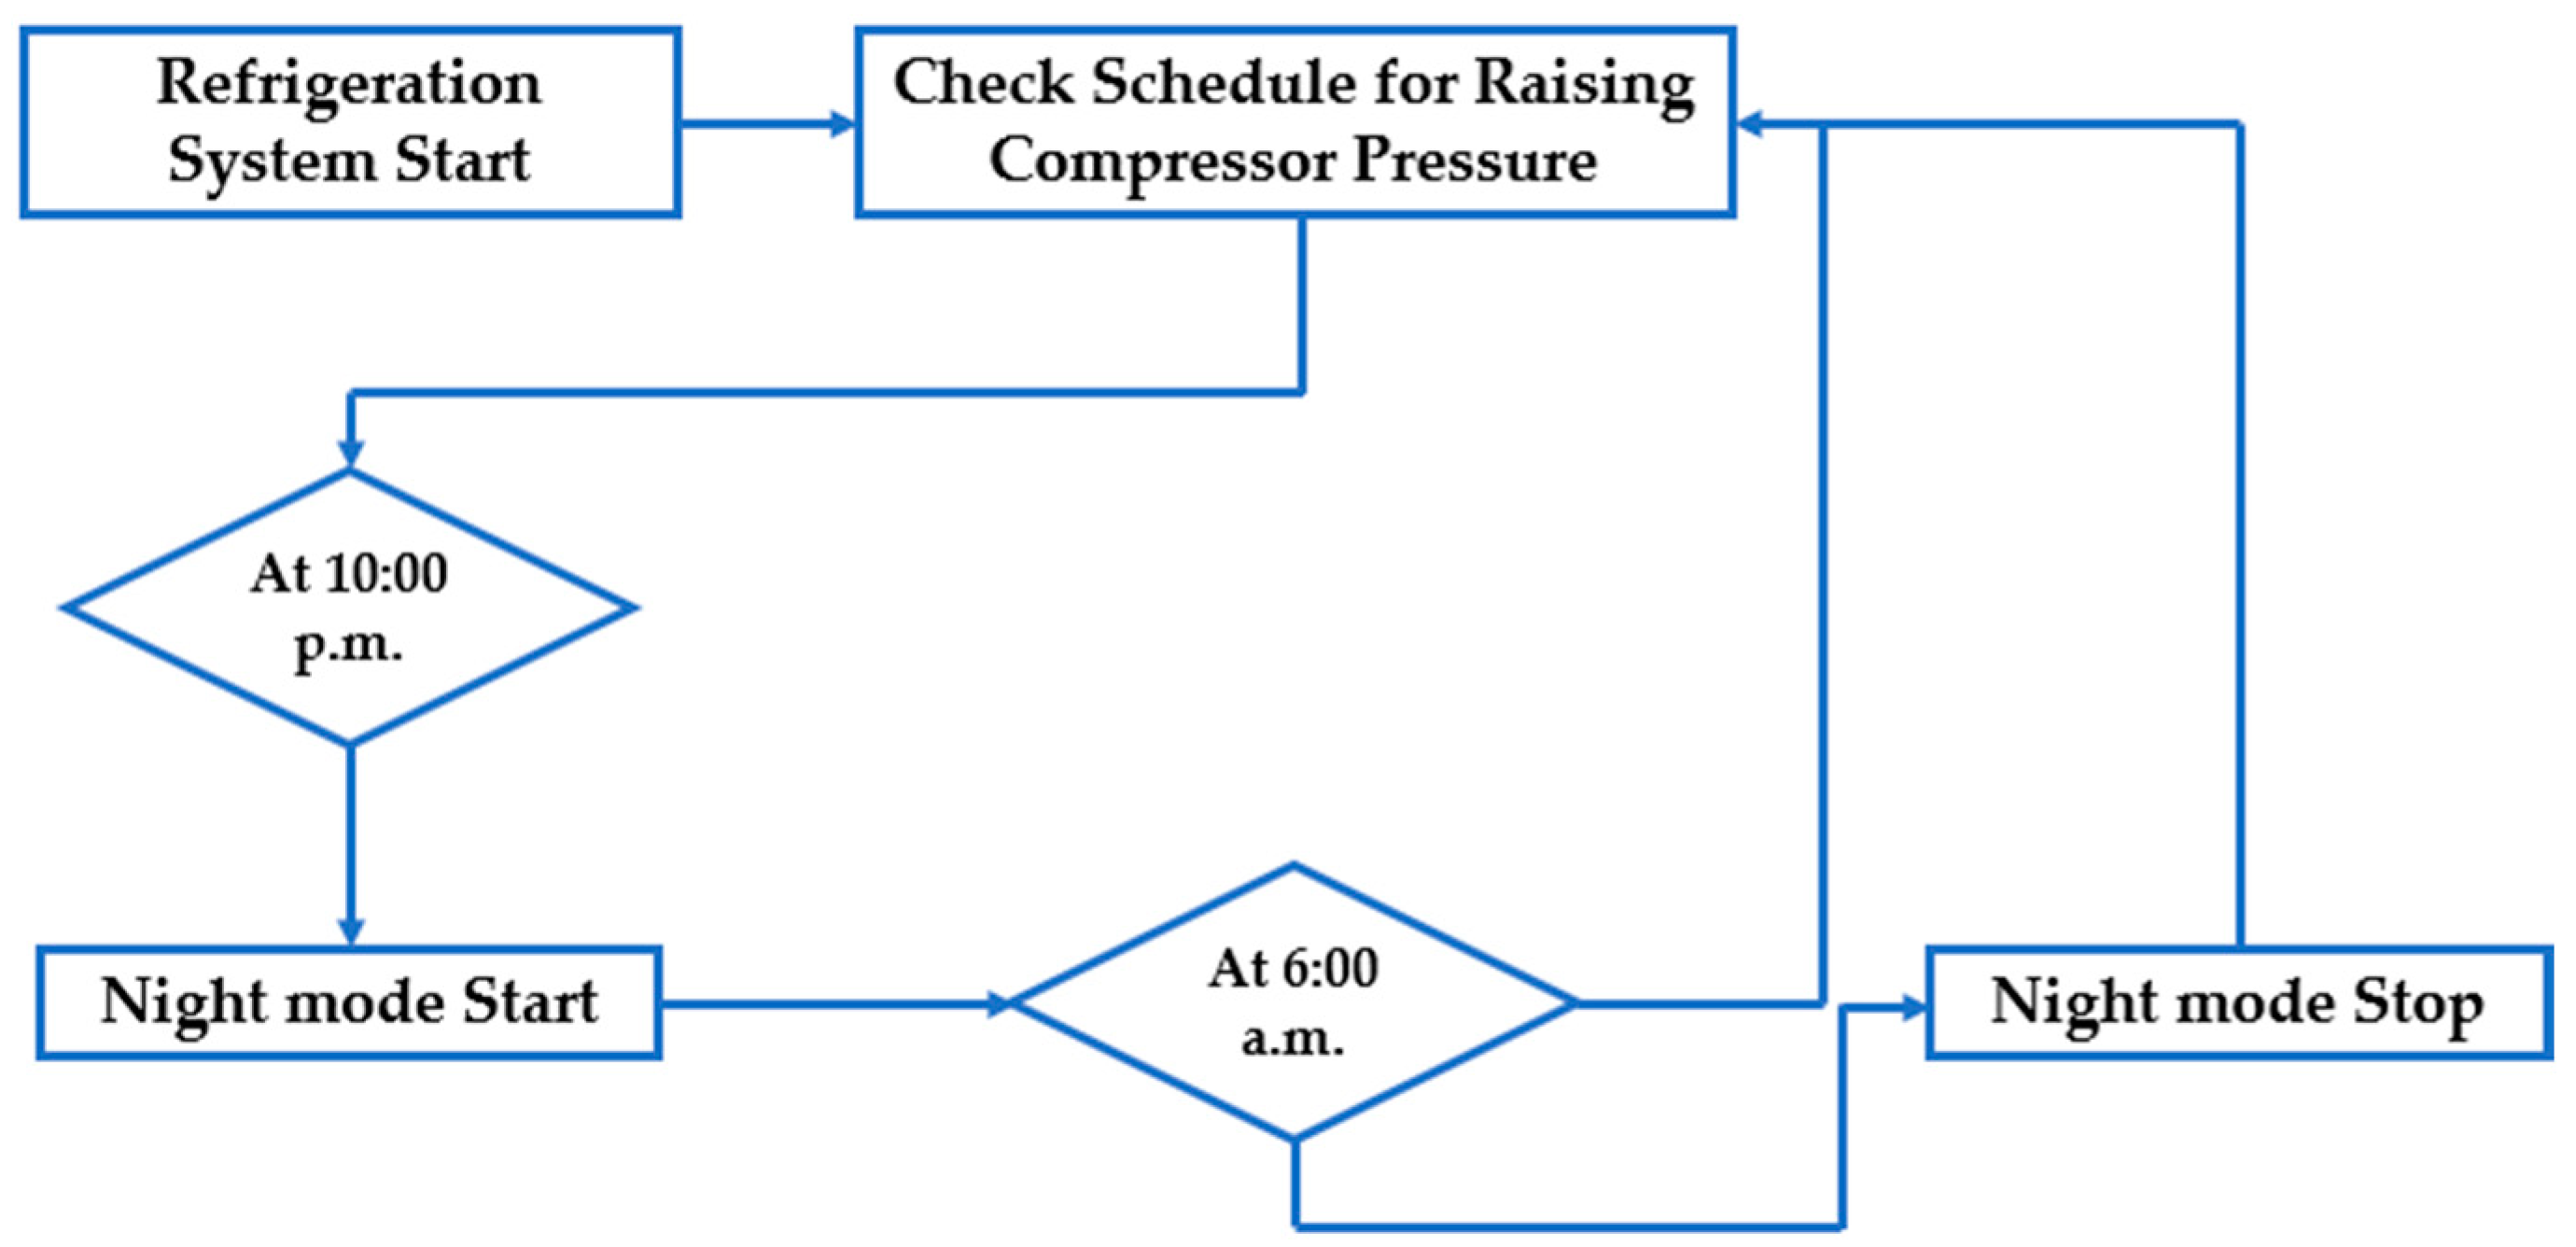
Typically, when the store is closed at night there is no activity generating heat from customers, and nighttime has a colder temperature than daytime. Therefore, the need for cooling in the refrigeration cabinets decreases at night. In this study, the BEMS directed the programmable logic controller (PLC) to raise the set point of the pressure transducer sensor located at the compressor by 0.3 bar (31 kPa) and increase the temperature set point by 2 degrees Celsius from the previous set point during the period from 10.00 p.m. to 6.00 a.m., as detailed in the flowchart in Figure 11.
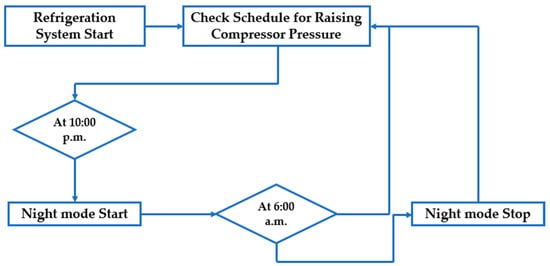
Figure 11.
Proposed BEMS logic control for refrigeration system at convenience store.
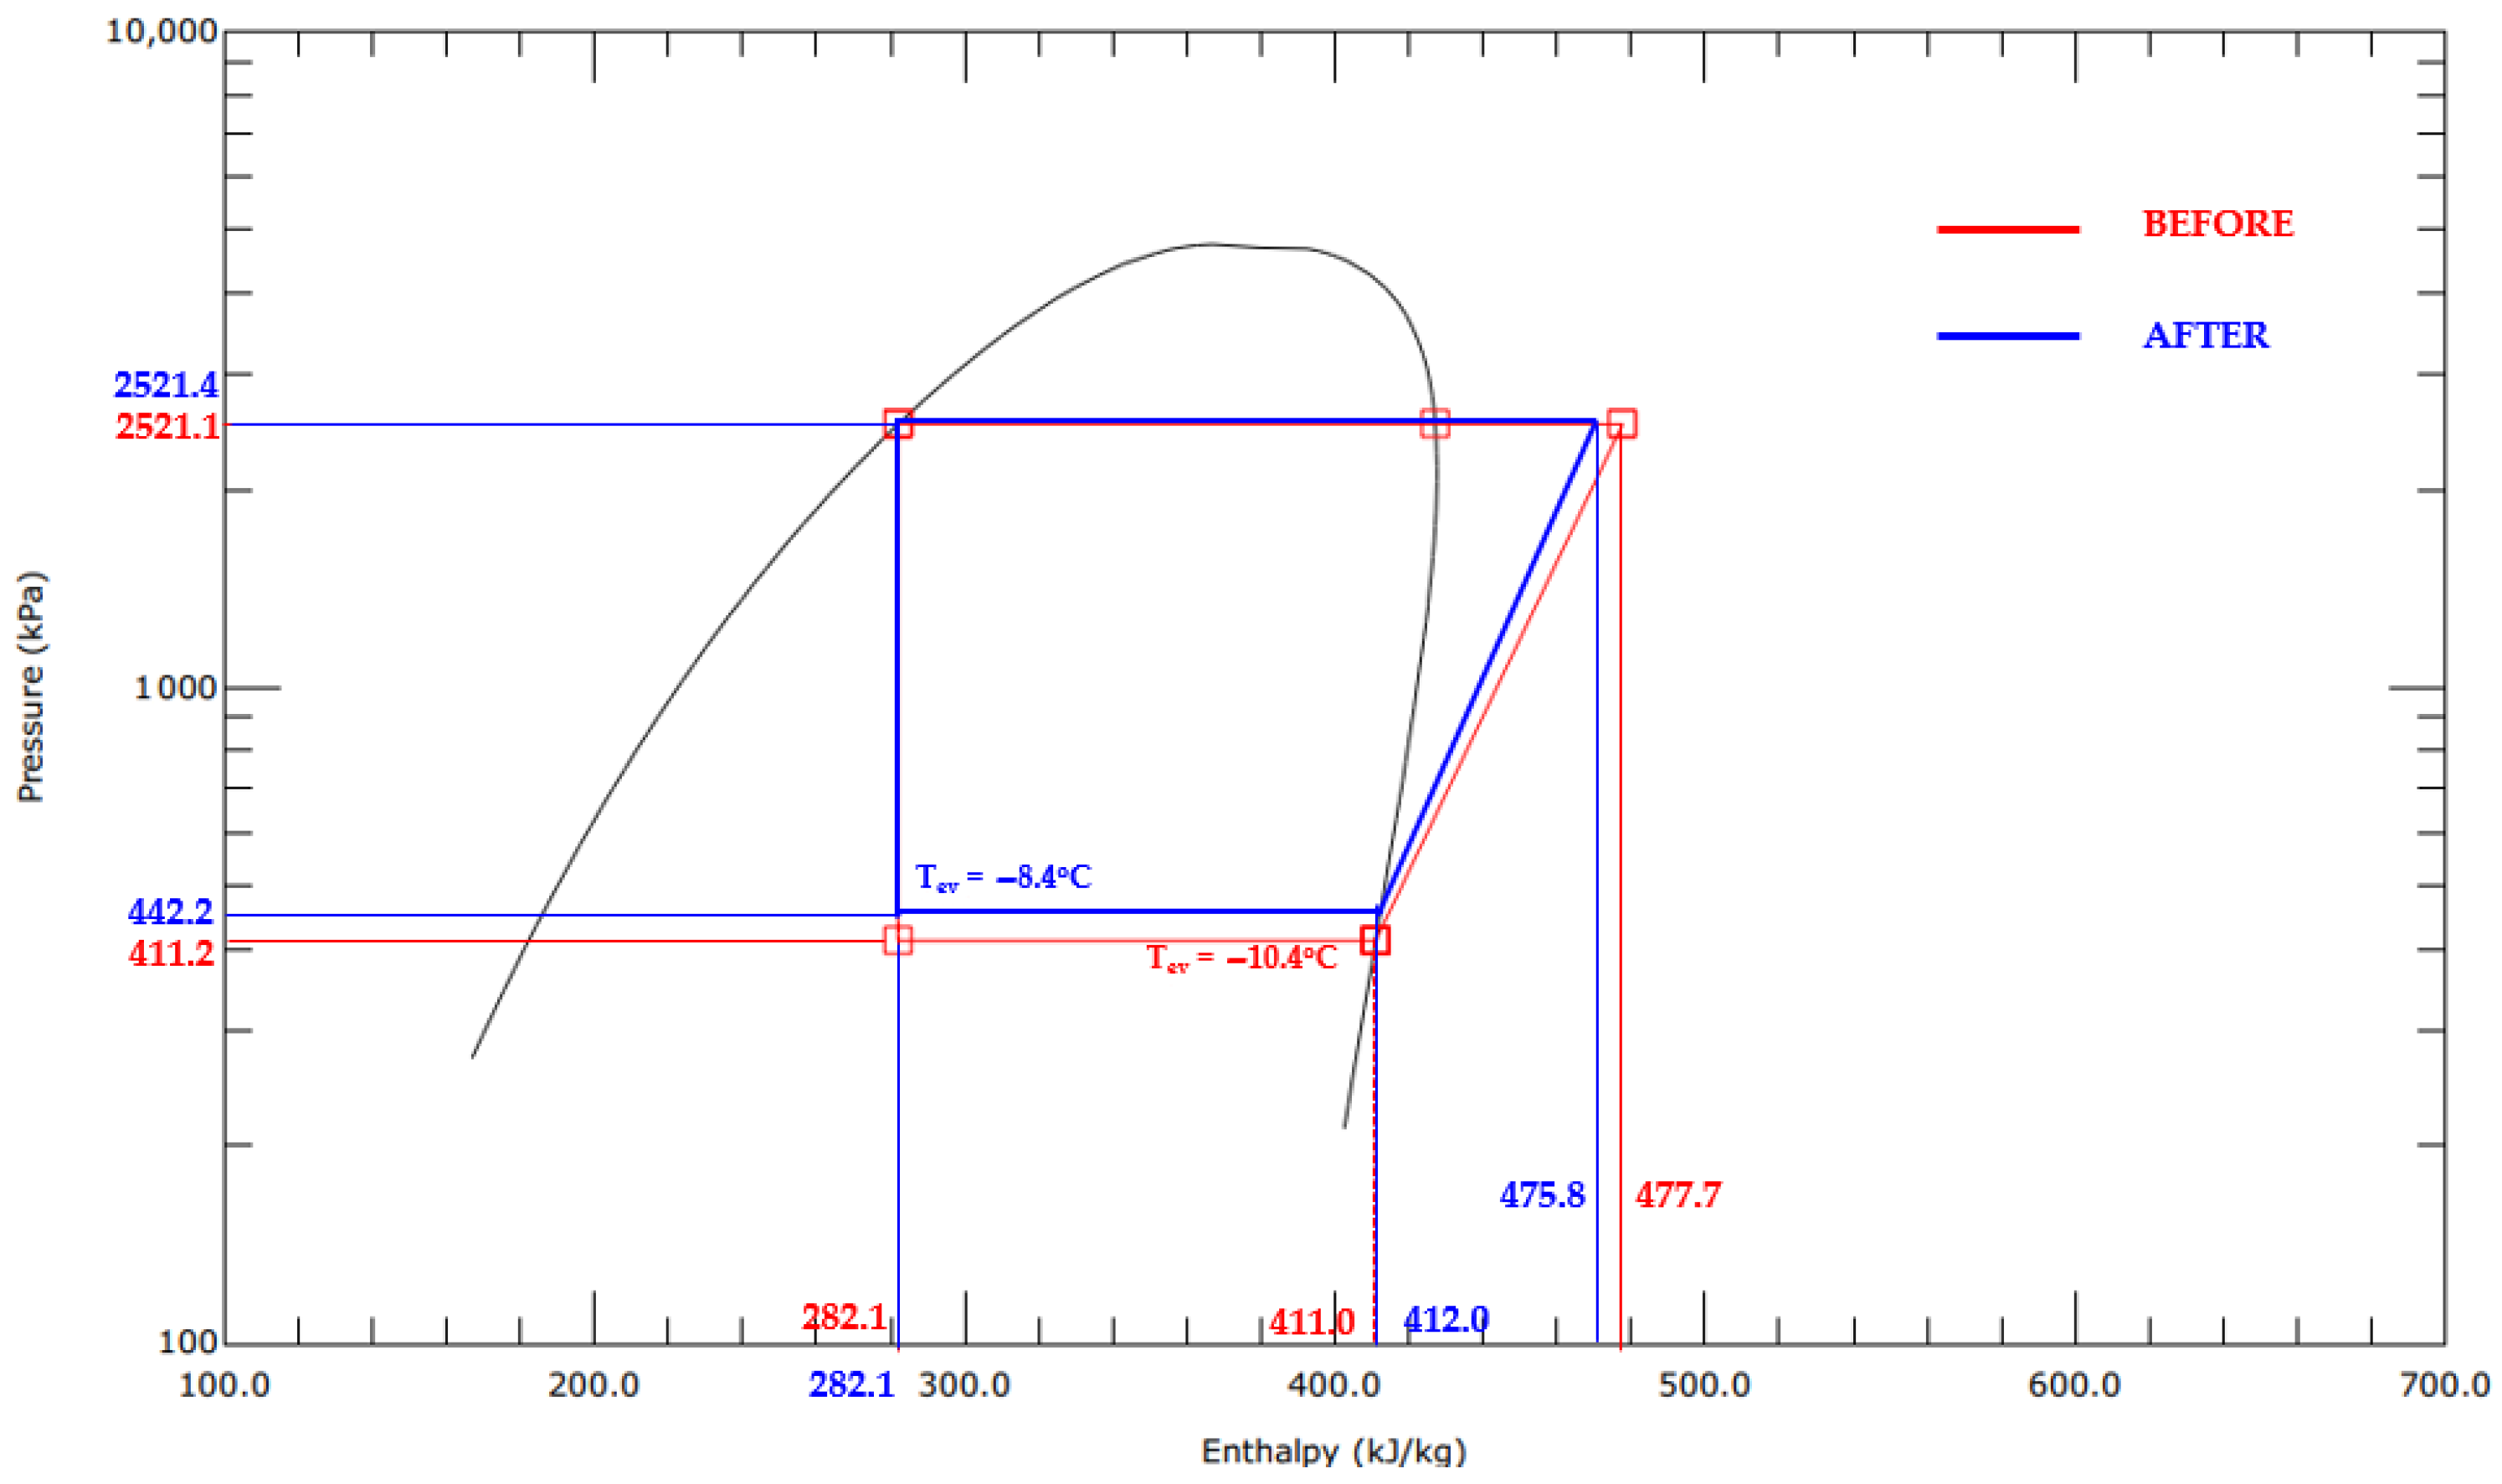
This action elevated the temperature at which evaporation occurs by 2 degrees Celsius and indirectly raised the compressor pressure by 0.3 bar (31 kPa). Theoretically, the system’s coefficient of performance (COP) experienced a change from 1.933 to 2.035, indicating a 5% increase in the COP. This information is illustrated in the detailed P-h diagram presented in Figure 12.
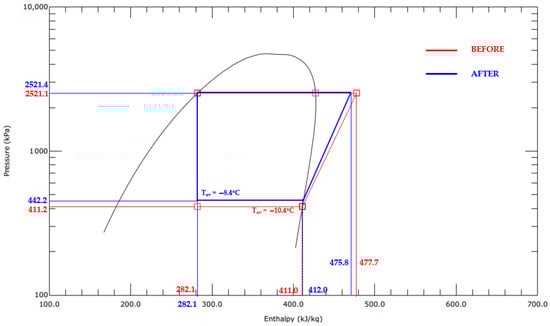
Figure 12.
R407F P-h diagram of the existing refrigeration system and the system after implementing the BEMS.
Figure 13 indicated that chilled cabinet and CDU of experiment store in this study. The findings of this study were condensed and compared with all variables before and after a period of 7 days using the energy and temperature-measuring devices, including the power consumption (kW and kWh). The energy consumption of the existing system and the BEMS was summarized. Over a span of 7 days, the energy usage was analyzed and contrasted exclusively during the nighttime hours between 10:00 p.m. and 6:00 a.m. to observe the disparity in energy consumption during the period when the store was closed.
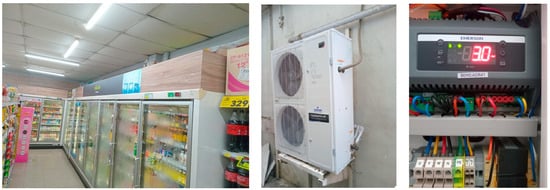
Figure 13.
Refrigeration system at the store.
4. Results
4.1. Energy Efficiency Improvement of AC System Using BEMS
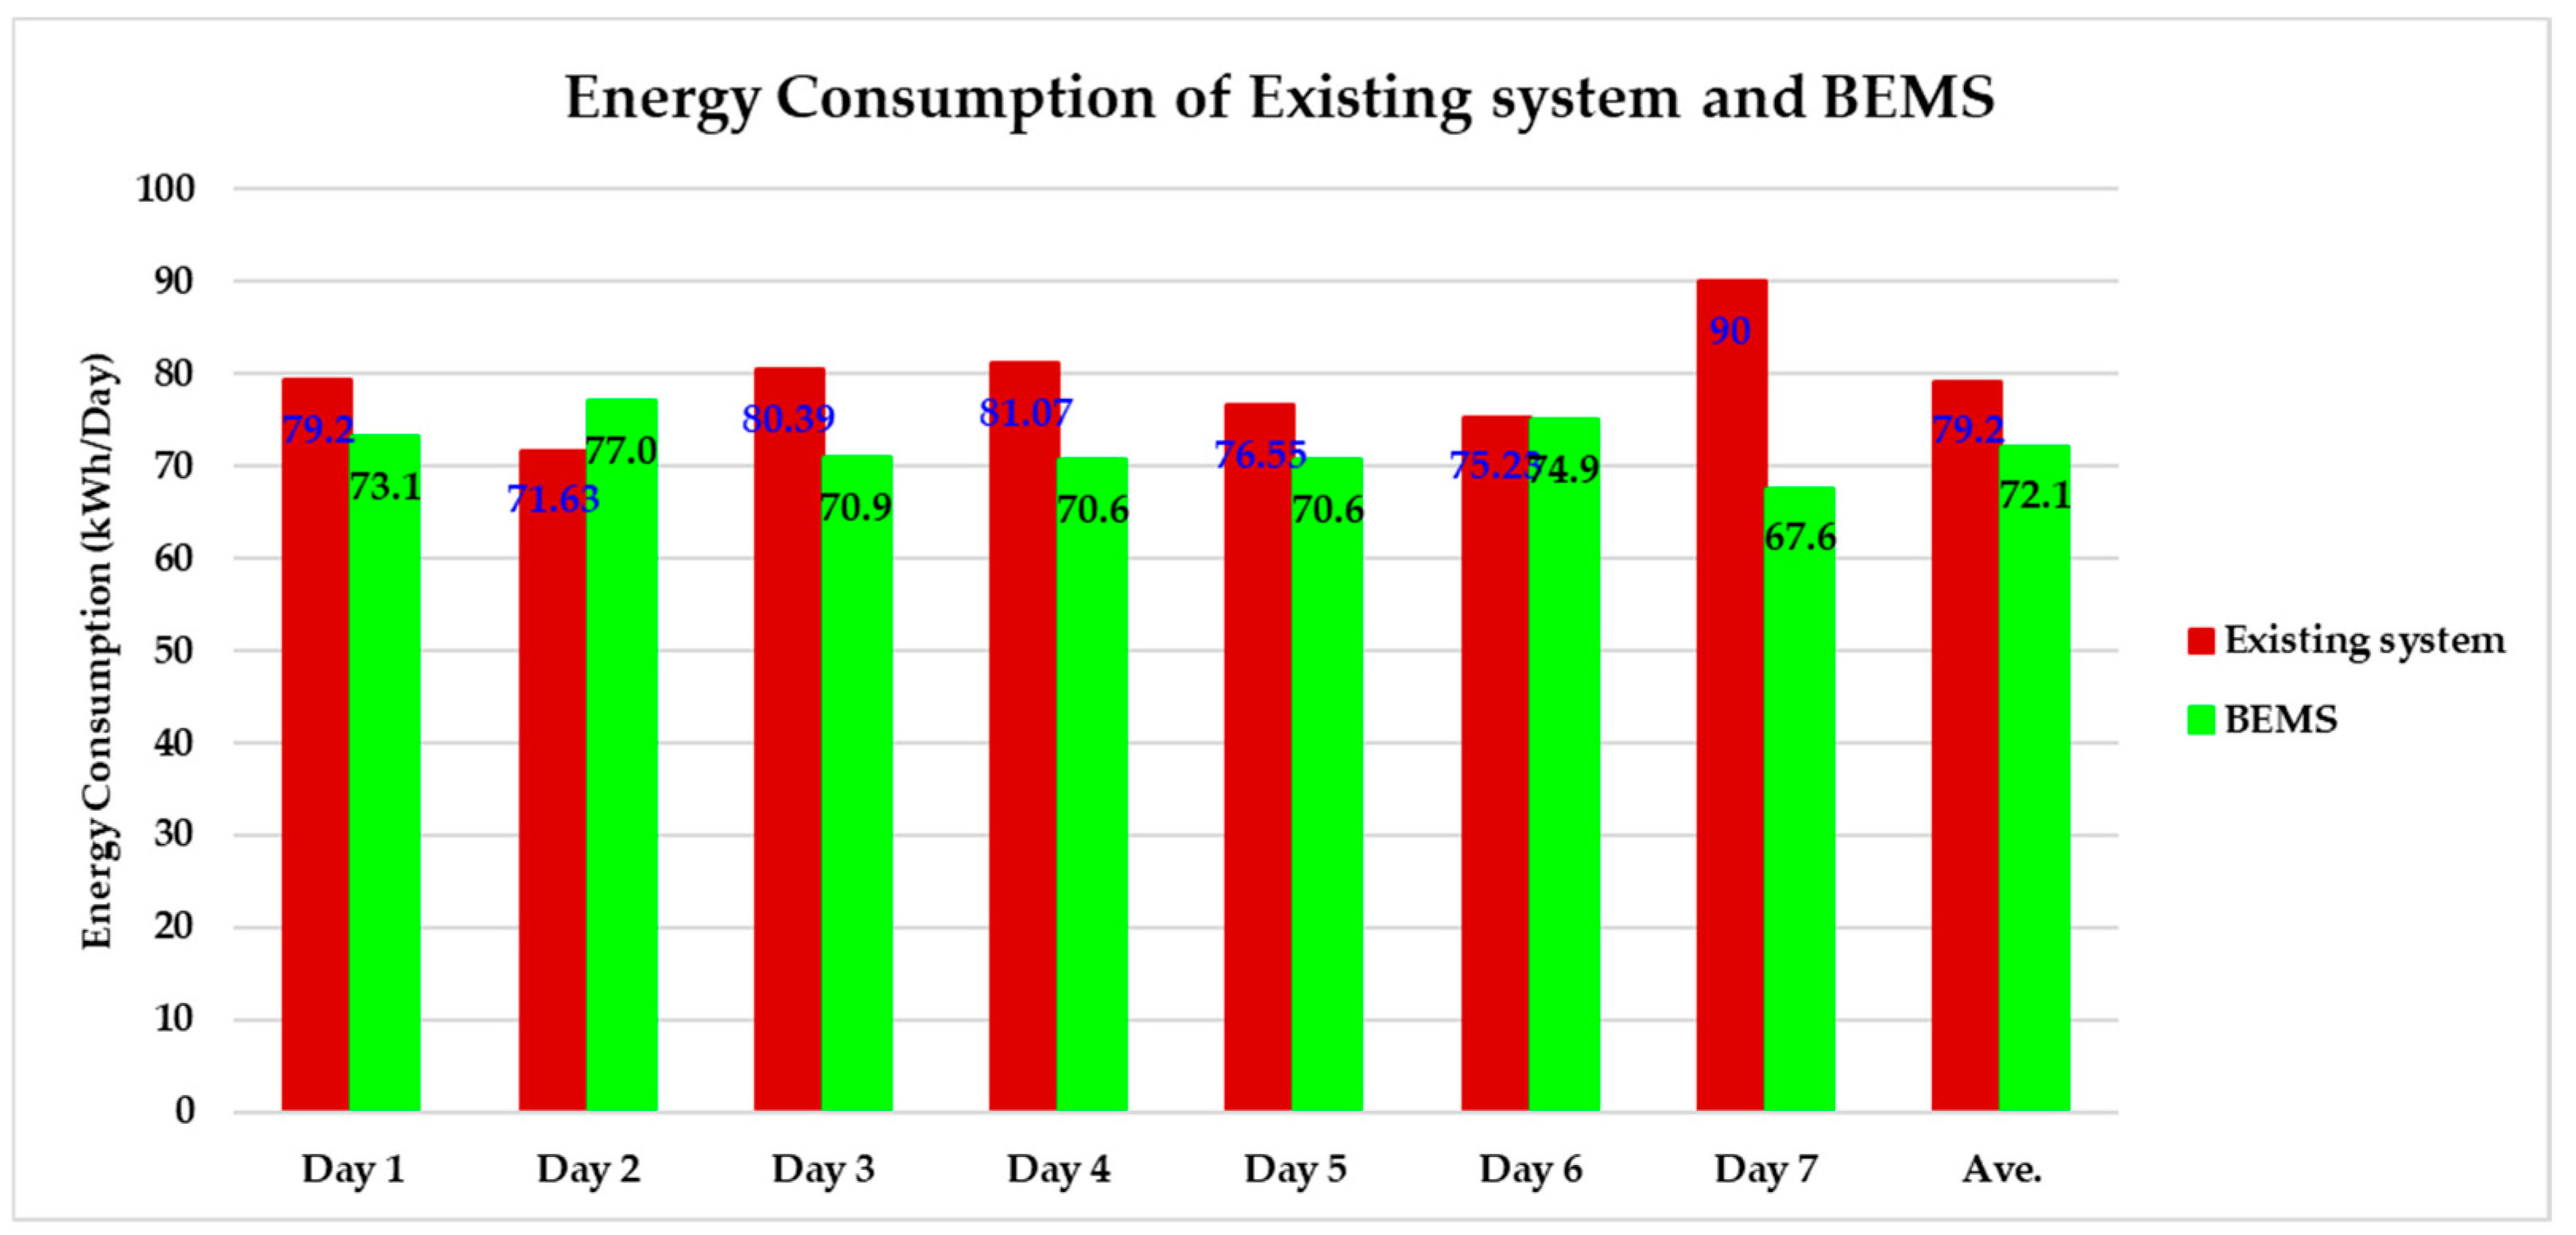
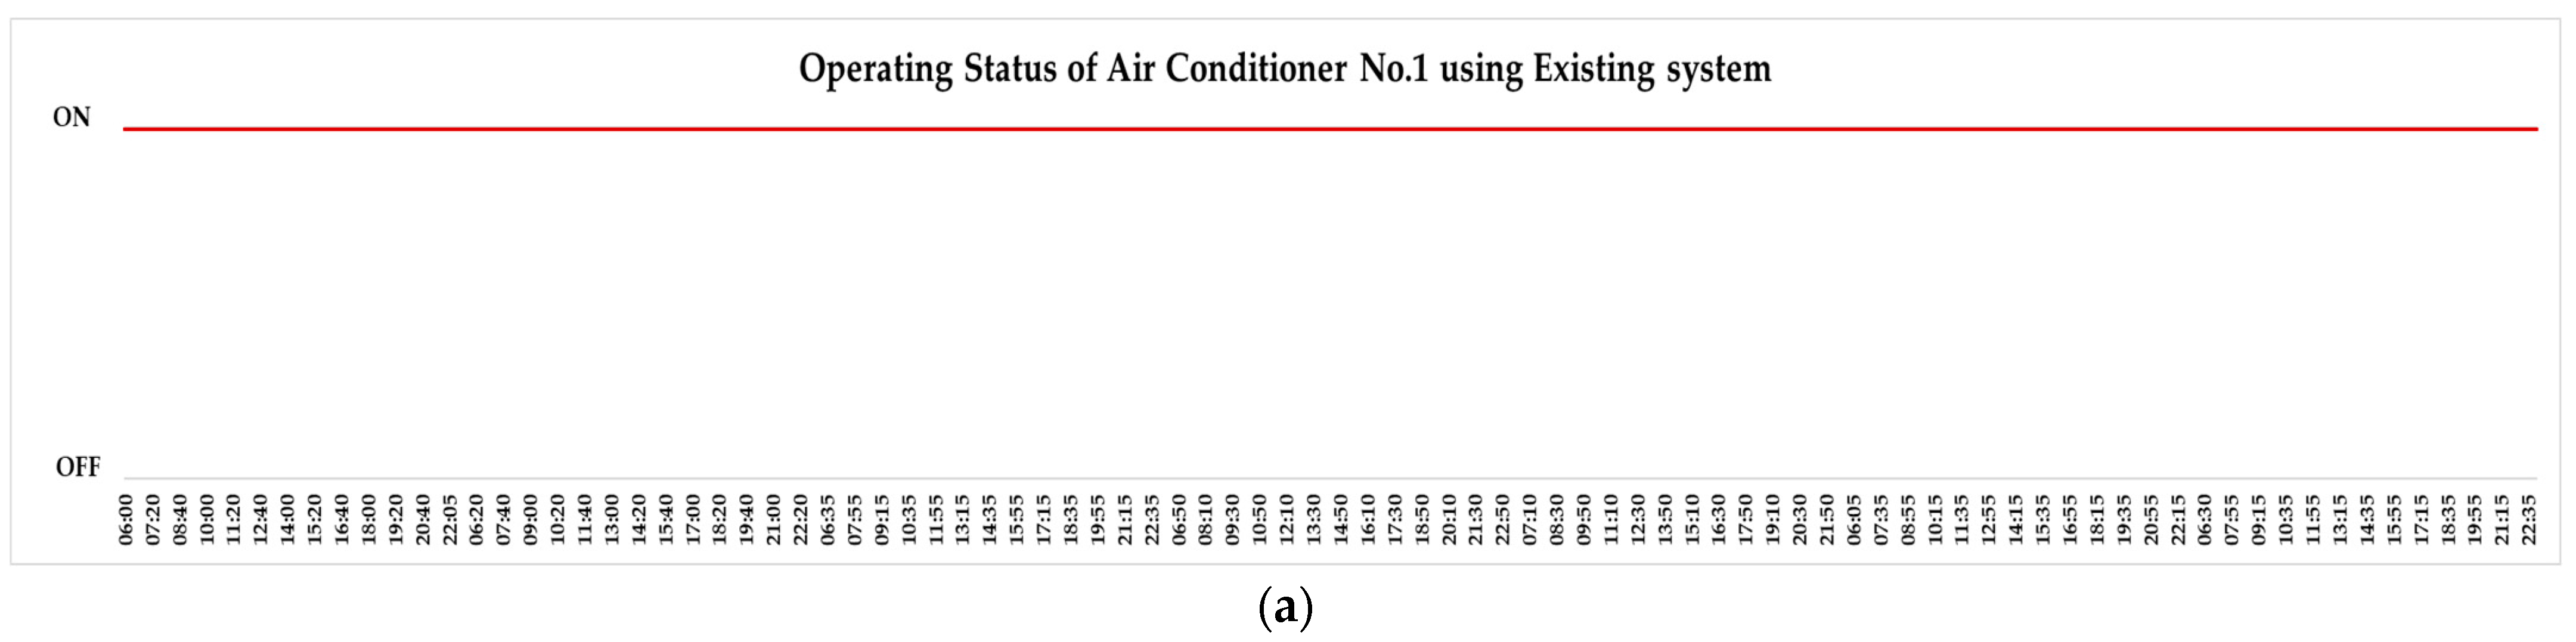
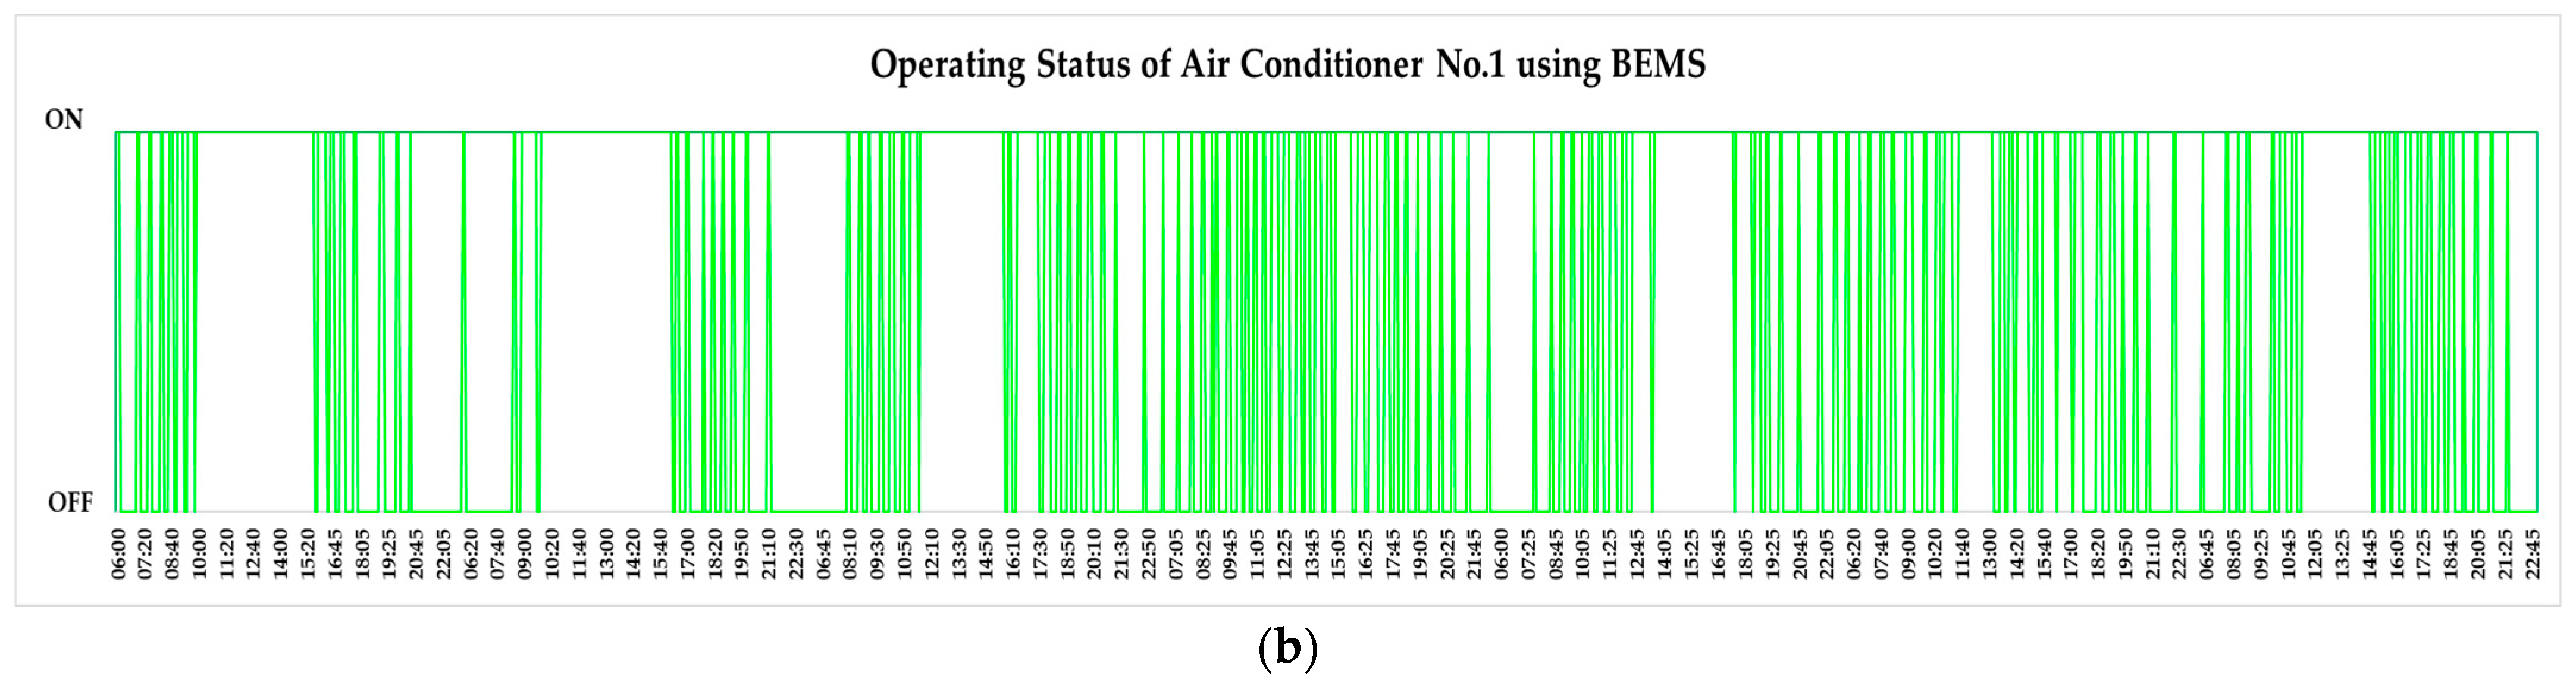
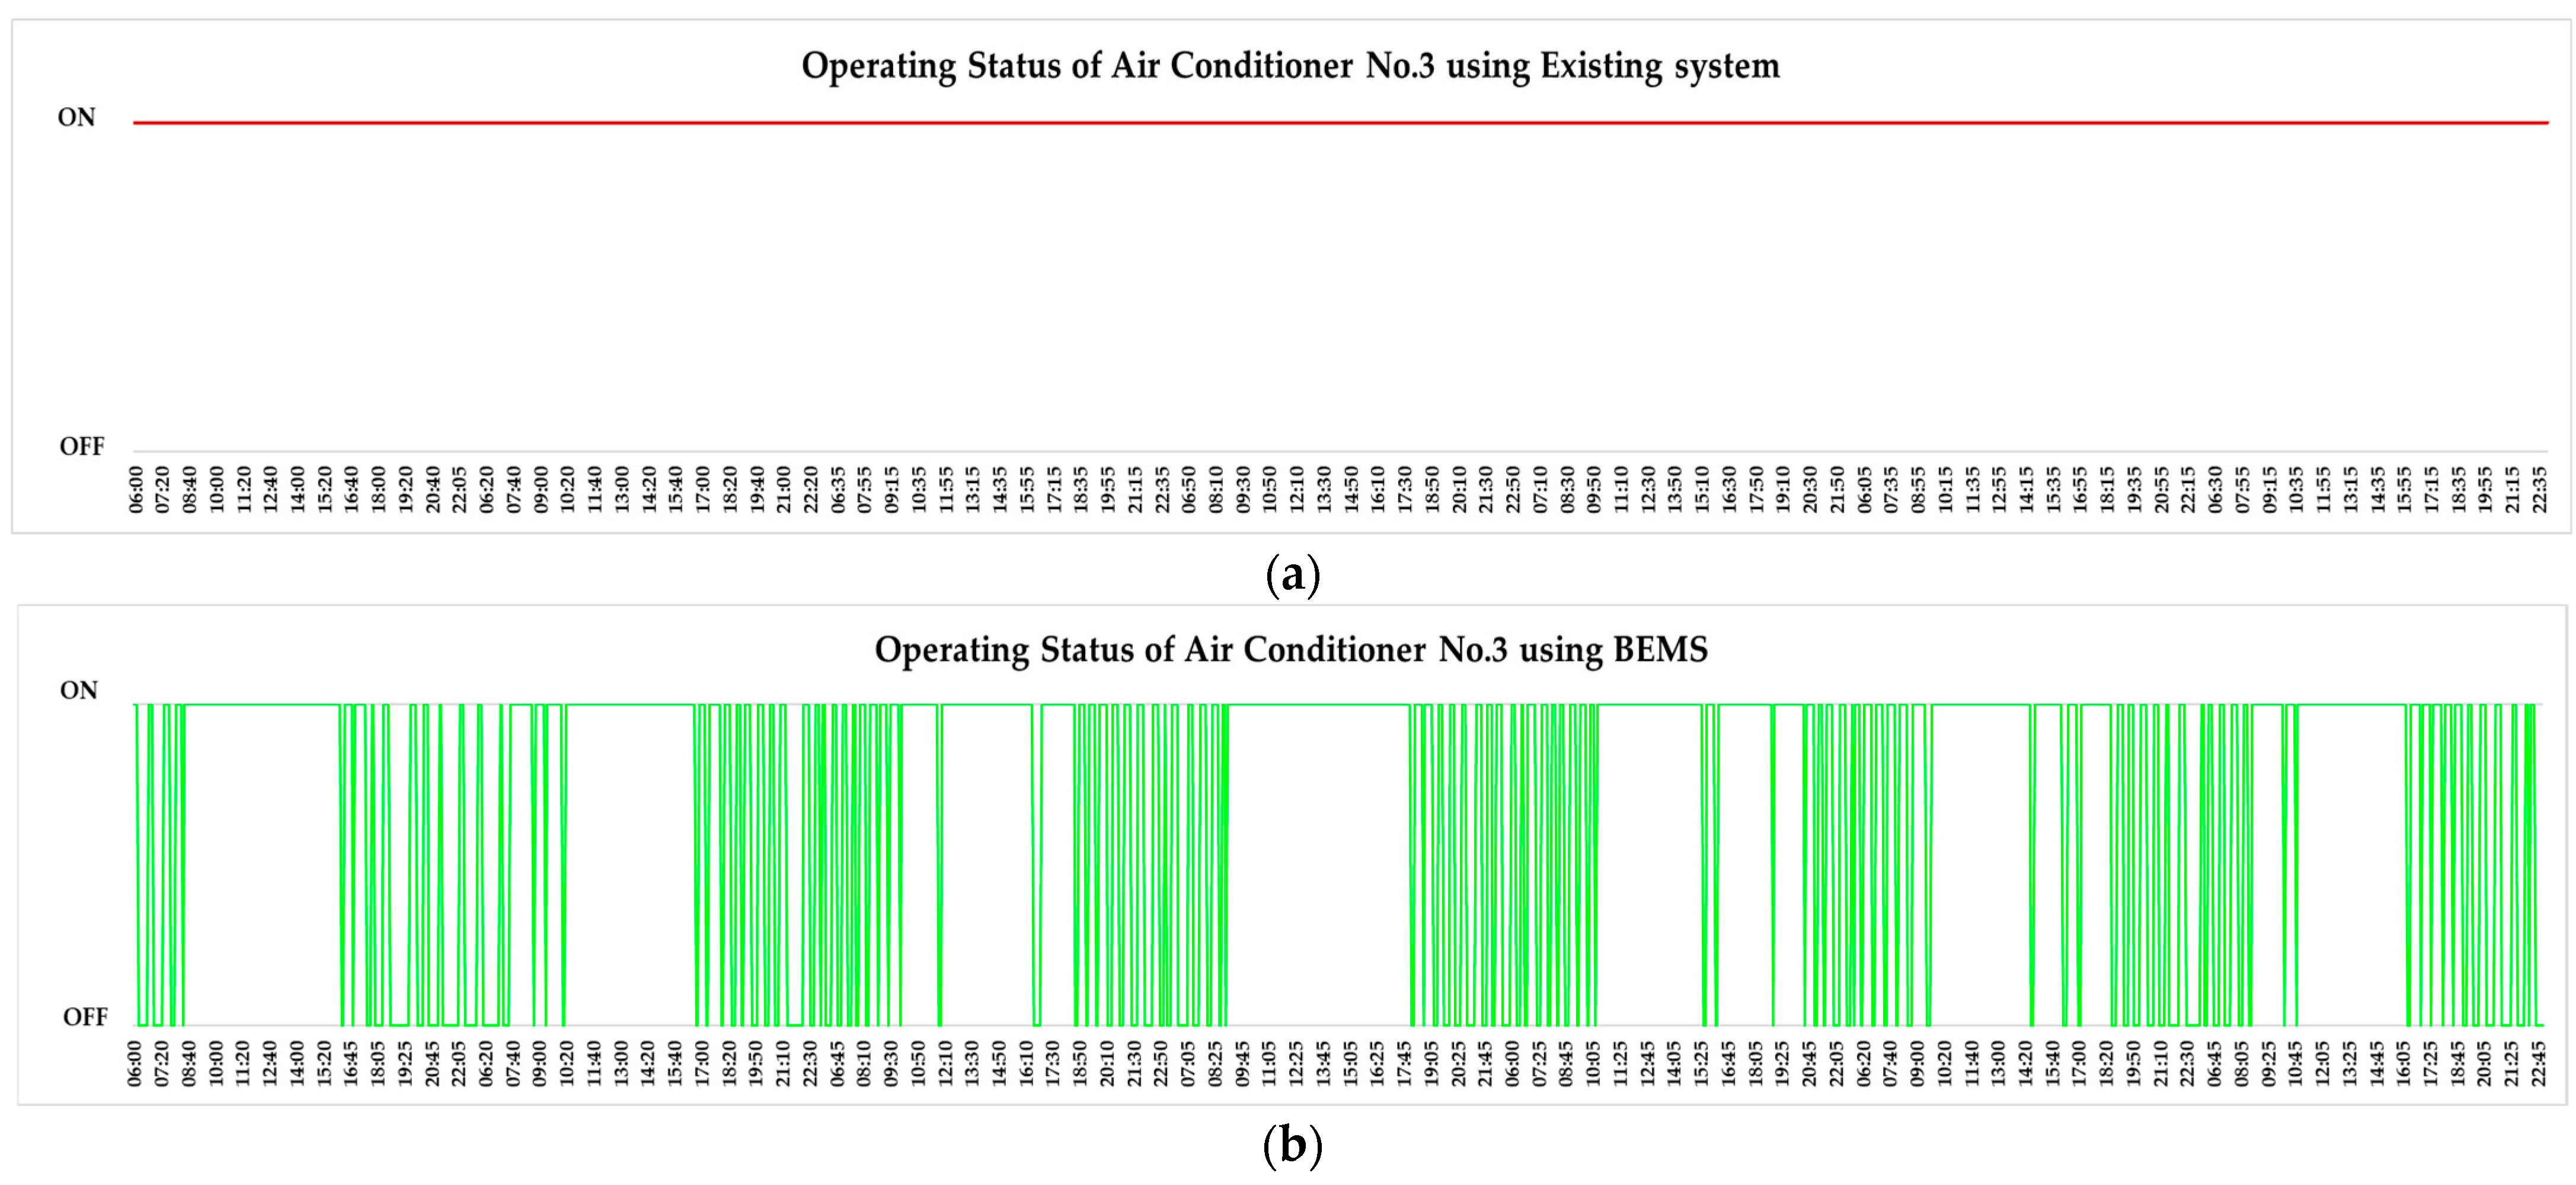
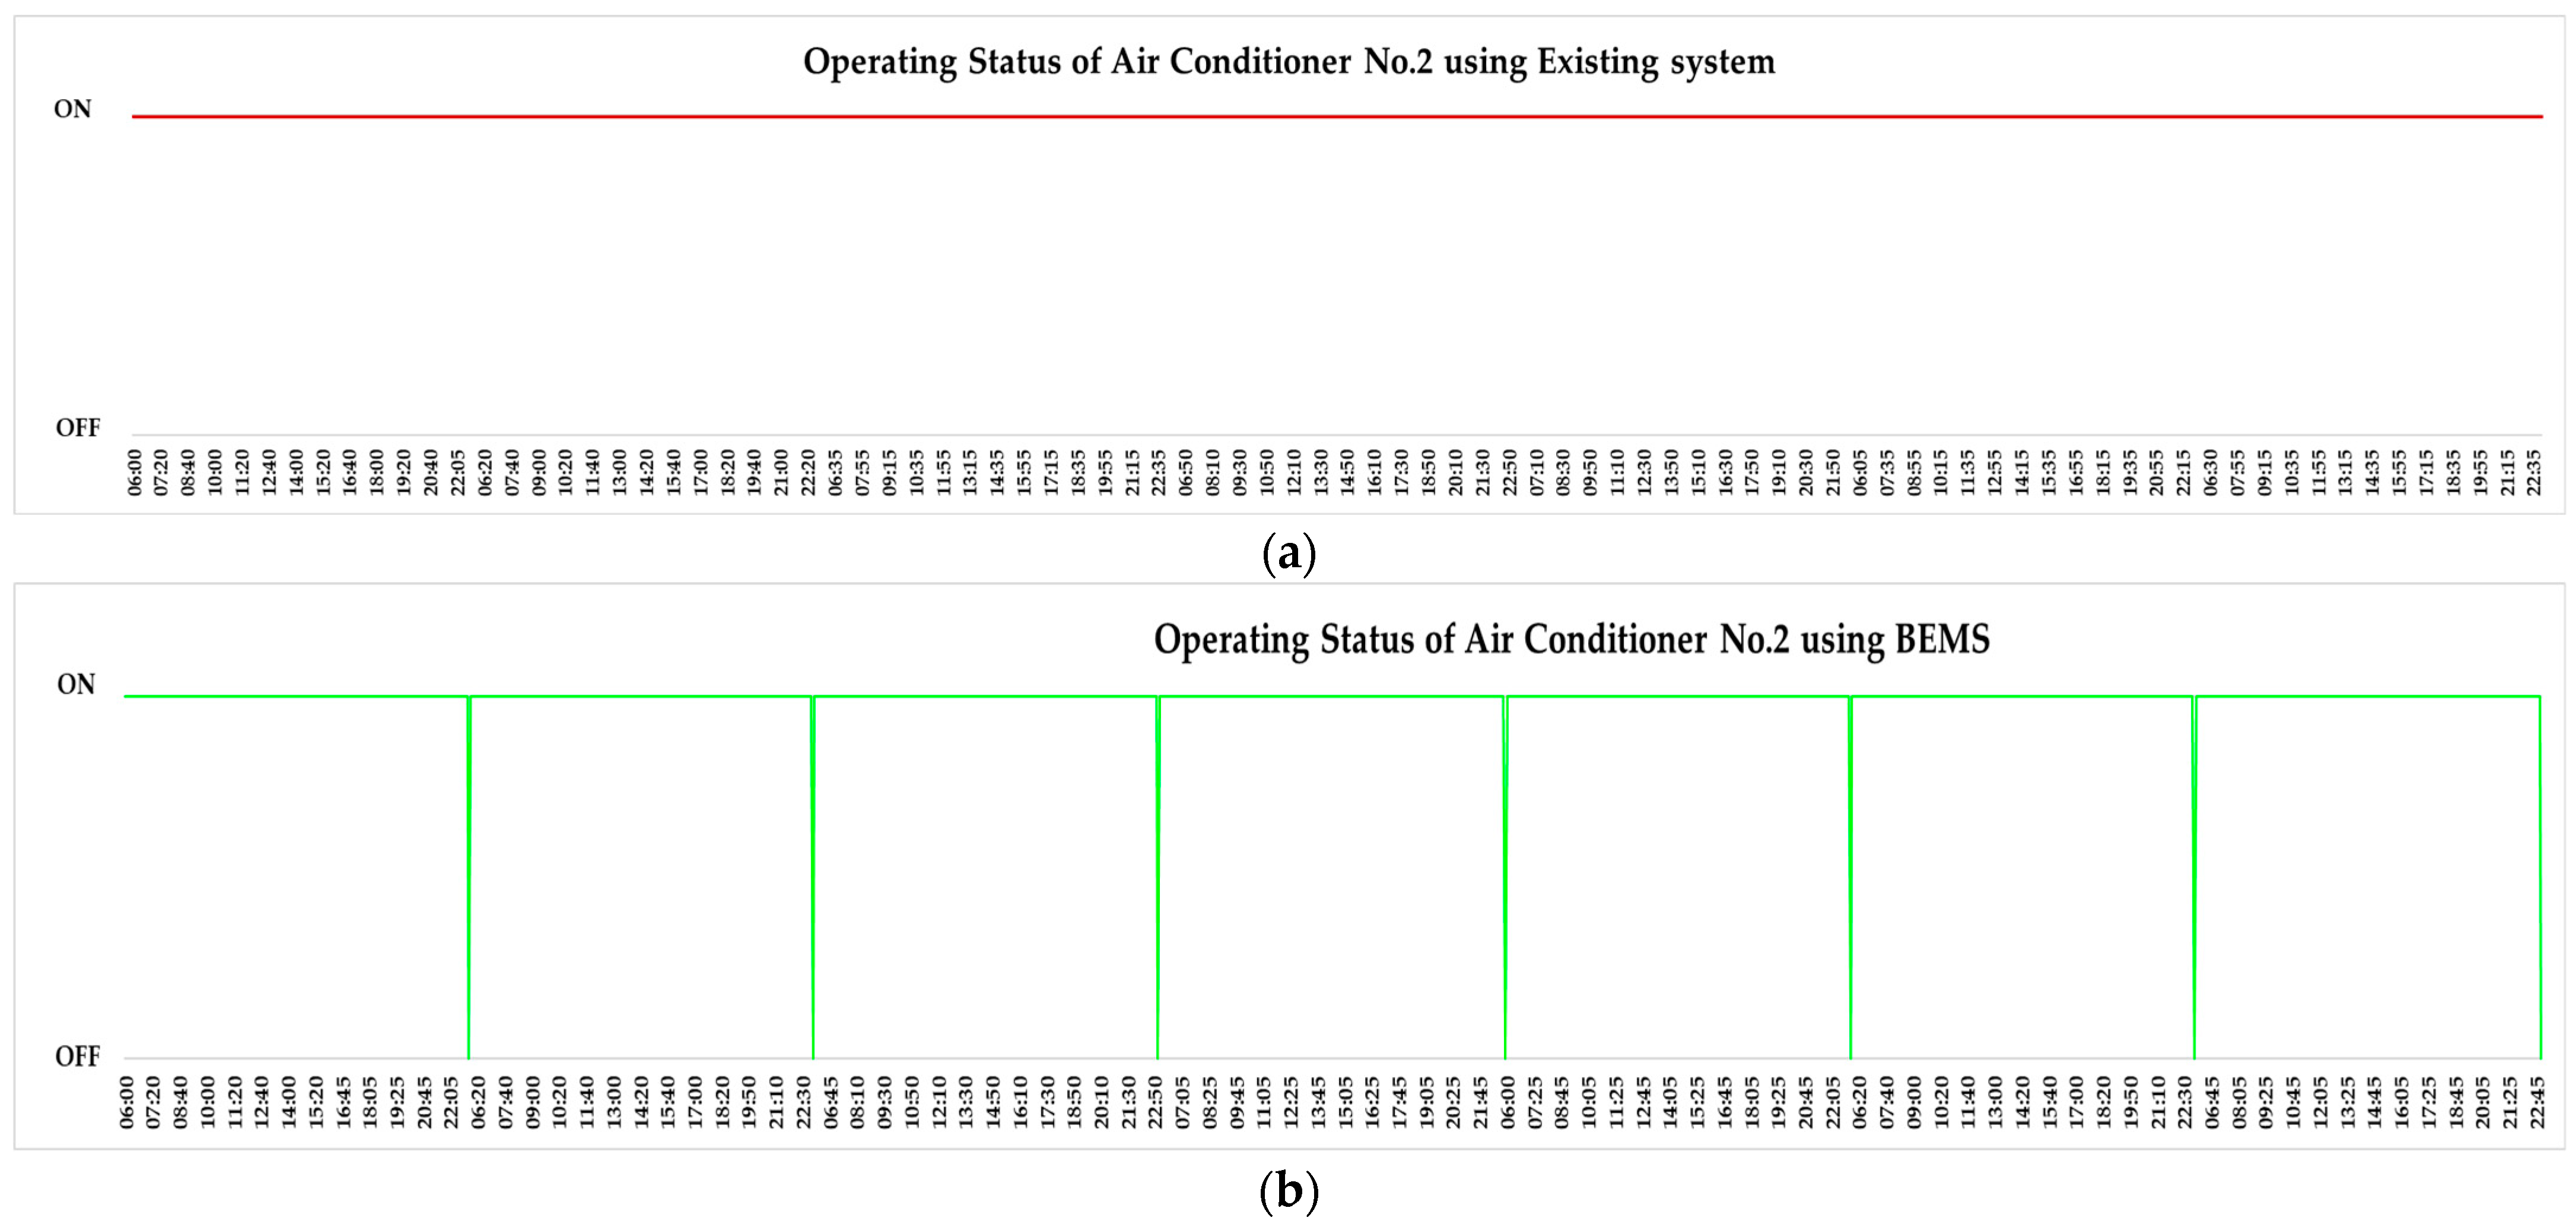
Figure 14 illustrates that following the implementation of the BEMS, the total energy consumption of the AC system during the store’s operating hours of 6:00 a.m. to 11:00 p.m. was consistently lower than with the existing system. The average total energy consumption values of the existing AC system and the BEMS were 79.2 and 72.1 kWh/day, respectively. The BEMS logic control proposed in this research can save 7.1 kWh/day and 2591.5 kWh/year for a reduction of 8.9%. On all days of the experiment using the existing system and the BEMS, the outdoor temperatures were very close. In addition, the energy output decreased after the experiment during both the morning and evening hours, particularly when the ambient temperature was lower compared to the daytime (shown in Figure 15). This allowed the BEMS logic control of the AC system to effectively conserve energy for the store. The operating statuses of the compressors for AC No. 1 (shown in Figure 16) and AC No. 3 (shown in Figure 17) suggest that they were not in operation during the morning, evening, or nighttime. This implies that energy can be saved by reducing the work performed by the compressors. Nevertheless, AC No. 2, as shown in Figure 18, remained in operation consistently during the entire period the store was open to ensure that the store’s heat load was effectively managed and rejected.
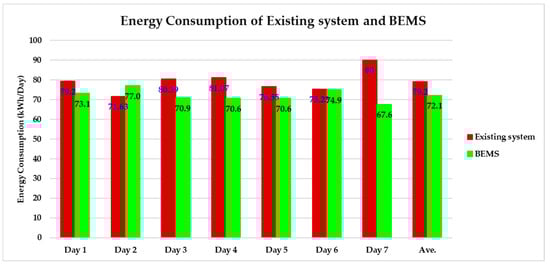
Figure 14.
Average energy consumption results of AC system.
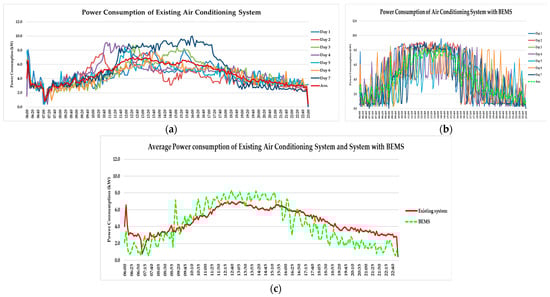
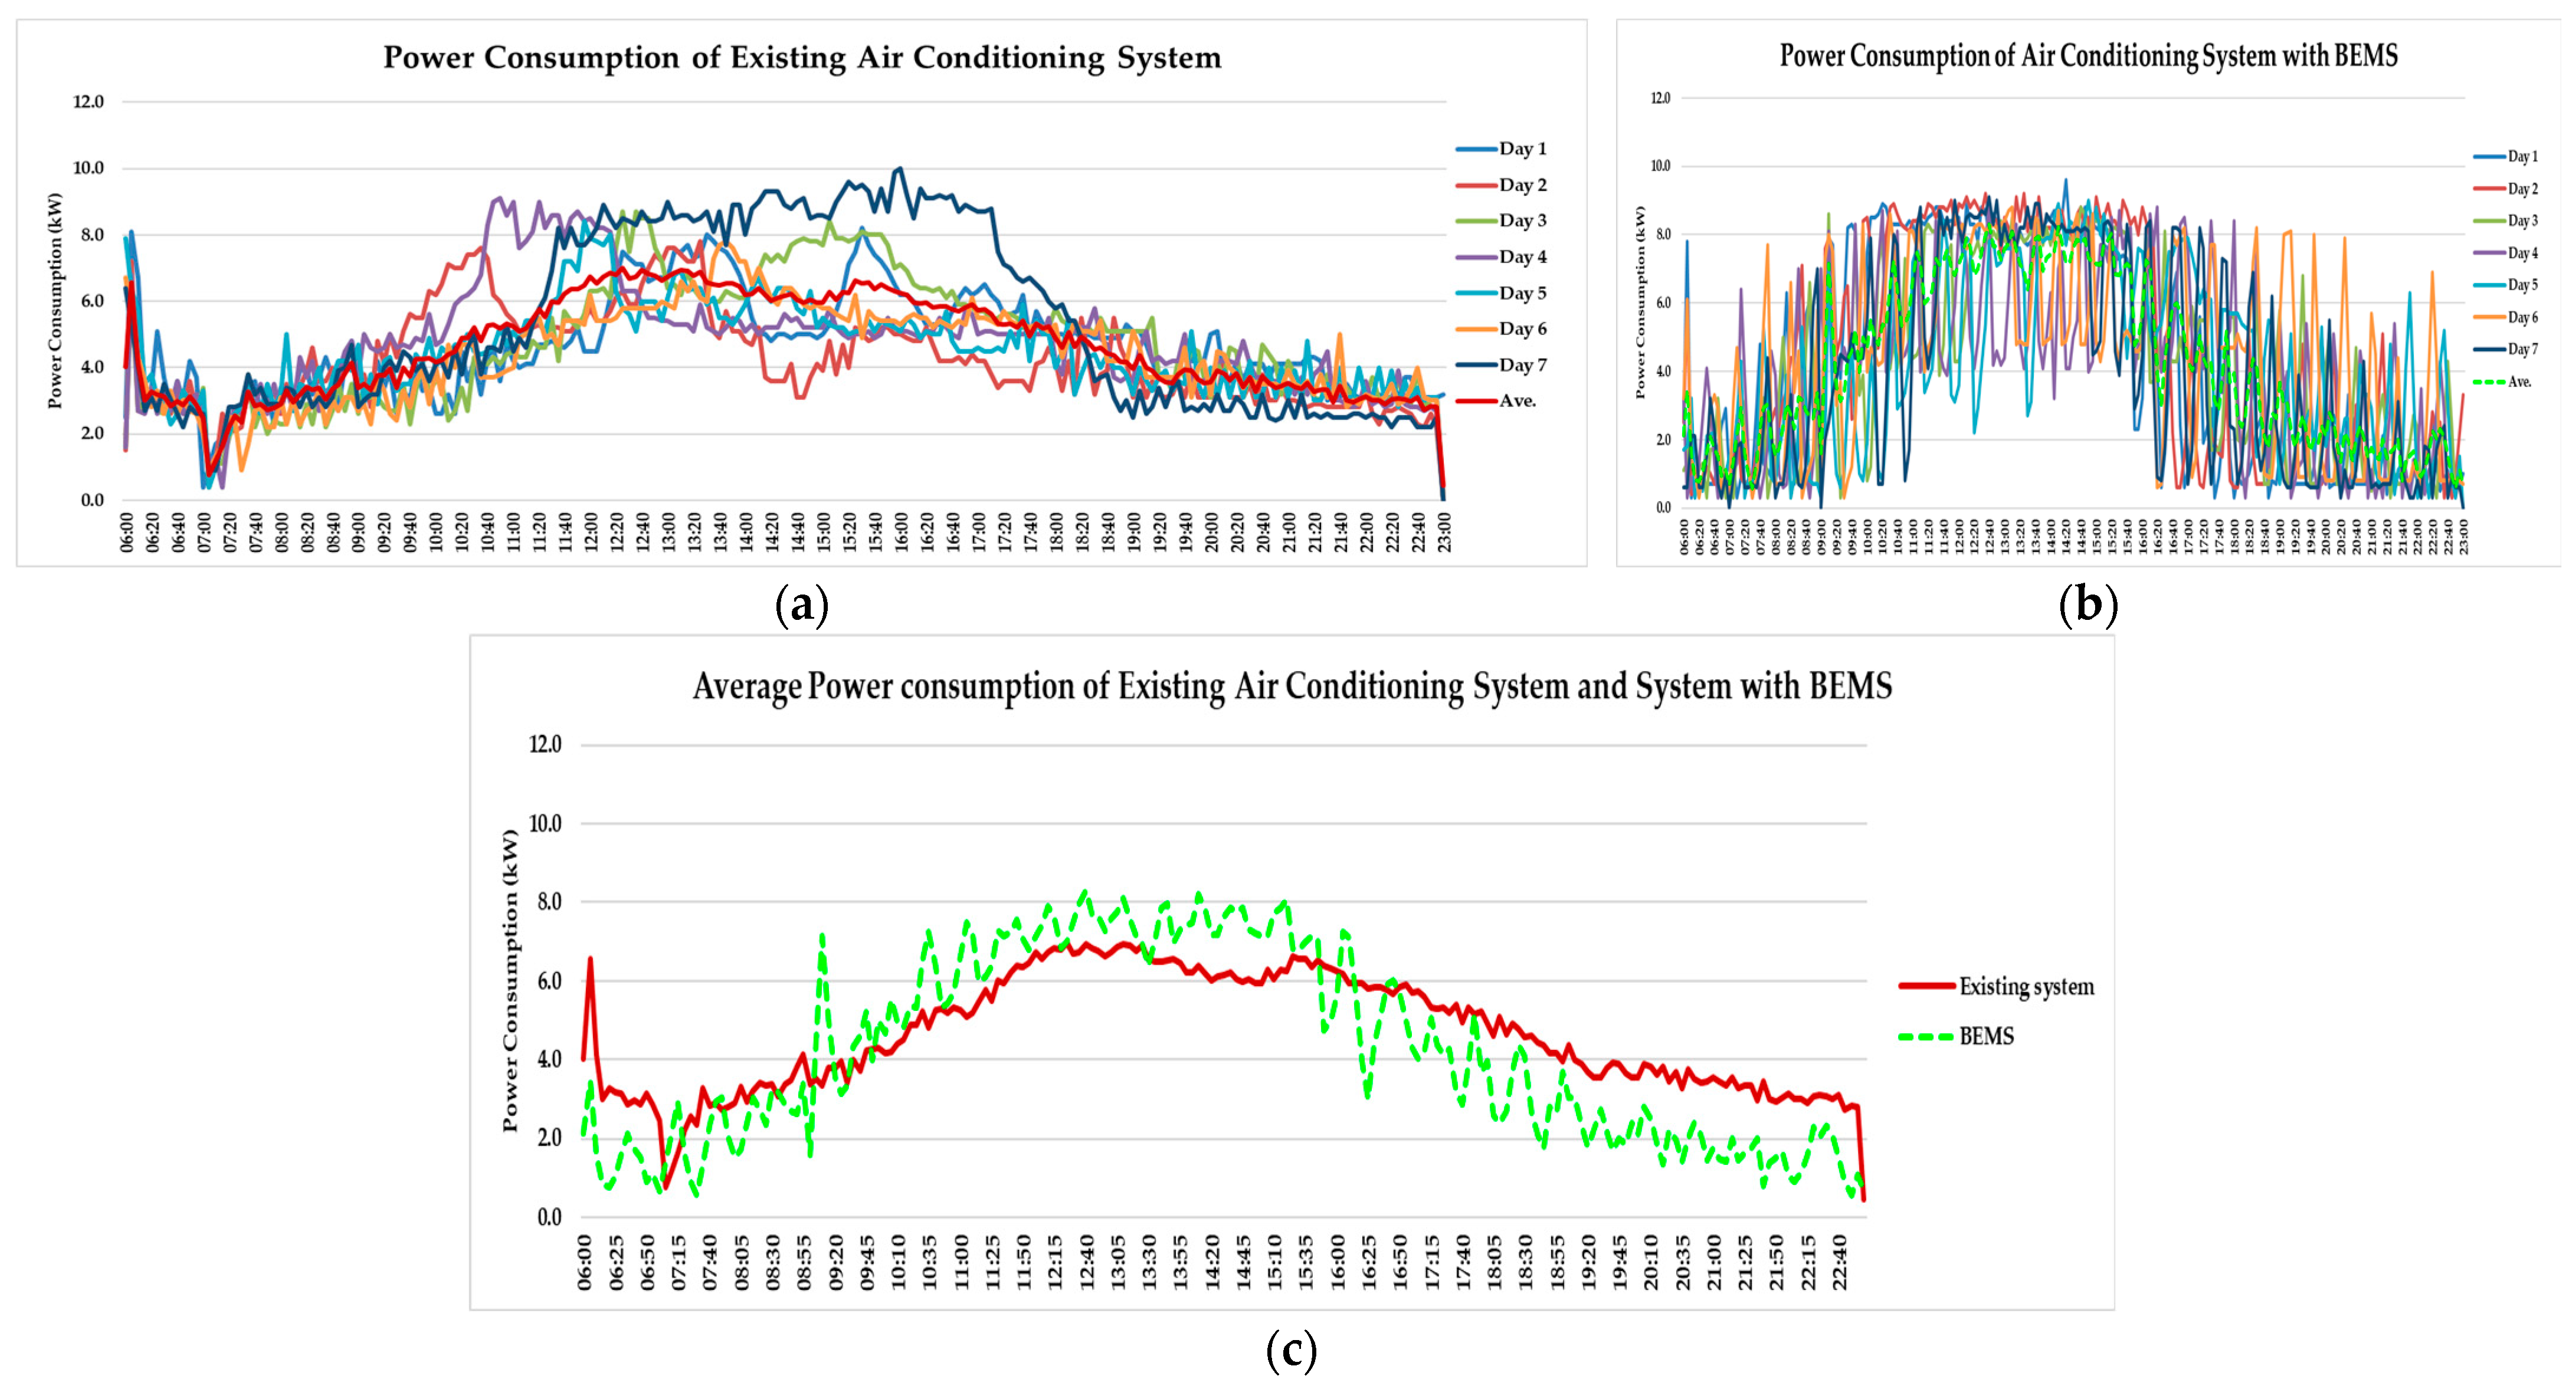
Figure 15.
AC power consumption results for (a) existing system and (b) BEMS. (c) Average results for existing system and BEMS.
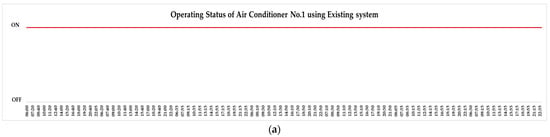
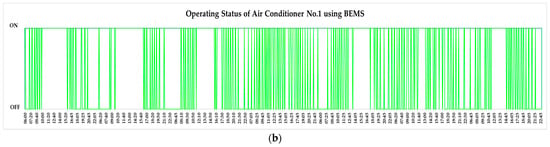
Figure 16.
Compressor status results of Air Conditioner No. 1 using (a) existing system and (b) BEMS.
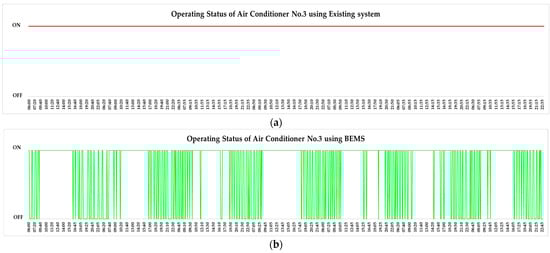
Figure 17.
Compressor status results of Air Conditioner No. 3 using (a) existing system and (b) BEMS.
Figure 18.
Compressor status results of Air Conditioner No. 2 using (a) existing system and (b) BEMS.
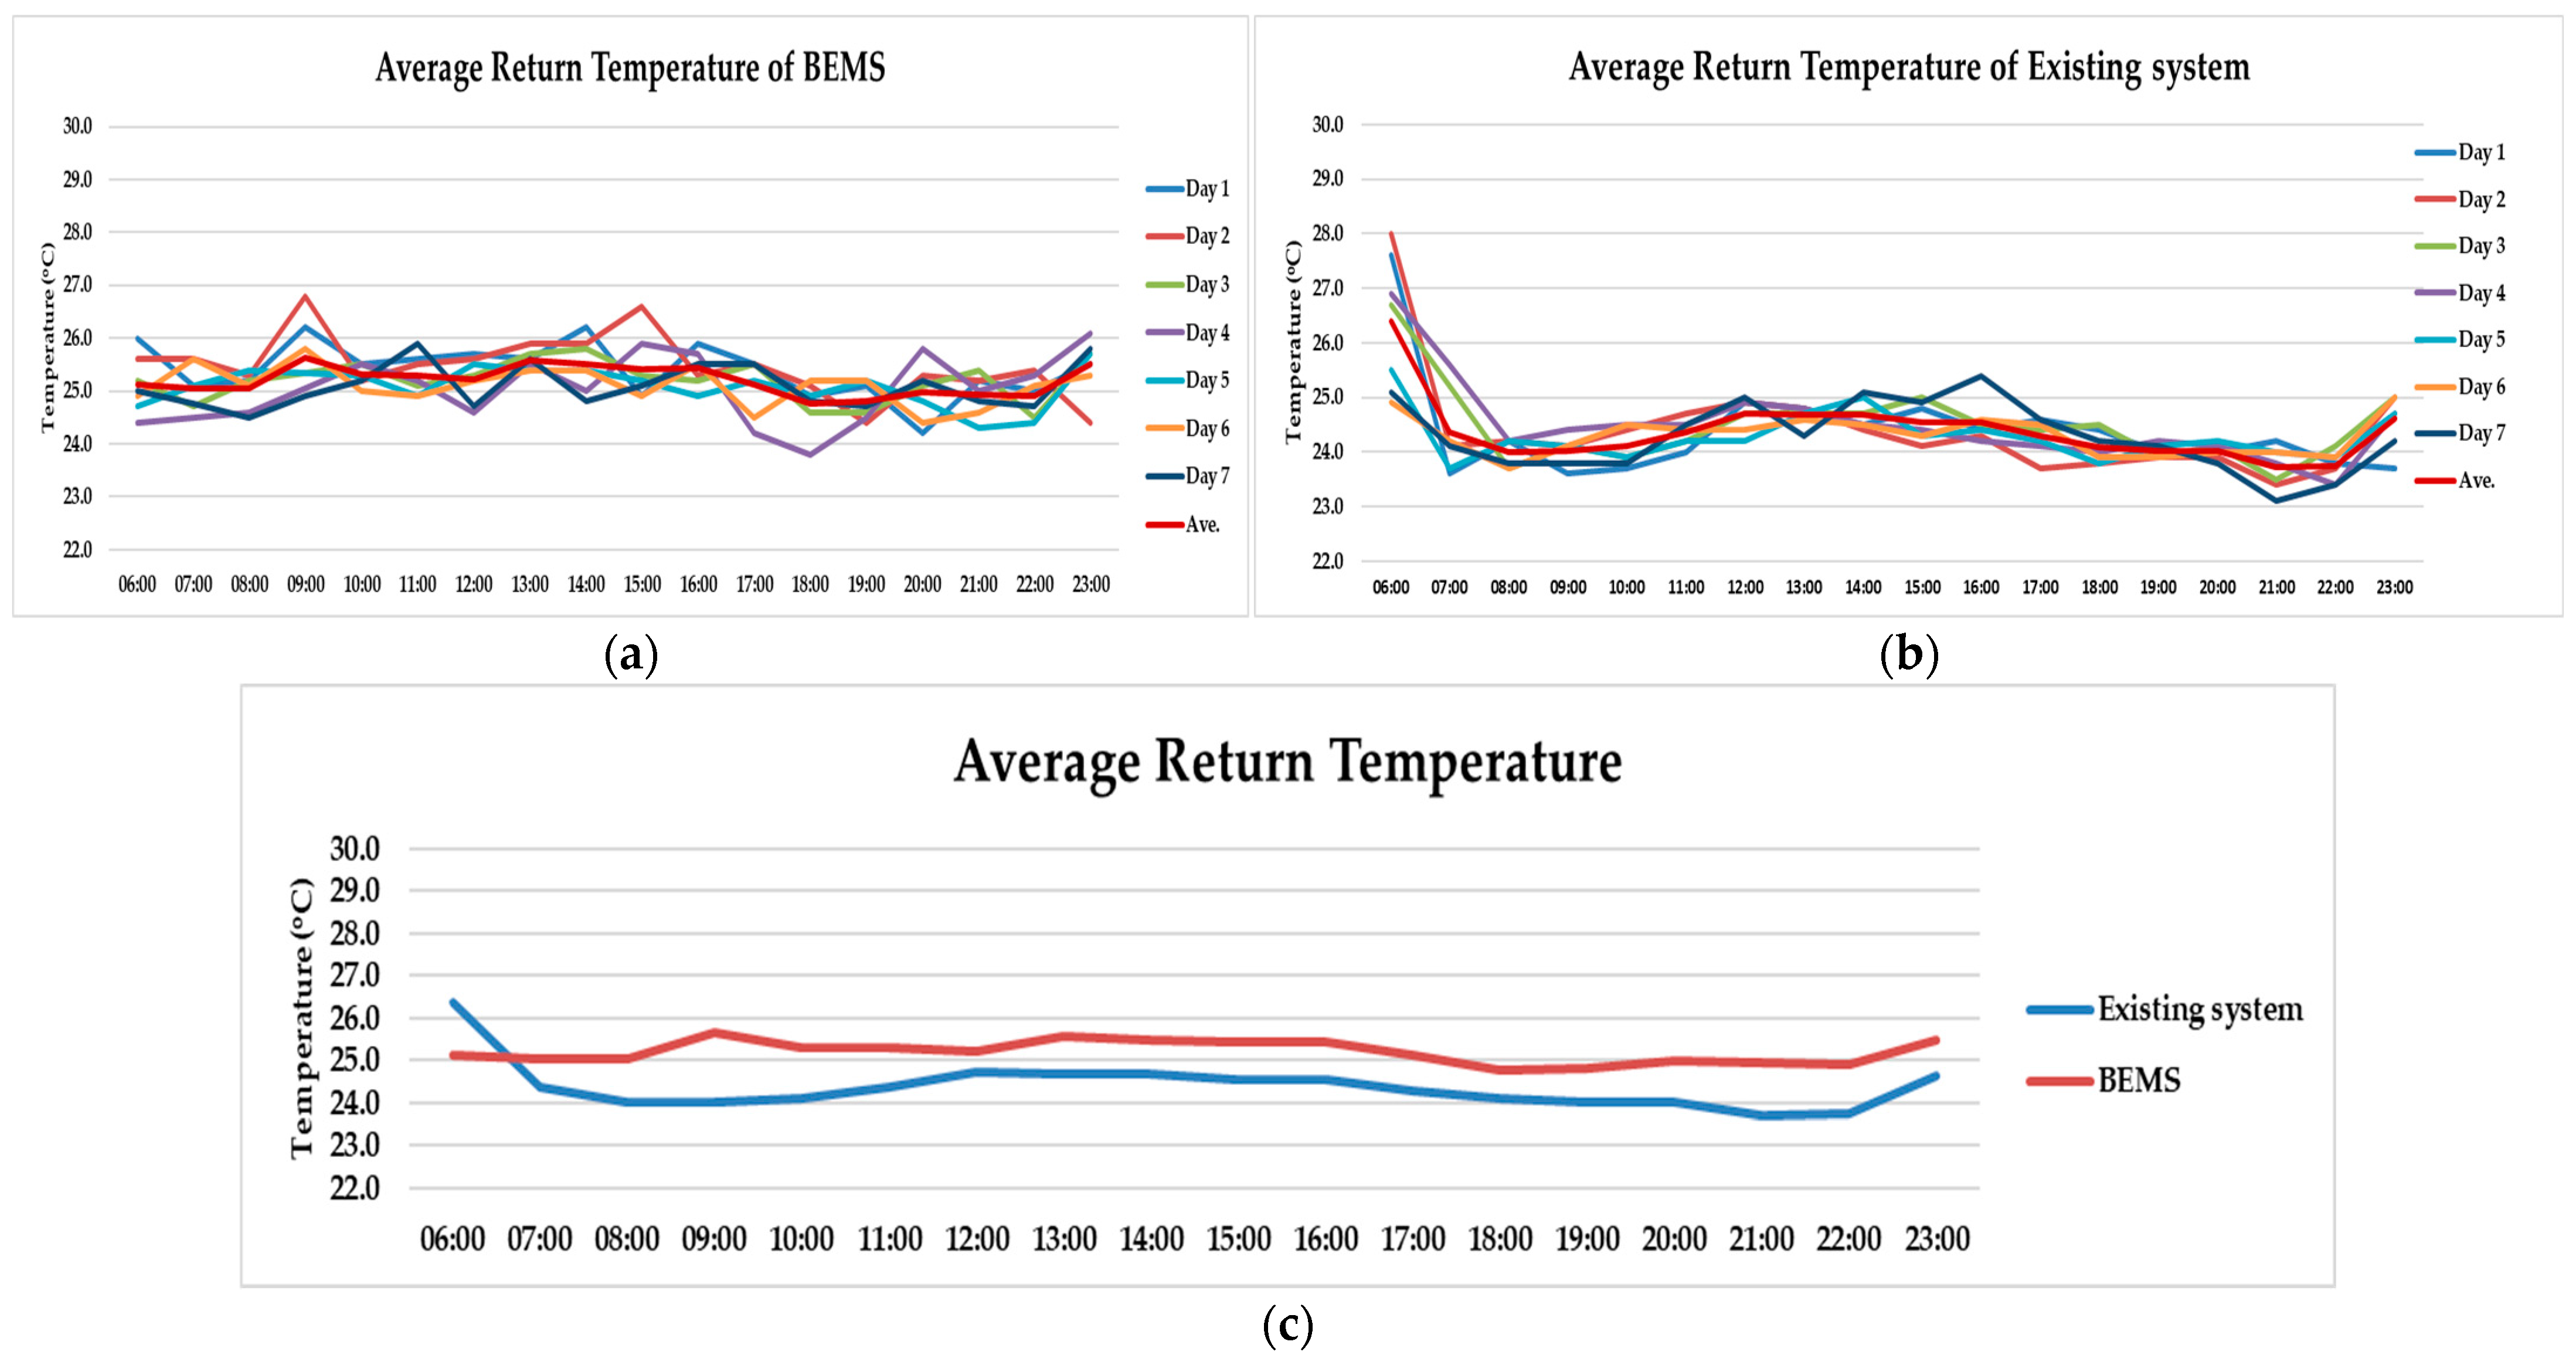
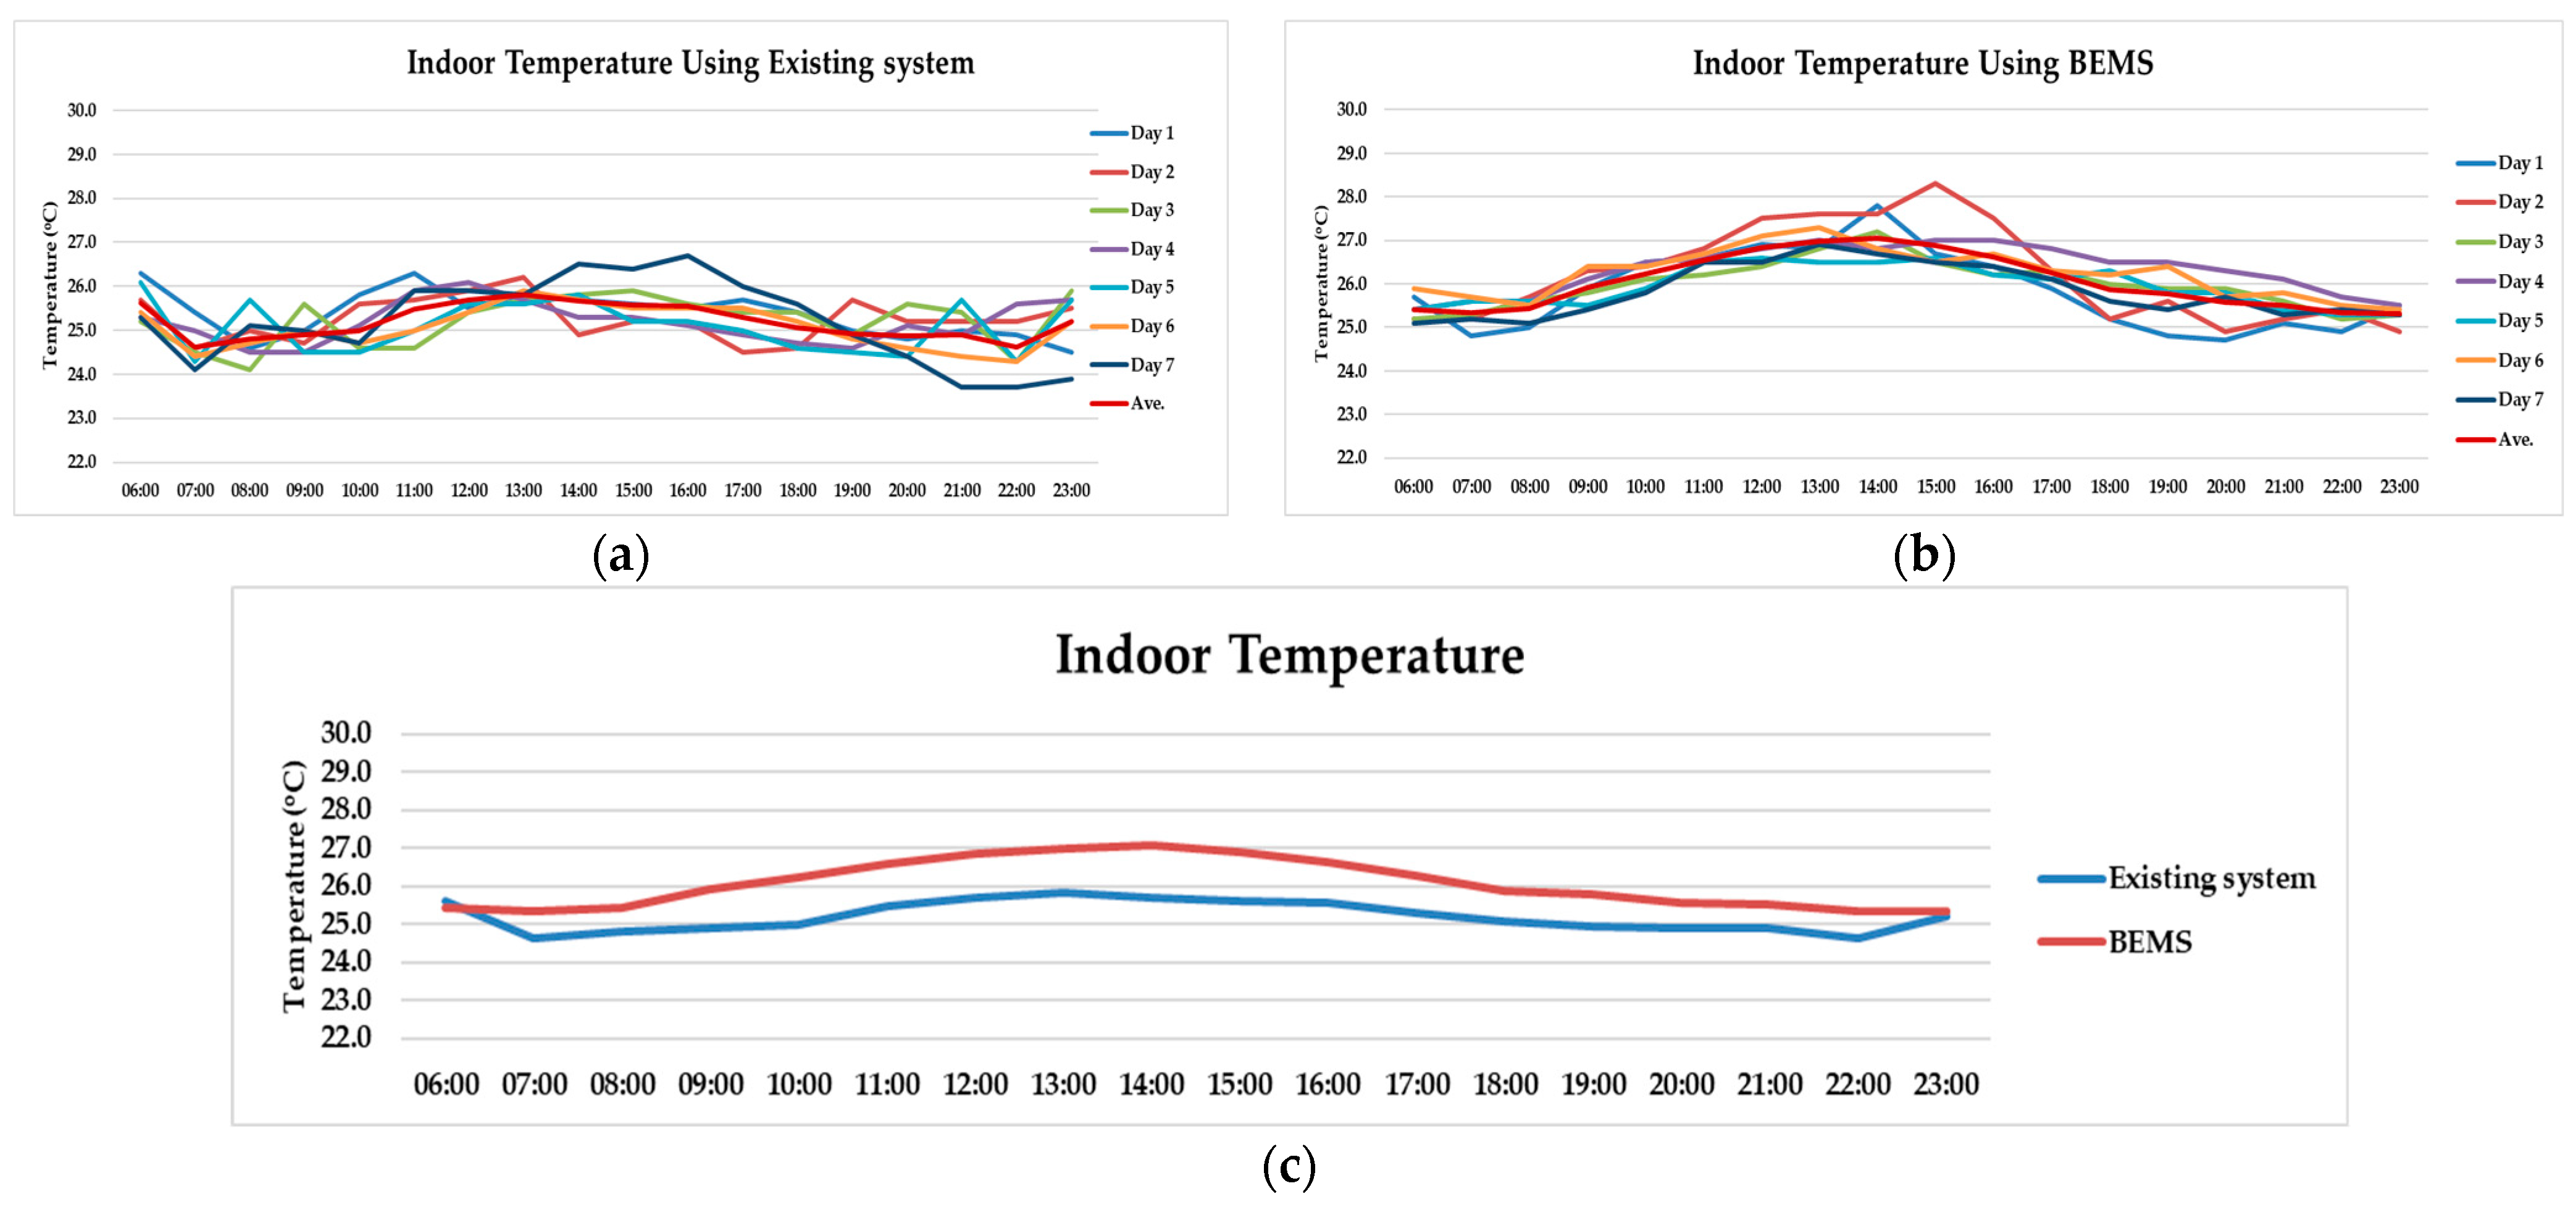
The results for the average return temperatures of all AC units in Figure 19 indicate that the average return temperature on each day using the existing system was almost 25 degrees Celsius, but the BEMS kept the temperature close to 25 degrees Celsius, as this was the required temperature. The BEMS logic control helped the AC system reduce energy waste by keeping the unit close to the desired temperature. In this research, the indoor temperature sensor was installed near the store’s center, not near the AC units, resulting in a difference of approximately 1 degree Celsius between the readings for the existing system and the BEMS each hour, as illustrated in Figure 20.

Figure 19.
Average temperature return results of (a) existing system and (b) BEMS. (c) Average results of existing system and BEMS.
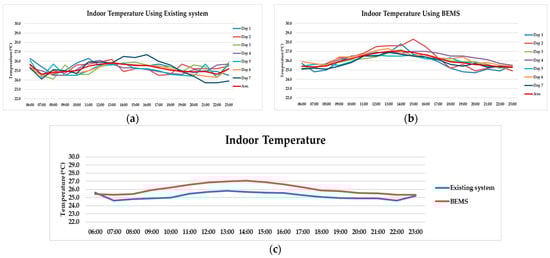
Figure 20.
Indoor temperature results for (a) existing system and (b) BEMS. (c) Average results for existing system and BEMS.
4.2. Energy Efficiency Improvement of Refrigeration System Using BEMS
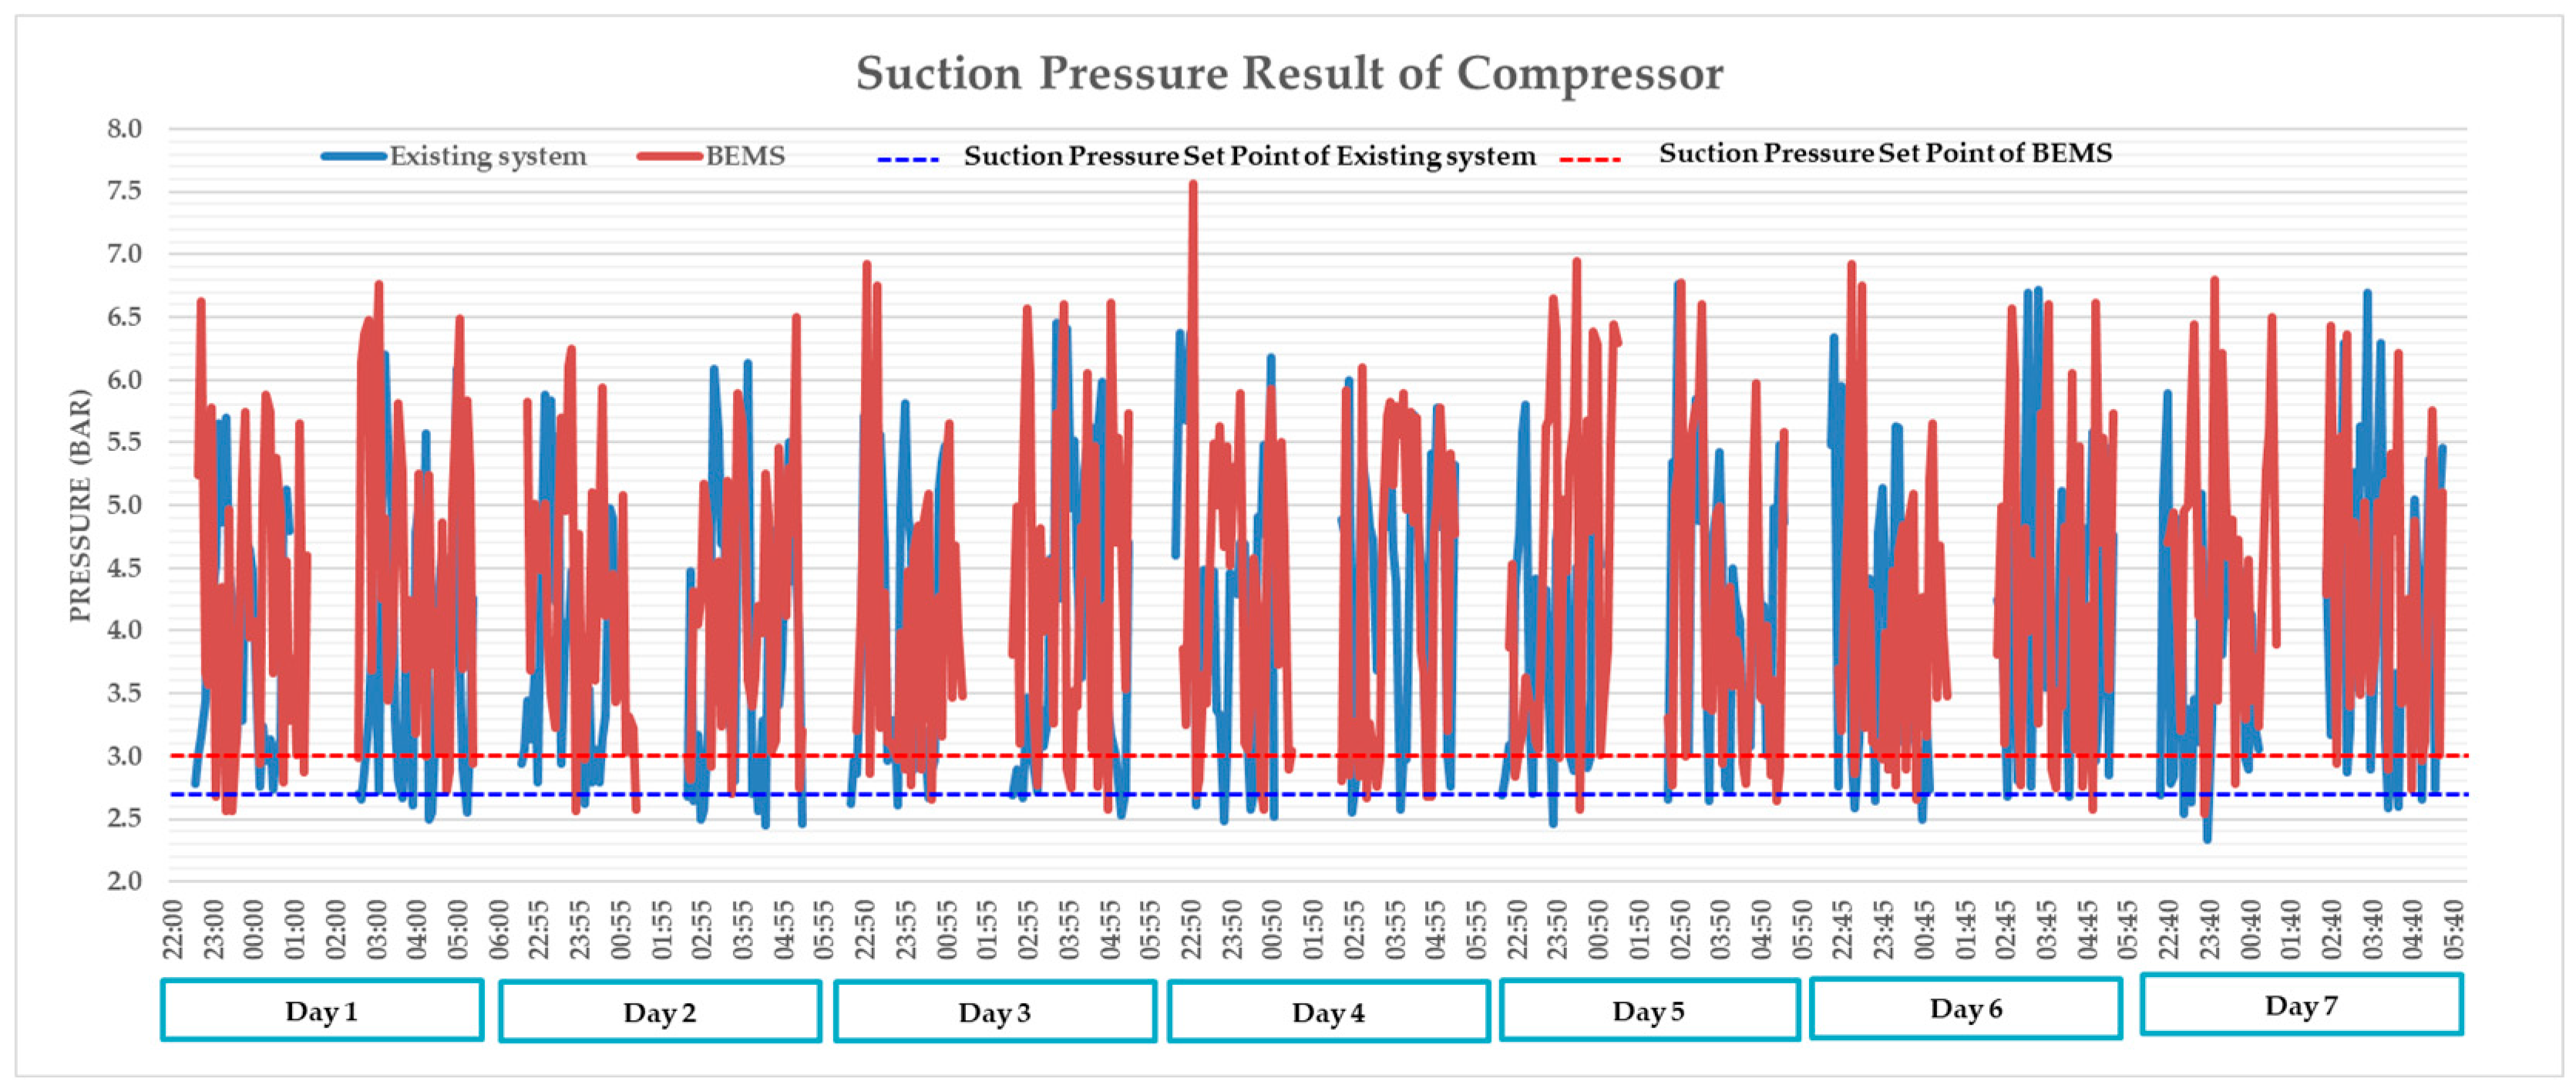
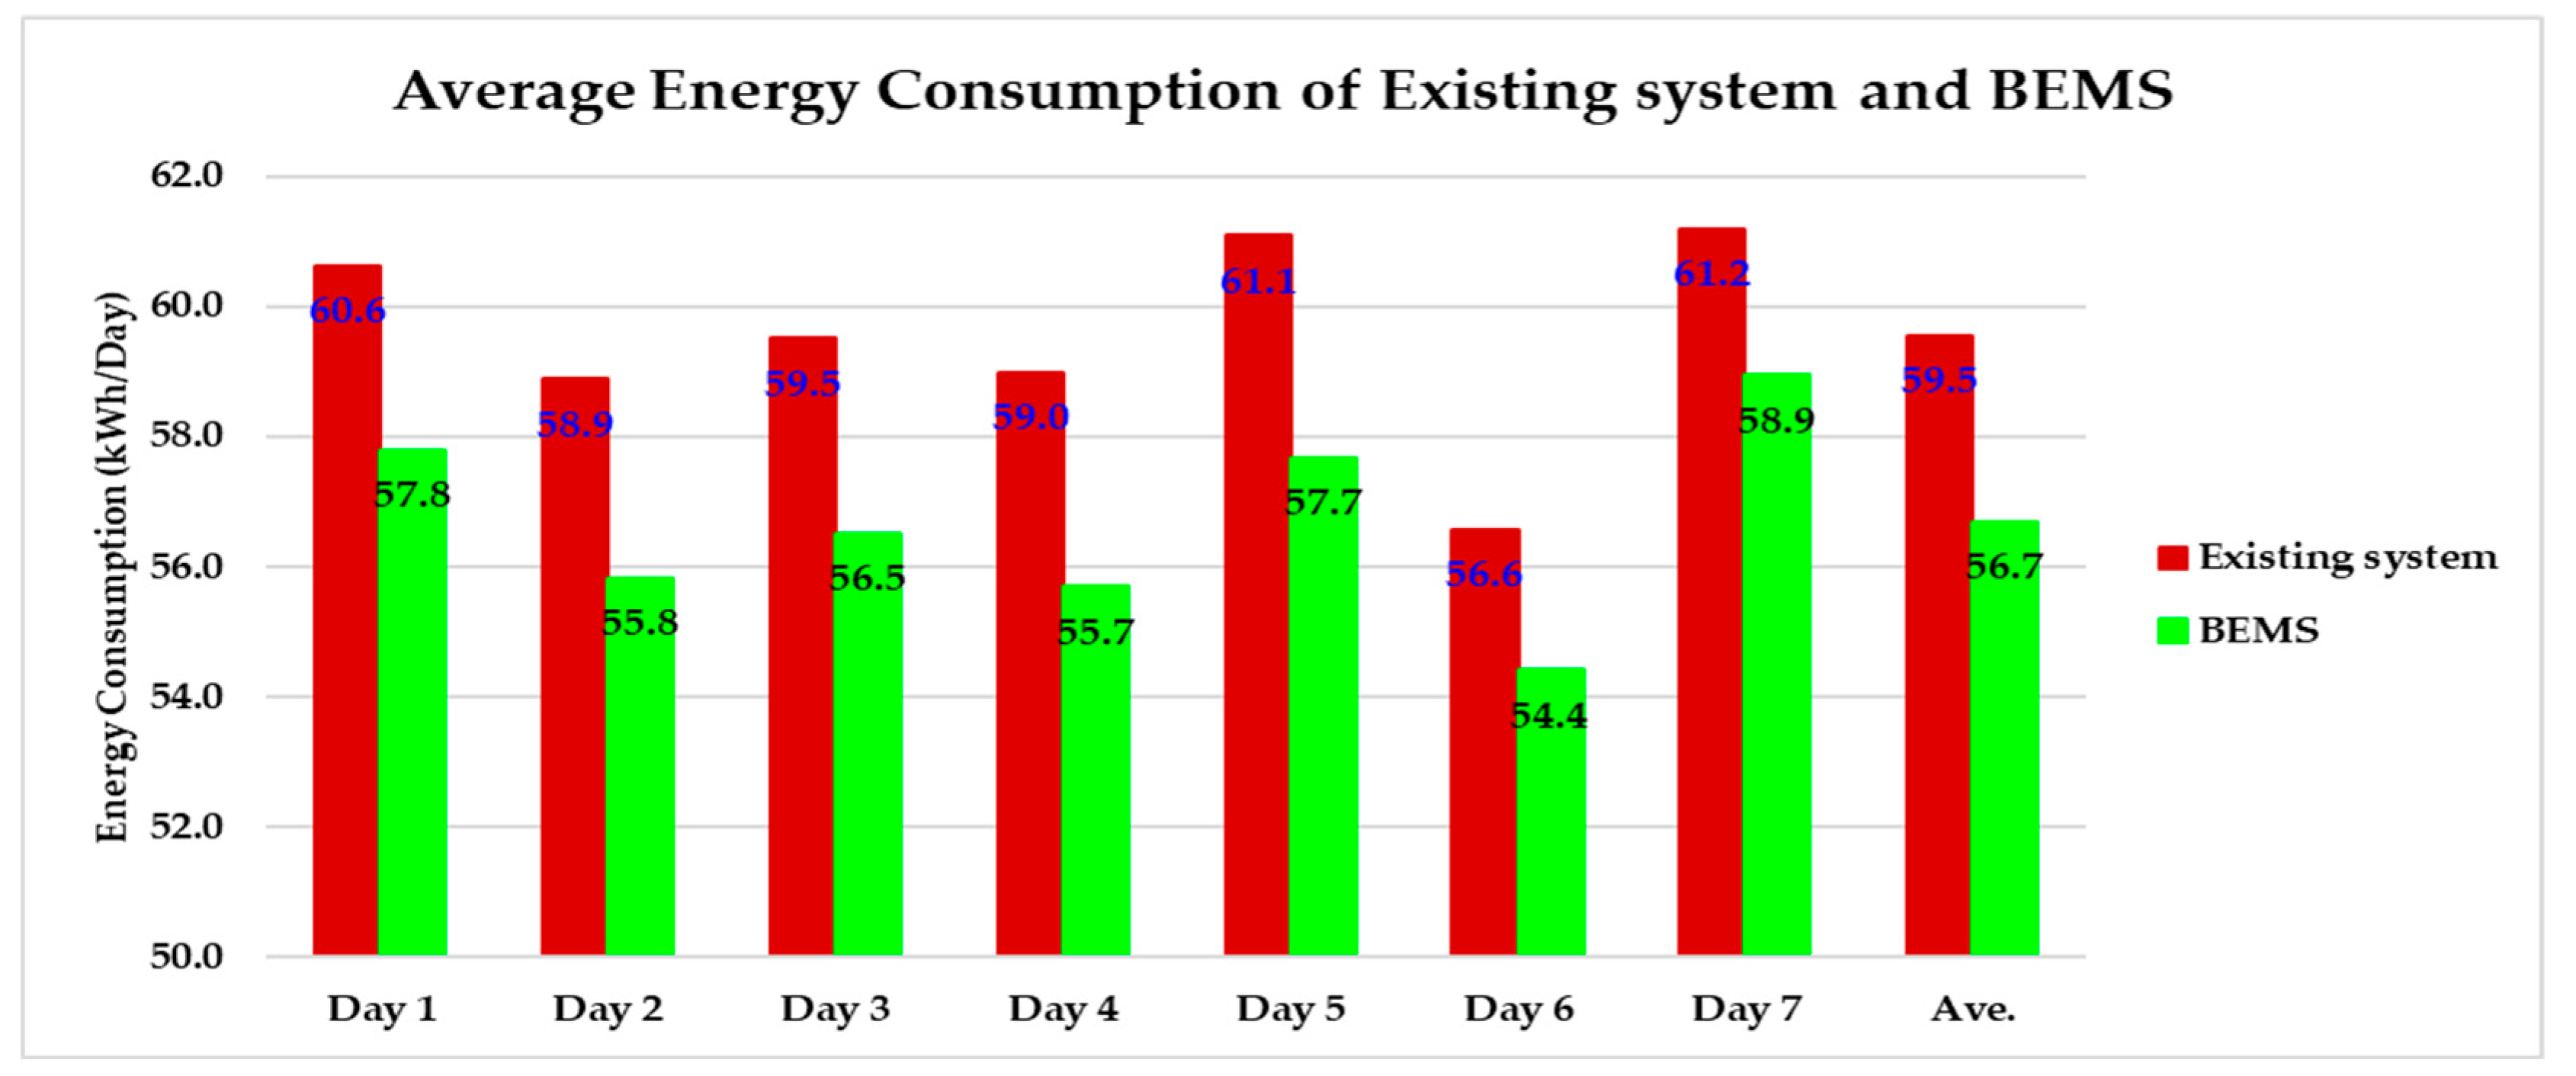
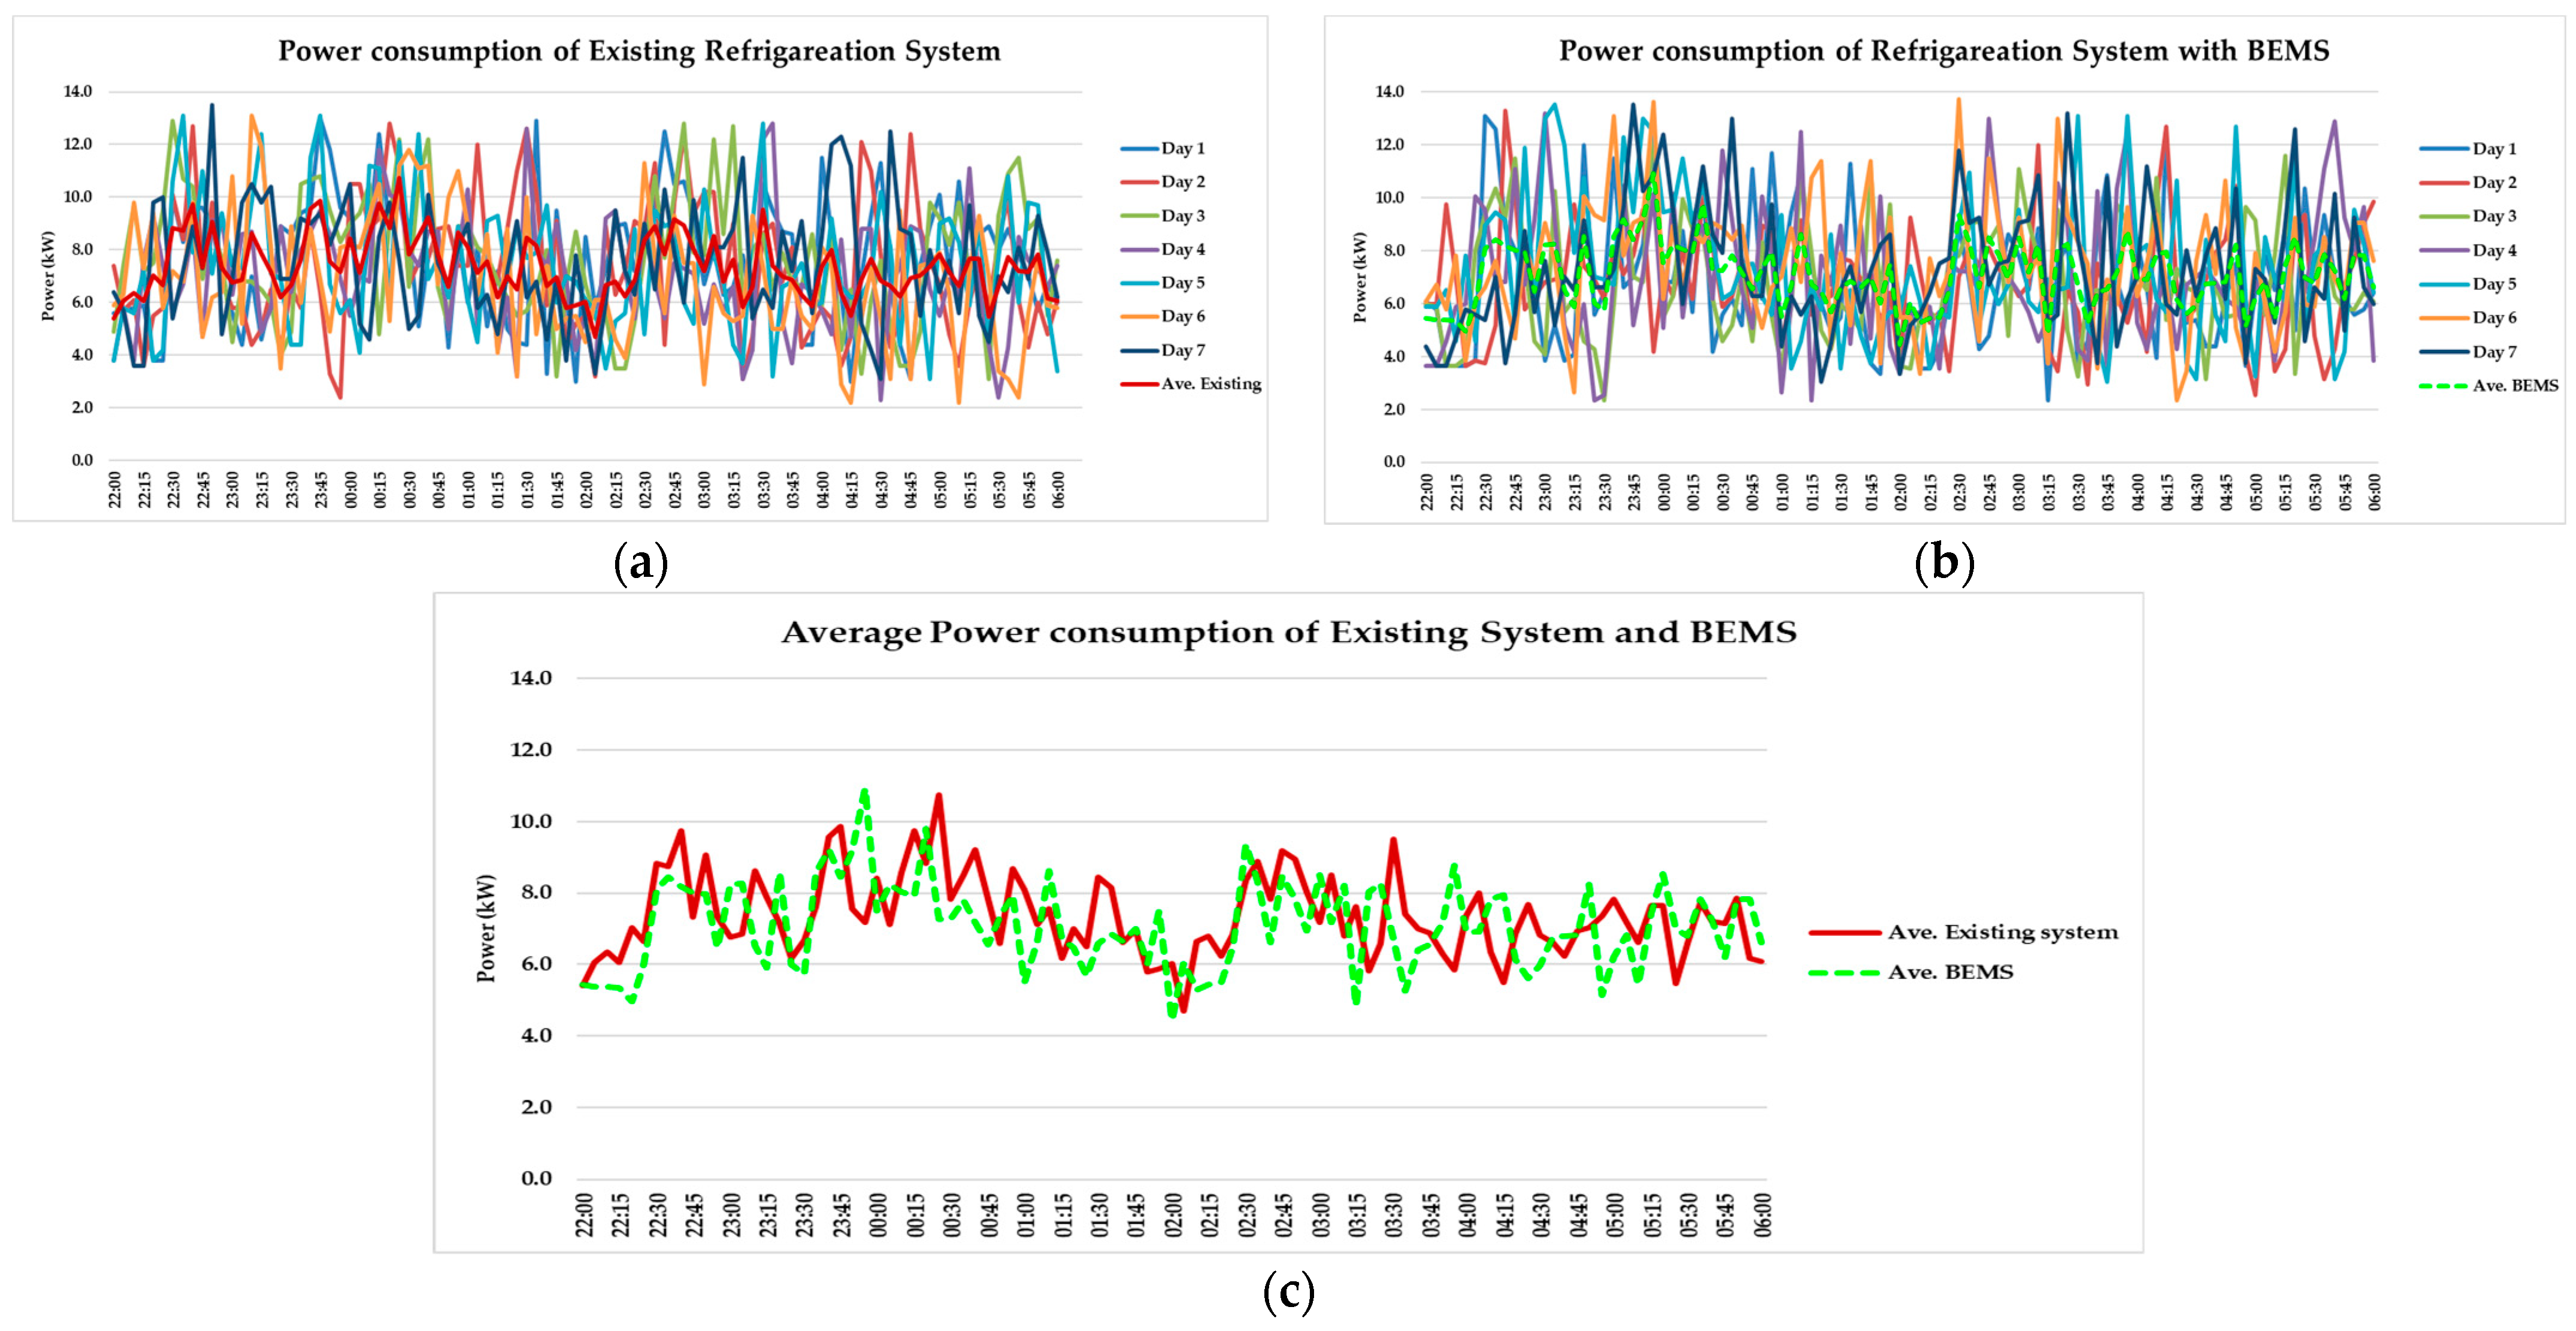
This study demonstrated that implementing a BEMS to regulate suction pressure during nighttime hours, specifically from 10 p.m. to 6 a.m., could increase the threshold of suction pressure by approximately 0.3 bar (31 kPa) in the refrigeration system compared to the existing system during this period, as depicted in Figure 21. We disregarded outcomes to accommodate the influence of pressure during the defrost intervals in all freezers. An increase in suction pressure can decrease the amount of work performed by a compressor, leading to a direct impact on the energy consumption of a refrigeration system. Deploying the BEMS resulted in decreases in both energy and power usage, as evidenced by Figure 22 and Figure 23, respectively. The proposed building energy management system (BEMS) logic control implemented in the refrigeration system of the experimental store has the potential to achieve significant energy savings. The average total energy consumption values of the refrigeration system before and after BEMS implementation were 59.5 and 56.7 kWh/day, respectively. It saved an average of 2.8 kilowatt-hours per day or 1022.0 kilowatt-hours per year, leading to a notable 4.8% reduction in energy consumption. When comparing the actual savings with the theoretical ones in the Section 4, there was a slight difference of approximately 0.2%.

Figure 21.
Suction pressure results of the compressor using the existing system and the BEMS.
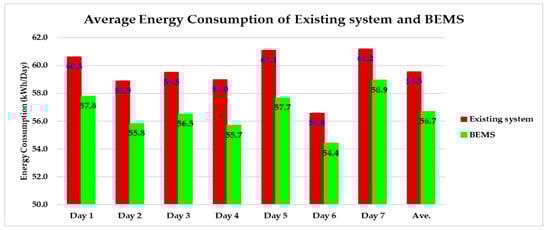
Figure 22.
Average energy consumption results of refrigeration system.
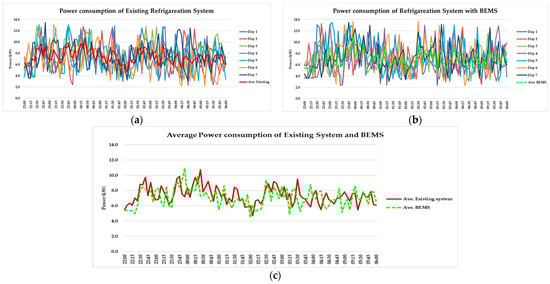
Figure 23.
Refrigeration power consumption results of (a) existing system and (b) BEMS. (c) Average results for existing system and BEMS.
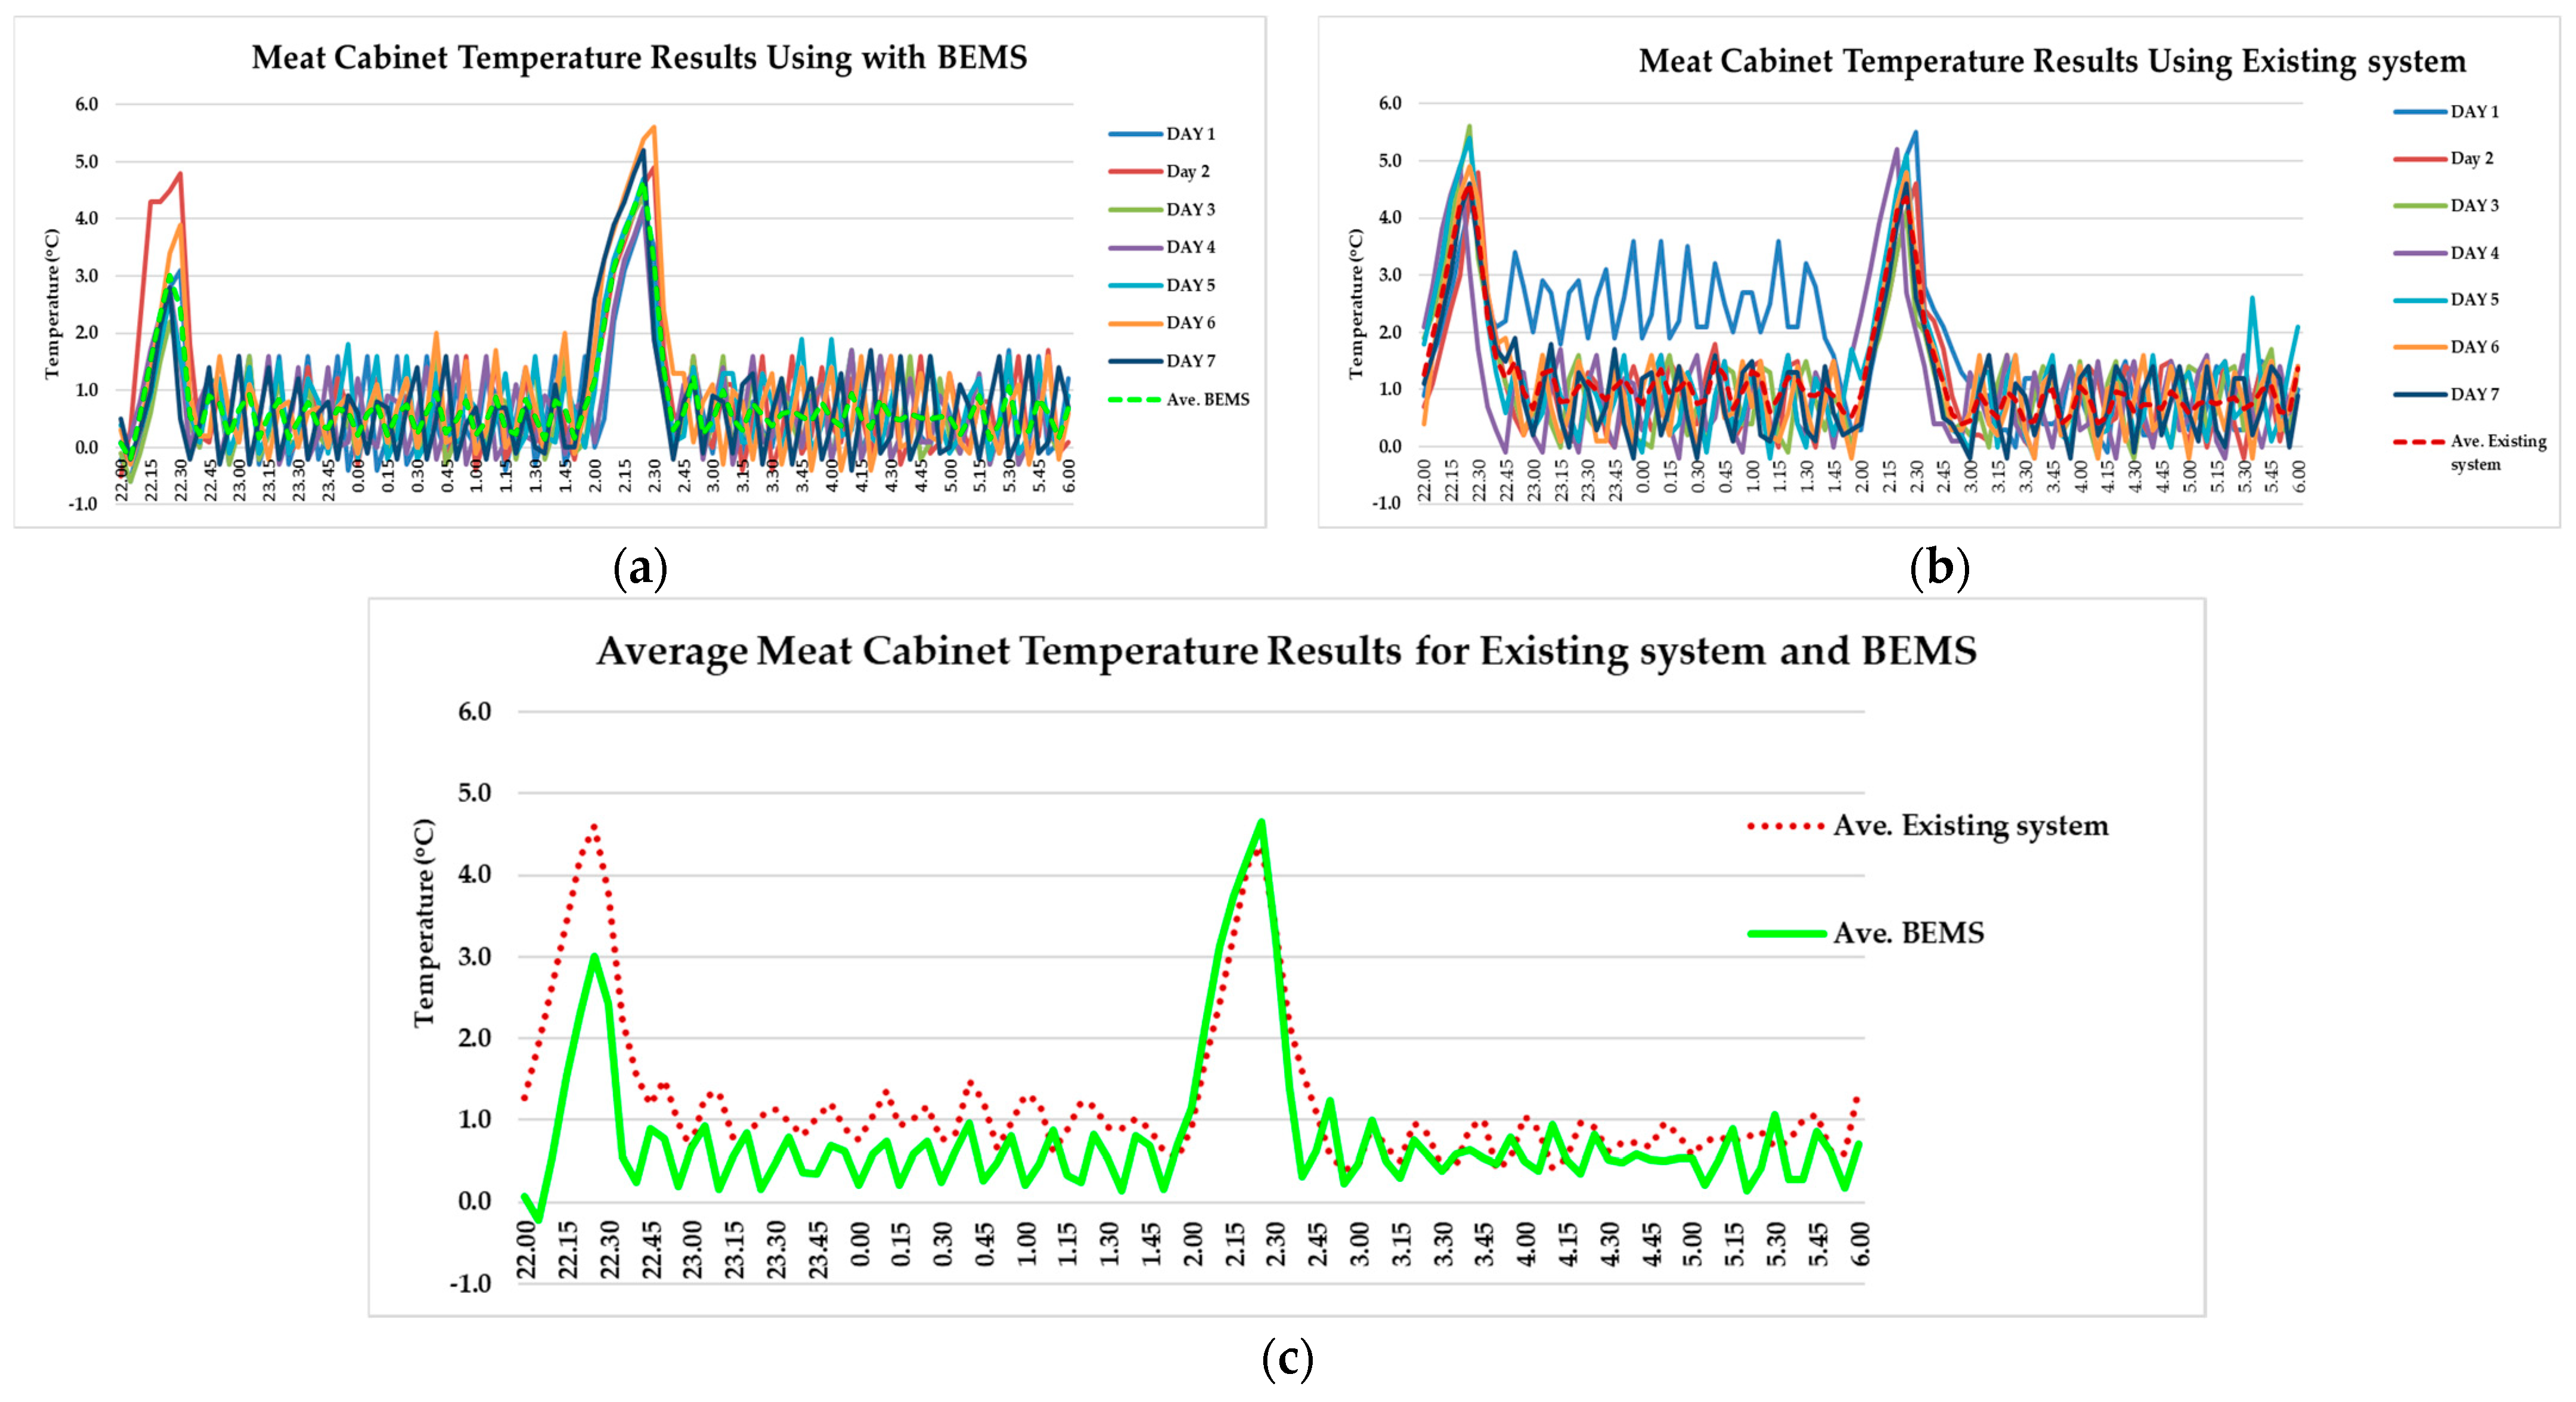
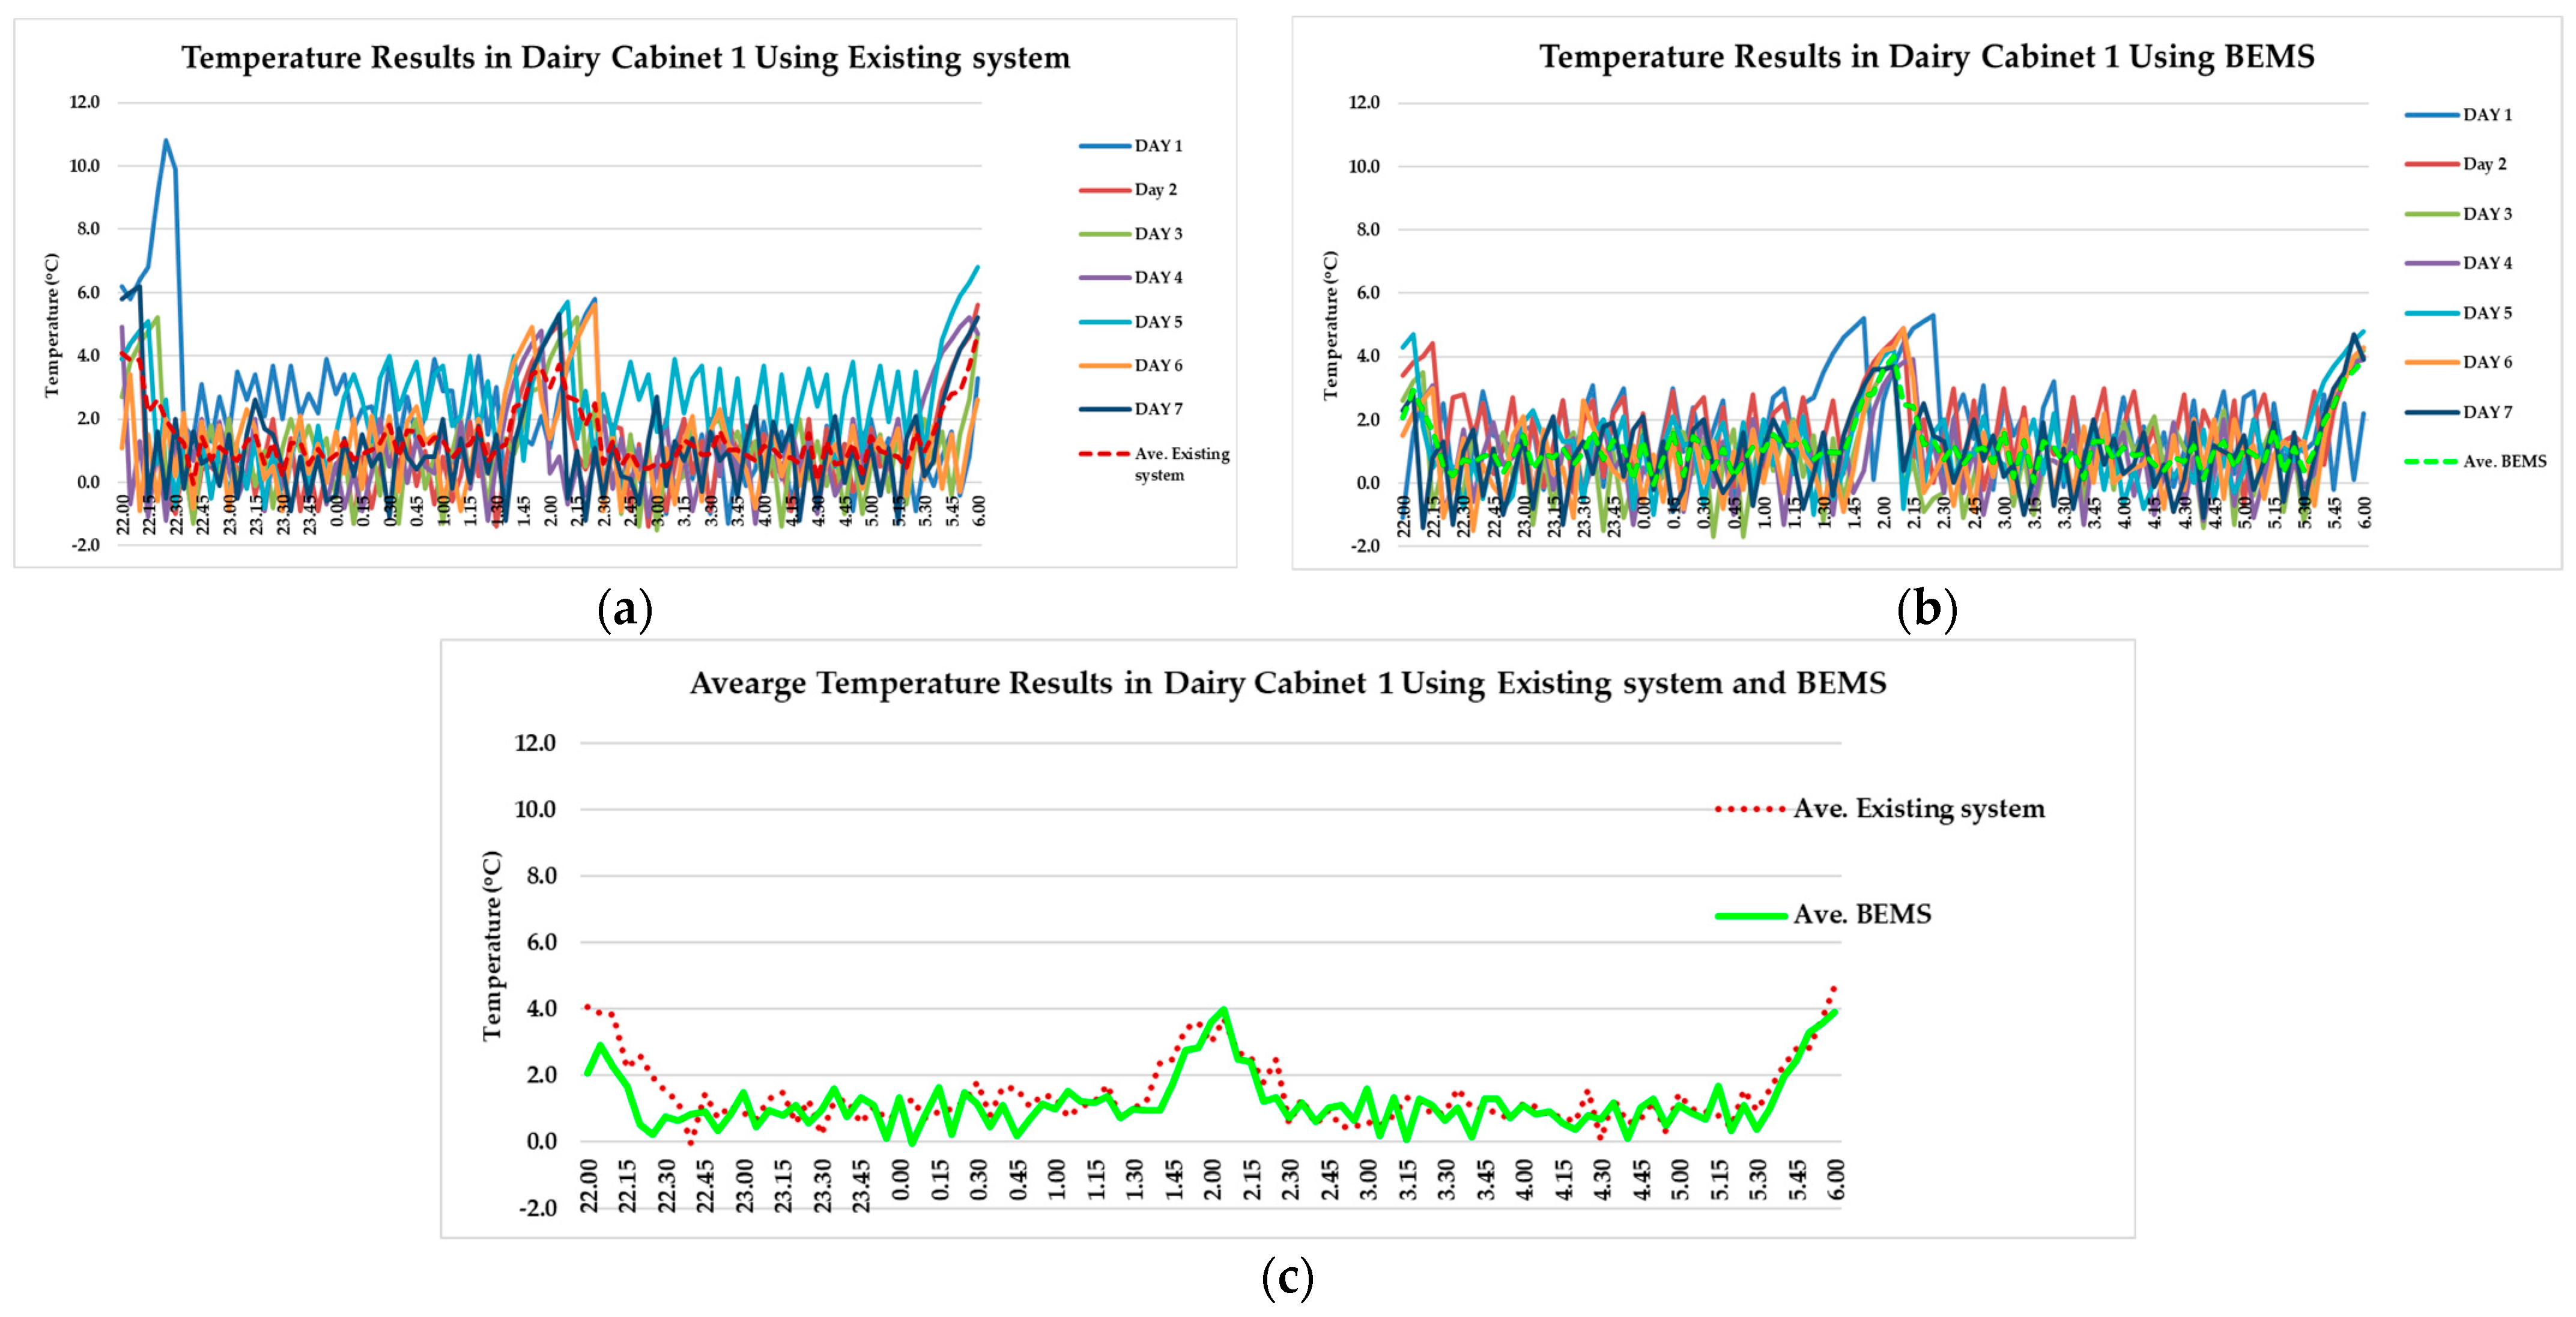
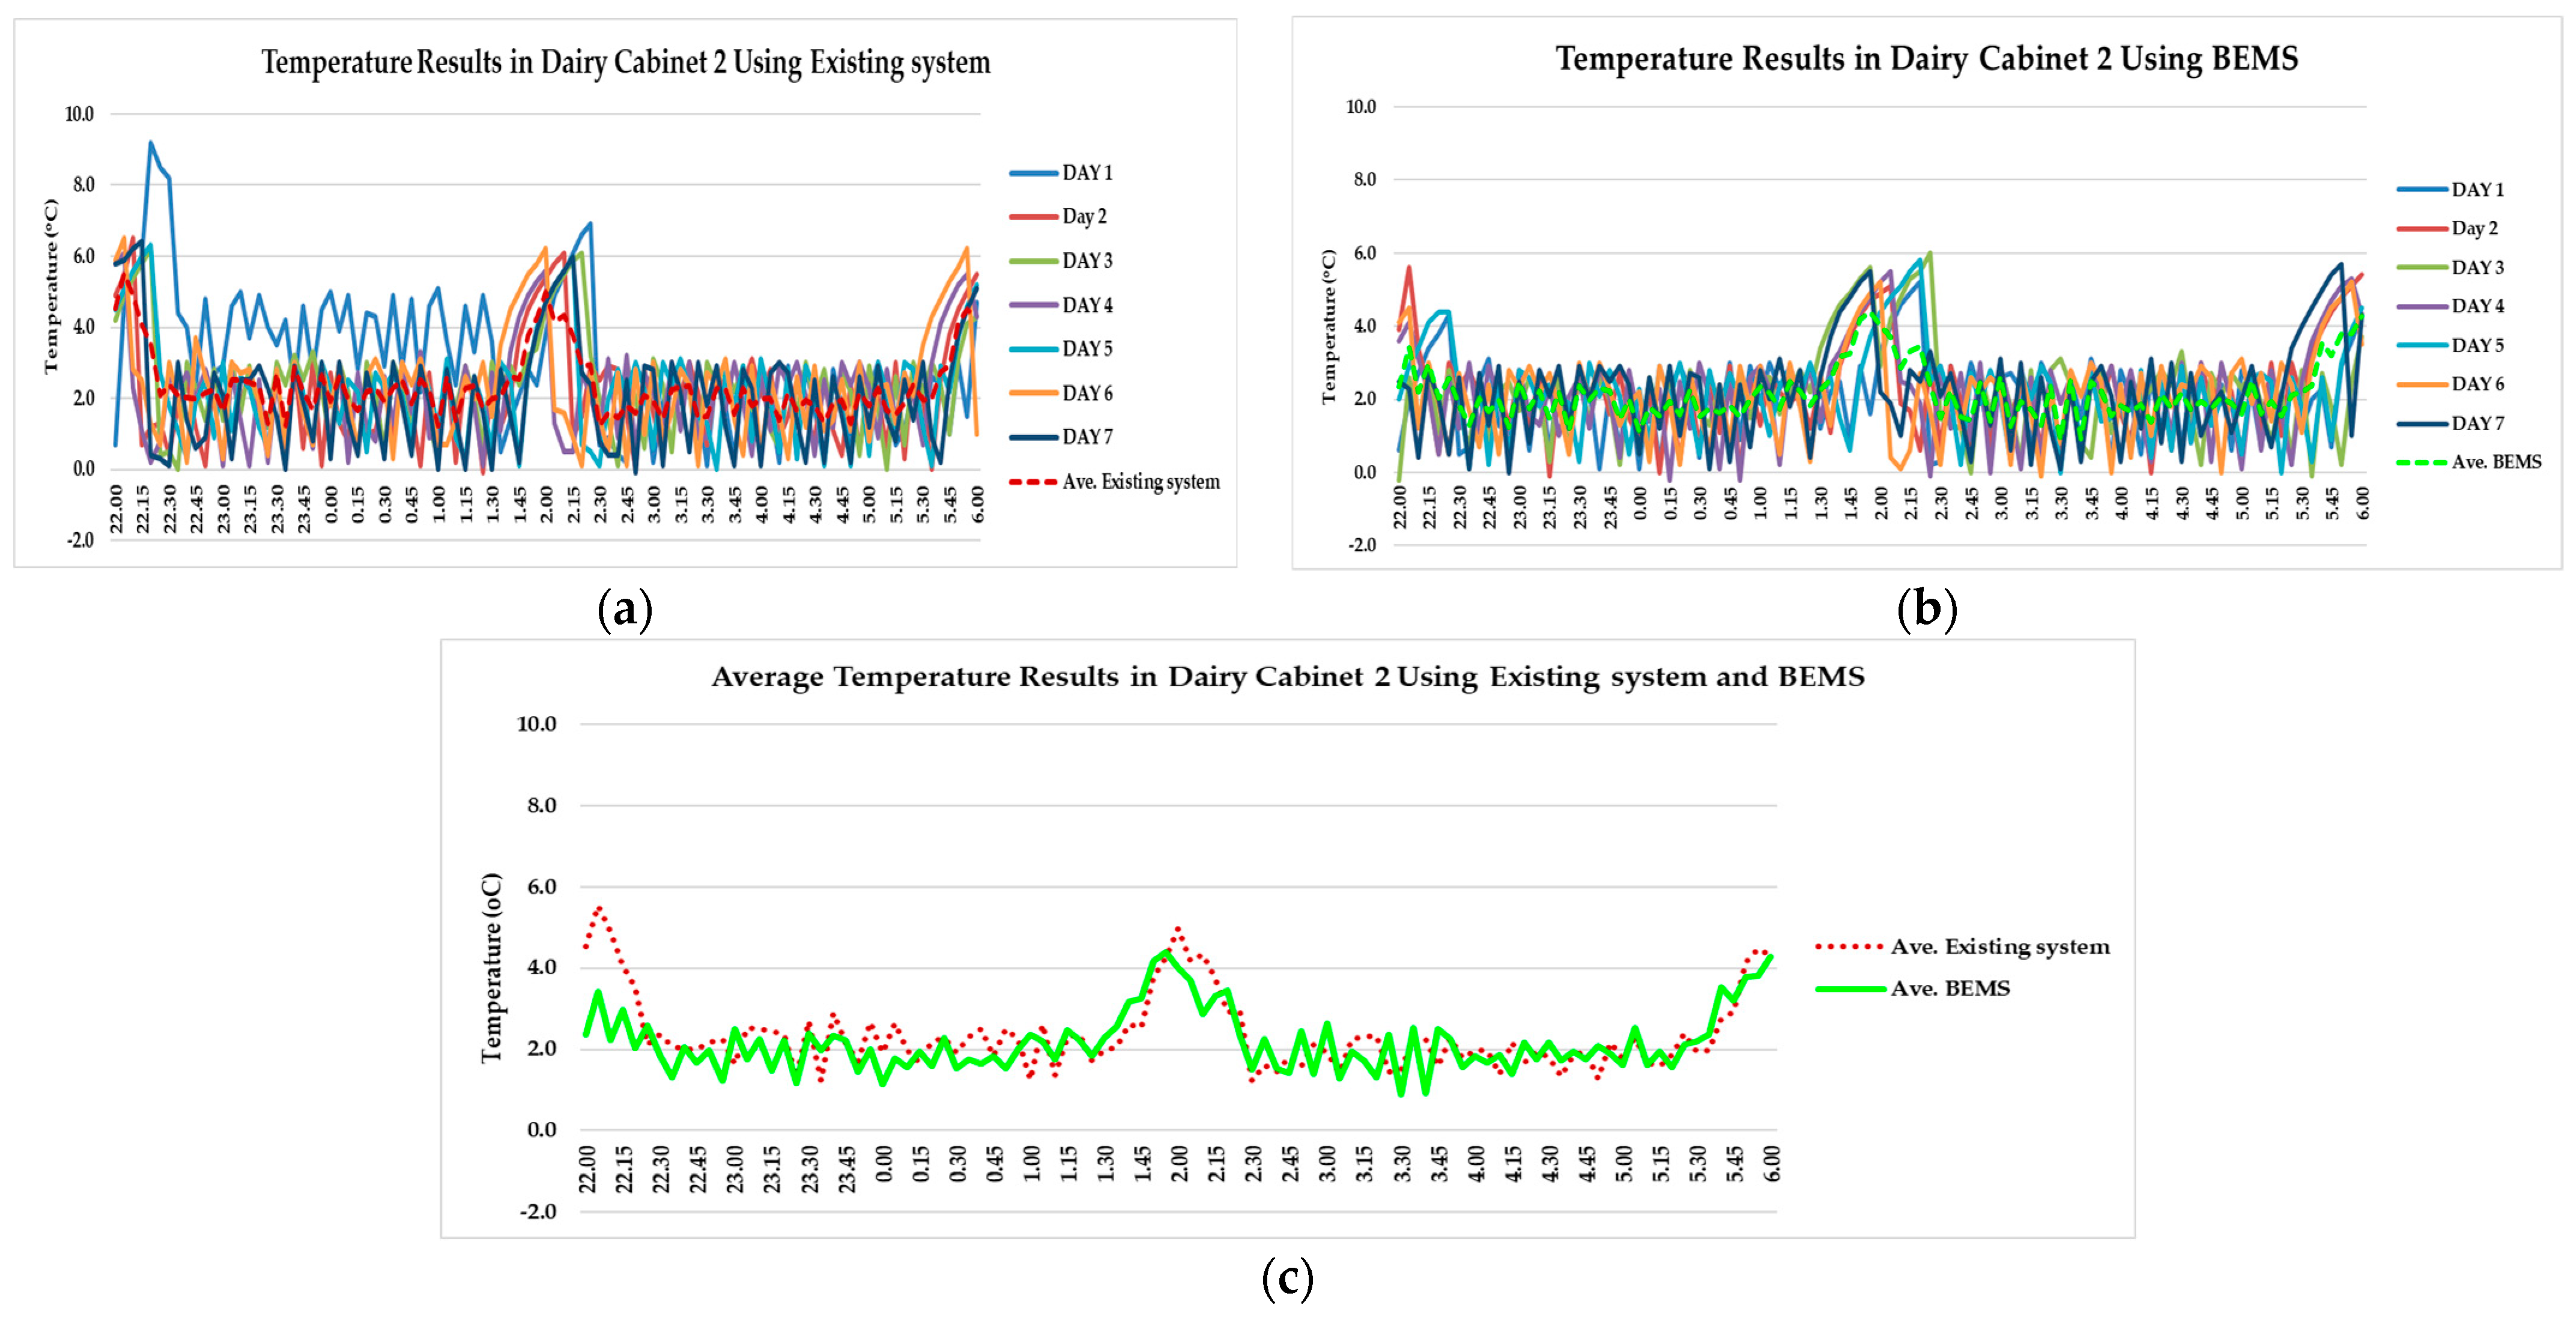
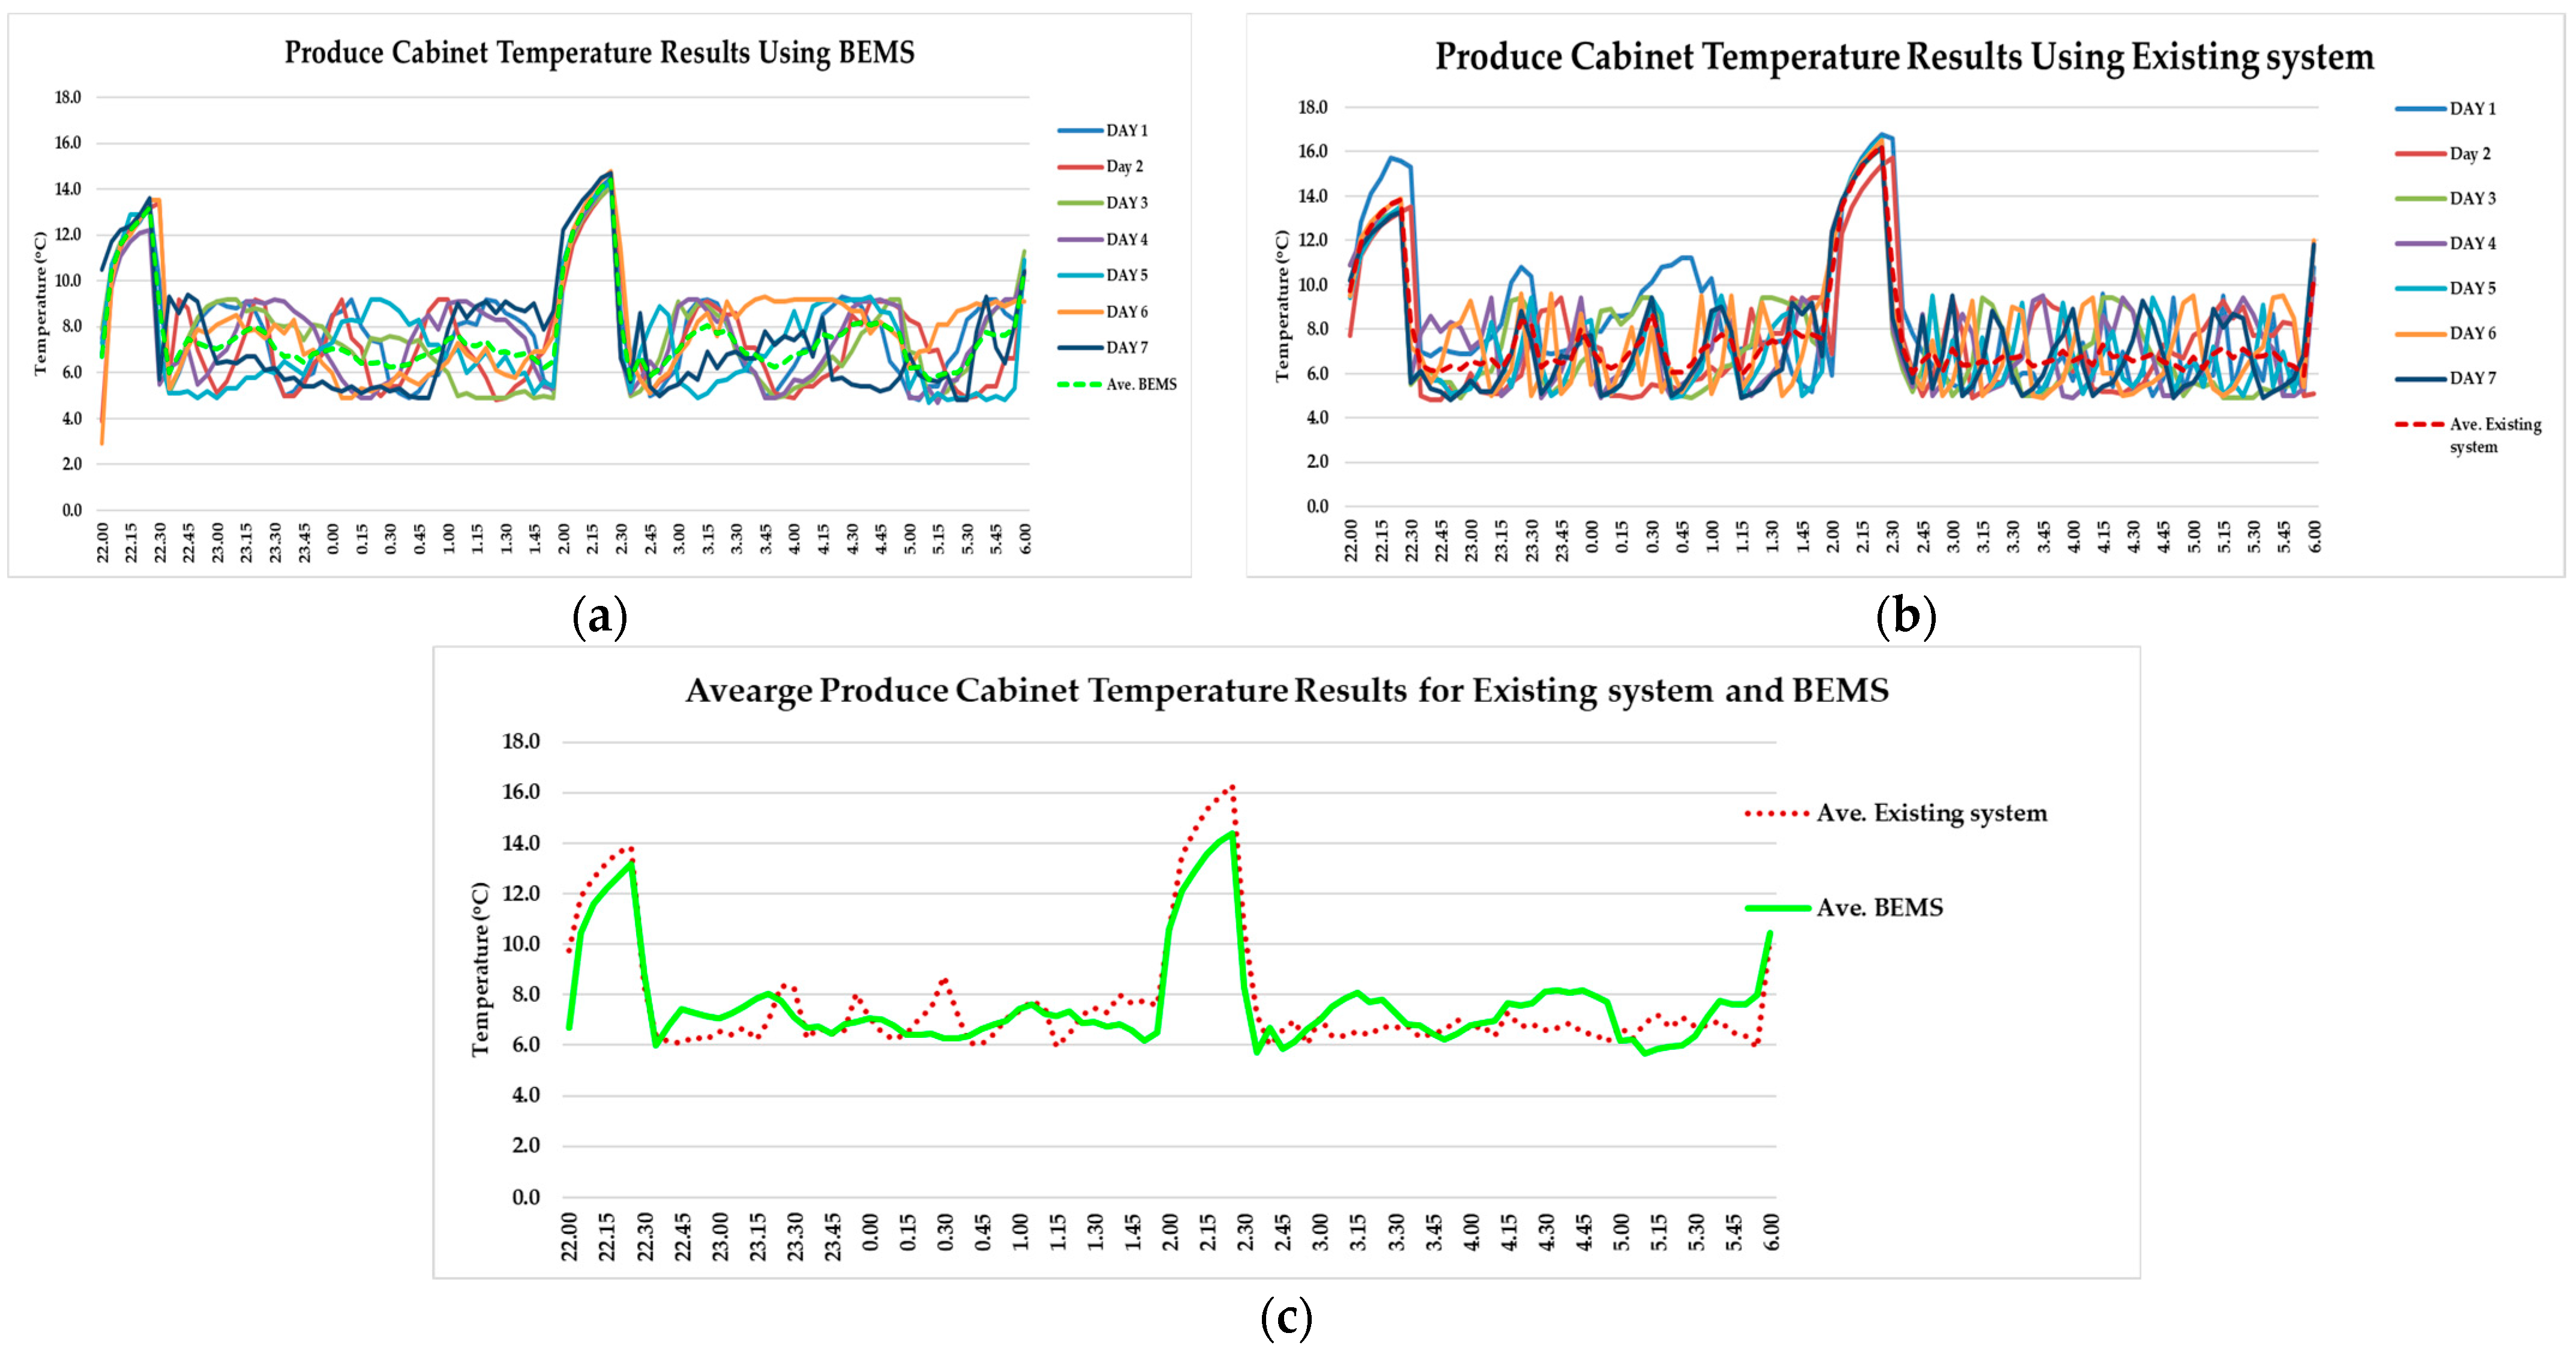
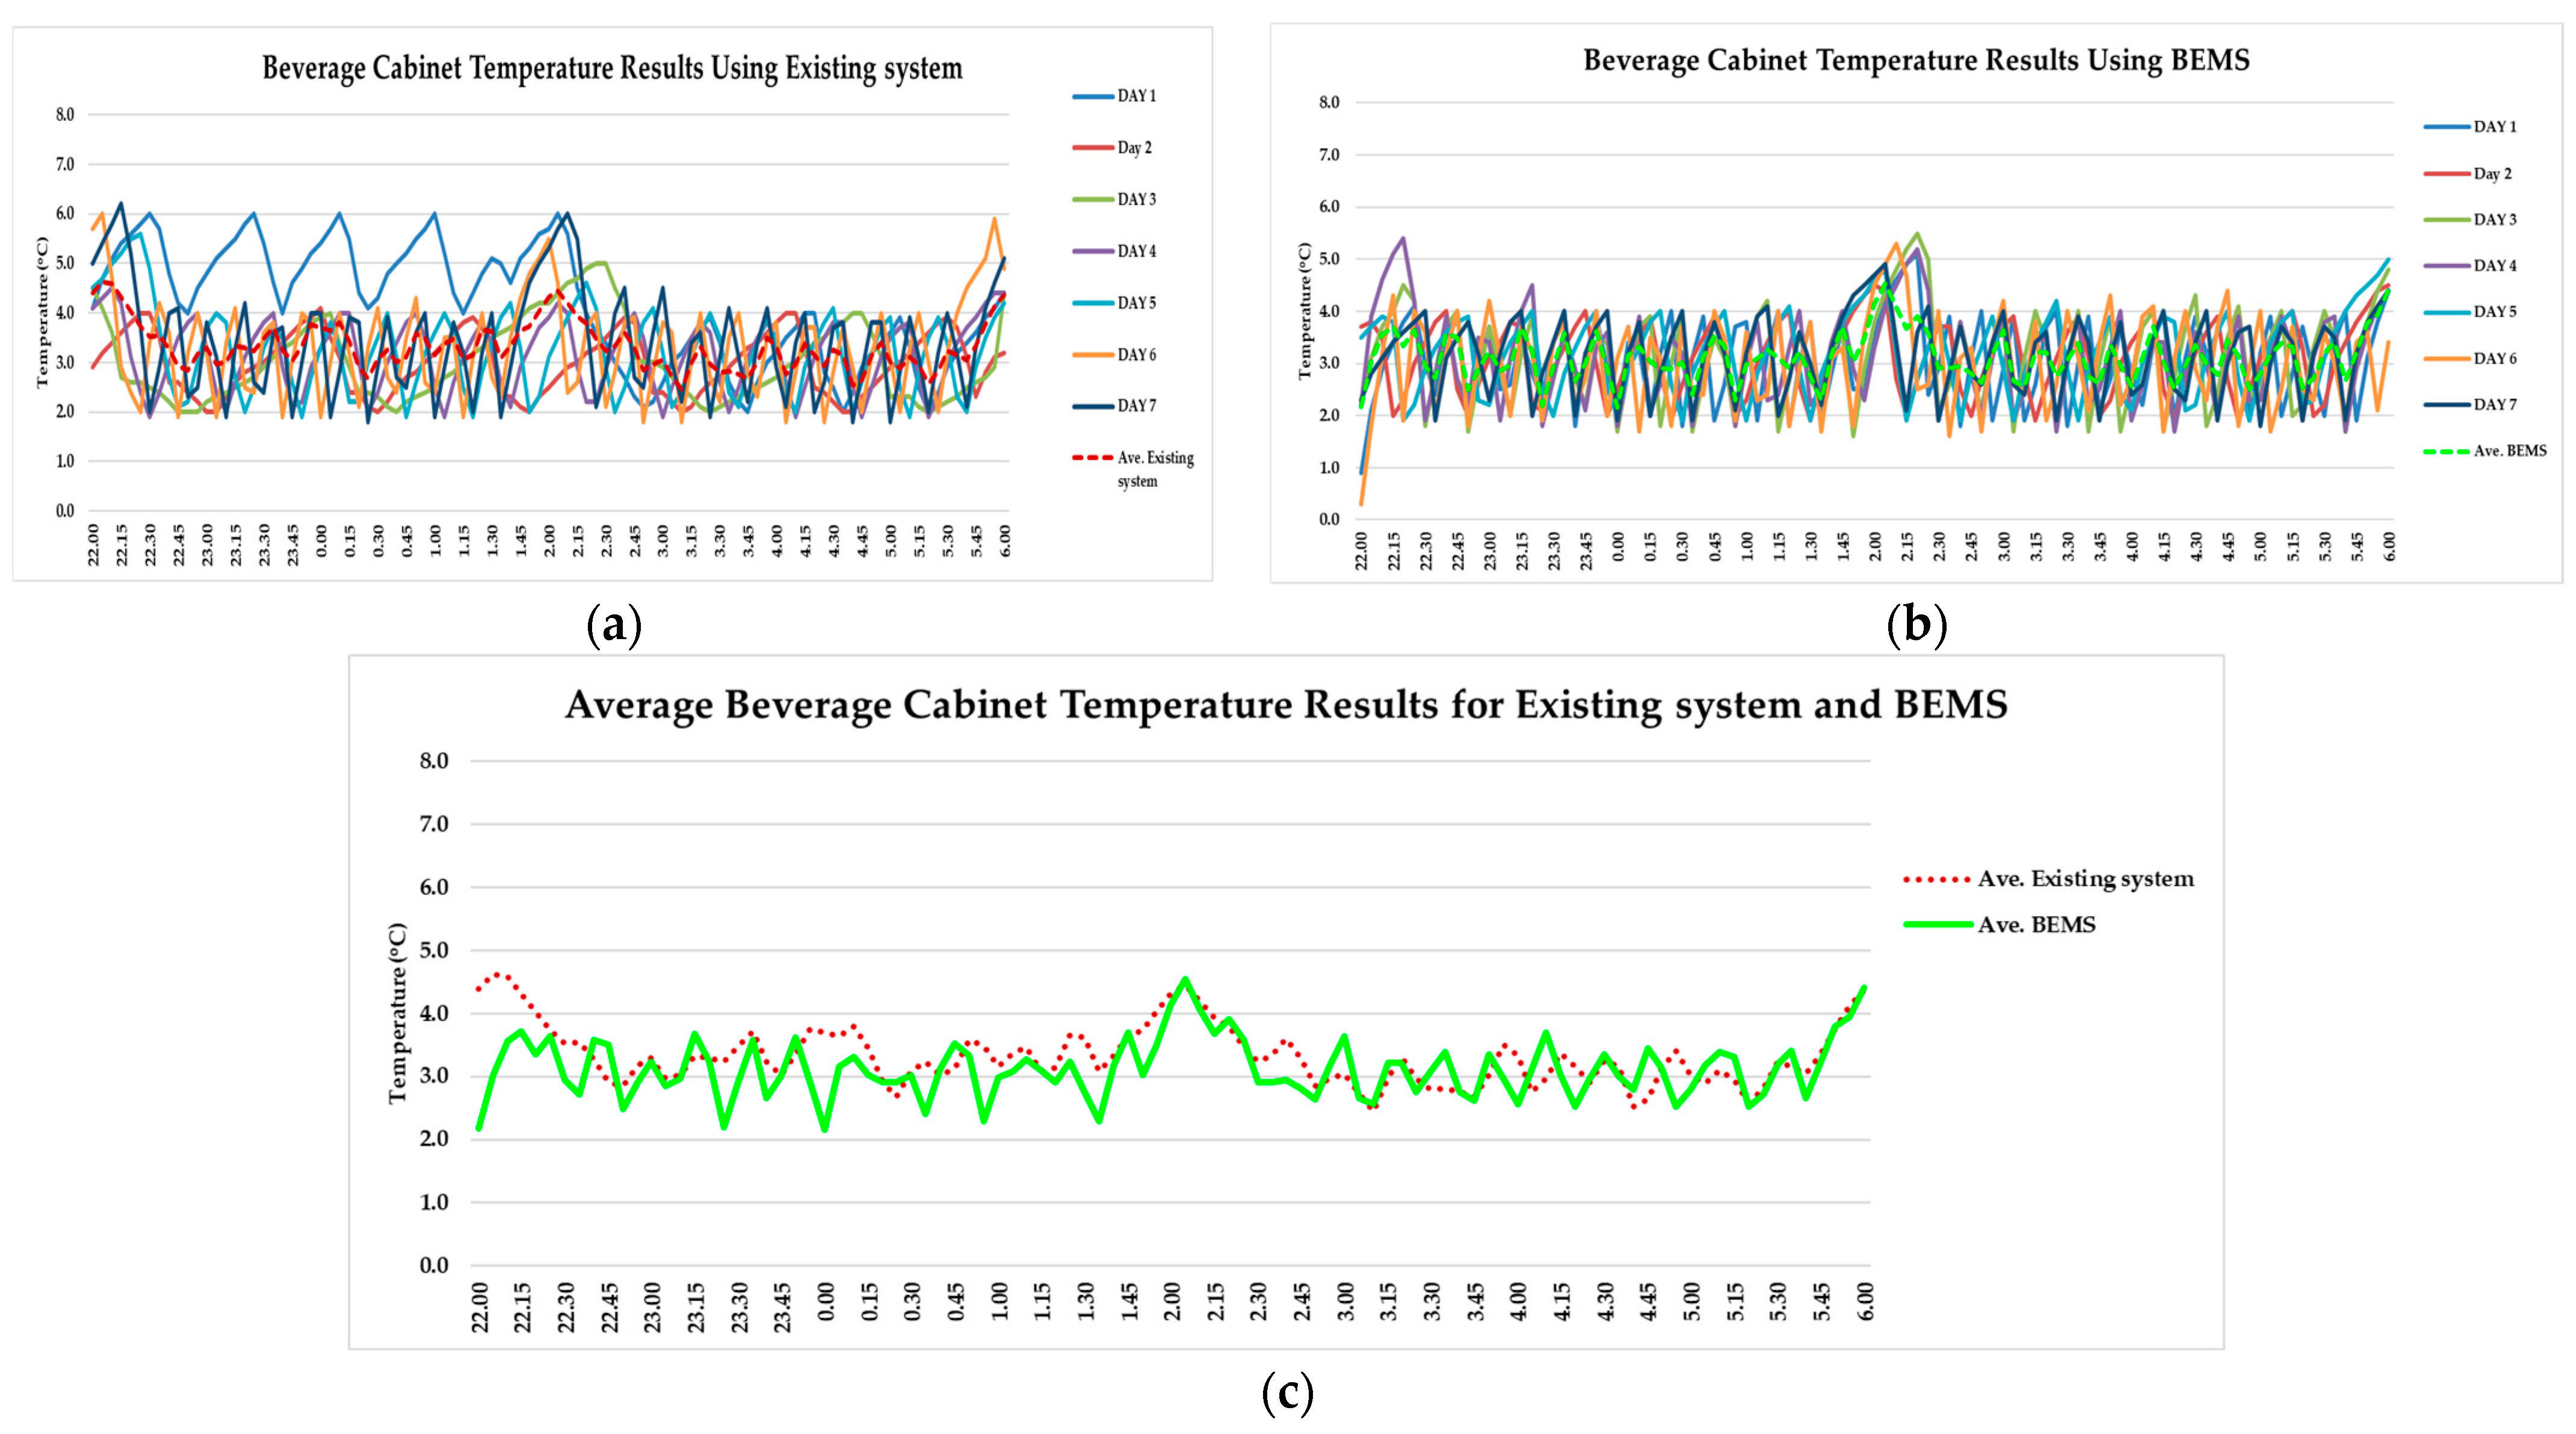
However, increasing the suction pressure resulted in a reduction in energy consumption. The experimental store’s freezers, which housed meat, two dairy products, produce, and beverages, were maintained at the same temperature from 10:00 p.m. to 6:00 a.m. in each cabinet of the existing system and the BEMS, as illustrated in Figure 24, Figure 25, Figure 26, Figure 27 and Figure 28. Moreover, it was noted that the temperature sporadically reached an elevated level, comparable to that of a mountain, during the defrosting period.
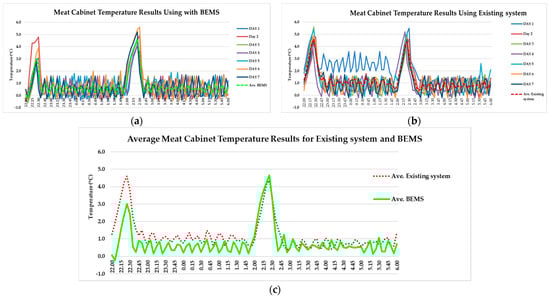
Figure 24.
The temperature of the meat cabinet using (a) the existing system and (b) the BEMS. (c) The average results of the existing system and the BEMS.
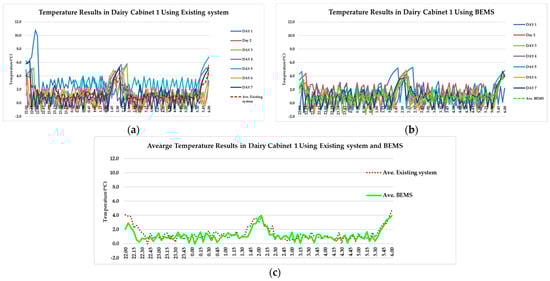
Figure 25.
The temperature of dairy cabinet 1 using (a) the existing system and (b) the BEMS. (c) The average results for the existing system and the BEMS.
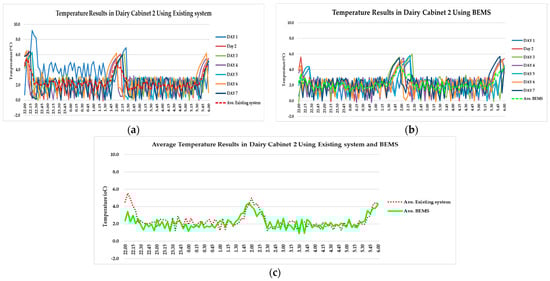
Figure 26.
The temperature of dairy cabinet 2 using (a) the existing system and (b) the BEMS. (c) The average results for the existing system and the BEMS.
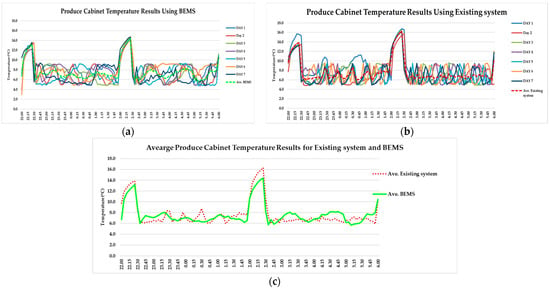
Figure 27.
The temperature of the produce cabinet using (a) the existing system and (b) the BEMS. (c) The average results for the existing system and the BEMS.
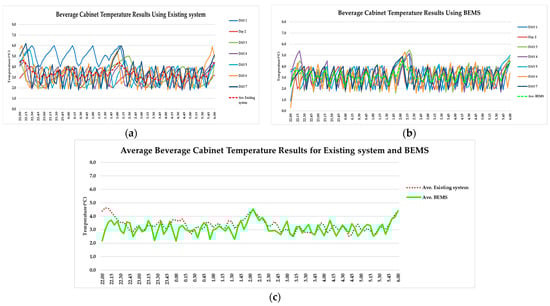
Figure 28.
The temperature of the beverage cabinet using (a) the existing system and (b) the BEMS. (c) The average results for the existing system and the BEMS.
4.3. Discussion
When the BEMS was implemented in the air conditioning and refrigeration systems examined in this case study, the energy consumption results indicated a 4.4-year payback period with a total energy savings of 9.9 kilowatt-hours per day or 3613.5 kilowatt-hours per year. This strategy controls air conditioning and refrigeration systems, which can reduce energy consumption by reducing the work performed by compressors. Table 2 compares the energy conservation results to those from previous studies. The findings regarding energy consumption are reliable and in line with those of previous studies. The specific usage conditions of this study can account for any variations observed in this research.
Table 2.
The percentage of energy savings compared with previous studies.
The execution of this study in an actual convenience store in the central region of Thailand had some constraints. The authors could not regulate customer traffic during the experimental period, which directly affected the demand on the air conditioning and refrigeration systems in the store. Moreover, it was essential to conduct this study within a limited observation period to prevent interference with sales operations. If the store operated for 24 h a day, the savings would exceed the previous levels. This indicates a decrease in the payback period. If these changes were implemented on a large scale, they could reduce the investment and directly affect the payback period.
5. Conclusions
Implementing a BEMS such as the logic control proposed in this research can not only reduce compressor energy consumption in both air conditioning and refrigeration systems but also reduce energy losses from low desired temperatures in sale areas and keep cabinet temperatures the same as before implementation. In an experiment at a 314-square-meter convenience store open from 6:00 a.m. to 11:00 p.m., the BEMS controlled AC units close to the desired sale-area temperature of 25 degrees Celsius and increased the suction pressure at a compressor of a medium-temperature CDU by 0.3 bar or 31 kPa. The results indicated a 4.4-year payback period with energy savings of 7.1 kilowatt-hours per day or 2591.5 kilowatt-hours per year for the air conditioning system, energy savings of 2.8 kilowatt-hours per day or 1022.0 kilowatt-hours per year for the refrigeration system, and total energy savings of 9.9 kilowatt-hours per day or 3613.5 kilowatt-hours per year. The convenience store can utilize the findings of this research to enhance the energy efficiency of its cooling system, which includes air conditioning and refrigeration systems, thereby promoting sustainable energy conservation.
Future research should prioritize the automation of lighting and other systems, alongside the examination of the optimal suction pressure for medium- and low-temperature CDUs in refrigeration systems. Strategies to control AC systems by modifying the ambient temperature should be examined to optimize energy efficiency.
Author Contributions
Conceptualization, software, validation, formal analysis, investigation, resources, data curation, writing—original draft preparation, and writing—review and editing, T.T.; visualization, supervision, project administration, and funding acquisition, P.S., P.V. and J.T. All authors have read and agreed to the published version of the manuscript.
Funding
This research was funded by Prince of Songkla University.
Data Availability Statement
The raw data supporting the conclusions of this article will be made available by the authors on request.
Acknowledgments
This study was supported by Prince of Songkla University. All authors provided valuable suggestions, and colleagues also provided support for this research.
Conflicts of Interest
The authors declare no conflicts of interest.
References
- The Energy Policy and Planning (EPPO). Energy Statistic of Thailand 2023. Available online: www.eppo.go.th (accessed on 1 January 2024).
- Borio, C. The COVID-19 economic crisis: Dangerously unique. Bus. Econ. 2020, 55, 181–190. [Google Scholar] [CrossRef]
- Narin, T. Industry Outlook 2024–2026 Modern Trade. Available online: https://www.krungsri.com/en/research/industry/industry-outlook/wholesale-retail (accessed on 4 April 2024).
- Saengsikhiao, P.; Taweekun, J.; Maliwan, K.; Sae-Ung, S.; Theppaya, T. The Replacement of the R404A Refrigeration System with The Environmentally Friendly R448A, to Improve Convenience Store Energy Efficiency in Thailand. J. Adv. Res. Fluid Mech. Therm. Sci. 2020, 75, 137–146. [Google Scholar] [CrossRef]
- Saengsikhiao, P.; Taweekun, J.; Maliwan, K.; Sae-Ung, S.; Theppaya, T. The Performance Simulation of The New R463A HFC/HFO/Carbon Dioxide Refrigerant with Lower GWP, As an Alternate Option for The R404A Refrigeration System. J. Adv. Res. Fluid Mech. Therm. Sci. 2020, 76, 113–123. [Google Scholar] [CrossRef]
- Shen, H.; Ke, X.; Jame, F. A statistical study on Energy performance of U.S. convenience stores: Investigation of factors and bench marking on store energy use. Energy Build. 2019, 183, 792–802. [Google Scholar] [CrossRef]
- Chou, D.-C.; Chang, C.-S.; Hsu, Y.-Z. Investigation and analysis of power consumption in convenience stores in Taiwan. Energy Build. 2016, 133, 670–687. [Google Scholar] [CrossRef]
- Anna, R.; Manuel, D.P.; Jorge, D.B.; Ricardo, M. Carbon (CI) and energy intensity (EI) dataset for retail stores. Data Brief 2018, 21, 1329–1333. [Google Scholar]
- Tirawannavit, K.; Krueasuk, W.; Bhasaputra, P.; Pattaraprakorn, W. Energy management for light system in the convenience stores: Case study of gas station in Thailand. In Proceedings of the 2011 International Conference & Utility Exhibition on Power and Energy Systems: Issues and Prospects for Asia (ICUE), Pattaya, Thailand, 28–30 September 2011; pp. 1–5. [Google Scholar] [CrossRef]
- Suapphong, K.; Weijun, G.; Pawinee, I.; Soichiro, K. Energy and Environmental Evaluation of Micro-Cogeneration System for Convenience Stores in Thailand. Am. J. Environ. Sci. 2014, 10, 312–323. [Google Scholar]
- Bin, Z.; Wentao, L.; Ka Wing, C.; Yijia, C.; Yonghong, K.; Xi, L. Smart home energy management systems: Concept, configurations, and scheduling strategies. Renew. Sustain. Energy Rev. 2016, 61, 30–40. [Google Scholar]
- Ma, Y.; Chen, X.; Wang, L.; Yang, J. Investigation of Smart Home Energy Management System for Demand Response Application. Front. Energy Res. 2021, 9, 772027. [Google Scholar] [CrossRef]
- Charlie, W.; Tom, H.; Richard, H. Benefits and risks of smart home technologies. Energy Policy 2017, 103, 72–83. [Google Scholar]
- Yanliang, W.; Yue, X. Photovoltaic-storage energy system management considering wireless data communication. Energy Rep. 2022, 8, 267–273. [Google Scholar]
- Michael, B.; Killian, M.; Jeff, M.; Tyrone, V. Home energy management under realistic and uncertain conditions; A comparison of heuristic, deterministic, and stochastic control methods. Appl. Energy 2022, 325, 119770. [Google Scholar]
- Kirsten, G.; Sarah, J. Home is where the smart is? Evaluating smart home research and approaches against the concept of home. Energy Res. Soc. Sci. 2018, 37, 94–101. [Google Scholar]
- Rasha, E.; Omar, S.; Amr, M.A.; Amin, M.; Mohamed, D. New smart home energy management systems based on inclining block-rate pricing scheme. Clean Energy 2022, 6, 503–511. [Google Scholar]
- Ali, E.; Abolfazl, R.; Andrew, G.S. Home energy management system for smart buildings with inverter-based air conditioning system. Electr. Power Energy Syst. 2021, 133, 107230. [Google Scholar]
- Yael, P.; Galit, B. Flexiwatts and seamless technology; Public perceptions of demand flexibility through smart home technology. Energy Res. Soc. Sci. 2018, 39, 177–191. [Google Scholar]
- Israr, U.; DoHyeun, K. An Improved Optimization Function for Maximizing User Comfort with Minimum Energy Consumption in Smart Homes. Energies 2017, 10, 1818. [Google Scholar] [CrossRef]
- Rebecca, F.; Macro, P.; Angela, S.; Beth, K. Categories and functionality of smart home technology for energy management. Build. Environ. 2017, 123, 543–554. [Google Scholar]
- Navid, R.; Danial, B.; Rajinikanth, V.; de Oliveira, G.G. A New Home Energy Management System for Smart Home Using Improved Multi-objective Antlion Optimization Algorithm. In Proceedings of the 7th Brazilian Technology Symposium (BTSym’21). BTSym 2021. Smart Innovation, Systems and Technologies; Springer: Cham, Switzerland, 2023; Volume 207, pp. 56–72. [Google Scholar]
- Babak, J.; Yateendra, M.; Gerard, L. Distributed load scheduling in residential neighborhoods for coordinated operation of multiple home energy management systems. Appl. Energy 2021, 300, 117353. [Google Scholar]
- Berk, C.; Robin, R.; Siddharth, S.; David, B.; Abdellatif, M. Electric energy management in residential areas through coordination of multiple smart homes. Renew. Sustain. Energy Rev. 2017, 80, 260–275. [Google Scholar]
- Eduardo, P.; Joao, S.; Costa, P.J.B. Improving the energy efficiency of aging retail buildings: A large department store in Lisbon as case study. Energy Syst. 2021, 12, 1081–1111. [Google Scholar]
- Magrini, A.; Marenco, L.; Bodrato, A. Energy smart management and performance monitoring of a NZEB: Analysis of an application. Energy Rep. 2022, 8, 8896–8906. [Google Scholar] [CrossRef]
- Pi, Z.X.; Li, X.; Yuemin, D.; Zhao, M.; Liu, Z.X. Demand response scheduling algorithm of the economic energy consumption in buildings for considering comfortable working time and user target price. Energy Build. 2021, 250, 111252. [Google Scholar] [CrossRef]
- Tuan, A.; Macro, A. Energy intelligent buildings based on user activity: A survey. Energy Build. 2013, 56, 244–257. [Google Scholar]
- Zheming, L.; Desong, B.; Xiaohu, Z.; Di, S.; Ruisheng, D.; Zhiwei, W. Optimal energy management for commercial buildings considering comprehensive comfort levels in a retail electricity market. Appl. Energy 2019, 236, 916–926. [Google Scholar]
- Ghezlane, H.M.; Mohamed, E.; Mohamed Ben, H.; Basheer, Q.; Junaid, Q.; Muhammad, A.; Ala, A.; Mohamed Riduan, A.; Driss, B. Intelligent Building Control Systems for Thermal Comfort and Energy-Efficiency: A Systematic Review of Artificail Intelligence-Assisted Techniques. arXiv 2016, arXiv:2104.02214. [Google Scholar] [CrossRef]
- Tong, Z.; Dunbing, T.; Haihua, Z.; Zequn, Z. Multi-agent reinforcement learning for online scheduling in smart factories. Robotics and Computer-Integrated. Manufacturing 2021, 72, 102202. [Google Scholar]
- Bilal, N.M.; Asif, H.; Kamran, A.K.N.; Mashood, N. An Optimal Energy Management System (EMS) for Residential and Industrial Microgrids. Energies 2022, 15, 6266. [Google Scholar] [CrossRef]
- Jianwei, G.; Fangjie, G.; Zeyang, M.; Ningbo, H.; Yu, Y. Multi-objective optimization of smart community integrated energy considering the utility of decision makers based on the Levy flight improved chicken swarm algorithm. Sustain. Cities Soc. 2021, 72, 103075. [Google Scholar]
- Saengsikhiao, P.; Prapaiporn, C.; Taweekun, J. The Optimization of Chillers Air-Conditioing in Thailand Supermarkets Using a Retail Energy Management Systems (REMS). J. Adv. Res. Fluid Mech. Therm. Sci. 2024, 2024, 62–73. [Google Scholar] [CrossRef]
- Guo-Ming, S.; Yen-Shih, S.; Chih-Ping, Y.; Cheng-Syuan, J. Two-port–two-port SI between RS485 and Ethernet with an FIFO queue for efficient PC-to-PC communication. IET Netw. 2020, 9, 102–109. [Google Scholar]
- Iman, K.; Abouzar, E.; Marian, V.; Georges, G. A review on Internet of Things solutions for intelligent energy control in buildings for smart city applications. Energy Procedia 2017, 111, 770–779. [Google Scholar]
- Terence, K.L.H.; Simon, S.R.; Daniel, D.S. Major requirements for building Smart Homes in Smart Cities based on Internet of Things technologies. Future Gener. Comput. Syst. 2017, 76, 358–369. [Google Scholar]
- Biljana, R.S.; Kire, T. A review of Internet of Things for smart home: Challenges and solutions. J. Clean. Prod. 2017, 140, 1454–1464. [Google Scholar]
- Fabliha, B.I.; Cosmas, I.N.; Dong-Seong, K.; Jae-Min, L. IoT-Based HVAC Monitoring System for Smart Factory. In Proceedings of the International Conference on Information and Communication Technology Convergence (ICTC), Jeju, Republic of Korea, 21–23 October 2020. [Google Scholar] [CrossRef]
- Rajat, G.; Matt, G. Building performance evaluation of low-energy dwellings with and without smart thermostats. Build. Serv. Eng. Res. Technol. 2022, 43, 297–318. [Google Scholar]
- Mohammed, A.A. Fuzzy-based smart energy management system for residential buildings in Saudi Arabia: A comparative study. Energy Rep. 2024, 11, 1212–1224. [Google Scholar]
- Varun, N.; Ancy, J.J.; Rithick, S.; Joshua, P.C. Efficient Energy Management using Sensors and Smart Grid. In Proceedings of the 2023 2nd International Conference on Edge Computing and Applications (ICECAA) IEEE Xplore, Namakkal, India, 19–21 July 2023; ISBN 979-8-3503-4757-9. [Google Scholar]
- José, L.H.; Ignacio, D.M.; Fredy, V.; Ali, V. Challenges and opportunities in European smart buildings energy management: A critical review. Renew. Sustain. Energy Rev. 2024, 199, 114472. [Google Scholar]
- Praddeep, G.; Robert, H.C.; Marzia, T.; Behzad, R. Comparing the life cycle costs of a traditional and a smart HVAC control system for Australian office buildings. J. Build. Eng. 2024, 91, 109686. [Google Scholar]
- Pan, Y. Review of energy saving technologies research in HVAC systems. E3S Web Conf. 2023, 438, 01006. [Google Scholar] [CrossRef]
- Dafang, Z.; Daichi, W.; Yuki, O.; Ittetsu, T.; Toshihiro, S.; Yoshiyuki, S.; Takao, O. Data-driven online energy management framework for HVAC systems: An experimental study. Appl. Energy 2023, 352, 121921. [Google Scholar]
- Kung-Jeng, W.; Chiuhsiang Joe, L.; Teshome Bekele, D. An adaptive indoor temperature control approach simultaneously improving thermal comfort and task performance. Int. J. Therm. Sci. 2023, 193, 108542. [Google Scholar]
- Praddeep, G.; Robert, H.C.; Marzia, T.; Behzad, R. Life cycle energy and greenhouse gas emissions of a traditional and a smart HVAC control system for Australian office buildings. J. Build. Eng. 2024, 82, 108295. [Google Scholar]
- Bao, Y.; Bing, S.; Fu, X.; Anbang, L.; Kehua, L.; Shen, L.; Rui, Y.; Qiuzhuang, L.; Ao, L.; Yuanyang, L.; et al. Energy-oriented control retrofit for existing HVAC system adopting data-driven MPC—Methodology, implementation and field test. Energy Build. 2023, 295, 113286. [Google Scholar]
- Dasheng, L.; Fu-Po, T. Air Conditioning Energy Saving from Cloud-Based Artificial Intelligence: Case Study of a Split-Type Air Conditioner. Energies 2020, 13, 2001. [Google Scholar] [CrossRef]
- Yuvraj, A.; Bharathan, B.; Rajesh, G.; Jacob, L.; Michael, W.; Thomas, W. Occupancy-Driven Energy Management for Smart Building Automation. In Proceedings of the BuildSys′10—Proceedings of the 2nd ACM Workshop on Embedded Sensing Systems for Energy-Efficiency in Buildings, Zurich, Switzerland, 3 November 2010; pp. 1–6. [Google Scholar]
- Fu, W.; Wai, T.; Chak, F. Novel load allocation analysis for energy management and carbon emissions reduction of chiller system in hotel buildings. J. Build. Eng. 2024, 96, 110405. [Google Scholar]
- Woohyun, K.; Min, G.; Robert, G.L.; Srinivas, K. Implementation and validation of optimal start control strategy for air conditioners and heat pumps. Appl. Therm. Eng. 2024, 257, 124256. [Google Scholar]
- Aaliya, A.; Chiranjeevi, C.; Raja, S.; Natarajan, M.; Srinivas, T. Performance Optimization of Chiller Used for Commercial Building Air-Conditioning. Energy and Exergy for Sustainable and Clean Environment. Green Energy Technol. 2023, 2, 509–522. [Google Scholar]
- Juan, C.R. Economic and environmental improvements using high energy efficiency HVAC in supermarkets. Clean Technol. Environ. 2020, 22, 1417–1429. [Google Scholar]
- Siyuan, Y.; Junqi, Y.; Zhikun, G.; Anjun, Z. Energy-saving optimization of air-conditioning water system based on data-driven and improved parallel artificial immune system algorithm. Energy Convers. Manag. 2023, 283, 116902. [Google Scholar]
- Franciskus, A. AI-powered deep learning for sustainable industry 4.0 and internet of things: Enhancing energy man-agement in smart buildings. Alex. Eng. J. 2024, 104, 409–422. [Google Scholar]
- Aristotelis, N.; Panagiotis, P.; Alfonso, P.R.; Skarmeta-Gómez, F.A.; Sánchez-Valverde, J.; Vlachou, C.M.; Marín-Pérez, R.; Quesada-Sánchez, A.; Purcell, F.; Wright, S. Smart buildings with legacy equipment: A case study on energy savings and cost reduction through an IoT platform in Ireland and Greece. Results Eng. 2024, 22, 102095. [Google Scholar]
- Yan, D.; Haozheng, Z.; Xiaochen, Y.; Zhe, T.; Chen, H. An adaptive switching control model for air conditioning systems based on information completeness. Appl. Energy 2024, 375, 124004. [Google Scholar]
- Mengchen, Z.; Santiago, G.; Hooman, N.; Craiq, Z.; Miriam, A.M.C.; Ayan, S. Toward Prediction of Energy Con-sumption Peaks and Timestamping in Commercial Supermarkets Using Deep Learning. Energies 2024, 17, 1672. [Google Scholar] [CrossRef]
- Baomin, D.; Tianhao, W.; Shengchun, L.; Peng, Z.; Jianing, Z.; Rao, F.; Dabiao, W. Assessment of booster refrigeration system with eco-friendly working fluid CO2/halogenated alkene (HA) mixture for supermarket application around the world: Energy conservation, cost saving, and emissions reduction potential. Energy 2024, 297, 131244. [Google Scholar]
- Bejarano, G.; Ortega, M.; Normey-Rico, J.; Rubio, F. Optimal control analysis and Practical NMPC applied to refrigeration systems. ISA Trans. 2020, 107, 90–106. [Google Scholar] [CrossRef] [PubMed]
- Mark, D.; Satyen, M.; Brian, M.; Gary, E. Optimization of Industrial Refrigeration Plants: Including a Case Study at Stonyfield Farm Yogurt. Eng. Environ. Sci. 2006, 1–14. [Google Scholar]
- Saengsikhiao, P.; Taweekun, J.; Maliwan, K.; Sae-Ung, S.; Theppaya, T. The Improvement of Energy Efficiency for Refrigeration System in Thailand Convenience Store by Digital Scroll Compressor. J. Adv. Res. Fluid Mech. Therm. Sci. 2020, 74, 144–150. [Google Scholar] [CrossRef]
- Siqueira, S.T.D.; Franco, I.C.; Fileti, A.M.F.; Silva, F.V. Dynamic linear modeling of a refrigeration process with electronic expansion valve actuator. Int. J. Refrig. 2017, 75, 311–321. [Google Scholar] [CrossRef]
- Gilberto, R.; Helem, S.; Victor, H. Control of Refrigeration Systems based on Vapour Compression using Multi-objective Optimization Techniques. Int. Fed. Autom. Control. 2018, 51, 722–727. [Google Scholar]
- Josep, C.; Jesus, A.C.; Daniel, Z.; Juan, A.O. A Data-Driven-Based Industrial Refrigeration Optimization Method Considering Demand Forecasting. Process 2020, 8, 617. [Google Scholar]
- Waleed, A.; Pericles, P. An Iterative Method to Derive the Equivalent Centrifugal Compressor Performance at Various Operating Conditions: Part I: Modelling of Suction Parameters Impact. Energies 2015, 8, 8497–8515. [Google Scholar] [CrossRef]
- Chun-Wie, C.; Chun-Chang, L.; Chen-Yu, L. Decision Analysis Model for Optimizing the Operation of Refrigeration Compressor Units. Am. J. Eng. Res. 2021, 10, 271–275. [Google Scholar]
- Mohd, Y.S.; Farah, W.M. Simulation of A Simple Vapour-Compression Refrigeration System Using R134a. J. Teknol. 2016, 78, 25–31. [Google Scholar]
- Xu, S.; Niu, J.; Ma, H.; Ma, G. Cooling and dehumidification performance study of a new air conditioning system with double evaporation temperature. Energy Build. 2023, 295, 113294. [Google Scholar]
- Favour, D.; Modupe, C.; Vincent, B.U.; Sina, A.M. Building energy management system research in South Africa—A decade overview. Energy Rep. 2023, 9, 33–39. [Google Scholar]
- Mariano-Hernández, D.; Hernández-Callejo, L.; Zorita-Lamadrid, A.; Duque-Pérez, O.; García, F.S. A review of strategies for building energy management system: Model predictive control, demand side management, optimization, and fault detect & diagnosis. J. Build. Eng. 2021, 33, 101692. [Google Scholar] [CrossRef]
- Panraluk, C.; Sreshthaputra, A. The Study of Thermal Comfort Zones for Developing the Government’s Senior Community Centers Using Field and Laboratory Studies: A Case Study in Phitsanulok, Thailand. Humanit. Arts Soc. Sci. Stud. 2020, 21, 587–600. [Google Scholar]
- Zhao, J.; Wang, R.; Wu, Y.; Zhao, C.; Qi, Y.; Li, S.; Jiang, H.; Cao, B. From characteristics to practical applications of skin temperature in thermal comfort research—A comprehensive review. Build. Environ. 2024, 262, 111820. [Google Scholar]
- Weiwei, L.; Yifeng, W.; Lei, S.; Jiang, L.; Zheng, W.; Xiaoyu, T. The relationship between thermal comfort, performance, and electroencephalogram during cognitive tests at normal indoor temperatures in summer. Build. Environ. 2024, 257, 111567. [Google Scholar]
- Saengsikhiao, P.; Taweekun, J. Energy Efficiency Improvement Solutions for Supermarkets by Low-E Glass Door and Digital Semi-Hermetic Compressor. Energies 2021, 14, 3134. [Google Scholar] [CrossRef]


Disclaimer/Publisher’s Note: The statements, opinions and data contained in all publications are solely those of the individual author(s) and contributor(s) and not of MDPI and/or the editor(s). MDPI and/or the editor(s) disclaim responsibility for any injury to people or property resulting from any ideas, methods, instructions or products referred to in the content. |
© 2024 by the authors. Licensee MDPI, Basel, Switzerland. This article is an open access article distributed under the terms and conditions of the Creative Commons Attribution (CC BY) license (https://creativecommons.org/licenses/by/4.0/).