Article

Energy Consumption and Fume Analysis: A Comparative Analysis of the Blasting Technique and Mechanical Excavation in a Polish Gypsum Open-Pit Mine

by
Andrzej Biessikirski
*,
Przemysław Bodziony
and
Michał Dworzak
Faculty of Civil Engineering and Resource Management, AGH University of Krakow, 30-059 Krakow, Poland
*
Author to whom correspondence should be addressed.
Energies 2024, 17(22), 5662; https://doi.org/10.3390/en17225662
Submission received: 22 October 2024 / Revised: 5 November 2024 / Accepted: 11 November 2024 / Published: 13 November 2024
(This article belongs to the Special Issue Energy Consumption at Production Stages in Mining)

Abstract

:
This article presents a comparative assessment of energy consumption and fume emissions such as NOx, CO2, and CO associated with the excavation of a specified gypsum volume using two mining methods (blasting and mechanical extraction). The analysis was carried out based on a case study gypsum open-pit mine in Poland where both extraction methods are applied. The findings indicate that, for the same output volume, blasting operations require significantly less energy (ranging from 1298.12 MJ to 1462.22 MJ) compared to mechanical excavation (86,654.15 MJ). Furthermore, a substantial portion of the energy in blasting operations is attributed to explosive loading and drilling (970.95 MJ). Conversely, mechanical mining results in higher fume emissions compared to blasting. However, during mechanical extraction, the fumes are dispersed over a prolonged period of 275 h, whereas blasting achieves the same gypsum volume extraction in approximately 7.5 h. The prediction model suggests that, based on the obtained data, overall gypsum extraction will decline unless new operational levels are developed or the mine is expanded. This reduction in gypsum extraction will be accompanied by a corresponding decrease in energy consumption and emission of fumes.

1. Introduction

Mineral extraction in open-pit mining is mostly related to the application of the blasting technique and mechanical extraction; however, drilling and blasting are considered the primary methods for quarrying rock mass due to their cost-effectiveness and ability to produce large volumes of well-fragmented rock in a relatively short period. This method is predominantly used for mining deposits of rock raw materials with compressive strengths above 20 MPa [1]. However, during the detonation process, explosive charges in boreholes generate a significant amount of energy, and, through the impact of the shock wave, stress waves, and expansion of the gaseous reaction products on the rock mass, they fracture the rock mass and release energy into the environment [2]. The literature shows that only 20–30% of the detonation energy is used for fragmentation, with the remaining energy being dispersed into the environment in the form of blast-induced vibrations, airborne shockwaves, and fly rock [3,4,5,6]. In sites where housing structures are close to open-pit mines, these environmental impacts can significantly restrict or even prohibit the use of blasting techniques [7,8,9,10,11,12]. Aside from the environmental risks associated with the release of detonation energy into the environment, the main gaseous products of decomposition reactions are large quantities of carbon and nitrogen oxides, which are considered fumes [13,14].
Where restrictions exist due to proximity to, e.g., housing structures or other constructions, quarry mining operations employ mechanical equipment, such as crawler tractors or bulldozers with ripper arms, excavators equipped with hydraulic breakers and vibration ripper devices, or continuous surface miners [15]. Compared to drilling and blasting, mechanical excavation is considered to be more expensive and time-consuming, with its main environmental impact associated with the production of fumes from diesel engines or near-distance emission of noise and dust [16,17,18]. The production rate of mechanical extraction in quarries depends on the type of machine used, its size, the mining and geological conditions, and the skills of the operators, based on which it varies from 10 to 500 Mg·h−1 [19,20,21]. The most common heavy equipment used in quarries is powered by diesel combustion engines, which are estimated to be 35–45% energy efficient [22,23,24,25].
Energy consumption in mechanical extraction by applying dozers with ripper attachments and/or eccentric vibratory skidders is widely discussed in the literature [21,26,27,28,29,30]. In general, ripping with crawler dozers is used to loosen the rock mass with a ripper and then move the loosened rock mass for loading, using single-head excavators or loaders, onto process haulers. Susceptibility to ripping is influenced by the physical properties of the rock, i.e., compressive strength, bedding plane, fracturing and cracking, brittleness and crystalline content, hardness, and weathering susceptibility. These parameters have a significant influence on the selection of the cavity size and the fracture angle of the ripper [21,26,31]. In the process of ripping, the ripper blade acts on a certain space of the rock medium in the space in front of the ripper and from its sides. As a result, the structure of the medium is destroyed to a degree that depends on the type of rock being ripped. In sum, these interactions constitute the magnitude of the ripping resistance [27]. The greatest efficiency of excavation with a crawler dozer with a skidder attachment is obtained by excavating the rock center in the direction of the fall of the deposited layers. However, the application of this method is associated with a high risk of repair downtime due to frequent damage and the accelerated wear of skidder attachment components. On the other hand, a vibratory ripper is an attachment fastened to the boom of a hydraulic backhoe excavator that is used to rip rock using its natural fractures. The process of ripping is based on the compression of the wedge of the working tool by the eccentric rotation of a shaft driven by a hydraulic motor. The process of destruction of the rock structure by the wedge tool is a dynamic phenomenon, and it is difficult to clearly determine the impact force and, therefore, the individual components of the resistance acting on the skidder [28,29,30]. Its value is determined by the unit penetration resistance—the resistance related to the unit length of the blade and the unit size of the penetration into the rock medium. This indicator depends mainly on the compressive strength of the rock and the natural cracks present in calcite. In order to determine the approximate mining efficiency of an eccentric vibratory skidder, it is necessary to determine the impact energy of the mining tool and the maximum force acting on the tool at the final stage of its penetration into the rock to a depth which depends on the type of equipment [27].
Comparative studies on mechanical mining versus blasting works have mainly been carried out for underground hard-rock mining. Stewart et al. compared the progress of excavation by TBM and blasting and highlighted the relevance of hybrid methods that combine both excavation technologies based on tunneling [32]. A similar comparison was made by Wennmohs [33] and Feijóo [34]. Skawina et al. compared the tunnel progress of mechanical excavation by a modular mobile mining machine and blasting based on discrete event simulation [35]. An LCA analysis and comparison of the two quarrying methods for quarries was carried out by Bascompta et al. and identified the critical factors in the emissions caused by blasting and mechanical excavation [36]. However, no studies have been carried out comparing the energy consumption of drilling and blasting and mechanical mining in quarry rock extraction operations.
This research paper presents a comparative analysis of the energy consumption of two mining methods—excavation with blasting techniques and mechanical extraction—based on the case study of an open-pit gypsum mine located in Poland. The energy consumption for excavating a selected section of the deposit with different mining methods was compared based on real data. Furthermore, the environmental impact of excavation by the selected methods was estimated based on the amount of gaseous products released into the environment in the form of carbon and nitrogen oxides. The energy consumption and the fumes were selected for comparison due to their applicability in both mining methods and the vulnerability of other performance factors to fluctuations in mining, geological, and market conditions and electricity and gas prices. This study aims to determine and compare the energy consumption and environmental impact due to fume emissions from mechanical excavation, drilling, and blasting, based on the case study of a Polish gypsum surface mine. The findings on energy consumption for both mining methods are of particular relevance to open-pit mine authorities, given the increasing costs of blasting per ton of output. Furthermore, the predictive model for overall output, based on data from the past five years, provides valuable insights into potential opportunities and risks at the operational level of the mine.

2. Materials and Methods

2.1. Test Stand

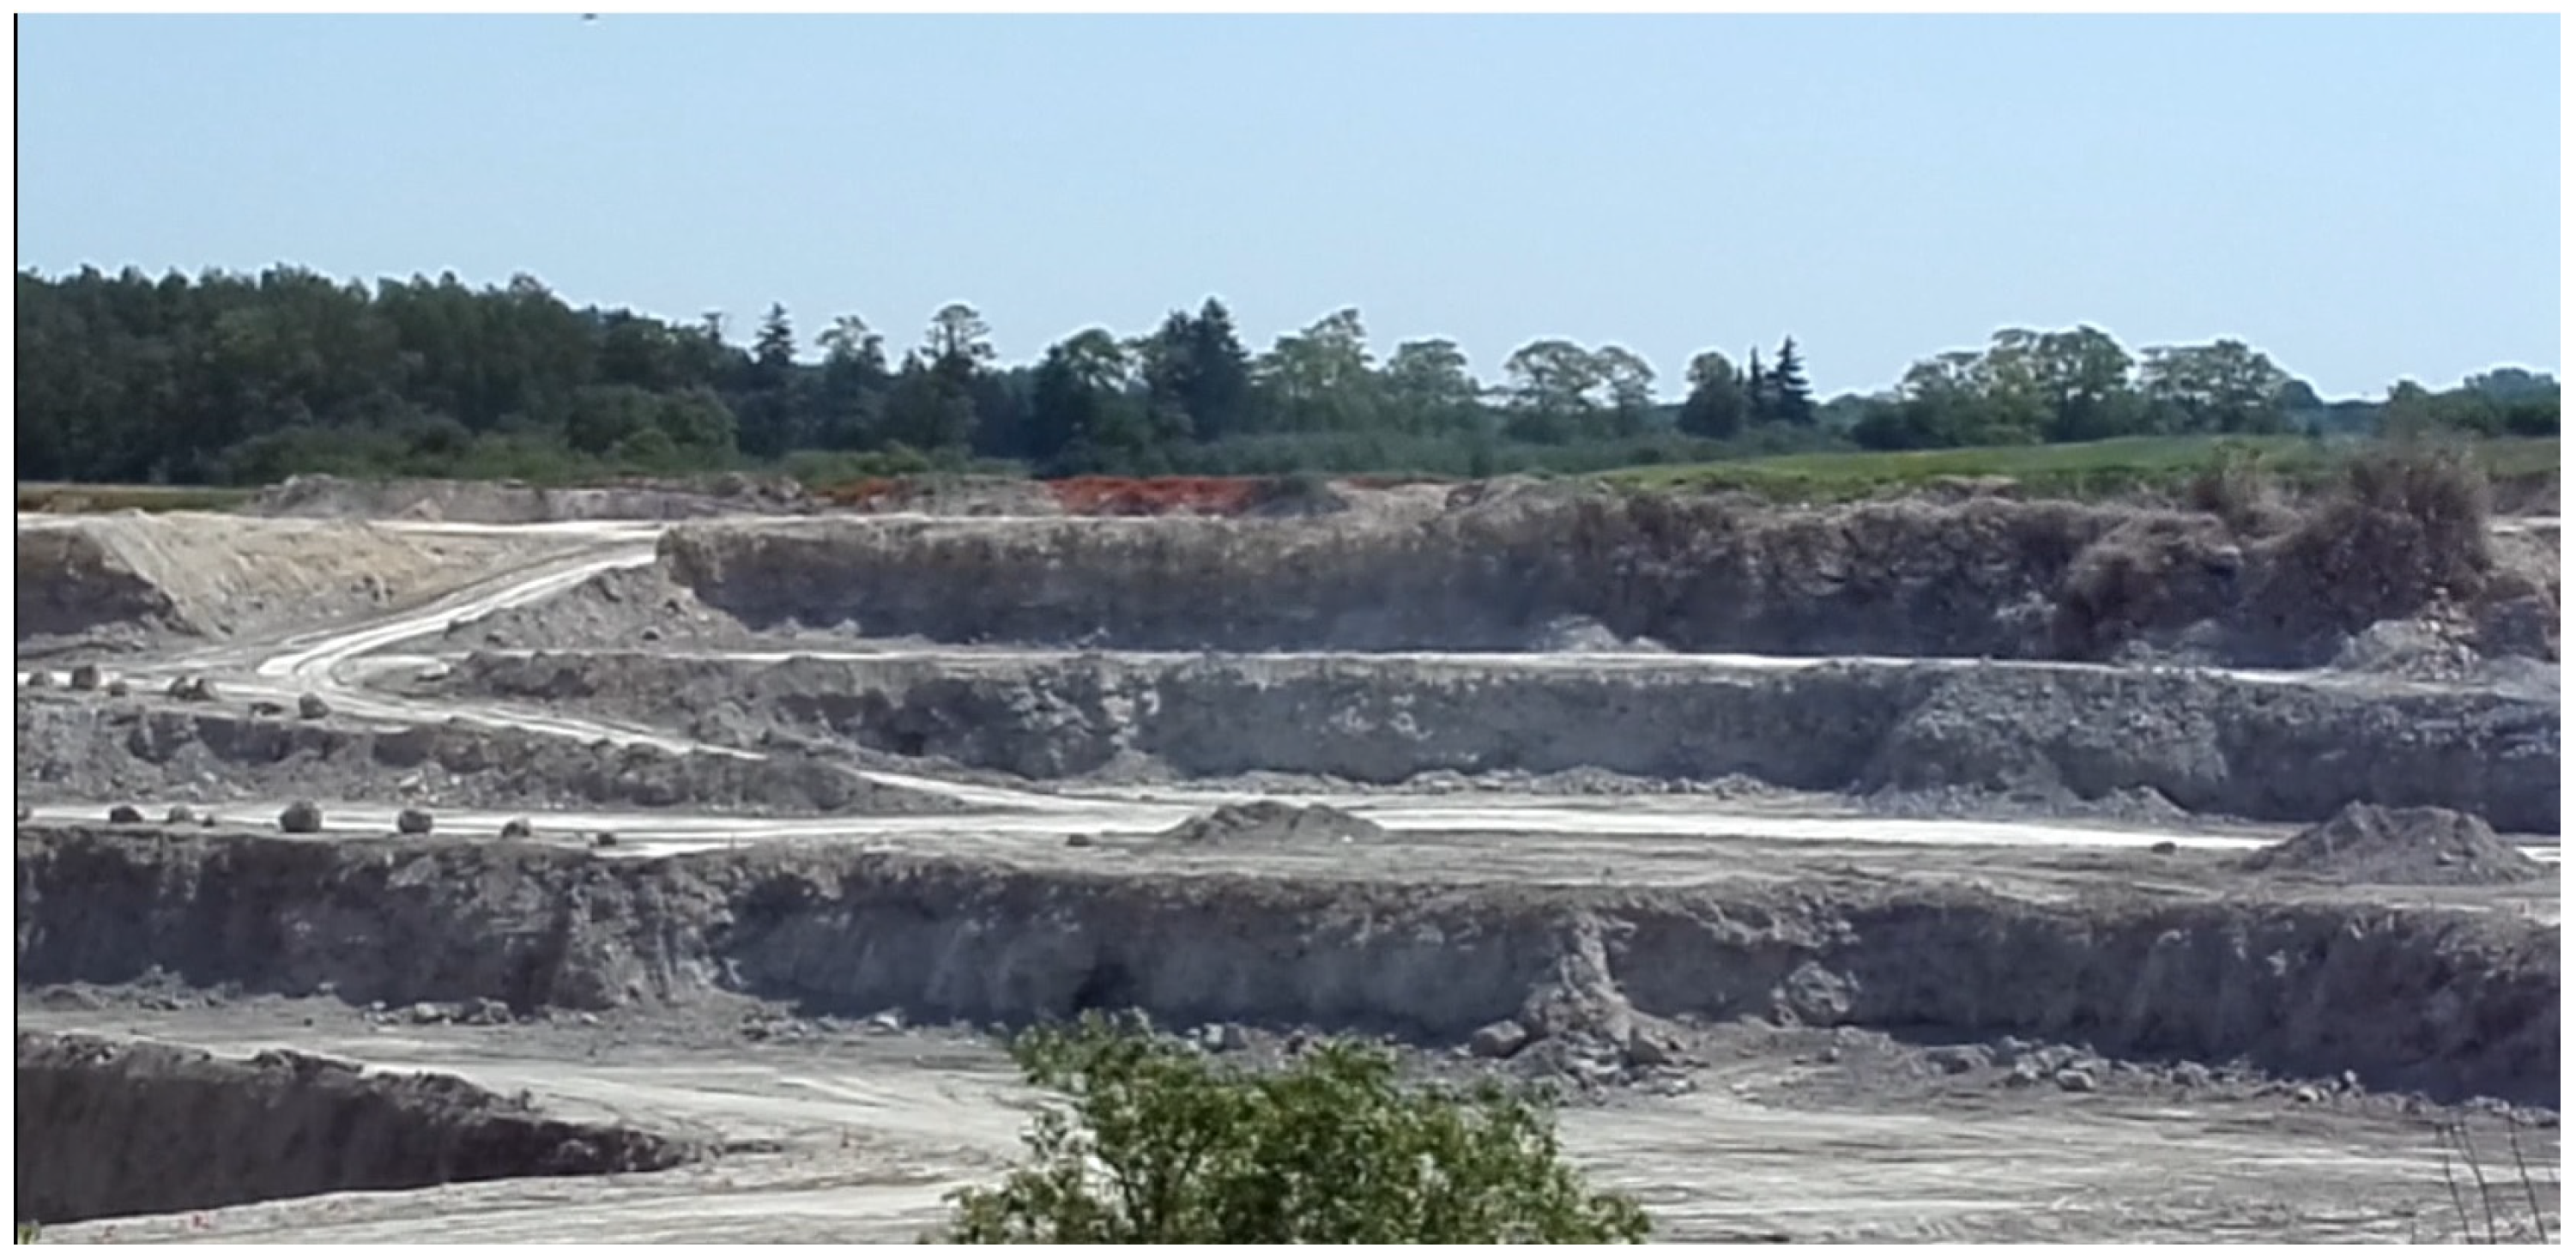
The evaluation of energy consumption was conducted for a gypsum open-pit mine located in the southern part of Poland. The proximity of the mine to residential structures imposes restrictions on the use of blasting operations. Consequently, extraction is performed using a combination of mechanical methods and blasting techniques. The area where these combined extraction methods are applied is depicted in red in Figure 1.
The gypsum deposit exhibits a gypsum content ranging from 75% to 99%, as illustrated in Figure 2 The uppermost layer of the deposit is primarily composed of low-calcination gypsum with a purity between 75% and 85%. Additionally, this layer is characterized by the presence of various geological features such as intrusions and sinkholes. The quality of the deposit improves progressively with depth (from the second operational level), reaching gypsum purity levels between 90% and 99%.
The jaw crusher utilized in the open-pit mining operation specifies that all quarried material with a diameter of approximately 650 mm or greater is classified as overburden material.

2.1.1. Blasting Works

Blasting operations, shown in Figure 3, were carried out by a drilling and blasting company active on the Polish market. Single-row, long-borehole blasting was employed. Explosive charges were undivided, with each series comprising 11 boreholes loaded with ANFO (ammonium nitrate fuel oil). The characteristics of the ANFO components are detailed in Section 2.2. Each ANFO charge was primed using an electronic detonator and a 0.5 kg TNT booster. The blasting pattern parameters, listed in Table 1, were provided directly by the mine authorities and represent the actual parameters employed on-site.
Given the proximity of the mine to the residential structures (top side of Figure 1) and the road (right side of Figure 1), the adoption of mechanical mining methods has become increasingly prevalent.

2.1.2. Mechanical Extraction

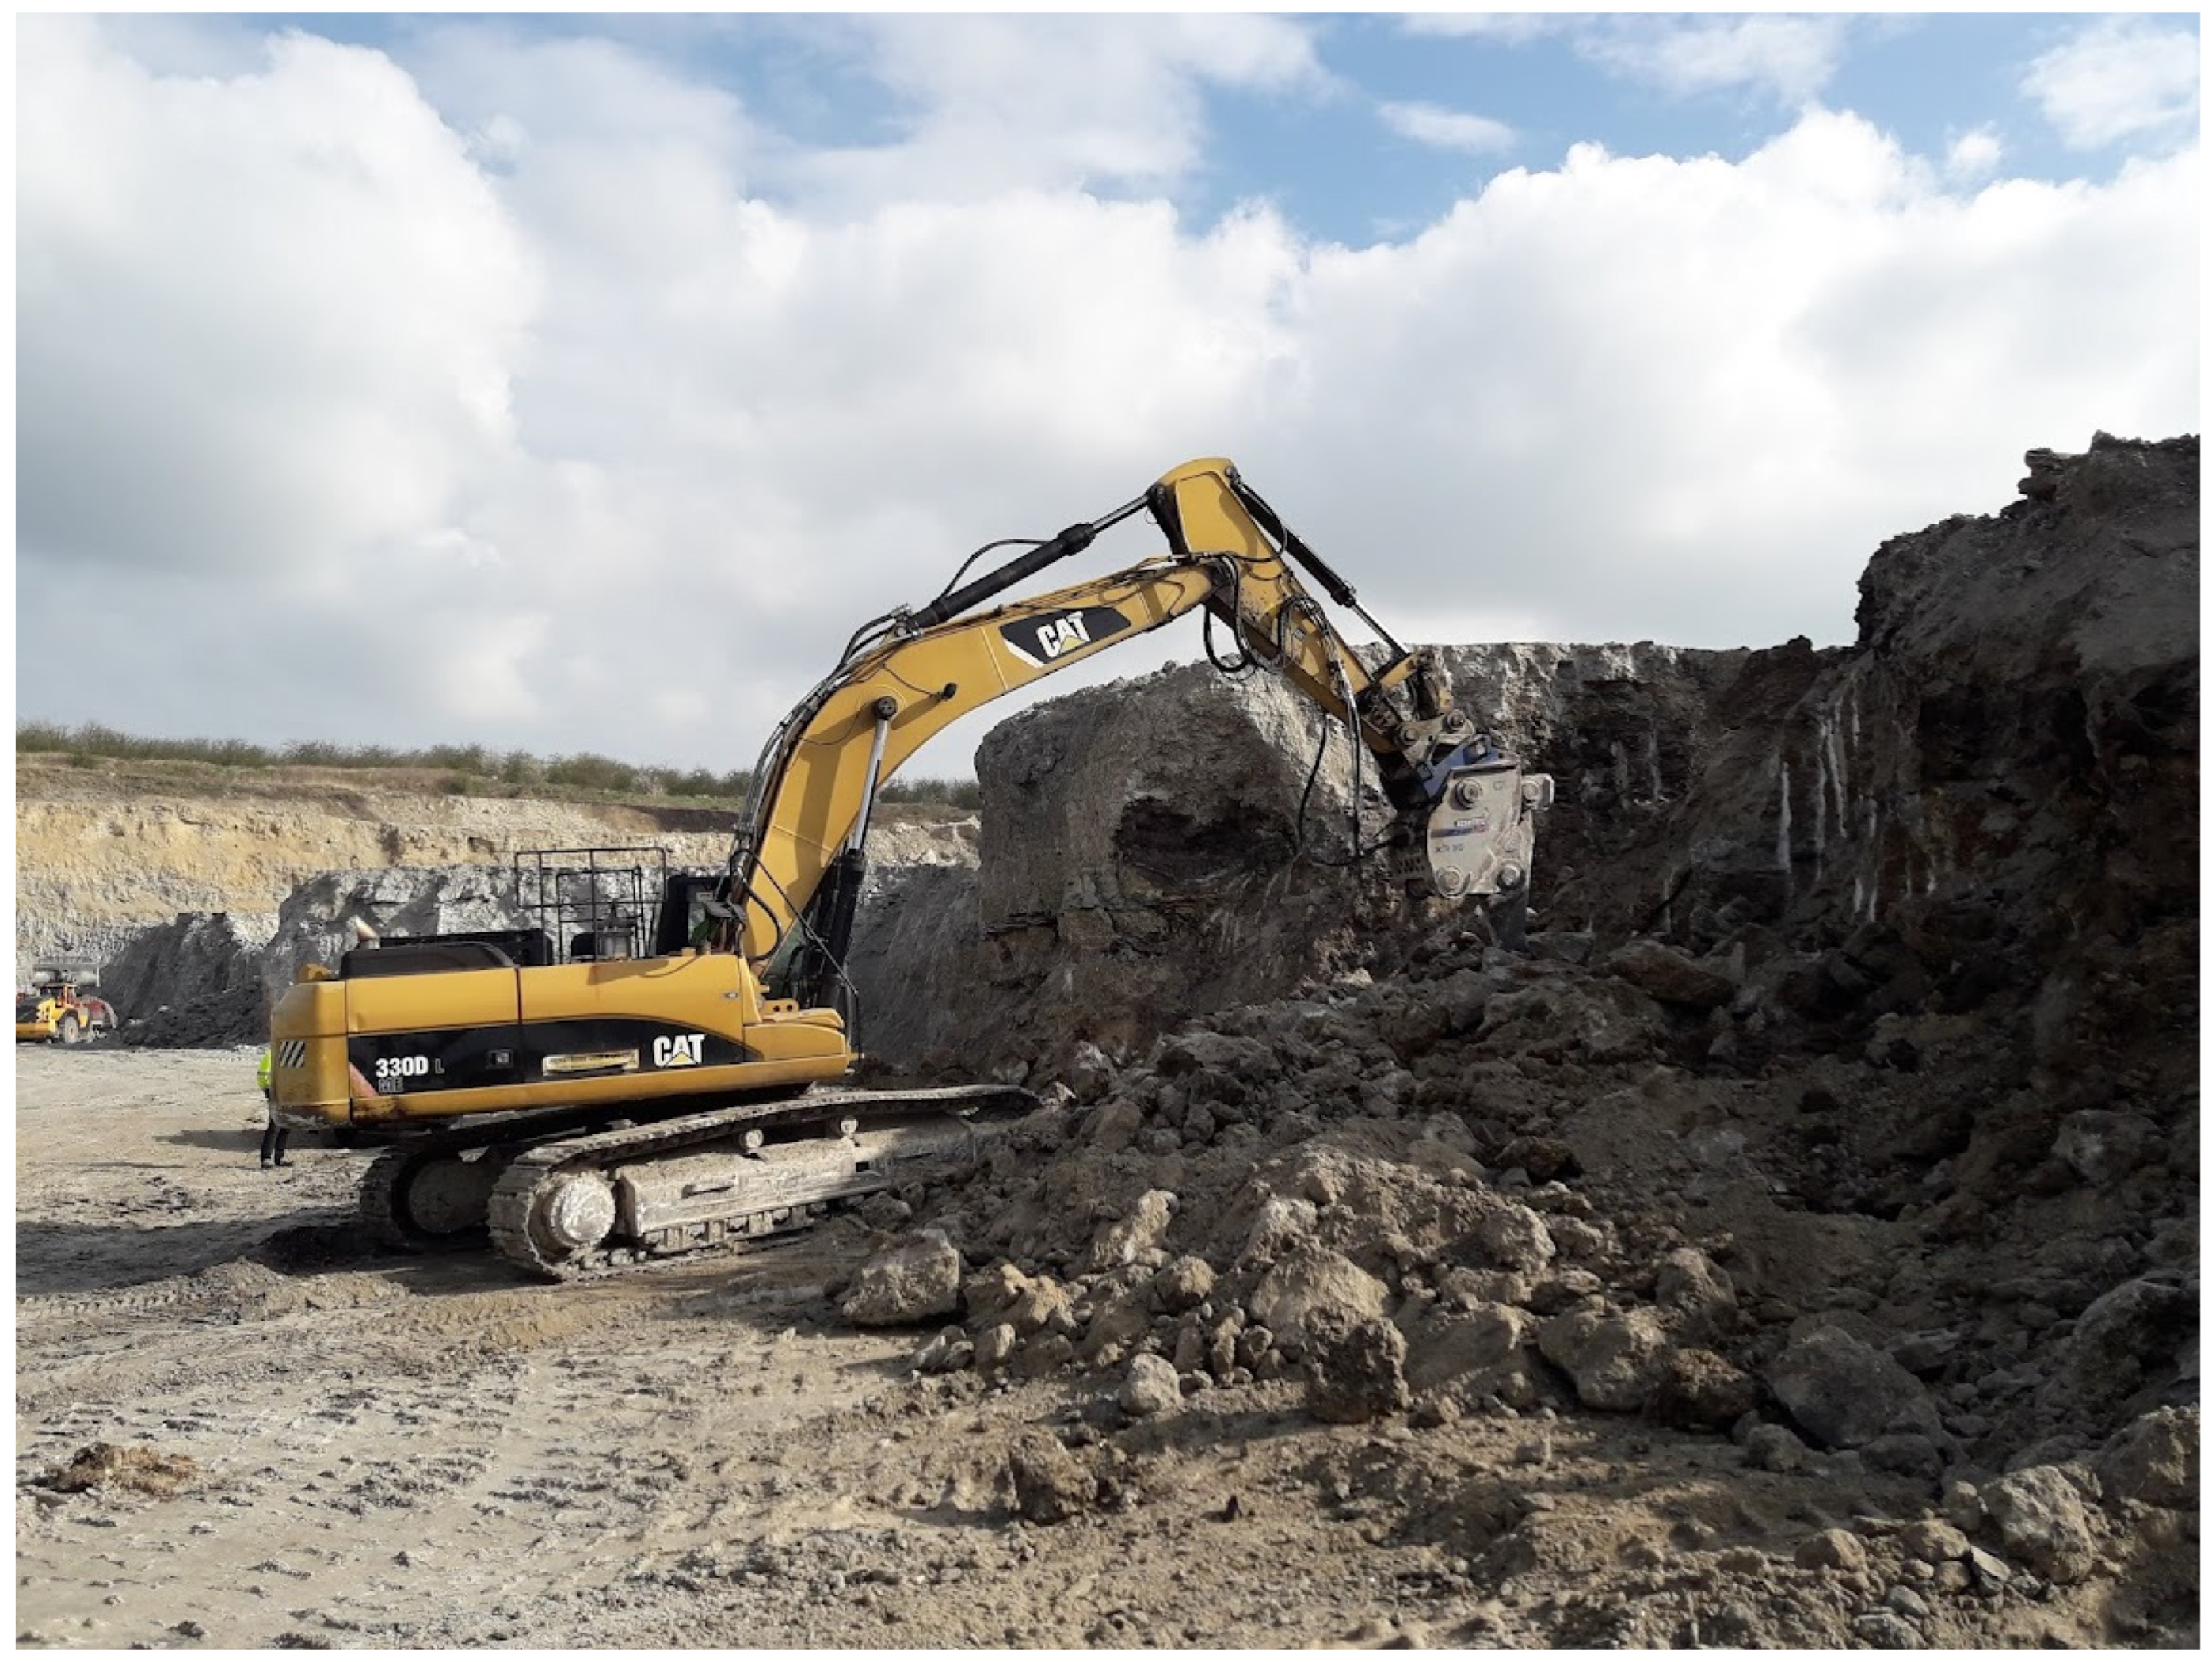
In a research case study, the widespread combination of a crawler dozer equipped with ripper attachments and an excavator equipped with a hydraulic eccentric skidder was used. The technological machinery system extracted an average of 12,779 tons of gypsum over a calendar year. This extraction was achieved over a cumulative operational period of approximately 1350 mths (hours of operation). The information about mechanical extraction is provided in Table 2.
Detailed data on fuel consumption (omitting the fuel consumption for other technological processes) and the quantity of gypsum extracted by each mechanical system are presented in Table 3.
The mechanical equipment, which was applied in the blasting and mechanical operations, shown in Figure 4, is described in detail in Section 2.3.

2.2. Materials

Ammonium nitrate (V) was produced by Yara International ASA (Szczecin, Poland). The sample contained approximately 35.0% nitrogen, with a prill diameter of 1 mm and a bulk density of 820 kg∙m−3.
The fuel oil (FO) was delivered by one of the operators in the Polish market. This FO sample consisted of a wide-range fraction of C10-C20 hydrocarbons, with a bulk density of 800 kg∙m−3. The kinetic viscosity of the FO sample was measured at 13.6 mm2·s−1 at 40 °C.
ANFO was blended in the Universal Mixing System (UMS). The system allows the manufacturing of ANFO or emulsion bulk explosive on-site. Fuel oil was blended with ammonium nitrate (V) straight before the loading process. The blending ratio of ammonium nitrate (V) to FO was 94.0:6.0 (% wt.).

2.3. Equipment

The Hausherr HSB 111P was used in the drilling operations. The HSB 111P is a crawler-mounted, hydraulic top-head drive drilling rig. The drilling rig had a gross power output of 125 kW. The average diesel consumption of the rig was approximately 12 l∙h−1. The engine of the drilling rig complied with the Tier 1/Final Stage I emission standards. The technical specifications of the drilling rig are detailed in Table 4.
The Mobile Explosive Mixing Unit (MEMU) is a truck designed for the on-site production and loading of ANFO, emulsion bulk, and heavy ANFO explosives. This unit was mounted on the Scania chassis, which provided a gross power output of 353 kW. The efficiency of the MEMU in manufacturing and loading ANFO averaged between 70 and 80 kg∙h−1. During loading and blending operations, the fuel consumption of the MEMU was typically between 30 and 35 l∙h−1.
The Caterpillar D9R crawler dozer is a versatile machine engineered for a range of mining operations including ripping overburden or production dozing. The dozer complies with Tier 3/Final Stage IIIA emissions requirements. It boasts a gross power output of 337 kW and has an operating weight of approximately 49.99 tons. Fuel consumption according to technical data varies depending on the type of operation (light, medium, heavy), ranging from 32 to 46 l h−1; however, the average fuel consumption obtained from data from the mine site was determined to be 25 l h−1. The technical specifications of the crawler dozer, which was equipped with a ripper, are detailed in Table 4.
The Caterpillar 330D is a hydraulic excavator equipped with an XC 30 excentric ripper. This excavator has an approximate operating weight of 35.3 tons and a gross power output of 200 kW. The average fuel consumption is approximately 23 l∙h−1. The Caterpillar 330D complies with the Tier 3/Final Stage IIIA emission standards. The technical specifications are detailed in Table 4.

2.4. Methods

2.4.1. Energy Consumption and Fumes

Fumes (COx and NOx) were quantified in accordance with the standard [37], which adheres to directive [38]. ANFO charges, each weighing 500 g, were detonated within a steel mortar situated in the blasting chamber. Following detonation, the resulting fumes were homogenized for 3 min using a mixing procedure. Subsequently, gasses were collected for 20 min via the ventilation system. The concentrations of COx and NOx were determined using IR (MIR 25e, ENVEA, Paris, France) and chemiluminescent (TOPAZE 32M, ENVEA, Paris, France) analyzers, respectively. The concentrations of carbon monoxide (CO) and nitrogen oxides (NOx) in the gaseous products were measured and reported per kilogram of explosive used.
The explosion energy was evaluated using a detonation calorimeter.
The method enables the assessment of the detonation energy generated from the detonation of 1 kg of explosive material. A 50 g sample of non-ideal explosive was initiated with an electric detonator and a 5 g RDX (Royal Detonation Explosive) booster. The results were recorded by considering the characteristic temperatures of four cycles (T1T4), the duration of the main period of the cycle (n), and the total heat effect (Q) calculated for the predetermined heat capacity of the assembly (K). These parameters were noted upon the completion of the measurement. The total heat effect was calculated using Equation (2).
Q = K ( Δ T k )
In the above equation, K is the heat capacity of the assembly, in cal °C; ΔT is the variation in temperature during the main period of the cycle, where ΔT = T3T2, °C; T1, T2, T3, and T4 are the specific temperatures in characteristic points of the measurement cycle, in °C; and k is the coefficient which is responsible for making a correction on losses of the assembly, in °C, computed based on Equation (2):
k = 0.5 [ 0.2 ( T 2 T 1 ) + 0.2 ( T 4 T 2 ) ] + ( 0.2 ( n 1 ) ( T 4 T 3 ) )
In the above equation, n denotes the duration of the main period of the cycle, in min.
The total efficiency of the powertrain systems, as well as the efficiency of the hydraulic working systems of the machines, was assessed based on the technical and operational documentation provided by the manufacturers. The drivetrain systems of the analyzed machines were evaluated by considering their drivetrain structure as a mixed, series-parallel configuration, which was calculated according to Equation (3). In these systems, the drivetrain components, together with the motor, are responsible for the conversion and transmission of energy from the driving components to the passive components, which are subjected to resistance forces. However, not all the work performed by the active forces is used for the intended purposes. A portion of the energy is expended in overcoming frictional resistance during movement, which is dissipated as heat into the environment [39]:
η = j = 1 n η i j
where η is the total efficiency of the powertrain unit in %; n is the number of powertrain components; and η ij is a multiplication of the efficiency of individual components of the powertrain unit.
The analyzed machines were equipped with diesel engines meeting the Tier 3/Stage IIIA/B emission standard. Fume (NOx and COx) emissions were determined based on Equation (4), used for the Tier 3 methodology [40]:
M E = N · H R S · P · ( 1 + D F A ) · L F A · E F B a s e
In the above equation, the following definitions are used:
ME is the mass of emissions of pollutant during inventory period in g·h−1;
N is the number of engine units;
HRS is the annual hours of use in h;
P is the engine size in kW;
DFA is the deterioration factor adjustment;
LFA is the load factor adjustment;
EFBase is the vase emission factor in g·kWh−1.
The parameters N, HRS, P, DFA, LFA, and EFBase are split further by classification systems as detailed below.
The machinery/vehicle population (N) is split into different technology levels and power ranges; the annual working hour (HRS) is a function of the age of the equipment/vehicles, so, for each subcategory, individual age-dependent usage patterns can be defined; power (P) is a function of the power distribution of the vehicles/machinery, so, for each subcategory, an individual power distribution can be defined within the given power ranges; the emission factor (EFBase) is determined for each pollutant as a function of technology levels and power output; finally, the deterioration factor adjustment (DFA) is a function of the power range of the vehicles/machinery and the technology level.
Table 5 and Figure 5 present the emissions of NOx, CO, and CO2 produced during one hour of effective operation in both mechanical and blasting processes.

2.4.2. Prediction Model Method

The prediction models were determined using the FBProphet algorithm (based on the FBProphet module in Python 3).
The FBProphet algorithm is an additive regression model featuring either a piecewise linear or logistic growth trend. This model incorporates a yearly seasonal component, represented via Fourier series, and a weekly seasonal component, modeled using dummy variables. Due to the limited dataset provided by the open-pit mine authorities, a full seasonal analysis was not included in the manuscript. Generally, the Prophet model is well-suited for datasets that encompass extended time periods (months or years), exhibit multiple strong seasonality, include known significant yet irregular events, contain missing data points or significant outliers, or show non-linear growth trends approaching a limiting value. The algorithm was employed for modeling time series data as a combination of trend, seasonality, and noise components, utilizing Bayesian inference. It applied a decomposable time series model described by Harvey and Peters [41,42], according to Equation (5) [43]:
y t = g t + e t + h t + E t
where y(t) represents the value of the time series at a specific time; g(t) is the trend component; e(t) is the error term; s(t) indicates the periodic changes; h(t) represents the effects with irregular schedules; and Et is an error term that accounts for any unusual changes not accommodated within the model [43]. As previously mentioned, the season analysis, due to the size of the dataset, was omitted.
The trend was modeled using a piecewise linear regression approach, allowing it to be represented as a sequence of linear segments. The slope of each segment was a function of change points within the time series data. The mathematical representation of the trend follows Equation (6):
y t = g t + e ( t )
The trend component was modeled as a piecewise linear function, described by Equation (7):
g t = k t · t + m ( t )
where k(t) defines the slope of the trend at time (t), and m(t) represents the intercept at time t. Both the slope and the intercept were modeled using a hierarchical Bayesian model. This approach allowed for the regularization of estimators and captured the uncertainty surrounding them.
The growth function in the prediction model modelled the overall data trend. By default, the algorithm applies a linear growth model, using piecewise linear equations with varying slopes at specific change points. When a time series approaches a saturation level, it means that the values are constrained by a maximum (cap) or minimum (floor), and a logistic growth function is preferable, as it accounts for these upper and lower limits. If no trend growth is observed, a flat growth function is applied, resulting in a constant trend value over time. For the current analysis, csv files containing either energy consumption or the annual gypsum extraction volume were provided to model these growth dynamics.

3. Results and Discussion

3.1. Blasting Techniques

Blasting operations are a crucial aspect of mining activities, playing a significant role in the efficiency of resource extraction and the overall energy consumption of the mining process. The energy consumption in blasting is multifaceted, encompassing the energy stored in the explosives, the energy required for drilling boreholes, and the energy expended in post-blast activities such as mucking and hauling. However, for this analysis, the energy related to post-blast activities will be omitted due to the similarity of these processes to those performed during mechanical extraction at the mine site.

3.1.1. Evaluation of Explosion Energy of Energetic Materials

The primary energy input in blasting operations is the energy stored in the applied explosives. The energy released from explosives is crucial for fragmenting the rock mass and facilitating subsequent extraction processes. The total explosive energy was calculated based on detonation calorimetry tests, providing a measure of the energy content of the explosives used. This approach enables the evaluation of the actual energy output from the tested blasting series.
Table 6 presents the specific energy release values for 1 kg of the applied explosives. Based on the detonation calorimetry measurements, the energy release for ANFO (ammonium nitrate fuel oil) is approximately 3940 kJ·kg−1. In one blasting series, a total of 407 kg of ANFO was used, resulting in an energy release of 1603.58 MJ. In comparison, the TNT booster generated approximately 6400 kJ kg−1. For the same blasting series, a total of 5.5 kg of TNT was used, producing an energy release of 35.2 MJ. Combining both explosives, the total mass of ANFO and TNT charges used was 412.5 kg, yielding an estimated stored energy in the explosives of 2635.6 MJ.
It is important to note that not all the stored energy in the explosives is utilized for quarrying. According to studies by Rai and Singh, Pyra, and Smujłlo, approximately 70–80% of the energy is dissipated into the environment in the form of air blast, blast-induced vibrations, and fly rock. Therefore, the effective energy available for quarrying is only 20–30% of the total stored energy [5,45,46].
From the total energy value of 1638.78 MJ, the effective energy for quarrying, calculated as 20–30% of the total, ranges from 327.76 MJ to 491.63 MJ. This indicates that a significant portion of the energy is lost to non-productive forms, emphasizing the need for optimizing blasting operations to enhance energy efficiency.

3.1.2. Evaluation of Energy Consumption of Loading and Drilling Operations

The energy expenditure required to excavate part of the deposit is determined by Equation (8), taking into account the effective energy of detonation of the blasting net of explosives and the energy required to drill and load the blasting net of the holes, as well as the total efficiency of the drive systems of the machines used, including the fuel and total efficiency. Drilling boreholes is essential in overall blasting operations. Energy consumption in drilling depends on several factors, including the type of drilling equipment used, the geological characteristics of the rock mass, and the borehole diameter and depth. In general, energy consumption from blasting operations can be presented according to Equations (8) and (9):
E T B = E D e t + E D r i l l i n g + E L o a d i n g
E T B = α E E x Q T + i ( η i V F O _ i d F O i C V F O i )
In the above equations, the following definitions are used:
E T B is a total sum of the energy consumption from all blasting operations in MJ;
E D e t is the energy released from the detonation of explosives in MJ;
E D r i l l i n g is the energy consumption from drilling operation in MJ;
E L o a d i n g is the energy consumption from loading operations in MJ;
α is an index for quarrying (energy which is subjected only for extraction 0.2–0.3, according to [21,26,28]);
Q T is the energy of the explosion in MJ g−1;
η i is the total efficiency of the powertrain unit in %;
V F O i _ is the average volume of combusted diesel oil in dm3 h−1;
d F O i is the fuel oil density in kg dm3;
C V F O i is the calorific value of combusted fuel oil in MJ kg−1.
According to Table 3, the Hausherr 111P drill rig has a drilling efficiency of 23.18 m/h and an average fuel consumption of 11.57 dm3/mth drilled.
For an analyzed series requiring a total borehole length of 99 m (11 boreholes), the drilling operation (assuming no maneuvering time) takes approximately 256 min. This results in a total diesel consumption of 49.40 dm3. Given the average density of diesel at 0.8325 kg dm3 and a calorific value of 42.6 MJ kg−1, the drilling process consumes 41.13 kg of diesel, corresponding to an energy requirement of 1752.14 MJ.
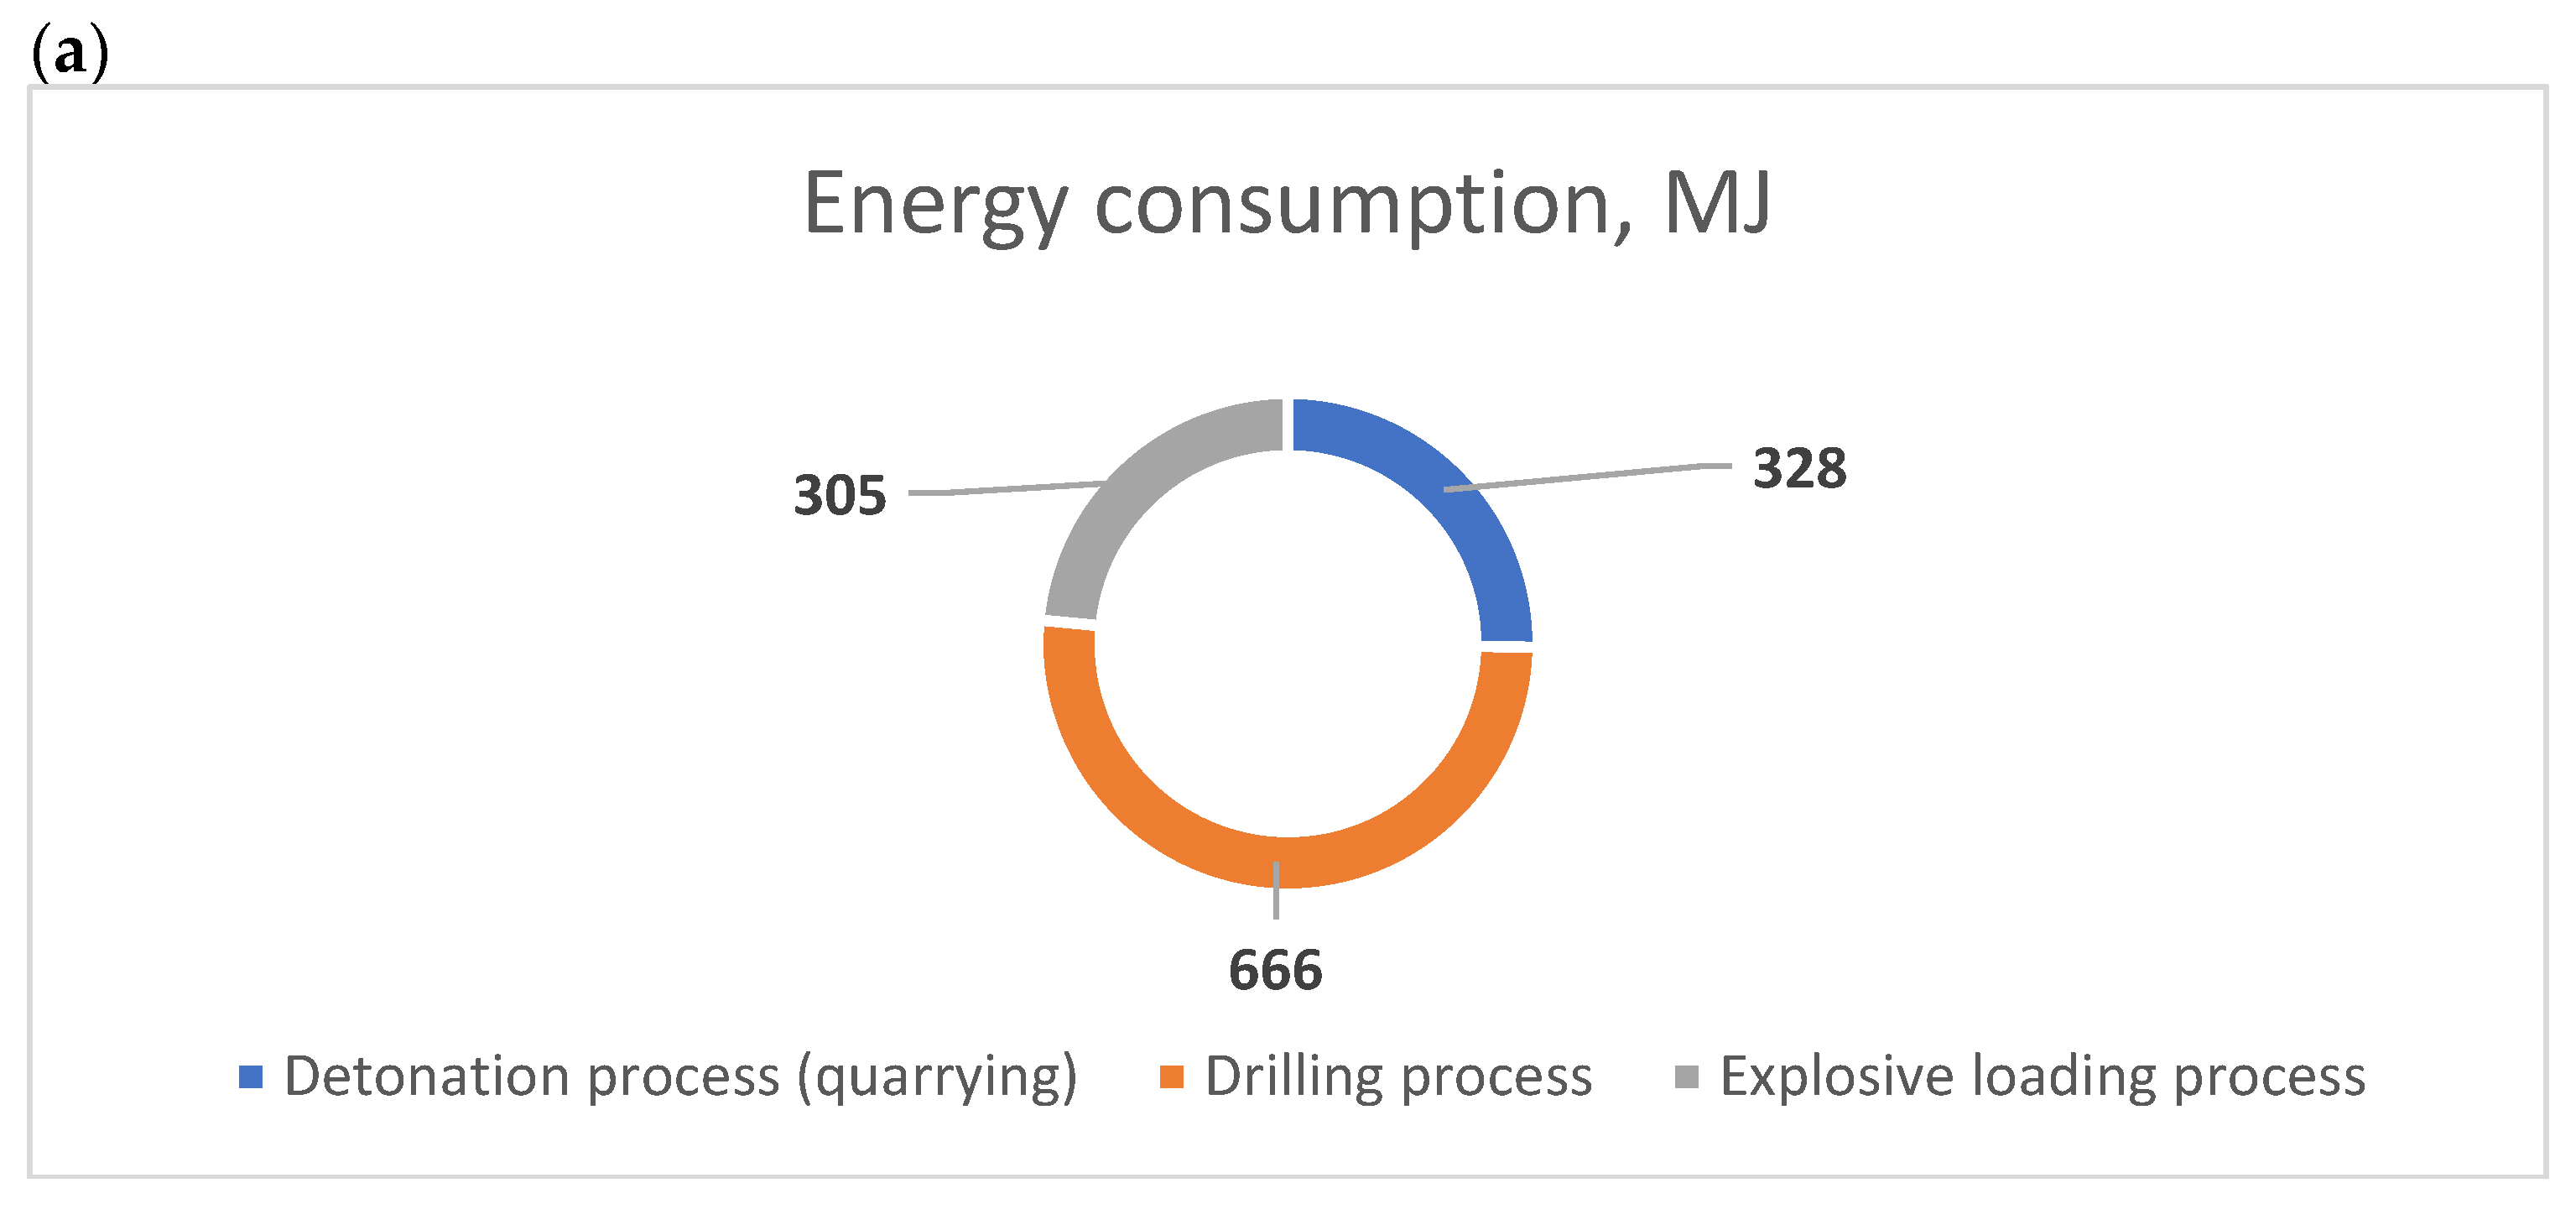
Considering that diesel engines and power transmission systems for Hausherr 111P have an efficiency of 38%, as shown in Table 4, the effective energy utilized for drilling is approximately 665.81 MJ.
The process of loading explosives into boreholes involves the handling and placement of explosive materials, such as ANFO and boosters, and is generally less energy-intensive compared to drilling. The Mobile Explosive Manufacturing Unit which is utilized at the blasting site in this case study operates for an average of 35 min (to produce and load 11 boreholes with ANFO). During this period, the mobile unit consumes an average of 32.5 dm3 of diesel oil. Given the diesel oil’s density of approximately 0.8325 MJ kg−1 and its calorific value of 42.6 MJ kg−1, the total mass of diesel combustion is 18.85 kg. This combustion results in a total energy output of 803.01 MJ [47].
However, considering the efficiency of diesel engines, which is typically around 38%, the effective energy available for the loading process is approximately 305.14 MJ. This energy estimation underscores the relatively lower energy demands of the loading phase compared to the drilling phase in blasting operations and is close to the energy range of 327.76 MJ to 491.63 MJ stored in explosives.
Analyzing the overall energy consumption of the loading and drilling process, detailed in Table 7 and Figure 6, it can be stated that drilling and loading actions require around 970.95 MJ of energy. The calculated value of energy consumption which is derived from loading and drilling actions is 2.5–3 times greater than the energy released from the explosive material which is subjected only to quarrying. However, the main difference is the process duration. In terms of the explosive decomposition reaction, the energy release is abrupt, which results in rock fragmentation.

3.1.3. Evaluation of Energy Consumption of Loading and Drilling Operations

Blasting operations are a critical component of mining activities, serving as a fundamental method for breaking rock and facilitating the extraction of mineral resources. These operations encompass a series of processes, including drilling, explosive loading, and detonation, each contributing to the overall efficiency and effectiveness of the mining process. However, these operations also result in the generation of fumes and emissions, which pose significant health, safety, and environmental challenges.
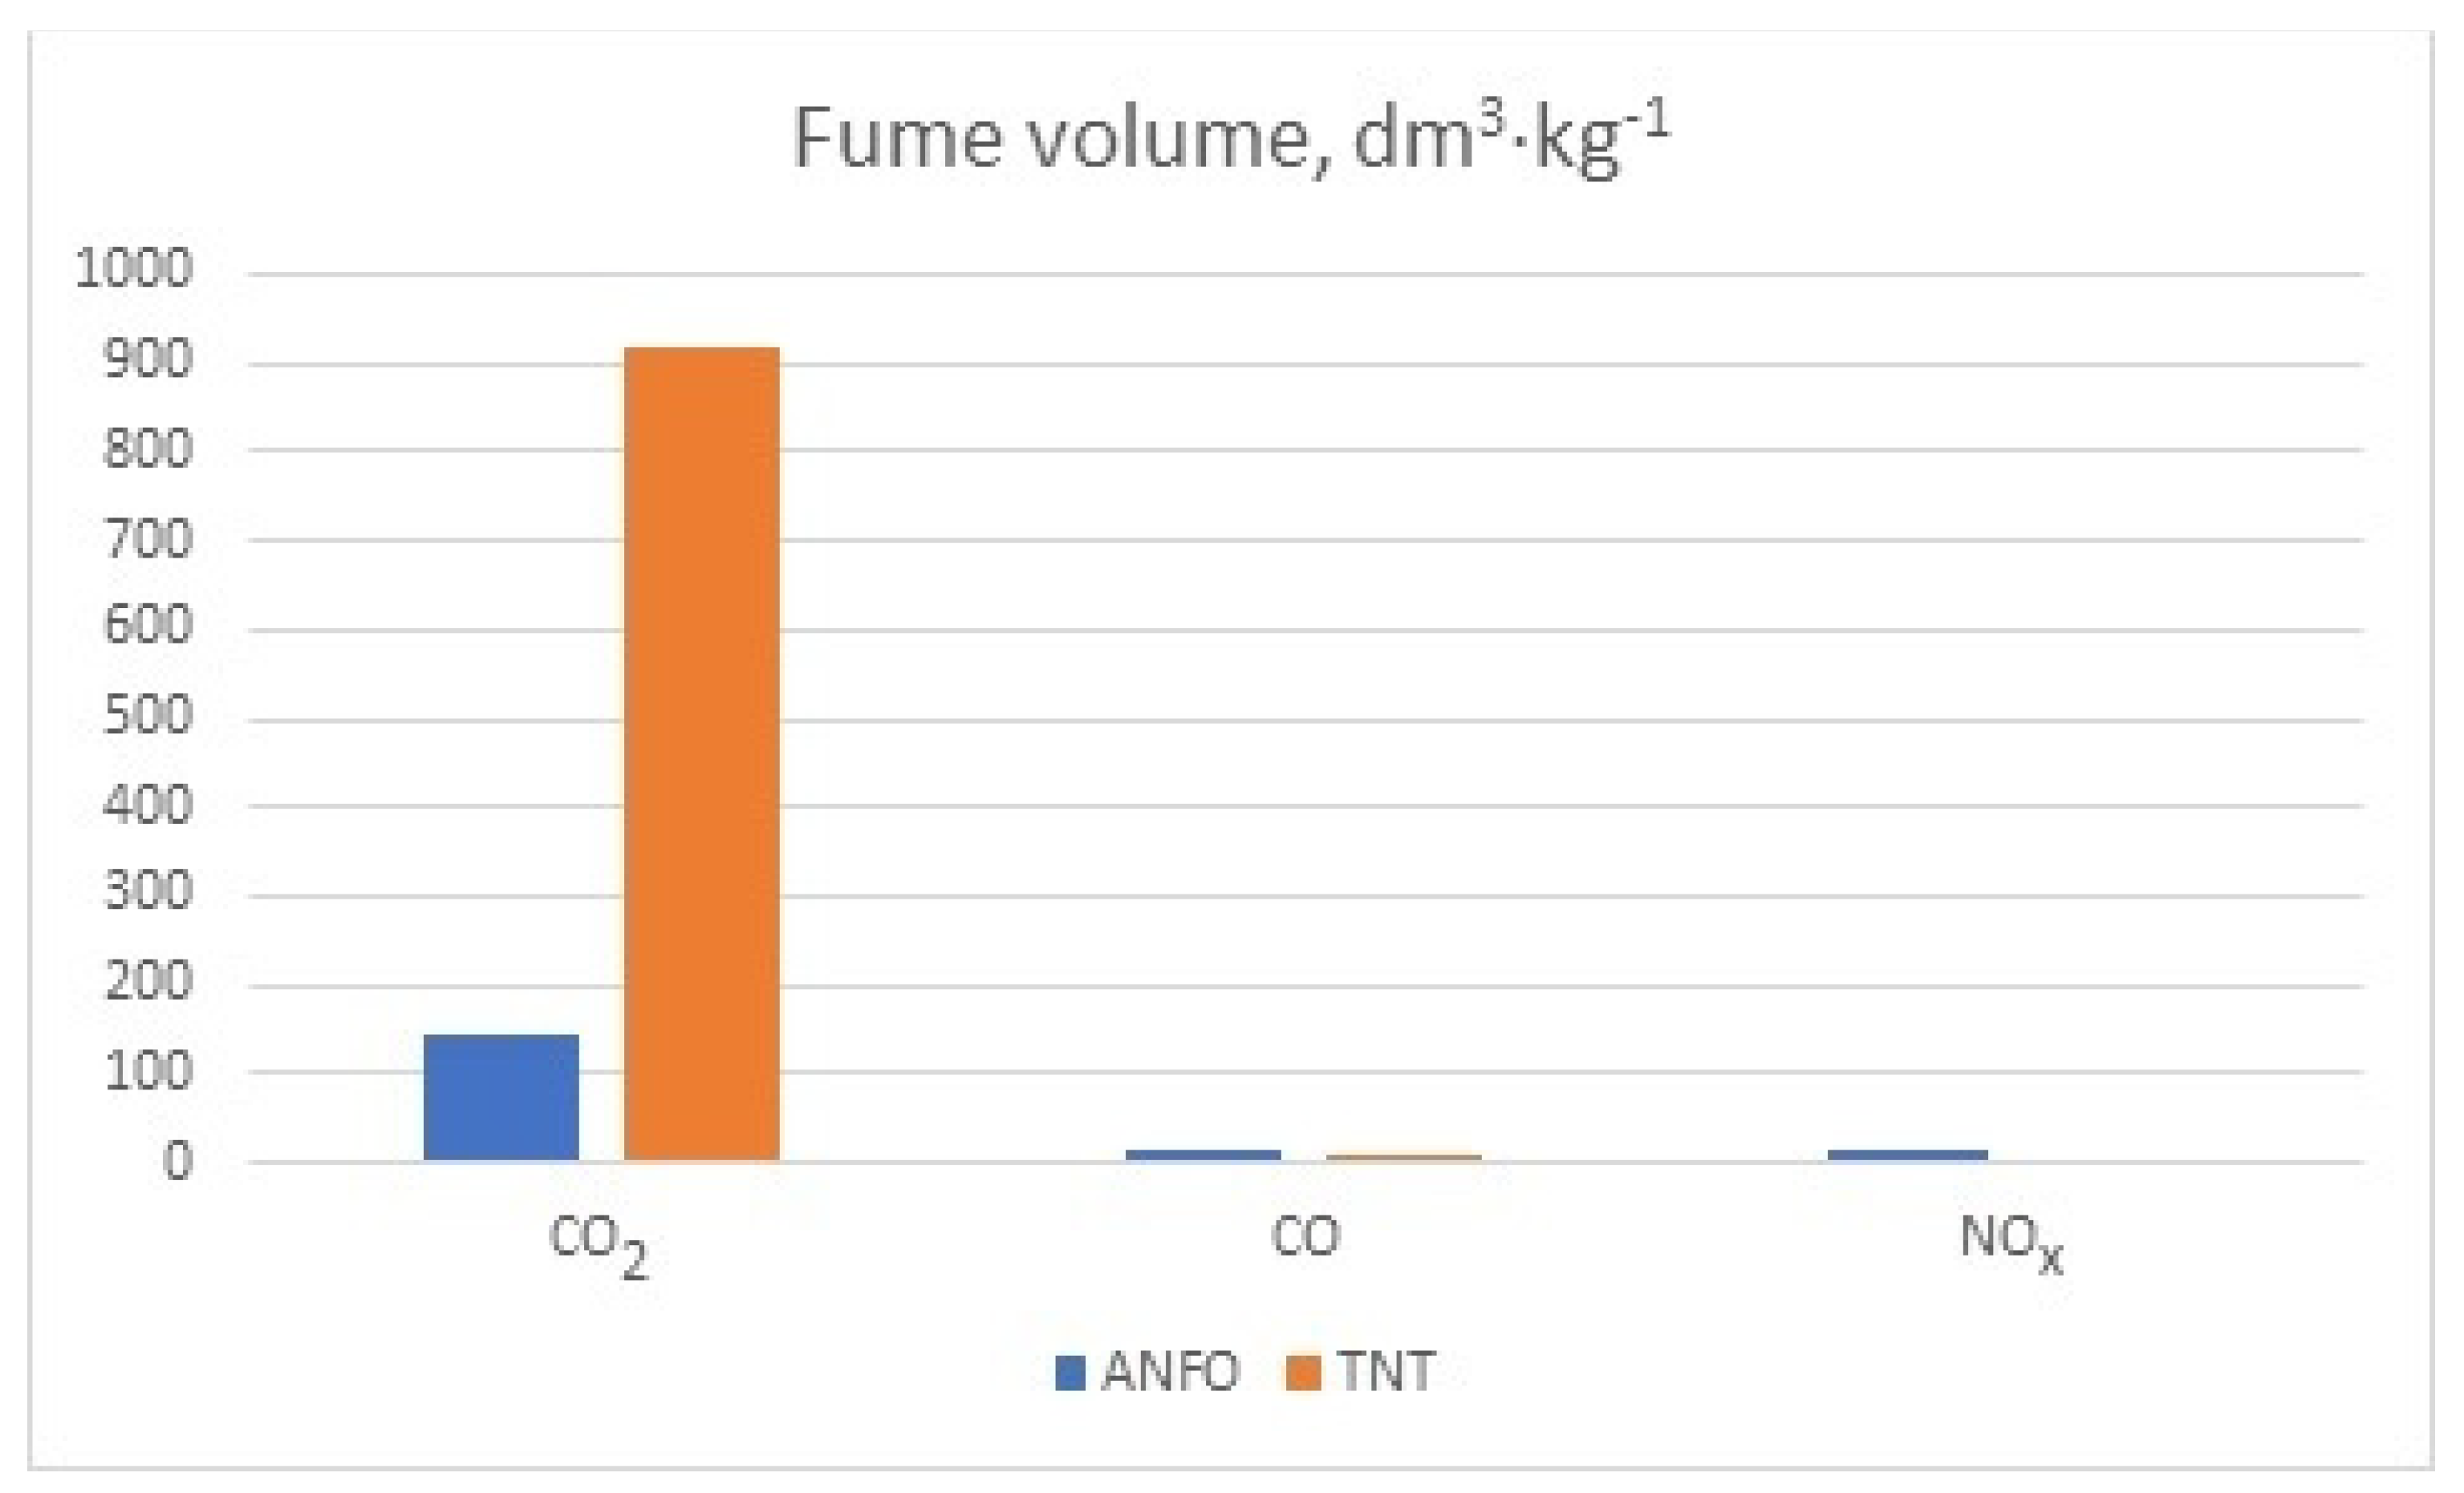
The detonation of explosives in mining leads to the production of various fumes, the composition of which is influenced mainly by the type of explosive used and the efficiency of the detonation process. The composition of the fumes generated by the detonation of the applied explosives—ANFO (ammonium nitrate fuel oil) and TNT (trinitrotoluene)—is detailed in Table 8.
According to Table 7, the detonation of the explosives that were applied in series (ANFO and TNT) resulted in the release of various gaseous byproducts. The volumetric emissions per kilogram of ANFO were as follows: 144.5 dm3 of carbon dioxide, 16.4 dm3 of carbon monoxide, and 13.1 dm3 of NOx., as detailed in Table 8 and Figure 7. In comparison to ANFO, 1 kg of TNT generated 919.6 dm3 of CO2, 11.5 dm3 of CO, and 4.8 dm3 of NOx.. The observed disparity in carbon dioxide emissions between ANFO and TNT can be attributed to the oxygen balance inherent in these explosives. ANFO exhibits an approximately zero oxygen balance, leading to a more complete combustion process and, consequently, lower fume concentrations. Conversely, TNT possesses an oxygen balance of approximately −74%, indicating an oxygen-deficient decomposition reaction which results in a higher volume of carbon oxides (COx). Moreover, the chemical structure of the explosive significantly influences the composition and volume of the fumes generated. TNT’s molecular configuration is rich in carbon atoms, accounting for its substantial CO2 output. In contrast, ANFO’s composition is nitrogen-rich, contributing to its distinct fume profile which includes higher nitrogen oxides. For a combined detonation of 412.5 kg of explosives, the estimated total fume volumes produced were 63.87 m3 of CO2, 6.74 m3 of CO, and 5.36 m3 of NOx.
The emissions of NOx and CO resulting from diesel combustion during drilling and loading operations were assessed based on parameters outlined in the literature, particularly referencing standards such as the Tier and Final stage. The assessment considered the engine horsepower and age for both the drilling rig and the Mobile Explosive Manufacturing Unit. In the case of the drilling rig, the NOx emission was evaluated to be 50 g·h−1 and CO 187.5 g·h−1.The drilling of 11 boreholes required 256 min. This resulted in the emission of 0.21 kg of NOx and 0.8 kg of CO. The combustion of diesel generated 2.67 kg of CO2 per liter. For 41.13 kg of diesel fuel consumed, the CO2 emission was 109.8 kg of CO2.
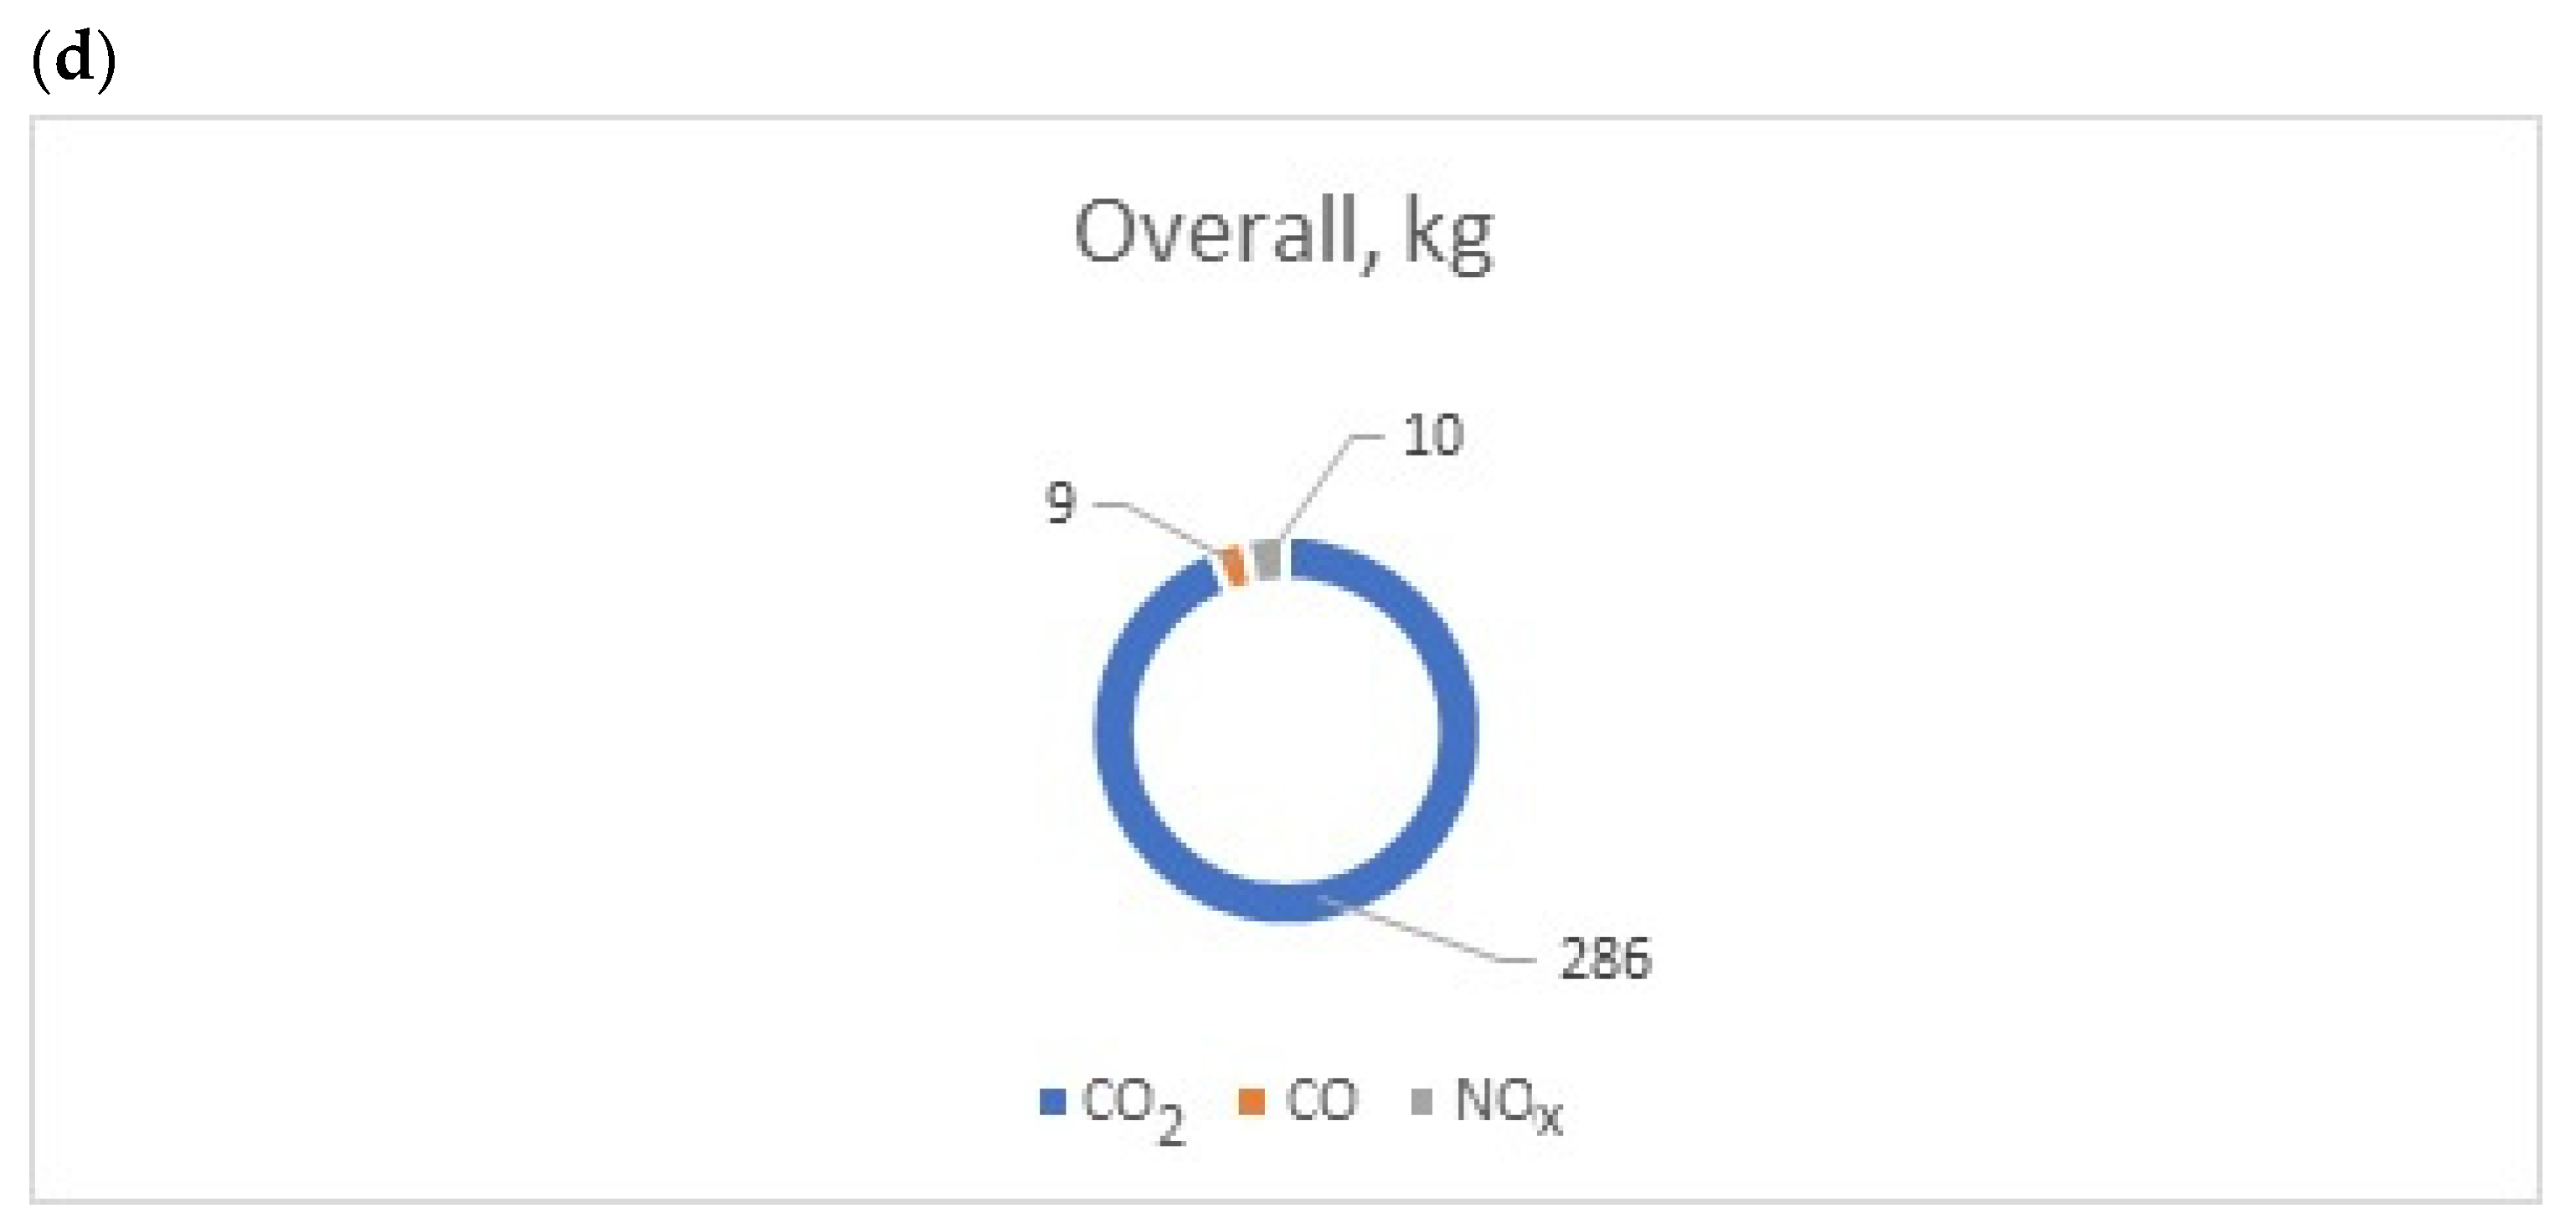
In the case of loading operations, the NOx emission was evaluated to be 60 g·h−1 and CO 225 g·h−1. The loading process lasted for 35 min, resulting in the following emissions: 0.0348 kg of NOx, 0.1305 kg of CO, and 50.3 kg of CO2. Combining the emissions from drilling and loading operations with those from the detonation of explosives, the total emissions were calculated as follows: 10.48 kg for NOx, 8.61 kg (density 1.91 g·dm−3 based on [48]) for CO, and 286.34 kg for CO2, as detailed in Table 9 and Figure 8.
This analysis revealed that, while drilling and loading operations contribute to fume emissions, the detonation process is the primary source of rapid and concentrated fume emissions, particularly impacting air quality in the vicinity of the blast site. Unlike the gradual emission and dispersion from drilling and loading, the sudden release of gasses during detonation poses a more immediate hazard to workers and necessitates stringent safety measures.

3.2. Mechanical Excavation

3.2.1. Evaluation of Mechanical Excavation’s Energy Consumption

Mechanical excavation in open-pit mining involves the use of various types of heavy machinery and equipment, each contributing to the total energy consumption of the mining operation. The energy usage in such operations is primarily dependent on the types of machinery employed, the nature of the deposit, the scale of the mining activities, and the operational practices followed. In the specific case study examined, gypsum excavation was conducted through the coordinated operation of a crawler bulldozer and a crawler excavator. It is noteworthy that hauling operations were not considered within the scope of this analysis, since they remain a requisite of both mechanical and blasting excavation methods. In general, energy consumption from mechanical excavation can be presented according to Equations (10) and (11):
E M E = E R + E E + E O E
E M E = m i ( η m i V F O _ m i d F O m i C V F O m i )
In the above equations, the following definitions are used:
E M E is a total sum of energy consumption from mechanical excavation, MJ;
E R is the energy consumption from ripping operations by dozer, MJ;
E E is the energy consumption from excavation operations by a backhoe with a skidder, MJ;
E O E is the energy consumption from oversize excavation operations by a backhoe with a skidder, MJ;
η m i is the total efficiency of the powertrain of all machines in the technological system, %;
V F O m i _ is the average volume of combusted diesel oil in dm3 h−1;
d F O m i is a fuel oil density, dm3 h−1;
C V F O m i is a calorific value of combusted fuel oil in MJ kg−1.
According to Table 3, the average fuel consumption for the Caterpillar D9R crawler dozer and the Caterpillar 330DL excavator is 26.76 dm3 h−11 and 22.76 dm3·h−1, respectively. Considering the work hours needed to excavate 12,779 tons of gypsum (assuming only excavation with no additional maneuvering) and the average fuel consumption of each machine, the total diesel fuel required amounts to 6781.38 kg (3285.27 kg for Caterpillar 330DL and 3496.10 kg for Caterpillar D9R).
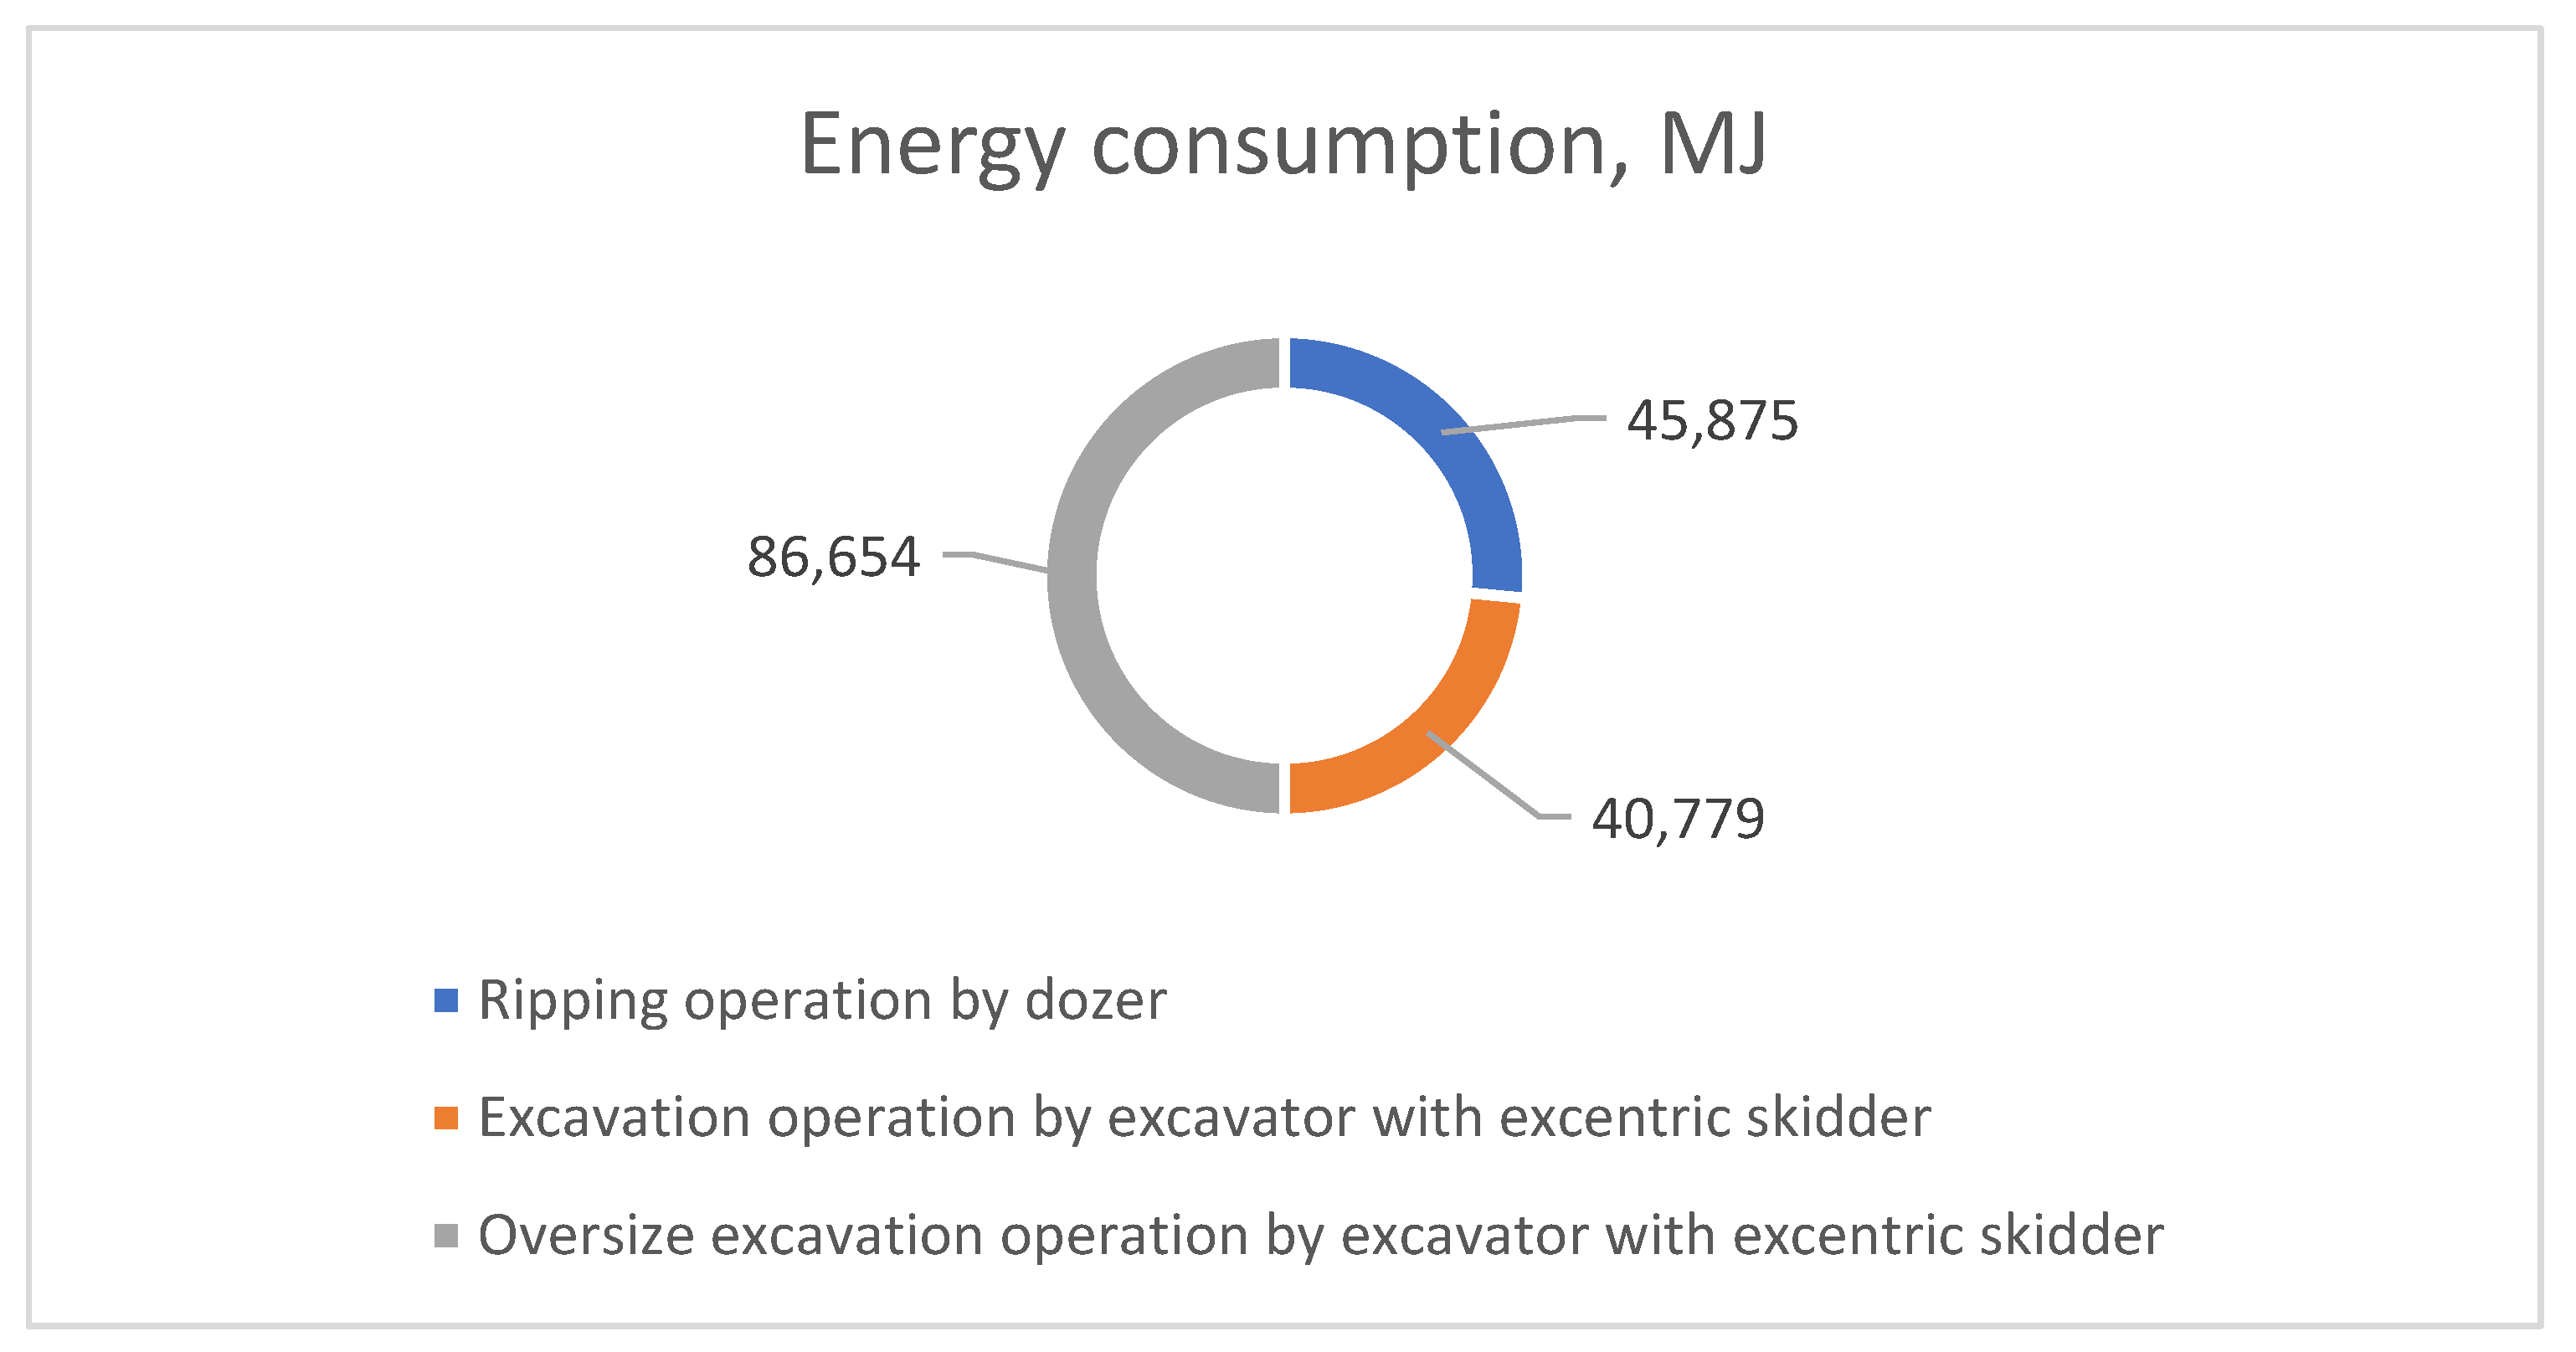
Given the average density of diesel fuel at 0.8325 kg·dm3 and a diesel calorific value of 42.6 MJ·kg, the total energy consumption for Caterpillar 330DL, factoring in its transmission system efficiency of 35%, was 40,778.71 MJ. For Caterpillar D9R, the energy consumption, based on a diesel consumption of 3496.10 kg and a transmission efficiency of 37%, amounted to 45,875.43 MJ. Consequently, the total energy consumption for mechanical excavation operations (ripping and quarrying) was 86,654.15 MJ, as shown in Table 10 and Figure 9.

3.2.2. Evaluation of the Fumes Generated by Mechanical Excavation

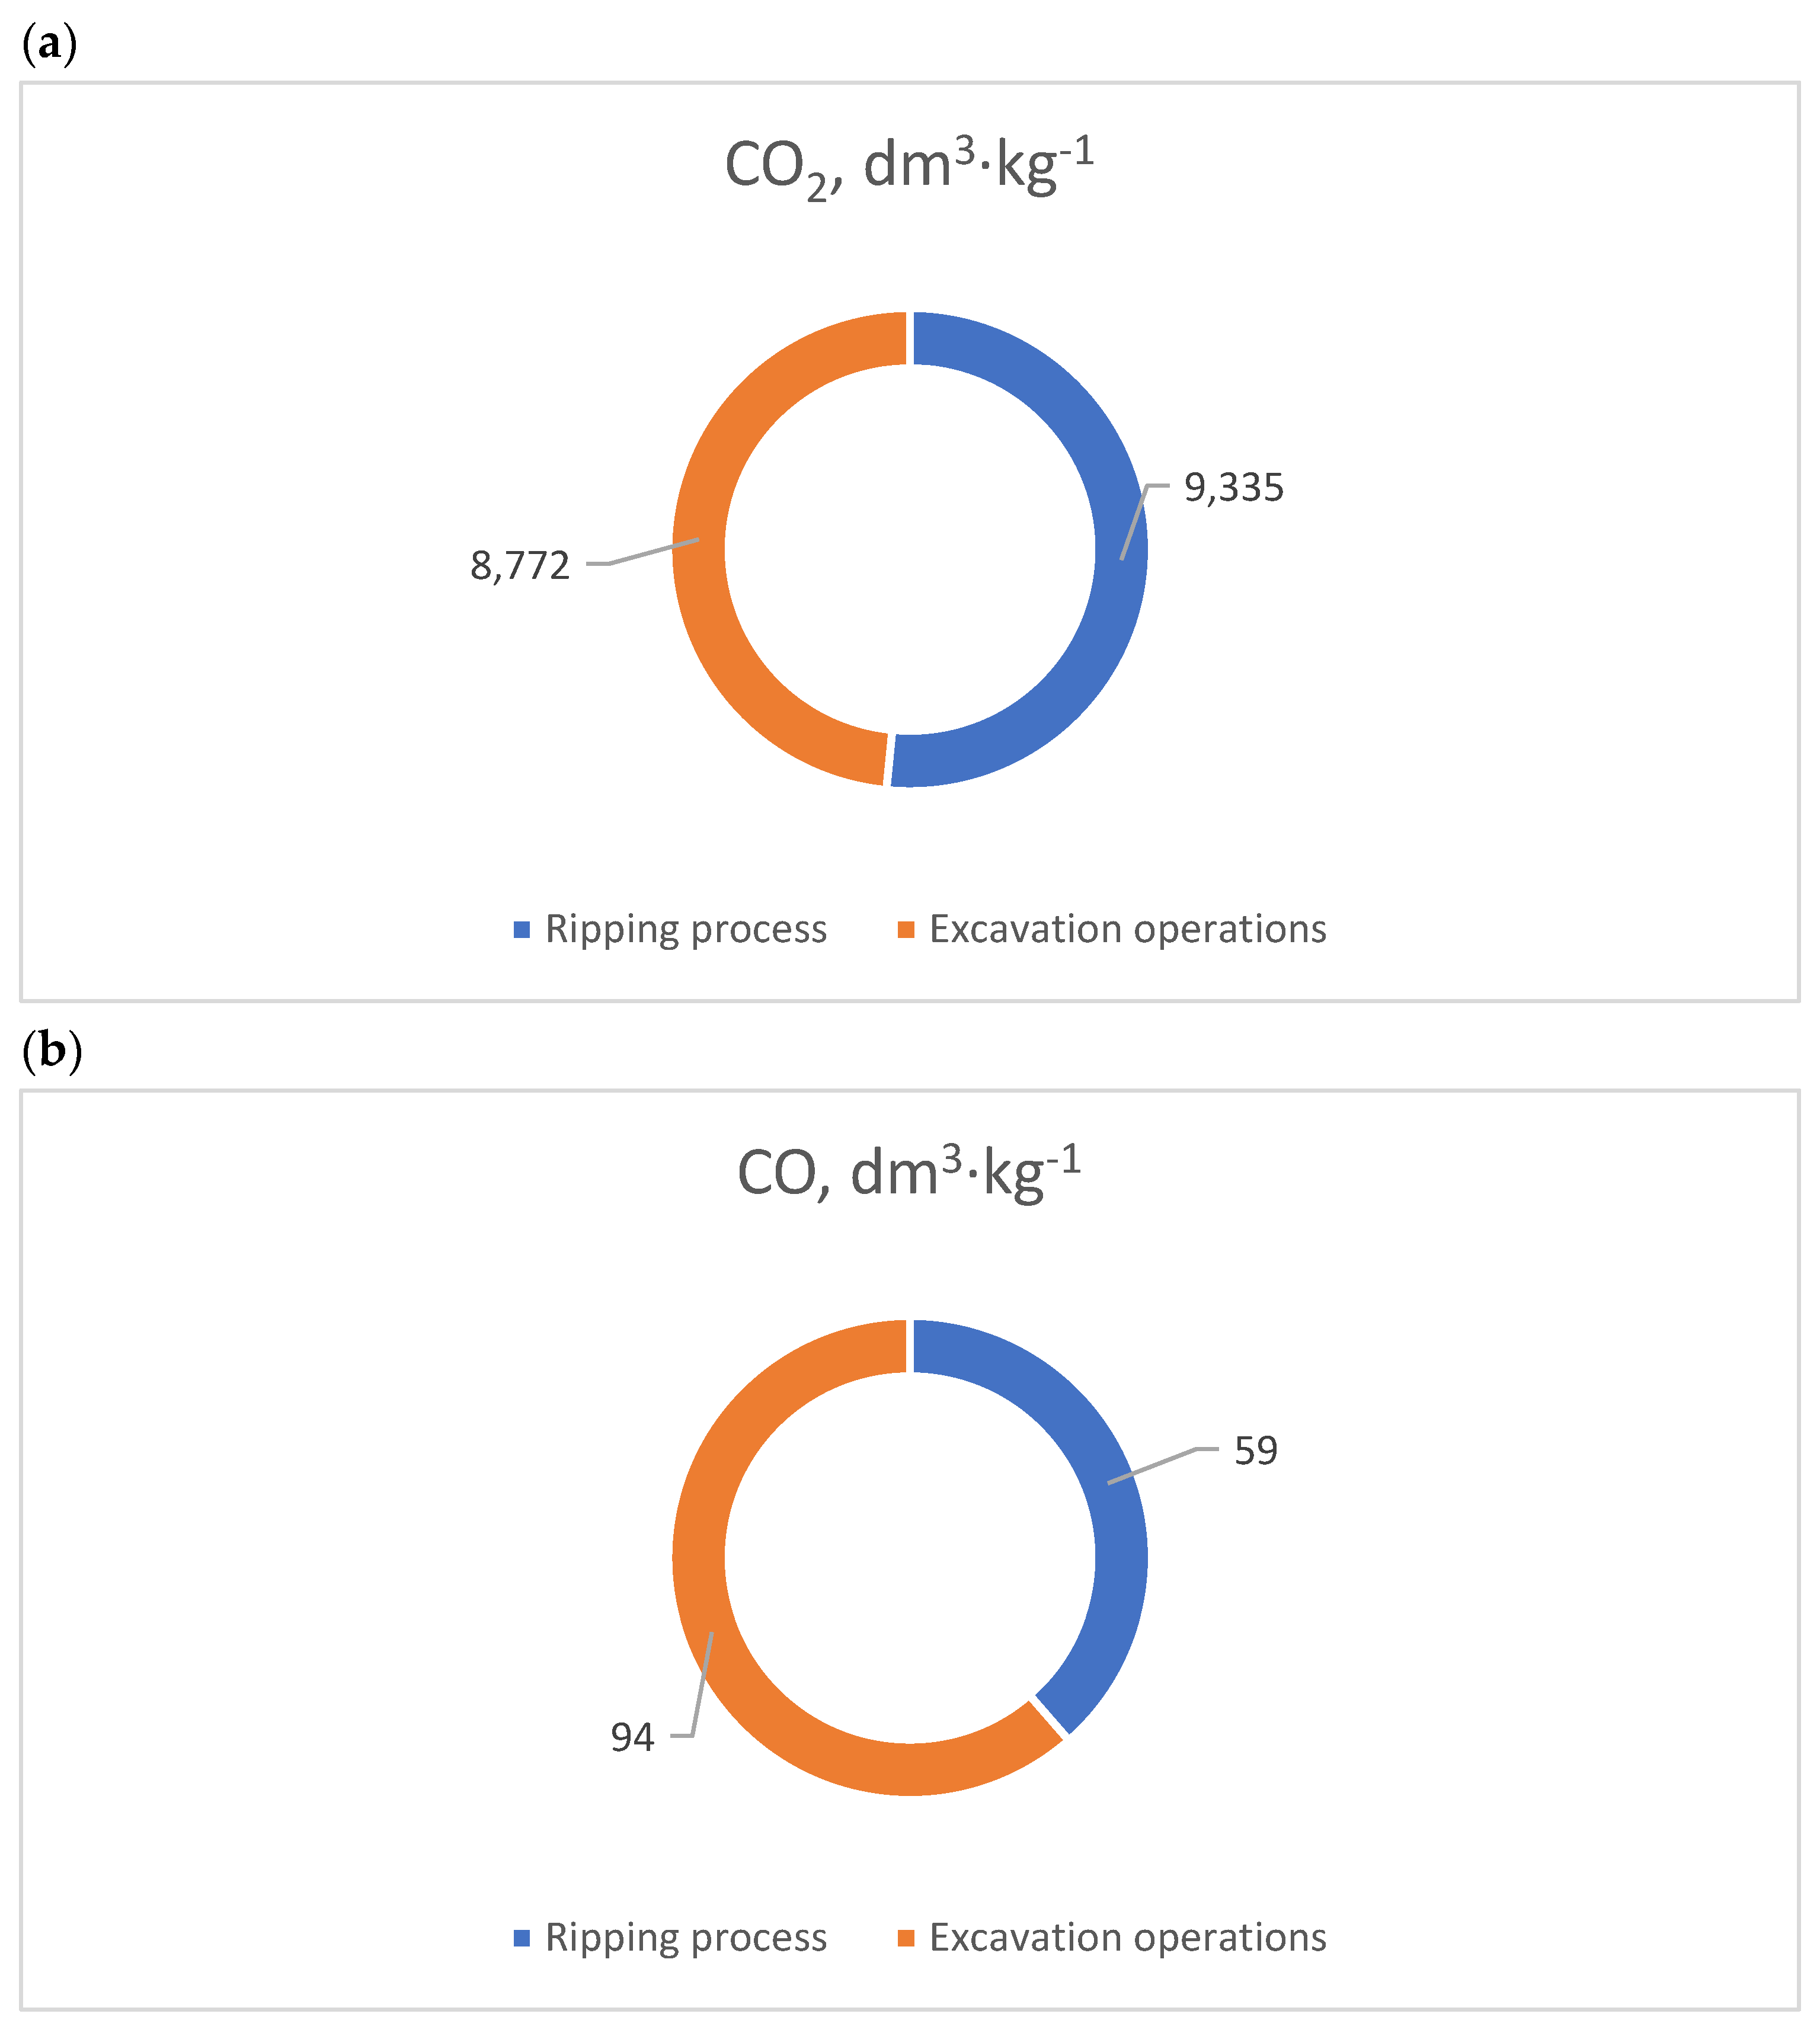
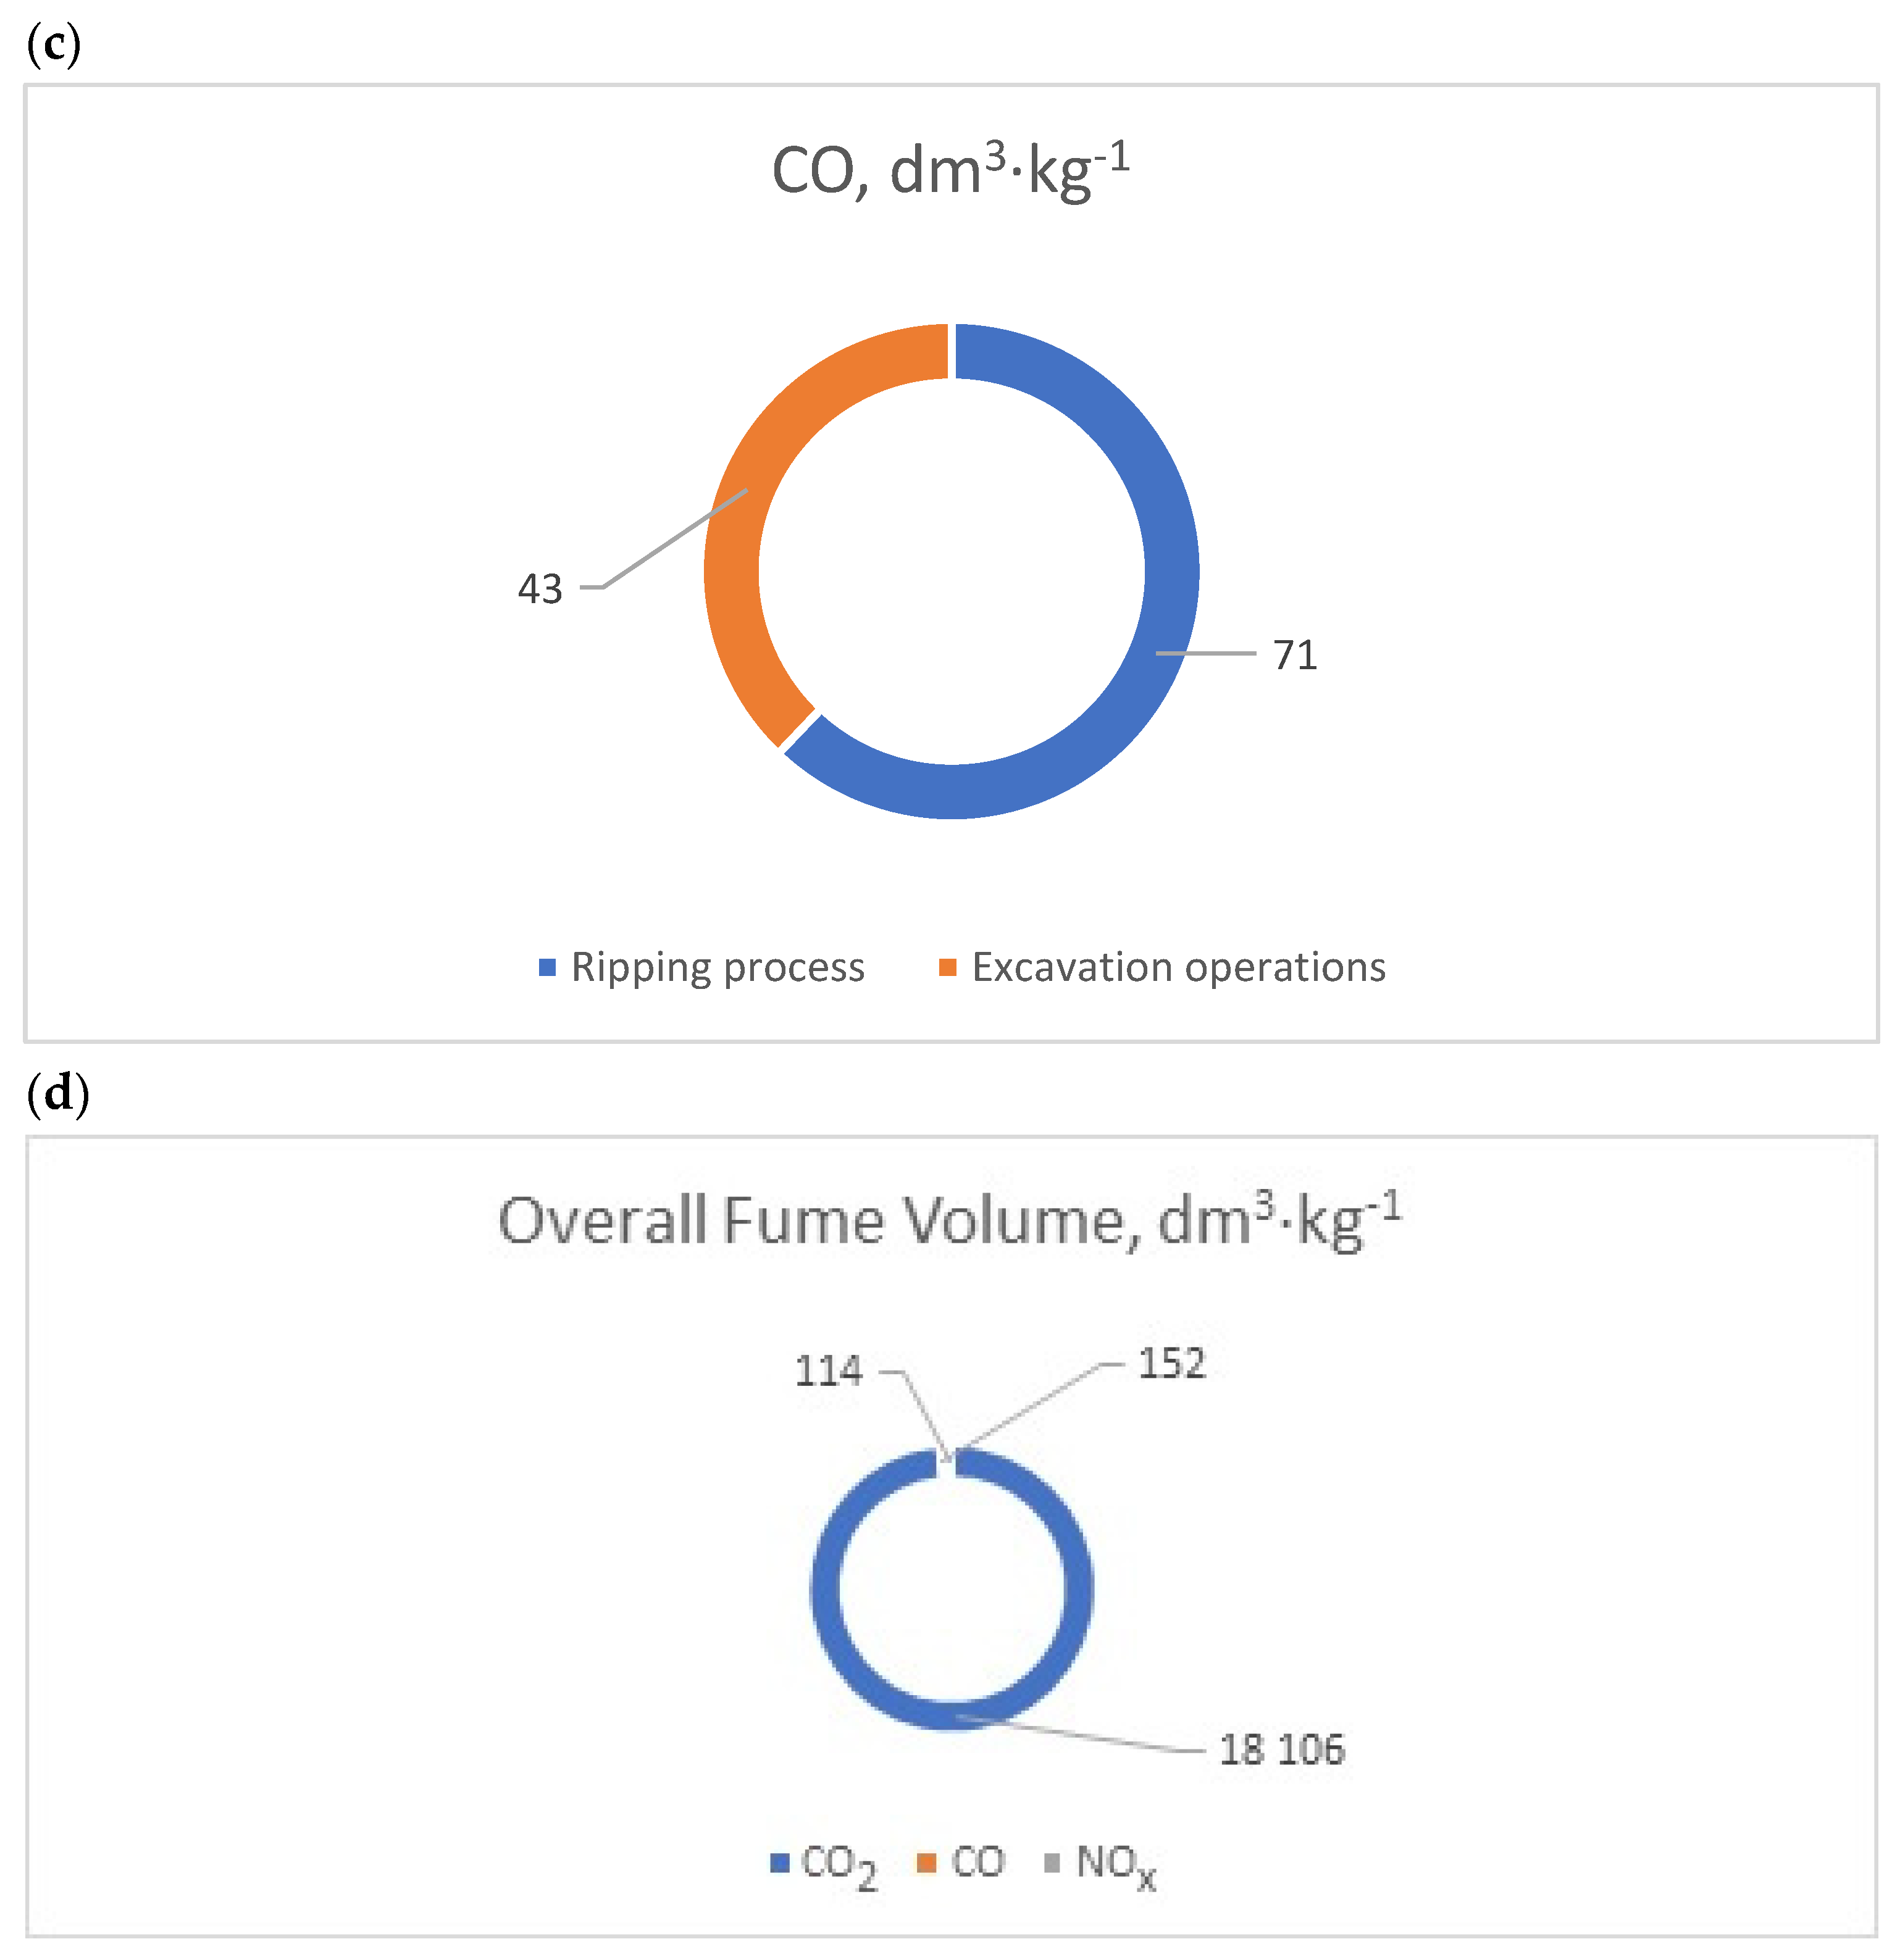
The emissions of NOx and CO resulting from diesel fuel combustion during mechanical excavation were evaluated using the parameters defined in [40] and according to Equation (11). The analysis considered both gross power and operational hours for the Caterpillar D9R dozer and the Caterpillar 330DL hydraulic excavator. For Caterpillar D9R, the base fume emissions were estimated at 543.6 g h−1 for NOx and 450 g h−1 for CO. With an average operational time of 130.6 h, this resulted in emissions of approximately 71.00 kg of NOx and 58.78 kg of CO (Table 11). Additionally, the combustion of 1 dm3 of diesel fuel emits approximately 2.67 kg of CO2, leading to an estimated CO2 emission of 9334.60 kg for the dozer during mechanical excavation. For the Caterpillar 330DL excavator, base emissions were estimated at 648 g h−1 for NOx and 300 g h−1 for CO. With an operational time of approximately 144.4 h, this resulted in emissions of approximately 93.56 kg of CO and 43.31 kg of NOx. The corresponding CO2 emissions were estimated at 8771.68 kg. Overall, the mechanical extraction of 12,779 tons of ore resulted in emissions of approximately 18,106.28 kg of CO2, 152.34 kg of CO, and 114.32 kg of NOx, as shown in Table 11 and Figure 10.

3.3. Comparison of Energy Consumption and Gas Emissions

The total energy consumption for drilling and blasting ranged from 1298.71 to 1452.58 MJ, as shown in Table 6, and, for mechanical mining, it equaled 173,308.30 MJ, as shown in Table 9. Despite the application of high-energy agents, the amount of energy required to extract the deposit was more than 100 times less than for mechanical excavation because of the accumulation of energy from the detonation in the mining process. For drilling and blasting, the most energy-consuming operation was borehole drilling (45.8% of the total energy), and the explosion itself consumed only 21.0% of the total energy of the extraction process. For the mechanical mining case, the energy required to extract the rock from the deposit was roughly equal to the energy consumption of re-crushing excessively large boulders produced during the extraction process. This is because properly adjusted blasting parameters allow one to obtain homogenous fragmentation of the extracted rock.
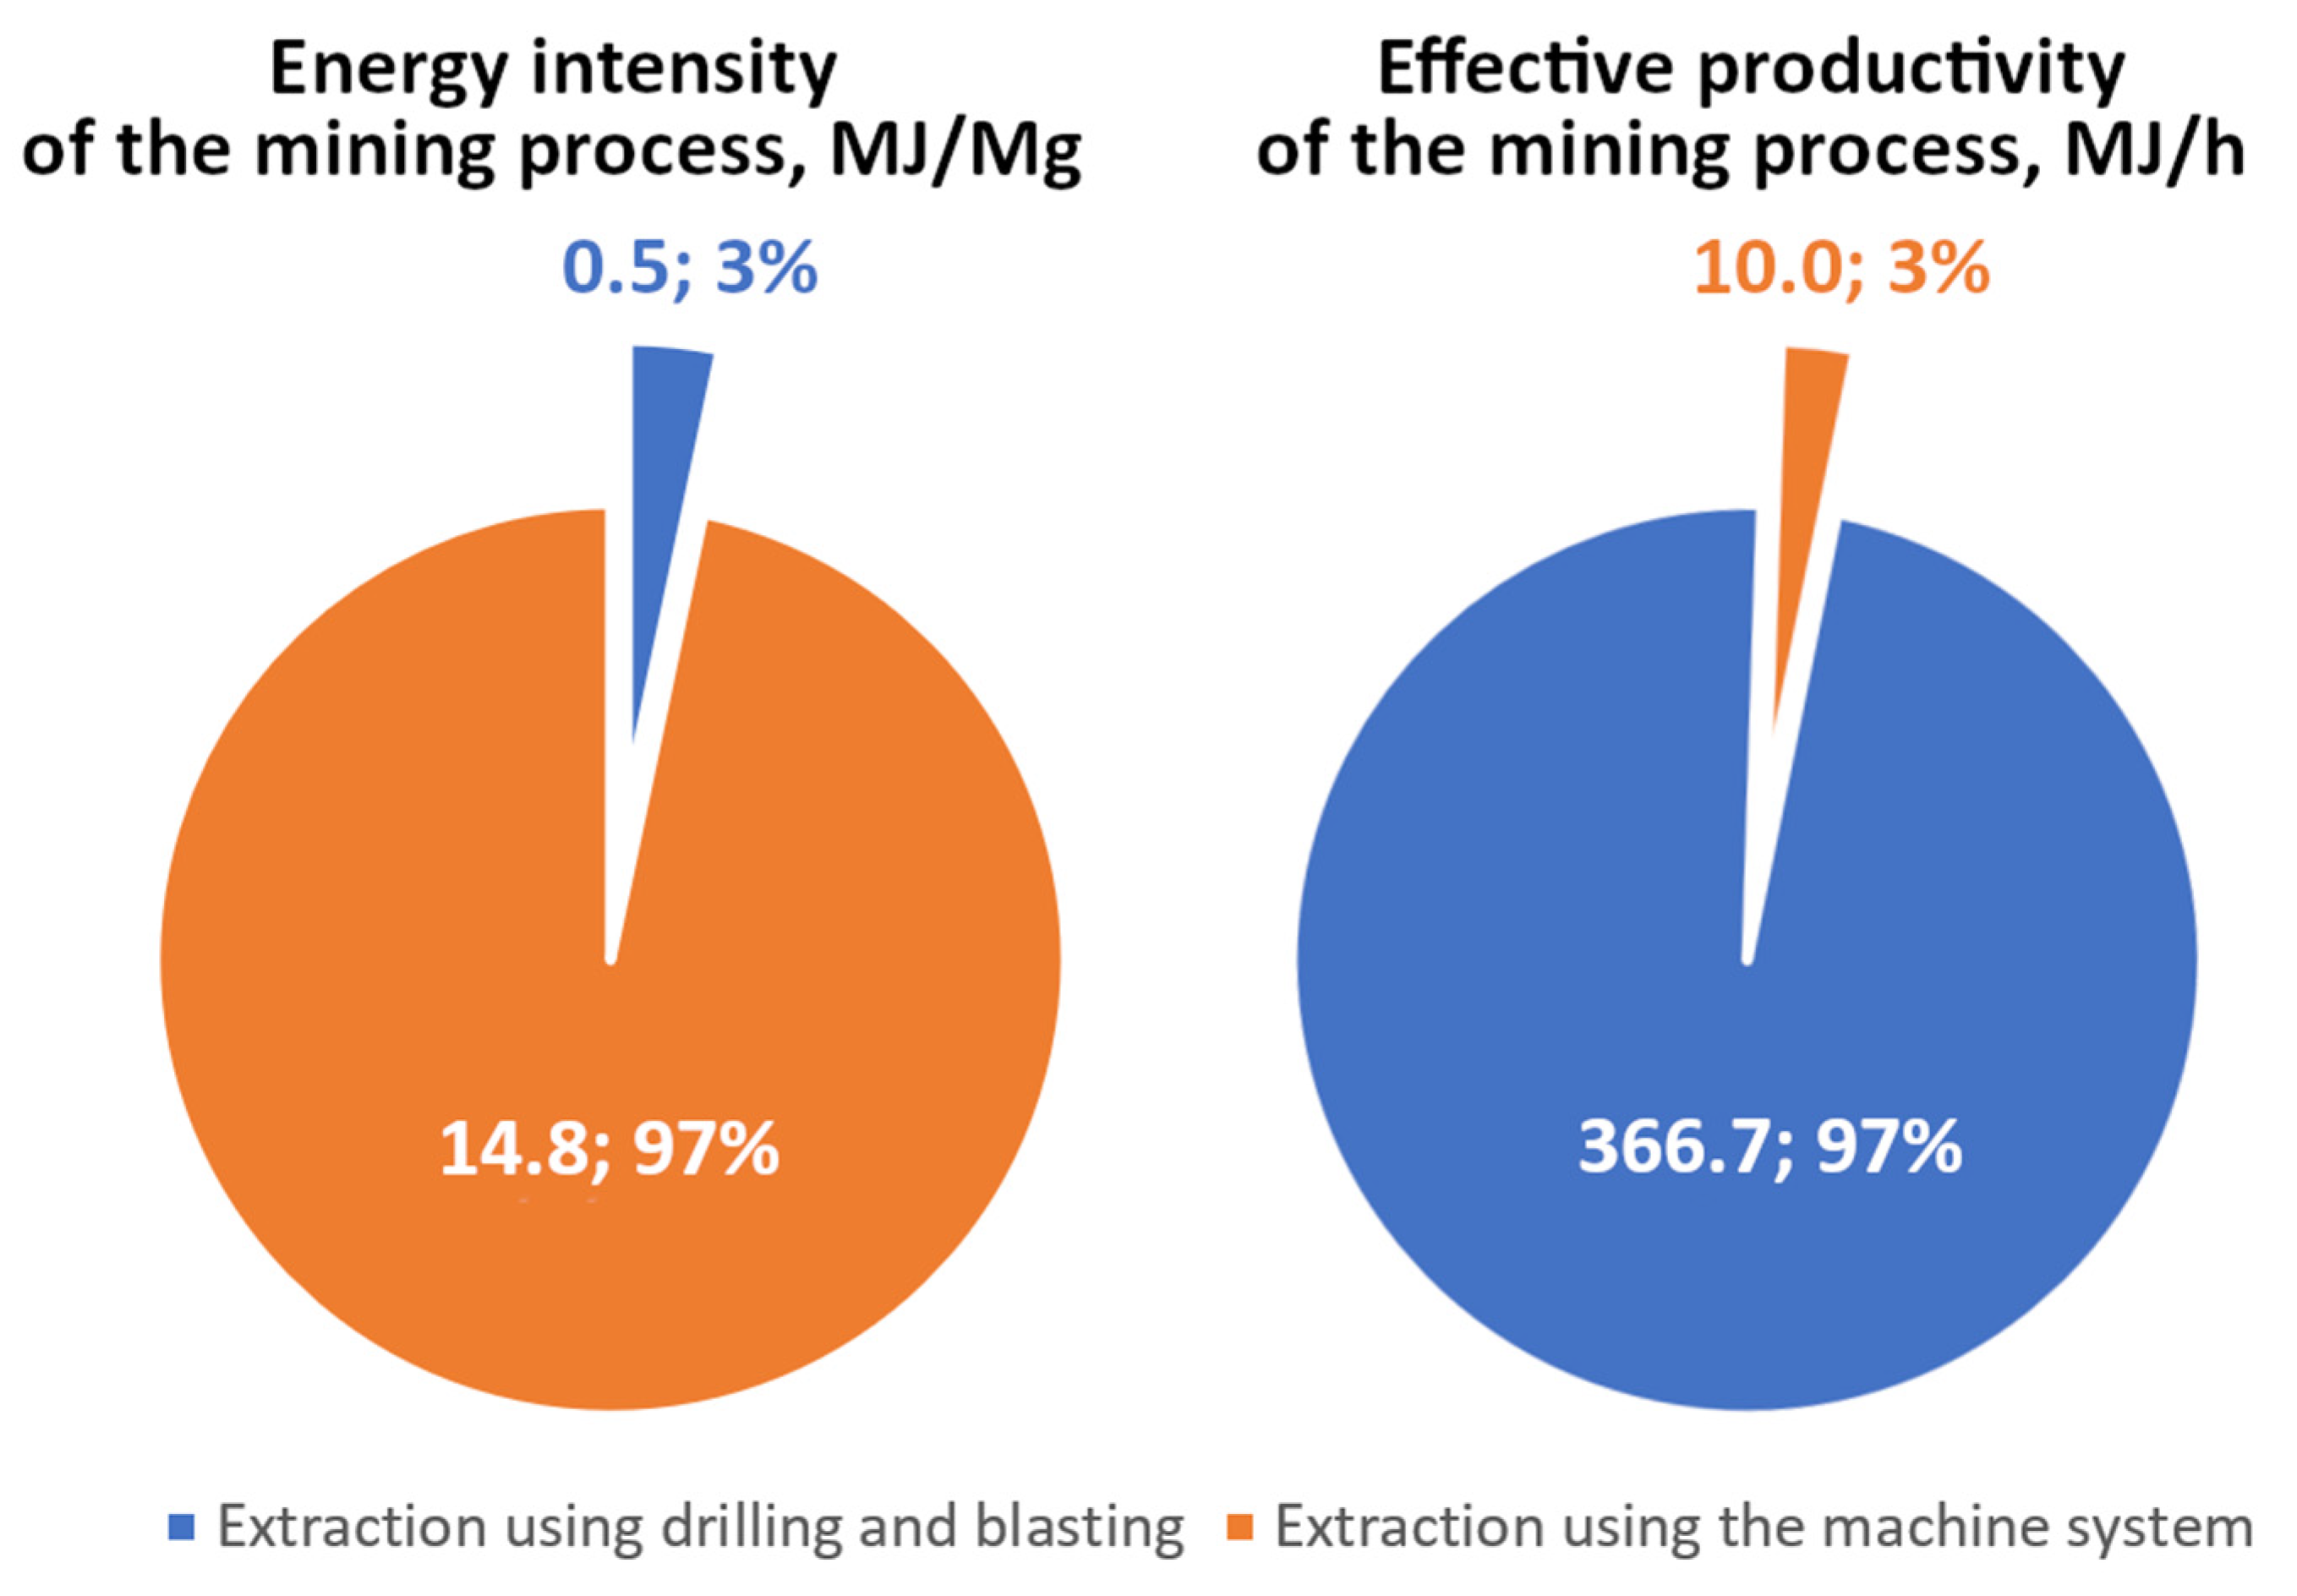
To compare the discussed mining techniques in terms of energy consumption, it was necessary to relate the impact of effective mining energy to the unit volume of the extracted deposit. Figure 11 shows the comparison of the energy intensity of the mining process and the effective productivity per hour for the analyzed mining techniques.
As can be seen from the analysis carried out for the process of mining with explosives and mechanical mining, these modes present an inversely proportional relationship regarding the energy required to mine part of the same deposit, Figure 11.
The total emission of fumes for drilling and blasting is 305.43 kg, as shown in Table 9, and, for mechanical mining, this equals 18,372.93 kg, as shown in Table 10. Although explosives produce an enormous amount of gaseous products per unit of mass, it has been found that the total amount of fumes produced in this process is more than six times less than for mechanical mining.
In both cases, carbon dioxide emissions are the highest. Considering blasting works, more nitrogen oxides are produced than carbon oxides, while the reverse applies to mechanical mining. It is evident that mechanical extraction results in significantly higher emissions, primarily due to the greater volume of diesel combusted. However, during the prolonged mechanical extraction process, these emissions are gradually dispersed into the environment.
The blasting technique, which involves drilling and explosive loading, results in the instantaneous release of high concentrations of fumes from explosive decomposition. This can pose significant occupational hazards to employees. However, despite being more energy-intensive (86,654.15 MJ) than blasting (1298.12 to 1462.22 MJ), mechanical extraction does not generate adverse environmental effects such as air blasts, blast-induced vibrations, or fly rocks. The absence of these effects is a major advantage of mechanical extraction. Nonetheless, it should be noted that the efficiency of mechanical extraction may decrease over time due to the potential wear and tear on technical equipment.

3.4. Prediction Model Results

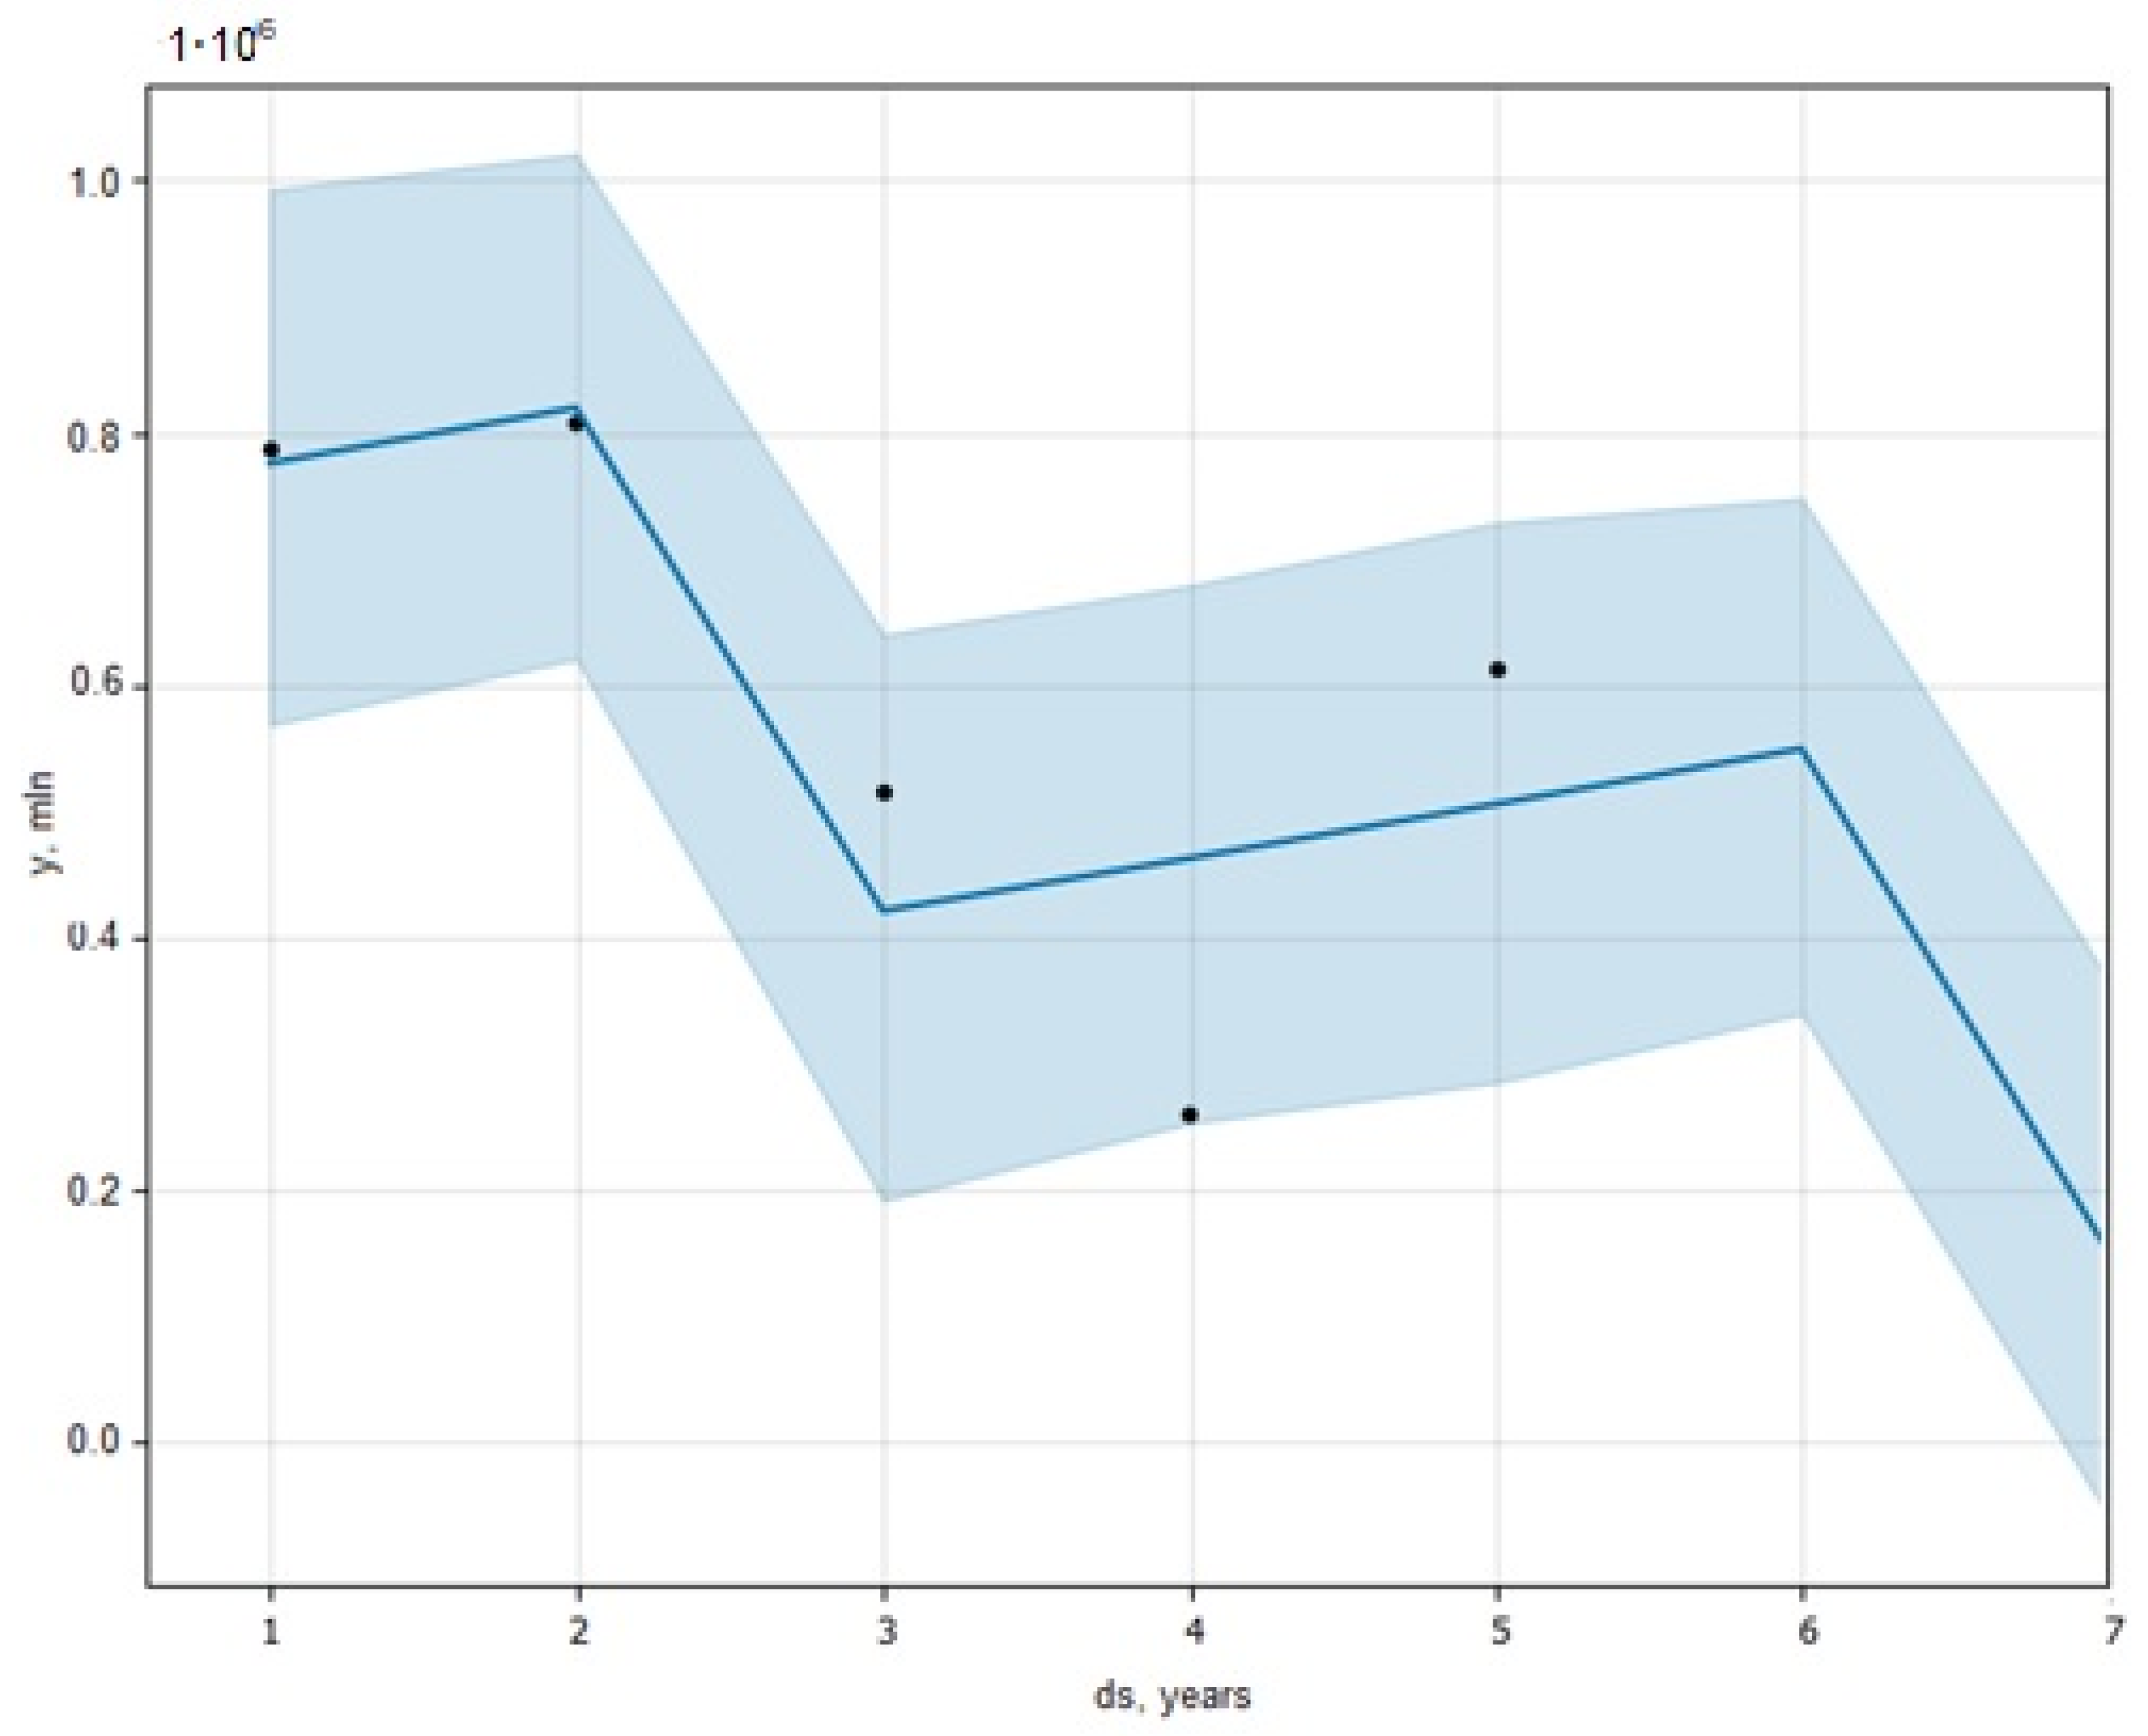
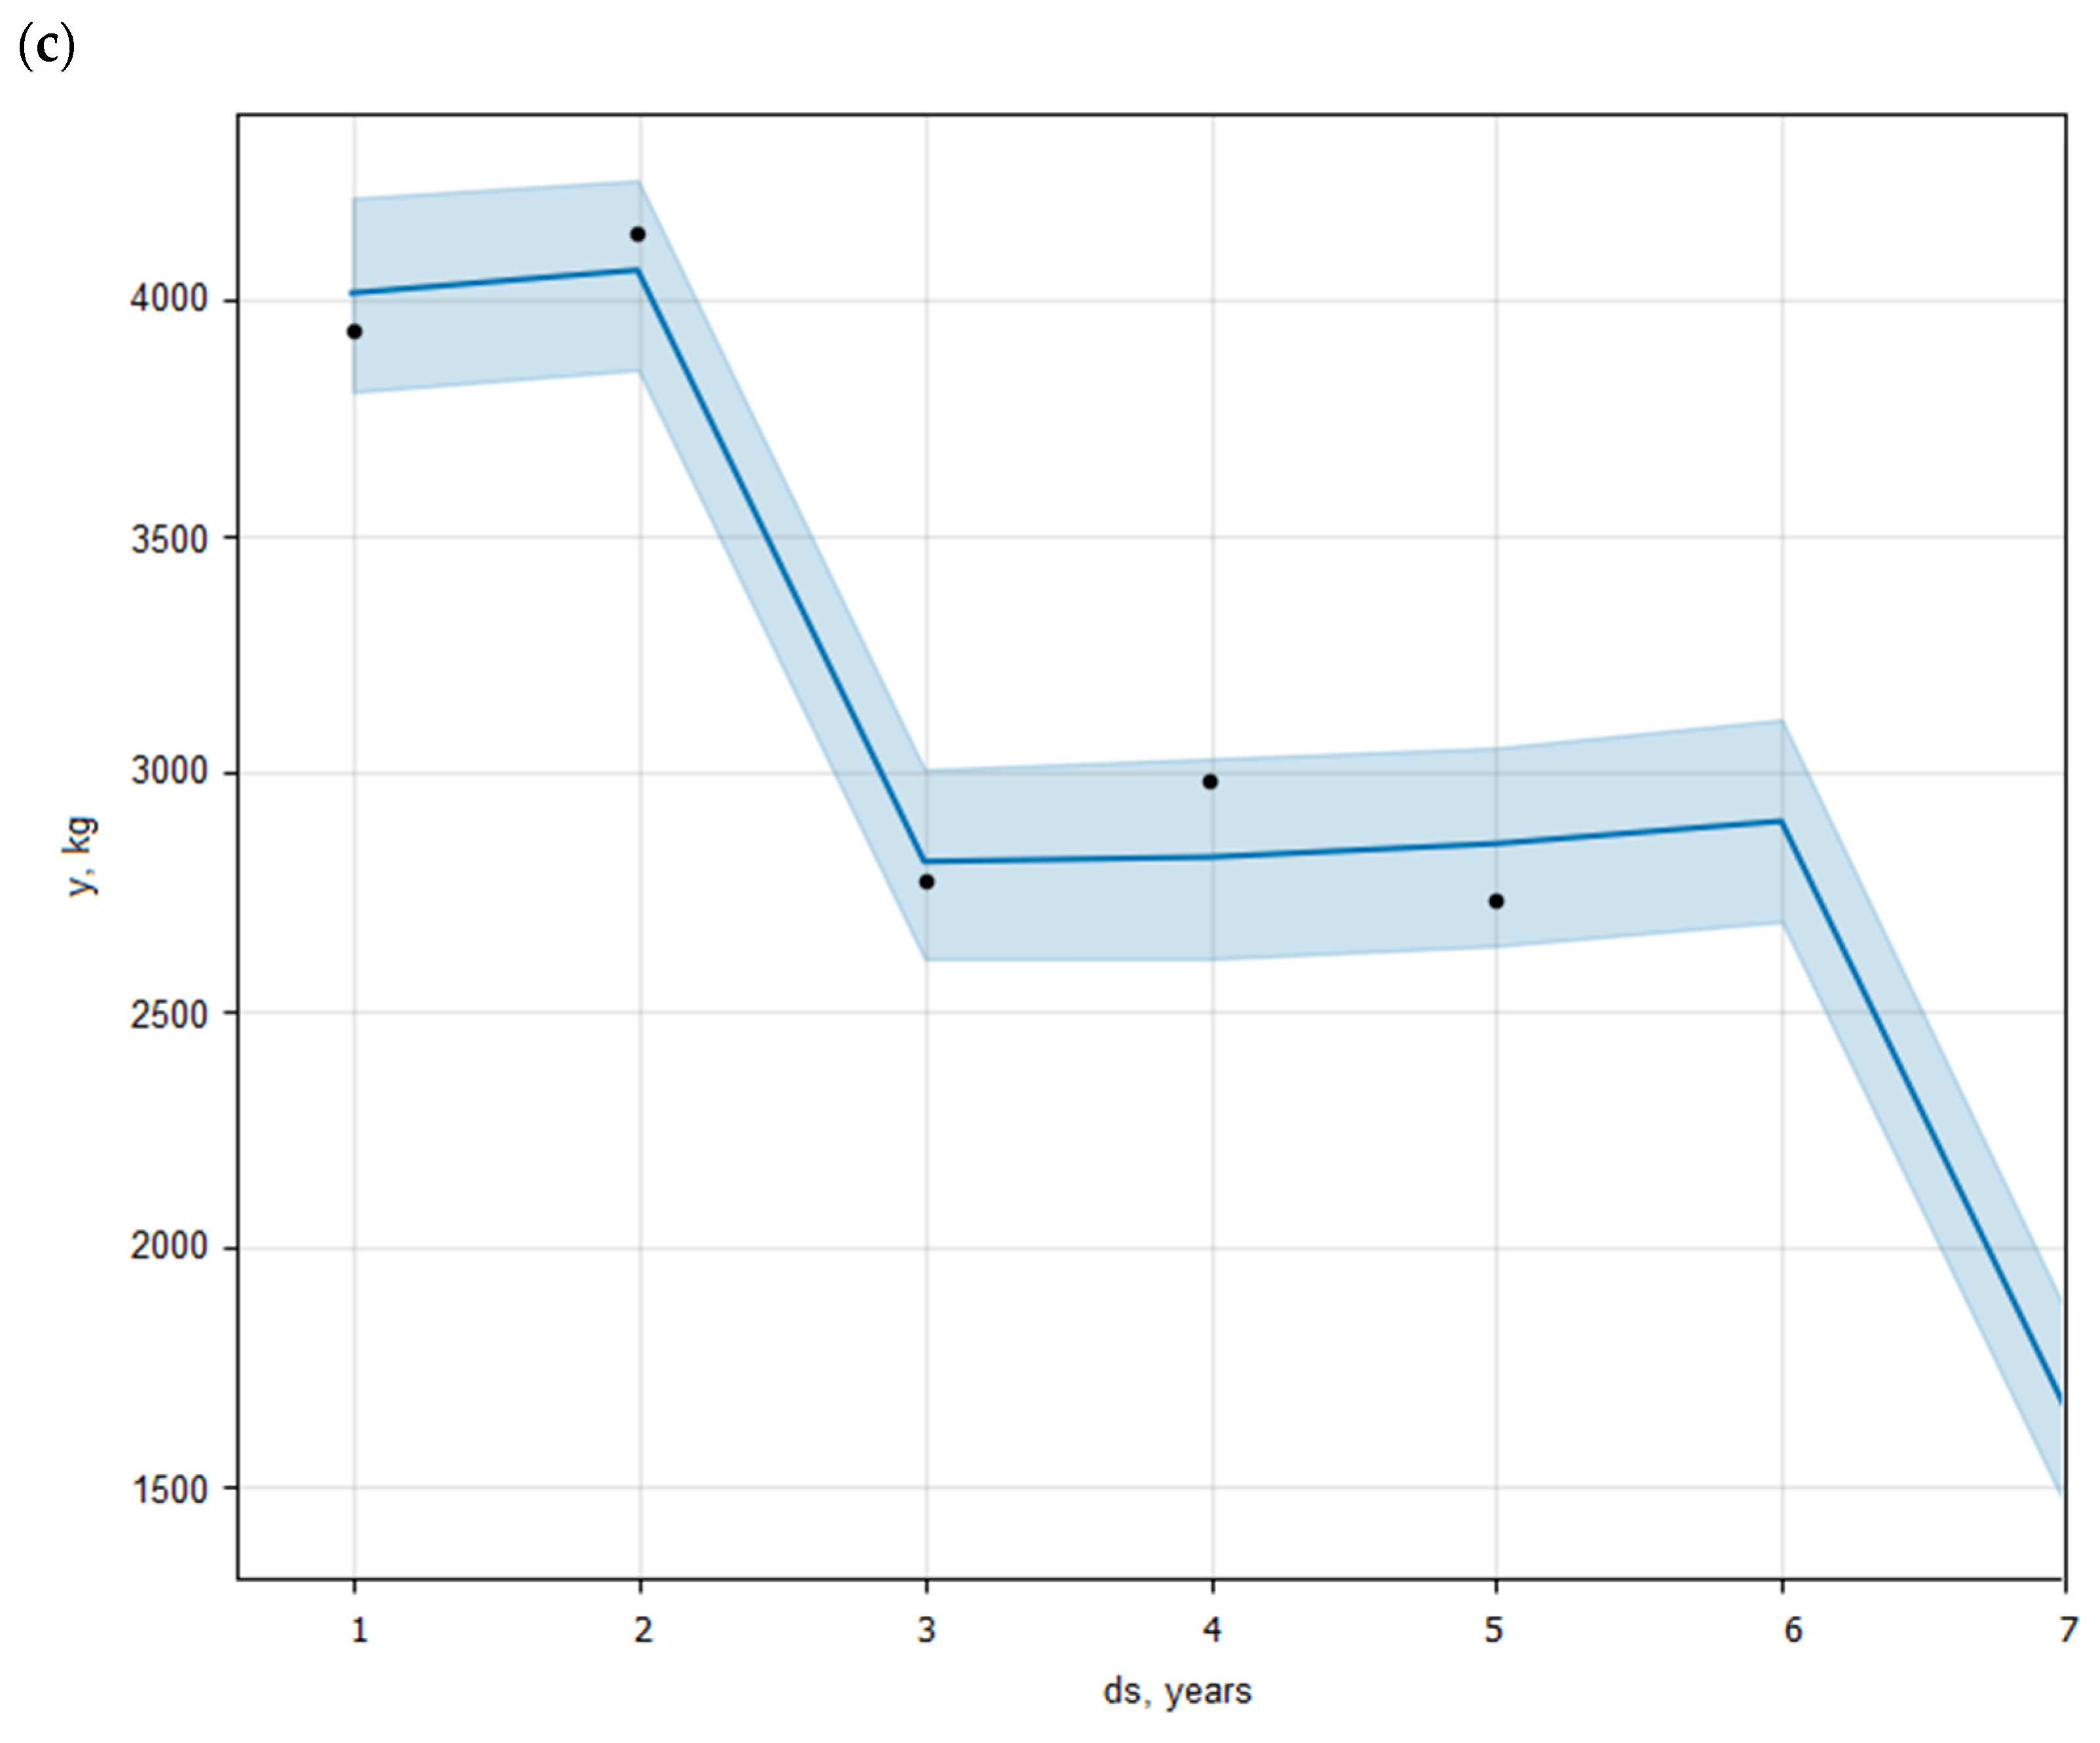
The prediction of the total extraction volume was made using a 5-year dataset of extraction records from the mine, as shown in Table 1.
In Table 12, a gradual decline in extraction volume can be observed, decreasing from approximately 800,000 tons to around 530,000 tons, with a slight recovery to 600,000 tons in the final year. Based on these trends, it is anticipated that extraction volumes will continue to decrease, as shown in Figure 12, due to the depletion of the deposit at the current operational levels of the open-pit mine. The opening of a new operational level or the development of a new excavation area could alter this predicted trend.
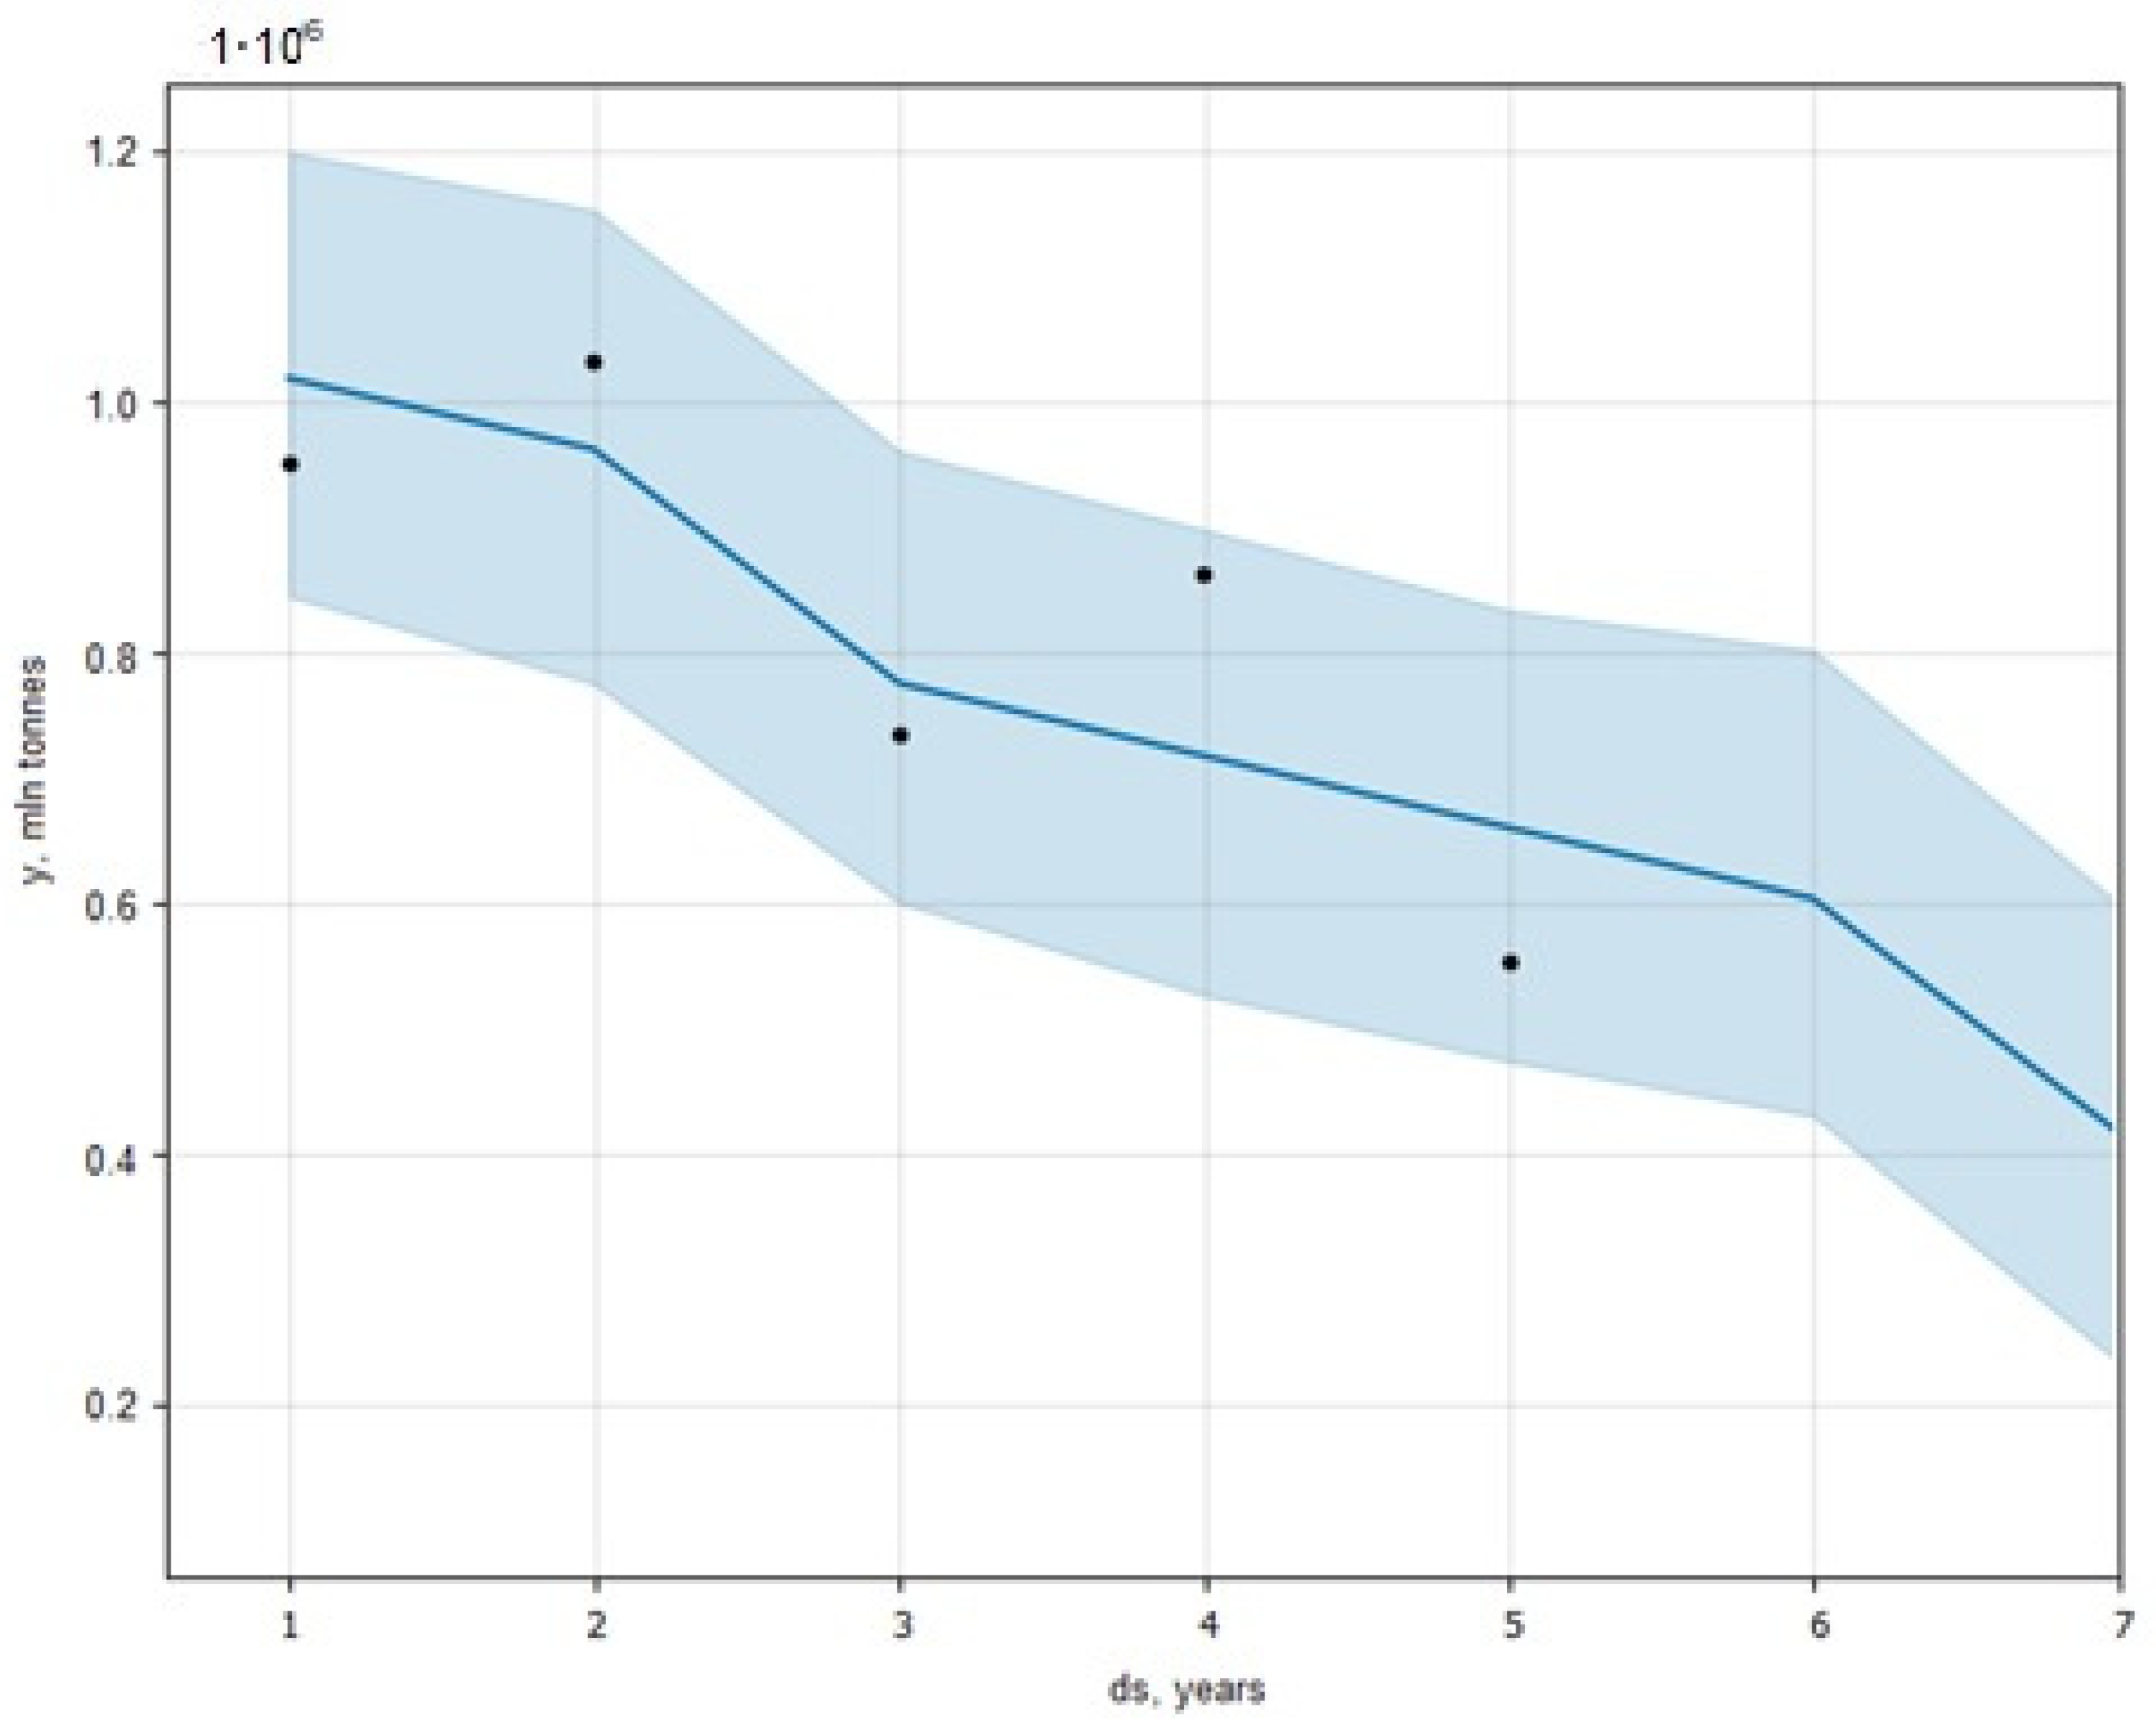
The reduction in gypsum extraction volume will be accompanied by a corresponding decrease in energy consumption, as depicted in Figure 13.
However, it should be noted that, when extraction volumes decrease, many fixed energy costs remain constant, leading to a higher energy intensity since the same amount of energy is used to extract a smaller volume of ore. This scenario applies only if the extracted gypsum volume continues to diminish. Should the open-pit mine initiate a new operational level or open a new excavation area, energy consumption related to haulage and preparatory works (which are not accounted for in the current analysis) would increase.
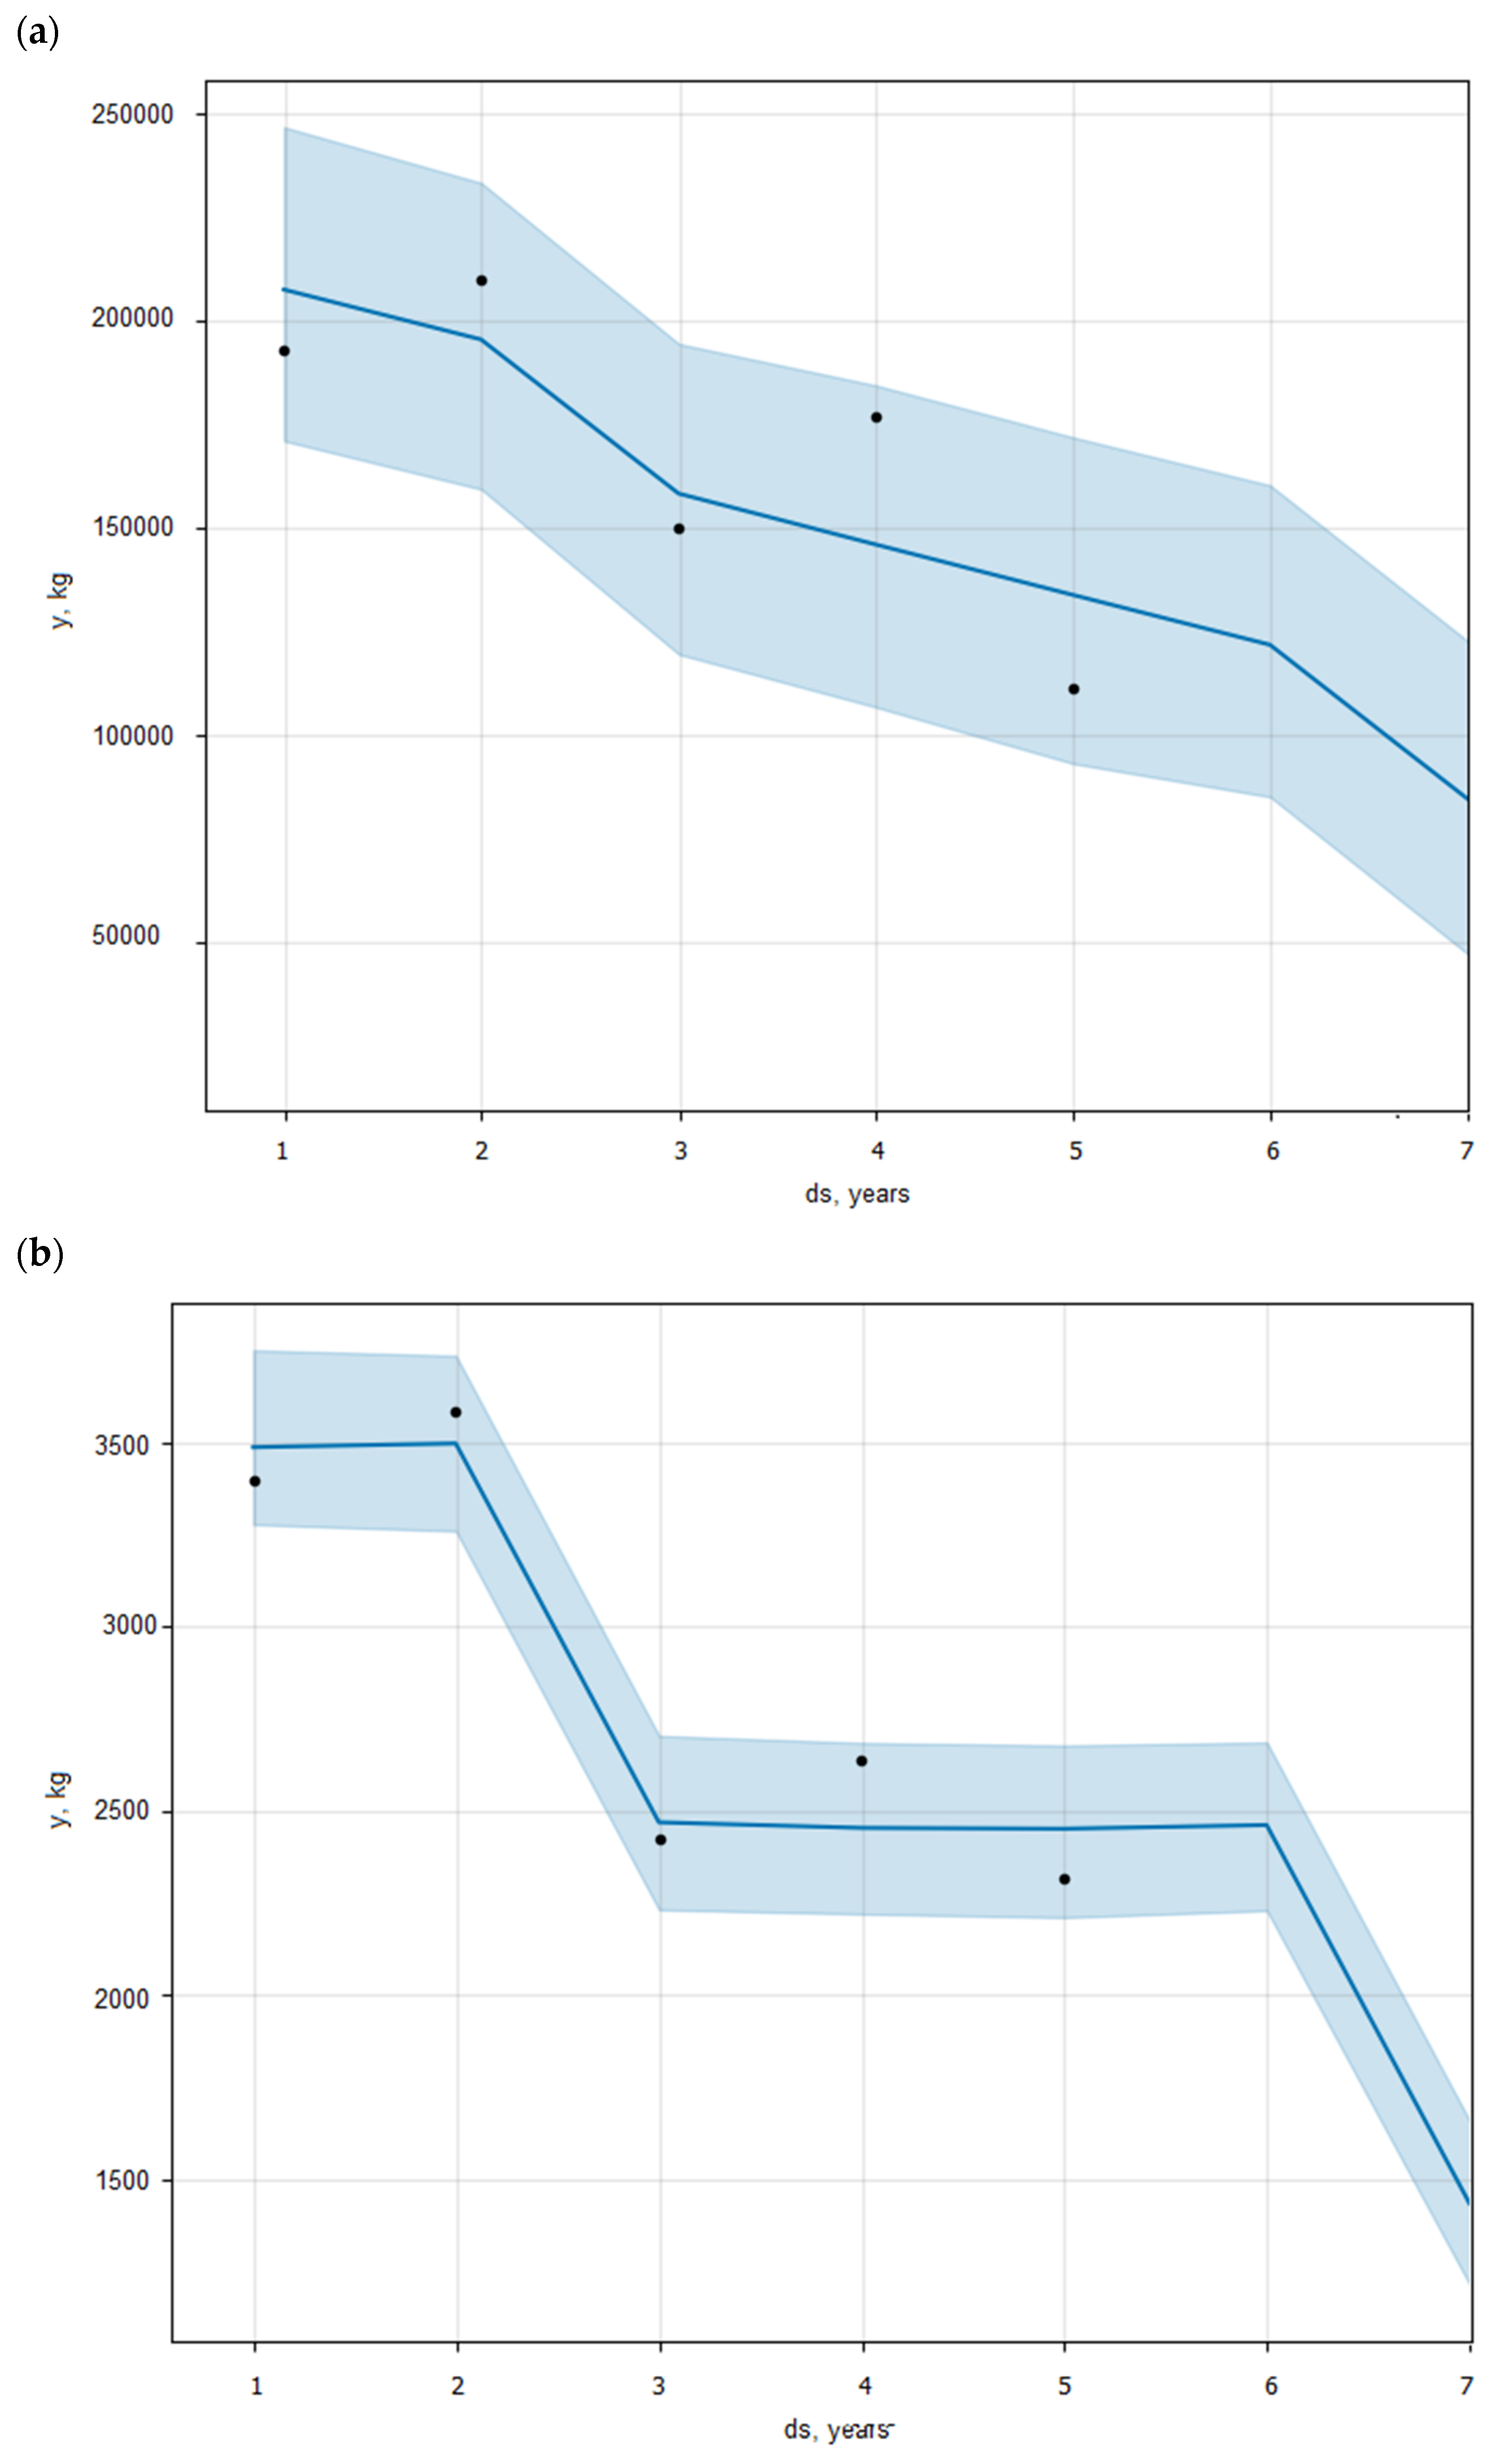
As the open-pit mine deepens, the distance between the pit and the processing facility increases, resulting in longer haulage times. This increase in haulage distance necessitates greater fuel consumption by trucks, directly affecting the energy efficiency of the operation. Additionally, mine expansion requires extensive preparatory work, including the removal of overburden to access the deposit. The increased volume of waste material to be removed and transported adds to the energy demand, reducing the efficiency of ore extraction and raising the energy consumption per ton of ore mined. These factors must be considered when evaluating the implementation of new extraction options. A decrease in energy consumption would also lead to a reduction in emissions, due to lower demands for fuel and explosives in mechanical extraction and blasting operations. The predictive model developed for carbon dioxide, carbon monoxide, and nitrogen oxide emissions corroborates this, as shown in Figure 14. However, if the total volume of extracted gypsum were to increase, the emission volume would rise proportionally as well.

3.5. Theoretical Discussion on Environmental Impact

As mentioned in the Introduction Section, quarrying can have a negative impact on the environment and local communities, regardless of the method of extraction [17,36,49,50,51,52]. Current studies show that the most common impacts of blasting operations in surface mines include blast-induced vibration [53,54,55], fly rock [56,57,58], air overpressure [59,60,61], air dust [62,63,64], noise [65,66,67], and gaseous emissions [68,69]. In the process of drilling blastholes with drilling rigs, noise, gas emissions from diesel engines, and air dust emissions can be identified [70,71]. Machine-based quarrying mainly concerns itself with the effects of noise, dust emission, and gas pollution from diesel engines [72,73]. The impact of quarry operations can be considered in terms of the nature and extent of the impact. Quarrying may affect the natural environment (i.e., greenhouse gas emission or noise), the anthropogenic environment (vibrations’ effect on the technical condition of nearby buildings), and human health (i.e., silica exposure from rock dust or noise exposure). Depending on the nature of the hazard, the impacted area can vary. The environmental impacts of blasting operations, depending on technological factors and mining and geological conditions, may affect the distant surroundings of the mine (blast-induced vibration, air overpressure), while others are rather local, limited to the direct vicinity. In mechanical quarrying, the most far-reaching impact is noise, while other hazards are mostly confined to the pit area. Due to the impact zone, limited mitigation options, and the urbanized surroundings of quarries, blast-induced vibrations and air overpressure are major sources of risk in quarrying [74,75,76]. Drilling and blasting may not be feasible in sites with short distances between the mine face and buildings or where geological conditions are unfavorable. In such cases, one of the most common approaches to ensuring production is the use of mechanical-based rock excavation.

4. Conclusions

This manuscript presents the comparison of energy consumption for two mining methods (gypsum extraction with blasting techniques and mechanical extraction).
The energy consumption analysis indicated that mechanical extraction with a combination of a crawler excavator and a crawler bulldozer required much more energy (86,654.15 MJ) compared to blasting techniques. In the case of blasting techniques, energy consumption ranged from 1298.12 to 1462.22 MJ. This range depended on the effective utilization of the detonation energy for quarrying. Moreover, approximately 970 MJ of energy was obtained from the detonation process. The residual energy was derived from diesel combustion in explosive loading and drilling operations. The energy from diesel combustion in both mining systems dissipated over a long period of time, resulting in the dilution of fumes. Based on the obtained data, it was established that the extraction of 12,779 tons required, depending on the extraction system, approximately 7.46 h (blasting techniques) or 130.6 h (mechanical excavation). This reveals that, in terms of operation time, the blasting technique is much more efficient. The analysis showed that, while blasting is more energy-efficient in terms of energy used per unit of extracted material, the mechanical excavation efficiency may decrease over time due to equipment wear and tear. This decline in efficiency can impact the overall productivity of the mining process.
Although explosives are classified as high-energy materials, the extended duration of mineral extraction for an equivalent volume of gypsum resulted in mechanical extraction being a significantly more energy-intensive process. This was primarily due to the substantial amount of fuel required for combustion during mechanical operations. Moreover, the energy required for mechanical extraction was released with time.
The fume analysis indicated that, in terms of blasting operations, the CO and NOx are mostly generated by the explosive’s detonation. The CO2 is mostly derived from the combustion of diesel. However, the composition of the fumes may be influenced by the type of explosives that are used. In terms of mechanical extraction, the overall emission of fumes was 18,106.28 kg of CO2, 152.34 kg of CO, and 114.32 kg of NO.
The prediction model indicated that gypsum extraction will decrease significantly within a relatively short period unless proactive measures, such as opening a new operational level or expanding the mine, are undertaken. Based on the data obtained and analyzed using the Prophet algorithm, it was established that the reduction in extraction volume will be accompanied by a corresponding decrease in both energy consumption and emission of fumes. However, it is important to note that, as extraction volumes decline, many fixed energy costs, such as those associated with machinery operation and mine maintenance, will remain constant. This will result in an increase in energy intensity, as the same amount of energy will be required to maintain operations, despite the smaller output of extracted material. Consequently, energy efficiency will deteriorate as the energy consumption per unit of extracted deposit will increase.
The FBProphet algorithm offers a robust and accessible approach for the predictive analysis of diverse trends. This algorithm has never been used before in the mining industry. The accuracy of the model is largely dependent on the dataset size, with larger datasets typically enhancing model precision. Additionally, the algorithm is particularly well-suited for time series modeling involving multiple seasonal patterns, making it a valuable tool for predicting general extraction volumes and other industry-relevant metrics. As the analysis showed, apart from the need for the mechanical excavation of hard rock, the impact of the detonation of explosives in the form of a blast wave, and the scattering range of rock fragments, the only factor that can be considered is cost. The authors plan to add an economic aspect to the case study discussed here in a future analysis.

Author Contributions

Conceptualization, A.B., M.D. and P.B.; methodology, A.B. and P.B.; validation, M.D.; formal analysis, A.B., P.B. and M.D.; investigation, A.B., M.D. and P.B.; resources, P.B.; data curation, A.B., M.D. and P.B.; writing—original draft preparation, A.B., P.B. and M.D.; writing—review and editing, A.B., M.D. and P.B.; visualization, M.D.; and supervision, A.B. All authors have read and agreed to the published version of the manuscript.

Funding

The authors wish to thank the Faculty of Civil Engineering and Resource Management at the AGH University of Krakow for the financial support for this research (no. 16.16.100.215).

Institutional Review Board Statement

Not applicable.

Informed Consent Statement

Not applicable.

Data Availability Statement

The original contributions presented in this study are included in the above article; further inquiries can be directed to the corresponding author.

Acknowledgments

The authors extend their gratitude to the management of Saint-Gobain Construction Products Polska Sp. z o.o. Special acknowledgment is due to Mateusz Gajda, Mine Manager, for his invaluable assistance with the mechanical extraction and blasting works at the Saint-Gobain Construction Products facility in Szarbków, Poland.

Conflicts of Interest

The authors declare no conflicts of interest.

References

  1. Machniak, Ł.; Kozioł, W.; Borcz, A. Wytyczne wyboru efektywnych układów wydobywczych do produkcji kruszyw łamanych. Górnictwo Odkryw. 2013, 54, 95–101. [Google Scholar]
  2. Zou, D. Mechanisms of Rock Breakage by Blasting. In Theory and Technology of Rock Excavation for Civil Engineering; Springer: Singapore, 2016. [Google Scholar]
  3. Hamdi, E.; Romdhane, N.B.; Mouza, J.; Le Cleach, J.M. Fragmentation Energy in Rock Blasting. Geotech. Geol. Eng. 2007, 26, 133–148. [Google Scholar] [CrossRef]
  4. Lusk, B.; Silva, J.J. Energy Distribution in the Blast Fragmentation Process. In Energy Efficiency in the Minerals Industry. Green Energy and Technology; Awuah-Offei, K., Ed.; Springer: Berlin/Heidelberg, Germany, 2017. [Google Scholar]
  5. Pyra, J. Impact assessment of mining blasting operations for buildings. WUG Bezpieczeństwo Pracy i Ochrona Środowiska w Górnictwie 2008, 3, 41–47. [Google Scholar]
  6. Sanchidrián, J.A.; Segarra, P.; López, L.M. Energy components in rock blasting. Int. J. Rock Mech. Min. Sci. 2007, 44, 130–147. [Google Scholar] [CrossRef]
  7. Armaghani, J.D.; Hajihassani, M.; Monjezi, M.; Tonnizam, M.; Marto, A.; Moghaddam, M.R. Application of two intelligent systems in predicting environmental impacts of quarry blasting. Arab. J. Geosci. 2015, 8, 9647–9665. [Google Scholar] [CrossRef]
  8. Fişne, A.; Kuzu, C.; Hüdaverdi, T. Prediction of environmental impacts of quarry blasting operation using fuzzy logic. Environ. Monit. Assess. 2011, 174, 461–470. [Google Scholar] [CrossRef]
  9. Hidayat, S. Environmental impacts of open pit mining blasting: Particular discussions on some specific issues. J. Min. Environ. 2021, 1, 1–11. [Google Scholar]
  10. Jung, J.; Grabar, K. Methods for reducing the environmental impact of rock mass excavation. EnvEng-IO 2020, 7, 29–38. [Google Scholar]
  11. Kuzu, C.; Ergin, H. An assessment of environmental impacts of quarry-blasting operation: A case study in Istanbul, Turkey. Environ. Geol 2005, 48, 211–217. [Google Scholar] [CrossRef]
  12. Tomberg, T.; Toomik, A. Environmental impact of mine blasting. Environ. Technol. Resour. Proc. Int. Sci. Pr. Conf. 1999, 1, 213–219. [Google Scholar] [CrossRef]
  13. Biessikirski, A.; Dworzak, M.; Twardosz, M. Composition of Fumes and Its Influence on the General Toxicity and Applicability of Mining Explosives. Mining 2023, 3, 605–617. [Google Scholar] [CrossRef]
  14. Goswami, T.; Brent, G. Blasting approaches to increase mine productivity and reduce greenhouse gas emissions in surface coal mining. In Proceedings of the 11th International Symposium on Rock Fragmentation by Blasting, Sydney, Australia, 24–26 August 2015; pp. 635–644. [Google Scholar]
  15. Kasztelewicz, Z.; Zajączkowski, M.; Sikora, M. Przegląd mechanicznych sposobów urabiania skał zwięzłych. Pr. Nauk. Inst. Górnictwa Politech. Wrocławskiej 2013, 43, 85–98. [Google Scholar]
  16. Kittipongvises, S. Assessment of Environmental Impacts of Limestone Quarrying Operations in Thailand. Environ. Clim. Technol. 2017, 20, 67–83. [Google Scholar] [CrossRef]
  17. Langer, W. Potential Environmental Impacts of Quarrying Stone in Karst—A Literature Review; U.S. Geological Survey Report; U.S. Department of the Interior, USGS Publishing Warehouse: Reston, VA, USA, 2001. [Google Scholar]
  18. Toraño, J.; Rodriguez, R.; Diego, I.; Menéndez, M. Environmental impact of rock excavation in urban areas: Comparison between blasting and hydraulic breaker hammer. Civ. Eng. Environ. Syst. 2006, 23, 117–126. [Google Scholar] [CrossRef]
  19. Amar, P.; Ramachandra, M.V.M.S.; Bahadur, S.K. Rock excavation using surface miners: An overview of some design and operational aspects. Int. J. Min. Sci. Technol. 2013, 23, 33–40. [Google Scholar]
  20. Ismael, M.; Abdelghafar, K.; Sholqamy, M.; Elkarmoty, M. Performance prediction of hydraulic breakers in excavation of a rock mass. Rud. Geološko-Naft. Zb. (Min. Geol. Pet. Eng. Bull.) 2021, 36, 107–119. [Google Scholar] [CrossRef]
  21. Pebrianto, R.; Asof, M.; Susilo, B.K.; Gofar, N. Evaluation of Factors Affecting Ripping Productivity in Open Pit Mining Excavation. Electron. J. Geotech. Eng. 2014, 19, 10447–10456. [Google Scholar]
  22. Cheenkachorn, K.; Poompipatpong, C.; Ho, C.G. Performance and emissions of a heavy-duty diesel engine fuelled with diesel and LNG (liquid natural gas). Energy 2013, 53, 52–57. [Google Scholar] [CrossRef]
  23. Huang, W.D.; Zhang, Y.H.P. Energy efficiency analysis: Biomass-to-wheel efficiency related with biofuels production, fuel distribution, and powertrain systems. PLoS ONE 2011, 6, e22113. [Google Scholar] [CrossRef]
  24. Kanfar, M.; Korman, T.; Kujundžić, T. Fuel consumption and engine load factors of equipment in quarrying of crushed stone. Teh. Vjesn. 2016, 23, 163–169. [Google Scholar]
  25. Okamoto, T.; Uchida, N. New Concept for Overcoming the Trade-Off between Thermal Efficiency, Each Loss and Exhaust Emissions in a Heavy Duty Diesel Engine. SAE Int. J. Engines 2016, 9, 859–867. [Google Scholar] [CrossRef]
  26. Ismail, M.A.M.; Kumar, N.S.; Abidin, M.H.Z.; Madun, A. Rippability Assessment of Weathered Sedimentary Rock Mass using Seismic Refraction Methods. J. Phys. Conf. Ser. 2018, 995, 012105. [Google Scholar] [CrossRef]
  27. Bęben, A. Teoretyczne Podstawy Mechanicznego Zwiercania Skał w Górnictwie Odkrywkowym; Wydawnictwa AGH: Kraków, Poland, 2012. [Google Scholar]
  28. Zhu, J.X.; Zhao, C.Y.; Zou, X.F. Identification of soil parameters on vibratory excavation of hydraulic excavator. Zhongnan Daxue Xuebao (Ziran Kexue Ban)/J. Cent. South Univ. (Sci. Technol.) 2006, 37. [Google Scholar]
  29. Zhu, J.X.; Zhao, C.Y.; Guo, X. Research on mechanism of vibratory excavation of hydraulic excavators. Yantu Lixue/Rock Soil Mechanics. 2007, 28, 537–541. [Google Scholar]
  30. Zhu, J.; Hu, H.; Mei, Y. Power consumption study on bucket vibratory excavation of hydraulic excavator. Tongji Daxue Xuebao/J. Tongji Univ. 2008, 36, 1408–1412. [Google Scholar]
  31. Boudiaf, M.; Chaib, R.; Talhi, K. Study of rippability in limestone quarries-case of the hadjar-soud quarry, Algeria. Phys. Chem. News 2010, 53, 39–44. [Google Scholar]
  32. Stewart, P.; Ramezanzadeh, A.; Knights, P. Benchmark Drill and Blast and Mechanical Excavation Advance Rates for Underground Hard-Rock Mine Development. In Proceedings of the Australian Mining Technology Conference, Hunter Valley, NSW, Australia, 26–27 September 2006; pp. 41–63. [Google Scholar]
  33. Wennmohs, K.H. Mechanical Rock Excavation versus Drilling and Blasting. GeoRecources J. Resour. Min. Tunn. Geotech. Equip. 2021, 2, 32–36. [Google Scholar]
  34. Feijóo, P.C. Comparative Analysis Between Drill and Blast and Mechanical Excavation in Underground Construction. Master’s Thesis, National Technical University of Athens, School of Mining and Metallurgical Engineering, Athens, Greece, 2019. [Google Scholar]
  35. Skawina, B.; Greberg, J.; Salama, A.; Schunnesson, H. Mechanical Excavation and Drilling and Blasting—A Comparison Using Discrete Event Simulation. Mine Plan. Equip. Sel. 2014, 367–377. [Google Scholar]
  36. Bascompta, M.; Sanmiquel, L.; Gangolells, M.; Sidki, N. LCA analysis and comparison in quarrying: Drill and blast vs mechanical extraction. J. Clean. Prod. 2022, 369, 133042. [Google Scholar] [CrossRef]
  37. EN 13631-16:2004; Explosives for Civil Uses. High Explosives. Part 16: Detection and Measurement of Toxic Gases. European Committee for Standardization: Brussels, Belgium, 2004.
  38. European Union. Council directive 93/15/EEC of 5 April 1993 on the harmonisation of the provisions relating to the placing on the market and supervision of explosives for civil uses. Off. J. Eur. Union 1993, 12, 20–36. [Google Scholar]
  39. Sadowski, A.; Żółtowski, B. Badania sprawności złożonych układów napędowych. Inżynieria I Apar. Chem. 2012, 5, 249–250. [Google Scholar]
  40. Winther, M.; Dore, C. EMEP/EEA Air Pollutant Emission Inventory Guidebook. 2023. Available online: https://www.eea.europa.eu/publications/emep-eea-guidebook-2023 (accessed on 1 August 2024).
  41. Harvey, A.C.; Shephard, N. Structural time series models. In Handbook of Statistics; Maddala, G., Rao, C., Vinod, H., Eds.; Elsevier: Amsterdam, The Netherlands, 1993; Volume 11, pp. 261–302. [Google Scholar]
  42. Harvey, A.C.; Peters, S. Estimation procedures for structural time series models. J. Forecast. 1990, 9, 89–108. [Google Scholar] [CrossRef]
  43. Taylor, S.J.; Letham, B. Forecasting at Scale. Am. Stat. 2018, 72, 37–45. [Google Scholar] [CrossRef]
  44. OZN Research. DCA 5 Detonation Calorimeter Product Datasheet. Available online: https://mueller-instruments.de/fileadmin/Downloads/instruments-medien/Detonationskalorimeter_-_DCA_5.pdf (accessed on 1 August 2024).
  45. Rai, R.; Singh, T.N. A new predictor for ground vibration prediction and its comparison with other predictors. Indian J. Eng. Mater. Sci. 2004, 11, 178–184. [Google Scholar]
  46. Samujłło, J. Roboty Strzelnicze w Górnictwie Odkrywkowym; Wydawnictwo Śląsk: Katowice, Poland, 1968. [Google Scholar]
  47. Orlen Poludnie. Ekoterm Product Datasheet. Available online: https://www.orlenpoludnie.pl/PL/NaszaOferta/StrefaBIOpaliw/OlejeOpalowe/Strony/Ekoterm.aspx (accessed on 9 August 2024).
  48. United States Environmental Protection Agency. Euxahust Emissions Calculations. Available online: https://www.epa.gov/sites/default/files/2015-09/documents/nghwemit.pdf (accessed on 9 August 2024).
  49. Lee, C.; Asbjörnsson, G.; Hulthén, E.; Evertsson, M. The environmental impact of extraction: A holistic review of the quarry lifecycle. Clean. Environ. Syst. 2024, 13, 100201. [Google Scholar] [CrossRef]
  50. Omosanya, K.O.; Ajivade, O.M. Environnmental impact of quarrying on Otere Village, Odeda, Southwestern Nigeria. Ozean J. Appl. Sci. 2011, 4, 75–82. [Google Scholar]
  51. Capitano, C.; Peri, G.; Rizzo, G.; Ferrante, P. Towards a holistic environmental impact assessment of merble quarrying and processing: Proposal of a novel easy-to-use IPAT-based method. Environ. Monit. Assess 2017, 189, 108. [Google Scholar] [CrossRef]
  52. Domingues, J.M.; Miranda, V.F.; Rezende, D.C.; Lares, Y.S.; Ferreira, S.R.; de Oliveira, I.R. Statistical modeling of qyarrying activities and their impact on residents’ satisfaction. J. Environ. Sci. Sustain. Dev. 2020, 3, 416–429. [Google Scholar] [CrossRef]
  53. Feher, J.; Cambal, J.; Pandula, B.; Kondela, B.; Sofranko, M.; Mudarri, T.; Buchla, I.; Feher, J.; Cambal, J.; Pandula, B.; et al. Research of the technical seismicity due to blasting works in quarries and their impact on the environment and population. Appl. Sci. 2021, 11, 2118. [Google Scholar] [CrossRef]
  54. Sevelka, T. Blasting Quarry Operations: Adverse and Cumulative Effects, Lawsuits and Complaints, and Suggested Remedies. J. Envtl. L. Pol’y 2023, 3, 1–79. [Google Scholar] [CrossRef]
  55. Djaksimuratov, K.; Bayramova, M. Environmental impact of rock blasting processes in mining enterprises. Mod. Sci. Res. 2024, 6, 842–847. [Google Scholar]
  56. Nikafshan Rad, H.; Bakhshayeshi, I.; Wan Jusoh, W.A.; Tahir, M.M.; Foong, L.K. Prediction of flyrock in mine blasting: A new computational intelligence approach. Nat. Resour. Res. 2020, 29, 609–623. [Google Scholar] [CrossRef]
  57. Murlidhar, B.R.; Nguyen, H.; Rostami, J.; Bui, X.; Armaghani, D.J.; Ragam, P.; Mohamad, E.T. Prediction of flyrock distance induced by mine blasting using a novel Harris Hawks optimization-based multi-layer perceptron neural network. J. Rock Mech. Geotech. Eng. 2021, 13, 1413–1427. [Google Scholar] [CrossRef]
  58. Bhatawdekar, R.M.; Kumar, R.; Sabri Sabri, M.M.; Roy, B.; Mohamad, E.T.; Kumar, D.; Kwon, S. Estimating flyrock distance induced due to mine blasting by extreme learning machine coupled with an equilibrium optimizer. Sustainability 2023, 15, 3265. [Google Scholar] [CrossRef]
  59. Nguyen, H.; Bui, X.N.; Tran, Q.H. Estimating air over-pressure resulting from blasting in quarries based on a novel ensemble model (GLMNETs–MLPNN). Nat. Resour. Res. 2021, 30, 2629–2646. [Google Scholar] [CrossRef]
  60. Fang, Q.; Nguyen, H.; Bui, X.N.; Tran, Q.H. Estimation of blast-induced air overpressure in quarry mines using cubist-based genetic algorithm. Nat. Resour. Res. 2020, 29, 593–607. [Google Scholar] [CrossRef]
  61. Harandizadeh, H.; Armaghani, D.J. Prediction of air-overpressure induced by blasting using an ANFIS-PNN model optimized by GA. Appl. Soft Comput. 2021, 99, 106904. [Google Scholar] [CrossRef]
  62. Zvyagintseva, A.V.; Sazonova, S.A.; Kulneva, V.V. Analysis of sources of dust and poisonal gases in the atmosphere formed as a result of explosions at quarries of the mining and integrated works. Proc. IOP Conf. Ser. Mater. Sci. Eng. 2020, 962, 042045. [Google Scholar] [CrossRef]
  63. Normatova, M.; Pardayeva, S. Reducing dust pollution in the production of mass explosions in quarries. Proc. EDP Sci. E3S Web Conf. 2024, 525, 01003. [Google Scholar] [CrossRef]
  64. Bakhtavar, E.; Hosseini, S.; Hewage, K.; Sadiq, R. Air pollution risk assessment using a hybrid fuzzy intelligent probability-based approach: Mine blasting dust impacts. Nat. Resour. Res. 2021, 30, 2607–2627. [Google Scholar] [CrossRef]
  65. Aksoy, M.; Hakan, A.; Konuk, A. Development of a Preliminary Blasting Design and Assessment of Environmental Impacts for a Quarry. Çukurova Üniversitesi Mühendislik-Mimar. Fakültesi Derg. 2019, 34, 241–248. [Google Scholar] [CrossRef]
  66. Kumar, A.; Prasad, S.; Reddy, R.S. Environmental implications on blasting operations in Indian quarry mines. Int. J. Min. Geo-Eng. 2024, 58, 289–294. [Google Scholar]
  67. Hassan, I.A. Impact of quarry activities on the serenity of the neighbouring localities in Ogun State, Nigeria. Afr. J. Agric. Technol. Environ. 2022, 11, 30–37. [Google Scholar]
  68. Al-Bakri, A.; Hefni, M. A review of some nonexplosive alternative methods to conventional rock blasting. Open Geosci. 2021, 13, 431–442. [Google Scholar] [CrossRef]
  69. Eruke, O.S.; Igwenagu-Ifeanyi, V.; Belonwu, D.C. Assessment of drinking water and air quality around selected quarries in southeastern Nigeria. World J. Innov. Res. 2021, 11, 70–76. [Google Scholar]
  70. Regotunov, A.; Sukhov, R.; Bersenyov, G. About transition processes in blasthole drilling at quarries. Proc. EDP Sci. E3S Web Conf. 2020, 177, 01008. [Google Scholar] [CrossRef]
  71. Ganapathi, H.; Phukan, M. Environmental hazards of limestone mining and adaptive practices for environment management plan. In Environmental Processes and Management. Water Science and Technology Library; Singh, R., Shukla, P., Singh, P., Eds.; Springer: Cham, Switzerland, 2020; Volume 91, pp. 121–134. [Google Scholar] [CrossRef]
  72. Gupta, P.; Roy, S.; Babu, A.R. Study on noise levels generated due to jack hammer drills in granite quarries. Front. Sci. 2012, 2, 47–52. [Google Scholar] [CrossRef]
  73. Singhal, A.; Goel, S. Impact of Sandstone Quarrying on the Health of Quarry Workers and local residents: A case study of Keru, Jodhpur, India. In Treatment and Disposal of Solid and Hazardous Wastes; Springer: Cham, Switzerland, 2022; pp. 97–118. [Google Scholar]
  74. Toraño, J.; Ramírez-Oyanguren, P.; Rodríguez, R.; Diego, I. Analysis of the environmental effects of ground vibrations produced by blasting in quarries. Int. J. Min. Reclam. Environ. 2006, 20, 249–266. [Google Scholar] [CrossRef]
  75. Spathis, A.T. A brief review of the measurement, modelling and management of vibrations produced by blasting. In Proceedings of the 9th International Symposium on Rock Fragmentation by Blasting, Granada, Spain, 13–17 August 2009; pp. 1–11. [Google Scholar]
  76. Zeng, J.; Mohammed, A.S.; Mirzaei, F.; Moosavi, S.M.H.; Armaghani, D.J.; Samui, P. A parametric study of ground vibration induced by quarry blasting: An application of group method of data handling. Environ. Earth Sci. 2022, 81, 127. [Google Scholar] [CrossRef]
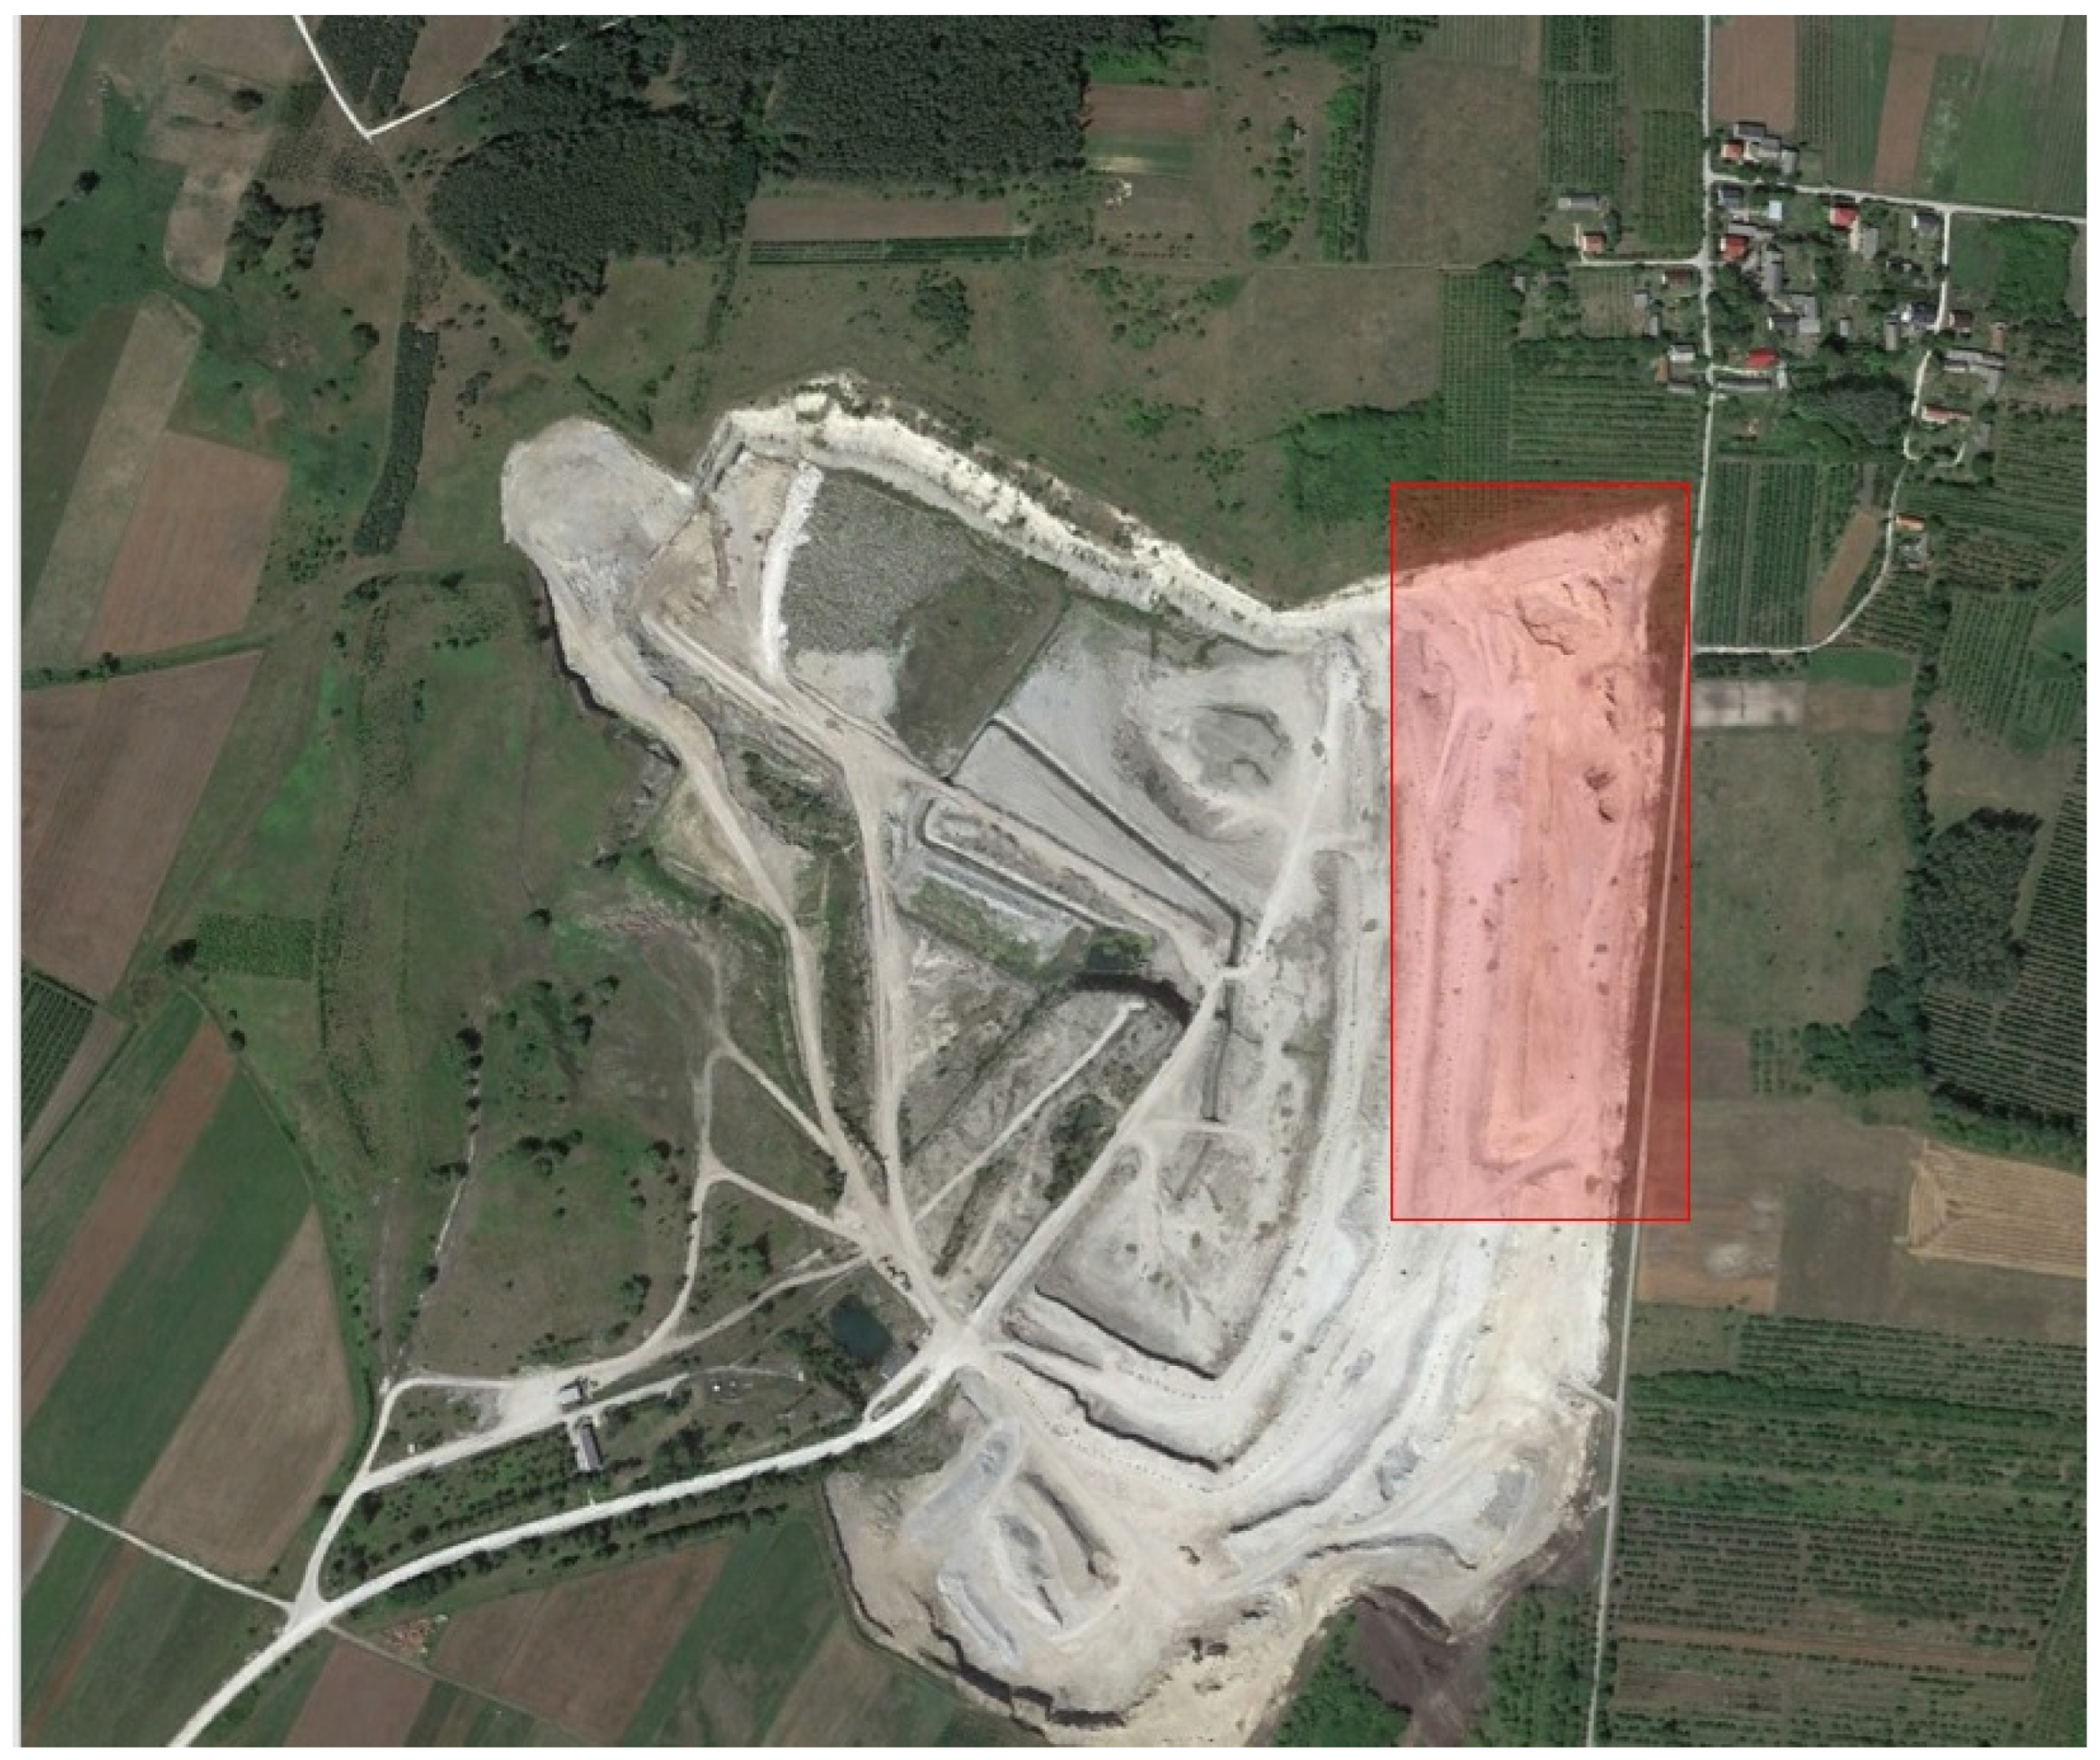
Figure 1. Open-pit mine’s aerial view.
Energies 17 05662 g001
Figure 2. An overview of the deposit quality model.
Energies 17 05662 g002
Figure 3. Blasting works at open-pit mine.
Energies 17 05662 g003
Figure 4. Mechanical extraction at the open-pit mine.
Energies 17 05662 g004
Figure 5. Fumes emitted from mechanical equipment during one hour of operation time: (a) CO, (b) CO2, and (c) NOx.
Energies 17 05662 g005
Figure 6. Total energy consumption of blasting works where the effective energy of detonation is (a) 20% and (b) 30%.
Energies 17 05662 g006aEnergies 17 05662 g006b
Figure 7. Fume volume comparison of ANFO and TNT fumes.
Energies 17 05662 g007
Figure 8. Total fumes emitted from all blasting operations: (a) CO, (b) CO2, (c) NOx, and (d) overall.
Energies 17 05662 g008aEnergies 17 05662 g008b
Figure 9. Energy consumption during mechanical extraction.
Energies 17 05662 g009
Figure 10. Total fumes emitted from all mechanical extraction operations: (a) CO, (b) CO2, (c) NOx, and (d) overall.
Energies 17 05662 g010aEnergies 17 05662 g010b
Figure 11. Relation of energy intensities and effective productivities of the mining process using blasting works and mechanical extracting.
Energies 17 05662 g011
Figure 12. Prediction model for overall gypsum extraction.
Energies 17 05662 g012
Figure 13. Prediction model of overall energy consumption.
Energies 17 05662 g013
Figure 14. Prediction models for the emission of (a) CO2, (b) CO, and (c) NOx.
Energies 17 05662 g014aEnergies 17 05662 g014b
Table 1. Blasting pattern.
Name of ParameterValue
Bench height, m8.0
Borehole diameter, mm95.0
Length of borehole with subdrill, m9.0
Stemming length, m1.0
Burden, m3.5
Spacing, m3.8
Mass of explosive per borehole, kg37.0
Mass of explosive per delay, kg37.0
Total mass of explosive, kg407.0
Number of boreholes in series11
Number of rows1
Gypsum volume, tons12,779
Table 2. Mechanical extraction.
Name of ParameterValue
Annual gypsum extraction, tons12,779
Bench height, m8.0
Burden, m3.5
Bench length, m41.8
Gypsum volume, tons12,779
Table 3. Summary of machine output for annual gypsum extraction and corresponding fuel consumption for each machine.
ParameterCaterpillar 330DLCaterpillar D9R
Annual volume of gypsum extraction, Mg67116068
Value of fuel consumption, l32,25326,362
Table 4. Summary of the technical parameters of the machines included in the analysis.
Technical ParametersCaterpillar 330DLCaterpillar D9RHausherr HSB111-P
Gross power, kW200302125
Average diesel consumption, l·h−122.7626.7612.32
Total efficiency of the powertrain unit η, %353738
Table 5. The volume of fume emissions related to the operating time of the analyzed machines.
Volume of GHG Emissions of GasesCaterpillar 330DLCaterpillar D9RHausherr HSB111-P
CO, g·h−1300450125
CO2, g·h−16140715034,011
NOx, g·h−164854438
Table 6. Average energy of explosion.
Energetic MaterialAverage Energy of Explosion, kJ·kg−1Maximum Deflection, %
ANFO39400.5
TNT *6400-
* TNT energy of explosive based on OZM research [44].
Table 7. Average energy consumption of each blasting operation.
OperationEnergy Consumption, MJ
Detonation process (quarrying)327.76–481.63
Drilling process665.81
Explosive loading process305.14
Table 8. Average fume volume formed during the decomposition reaction.
Energetic MaterialAmount, dm3·kg−1
CO2CONOx
ANFO144.516.413.1
TNT919.611.54.8
Table 9. Average fume emissions from this case study’s blasting operations.
Type of OperationAmount, kg
CO2CONOx
Detonation process126.247.6810.23
Drilling operations109.80.80.21
Explosive loading50.30.1300.035
Overall 286.348.6110.48
Table 10. Average energy consumption of each mechanical excavation operation equivalent to the gypsum output from one blasting series.
OperationEnergy Consumption, MJ
E R —Ripping operation by dozer45,875.4
E E —Excavation operation by excavator with excentric skidder40,778.7
E O E —Oversize excavation operation by excavator with excentric skidder86,654.2
Table 11. Average fume emissions from blasting mechanical excavation in this case study.
Type of OperationAmount, kg
CO2CONOx
Ripping process9334.6058.7871.00
Excavation operations8771.6893.5643.31
Overall 18,106.28152.33114.32
Table 12. Overall annual extraction, energy consumption with the assumption of 80% energy dissipation from explosive detonation, and fume emission from blasting operation and mechanical extraction.
YearGypsum Mass, TonsEnergy Consumption, MJAmount, kg
CO2CONOx
1804,473949,506192,902.63398.63934.1
2827,9561,031,034209,789.43588.64138.6
3529,479735,154150,017.32422.82772.9
4529,320961,798176,508.92636.12983.2
5619,790552,251111,117.92315.92732.5
Disclaimer/Publisher’s Note: The statements, opinions and data contained in all publications are solely those of the individual author(s) and contributor(s) and not of MDPI and/or the editor(s). MDPI and/or the editor(s) disclaim responsibility for any injury to people or property resulting from any ideas, methods, instructions or products referred to in the content.