Article

Research on Heat Transfer Characteristics of Plate Evaporators for Cold Storage

1
Xinglin College, Nantong University, Nantong 226000, China
2
Nanhua Heat Exchanger Manufacturing Co., Ltd., Shanghai 201400, China
*
Author to whom correspondence should be addressed.
Energies 2024, 17(23), 5837; https://doi.org/10.3390/en17235837
Submission received: 25 September 2024 / Revised: 18 November 2024 / Accepted: 19 November 2024 / Published: 21 November 2024
(This article belongs to the Section J1: Heat and Mass Transfer)

Abstract

:
A new type of plate evaporator suitable for cold storage refrigeration systems was designed. A mathematical model of the plate evaporator was established using Fluent14.0 software, and the effects of refrigerant mass flow rate and air velocity on the heat transfer characteristics of the plate evaporator were discussed. The numerical simulation results were verified through experiments. The research results show that in the design conditions of a refrigerant inlet dryness of 0.27, temperature of −5 °C, saturation pressure at this temperature, mass flow rate of 0.0187 kg/s, air inlet temperature of 6 °C, relative humidity of 80%, and flow rate of 3 m/s, the new plate evaporator had a cooling capacity of 3.13 kW, a refrigerant side pressure drop of 1.36 kPa, and an air side pressure drop of 495 Pa. By increasing the mass flow rate of the refrigerant or the air side flow rate, the cooling capacity of the evaporator increases linearly, but at the same time, the pressure drop on both the refrigerant and air sides increases rapidly.

1. Introduction

Cold storage, as an important part of the cold chain system, is widely used for low-temperature storage of fruits, vegetables, meat, and aquatic products. With the steady development of China’s economy and the improvement of residents’ consumption levels and concepts, the demand for cold storage in China has also increased year by year. According to data released by the Cold Chain Committee of China Federation of Logistics and Purchasing (CFLP), the capacity of food cold storage in China reached 70.8 million tons in 2020, a year-on-year increase of 16.98% [1]. At present, the construction and operation costs of cold storage refrigeration systems remain high, with the cost of evaporators as key components exceeding 30%, and the heat transfer performance of evaporators directly affects the operational efficiency of the refrigeration system [2].
Domestic and foreign scholars have conducted a series of theoretical and experimental studies on the structural parameters, operating conditions, and refrigerant selection of heat exchangers.
Zhang Jiachi et al. [3] conducted simulation and experimental research on the influence of structural parameters of air coolers on their frosting characteristics at different storage temperatures, revealing the changing effects of fin spacing of air coolers in cold storage with different air state parameters on their heat transfer surface frosting characteristics and system performance.
Ma Yan et al. [4] experimentally studied the heat transfer performance and pressure drop of variable pitch and fixed pitch air coolers under different operating conditions. Comparative analysis showed that the performance of variable pitch air coolers was generally better than that of fixed pitch air coolers under low-temperature conditions.
Shen Jiang et al. [5] studied the operational performance of air coolers through numerical simulation methods. The influence of structural parameters (tube spacing, fin spacing, and fin thickness) of the air cooler on its performance was explored.
Mehmet DAS et al. [6] studied the thermal performance of R290 and R404A refrigerants in the same cooling system through experiments and numerical simulations. The research results indicate that the thermal performance of R290 is higher than that of R404A.
From the above research, it can be seen that optimization studies on evaporators in cold storage refrigeration systems are mostly focused on tube fin heat exchangers. However, the problems existing in tube fin heat exchangers have not been completely solved. One reason is that the fins are a secondary heat exchange surface, and due to the existence of fin efficiency, they are not as good as the heat transfer performance of the primary heat exchange surface. The second issue is that the spacing between fins is too small, and once frost forms on the surface of the evaporator, it is easy to form frost accumulation, which brings difficulties to surface defrosting. Moreover, frost accumulation not only hinders air flow but also increases heat transfer resistance, resulting in a decrease in the cooling capacity of the evaporator [7,8]. Thirdly, the cost is relatively high. The copper and aluminum used in the production of tube fin heat exchangers are both non-ferrous metals, among which copper is a strategic metal in China. China’s copper production cannot meet the consumption required for economic development. In 2020, China’s copper resource reserves only accounted for 3.0% of the world’s total, but refined copper production reached 41.9% of the world’s total, and the external dependence of copper resources reached 75.3% [9]. With the development of China’s cold chain logistics system, the construction of cold storage will experience a significant increase, and the amount of copper consumed in the production of tube fin evaporators will also increase rapidly.
Based on the above analysis, some scholars have proposed using stainless steel heat exchangers as evaporators for cold storage refrigeration systems. The use of plate-type stainless steel heat exchangers has the following advantages: All heat exchange surfaces are primary surfaces, which improves heat transfer efficiency. By using corrugated flow channels to disturb the air, the heat transfer coefficient can be improved, compensating for the increase in thermal resistance caused by the low thermal conductivity of stainless steel. The surface of the plate heat exchanger makes it easy to perform anti-corrosion and frost suppression treatment, providing assistance for the stable operation of the evaporator. Domestic and foreign scholars have conducted extensive research on the heat transfer performance of corrugated plate evaporators.
Lee et al. [10] experimentally studied the heat transfer and pressure drop performance of a plate evaporator with R1233zd (E) as the working fluid. The results indicate that as the mass flow rate of the working fluid or the mass fraction of gas at the outlet of the preheater increases, the turbulence level of the fluid intensifies, and the heat transfer of R1233zd (E) is enhanced.
Kim et al. [11] studied the heat transfer characteristics of R1234ze (E) and R134a in plate heat exchangers with 30/60° ripple angles at different mass flow rates. The results indicate that both working fluids exhibit strong turbulence effects when the herringbone ripple angle is large.
Wu Lijun et al. [12,13] analyzed the phase change heat transfer performance of R245fa in a corrugated plate heat exchanger in an organic Rankine cycle system through numerical simulation, researched the effects of steam superheat, wall subcooling, and steam dryness on heat transfer coefficient and pressure loss, fitted a heat transfer correlation equation suitable for R245fa, and verified it through experiments.
Wu Xuehong et al. [14] simulated the phase change flow in plate heat exchangers by establishing a three-dimensional single channel model. The research results showed that increasing the ripple angle and decreasing the ripple pitch helped to improve the boiling heat transfer coefficient.
Belman Flores et al. [15] simulated and compared the heat transfer performance of plate fin evaporators and plate evaporators in micro refrigeration systems using computational fluid dynamics, and calculated the velocity and temperature distribution in small spaces.
By analyzing the existing literature, it can be concluded that plate heat exchangers made of stainless steel can be fully used as evaporators in refrigeration systems. In this article, a new type of plate evaporator suitable for cold storage refrigeration systems was designed. Using R22 as the refrigerant, a numerical simulation research was conducted on the heat transfer characteristics of the evaporator, and the effects of refrigerant mass flow rate, inlet dryness, and frontal wind speed on the heat transfer and pressure drop performance of the plate evaporator were discussed. The mathematical model of the evaporator was verified through experiments.

2. Establishment of Heat Transfer Model for Evaporator
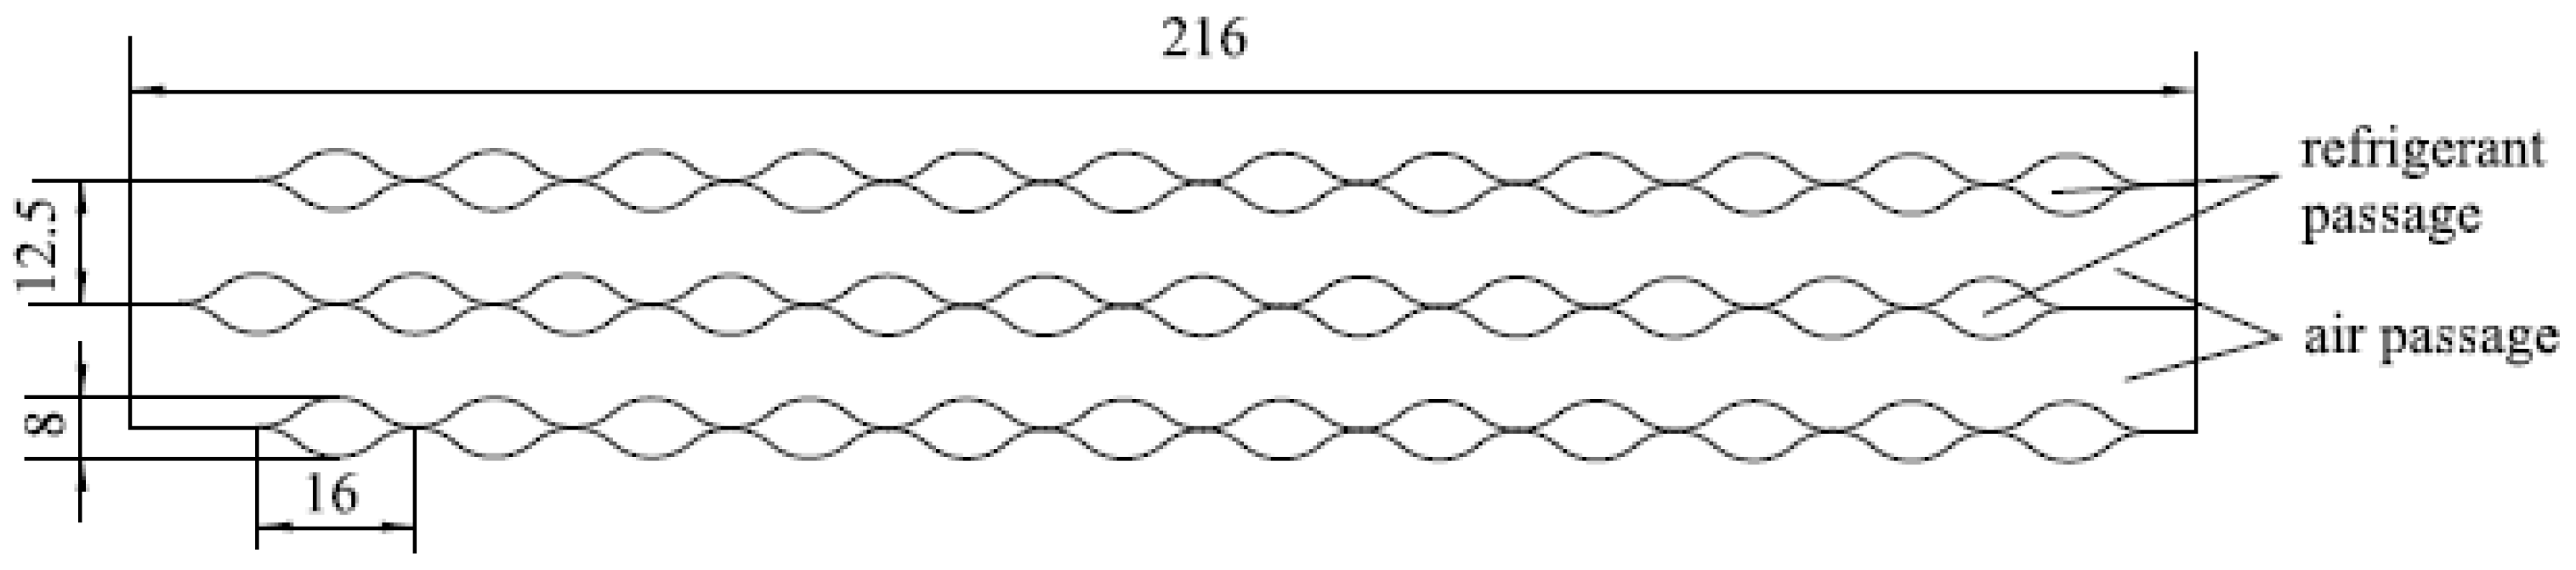
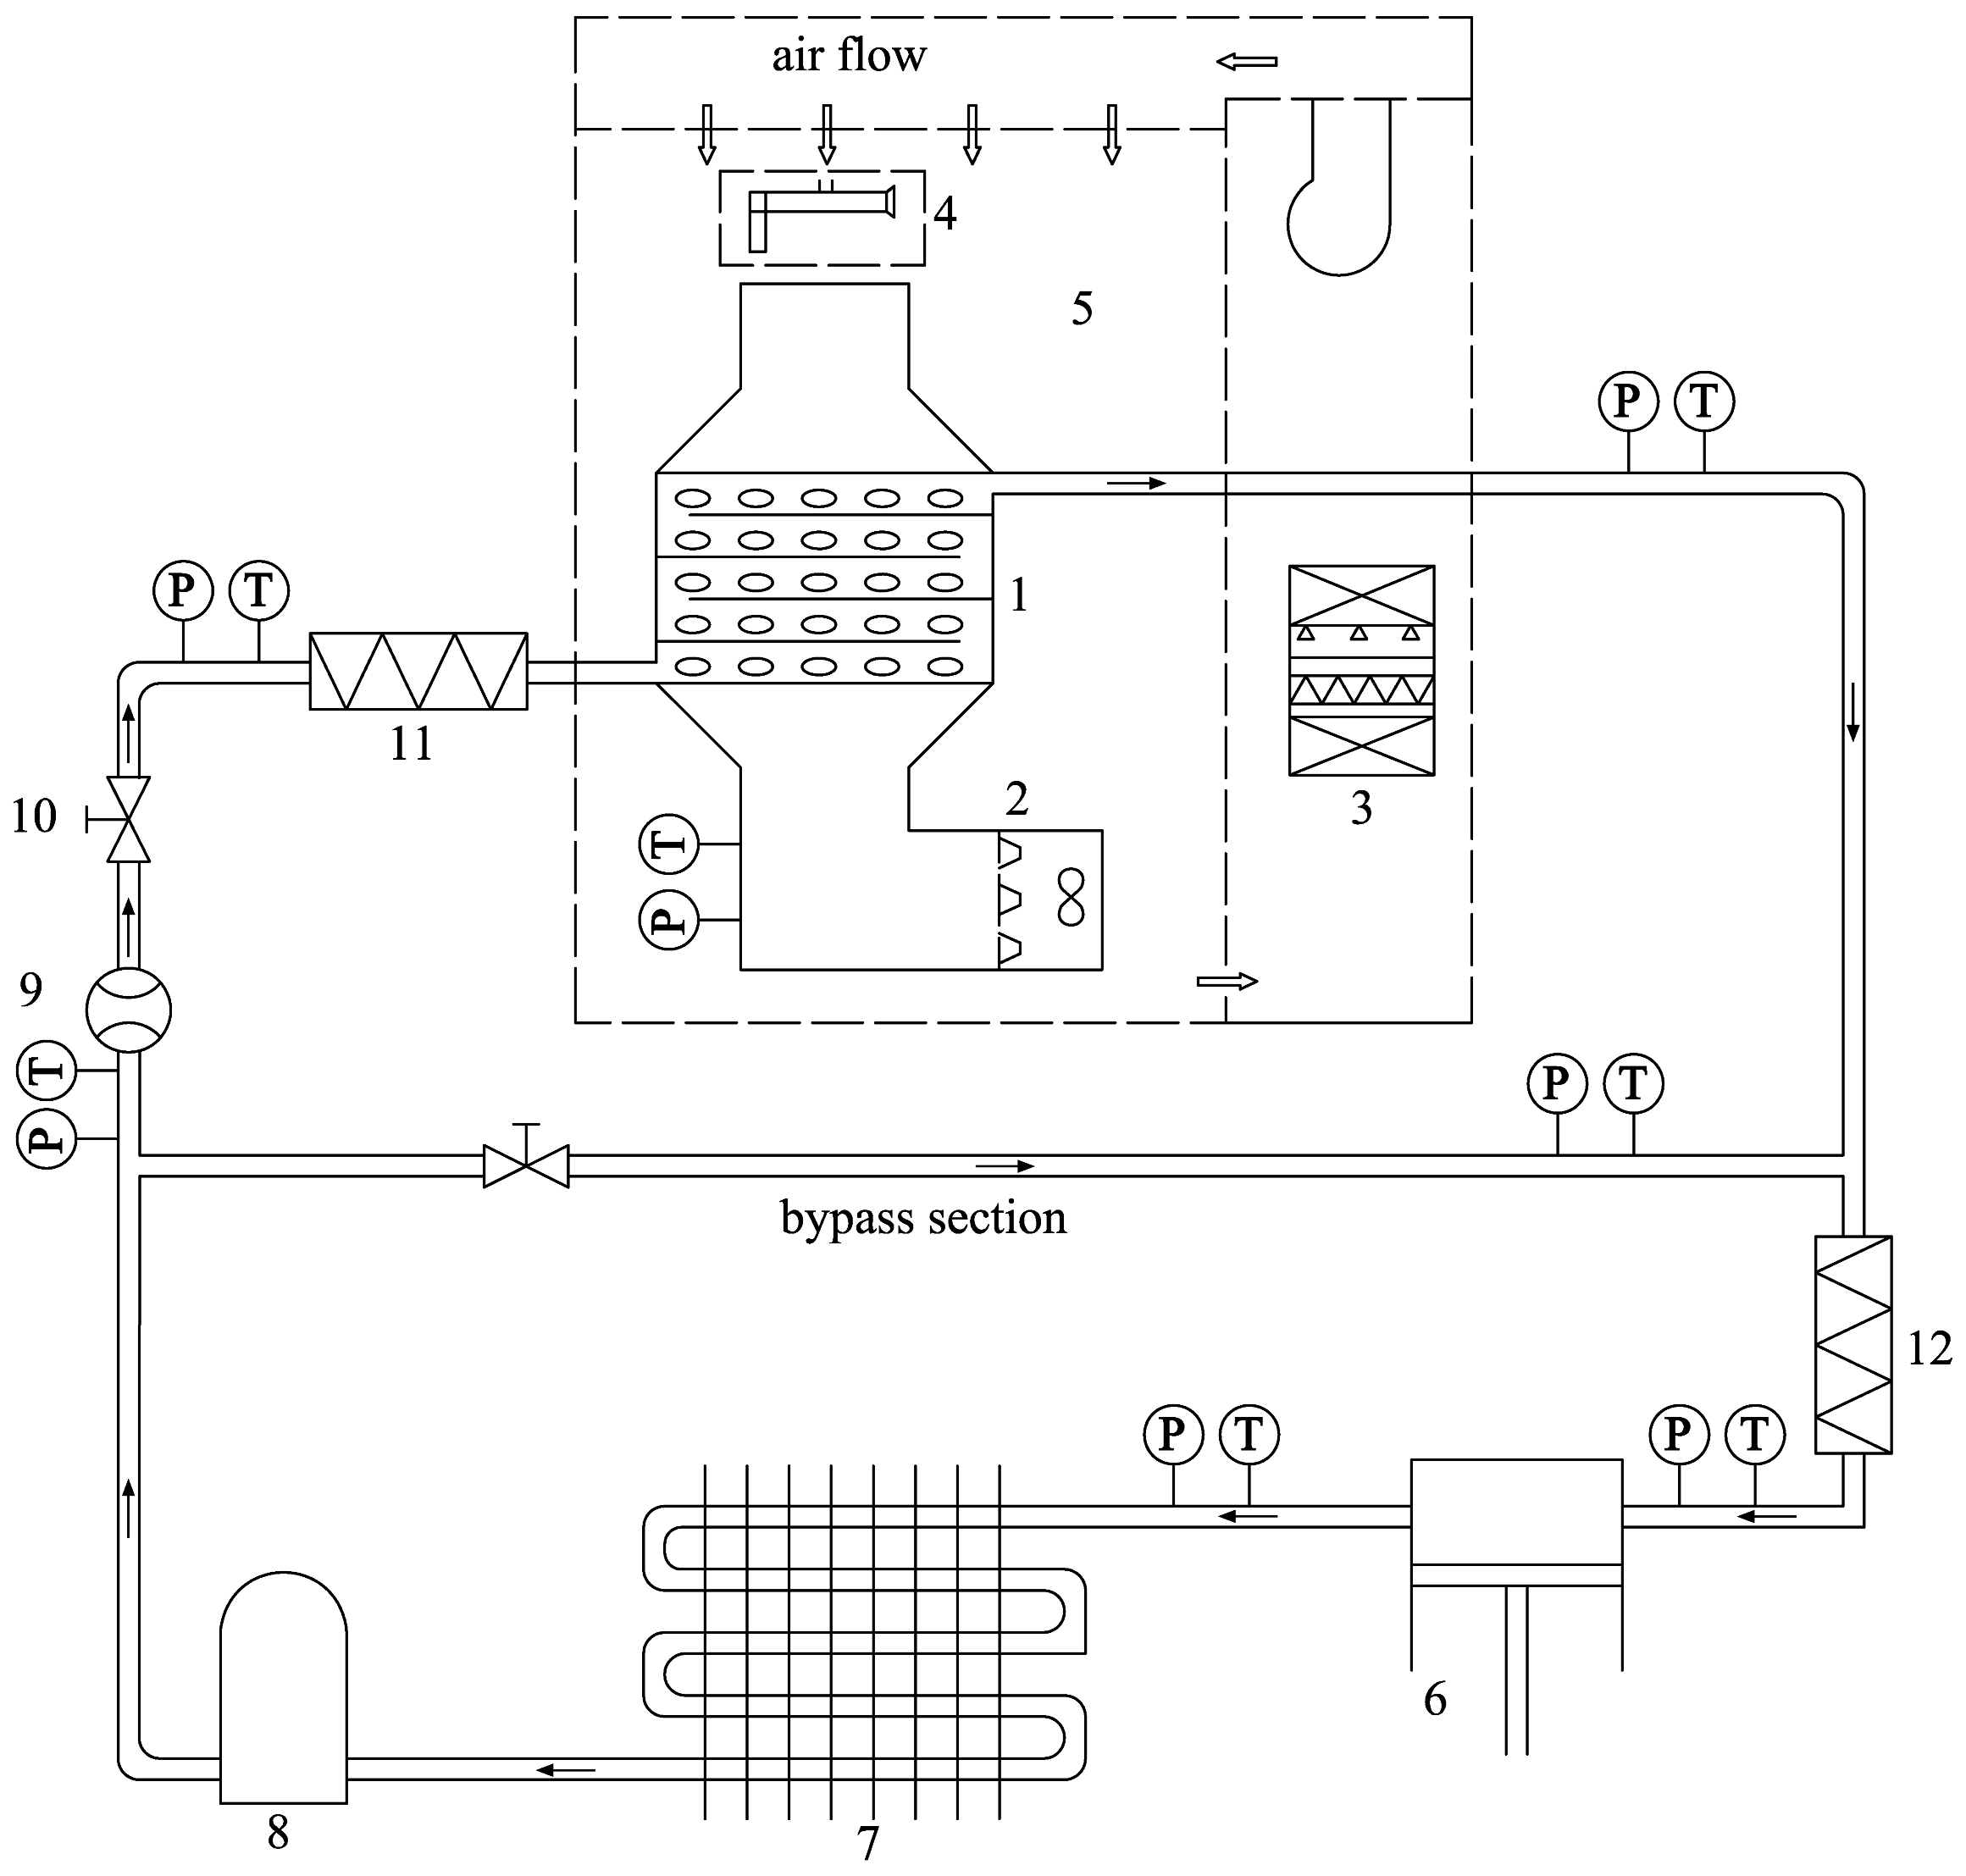
2.1. Physical Model

The structural model of the plate evaporator is shown in Figure 1.
The heat exchange core is formed by a series of plate bundles that are stacked in staggered manner. A single heat exchange plate bundle is formed by two plates through certain processing techniques to form channels with elliptical or flat cross-sections. The plate is made of stainless steel material with a thickness of 1 mm, and the physical parameters are as follows: density of 7930 kg·m−3; thermal conductivity of 17 W·(m·K)−1; specific heat 0.5 kJ·(kg·K)−1. The internal circulation channel of the plate bundle serves as the refrigerant channel, and the corrugated space formed by the staggered stacking of plate bundles serves as the air channel, as shown in Figure 2.
The size and spacing of evaporator plates are based on the optimized structural parameter ratio in reference [16]. The elliptical channel has a long axis of 16 mm and a short axis of 8 mm, with a spacing between plate bundles of 12.5 mm and a length of 800 mm. There are a total of 12 elliptical channels with a width of 216 mm, a middle channel with a width of 30 mm and a spacing of 50 mm, and a total of 10 air channels are set between plate bundles. The heat transfer area of a single plate bundle is 0.382 m2. The cross-sectional area of the air channel is 0.01 m2, and the equivalent diameter is 24.6 mm. The cross-sectional area of the refrigerant channel is 1.0 × 10⁻⁴ m2, with an equivalent diameter of 0.01 m. The heat exchange core consists of 11 plate bundles, with 10 air channels between the plate bundles.

2.2. Mathematical Models

Fluent includes three multiphase flow models, namely VOF model, Mixture model, and Eulerian model. The Mixture model is a simplified Eulerian model with moderate computational complexity, which can solve two-phase or multiphase flows with different velocities. In this article, the Mixture model [17] is selected, and the control equation is as follows.

2.2.1. Refrigerant Domain

Continuity equation:
t ( ρ m ) + ( ρ m u m ) = S m
In the formula, ρm is the density of the mixture, kg/m3; um is the average mass velocity, m/s; Sm is the quality source term, kg/(m3·s).
Momentum equation:
t ( ρ m u m ) + · ( ρ m u m u m ) = p + μ m u m + u m T + ρ m g + F · k = 1 n α k ρ k u d r , k u d r , k
In the formula, n is the number of phases; F is the volumetric force, N·m−3; μm is the viscosity of the mixture, Pa·s; udr,k is the slip velocity of the k-th phase, m/s.
Energy equation:
t k = 1 n α k ρ k E k + · k = 1 n α k u k ρ k E k + p = · k e f f T k h k J k + τ e f f · υ + S E
In the formula, keff is the effective thermal conductivity, W/(m·K); τeff is the stress tensor, Pa; h is the enthalpy of the substance; Jk is the diffusion flow rate, kg/s; SE is the energy source term, W/m3.
The turbulent flow adopts the standard k-ε two-equation model.
( ρ Y ) t ( ρ k ) + x i ( ρ k v i ) = x j μ + μ t σ k k x j + G k ρ ε
t ( ρ ε ) + x i ( ρ ε v i ) = x j μ + μ t σ ε ε x j + C 1 ε ε k G k C 2 ε ρ ε 2 k
In the formula, ε is the dissipation rate; Gk is the turbulent kinetic energy generated by the average velocity gradient, J; σk is the turbulent Prandtl number for k; σε is the turbulent Prandtl number for ε, Constant σk = 1.0, σε = 1.3, C = 1.44, C = 1.92.
Source terms equation:
In the process of evaporation and condensation heat transfer, the mass and energy transfer source terms are calculated using the phase transition coefficient model [18]. Compared with other models, the Lee model has simpler calculation formulas and wider applicability, and is widely used in the condensation process of pure steam and non-condensable gases [19,20,21]. Lee [22] regards flow as a dispersed flow with constant diameter, and the difference between the temperature of the unsaturated phase and the saturation temperature is the driving force of phase transition. The condensation and evaporation rates are also proportional to the difference.
Evaporation process:
T l > T s a t
S l = S v = r α l ρ l T s a t T l T s a t
Condensation process:
T v < T s a t
S l = S v = r α v ρ v T v T s a t T s a t
Energy source term:
S E = L · S m , l = L · S m , v
In the formula, Sl, Sv are the mass transfer quantities during the phase transition process, kg/(m3·s); α is the volume fraction of each phase; ρ is the density of each phase, kg/m3; T is the fluid temperature, K; Tsat is the saturation temperature, K; r is the phase transition coefficient, s−1.
The determination of the phase transition coefficient r in the Lee model is crucial for numerical calculations. The value of r is related to gas composition, temperature, pressure, model structure, grid size, time step, etc. [23]. To simplify the complexity of calculations, the phase transition coefficient r is usually taken as a constant value when using the Lee model. If the value of r is too large, it will cause difficulty in numerical calculation convergence, and if it is too small, it will lead to a certain deviation between the gas–liquid interface temperature and the saturation temperature.
Qiu Guodong et al. [24] studied the rationality of the value of phase transition coefficient in the Lee model and proposed using two indicators to evaluate the rationality of phase transition coefficient: the proportion of latent heat transfer to total heat transfer, and the difference between fluid temperature and saturation temperature. The theoretical expressions for latent heat share and saturation temperature difference were derived through steady-state analysis models. It was recommended that the phase transition coefficient should be above 104 under common operating conditions. In this article, r is set to 104 s−1.

2.2.2. Air Domain

The continuity equation, momentum equation, energy equation, and turbulent model equation are consistent with the refrigerant domain.
When the moist air on the air side flows through the surface of the cold plate bundle below its dew point temperature, water vapor condenses, and heat transfer includes convective heat transfer and condensation heat transfer. Consider moist air as a bicomponent ideal gas composed of water vapor and dry air, and ignore the thermal resistance of the condensate film. The conservation equation of components needs to be activated [25]:
( ρ Y ) t + ( ρ u Y ) = J + S d
In the formula, Y is the mass fraction of the substance; Sd is the source term generated by the condensation of steam components; J is the diffusion flux of the component:
J = ρ D m + μ t S c t Y D T T T
In the formula, μt and Sct are the turbulent viscosity coefficient and turbulent Schmidt number, respectively; Dm is the mass diffusion coefficient; DT is the thermal diffusion coefficient.

2.2.3. Solid Domain

Energy equation:
2 t = 0
In the formula, t is the temperature in K.

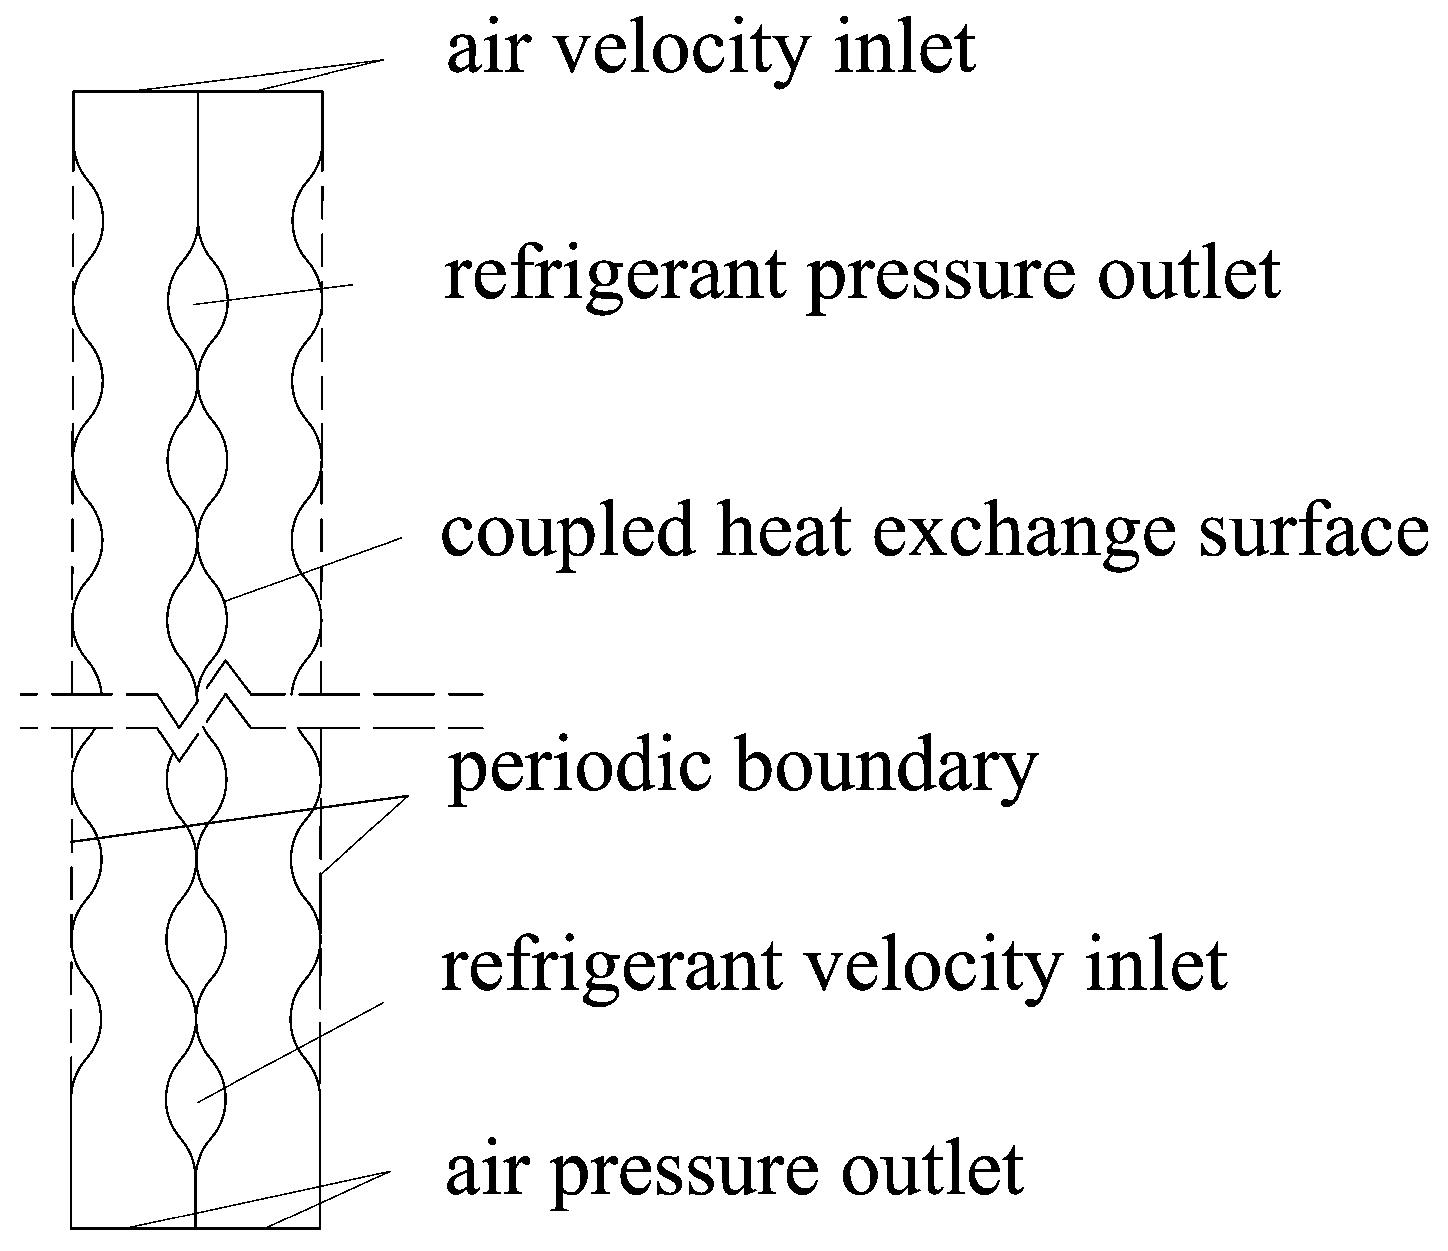
2.3. Boundary Conditions

The boundary conditions of the mathematical model of the plate evaporator are shown in Figure 3:
Both the air and refrigerant inlets are set as velocity inlet boundary conditions. Both the air and refrigerant outlets are set as pressure outlet boundaries. The heat exchange surfaces are set as coupled surface boundary conditions: the left and right interfaces are set as periodic boundary conditions, and the other boundaries are set as wall boundary conditions.
According to the common operating conditions of cold storage, the air inlet temperature is set at 6 °C, the relative humidity is 80%, and the inlet flow velocity range is 1–5 m/s. The inlet dryness (the mass fraction of vapor in the two-phase mixture) of refrigerant R22 is set to 0.27, with a temperature of −5 °C and a saturation pressure of 0.4218 MPa at that temperature. The mass flow rate is matched with the air flow rate based on the actual heat transfer situation. After multiple numerical calculations, the value corresponding to the complete evaporation of the refrigerant is taken. The process of moist air cooling and dehumidification is shown by the red line in Figure 4. The refrigerant mass flow rate, air outlet temperature, and relative humidity at different air inlet velocities are shown in Table 1.

3. Numerical Simulation Results and Analysis

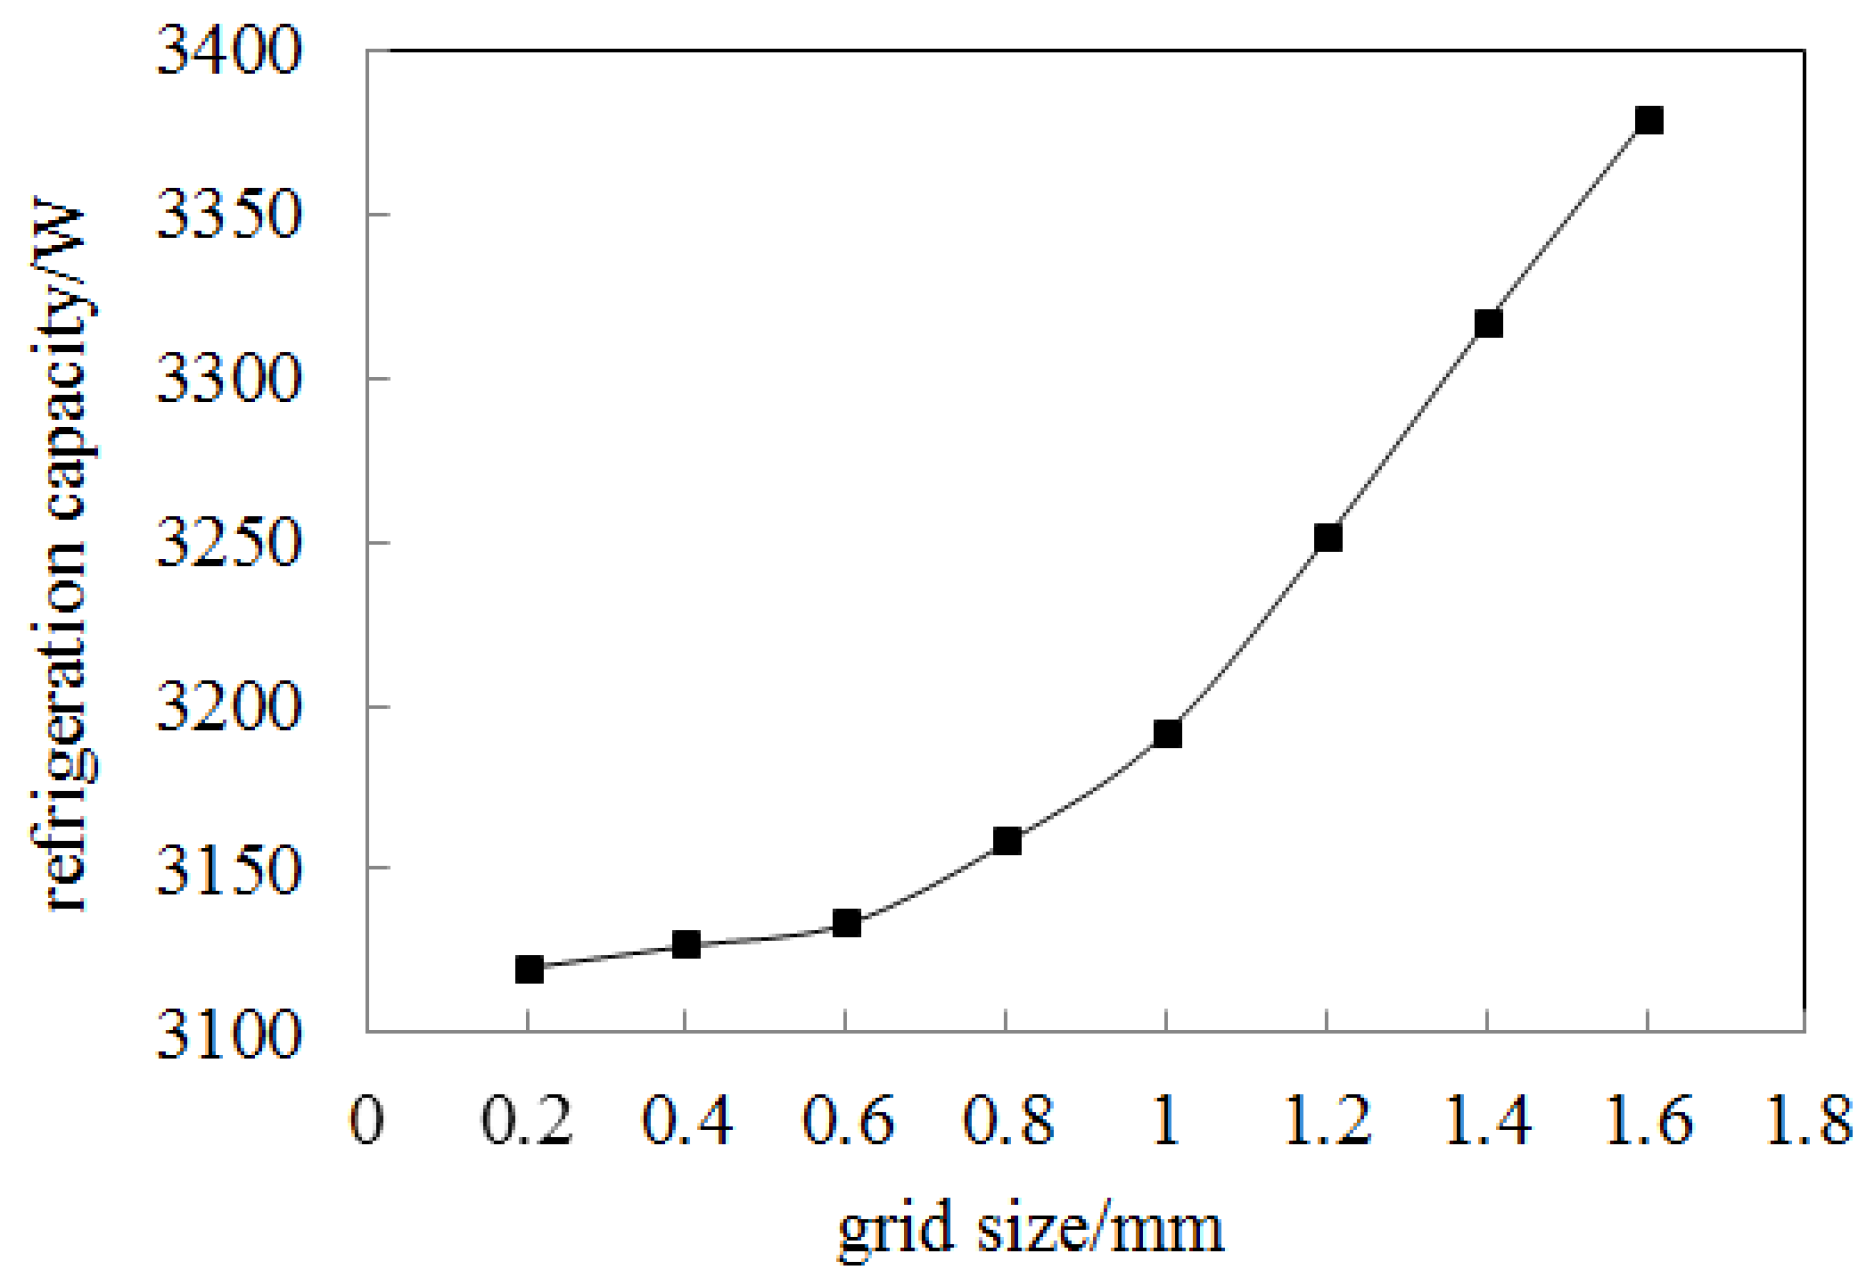
3.1. Grid Independence Verification

When using Fluent for numerical simulation calculations, a discrete implicit method is used, with PISO for pressure discretization and SIMPLE for pressure velocity coupling. According to the model size of the evaporator heat exchange channel, the grid size range is selected between 0.2 and 1.6 mm, with different grid sizes taken every 0.2 mm interval for numerical simulation. The working conditions are simulated as a unified working condition.
The working condition with an air flow velocity of 3 m/s selected in Table 1 is taken as an example. The dew point temperature is derived from the Magnus formula.
t d = 235 × 7.45 lg R H · 10 7.45 t 235 + t 1 1
In the formula, t is the dry bulb temperature of the air, °C; RH is the relative humidity.
The variation in cooling capacity at different grid sizes is shown in Figure 5. It can be seen that as the grid size decreases, the cooling capacity continuously decreases. When the grid size decreases to 0.2–0.6 mm, the cooling capacity remains stable. Taking into account the solution accuracy and required computational resources, the grid size parameter used in this paper is 0.6 mm.

3.2. Calculation Results

Liquid R22 absorbs heat and evaporates inside the elliptical tube. The phase transition and pressure change in R22 along the flow direction inside the tube are shown in Figure 6 and Figure 7.
The moist air releases heat. The temperature drops to 0.3 °C, and the humidity drops to 3.52 mg/L at the outlet. The temperature, humidity, and pressure changes on the air side are shown in Figure 8, Figure 9 and Figure 10.
The variation in R22 dryness along the relative pipe length in the elliptical channel is shown in Figure 11.
From Figure 11, it can be seen that refrigerant R22 with a dryness of 0.27 enters the elliptical channel, absorbing heat from the air and evaporating phase change. The dryness first increases rapidly and then slows down after reaching about 0.8, until complete evaporation occurs. This is because when the dryness of the refrigerant is low, refrigerant bubbles generated by heat absorption and evaporation at the inner wall of the channel begin to enter the main flow area of the refrigerant, increasing refrigerant disturbance. As the dryness increases, the thickness of the liquid film on the inner wall of the channel decreases, and convective heat transfer is enhanced. The evaporation rate of R22 increases with the increase in dryness within the range of relative pipe length from 0 to 0.6. As the dryness further increases, the liquid film on the wall begins to dry up, causing direct contact between the wall and refrigerant vapor, resulting in a deterioration of heat transfer and a slowdown in evaporation rate. When the relative length of the channel is 0.97, R22 completely evaporates and there is superheated steam at the outlet.
The cooling capacity of the evaporator can be obtained from the inlet and outlet parameters.
Heat exchange on the air side:
Q a = m a ( h a 1 h a 2 )
In the formula, Qa is the cooling capacity on air side, kW; ma is the mass flow rate of air, kg/s; ha1 is the specific enthalpy of air at the inlet of the evaporator, kJ/kg; ha2 is the specific enthalpy of air at the outlet of the evaporator, kJ/kg.
Heat exchange on the refrigerant side:
Q r = m r ( h r 2 h r 1 )
In the formula, Qr is the cooling capacity on R22 side, kW; mr is the mass flow rate of R22, kg/s; hr1 is the specific enthalpy of R22 at the inlet of the evaporator, kJ/kg; hr2 is the specific enthalpy of R22 at the outlet of the evaporator, kJ/kg.
Energy balance on both sides:
Q a = Q r
Overall heat transfer coefficient:
U 0 = Q a A Δ t m
In the formula, A is the total heat exchange area, m2; Δtm is the logarithmic mean temperature difference, °C.
The calculation results of the refrigeration capacity, refrigerant side pressure drop, air side pressure drop and overall heat transfer coefficient of the plate evaporator in various operating conditions are shown in Table 2.

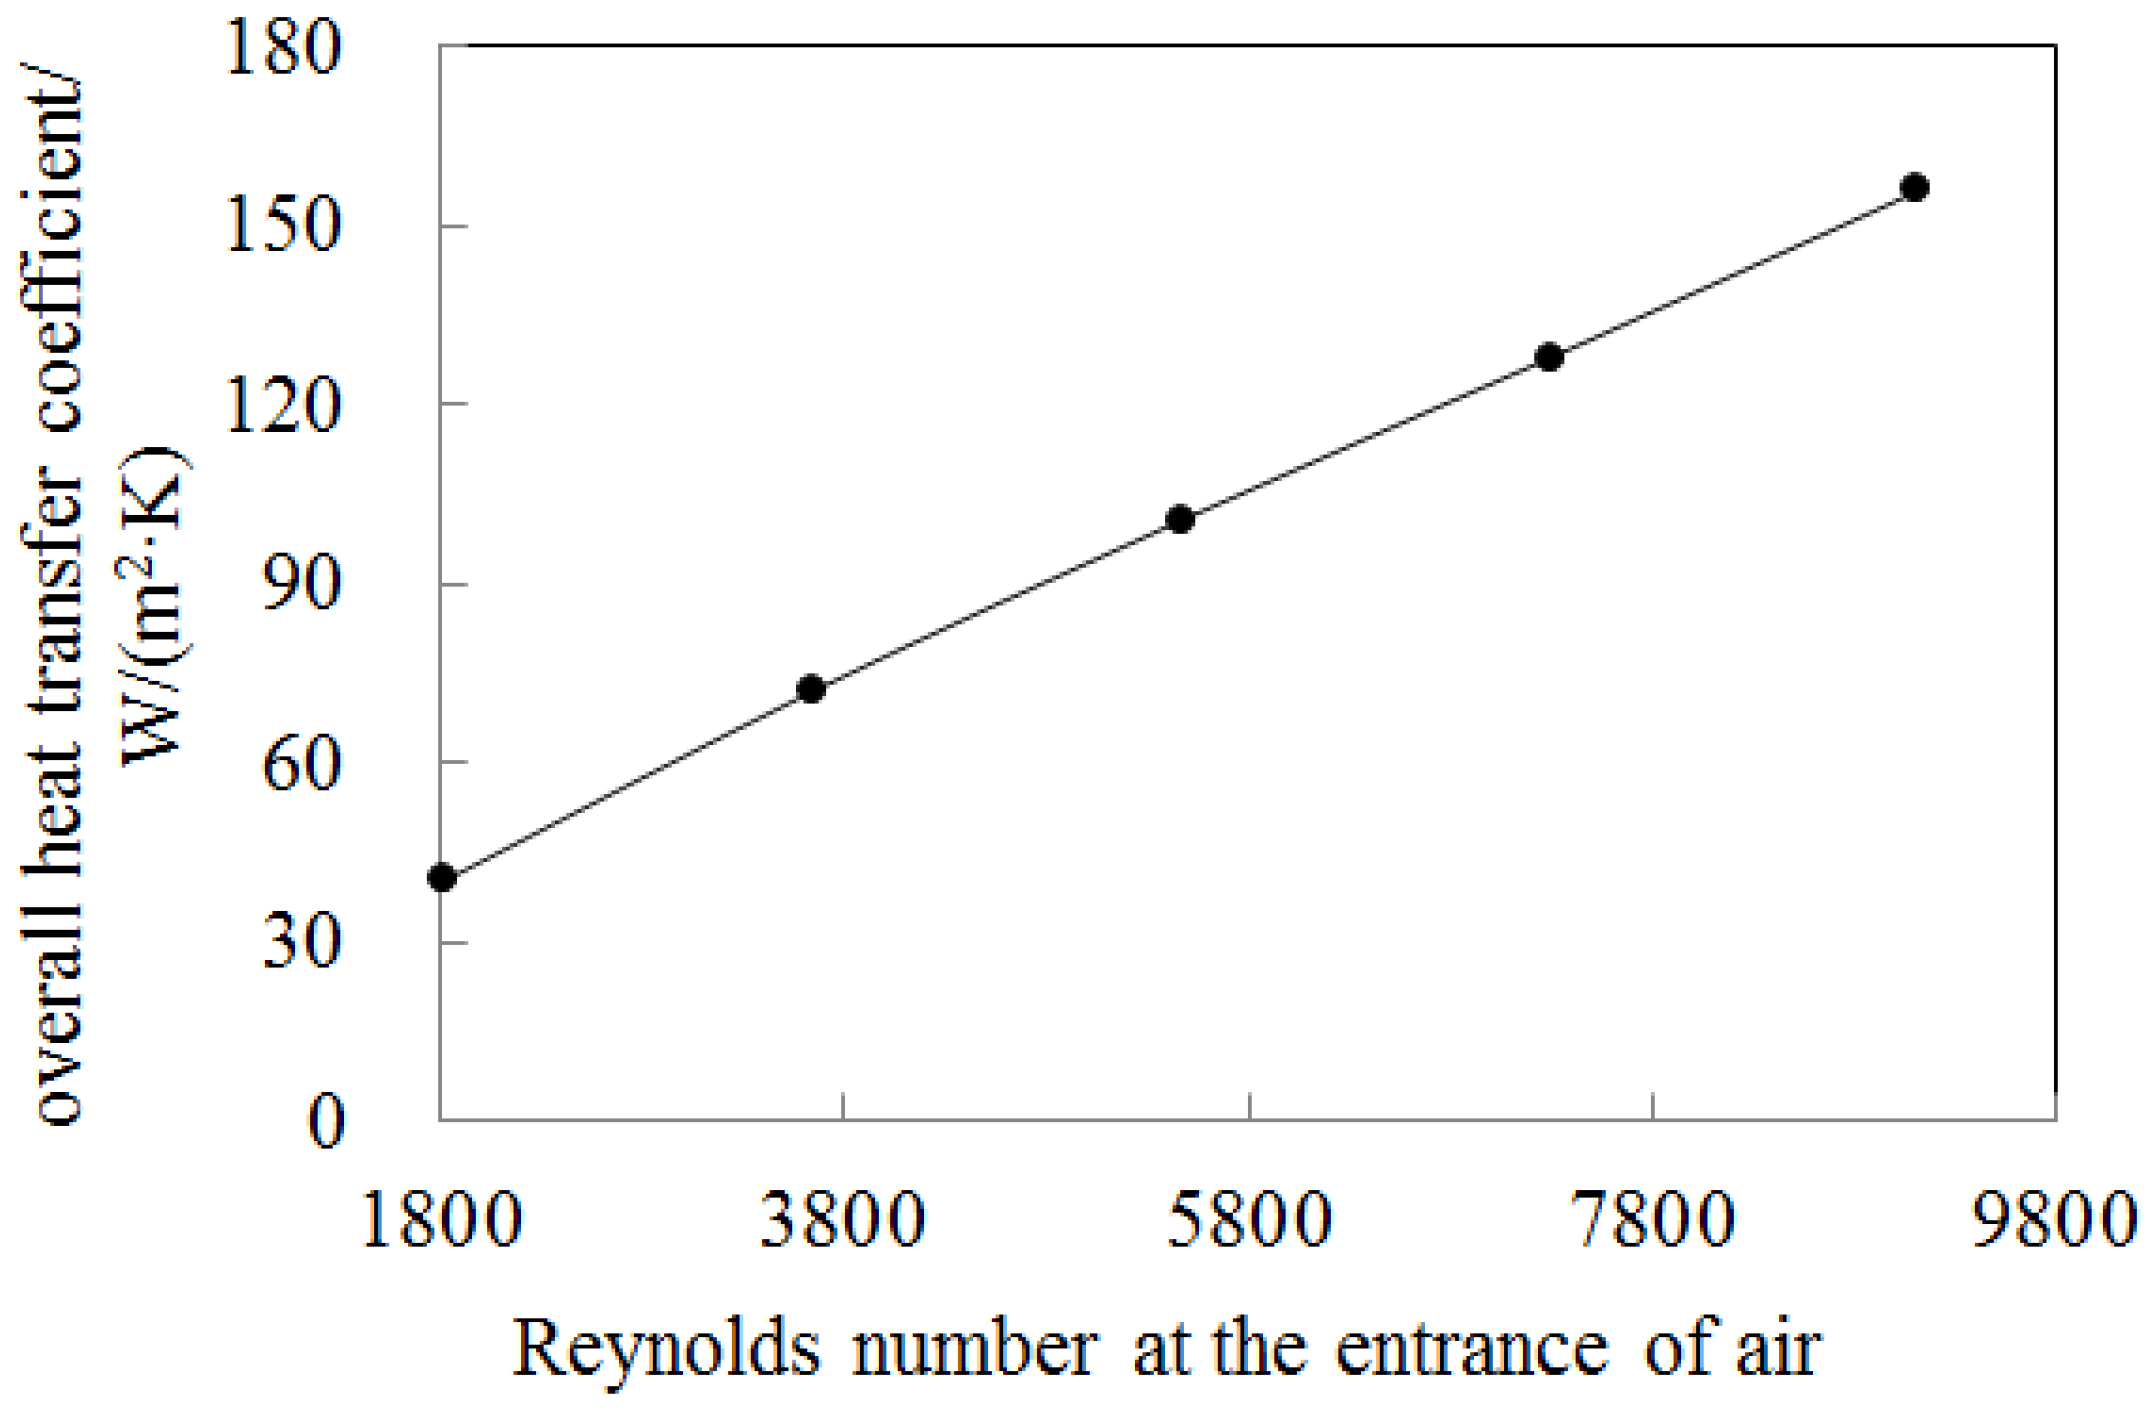
3.3. Analysis of Heat Transfer and Pressure Drop Characteristics

The performance changes of the evaporator in different inlet conditions are shown in Figure 12 and Figure 13.
From Figure 12, it can be seen that the cooling capacity of the evaporator increases linearly with the increase in refrigerant mass flow rate.
The pressure drop on the refrigerant side increases with the increase in refrigerant mass flow rate, and the growth rate accelerates. This is because the increase in refrigerant mass flow rate enhances fluid turbulence and increases flow resistance.
As shown in Figure 13, the cooling capacity of the evaporator increases linearly with the increase in inlet wind speed.
The air side pressure drop increases with the increase in air inlet flow rate. This is because as the air velocity increases, the fluid turbulence effect increases, and the disturbance becomes more severe, resulting in an increase in pressure drop.
The relationship between the total heat transfer coefficient of the evaporator and the Reynolds number at the fluid inlet on both sides is shown in Figure 14 and Figure 15.
From Figure 14 and Figure 15, it can be seen the overall heat transfer coefficient increases linearly with the increase in the Reynolds number of the heat transfer fluid.

4. Experimental Study on Plate Evaporator

4.1. Experimental System

To verify the accuracy of the numerical simulation results, a plate evaporator refrigeration experiment was conducted. The system diagram is shown in Figure 16.
The experimental system includes a refrigeration system, an electric heating system, an air side measurement system, and a data acquisition system.
The main components of the refrigeration system are the compressor, condenser, storage tank, expansion valve, and plate evaporator. The size parameters and heat transfer area of the plate evaporator are consistent with the numerical simulation physical model.
The air side measurement system of the evaporator mainly consists of a constant temperature and humidity environment room, an air reprocessing device, and an air volume testing device. The plate evaporator is placed inside the enthalpy difference experimental chamber. The cooling capacity is obtained by multiplying the air volume passing through the cupboard-type air terminal and the enthalpy difference between the inlet and outlet air of the evaporator.
When the system is running, the refrigerant gas with high temperature and pressure is discharged from the compressor, condensed into liquid after passing through the condenser and flows into the liquid reservoir. Then, the opening of the manual throttle valve in the system is adjusted so that the refrigerant flows out in two ways, one way through the bypass pipeline, the other way to the evaporation pipe section, and then flows into the evaporator after being throttled by the manual throttle valve. After exchanging heat with air, the refrigerant flowing out of the evaporator section mixes with the refrigerant flowing out of the bypass branch, enters the superheated section, is heated to a superheated state, and then enters the compressor to complete a refrigeration cycle.
The measuring instruments used in the experimental system are shown in Table 3.

4.2. Uncertainty Analysis

The air enthalpy difference method for testing refrigeration capacity involves multiple measurement steps, which can lead to error accumulation during the testing process, resulting in uncertainty in the test results.
The formula for calculating refrigeration capacity is
Φ = q ( h a 1 h a 2 ) M R T ( P P W )
In the formula, Φ is the cooling capacity, W; q is the indoor unit air volume, m3/s; ha1 is the specific enthalpy of the indoor unit inlet air, kJ/kg; ha2 is the specific enthalpy of the indoor unit outlet air, kJ/kg; M is the dry air molar mass, kg/mol; R is the universal gas constant, J/(kg·K); T is the dry bulb temperature of the indoor unit’s air, °C; P is atmospheric pressure, Pa; PW is the partial pressure of water vapor at the exit wet bulb temperature, Pa.
The relative uncertainty of each component value is calculated based on the measurement accuracy of the instrument, the coverage factor of the conceptual distribution, and the sensitivity coefficient. The specific calculation method can be found in reference [26], The working condition with an air flow velocity of 3 m/s selected in Table 1 is taken as an example, the calculation results are shown in Table 4.
The relative standard uncertainty of synthesis is
u ( Φ ) Φ = i = 1 n u ( x i ) x i 2
In the formula, u ( x i ) x i is the relative uncertainty of each uncertainty source component.
The expanded relative standard uncertainty is
U = k u ( Φ ) Φ
In the formula, k is the coverage factor.
According to Equations (20) and (21), the combined relative standard uncertainty of refrigeration capacity is 3.34%, and the extended relative standard uncertainty is 6.67%.

4.3. Test Results and Analysis

In the experiment, the evaporation temperature is set to −5 °C, the pressure is the saturation pressure at this temperature of 0.4218 Mpa, and the outlet superheat of the evaporator is 3 °C. The condensation temperature is 45 °C, and the pressure is the saturation pressure at this temperature of 1.7292 Mpa. The subcooling degree at the outlet of the condenser is 4 °C. The enthalpy diagram of the refrigeration cycle is shown in Figure 17.
In different air flow conditions, the refrigerant flow rate was adjusted by monitoring the outlet temperature of the evaporator, as well as by monitoring the outlet temperature of the condenser and adjusting the air flow rate on the condenser side to meet the subcooling requirements.
The experimental test results are shown in Table 5.
From Table 3, it can be seen that the heat transfer error on both sides of the evaporator is within 5%.
The comparison between experimental and numerical simulation results is shown in Figure 18 and Figure 19.
Data comparison reveals that the experimental results have the same trend as numerical simulations. The cooling capacity calculated by numerical simulation is about 8% higher than the experimental value. This may be due to two reasons. One reason is that in the experiment, liquid water droplets or water films were formed on the surface of the plate due to the condensation of humid air, which increased the heat transfer resistance. However, this part of the heat transfer resistance was ignored in the numerical calculation model. Secondly, uneven refrigerant separation occurred within the plate bundle of the plate evaporator, which affected the heat transfer process. The pressure drop error on the refrigerant side and air side was within 5.1%. It can be seen that the model established above is correct and reliable.

5. Conclusions

A new type of plate evaporator suitable for cold storage refrigeration systems is designed, and R22 is selected as the refrigerant to conduct numerical simulation and experimental research on the heat transfer characteristics of the evaporator. The research results indicate the following:
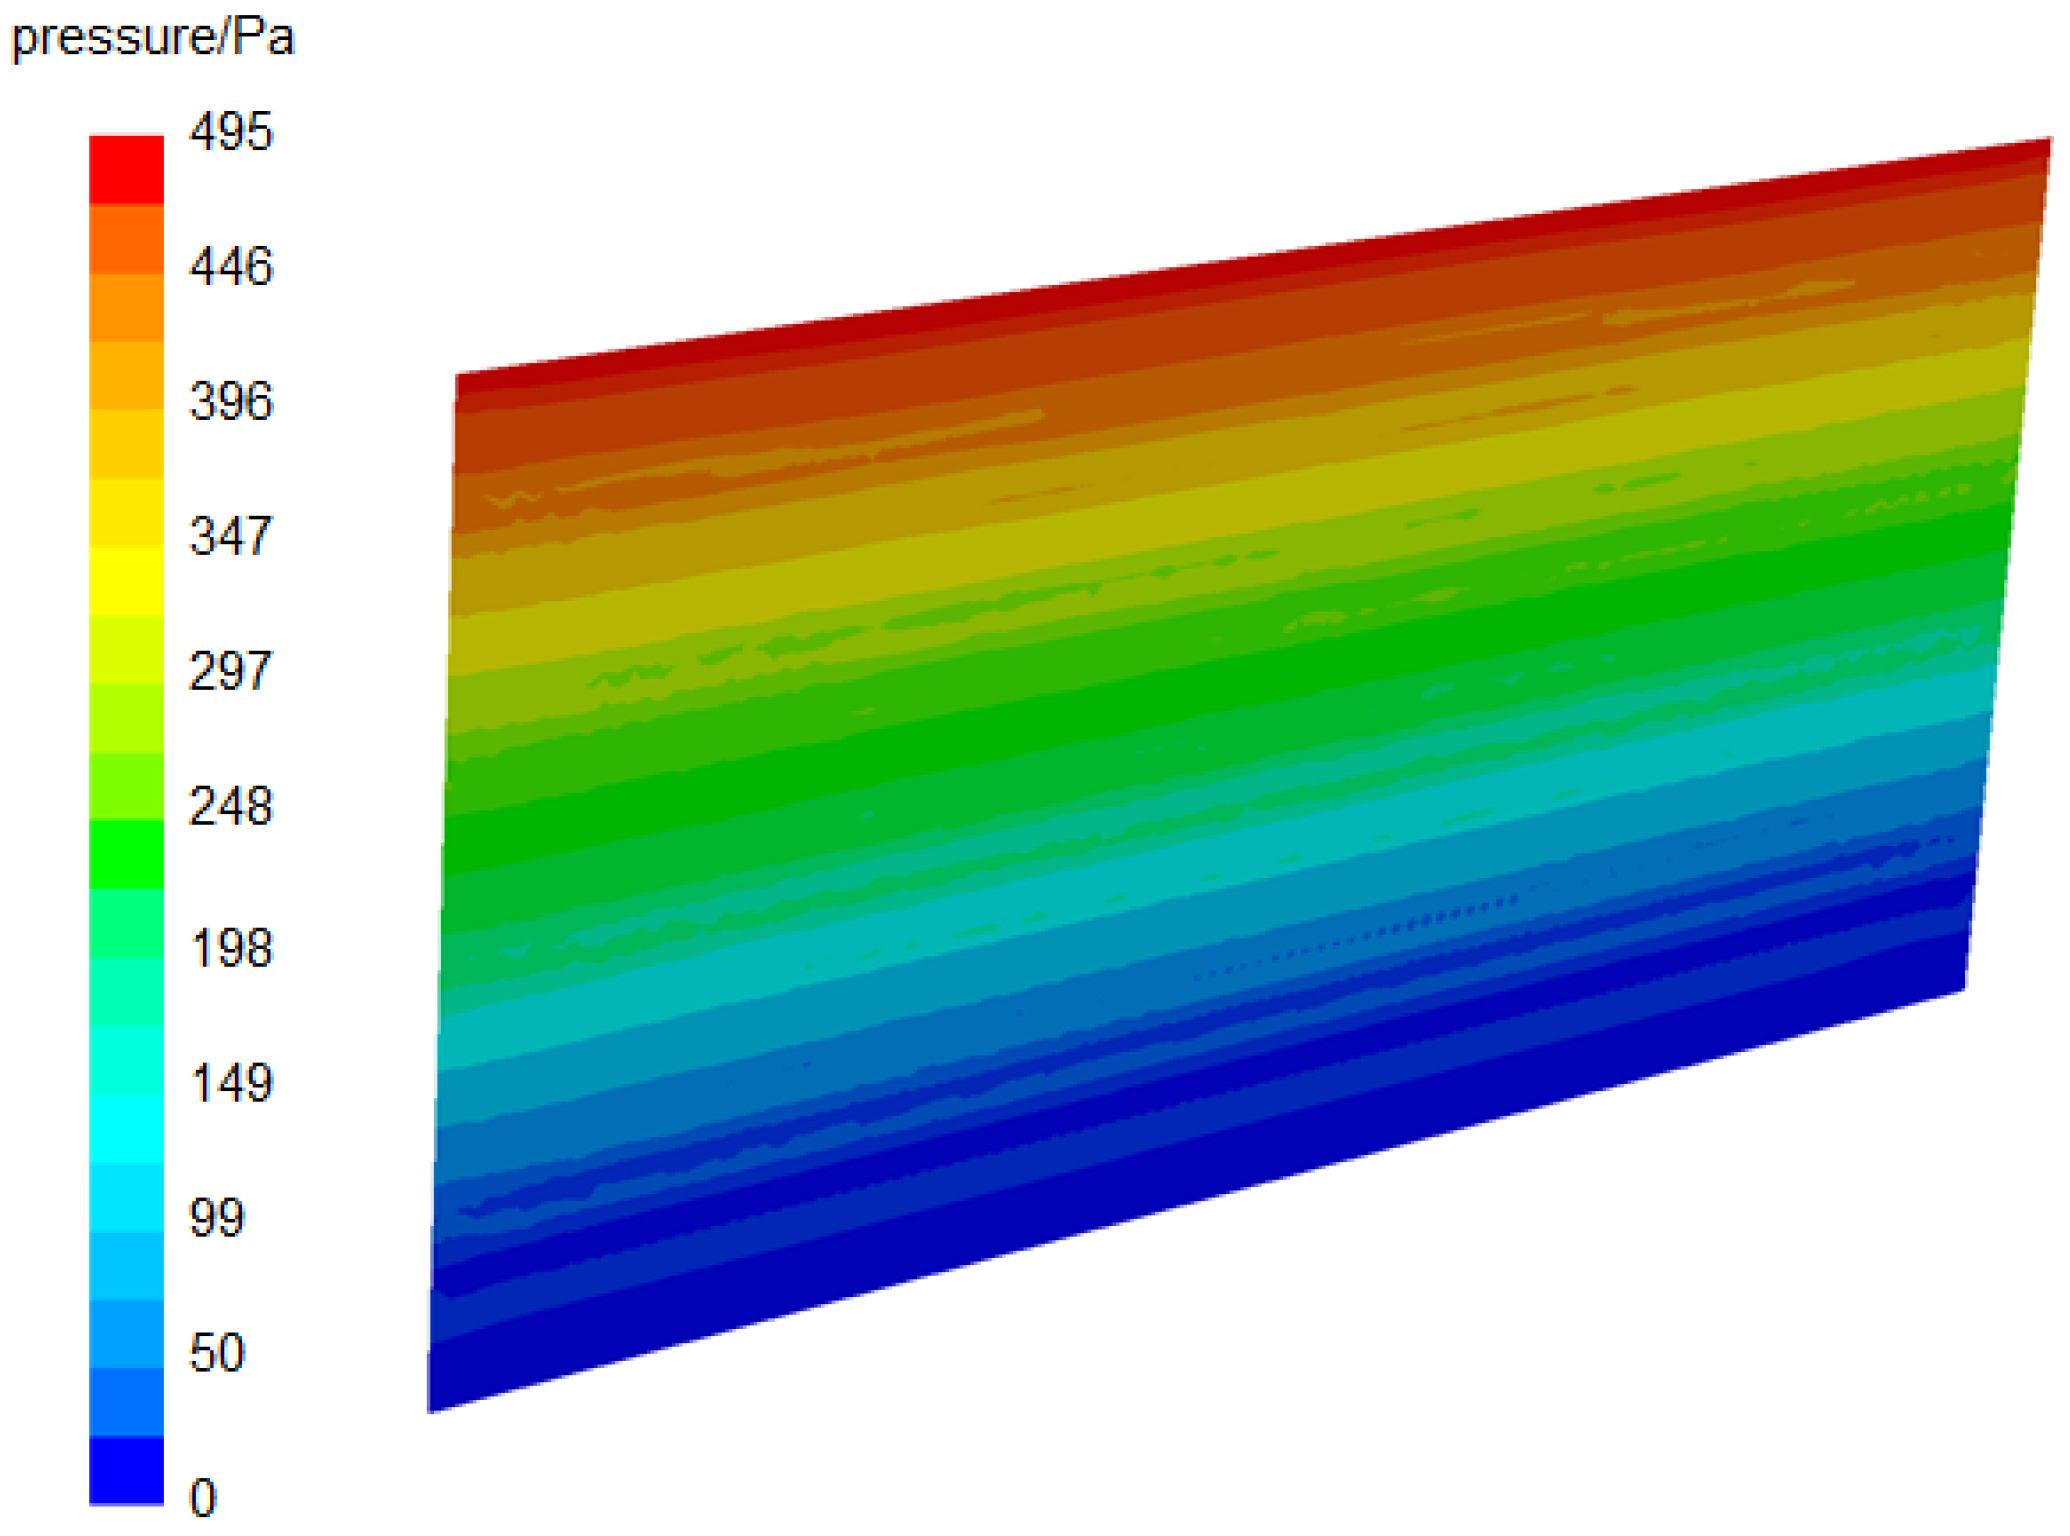
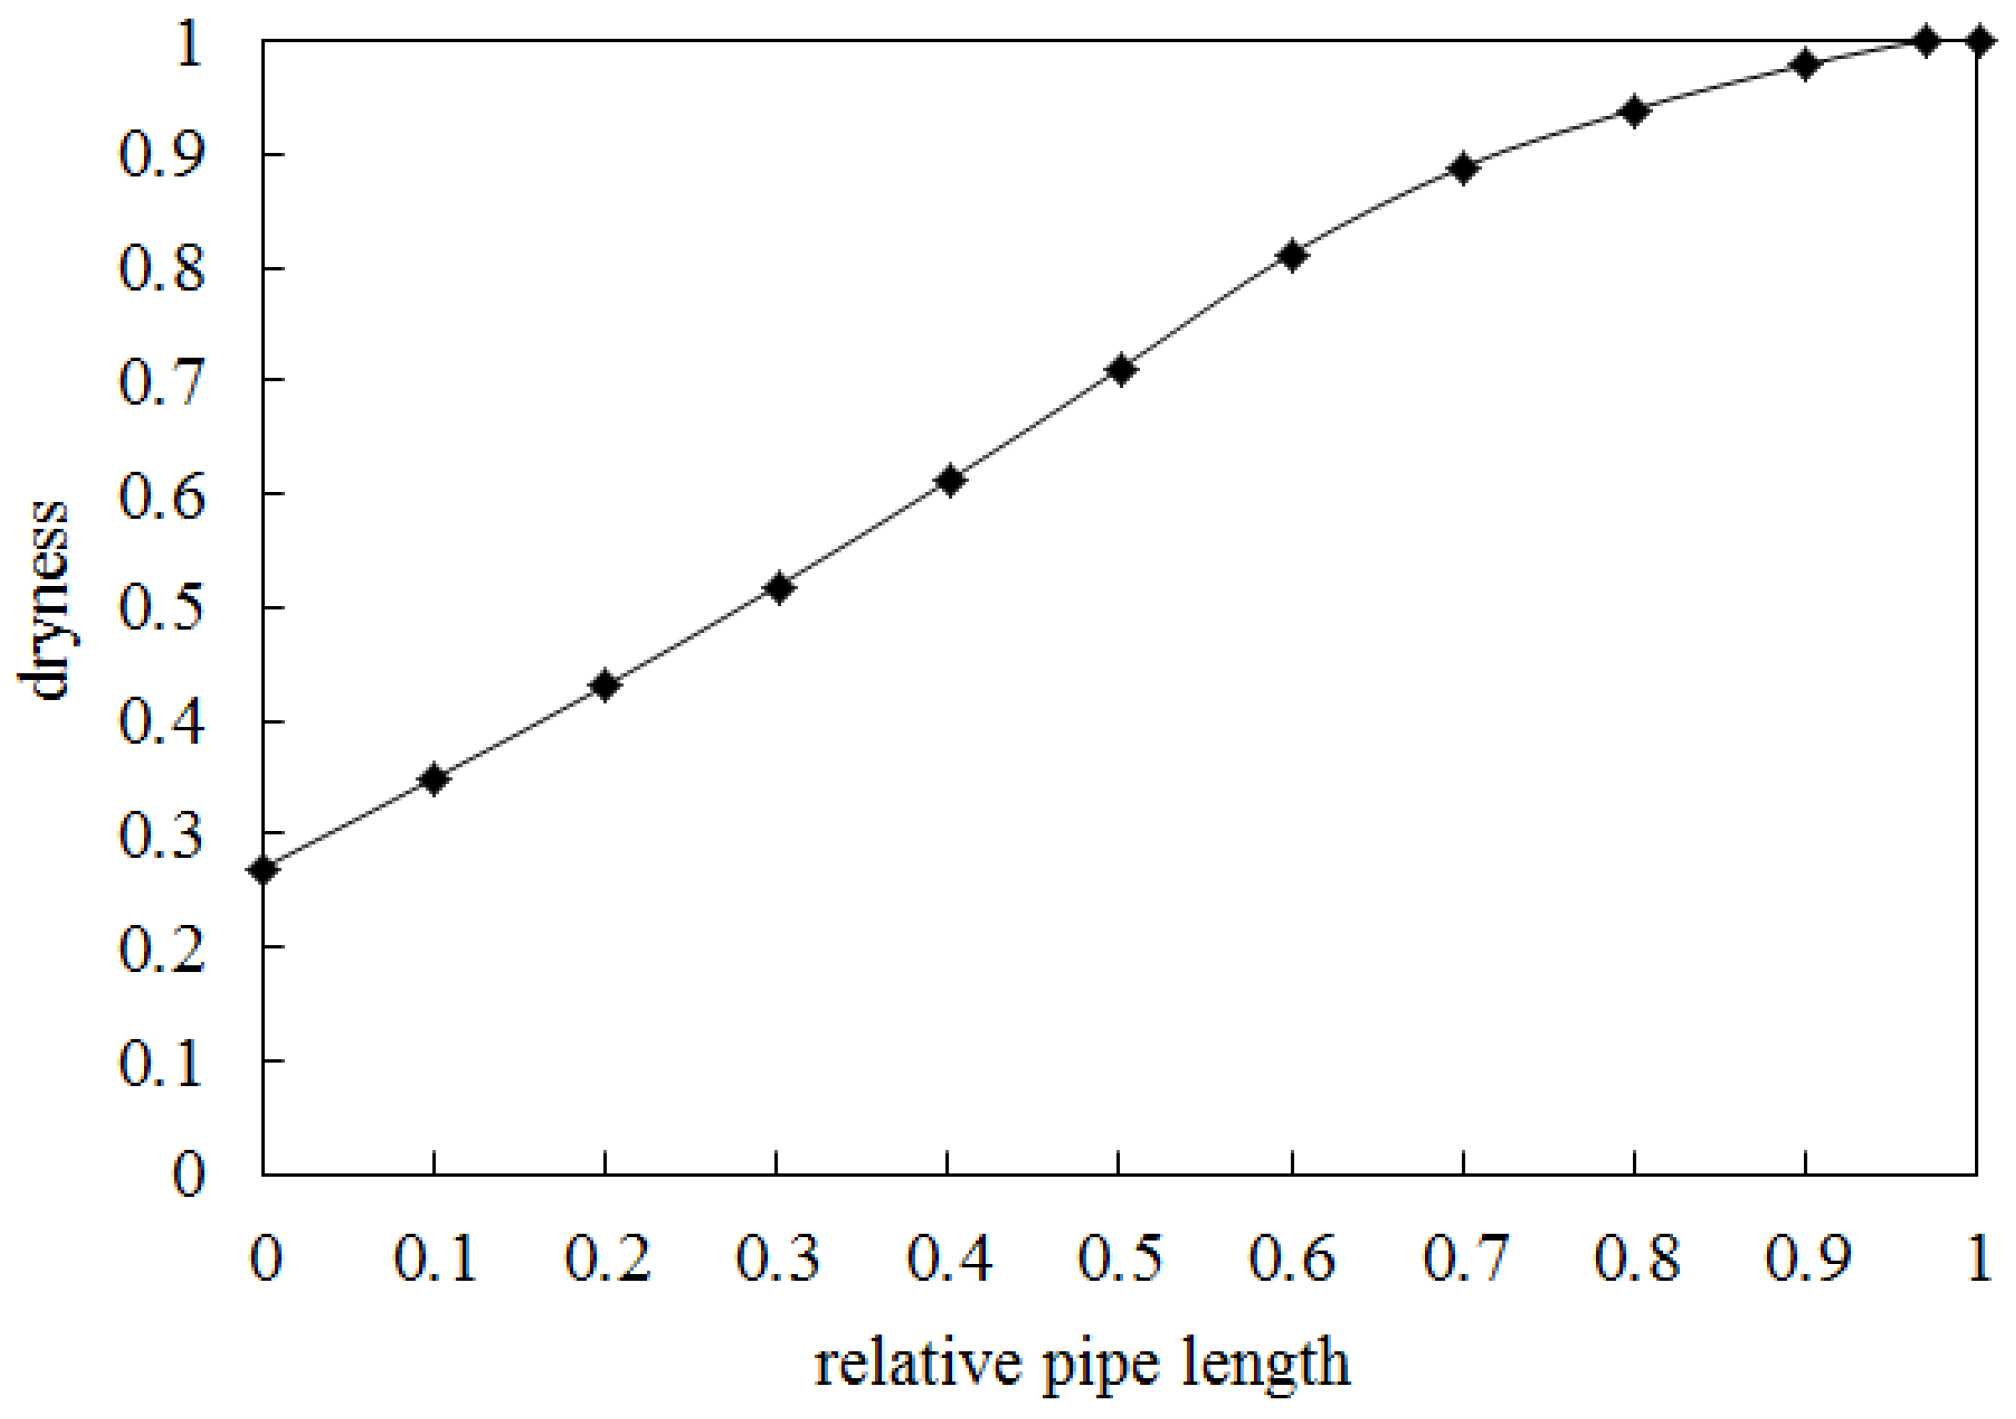
  • The design working condition is that the inlet dryness of refrigerant R22 is 0.27, the temperature is −5 °C, the pressure is the saturation pressure at this temperature, the mass flow rate is 0.0187 kg/s, the air inlet temperature is 6 °C, the relative humidity is 80%, and the flow rate is 3 m/s. The new plate evaporator has a cooling capacity of 3.13 kW, a refrigerant side pressure drop of 1.36 kPa, and an air side pressure drop of 495 Pa.
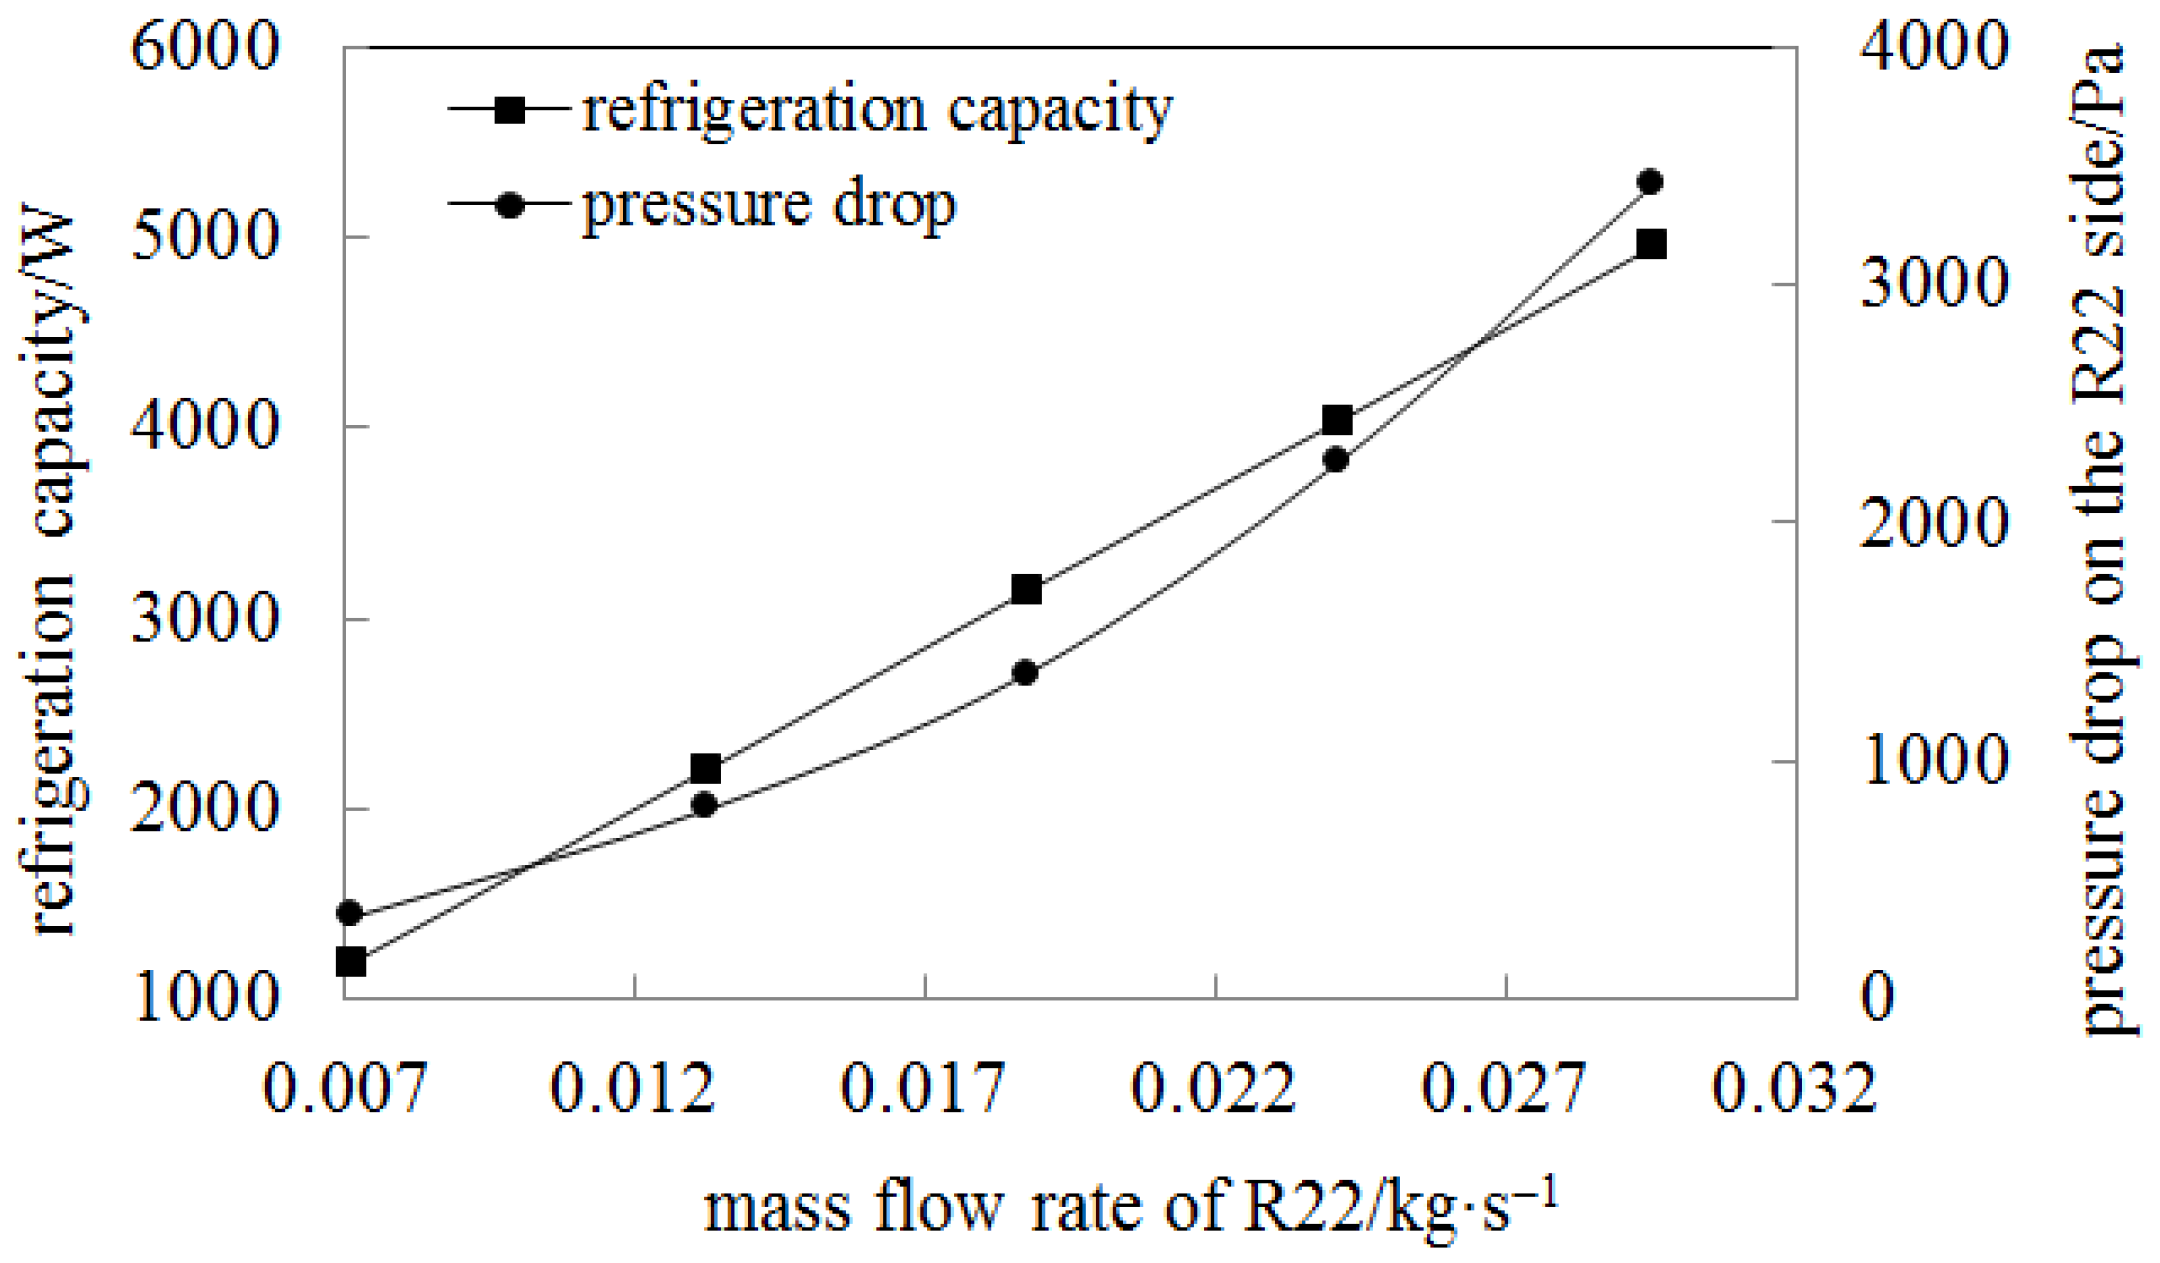
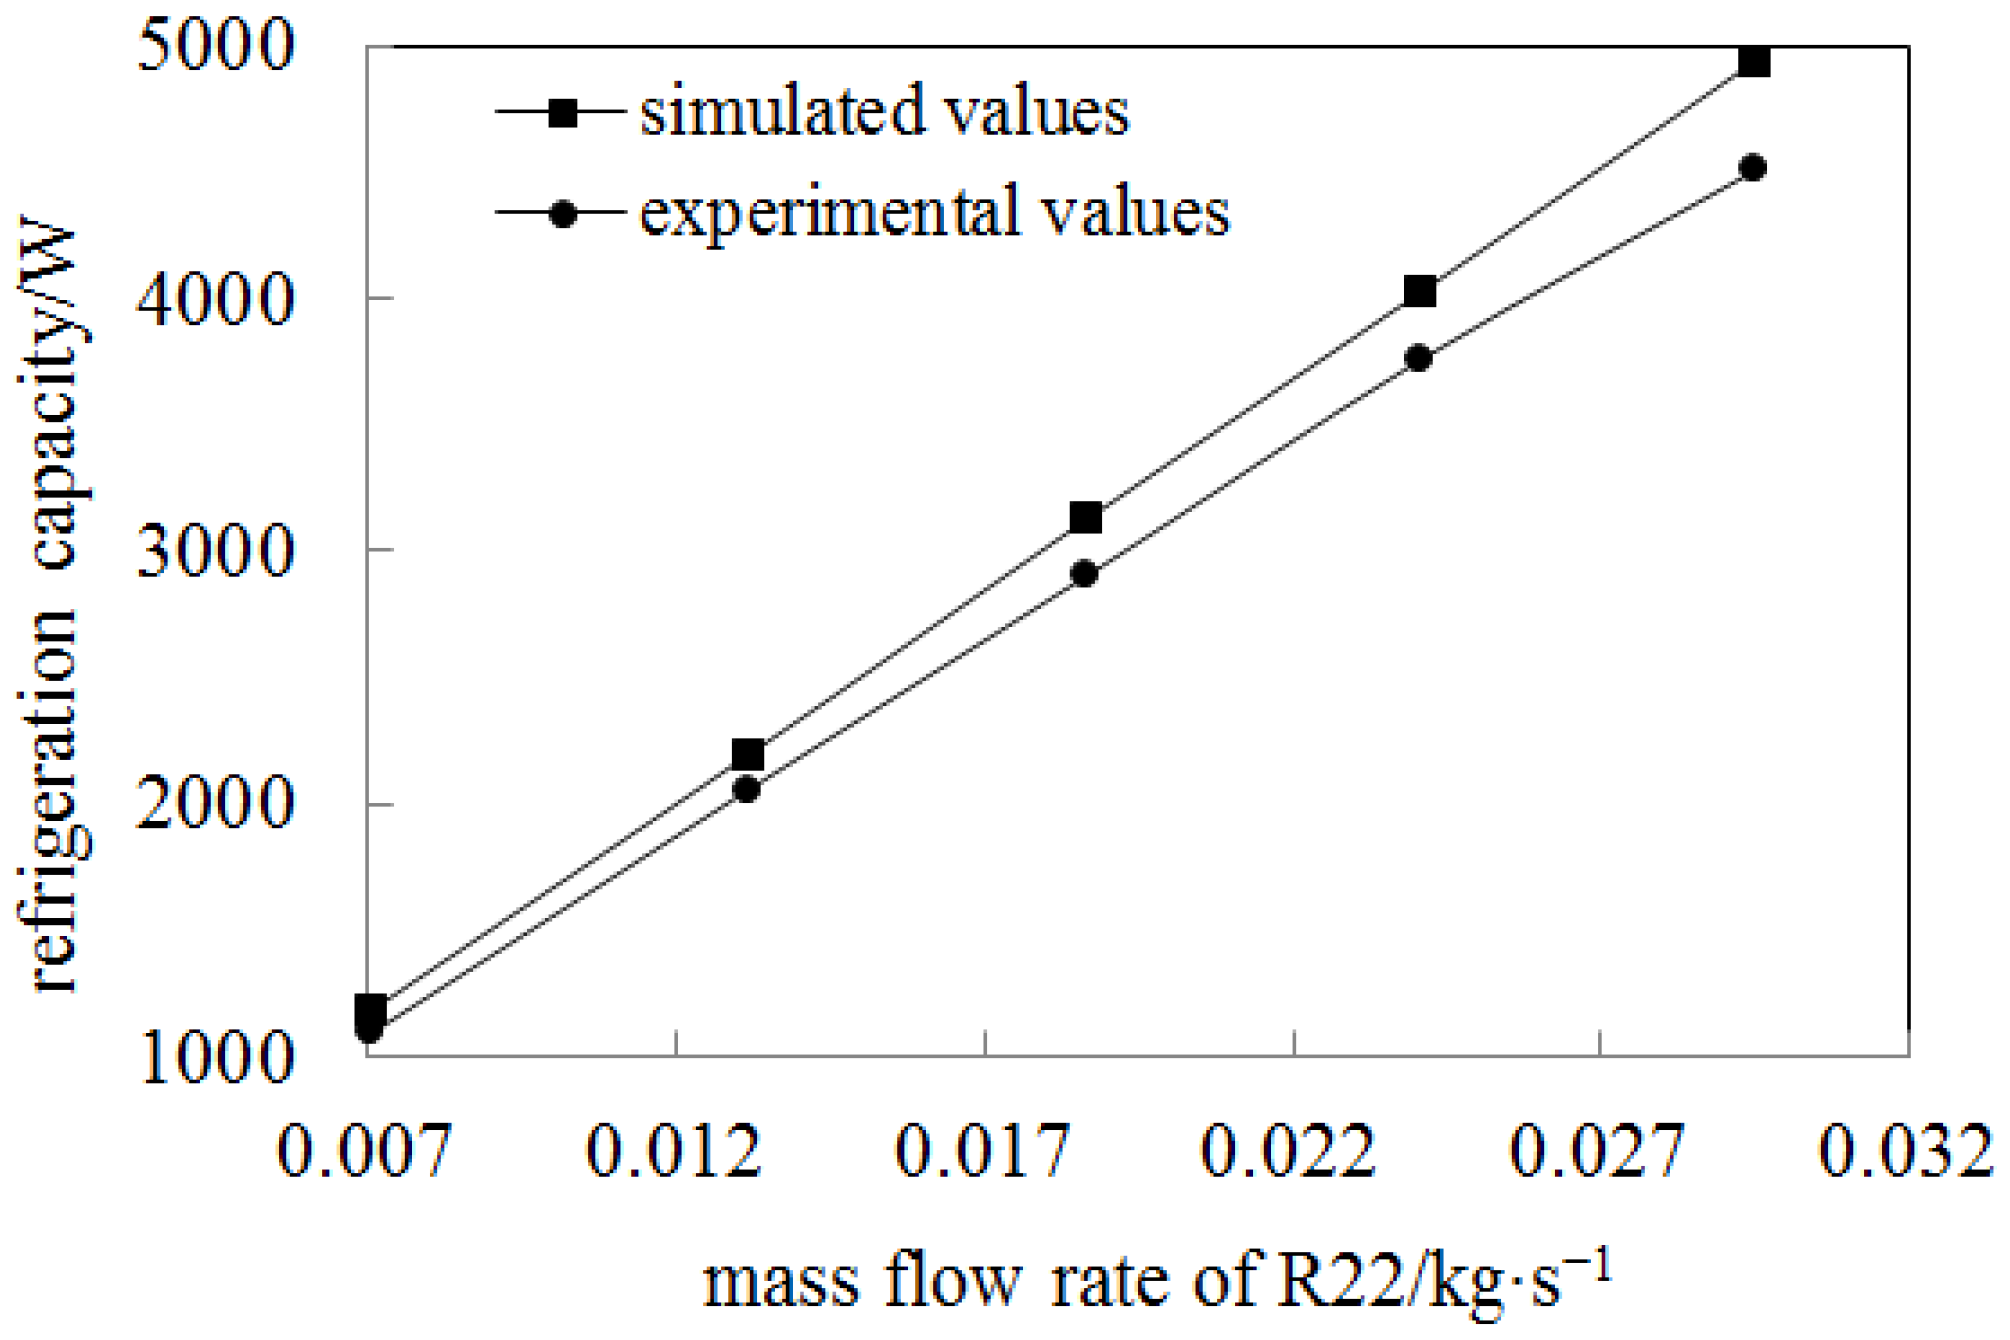
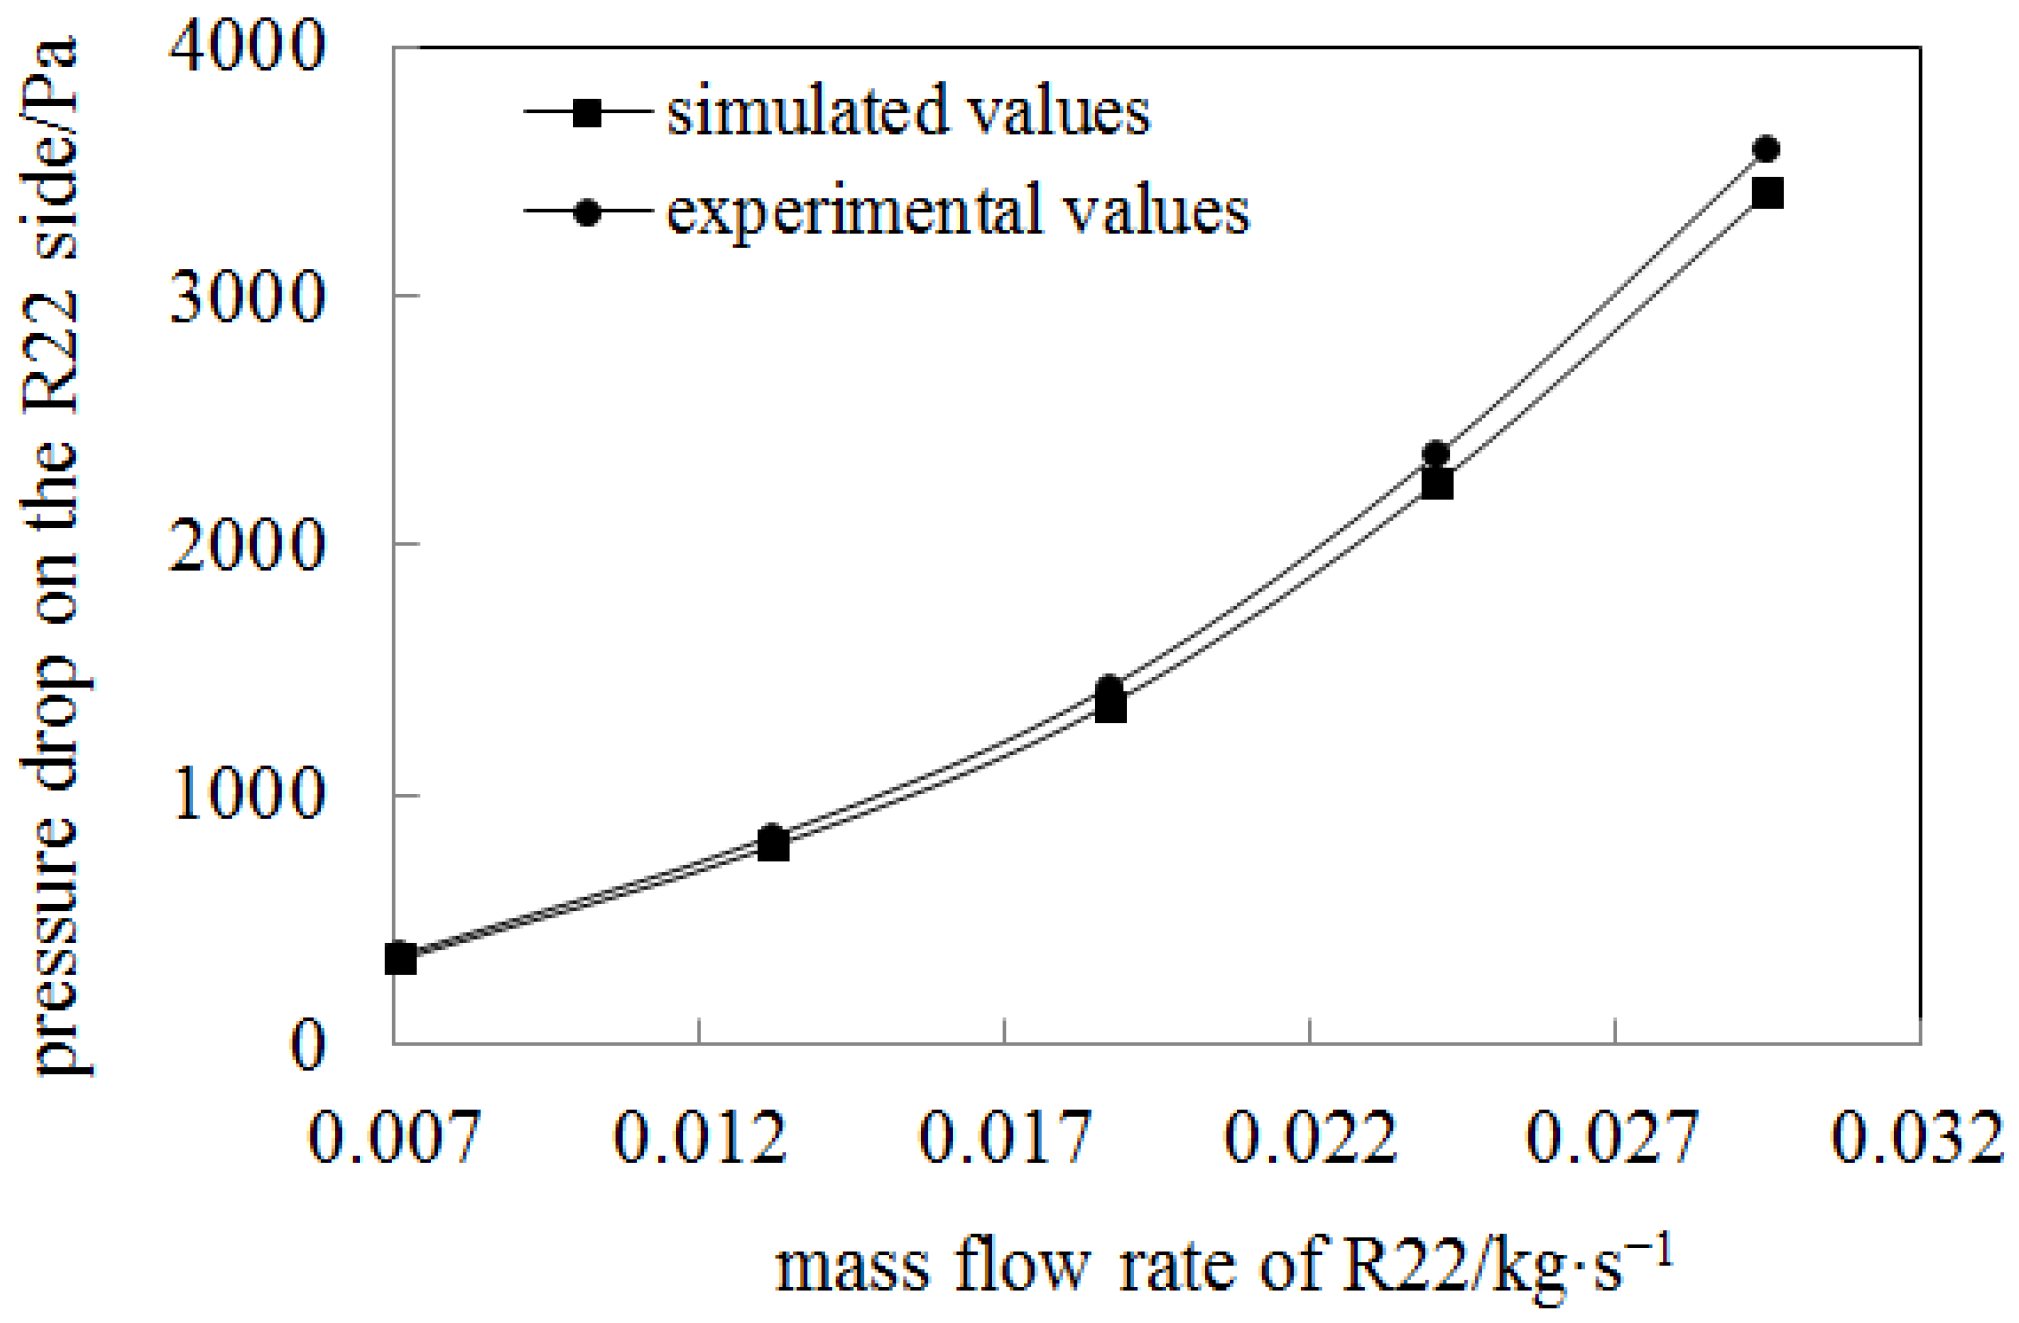
  • The refrigeration capacity increases linearly with the increase in refrigerant mass flow rate. The pressure drop on the refrigerant side increases with the increase in R22 mass flow rate, and the growth rate gradually increases.
  • The cooling capacity increases linearly with the increase in the frontal wind speed. The air side pressure drop increases with the increase in air inlet flow rate.
  • The refrigerant mass flow rate and air inlet conditions should match each other.
Regarding the shortcomings in existing research work, the next step of research includes the following:
  • A reasonable and systematic calculation and experimental plan will be designed; sufficient data samples will be collected, and the heat transfer correlation equations will be fit on both sides of the plate evaporator.
  • Due to its destruction of the ozone layer and high greenhouse effect, refrigerant R22 will be replaced by other new refrigerants. Therefore, the next step will be to study the performance of plate evaporators using new refrigerants as working fluids.
  • The structure of the plate evaporator should be optimized to improve its heat transfer performance.

Author Contributions

Conceptualization, X.X.; methodology, X.X.; software, X.X.; experimental confirmation, Z.Y.; investigation, Z.Y.; writing—original draft preparation, X.X.; writing—review and editing, X.X.; supervision, X.X.; project administration, X.X.; funding acquisition, X.X. All authors have read and agreed to the published version of the manuscript.

Funding

This research was funded by the Science and Technology Project of Nantong City, Jiangsu Province, China, grant number JC22022071.

Data Availability Statement

The data are available from the corresponding author on reasonable request.

Conflicts of Interest

Author Zhaokuo Yuan was employed by Nanhua Heat Exchanger Manufacturing Co., Ltd. The remaining authors declare that the research was conducted in the absence of any commercial or financial relationships that could be construed as a potential conflict of interest.

Nomenclature

Atotal heat exchange area, m2
Dmmass diffusion coefficient
DTthermal diffusion coefficient.
Fvolumetric force, N·m−3
Gkturbulent kinetic energy generated by the average velocity gradient, J
henthalpy of the substance
ha1specific enthalpy of the indoor unit inlet air, kJ/kg
ha2specific enthalpy of the indoor unit outlet air, kJ/kg
Jdiffusion flow rate, kg/s
Ktotal heat transfer coefficient/W(m2·K)
kcoverage factor
keffeffective thermal conductivity, W/(m·K)
Mdry air molar mass, kJ/mol
mamass flow rate of air, kg/s
mrmass flow rate of R22
nnumber of phases
Patmospheric pressure, Pa
PWpartial pressure of water vapor at the exit wet bulb temperature, Pa.
qindoor unit air volume, m3/s
Qacooling capacity on air side, kW;
Qrcooling capacity on R22 side, kW
Rideal gas constant, J/(kg·K)
RHrelative humidity
rphase transition coefficient, s−1.
Sctturbulent Schmidt number
Sdsource term generated by the condensation of steam components
SEenergy source term, W/m3
Smquality source term, kg/(m3·s).
Slmass transfer quantities during the evaporation process, kg/(m3·s)
Svmass transfer quantities during the condensation process, kg/(m3·s)
Tfluid temperature, K
tdry bulb temperature of the air, °C
tddew point temperature of the air, °C
Tsatsaturation temperature, K
Uthe expanded relative standard uncertainty
u(x) uncertainty
umaverage mass velocity, m/s
udr,kslip velocity of the k-th phase, m/s
Ymass fraction of the substance
ρdensity of each phase, kg/m3
ρmdensity of the mixture, kg/m3
μmviscosity of the mixture, Pa·s
τeffstress tensor, Pa
μtturbulent viscosity coefficient
εdissipation rate
σkturbulent Prandtl number for k
σεturbulent Prandtl number for ε
αvolume fraction of each phase
Φcooling capacity, W

References

  1. Qin, Y. Cold storage construction boom: Seven causes and eight trends. China Food Ind. 2021, 11, 61–63. [Google Scholar]
  2. Wei, D.; Jiang, S. Experimental study on performance test of cold storage finned tube evaporator. Cryog. Supercond. 2019, 47, 72–76. [Google Scholar]
  3. Zhang, J.; Gao, E.; Liang, C.; Lv, N.; Shao, Z. Effect of structure parameters on frosting characteristics of air cooler at different cold storage temperatures. J. Cent. South Univ. (Sci. Technol.) 2022, 12, 4905–4914. [Google Scholar]
  4. Ma, Y.; Zang, R.; Sun, Z.; Wu, G. Comparative study on the performance of variable fin spacing cooling fan and fixed fin spacing cooling fan. Fluid Mach. 2019, 47, 6–10. [Google Scholar]
  5. Jiang, S.; Yujun, B.; Meng, Y. Simulation study on the influence of structure parameters of CO2 air cooler on the heat transfer. Refrigeration 2018, 45, 79–85. [Google Scholar]
  6. Mehmet, D.A.S.; Pektezel, O. Experimental and numerical comparison of thermodynamic performance of new and old generation refrigerants in the same cooling system. Therm. Sci. 2022, 26, 4841–4854. [Google Scholar]
  7. Sun, H.; Jin, T.; Hu, K.; Yang, W.; Tian, S.; Tian, Q. Summary of Frost Retarding Technology of Evaporator in Cold Storage. J. Refrig. Technol. 2023, 46, 4–10. [Google Scholar]
  8. Dong, C.; Chen, S.; Zhu, M.; Jin, S.; Wu, Z. Effect of Double-wall Heat Transfer Tube on Frosting Characteristics of Finned-tube Vaporizer. J. Refrig. 2022, 43, 100–107. [Google Scholar]
  9. Gu, Y.; Yang, H.; Wu, Y.; Zuo, T. The Realization Mechanism of Carbon Neutralization in the Evolution of China’s Copper Industry. Environ. Conform. Assess. 2023, 4, 61–71. [Google Scholar]
  10. Lee, D.; Kim, D.; Park, S.; Lim, J.; Kim, Y. Evaporation heat transfer coefficient and pressure drop of R-1233zd(E) in a brazed plate heat exchanger. Appl. Therm. Eng. 2018, 130, 1147–1155. [Google Scholar] [CrossRef]
  11. Kim, D.; Lee, D.; Jang, D.S.; Jeon, Y.; Kim, Y. Comparative evaluation of flow boiling heat transfer characteristics of R-1234ze(E) and R-134a in plate heat exchangers with different Chevron angles. Appl. Therm. Eng. 2018, 132, 719–729. [Google Scholar] [CrossRef]
  12. Qiu, C.; Wu, L.; Wu, S. Numerical Study of Evaporator’s Heat Transfer Characteristics in ORC System. Energy Conserv. Technol. 2020, 38, 9–15. [Google Scholar]
  13. Wu, L.; Liang, X.; Wei, Z.; Yuan, Z. Heat Transfer Characteristics of Corrugated Plate Condenser in Organic Rankine Cycle for Blast Furnace Slag Flushing Water. J. Tongji Univ. (Nat. Sci.) 2021, 49, 1778–1788. [Google Scholar]
  14. Wu, X.H.; Li, C.; Gong, Y.; Zhang, J.; Zhao, M. Heat transfer and pressure drop characteristic of phase change flow in plate heat exchanger. Chin. J. Chem. Eng. 2017, 68, 133–140. [Google Scholar]
  15. Belman-Flores, J.M.; Gallegos-Munoz, A. Analysis of the flow and temperature distribution inside the compartment of a small refrigerator. Appl. Therm. Eng. 2016, 106, 743–752. [Google Scholar] [CrossRef]
  16. Wu, L.; Yuan, Z.; Yuan, Z. Optimization on the Structure of Plate Economizer Based on Orthogonal Design and Grey Relational Theory. J. Tongji Univ. (Nat. Sci.) 2017, 45, 1694–1700. [Google Scholar]
  17. Fan, J.; Peng, H. Advanced Applications and Example Analysis of Fluent; Tsinghua University Press: Beijing, China, 2008. [Google Scholar]
  18. Ye, X.; Zhang, J.; Lu, L.; Dai, A.; Yin, J. Research of source models by numerical simulation in wall condensation of water vapor. Energy Conserv. 2021, 6, 66–70. [Google Scholar]
  19. Deng, H.; Bai, Y. Numerical Simulation for Flow and Condensation in Air Cooled Condenser Reflux Tube with Diffusion Layer Model and Multiphase-flow Approach. Proc. CSEE 2017, 37, 826–837. [Google Scholar]
  20. Zhang, Q. Numerical Simulation of Flue Gas Condensation Heat Transfer in the Tail of Natural Gas Boiler. Master’s Thesis, Harbin Institute of Technology, Harbin, China, 2019. [Google Scholar]
  21. Zhou, M.; Yu, B.; Cao, Y. Numerical Study on Condensation Behaviors of Air-vapor Mixture within and outside of Heat Exchange Pipes. Petro-Chem. Equip. 2019, 48, 40–47. [Google Scholar]
  22. Lee, W.H. Computational Methods for Two-Phase Flow and Particle Transport; World Scientific Publishing Company: Singapore, 1980; pp. 407–431. [Google Scholar]
  23. Ding, Q. Simulation of Steam Condensation and Flow in Horizontal Tube; Dalian University of Technology: Dalian, China, 2018. [Google Scholar]
  24. Qiu, G.; Cai, W.; Wu, Z.; Jiang, Y.; Yao, Y. Analysis on the value of coefficient of mass transfer with phase change in Lee′s equation. J. Harbin Inst. Technol. 2014, 46, 15–19. [Google Scholar]
  25. Liu, X.; Chen, H.; Zhu, L.; Cheng, K.; Wang, G. Numerical simulation of heat transfer law of flue gas with steam condensation. Energy Conserv. 2018, 433, 125–128. [Google Scholar]
  26. Li, M.; Huang, Y.S.; Huang, H. Analysis of the main deviation sources of measuring the cooling capacity of air conditioners by the air enthalpy method and the evaluation of measurement uncertainty. J. Insp. Quar. 2017, 27, 7–9. [Google Scholar]
Figure 1. Structure of heat exchange core in plate evaporator.
Energies 17 05837 g001
Figure 2. Structure diagram of evaporator plate bundle.
Energies 17 05837 g002
Figure 3. Boundary conditions.
Energies 17 05837 g003
Figure 4. Air cooling and dehumidification process on the psychrometric chart.
Energies 17 05837 g004
Figure 5. Changes in cooling capacity at different grid sizes.
Energies 17 05837 g005
Figure 6. Variation diagram of refrigerant gas volume fraction along the length of the pipe.
Energies 17 05837 g006
Figure 7. Pressure drop distribution diagram on the refrigerant side.
Energies 17 05837 g007
Figure 8. Distribution of air temperature on the section perpendicular to the plate bundle at the center of the air channel.
Energies 17 05837 g008
Figure 9. Distribution of air humidity in the middle plane between two plate bundles.
Energies 17 05837 g009
Figure 10. Distribution of air pressure drop in the middle plane between two plate bundles.
Energies 17 05837 g010
Figure 11. Changes in dryness of refrigerant along relative pipe length.
Energies 17 05837 g011
Figure 12. Relationship between refrigeration capacity, R22 side pressure drop, and R22 mass flow rate.
Energies 17 05837 g012
Figure 13. Relationship between refrigeration capacity, air side pressure drop, and air inlet flow rate.
Energies 17 05837 g013
Figure 14. Relationship between the overall heat transfer coefficient and the Reynolds number at the inlet of R22.
Energies 17 05837 g014
Figure 15. Relationship between the overall heat transfer coefficient and the Reynolds number at the inlet of air.
Energies 17 05837 g015
Figure 16. Plate evaporator refrigeration experimental system. 1. Plate evaporator; 2. airflow testing device; 3. air handling unit; 4. air sampling and measuring device; 5. inside the enthalpy difference chamber; 6. compressor; 7. condenser; 8. reservoir; 9. mass flow meter; 10. expansion valve; 11. preheating; 12. superheat.
Energies 17 05837 g016
Figure 17. P-h diagram of refrigeration cycle.
Energies 17 05837 g017
Figure 18. Comparison between experimental and simulated values of refrigeration capacity with R22 mass flow rate variation.
Energies 17 05837 g018
Figure 19. Comparison between experimental and simulated values of refrigerant side pressure drop with R22 mass flow rate variation.
Energies 17 05837 g019
Table 1. Refrigerant mass flow rate, air outlet temperature, and relative humidity at different air inlet velocities.
Air Inlet Velocity/m·s−1Air Outlet Temperature/°CRelative Humidity at the Air OutletR22 Mass Flow Rate/kg·s−1
1−0.50.930.0071
200.920.0132
30.30.910.0187
40.50.910.0241
50.60.910.0295
Table 2. Performance data of plate evaporator under various operating conditions.
Air Inlet Velocity/m·s−1R22 Mass Flow Rate/kg·s−1Refrigeration Capacity/WPressure Drop on the R22 Side/PaPressure Drop on Air Side/PaTotal Heat Transfer Coefficient/W·m−2·K−1
10.0071119134311340
20.0132220079423672
30.018731331360495101
40.024140292250853128
50.0295494034101310156
Table 3. Model, measurement range, and accuracy of the instrument.
InstrumentMeasurement RangeAccuracy
T-type thermocouple−200–350 °C±0.2 °C
CAREL SPKT00B1C0 pressure transmitter (Blue Gate Refrigeration Equipment Co., Ltd., Shanghai, China)0~44.8 Bar±0.1 Bar
Coriolis Mass Flowmeter (Yinuo Instrument Co., Ltd., Shanghai, China)0–10 kg/h±0.2%
Table 4. Calculation results of uncertainty for each component value.
Source of UncertaintyUncertaintyRelative Uncertainty/%
q32.4 m3/h1.50
ha10.48 kJ/kg2.32
ha20.21 kJ/kg1.80
T0.2 K0.04
P1000 Pa0.50
PW10 Pa0.02
Table 5. Heat transfer on both sides of the evaporator under different test conditions.
Air Flow Rate/m·h−1Air Outlet Temperature/°CAir Outlet Relative Humidity/%Air Heat Lost/WR22 Mass Flow Rate/kg·h−1R22 Heat Gain/WError/%
3600.193108427.2511173.09
7200.592202749.8820963.42
10800.892285671.1829633.76
1440191369691.3238283.57
18001.2914406113.8346094.6
Disclaimer/Publisher’s Note: The statements, opinions and data contained in all publications are solely those of the individual author(s) and contributor(s) and not of MDPI and/or the editor(s). MDPI and/or the editor(s) disclaim responsibility for any injury to people or property resulting from any ideas, methods, instructions or products referred to in the content.

