Article

Data-Model Fusion-Driven Method for Fault Quantitative Diagnosis of Heat Exchanger

1
CNOOC China Limited Beijing Research Center, Beijing 100028, China
2
School of Mechanical and Transportation Engineering, China University of Petroleum, Beijing 102249, China
3
Key Laboratory of Oil and Gas Production Equipment Quality Inspection and Health Diagnosis, State Administration for Market Regulation, Beijing 100088, China
4
School of Safety and Ocean Engineering, China University of Petroleum, Beijing 102249, China
5
Exploration and Development Department of CNOOC Limited, Beijing 100010, China
*
Author to whom correspondence should be addressed.
Energies 2024, 17(23), 6113; https://doi.org/10.3390/en17236113
Submission received: 2 November 2024 / Revised: 24 November 2024 / Accepted: 3 December 2024 / Published: 4 December 2024
(This article belongs to the Section J1: Heat and Mass Transfer)

Abstract

:
Heat exchangers play essential roles in the oil and gas production process for convective heat transfer and heat conduction. The health management of heat exchangers stays in the direct monitoring of performance parameters. Aiming at the difficulty of precise fault identification and quantification for heat exchangers in multiple unknown failure modes, a data-model fusion-driven fault quantitative diagnosis method is proposed. Firstly, based on the monitoring data such as temperature, pressure and flow rate, the secondary parameters characterizing the heat exchanger running state are constructed combined with structural physical parameters. Then, by analyzing the correlation among parameter variation, failure modes and deterioration degree, a qualitative inference model of heat exchanger is formed for fault identification, where weights of parameters are introduced based on their sensitivity for different failure modes. After the fault mode is identified, to achieve quantitative analysis of the failure degree, an index-integrated mechanism equation is constructed using monitoring data and secondary parameters, where the index is dynamically modified by online data. Finally, a heat exchanger experiment is carried out to demonstrate the robustness and accuracy of the proposed method.

1. Introduction

As an effective heat transfer equipment from one fluid to another through a solid surface, heat exchangers have a variety of applications in the oil and gas production process, such as heat transfer, cooling or heating fluids to meet process requirements. The safe operation of heat exchangers is significant for the stability of the production process, energy utilization efficiency and product quality. Heat exchangers commonly serve in harsh environments such as high temperature and pressure, large temperature difference and radioactivity. Under long-term serving and withstanding the effects of temperature, pressure, mechanical load and medium corrosion, etc., leakage, scaling and other failures occur, resulting in the low reliability and performance of heat exchangers, which can even bring serious safety accidents. According to the survey, more than 90% of the heat exchangers have various scaling phenomena [1], and 10% of the corrosion damage in the industry is caused by the internal medium leakage of heat exchangers. Therefore, how to effectively identify the fault modes and quantitatively analyze the fault degree of heat exchangers is the key problem to be solved urgently.
The health management of heat exchangers is a multidisciplinary problem involving statistics, mechanics, chemistry, physics and heat transfer. For heat exchanger condition monitoring, prior research has focused on hydraulic [2,3] and thermal calculation methods [4,5]. For example, Afgan et al. [6] developed an expert system for heat exchanger fault assessment, which uses heat transfer efficiency as an index to evaluate the fouling condition of heat exchangers. However, limited by a single index, this method has low sensitivity. Patil et al. [7] analyzed the causes of heat exchanger fouling and constructed a fouling propensity index (FPI) to evaluate fouling propensity. Wallhaußer et al. [8] described the performance characteristics of heat exchangers from multiple aspects such as pressure drop and heat transfer coefficient, realizing the fouling monitoring of heat exchangers. Di et al. [9] proposed a flexibility analysis method for fouling and optimal cleaning cycle scheduling was determined. However, these model-based methods need a lot of phenomenological knowledge about failure deterioration mechanism of the equipment. Due to the complexity of the industrial process, model-based methods are often costly, time-consuming and laborious, of which performance is greatly affected by the fluctuation of the working condition, and they cannot intuitively represent the leakage or scaling failure of the equipment.
In recent years, data-driven methods based on machine learning and signal analysis have been developing for process equipment diagnosis [10]. Hacene et al. [11] established a data-driven nonlinear dynamic fuzzy model for heat exchangers, and proposed a leakage detection and diagnosis scheme for heat exchangers based on the fuzzy model. Davoudi et al. [12] used artificial neural networks to predict scaling factors from some easily measured variables in the system, realizing the evaluation of the fouling of heat exchangers. Tian et al. [13] constructed an internal leakage model of a heat exchanger and realized the early warning of internal leakage fault based on dynamic simulation and long short-term memory neural network. Jallal et al. [14] proposed a fouling detection method based on convolutional neural networks and principal component analysis. Ingimundardottir et al. [15] applied wavelet transform to analyze the vibration signals of heat exchangers, and defined fault factors combined with the simulation model to realize the health monitoring of heat exchangers under stationary state. In addition, a Risk-Based Inspection (RBI) approach [16] was carried out to estimate the probability of fouling in heat exchangers. Although the above methods can mine the intrinsic health information from a large number of monitoring data without in-depth understanding of the causes and evolution mechanism of heat exchangers [17], different heat exchangers have various heat transfer performances and fault characteristics, as well as different internal structures and system configurations. It is difficult to obtain complete samples covering all failure modes. It is difficult to guarantee the correctness and validity of the diagnosis model.
Other fault detection methods for heat exchangers are commonly based on distance laser sensors [18], ultrasonic, optical technology [19] and acoustic [20]. In the nuclear power field, the radioactivity of heat exchanger water is also detected to reveal whether leakage occurred [21]. However, the application of these methods requires specific detection instruments, which can only be implemented in the shutdown state of heat exchangers, resulting in the limited adaptability of the working conditions. So, they are not suitable for online condition monitoring and fault diagnosis.
In summary, current research work mainly focuses on the condition monitoring of heat exchangers using process parameters. It cannot directly reflect the fault degree, and the actual fault state is usually obtained by offline detection. Therefore, aiming at the difficulty of precise fault identification and quantification for heat exchangers in multiple unknown failure modes, a data-model fusion-driven fault quantitative diagnosis method is proposed. Firstly, online monitoring data such as temperature, pressure and flow rate are acquired, and secondary parameters are constructed. By analyzing the correlation among parameter variation, failure modes and deterioration degree, a qualitative inference model of heat exchanger is formed for fault identification. Then, to achieve quantitative analysis of the failure degree, an index-integrated mechanism equation is constructed by using monitoring data and secondary parameters, where the index can be dynamically modified by online data. Finally, the robustness and accuracy of the proposed method in fault identification and quantitative analysis are verified by a heat exchanger experiment.

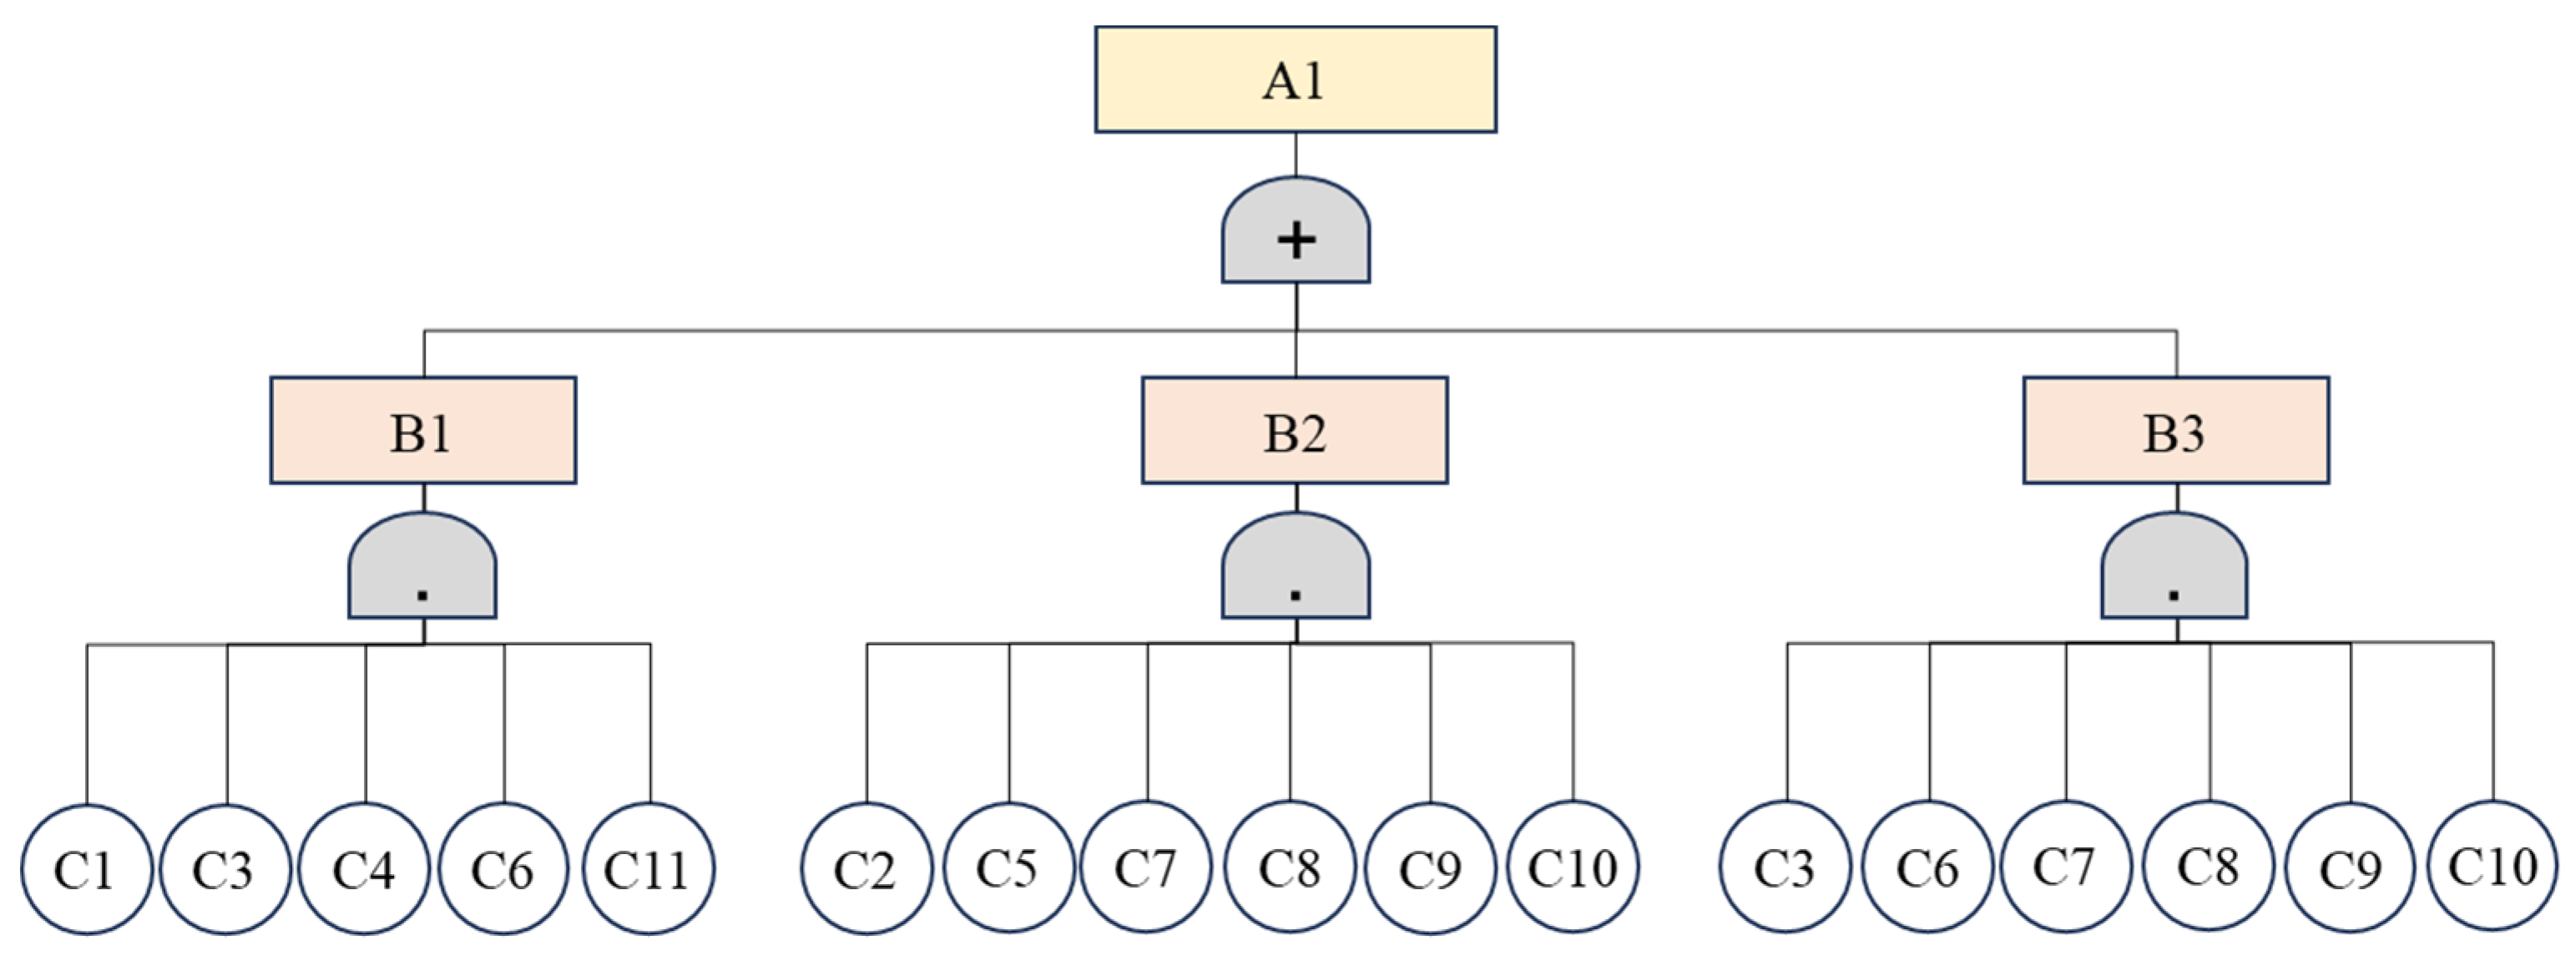
2. Failure Mode and Effect Analysis of Heat Exchanger

The common faults of heat exchangers include leakage and scaling faults. The leakage fault includes internal leakage and external leakage. The location of internal leakage is mainly in the heat exchange wall, and the external leakage is mainly in the seal. In this paper, the shell-and-tube heat exchanger of the equipment cooling water system is taken as an example, where the fluid medium with high temperature is generally in the tube side, and the cooling medium with low temperature is in the shell side. For the scaling fault and leakage fault of heat exchangers, the fault mechanism and its effectiveness are analyzed, and the fault tree model is constructed as shown in Figure 1 and Table 1. The detailed analysis is as follows:
(1)
Fouling fault
When the fouling fault occurs, the fouling layer is attached to the cold side wall of the heat exchanger. From the perspective of heat transfer as shown in Equations (1) and (2), the heat transfer performance of the heat exchanger is blocked as the heat transfer coefficient of the fouling layer is much lower than that of the heat exchange wall material, resulting in an outlet temperature T h o increase in the hot side and outlet temperature T c o decrease in the cold side. It will lead to the heat exchange efficiency ε decrease and the mean temperature differential Δ T m increase in heat exchangers, where Δ T max , Δ T min , Φ and Φ max are, respectively, maximum and minimum temperature differentials of the temperature in the cold side and hot side, the actual heat transfer amount and the maximum heat transfer amount that the heat exchanger can carry out. As illustrated in Equation (3), due to the decrease in heat transfer efficiency, the heat transfer amount decreases, resulting in the value of heat transfer coefficient K in fouling condition being smaller than that in healthy condition. The fouling fault analysis is mainly based on the heat transfer performance index:
Δ T m = Δ T max Δ T min lg T max T min = ( T h i T c i ) ( T h o T c o ) lg T h i T c i T h o T c o
ε = Φ Φ max = T c o T c i T h i T c i
Φ = K A Δ T m
(2)
Internal leakage
When the internal leakage fault occurs, the hot side medium flows into the cold side for direct heat transfer, resulting in abnormal outlet temperature in the cold side T c o increase and outlet temperature in the hot side T h o decrease. The heat transfer efficiency ε of the heat exchanger is higher than that in normal condition, and the average temperature differential Δ T m is reduced. But for a small leakage rate case, the heat loss effect on the heat transfer in the whole heat exchanger is not significant and sensitive enough.
From the perspective of medium transfer, when there is an internal medium leakage, the medium flow rate V decreases, and the total flow area of the medium increases. Under the constant speed of the power pump, the flow resistance decreases. So, the inlet pressure P i decreases and the pressure drop P d i of the outlet and inlet pressure decreases. At the same time, when an internal leakage fault occurs, the pressure of the compressed gas in the buffer tank replenishes the buffer medium stored in the tank to the heat exchanger, resulting in a water level L decrease in the buffer tank.
(3)
External leakage
When the external leakage fault occurs, take the leakage caused by the sealing failure of the hot side fluid inlet flange as an example. From the perspective of heat transfer, as the leakage side medium leaks to the outside of the equipment, the total amount of fluid medium participating in the heat transfer decreases, resulting in a more insufficient heat transfer. The hot side outlet temperature increases and the heat transfer efficiency decreases. Similar to the internal leakage fault, the medium flow rate V decreases, and the flow resistance decreases, resulting in the inlet pressure P i decreasing and the pressure drop P d i of the outlet and inlet pressure decreasing. Also, the pressure of the compressed gas in the buffer tank replenishes the buffer medium stored in the tank to the heat exchanger, resulting in a water level L decrease in the buffer tank.

3. The Data-Model Fusion-Driven Method for Fault Quantitative Diagnosis

Based on the combination of qualitative diagnosis and quantitative analysis, a data-model fusion-driven method for heat exchanger fault quantitative diagnosis is proposed.
This method firstly acquires monitored parameters, such as temperature, pressure, and flow rate, and combines them with structural physical parameters to construct secondary parameters that reflect the heat exchange performance. Then, by analyzing the relationship among the parameter variation, failure modes and deterioration degree, a qualitative fault identification inference model is formed. After the fault mode is identified, an index-integrated mechanism equation is constructed using monitoring data and secondary parameters to achieve quantitative analysis of the failure degree. The detailed description of the proposed method is illustrated in Figure 2.

3.1. Data Acquisition and Processing

Building a fault quantitative diagnosis model requires the acquisition and processing of multi-source health parameters. As shown in Table 2, the health parameters involve two types of data: monitored online data and secondary parameters. Monitored online data include temperature, pressure, flow rate, pressure drop and buffer tank pressure. The secondary parameters are constructed based on the formulas listed in Table 2, including heat transfer efficiency, heat transfer coefficient and mean temperature differential.
To eliminate the effect of the data fluctuations caused by environmental conditions and other external interferences, the monitored online data are preprocessed using the exponential moving average (EMA) as shown in Equation (4), where α, pt and ft respectively represent the smoothing parameter between 0 and 1, data to be processed and the processed data value.
f t = α p t + ( 1 α ) p t 1
The EMA algorithm processes time-series data by combining real-time monitoring data with historical data. If the value of α is large, the real-time data have a greater weight. Conversely, if α is small, historical data have a greater influence on the smoothed data. Therefore, α needs to be adjusted according to the actual data fluctuations in practical applications.

3.2. Inference Rules for Fault Qualitative Identification

The fault reasoning model is triggered by the abnormal increase or decrease in fault symptoms (monitored online data and secondary parameters). In order to transform the precise numerical change of parameters into fuzzy qualitative expression, the 3σ discriminant criterion is introduced. If the value of the parameter x is outside the three-fold variance interval of the data mean value in the stationary healthy stage, it is considered that the parameter has abnormally increased or decreased, as is shown in Equation (5), where rx, x ¯ and σ are, respectively, the qualitative expression of the parameter variation, the mean value of the monitored online data or secondary parameters, and their variance.
r x = Abnormal   Decrease ,   x < x ¯ 3 σ Normal ,   x ¯ 3 σ x x ¯ + 3 σ Abnormal   Increase ,   x > x ¯ + 3 σ
As shown in Table 3, considering that the parameter variation is different under different fault modes, the parameter weight is introduced in order to enhance the accuracy of the model, where different weights are given to the bottom events based on the actual system response in various fault modes and expert experience. Fault symptom 1 is the abnormal increase in mean temperature differential Δ T m . Fault symptom 2 is the abnormal decrease in mean temperature differential Δ T m . Fault symptom 3 is the abnormal increase in hot side outlet temperature T h o . Fault symptom 4 is the abnormal decrease in cold side outlet temperature T c o . Fault symptom 5 is the abnormal increase in heat transfer efficiency ε . Fault symptom 6 is the abnormal decrease in heat transfer efficiency ε . Fault symptom 7 is the abnormal decrease in buffer tank water level L. Fault symptom 8 is the abnormal decrease in inlet pressure P i . Fault symptom 9 is the abnormal decrease in pressure drop P d i . Fault symptom 10 is the abnormal decrease in flow rate V. Fault symptom 11 is the abnormal decrease in heat transfer coefficient K. Through the comprehensive reasoning of the qualitative variation of fault symptoms, the corresponding fault mode score is calculated as shown in Equation (6), where yi is the triggered state of the fault symptom i (yi = 1 when it is triggered and yi = 0 when it is not triggered). When the total score S exceeds the set threshold, the fault mode is identified.
S c o r e = i = 1 11 y i w i

3.3. Model-Data Fusion-Driven Fault Quantification Index

After the fault mode is identified through the proposed fault reasoning model, the corresponding fault quantification index is introduced for fault degree assessment. The detailed construction method of the fault quantification index for fouling thickness and leakage fault is as follows.

3.3.1. Quantification Index for Fouling

To construct the direct quantification index for fouling thickness, several assumptions have been made about the operation of the heat exchangers: (a) fouling is only attached to the outside of the tubes, (b) fouling evenly adheres to the outside of the tubes and (c) the ratio of the inner diameter and outer diameter of the tubes is 1.
Therefore, the fouling thickness can be described as follows:
δ f = λ 2 ( A Δ T m c G c Δ T c 1 α 1 1 α 2 δ t λ 1 )
where A is the heat exchange area, ΔTmclean is the average mean temperature in clean state, c is cold fluid constant-pressure specific heat, Gc is the fluid mass corresponding to the shell side flow rate. ΔTc is the temperature difference between the inlet and outlet of shell side fluid, α 1 is the tube side convective heat transfer coefficient, α 2 is the shell side convective heat transfer coefficient, λ1 is the thermal conductivity of the tubes, λ2 is the fouling thermal conductivity, δt is the tube thickness. α 1 and α 2 can be calculated using Equation (8):
α h = ( C h L h m 1 c p , h s h m n ) λ h 1 n μ h n m q h m α c = ( C c L c m 1 c p , c s c m n ) λ c 1 n μ c n m q c m
Since the undetermined coefficients in Equation (8) have a fixed value after the heat transfer model is determined, the constant term in the equation can be merged to obtain Equation (9).
α h = C 1 λ h n 1 μ h m n q h m α c = C 2 λ c n 1 μ c m n q c m
By using least square regression on groups of health condition data, the undetermined coefficients C1, C2, m and n in Equation (9) are solved, and the fouling thickness quantification index is constructed to realize real-time calculation of heat exchanger fouling thickness.
In order to further improve the accuracy of the fouling thickness quantification index, it needs to be dynamically modified by monitoring data. A piece of historical data of heat exchanger in clean state and stable working condition is selected as the reference to modify the index as follows:
δ f 0 = λ 2 ( A Δ T m l e a n c G c Δ T c 1 α 1 c l e a m 1 α 2 d e a m δ t λ 1 )
where α1clean and α2clean are, respectively, the convective heat transfer coefficients of tube and shell in heat exchanger clean state. Since the heat exchanger is in the fouling-free state at this time, the current fouling thickness will be used as the correction term to correct the fouling thickness output from the index model, as shown in Equation (11).
δ f , r e a l = δ f δ f 0

3.3.2. Quantification Index for Leakage

Based on the analysis of the failure effect on the heat exchange performance, from the perspective of heat conservation, the following four parts of heat transfer process in leakage fault are calculated.
(a)
Q1: Heat loss caused by the leakage of hot fluid flowing from the tube to the shell through the leakage hole, as is shown in Equation (12).
Q 1 = x c ρ ( T h i T h o )
(b)
Q2: The released heat during the process that the hot fluid leaking from tubes flows into the shell, as is shown in Equation (13).
Q 2 = x c ρ ( T h i T c i + T c o 2 )
(c)
Q3: Heat brought by an external heat source that leads to the temperature increase of the cold side fluid in the shell, as is shown in Equation (14).
Q 3 = V c c ρ Δ T c i
(d)
Q4: Absorbed heat as hot fluid flowing into the shell and causing the cold fluid temperature to rise, as is shown in Equation (15).
Q 4 = V c c ρ Δ T c o
By the law of energy conservation, the heat supplied by the heat source is equal to the heat absorbed from the heat source, which means Q 3 + Q 2 = Q 4 + Q 1 . Then, the direct quantification index x of internal leakage fault can be obtained by the simplification Q 3 + Q 2 = Q 4 + Q 1 , as illustrated in Equation (16), where Vc is the cold fluid flow rate and ρ is the fluid density.
x = V c ( Δ T c o Δ T c 1 ) T h o T c o + T c l
When the external leakage fault occurs, the medium leaks out and the left hot fluid in the tube exchanges heat with the cold fluid in the shell. The heat released by the left hot fluid in the tube unconsidered by the leakage part to the outside is equal to the heat absorbed from the left hot fluid by the cold fluid in the shell, as shown in Equation (17).
( V h x ) ( T h i T h o ) = V c ( T c o T c i )
Equation (17) can be simplified as follows:
x = V h ( T h i T h o ) V c ( T c o T c i ) T h i T h o
In order to further improve the accuracy of the leakage quantification index, it also needs to be dynamically modified by monitored data. The leakage xclean calculated by the leakage index model using the data obtained in the heat exchanger in healthy state is taken as the reference to modify the leakage index model in Equation (19), where xclean is the modified leakage quantification index.
x r e a l = x x c l e a n

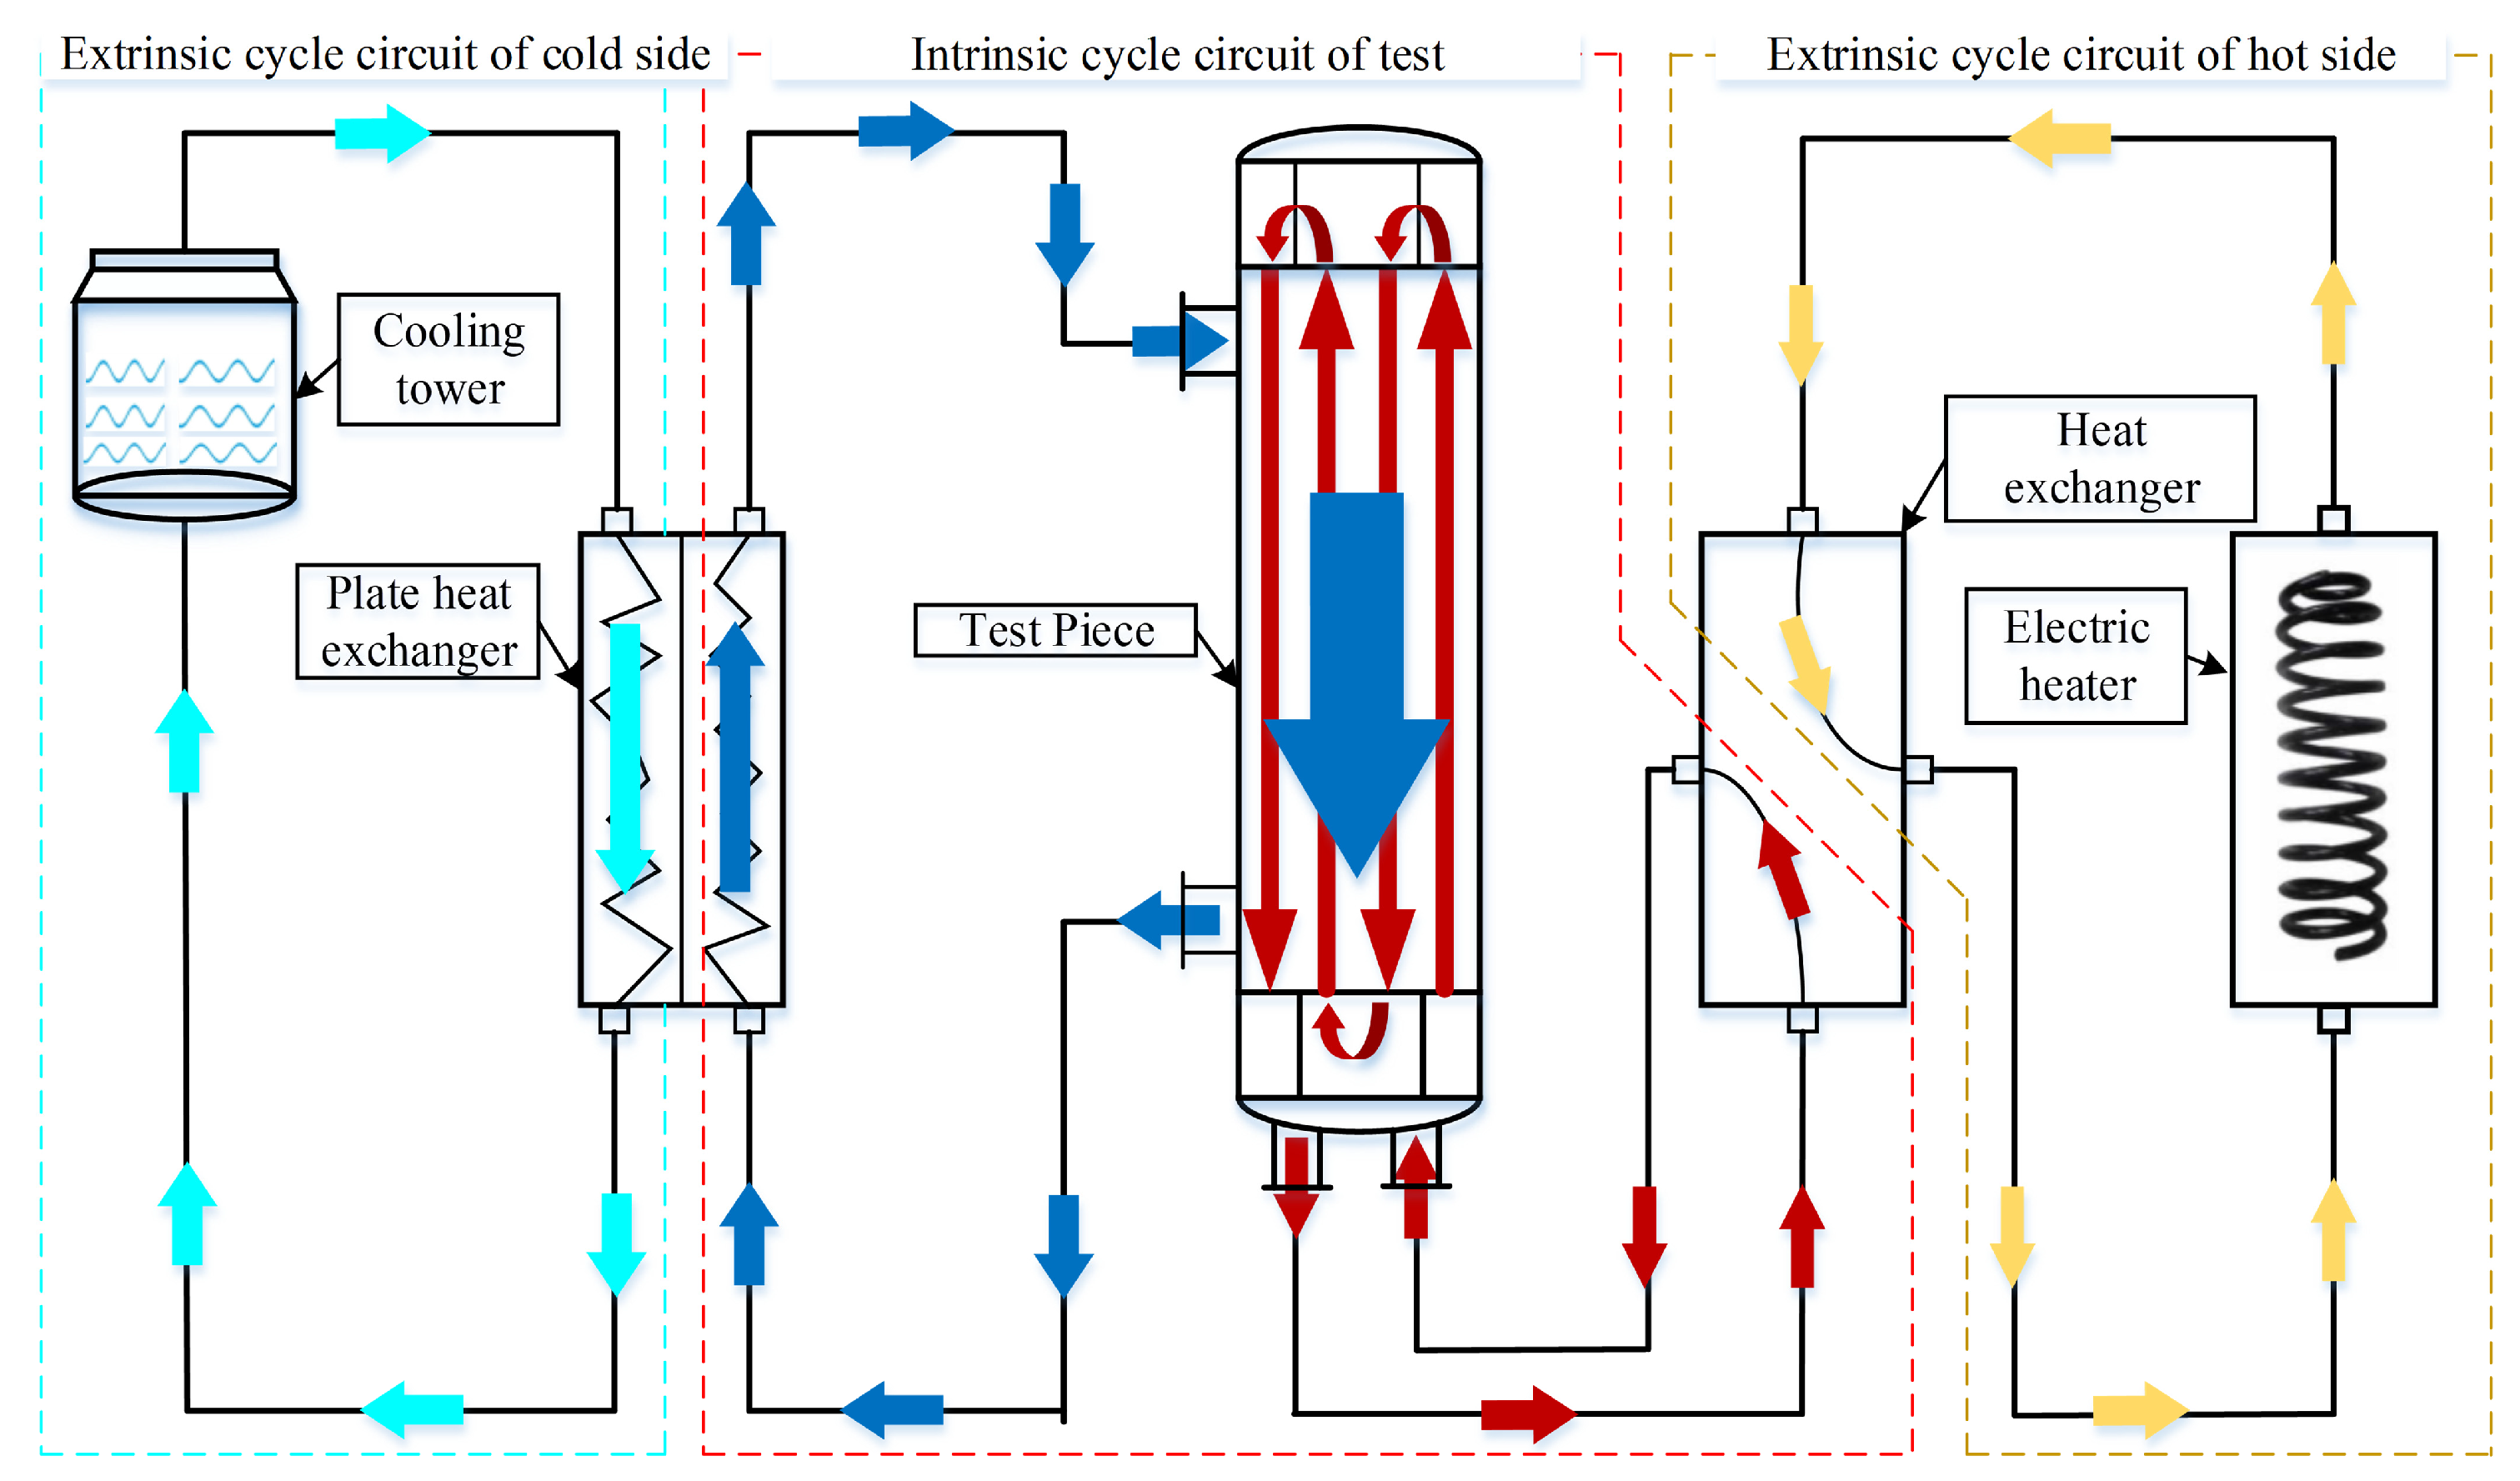
4. Experimental Study

4.1. Experiment Setup and Data Acquisition

To verify the effectiveness of the proposed method, the testbench shown in Figure 3 is constructed. The device consists of three circuits, including extrinsic cycle circuit of cold side, intrinsic cycle circuit of test and extrinsic cycle circuit of hot side. During the experiment, the heat source heats the medium and then transfers the heat to the thermal fluid of the test circuit through the electric heating equipment and the heat exchanger. After the test circuit heat transfer is completed, the heat is brought out through the plate heat exchanger and dissipated through the cooling tower. In the experiment, the test double circuit is set as a shell-and-tube heat exchanger, where the tube is the side with a higher temperature and pressure fluid. In each circuit, the temperature, pressure and flow rate are monitored by a PT100 platinum thermal resistance sensor, diffusion silicon pressure transmitter and turbine flow meter, respectively. Pressure gauges are equipped in the heating, cooling and testing circuits. A Siemens S7-1200 series PLC is selected as the data acquisition unit. Its acquisition accuracy is 13 bits and the ADC conversion time is 625 us. The data acquisition unit can achieve an accuracy of more than 0.1% and speed of more than 50 SPS per channel. The collected parameters include the inlet and outlet temperature, inlet and outlet pressure and medium flow rate et al.
In order to simulate the fouling fault of the heat exchanger, pure water is used as the tube medium, and a CaSO4 solution is used as the shell medium. By weighing the mass before and after the fouling test and making a difference, the mass of fouling generated during the test is calculated. Then, the fouling thickness is obtained according to the density and heat transfer area. To simulate the leakage fault, threaded vias are fabricated on the heat exchanger tube plate and tubes as leakage channels. The fluid leakage is controlled and measured by regulating valves and flowmeters.
In the experiment, the data are collected under the sampling period of 10 s. The working conditions of the leakage and scaling fault tests are shown in Table 4 and Table 5. The leakage test contains three sets of fault data including internal leakage and external leakage, and the fouling test also contains fault data under three different working conditions.

4.2. Data Analysis

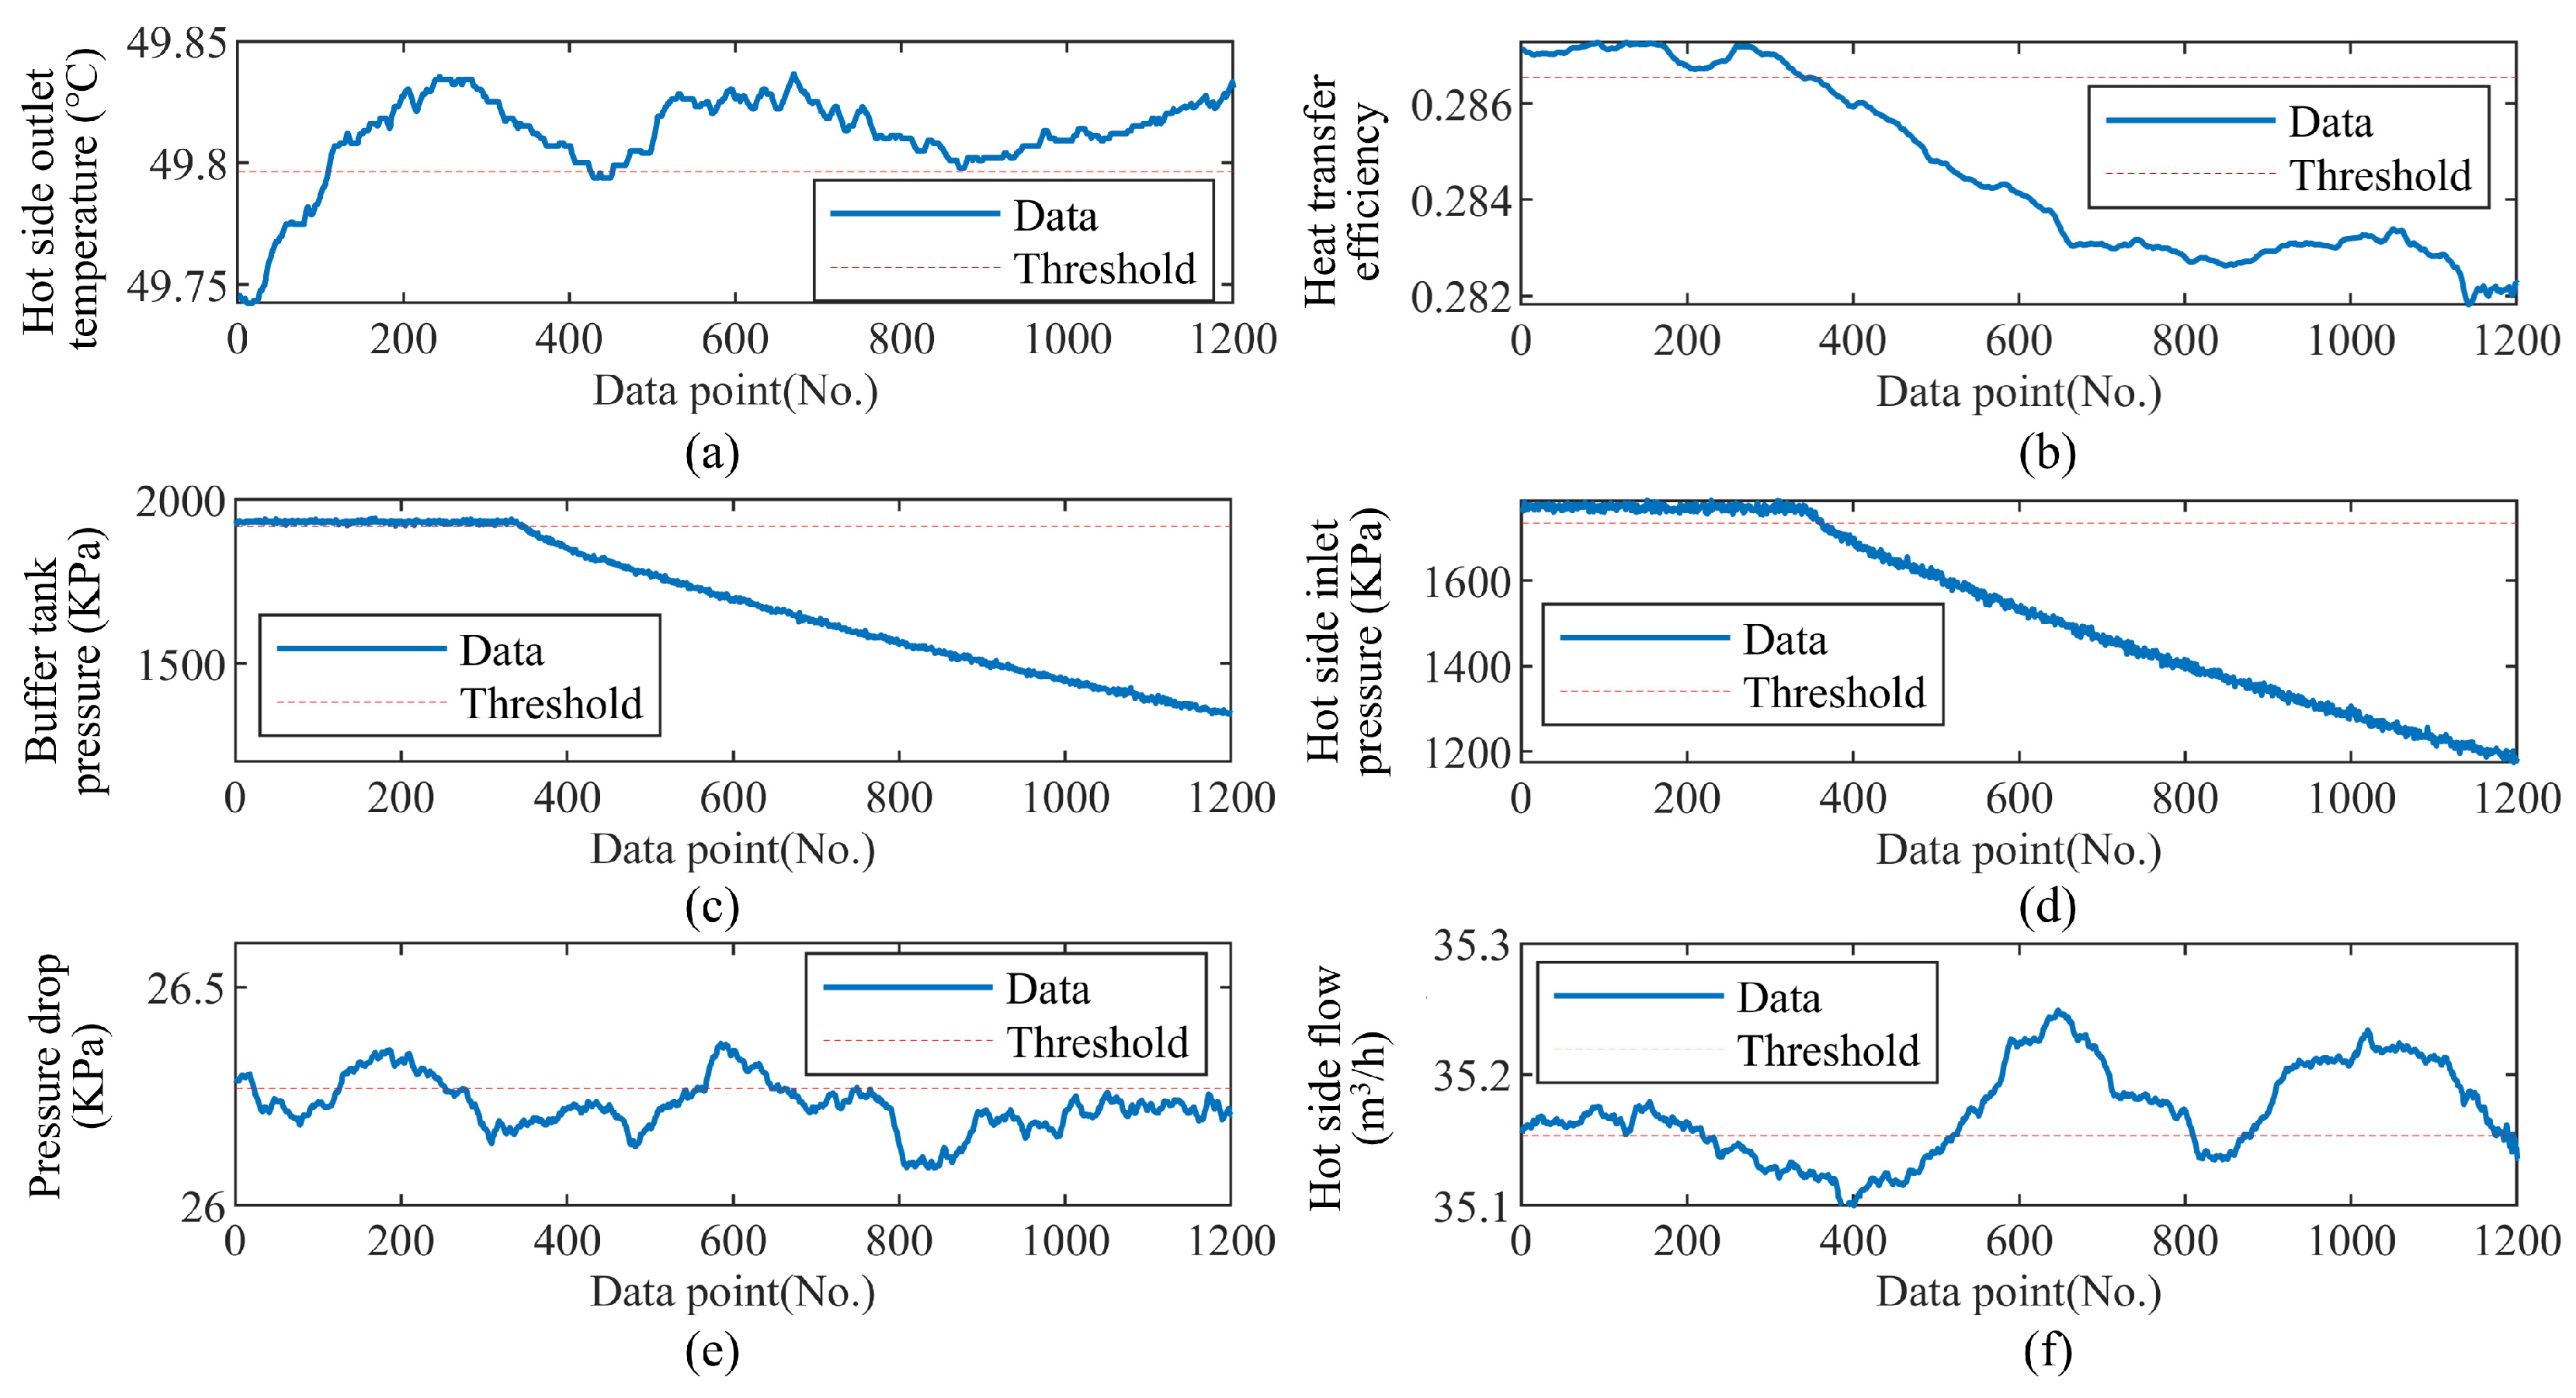
4.2.1. Data Analysis for Leakage Fault

When the heat exchanger leakage occurs, the parameter variation is shown in Figure 4. The leakage part of the heat transfer medium flows outwards, resulting in the part of the fluid not participating in heat and medium transfer. At this time, the cold side flow rate and temperature are unchanged, which means there is less heat exchange between the hot side fluid and cold fluid. The outlet temperature of the hot fluid decreases. At the same time, it will also cause the outlet temperature of the cold fluid to decrease, the heat transfer efficiency to decrease and the average mean temperature differential to increase.
When internal leakage occurs in the heat exchanger, the parameter variation is shown in Figure 5. The heat transfer process of the leakage part of the fluid can be regarded as the heat transfer process without the heat transfer wall, where the heat transfer efficiency is higher. The outlet temperature of the hot side and the cold side will correspondingly decrease and increase, respectively, resulting in the increase in the heat transfer efficiency. Since the heat transfer is more sufficient, the average mean temperature differential will also be reduced. The experimental data are in accordance with the law obtained from the fault mode and effect analysis of the heat exchanger.

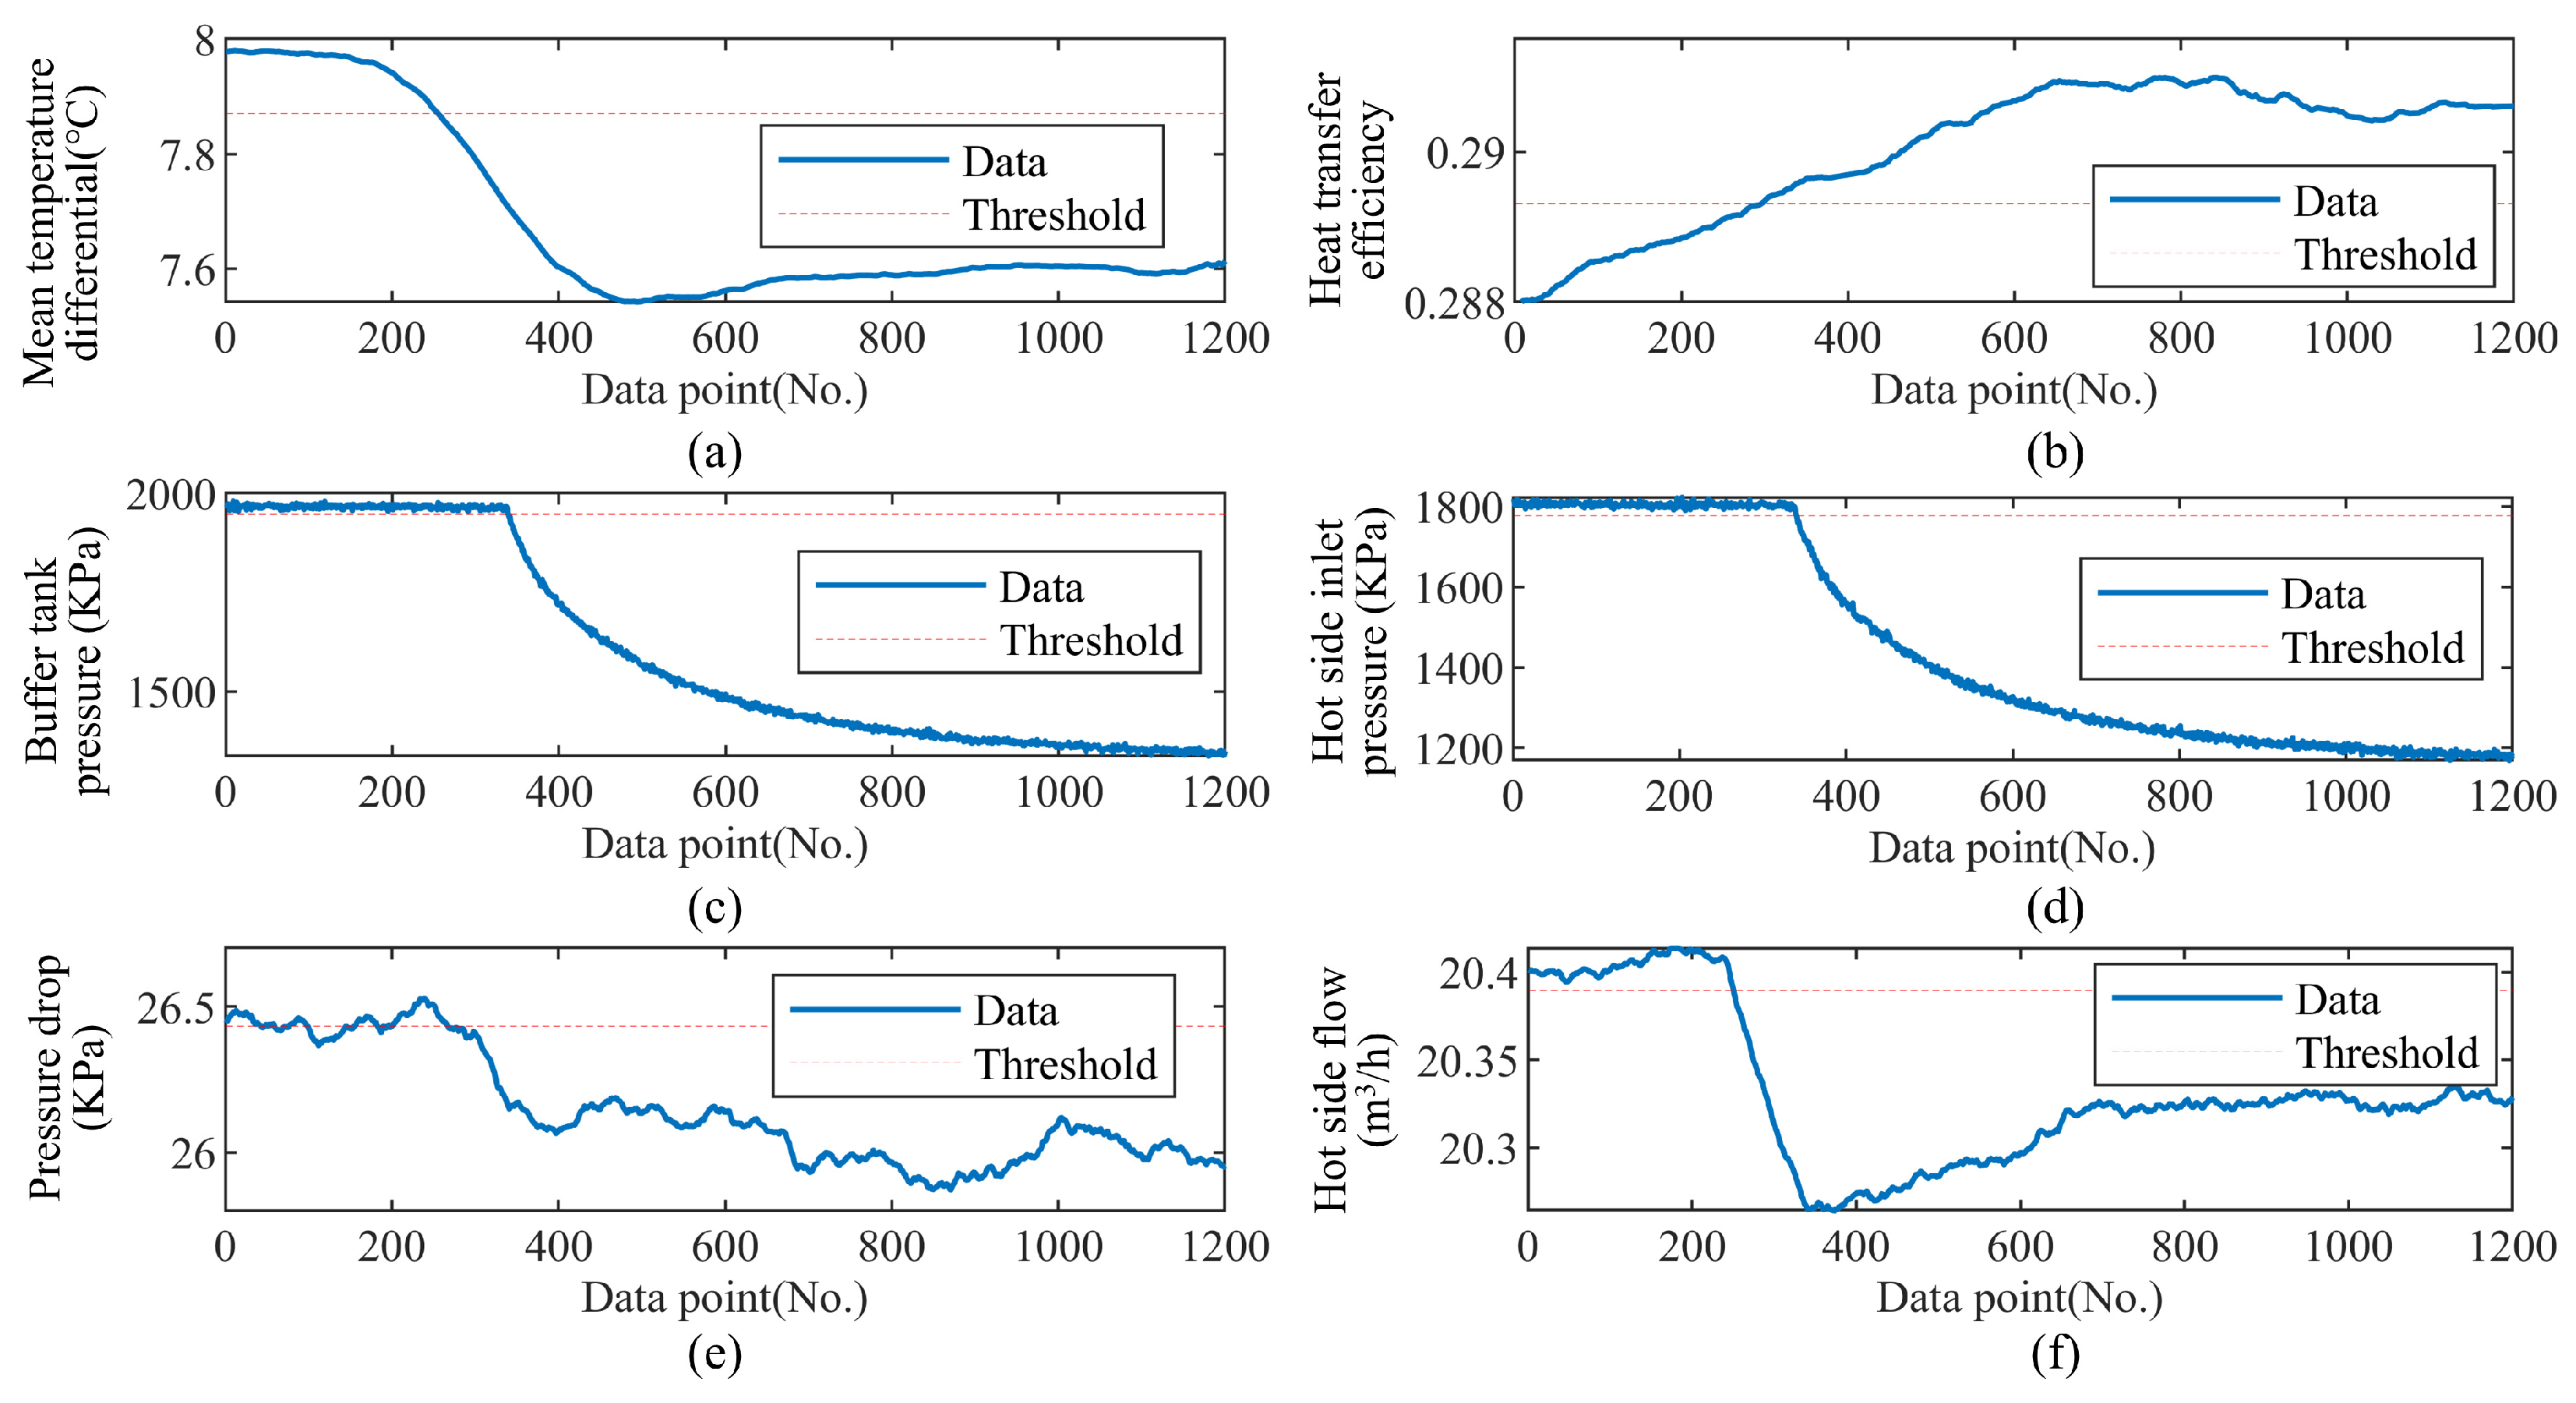
4.2.2. Data Analysis for Fouling Fault

As shown in Figure 6, the main effect of fouling is on the heat transfer performance. When fouling occurs, the heat resistance on both sides of the wall under the same temperature difference is larger. The outlet temperature of the hot side and the cold side rise and falls, respectively, reducing the heat transfer efficiency and increasing the average mean temperature differential. The fouling thermal resistance brought by the fouling layer reduces the total heat transfer coefficient. Though the amplitude of the cold side outlet temperature and the hot side outlet temperature data fluctuates and is affected by the working condition fluctuation, the overall trend is in line with the law obtained from the fault mode and effect analysis of the heat exchanger.

4.3. Fault Reasoning and Qualitive Identification

Experiment data in fouling fault under three working conditions, internal leakage fault under two working conditions and external leakage fault under one working condition are carried out for fault qualitative identification.
As shown in Table 6, different weight coefficients are set based on expert experience for eleven kinds of fault symptoms, and the score threshold is set to 1. When the above monitoring parameters exceed the adaptive threshold based on 3σ, as illustrated in Figure 4, Figure 5 and Figure 6, the corresponding fault symptom will be triggered. The scores of different fault modes under six working conditions are shown in Table 6. By fault reasoning of the model, the scores of the fault data in the corresponding fault mode are all greater than 1, which realizes a good qualitative diagnosis of fault mode.

4.4. Fault Degree Quantification

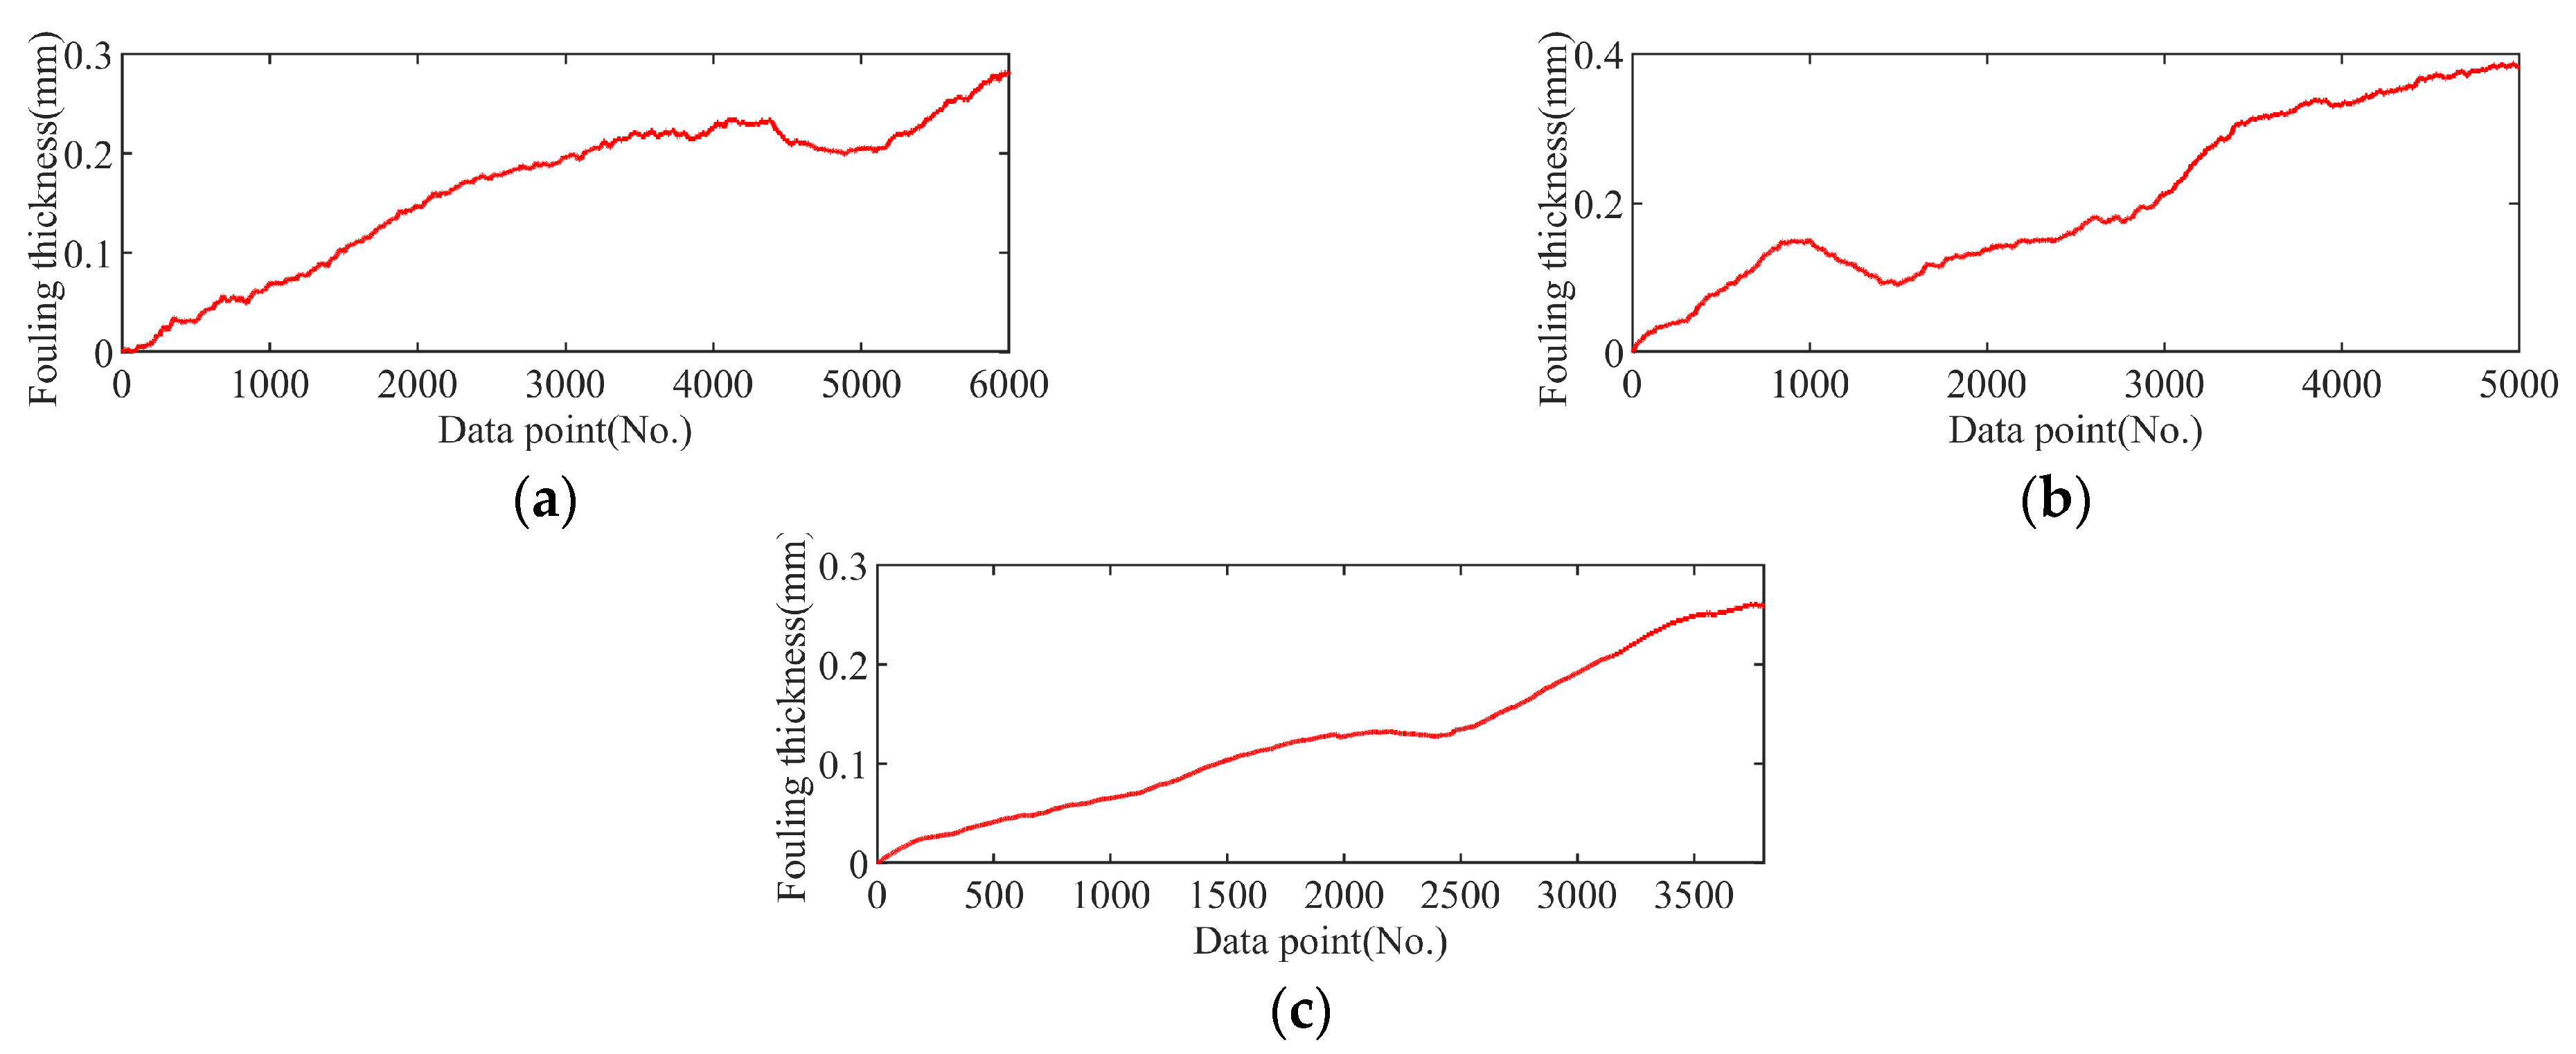
4.4.1. Fouling Thickness Quantification Analysis

Through the experiment data, the fouling quantification results based on the proposed quantification index are shown in Figure 7 and Table 7. Compared with the actual fouling thickness value under three groups of working conditions, the proposed method can achieve a maximum calculated error of 0.019 mm and average calculated error of 0.013 mm.

4.4.2. Leakage Quantification Analysis

Through the experiment data, leakage analysis results based on the proposed leakage quantification index are shown in Table 8. For internal/external leakage of media within 1% leakage rate under three working conditions, the proposed method can achieve a minimum calculated error of 0.001 m3/h and maximum calculated error of 0.047 m3/h, within the average calculated error of 0.017 m3/h.

5. Discussions

In order to further illustrate the effectiveness of the proposed method, firstly, the heat transfer coefficient K of the heat exchanger is selected for comparation and analysis of the effectiveness on leakage and scaling fault detection analysis. Then, comparation of the methods in fault quantification is carried out. Finally, the scalability of the proposed method to other types of heat exchangers is analyzed.
(1)
Comparation of the methods in fault detection
When the heat exchanger is in healthy state, the value of the heat transfer coefficient K stabilizes in a small range. Therefore, based on the value range, whether leakage or scaling occurs and the fault degree can be determined. For heat transfer coefficient K, the average value during the stable operation of the heat exchanger is taken as the standard value k0, and its fluctuation within the variance range is considered normal. That is, the value K being in the range of k ± σ is considered normal. In order to more clearly reflect the health state, the fault factor α is defined as follows:
α = k k 0 σ
When the fault factor is in the range of [0, 1], it means that there is no fault. When the fault factor is greater than 1, it means that fault occurs. The fault analysis results of scaling and leakage through fault factors are shown in Table 9 and Table 10. The time delay for fault detection is measured by the time difference from the occurrence of fault to the completion of fault detection. As the weight coefficients of parameters are introduced to a fault reasoning model, the sensitive parameters such as pressure drop play a more important role in the identification of leakage faults. Therefore, the proposed model is more sensitive than the traditional method based on the heat transfer coefficient in leakage diagnosis. For fouling fault, the sensitivity of the proposed method is slightly inferior to the traditional method. That is because more parameters are considered in fault identification, which leads to the lack of sensitivity while improving robustness.
(2)
Comparation of the methods in fault quantification
In this part, two fault quantification indexes for leakage and fouling are respectively carried out for comparation. For leakage fault, a model-based method is introduced to calculate the leakage value, as shown in Equation (21). c, Tti, Tto, Thealth and Tmean are, respectively, medium specific heat capacity, tube side inlet temperature, tube side outlet temperature, tube side outlet temperature in healthy state, mean value of inlet and outlet temperature in shell side.
L e a k a g e = K A ( T t i T h e a l t h ) c ( T t o T mean )
For fouling fault, a fouling thickness estimation method is introduced, as is illustrated in Equation (22), where n, D, d, L, ρ, S and λ are, respectively, tube number, shell diameter, tube diameter, length of tubes, medium density, shell side resistance coefficient and medium flow resistance coefficient. Through Equation (22), the fouling thickness can be calculated.
F o u l i n g = n 2 M 2 4 n M D + 4 n D 2 2 n d n M 4 n M = 8 ρ λ L π 2 S 5
The comparation results of models for fouling and leakage fault quantification are shown in Table 11. Compared with the traditional methods, though the performance of the proposed method is slightly inadequate under small leakage conditions, it has better performance in most of the working conditions.
(3)
Scalability and limitation analysis of the proposed method
Limited by the experimental conditions, only the shell-and-tube heat exchanger was analyzed in this paper. The fault quantification index proposed in this paper is based on thermodynamics, fluid mechanics and other mechanisms. Its construction is based on the heat transfer performance, resistance performance and comprehensive performance of the heat exchanger itself. For different types of heat exchangers, the performance evaluation indexes also include heat transfer coefficient, heat transfer efficiency, average temperature differential and other indexes. When the type of heat exchangers changes, the index calculation formula is different and needs to be adjusted for further application.

6. Conclusions

Aiming at the problem of fault quantitative diagnosis of the shell-and-tube heat exchangers, the idea of qualitative diagnosis and quantitative analysis is introduced. This paper proposes a data-model fusion-driven method for heat exchanger fault quantitative diagnosis. The effectiveness of the proposed method is verified by experiments and the following conclusions can be drawn:
(1)
Based on failure modes and effect analysis of heat exchangers, a fault symptoms and reasoning rule base for fault identification is constructed. By introducing parameter weights, the model has excellent sensitivity to fault recognition.
(2)
The direct fault quantification index of the heat exchanger is constructed by an integrate fault mechanism and the actual monitored data, which can achieve fault quantitative analysis of a heat exchanger with a leakage rate less than 1% and scale thickness less than 0.5 mm, within a 0.017 m3/h and 0.013 mm mean calculated error, respectively.
(3)
Compared with the traditional fault diagnosis method, the proposed method integrates fault qualitative identification and quantification analysis, which can not only realize an accurate identification of different fault modes, but also has good performance on fault degree assessment.
To achieve the intelligent health management of heat exchangers, further work is also suggested, such as explainable fault diagnosis based on the monitored online data and secondary parameters to achieve abnormal parameter identification, and remaining useful life prediction based on the proposed fault quantification index.

Author Contributions

Conceptualization, X.Q. and J.W.; data curation, H.X.; formal analysis, S.Y.; investigation, S.Y., Y.G. and H.X.; methodology, X.Q. and S.Y.; project administration, J.W.; resources, J.W.; software, Y.G.; supervision, J.W.; validation, Y.G., H.X. and Y.Y.; visualization, Y.Y.; writing—original draft, X.Q.; writing—review and editing, Y.G. All authors have read and agreed to the published version of the manuscript.

Funding

This research received no external funding.

Data Availability Statement

The original contributions presented in the study are included in the article, further inquiries can be directed to the corresponding author.

Conflicts of Interest

Authors Xiaogang Qin and Haibo Xu were employed by the company CNOOC China Limited Beijing Research Center. Author Yanbing Yu was employed by the company Exploration and Development Department of CNOOC Limited. The remaining authors declare that the research was conducted in the absence of any commercial or financial relationships that could be construed as a potential conflict of interest.

References

  1. Steinhagen, R.; Müller-steinhagen, H.; Maani, K. Problems and Costs Due to Heat Exchanger Fouling in New Zealand Industries. Heat Transf. Eng. 1993, 14, 19–30. [Google Scholar] [CrossRef]
  2. Fguiri, A.; Marvillet, C.; Jeday, M.R. Estimation of Fouling Resistance in a Phosphoric Acid/Steam Heat Exchanger Using Inverse Method. Appl. Therm. Eng. 2021, 192, 116935. [Google Scholar] [CrossRef]
  3. Al Hadad, W.; Schick, V.; Maillet, D. Fouling Detection in a Shell and Tube Heat Exchanger Using Variation of Its Thermal Impulse Responses: Methodological Approach and Numerical Verification. Appl. Therm. Eng. 2019, 155, 612–619. [Google Scholar] [CrossRef]
  4. Jonsson, G.R.; Lalot, S.; Palsson, O.P.; Desmet, B. Use of Extended Kalman Filtering in Detecting Fouling in Heat Exchangers. Int. J. Heat Mass Transf. 2007, 50, 2643–2655. [Google Scholar] [CrossRef]
  5. Delrot, S.; Guerra, T.M.; Dambrine, M.; Delmotte, F. Fouling Detection in a Heat Exchanger by Observer of Takagi–Sugeno Type for Systems with Unknown Polynomial Inputs. Eng. Appl. Artif. Intell. 2012, 25, 1558–1566. [Google Scholar] [CrossRef]
  6. Afgan, N.H.; Carvalho, M.G. Knowledge-Based Expert System for Fouling Assessment of Industrial Heat Exchangers. Appl. Therm. Eng. 1996, 16, 203–208. [Google Scholar] [CrossRef]
  7. Patil, P.D.; Kozminski, M.; Peterson, J.; Kumar, S. Fouling Diagnosis of Pennsylvania Grade Crude Blended with Opportunity Crude Oils in a Refinery Crude Unit’s Hot Heat Exchanger Train. Ind. Eng. Chem. Res. 2019, 58, 17918–17927. [Google Scholar] [CrossRef]
  8. Wallhäußer, E.; Hussein, M.A.; Becker, T. Detection Methods of Fouling in Heat Exchangers in the Food Industry. Food Control 2012, 27, 1–10. [Google Scholar] [CrossRef]
  9. Di Pretoro, A.; D’Iglio, F.; Manenti, F. Optimal Cleaning Cycle Scheduling under Uncertain Conditions: A Flexibility Analysis on Heat Exchanger Fouling. Processes 2021, 9, 93. [Google Scholar] [CrossRef]
  10. Wang, K.; Chen, J.; Song, Z.; Wang, Y.; Yang, C. Deep Neural Network-Embedded Stochastic Nonlinear State-Space Models and Their Applications to Process Monitoring. IEEE Trans. Neural Netw. Learn. Syst. 2022, 33, 7682–7694. [Google Scholar] [CrossRef]
  11. Hacene, H.; Michel, K.; Mimoun, Z. A Complete Procedure for Leak Detection and Diagnosis in a Complex Heat Exchanger Using Data-Driven Fuzzy Models. ISA Trans. 2009, 48, 354–361. [Google Scholar] [CrossRef]
  12. Davoudi, E.; Vaferi, B. Applying Artificial Neural Networks for Systematic Estimation of Degree of Fouling in Heat Exchangers. Chem. Eng. Res. Des. 2018, 130, 138–153. [Google Scholar] [CrossRef]
  13. Tian, W.; Liu, N.; Sui, D.; Cui, Z.; Liu, Z.; Wang, J.; Zou, H.; Zhao, Y. Early Warning of Internal Leakage in Heat Exchanger Network Based on Dynamic Mechanism Model and Long Short-Term Memory Method. Processes 2021, 9, 378. [Google Scholar] [CrossRef]
  14. Jallal, M.A.; Vallée, M.; Lamaison, N. Fouling Fault Detection and Diagnosis in District Heating Substations: Validation of a Hybrid CNN-Based PCA Model with Uncertainty Quantification on Virtual Replica Synthesis and Real Data. Energy 2024, 312, 133590. [Google Scholar] [CrossRef]
  15. Ingimundardóttir, H.; Lalot, S. Detection of Fouling in a Cross-Flow Heat Exchanger Using Wavelets. Heat Transf. Eng. 2011, 32, 349–357. [Google Scholar] [CrossRef]
  16. Elwerfalli, A.; Alsadaie, S.; Mujtaba, I.M. Estimation of Shutdown Schedule to Remove Fouling Layers of Heat Exchangers Using Risk-Based Inspection (RBI). Processes 2021, 9, 2177. [Google Scholar] [CrossRef]
  17. Wang, F.-L.; Tang, S.-Z.; He, Y.-L.; Kulacki, F.A.; Yu, Y. Heat Transfer and Fouling Performance of Finned Tube Heat Exchangers: Experimentation via on Line Monitoring. Fuel 2019, 236, 949–959. [Google Scholar] [CrossRef]
  18. Cid, N.; Patiño, D.; Porteiro, J.; Eiroa, D. Validation of a Fouling Measurement Procedure. IEEE Trans. Instrum. Meas. 2021, 70, 1–8. [Google Scholar] [CrossRef]
  19. Withers, P.M. Ultrasonic, Acoustic and Optical Techniques for the Non-Invasive Detection of Fouling in Food Processing Equipment. Trends Food Sci. Technol. 1996, 7, 293–298. [Google Scholar] [CrossRef]
  20. Guépié, B.K.; Grall-Maës, E.; Beauseroy, P.; Nikiforov, I.; Michel, F. Reliable Leak Detection in a Heat Exchanger of a Sodium-Cooled Fast Reactor. Ann. Nucl. Energy 2020, 142, 107357. [Google Scholar] [CrossRef]
  21. Samantray, J.S.; Goswami, S.; Sharma, V.K.; Biswal, J.; Pant, H.J. Leak Detection in a High-Pressure Heat Exchanger System in a Refinery Using Radiotracer Technique. J. Radioanal. Nucl. Chem. 2014, 302, 979–982. [Google Scholar] [CrossRef]
Figure 1. Fault tree for heat exchanger typical fault.
Energies 17 06113 g001
Figure 2. Framework of the proposed data-model fusion-driven method for heat exchanger fault quantitative diagnosis.
Energies 17 06113 g002
Figure 3. Schematic diagram of the testbench.
Energies 17 06113 g003
Figure 4. Data analysis for external leakage fault: (a) hot side outlet temperature, (b) heat transfer efficiency, (c) buffer tank pressure, (d) hot side inlet pressure, (e) pressure drop, (f) hot side flow.
Energies 17 06113 g004
Figure 5. Data analysis for internal leakage fault: (a) mean temperature differential, (b) heat transfer efficiency, (c) buffer tank pressure, (d) hot side inlet pressure, (e) pressure drop, (f) hot side flow.
Energies 17 06113 g005
Figure 6. Data analysis for fouling fault: (a) mean temperature differential, (b) hot side outlet temperature, (c) cold side outlet temperature, (d) heat transfer efficiency, (e) heat transfer coefficient.
Energies 17 06113 g006
Figure 7. Calculated results of fouling thickness quantification index: (a) working condition 1, (b) working condition 2, (c) working condition 3.
Energies 17 06113 g007
Table 1. List of fault tree events for heat exchanger.
EventSymbolEvent Name
Top eventA1Fault of heat exchanger occurs
Intermediate eventB1Fouling
B2Internal leakage
B3External leakage
Bottom eventC1Abnormal increase in average mean temperature Δ T m
C2Abnormal decrease in average mean temperature Δ T m
C3Abnormal increase in hot side outlet temperature T h o
C4Abnormal decrease in cold side outlet temperature T c o
C5Abnormal increase in heat transfer efficiency ε
C6Abnormal decrease in heat transfer efficiency ε
C7Abnormal decrease in buffer tank water level L
C8Abnormal decrease in inlet pressure P i
C9Abnormal decrease in pressure drop P d i
C10Abnormal decrease in flow rate V
C11Abnormal decrease in heat transfer efficiency K
Table 2. Monitored online data and constructed secondary parameters.
ParameterNameEquation
Hot side inlet temperature T h i
Monitored online dataHot side outlet temperature T h o /
Cold side inlet temperature T c i
Cold side outlet temperature T c o
Buffer tank water level L
Inlet pressure P i
Pressure drop P d - i
Flow rate V
Secondary parametersAverage temperature differential Δ T m Δ T m = ( T h i T c i ) ( T h o T c o ) lg ( T h i T c i ) ( T h o T c o )
Heat transfer coefficient K K = Φ / ( A Δ T m )
Heat transfer efficiency ε ε = Φ Φ max = T c o T c i T h i T c i
Table 3. Fault symptoms and reasoning rules of heat exchangers.
Fault TypeFault Symptom Score
1
(w1)
2
(w2)
3
(w3)
4
(w4)
5
(w5)
6
(w6)
7
(w7)
8
(w8)
9
(w9)
10
(w10)
11
(w11)
Fouling10110100001S1
Internal leakage01001011110S2
External leakage00100111110S3
Table 4. Experiment set for leakage fault.
ParametersWorking Condition 1Working Condition 2Working Condition 3
Hot/cold side inlet temperature (°C)55/3555/3555/35
Hot/cold side inlet pressure (MPa)1.0/0.11.5/0.12.0/0.1
Hot/cold side flow rate (m3/h)30/2035/2030/20
Internal medium leakage rate (%)0.040.6\
External leakage rate of flange (%)\\0.12
Table 5. Experiment set for fouling fault.
ParametersWorking Condition 1Working Condition 2Working Condition 3
Hot/cold side inlet temperature (°C)60/2570/3075/35
Hot/cold side inlet pressure (MPa)0.10.10.1
Hot/cold side flow rate (m3/h)8/57/46/3
Medium in the shellWater
Medium in tubesCaSO4
Table 6. Fault symptoms’ trigger rules and scores for different fault modes.
Fault and DatasetFault Symptoms and Weight CoefficientsScore
1
(0.3)
2
(0.3)
3
(0.3)
4
(0.3)
5
(0.3)
6
(0.3)
7
(0.3)
8
(0.3)
9
(0.3)
10
(0.1)
11
(0.4)
Fouling1001101000011
2001101000011
3001101000011
Internal leakage4100010111101.5
5110011111101.8
External leakage6101011111101.7
Table 7. Fouling diagnosis results based on the proposed fouling thickness quantification index.
Working
Condition
Actual Fouling
Thickness (mm)
Calculated Fouling
Thickness (mm)
Calculated Error (mm)
10.2880.2820.006
20.4010.3820.019
30.2440.2590.015
Table 8. Leakage diagnosis results based on the proposed leakage quantification index.
Working
Condition
Leakage RateActual Leakage
(m3/h)
Calculated Leakage (m3/h)Calculated Error (m3/h)
10.04%0.0120.0130.001
20.60%0.2170.1700.047
30.12%0.04280.0390.004
Table 9. Comparation results for leakage fault detection.
Working ConditionActual Leakage (m3/h) α Value When Fault OccursTime Delay for Fault Detection Using α Value (s)Time Delay for Fault Detection Using the Proposed Method (s)
10.0120.7564010
20.2170.5796010
30.04280.4627010
Table 10. Comparation results for fouling fault detection.
Working ConditionActual fouling Thickness (mm) α Value When Fault OccursTime Delay for Fault Detection Using α Value (s)Time Delay for Fault Detection Using the Proposed Method (s)
10.3190.921160240
20.2230.942210260
30.2650.913410460
Table 11. Comparation results on fault quantification analysis.
Fault ModeWorking ConditionCalculated Error
The Proposed MethodTraditional Fouling ModelTraditional Leakage Model
Fouling10.006 mm0.119 mm/
20.019 mm0.205 mm
30.015 mm0.213 mm
Leakage10.001 m3/h/0.008 m3/h
20.047 m3/h0.175 m3/h
30.004 m3/h0.001 m3/h
Disclaimer/Publisher’s Note: The statements, opinions and data contained in all publications are solely those of the individual author(s) and contributor(s) and not of MDPI and/or the editor(s). MDPI and/or the editor(s) disclaim responsibility for any injury to people or property resulting from any ideas, methods, instructions or products referred to in the content.

