Article

Optimal Scheduling Strategies for EV Charging and Discharging in a Coupled Power–Transportation Network with V2G Scheduling and Dynamic Pricing

College of Intelligent Systems Science and Engineering, Hubei Minzu University, Enshi 445000, China
*
Author to whom correspondence should be addressed.
Energies 2024, 17(23), 6167; https://doi.org/10.3390/en17236167
Submission received: 15 November 2024 / Revised: 28 November 2024 / Accepted: 5 December 2024 / Published: 6 December 2024

Abstract

:
With the increasing penetration of electric vehicles (EVs), the spatial–temporal coupling between the transportation network (TN) and the power distribution network (PDN) has intensified greatly. Large-scale uncoordinated charging of EVs significantly impacts both the PDN and TN. In this paper, an optimal scheduling strategy for EV charging and discharging in a coupled power–transportation network (CPTN) with Vehicle-to-Grid (V2G) scheduling and dynamic pricing is proposed. The strategy considers the influence of dynamic transportation road network (DTRN) information on EV driving patterns, as well as the unique vehicle characteristics and mobile energy storage capabilities of EVs. Firstly, a DTRN model is established. Subsequently, the dynamic Dijkstra algorithm is utilized to accurately simulate the EV driving paths and predict the spatial–temporal distribution of the EV charging load. Secondly, optimal scheduling for EV charging and discharging within the CPTN is performed, guided by a V2G model coupled with a multi-time dynamic electricity price (MTDEP) strategy to optimize the grid load curve while accommodating the charging requirements of EVs. Finally, the effectiveness and superiority of the proposed optimization scheduling model are validated by the IEEE 33-node PDN test system.

1. Introduction

Electric vehicles have become a crucial entity in enhancing the competitiveness of the national transportation sector in terms of energy saving and emission reduction, particularly in the context of carbon neutrality [1]. Recently, the number of new energy vehicles has rapidly increased, and the deployment of large-scale EVs exhibits significant potential for energy saving and emission reduction [2]. As the penetration rate of EVs rises, the interrelation between the transportation network and the power distribution network has increasingly strengthened through the intermediary of charging stations [3]. On the one hand, the interaction between EV route selection and road congestion may lead to uneven charging station utilization [4]. On the other hand, the disorderly access of large-scale EVs to the PDN at charging stations poses risks to its safety and stable operation [5]. However, due to the unique spatial–temporal mobility characteristic and charging–discharging energy storage flexibility of EVs [6], effective control strategies can provide abundant flexible resources to ensure the safe and stable operation of the coupled power–transportation network.
Currently, extensive research is devoted to utilizing the charging and discharging flexibility of EVs, which primarily focuses on the interactions between EVs and the grid. In [7], the authors established a demand response control model to formulate optimal charging and discharging plans for EVs, and a real-time supply and demand balance was achieved. In [8], the authors developed intelligent charging strategies aimed at optimizing the system load curve and reducing charging costs while meeting the charging demands of EVs. In [9], the authors proposed a mixed integer programming model for optimal bi-level scheduling, which minimizes the overall load variance of the PDN under the constraints of power flow and EV travel demand. In [10], the authors explored the latest distributed charging control schemes for EVs from the perspectives of charging network operators, EV users, and aggregators, which provided a reference for research on distributed optimization algorithms. In [11,12], the authors investigated the potential of EVs as distributed energy storage devices in participating in V2G services and assessed their influence on the power system, highlighting the practical challenges that V2G scheduling encounters when accounting for business models and market mechanisms. The former introduces temporal and economic indicators to evaluate the feasibility of EVs providing V2G services across various charging scenarios. The latter concentrates on the grid integration challenges of EVs within the carbon market framework, proposing a method grounded in carbon-inclusive management strategies, which improve the economic viability of low-carbon transitions through the optimization of EV charging and discharging schedules. In [13,14], the authors proposed an innovative infrastructure for V2G technology. Reference [13] introduces a distributed edge computing framework that employs Long Short-Term Memory (LSTM) networks to forecast electricity data, enhancing the prediction accuracy and robustness by integrating attention mechanisms and data clustering. Reference [14] proposed a pseudo-hierarchical management architecture for direct current microgrids predicated on intelligent charging points, which facilitates autonomous power coordination and real-time V2G operations via decentralized control mechanisms, effectively mitigating short-term load fluctuations. In [15], the authors proposed an evaluation metric tailored for the forecasting value in the context of V2G scheduling, which is used to assess the impact of forecasting performance on the degradation rate of scheduling performance, providing valuable insights into potential directions for improvement in future load forecasting technology.
However, the aforementioned charging scheduling strategies are confined to the interaction between the power grid and EVs, and neglect the collaborative interactions among EVs, charging stations, road networks, and the grid. Therefore, another study considered the space–time movement flexibility of EVs and investigated the coordinated operation of the CPTN. In [16], the authors formulated the optimal charging pricing problem for charging stations considering the interdependent operation of the urban TN and PDN. A bi-level optimization model that integrates the urban TN and PDN from the perspective of charging network operators is developed to analyze the effects of pricing regulation strategies on the revenues of the TN, PDN, and EV users. However, the model only takes into account the distribution of static traffic flow in a single time segment and does not account for the influence of travel time costs on EV users’ charging decisions. In [17], the authors considered the node pricing and congestion fees for roads and charging stations and proposed a collaborative pricing model based on variational inequality methods to coordinate the CPTN, so as to minimize the operational cost of the entire system. However, the model did not account for dynamic traffic flows and the randomness of user behavior. In [18], the authors incorporated the route preferences of EV drivers and proposed a comprehensive optimal traffic–power flow model that accounts for environmentally aware user behavior to coordinate the CPTN. However, it did not address the dynamic changes in user behavior and the temporal variations in traffic flow distribution. In [19], the authors proposed a new resilience enhancement method, which integrates a dynamic road network and V2G technology to select charging stations for EVs with insufficient power and dispatch EVs with sufficient power to provide support for the power grid through V2G technology. However, it lacks accurate simulation of the driving paths and charging loads of EVs.
This paper explores the influence of DTRN information on EV driving patterns, considering the unique characteristics of EVs as vehicles and their mobile load attributes. An EV charging and discharging scheduling strategy considering V2G scheduling in the CPTN is proposed. We establish the DTRN model, and the origin–destination (OD) matrix and dynamic Dijkstra algorithm are used to simulate EV driving paths and predict the spatial–temporal distribution of charging loads. Subsequently, based on the simulation results and in conjunction with dynamic pricing and the V2G model, user charging behavior is guided by MTDEP to realize the optimal scheduling of EV charging and discharging in the CPTN, which optimizes the grid load curve and reduces the peak–valley difference. The major contributions of this paper are as follows:
  • A DTRN model is developed by an OD matrix method to simulate the travel movement features of EVs. By incorporating a dynamic Dijkstra algorithm, the travel paths of EVs are accurately modeled. Furthermore, the charging loads are predicted through interactions between the TN and PDN.
  • An MTDEP mechanism is proposed that optimizes the charging plan of EVs. By segmenting the load into multiple time periods and calculating the price for each period based on the actual load conditions, the proposed MTDEP mechanism can accurately and efficiently facilitate load transfer in accordance with varying base load conditions and enhance economic efficiency.
  • An optimal scheduling strategy for EV charging and discharging in a CPTN with V2G scheduling and dynamic pricing is proposed using DTRN information from the coupled system. This model optimizes the charging and discharging of EVs according to the predicted spatial–temporal distribution of charging loads, in conjunction with the MTDEP-guided V2G model. It effectively meets EV charging demands while reducing costs, minimizing load fluctuations, and enhancing grid stability.
The remainder of this paper is organized as follows. Section 2 presents the spatial–temporal distribution simulation of EV charging loads and the charging and discharging scheduling problem within the CPTN. Section 3 proposes the model-solving methods. Section 4 provides the experimental simulation results of the CPTN constructed by the IEEE 33-node PDN model combined with the DTRN model as a test system. Finally, Section 5 concludes this paper and suggests future research directions.

2. Problem Formulation

2.1. Modeling for the Spatial–Temporal Distribution Simulation of EV Charging Loads

The energy consumption generated by EVs traveling in the TN is influenced by traffic information, such as traffic demand [20], travel distribution [21], and route planning [22], etc., which are impacted by road structures and segment congestion. Subsequently, the charging load is integrated into the PDN through charging stations, which changes the spatial–temporal distribution of power flow within the PDN [23]. This study proposes a simulation model for the spatial–temporal distribution of EV charging loads to characterize their distribution accurately. To enhance the accuracy of spatial–temporal distribution simulations and assess the influence of large-scale charging on the PDN, a CPTN model has been established. The schematic diagram of the topology of the CPTN is illustrated in Figure 1.

2.1.1. DTRN Model

In the “vehicle–road–network” interaction model, the road network is typically represented by a static model in which traffic flow remains constant over time. To capture the dynamic characteristics of the road network, this paper develops the DTRN model, which updates the flow for each segment, as represented below [24]:
G = ( V , E , H , W ) ,
V = v i | i = 1 , 2 , , u ,
E = v i j | i j ,
H = k | k = 1 , 2 , , T ,
W = w i j k | k H ,
where G represents the set of road networks; V denotes the set of all nodes, totaling u; E is the set of road segments; H represents time intervals that partition the day into T segments; W is the set of weights for the road segments; v i represents the i-th node in the road network; v i j denotes the segment connecting the i-th and j-th nodes; and w i j k is the weight of the segment v i j during time period k.

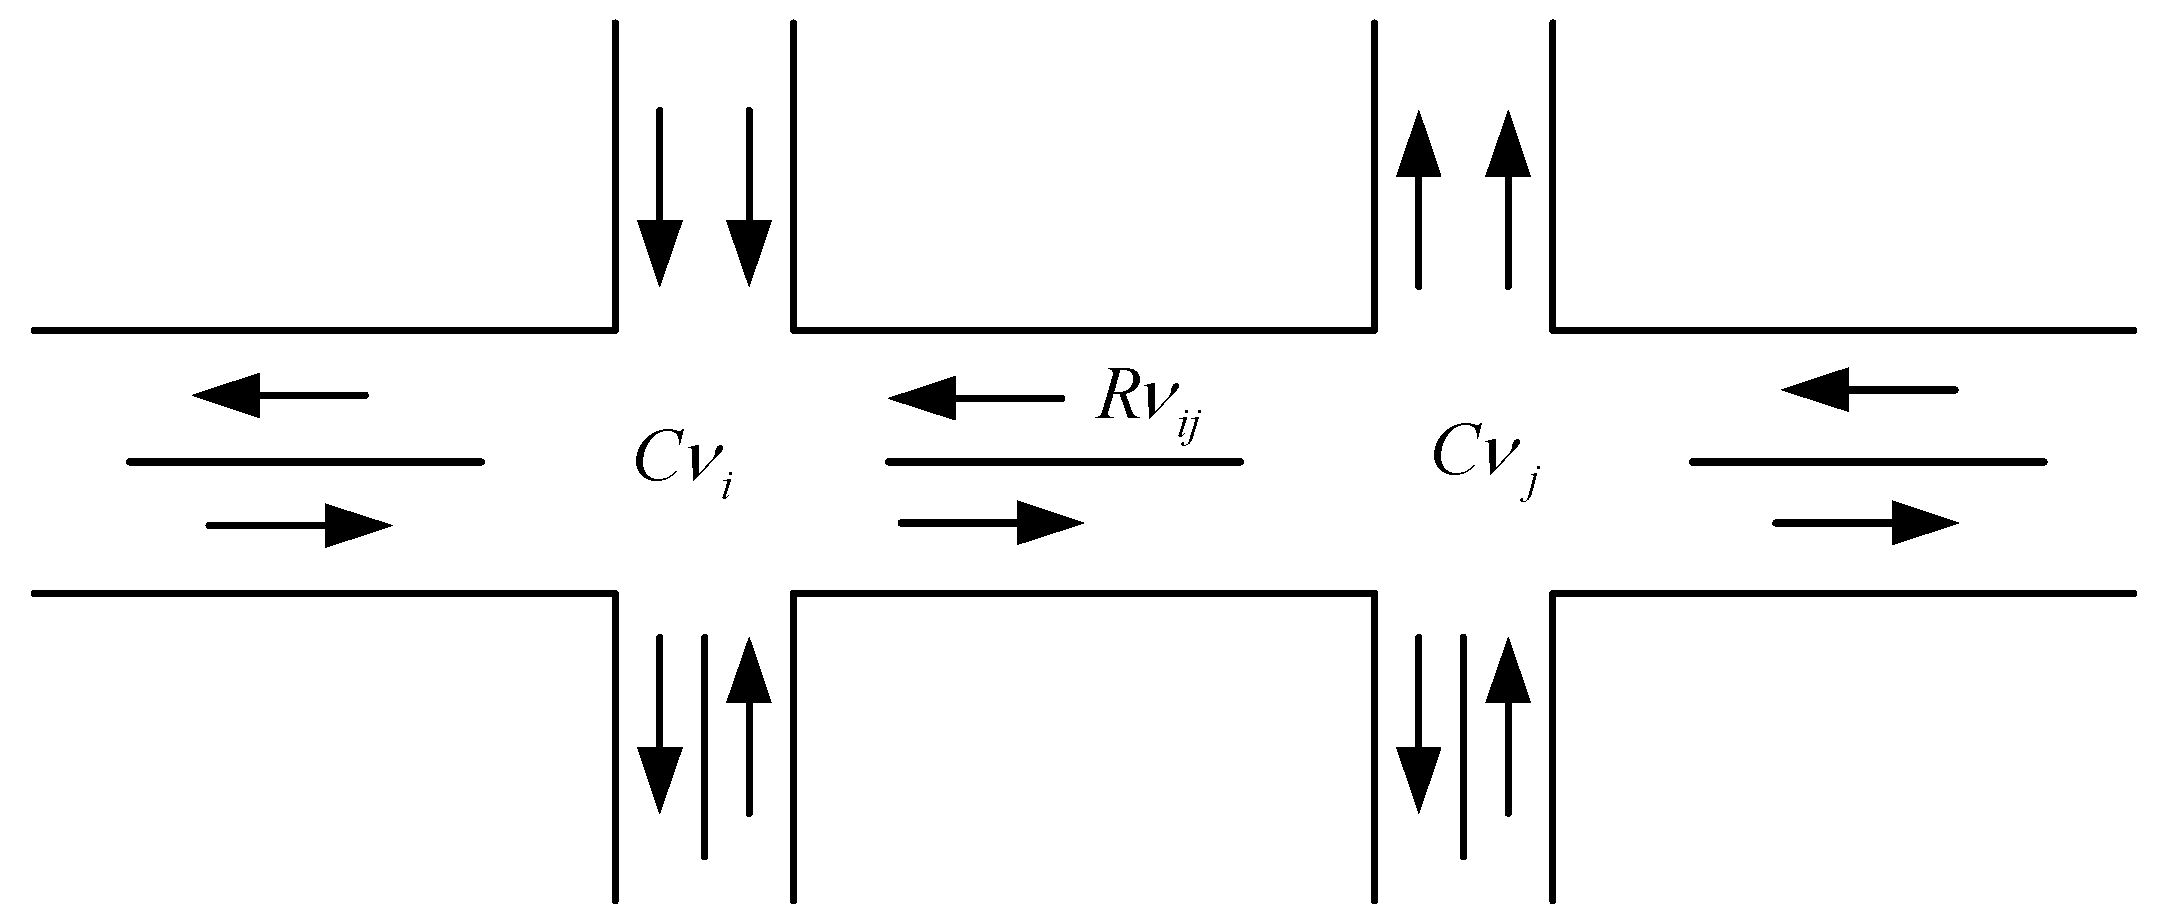
2.1.2. Road Resistance Model

Urban road networks exhibit the characteristics of dynamic variability and multiple intersections. EV driving is not only influenced by segment impedance but also experiences delays due to traffic signal control. Therefore, a time flow model [25] is introduced for analysis in this paper. This model quantifies travel costs on urban roads by analyzing real-time variations in traffic flow and segment travel times. The schematic of the urban road resistance structure is displayed in Figure 2.
As illustrated in Figure 2, the road impedance model can be described as follows:
W i j k ( t ) = C ν i ( t ) + R ν i j ( t ) ,
where C ν i ( t ) denotes the node impedance model; R ν i j ( t ) denotes the segment impedance model.
Based on the classification criteria for urban traffic conditions, the saturation index S is defined as follows: when 0 < S ≤ 0.6, the road is considered to be in a free-flowing state; when 0.6 < S ≤ 0.8, the road is in a slow-moving state; when 0.8 < S ≤ 1.0, the road is considered to be in a congestion state; and when 1.0 < S ≤ 2.0, the road is in a state of severe congestion. Road intersections and segments with varying capacities can obtain different impedance models for road sections and nodes under different saturation levels [26].
(1)
The road segment impedance model is as follows:
R ν i j ( t ) = R 1 ν i j ( t ) : t 0 ( 1 + α ( S ) β ) , 0 < S 1.0 R 2 ν i j ( t ) : t 0 ( 1 + α ( 2 S ) β ) , 1.0 < S 2.0 ,
In the formula, saturation S = Q/C; Q is the traffic flow of the road segment; C is the traffic capacity; t 0 is the travel time at zero flow; and α and β are impedance impact factors.
(2)
The node impedance model is as follows:
C ν i ( t ) = C 1 ν i ( t ) : 9 10 [ c ( 1 λ ) 2 2 ( 1 λ S ) + S 2 2 q ( 1 S ) ] , 0 < S 0.6 C 2 ν i ( t ) : c ( 1 λ ) 2 2 ( 1 λ S ) + 1.5 ( S 0.6 ) 1 S S , S > 0.6 ,
where c is the signal cycle; λ is the green ratio; and q is the vehicle arrival rate at the road segment.
(3)
The road resistance model is as follows:
w i j k ( t ) = R 1 ν i j ( t ) + C 1 ν i ( t ) , 0 < S 0.6 R 1 ν i j ( t ) + C 2 ν i ( t ) , 0.6 < S 0.8 R 2 ν i j ( t ) + C 1 ν i ( t ) , 0.8 < S 1.0 R 2 ν i j ( t ) + C 2 ν i ( t ) , 1.0 < S 2.0 ,

2.1.3. EV Driving Characteristics

EVs are classified into three categories according to their types and different travel features: private cars, rental cars, and public cars. Among them, the OD points for private cars primarily consist of home-to-workplace routes, whereas the OD points for rental and public cars are not fixed. To analyze the driving characteristics of EVs, the OD matrix method [27] is described as follows:
C i j K = B i j K j = 1 M B i j K , ( 1 < i < n , 1 < j < n , i j ) ,
where B i j K represents the number of traffic vehicles from node i to node j during time period T; C i j K represents the probability of travel from node i to node j. The probability distributions of departure and return times for each type of EV can be referenced in Ref. [28].
Utilizing the obtained OD matrix for each EV, we employ the dynamic Dijkstra algorithm [29] to search for the minimum travel time path between OD pairs. This approach allows for the depiction of the dynamic driving trajectories of EVs and the assessment of their driving characteristics. The objective of the Dijkstra algorithm is as follows:
S i j t = ν i j E ν i j w i j k t ,
ν i j = 1 , ν i j d i ( i ) 0 , ν i j d i ( i ) ,
where ν i j = 1 indicates that the right side of the road is in the actual driving path d i ( i ) , otherwise ν i j = 0 .

2.1.4. EV Charging Characteristics

Each EV travels along the OD path determined by the Dijkstra algorithm, with real-time updates to the energy parameters to obtain the charging characteristics. The battery capacities of all kinds of EVs conform to the normal distribution, as detailed in Ref. [30].
g [ C p ( i ) ; u ; σ ] = 1 σ 2 π e [ C p ( i ) u ] 2 2 σ 2 ,
It is assumed that the initial state of charge (SOC) corresponds to the battery level immediately after charging. The SOC after charging is set to be 0.8~0.9 of the battery capacity. According to the above formula, the initial battery capacity of each EV can be obtained. The remaining energy C t ( i ) at time t is expressed as follows:
C t ( i ) = η ( C t 1 ( i ) Δ l E c ) ,
where η is the energy consumption coefficient, taking values between 0.9 and 1; E c is the energy consumption per kilometer, with values ranging from 0.15 to 0.2 (kWh)/km; C t 1 is the remaining energy at time t − 1; and Δ l is the distance traveled by the i-th EV from t − 1 to t.

2.1.5. Charging Demand Model

The OD of private cars is relatively fixed, and the main charging method is slow charging. After private cars arrive at their destinations, the charging demand is triggered when C t ( i ) cannot meet the next trip as follows:
C t ( i ) L t d ( i ) E c ,
where L t d ( i ) indicates the distance from the current position to the destination of the EV.
The travel behavior of rental cars is highly random, and the primary charging method is fast charging. Thus, when the remained energy falls lower than a predetermined threshold, the charging demand will be triggered as follows:
C t ( i ) δ C l ( i ) ,
where δ takes values between 0.15 and 0.35; C l ( i ) is the threshold quantity of electricity.
According to the travel characteristics of public cars, the private car charging method is used when Equation (14) is satisfied; otherwise, the rental car charging method is adopted. Finally, the charging duration can be described using the following equation:
T c ( i ) = C o ( i ) C t ( i ) η c P charge ,
where C o ( i ) represents the initial energy of the EV; η c and P charge denote the charging efficiency and charging power, respectively.

2.2. Optimal Power Flow Model for the PDN

In the CPTN model, the PDN is spatially coupled with the TN at the nodes. Considering the interaction characteristics between EV charging energy and grid energy, a certain PDN scale needs to be constructed to match the scale of the TN based on the established DTRN model [31]. This research employs the IEEE 33-node standard PDN model, in which each PDN node is interconnected with the TN nodes. Upon determining the optimal path, EV users establish connections to the grid at nodes 15, 19, 23, and 32 for grid-connected charging operations. Simultaneously, the grid side allocates an optimized charging distribution for EVs to achieve optimization objectives. The total load is defined as the summation of the base load and the cumulative charging power of the connected EVs at the respective charging nodes [32], mathematically described as follows:
L t d = L t b a s e + i = 1 N x i , t ,
where L t d is the total grid load at time t, L t b a s e serves as the basic load for each operation of the grid, and x i , t is the charging power of the i-th EV at time t.

2.2.1. EV Grid Connection Model

When the EV chooses the optimal path to reach the destination on the TN side for grid-connected charging, the time available for scheduling EV charging can be articulated as follows:
T i charge = t i l e v t i a r r ,
where t i a r r represents the i-th EV grid connection time; t i l e v denotes the i-th EV disconnection time.
The charging demand of each EV is described as follows:
E i q = E i c a p S O C arr S O C lev 0.9 ,
where E i c a p indicates the full capacity of the i-th EV battery, while the battery states upon arrival and departure are denoted by S O C arr and S O C lev , respectively. The SOC after charging is set to 0.9 of the battery capacity.
The scheduling cycle for a day is divided into T time periods, each of unit length τ , and the capacity constraint during battery charging can be expressed as follows:
0 E i c a p S O C arr + t = t i a q r t i q τ x i , t E i c a p t q t t i n , t i o f ,
The power constraint during charging is expressed as follows:
P discharge < x i , t < P charge ,
where P discharge is the maximum charging power; P charge is the maximum discharging power.
The total charging load of the EVs at time t is represented as follows:
L t E V = i = 1 N x i , t ,

2.2.2. MTDEP Mechanism

The time-sharing static electricity price (TSSEP) represents an effective method for regulating demand on the user side within the grid segment [33]. Charging network operators divide the peak–valley electricity prices according to local basic load curves. The fluctuation of electricity prices significantly influences electricity demand, which leads to variations in charging loads. This aims to decrease the peak–valley load difference and achieve peak shaving and valley filling [34]. The price range of the traditional TSSEP is typically not further adjusted once set. However, residents’ electricity consumption behaviors are influenced by factors such as seasonal variations, regional differences, and individual comfort levels, which can lead to deviations from the initially established price range. These deviations frequently result in a mismatch between load and price fluctuations [35]. Consequently, an MTDEP strategy is proposed in this paper, which sets the price level of the period according to the load level of the period. It can well reflect the current market supply and demand situation and emphasizes the real-time adjustment function of the price. It aims to alleviate the charging congestion that easily occurs during the trough electricity price period and has strong timeliness.
The MTDEP is associated with the peak and valley magnitudes of daily load, which is defined based on daily load and time-varying electricity prices as follows:
d t = L t b a s e L t l o w P r up P r low L t , up b a s e L t , low b a s e + P r low ,
where L t b a s e is the base load for the operation of the grid at time t; L t l o w is the minimum load at time t; P r up is the maximum electricity price; P r low is the minimum electricity price; L t , up b a s e is the maximum base load for the operation of the grid at time t; and L t , low b a s e is the minimum base load for the operation of the grid at time t.
The charging cost for a single EV is derived from the following expression:
cos t i = t i a r r t i l e v x i , t d t ,
where the definition of variables is consistent with the previous description.

2.2.3. Network Loss Model

The network loss costs resulting from EV charging and discharging behaviors are closely related to node performance. Additionally, scheduling strategies assign varying load levels to each node. Direct calculation of network losses through power flow calculations can significantly increase the optimization time, which leads to the inability to provide charging and discharging plans for all EV users in a timely manner [36]. Reducing the network losses caused by EV grid connections is essential for the economic operation of power systems, as it alters the distribution of power flow of the existing system. The charging and discharging time and power of EVs significantly influence the smoothing of the system load curve during the scheduling process. Changes in injected power at system nodes impact variations in network losses, which can be quantified using network loss sensitivity (NLS). The NLS indicates how network losses respond to power injections at nodes. Macroscopically, this can be interpreted as the extent of network loss resulting from an increase in the unit load at grid nodes [37]. The polar form of the power flow equations is expressed as follows:
P i = V i V j G i j cos δ i j + B i j sin δ i j ,
where V i and V j denote the voltage magnitudes at nodes i and j, respectively; P i is the injected power at node i; G i j and B i j are the conductance and susceptance of branch ij, respectively; and δ i j is the phase angle differences between nodes i and j.
The active power loss sensitivity S P i at node i is defined as follows [38]:
S P i = P loss P i ,
where P loss represents the network loss of the system, which should equal the sum of injected powers across all nodes in the system.
The network loss resulting from the net load power of EVs at node i during time period t is articulated as follows:
P loss ( t ) = i = 1 N S p i P EV ( i , t ) ,
where P EV ( i , t ) denotes the net load power of EVs at node i during time period t; S p i indicates the PLS value at node i during time period t; P loss ( t ) is the network loss during time period t; and N signifies the total number of nodes within the network.
Within the scheduling cycle, the total active network loss is given by the following equation:
P loss = t = 1 96 P loss t ,
Furthermore, NLS is calculated using the grid’s base load, implying that each time period corresponds to a specific set of NLS values. Since the scheduling strategy relies on base load data derived from day-ahead forecasts, the NLS can perform offline calculations for all time periods well in advance of the daily scheduling process. Consequently, in the subsequent optimization process, the NLS metrics are only updated according to the charging and discharging behaviors of the EVs at the corresponding nodes, which avoids the necessity of repeated power flow calculation. This approach not only enhances computational efficiency but also facilitates a timely response to EV charging demands in a dynamic environment.

2.2.4. Objective Function and Constraints

The objective of this optimization is to formulate an EV charging plan that minimizes total costs while meeting the charging demands of EVs. The specifics are described as follows:
min i = 1 N cos t i + t = 1 T k 1 P loss ( t ) ,
s . t .   ( 18 ) ( 25 ) ,
where k 1 represents the conversion coefficient for network loss costs, and the definitions of other variables remain consistent with previous sections.

3. Model-Solving Method

Convex optimization methods are effective for solving high-dimensional convex optimization problems. This study employs the interior point method to address the scheduling model. This method constructs a convex penalty function within the feasible region of the original optimization problem and iteratively optimizes this function to converge toward the optimal solution. The primary advantage of the interior point method is its iterative nature, which ensures that the solution remains within the feasible region, thus mitigating the risk of convergence to infeasible solutions. The flowchart illustrating the scheduling model constructed using the interior point method is presented in Figure 3.

4. Case Analysis

4.1. Test System

The IEEE 33-node PDN system combined with the DTRN model is used to construct the CPTN. Four charging stations are positioned at coupling nodes 15, 19, 23, and 32. The network topology of the test system is illustrated in Figure 4. Node 1 serves as the balancing node for the IEEE 33-node PDN system, with a base voltage of 12.66 kV and a base power of 100 MVA. The simulation time is 24 h a day, divided into 96 time periods, i.e., 15 min for each time period.

4.2. Experimental Results and Analysis

Section 4.2.1 provides a comparison between the MTDEP mechanism and traditional TSSEP pricing, with TSSEP data derived from time-of-use electricity prices in a certain region. The distribution of the initial three types of EVs at traffic nodes is detailed in Section 4.2.2. Section 4.2.3 analyzes the spatial–temporal distribution characteristics of EV charging loads, offering foundational data for subsequent simulations. Section 4.2.4 compares the grid load distribution between the proposed charging and discharging strategy and a disordered charging and discharging state. Section 4.2.5 describes the NLS at various grid nodes across different time periods. Finally, Section 4.2.6 conducts a cost analysis comparing cases before and after scheduling.

4.2.1. Comparison of Electricity Price Strategies

Figure 5 illustrates a comparison of the two pricing strategies; the MPDEP strategy can be adjusted according to varying base load conditions. The more refined the division of the load range, the more accurate the guidance. A comparison of the two pricing strategies reveals that the MPDEP strategy offers greater flexibility than TSSEP. This flexibility not only accommodates residents’ electricity consumption patterns more effectively but also significantly mitigates congestion resulting from a substantial number of EVs charging during low-price periods. Meanwhile, the peak-to-valley difference for both pricing strategies is presented in Table 1.
Table 1 indicates that the MPDEP strategy reduces the load peak by 1.8% and the peak-to-valley difference by 9.04% compared to the TSSEP strategy. Consequently, the MPDEP strategy effectively decreases the peak-to-valley difference in the power grid.

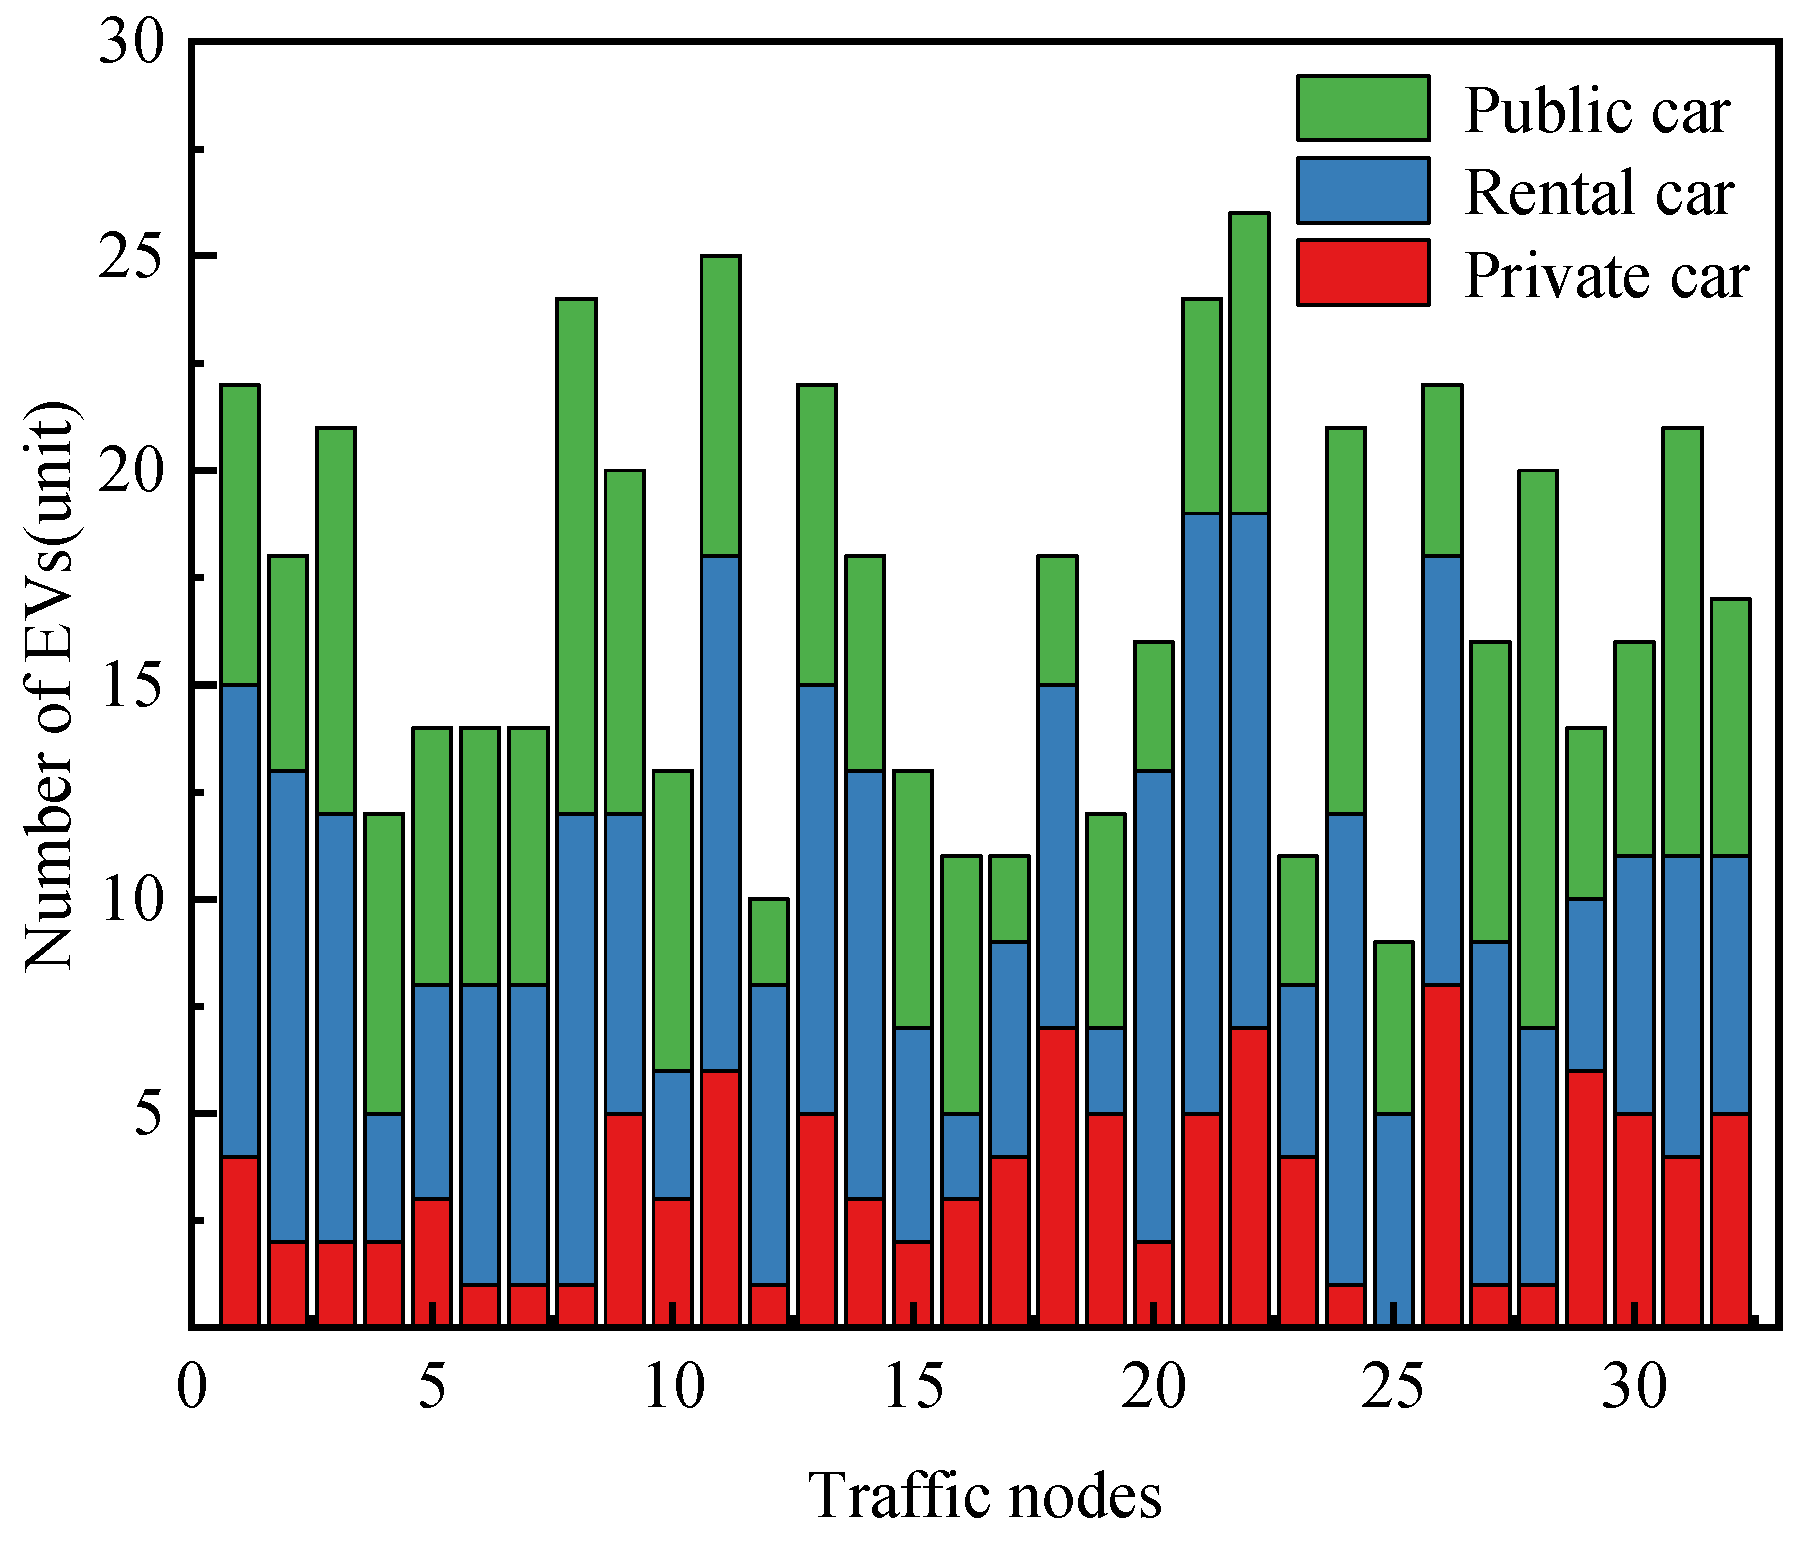
4.2.2. Initial Distribution of EVs at Traffic Nodes

A total of 545 EVs are allocated across various traffic nodes in the system, comprising 109 commuter private cars, 240 rental cars, and 196 other public cars. Figure 6 depicts the initial distribution of the three categories of EVs at each traffic node. These EVs search for the shortest charging path by the dynamic Dijkstra algorithm between OD pairs based on their respective charging demands and destinations. They navigate along predetermined routes to select suitable charging station nodes for connection to the grid.

4.2.3. Spatial–Temporal Distribution of EV Charging Loads

This section analyzes the spatial–temporal distribution characteristics of EV charging loads through a predictive model and provides references for subsequent charging and discharging regulation efforts. Upon the arrival of each EV at its destination via the optimal path and subsequent connection to the grid, the charging demands at four charging stations are as illustrated in Figure 7.
As illustrated in Figure 7, the four charging stations located at coupling nodes 15, 19, 23, and 32 primarily serve various categories of EVs with charging demands and satisfy these charging demands while maintaining the overall charging load within the planned thresholds. Notably, among the four charging station nodes of the CPTN, the overall time distribution of EV charging demand peaks predominantly between time intervals 35 and 44, exhibiting a “single-peak” pattern. During the remaining time intervals, only a limited number of EVs choose to charge.

4.2.4. Comparison of Charging Strategies

In this paper, based on predictive results and the V2G model guided by the MPDEP strategy, an optimized scheduling strategy for EV charging and discharging within the CPTN is proposed. The proposed strategy aims to optimize grid load distribution and fulfill EV charging requirements by intelligently shifting charging demand to valley periods, especially during peak electricity demand hours. The comparison of grid load distribution between disordered charging and discharging strategies and the MPDEP-guided V2G strategy is shown in Figure 8.
Figure 8 demonstrates that the MPDEP-guided V2G strategy significantly improves the overall load curve of the grid. Specifically, in the disordered charging and discharging state (where EVs connect to the grid and charge at maximum speed until the battery is full before disconnecting), the total load peak of the grid reaches 3062.565 kW, while the valley measures 1932.036 kW with a peak–valley difference of 1130.529 kW. After implementing the proposed scheduling strategy, the total load peak of the grid is reduced to 2869.156 kW, with a valley of 2033.566 kW and a peak–valley difference of 835.59 kW.
Compared with the disordered charging and discharging states, the proposed strategy effectively reduces the violent fluctuation of the load curve. In the uncontrolled disordered charging and discharging mode, the load curve shows considerable fluctuations, with peak loads observed at time periods 44 and 73. Such abrupt changes in load can severely influence the stable operation of the power grid. In contrast, the proposed strategy ensures a relatively stable load level of around 2800 kW during concentrated charging periods by implementing meticulous management of the charging process. This strategy achieves a load reduction of approximately 300 kW and decreases the total peak–valley difference by 26.09%. This strategy not only alleviates pressure on the grid during peak periods but also effectively smooths the load curve. Furthermore, it plays a vital part in enhancing the reliability of electricity supply, decreasing operational costs and facilitating the integration of renewable energy sources into the grid.
The base load reaches its peak values during the time periods around 44 and 73. The proposed scheduling strategy aims to mitigate the peak load during these times. During significant peak–valley differences at time periods 44 and 73, V2G technology is employed to schedule EV discharges during high electricity price periods to meet the demands of other electrical loads in the system. Conversely, during low-price periods, the scheduling strategy charges EVs to alleviate system load pressure and prevent power supply shortages during peak load periods, thus ensuring stable system operation. Furthermore, some EVs choose to feed power back to the grid during periods 44 and 73 to gain additional revenue. As a result, the total load after scheduling is significantly lower than the base load during these periods. At the moment of a low electricity price being set, the scheduling center directs a substantial number of EVs to charge, thereby effectively utilizing low-cost electric energy resources for storage and ensuring adequate reserve energy for subsequent high-demand periods. Therefore, after implementing the scheduling strategy, the energy consumption load of EVs becomes more stable, achieving significant peak-shaving and valley-filling effects while avoiding EV charging during high-price periods and reducing charging costs.

4.2.5. NLS Analysis

A sensitivity analysis of network losses across various time periods and nodes in the IEEE 33-node PDN system was conducted based on fundamental load calculations. The NLS values for each grid node at different time periods are shown in Figure 9.
Figure 9 indicates that nodes 18 and 33 exhibit relatively high NLS values, and the degree of change in the amount of response is larger when the same power is injected, which has a greater influence when calculating the NLS metrics. Notably, node 1 is a balanced node in the IEEE 33-node PSN system, with an NLS value of 0, which indicates that it is unaffected by network losses. It is noteworthy that node 1 prohibits the connection of EVs. Additionally, during specific periods, particularly periods 44 and 73, sensitivity values in nearby areas are relatively high due to substantial basic loads connected during these intervals, causing increased sensitivity values in those regions. The high sensitivity value observed at a particular node within the same timeframe is attributed to the node with a large sensitivity value having a large change in the response amount when the same power is injected.

4.2.6. Cost Analysis

The charging cost and network loss cost are closely related to the total load curve [39,40]. The total cost includes three types of EV charging costs and network loss costs. This subsection presents the total cost analysis of three types of EV scheduling scenarios before and after. The comparison of the total costs before and after scheduling is presented in Table 2.
Table 2 indicates that the total cost after scheduling has decreased by 9.73%. Consequently, the proposed scheduling strategy effectively reduces the total cost.
Finally, simulation experiments demonstrate that the proposed strategy significantly reduces users’ charging costs while stabilizing the load of the power system. More importantly, the orderly scheduling of charging and discharging facilitated by this strategy can diminish the peak-to-valley load difference, effectively achieving peak-shaving and valley-filling effects. In summary, the proposed optimization scheduling model not only mitigates load fluctuations in the power grid but also enhances the economic efficiency and stability of grid operations.

5. Conclusions

This paper examines the influence of DTRN information on EV driving and emphasizes the necessity of collaboration between EVs and the electrical grid to maximize the flexibility of EVs in energy scheduling. An optimal charging and discharging scheduling strategy for EVs under the CPTN considering the MPDEP strategy as well as V2G scheduling is proposed. Firstly, a DTRN model is established, and the dynamic Dijkstra algorithm is employed to accurately simulate EV travel paths. By analyzing the interaction between the TN and PDN, the spatial distribution of EVs in the grid is deduced using DTRN information, which in turn predicts the spatial–temporal distribution of charging loads. Secondly, an optimal charging and discharging scheduling strategy is formulated to meet EV charging demands while guiding users’ charging behaviors through the MPDEP-based V2G model. Finally, a simulation analysis of the proposed strategy demonstrates successful load shifting over an extended time frame, resulting in peak shaving and valley filling, effectively reducing users’ charging costs and stabilizing the power system load. The experimental results indicate that the proposed strategy keeps a stable load level of about 2800 kW during concentrated charging periods through meticulous management, and achieves a load reduction of about 300 kW. The overall peak–valley load difference is reduced by 26.09%, which makes the load curve smoother, effectively alleviates the load fluctuation of the power grid, and enhances the stability of the power grid operation. Additionally, this strategy effectively reduces charging costs while ensuring the timely completion of charging tasks. Consequently, this strategy provides an efficient and feasible solution for EV charging management within the CPTN framework.
This study is predicated on certain assumptions regarding the characteristics of complex networks that may not align with actual conditions. Potential limitations encompass possible delays in price adjustment mechanisms, the simplification of actual operating costs, and the underestimation of the challenges involved in integrating the proposed strategy into the existing grid infrastructure. Furthermore, this study does not account for the battery degradation resulting from EV discharge nor the sensitivity of users to the benefits of discharging. Future research will focus on incorporating user travel demand elasticity, randomness of user behavior, travel budget, scalability, and generalization of the model under different regional, climate, and policy conditions, as well as applicability to various electricity price policies, EV types, battery characteristics, and whether fast charging is supported in the CPTN model.

Author Contributions

Conceptualization, Y.R., H.L. (Honghua Liao) and H.L. (Huijun Liang); writing—original draft preparation, Y.R.; writing—review and editing, Y.R., H.L. (Honghua Liao), H.L. (Huijun Liang) and J.Z.; methodology, Y.R. and H.L. (Huijun Liang); software, Y.R.; investigation, L.L.; visualization, Y.R. and L.L.; formal analysis, Y.R. and H.L. (Huijun Liang); data curation, Y.R. and L.L.; funding acquisition, H.L. (Honghua Liao), H.L. (Huijun Liang) and J.Z.; supervision, L.L. and J.Z. All authors have read and agreed to the published version of the manuscript.

Funding

This research was funded by the National Natural Science Foundation of China under grants 62163013 and 62341305.

Data Availability Statement

The original contributions presented in this study are included in the article. Further inquiries can be directed to the corresponding author.

Acknowledgments

We are very grateful to the reviewers and editors for their contributions to improving this paper.

Conflicts of Interest

The authors declare no conflicts of interest.

References

  1. Wu, T.; Wei, X.; Zhang, X.; Wang, G.; Qiu, J.; Xia, S. Carbon-oriented expansion planning of integrated electricity-natural gas systems with EV fast-charging stations. IEEE Trans. Transp. Electr. 2022, 8, 2797–2809. [Google Scholar] [CrossRef]
  2. Keegan, G.; Nelendran, P.; Oluwafemi, O. Modeling and Simulation of Hybrid Electric Vehicles for Sustainable Transportation: Insights into Fuel Savings and Emissions Reduction. Energies 2024, 17, 5225. [Google Scholar] [CrossRef]
  3. Ahmad, F.; Iqbal, A.; Ashraf, I.; Marzband, M.; Khan, I. Optimal location of electric vehicle charging station and its impact on distribution network: A review. Energy Rep. 2022, 8, 2314–2333. [Google Scholar] [CrossRef]
  4. Jin, H.; Lee, S.; Nengroo, S.H.; Har, D. Development of charging/discharging scheduling algorithm for economical and energy-efficient operation of multi-EV charging station. Appl. Sci. 2022, 12, 4786. [Google Scholar] [CrossRef]
  5. Li, J.; He, S.; Yang, Q.; Ma, T.; Wei, Z. Optimal design of the EV charging station with retired battery systems against charging demand uncertainty. IEEE Trans. Ind. Inf. 2022, 19, 3262–3273. [Google Scholar] [CrossRef]
  6. Zhang, L.; Sun, C.; Cai, G.; Koh, L.H. Charging and Discharging Optimization Strategy for Electric Vehicles Considering Elasticity Demand Response. eTransportation 2023, 18, 100262. [Google Scholar] [CrossRef]
  7. Yan, Q.; Zhang, B.; Kezunovic, M. Optimized Operational Cost Reduction for an EV Charging Station Integrated with Battery Energy Storage and PV Generation. IEEE Trans. Smart Grid 2018, 10, 2096–2106. [Google Scholar] [CrossRef]
  8. Xu, Z.; Su, W.; Hu, Z.; Song, Y.; Zhang, H. A Hierarchical Framework for Coordinated Charging of Plug-in Electric Vehicles in China. IEEE Trans. Smart Grid 2015, 7, 428–438. [Google Scholar] [CrossRef]
  9. Li, Y.; Hu, B. An Iterative Two-Layer Optimization Charging and Discharging Trading Scheme for Electric Vehicle Using Consortium Blockchain. IEEE Trans. Smart Grid 2019, 11, 2627–2637. [Google Scholar] [CrossRef]
  10. Pourazarm, S.; Cassandras, C.G. Optimal Routing of Energy-Aware Vehicles in Transportation Networks with Inhomogeneous Charging Nodes. IEEE Trans. Intell. Transp. Syst. 2017, 19, 2515–2527. [Google Scholar] [CrossRef]
  11. Zheng, Y.; Shao, Z.; Shang, Y.; Jian, L. Modeling the temporal and economic feasibility of electric vehicles providing vehicle-to-grid services in the electricity market under different charging scenarios. J. Energy Storage 2023, 68, 107579. [Google Scholar] [CrossRef]
  12. Lei, X.; Yu, H.; Yu, B.; Shao, Z.; Jian, L. Bridging electricity market and carbon emission market through electric vehicles: Optimal bidding strategy for distribution system operators to explore economic feasibility in China’s low-carbon transitions. Sustain. Cities Soc. 2023, 94, 104557. [Google Scholar] [CrossRef]
  13. Shang, Y.; Shang, Y.; Yu, H.; Shao, Z.; Jian, L. Achieving efficient and adaptable dispatching for vehicle-to-grid using distributed edge computing and attention-based LSTM. IEEE Trans. Ind. Inform. 2021, 18, 6915–6926. [Google Scholar] [CrossRef]
  14. Yu, H.; Shang, Y.; Niu, S.; Cheng, C.; Shao, Z.; Jian, L. Towards energy-efficient and cost-effective DC nanaogrid: A novel pseudo hierarchical architecture incorporating V2G technology for both autonomous coordination and regulated power dispatching. Appl. Energy 2022, 313, 118838. [Google Scholar] [CrossRef]
  15. Zhong, J.; Lei, X.; Shao, Z.; Jian, L. A Reliable Evaluation Metric for Electrical Load Forecasts in V2G Scheduling Considering Statistical Features of EV Charging. IEEE Trans. Smart Grid 2024, 15, 4917–4931. [Google Scholar] [CrossRef]
  16. Cui, Y.; Hu, Z.; Duan, X. Optimal Pricing of Public Electric Vehicle Charging Stations Considering Operations of Coupled Transportation and Power Systems. IEEE Trans. Smart Grid 2021, 12, 3278–3288. [Google Scholar] [CrossRef]
  17. Xie, S.; Wu, Q.; Hatziargyriou, N.D.; Zhang, M.; Zhang, Y.; Xu, Y. Collaborative Pricing in a Power-Transportation Coupled Network: A Variational Inequality Approach. IEEE Trans. Power Syst. 2022, 38, 783–795. [Google Scholar] [CrossRef]
  18. Cao, Z.; Han, Y.; Zhao, Q.; Wang, J.; Li, Y.; Zhao, S. Traffic and Power Flow Optimization of Coupled Power-Transportation Networks Considering Environment-Aware User Behavior. IEEE Trans. Transp. Electrif. 2023, 10, 3940–3955. [Google Scholar] [CrossRef]
  19. Gan, W.; Wen, J.; Yan, M.; Zhou, Y.; Yao, W. Enhancing resilience with electric vehicles charging redispatching and vehicle-to-grid in traffic-electric networks. IEEE Trans. Ind. Appl. 2023, 60, 953–965. [Google Scholar] [CrossRef]
  20. Wang, W.; Liu, Y.; Wei, W.; Wu, L. A Bilevel EV Charging Station and DC Fast Charger Planning Model for Highway Network Considering Dynamic Traffic Demand and User Equilibrium. IEEE Trans. Smart Grid 2023, 15, 714–728. [Google Scholar] [CrossRef]
  21. Sun, Y.; Chen, Z.; Li, Z.; Tian, W.; Shahidehpour, M. EV Charging Schedule in Coupled Constrained Networks of Transportation and Power System. IEEE Trans. Smart Grid 2018, 10, 4706–4716. [Google Scholar] [CrossRef]
  22. He, C.; Zhu, J.; Lan, J.; Li, S.; Wu, W.; Zhu, H. Optimal planning of electric vehicle battery centralized charging station based on EV load forecasting. IEEE Trans. Ind. Appl. 2022, 58, 6557–6575. [Google Scholar] [CrossRef]
  23. Chen, J.; Huang, X.; Cao, Y.; Li, L.; Yan, K.; Wu, L.; Liang, K. Electric vehicle charging schedule considering shared charging pile based on generalized Nash game. Int. J. Electr. Power Energy Syst. 2022, 136, 107579. [Google Scholar] [CrossRef]
  24. Ngo, H.; Kumar, A.; Mishra, S. Optimal positioning of dynamic wireless charging infrastructure in a road network for battery electric vehicles. Transp. Res. Part D 2020, 85, 102385. [Google Scholar] [CrossRef]
  25. Li, B.; Chang, X. EV charging station load prediction in coupled urban transportation and distribution networks. Energy Eng. 2024, 121, 3001–3018. [Google Scholar] [CrossRef]
  26. Chen, L.; Xie, C.; Ma, D.; Yang, Y.; Li, Y. A short-term traffic flow prediction model for road networks using inverse isochrones to determine dynamic spatiotemporal correlation ranges. Phys. A Stat. Mech. Its Appl. 2024, 657, 130244. [Google Scholar] [CrossRef]
  27. Mahmoudi, E.; dos Santos Barros, T.A.; Ruppert Filho, E. Forecasting urban electric vehicle charging power demand based on travel trajectory simulation in the realistic urban street network. Energy Rep. 2024, 11, 4254–4276. [Google Scholar] [CrossRef]
  28. Tang, D.; Wang, P. Probabilistic modeling of nodal charging demand based on spatial-temporal dynamics of moving electric vehicles. IEEE Trans. Smart Grid 2015, 7, 627–636. [Google Scholar] [CrossRef]
  29. Jabbar, L.S.; Abass, E.I.; Hasan, S.D. A modification of shortest path algorithm according to adjustable weights based on Dijkstra algorithm. Eng. Technol. J. 2023, 41, 359–374. [Google Scholar] [CrossRef]
  30. Mu, Y.; Wu, J.; Jenkins, N.; Jia, H.; Wang, C. A spatial-temporal model for grid impact analysis of plug-in electric vehicles. Appl. Energy 2014, 114, 456–465. [Google Scholar] [CrossRef]
  31. Shao, C.; Li, K.; Qian, T.; Shahidehpour, M.; Wang, X. Generalized user equilibrium for coordination of coupled power-transportation network. IEEE Trans. Smart Grid 2022, 14, 2140–2151. [Google Scholar] [CrossRef]
  32. Hou, S.; Zhang, X.; Yu, H. Electric vehicle charging load prediction considering spatio-temporal node importance information. Energies 2024, 17, 4840. [Google Scholar] [CrossRef]
  33. Zhang, D.; Jiang, Y.; Wang, S.; Li, H.; Bai, J.; Zhang, R.; An, Z. Performance analysis of the comprehensive energy system based on active energy storage-discharge technology under time-sharing electricity price operation strategy. J. Clean Prod. 2024, 436, 140654. [Google Scholar] [CrossRef]
  34. Tian, X.; Cheng, B.; Liu, H. V2G optimized power control strategy based on time-of-use electricity price and comprehensive load cost. Energy Rep. 2023, 10, 1467–1473. [Google Scholar] [CrossRef]
  35. Hu, W.; Zhang, X.; Zhu, L.; Li, Z. Optimal allocation method for energy storage capacity considering dynamic time-of-use electricity prices and on-site consumption of new energy. Processes 2023, 11, 1725. [Google Scholar] [CrossRef]
  36. Nam, I.; Kim, J.H.; Yoo, Y.; Jung, S. An EV-based wind power curtailment scheme utilizing the power sensitivity of the distribution network. IEEE Access 2022, 10, 61124–61134. [Google Scholar] [CrossRef]
  37. Xu, F.; Wei, S.; Li, J.; Yuan, D. Sensitivity analysis of a double-layer coupling structure for an electric vehicle wireless power transfer system. World Electr. Veh. J. 2023, 14, 322. [Google Scholar] [CrossRef]
  38. Khosravi, M.; Monsef, H.; Aliabadi, M.H. Network loss management and allocating the transmission losses to loads and generation units according to their transactions. IET Gener. Transm. Distrib. 2020, 14, 1540–1551. [Google Scholar] [CrossRef]
  39. Eltamaly, A.M. Optimal Dispatch Strategy for Electric Vehicles in V2G Applications. Smart Cities 2023, 6, 3161–3191. [Google Scholar] [CrossRef]
  40. Alotaibi, M.A.; Eltamaly, A.M. Upgrading conventional power system for accommodating electric vehicle through demand side management and V2G concepts. Energies 2022, 15, 6541. [Google Scholar] [CrossRef]
Figure 1. Schematic diagram of the topology of the CPTN.
Energies 17 06167 g001
Figure 2. Schematic diagram of the urban road resistance structure.
Energies 17 06167 g002
Figure 3. Flow of the model-solving method.
Energies 17 06167 g003
Figure 4. Network topology of the test system.
Energies 17 06167 g004
Figure 5. Comparison of electricity price strategies.
Energies 17 06167 g005
Figure 6. EV distribution of the initial transportation nodes.
Energies 17 06167 g006
Figure 7. Spatial and temporal distribution of EV charging loads.
Energies 17 06167 g007
Figure 8. Comparison of charging strategies.
Energies 17 06167 g008
Figure 9. Power loss sensitivity of the grid nodes.
Energies 17 06167 g009
Table 1. Comparison of the peak-to-valley difference for electricity pricing strategies.
Pricing StrategyPeak Value/kWValley Value/kWPeak–Valley Difference/kW
TSSEP2982.4431962.6281019.815
MPDEP2928.7482001.147927.601
Table 2. Comparison of the total costs.
Scheduling StrategyTotal Cost/CNY
Disorderly charging and discharging10,526.087
The proposed scheduling strategy9502.075
Disclaimer/Publisher’s Note: The statements, opinions and data contained in all publications are solely those of the individual author(s) and contributor(s) and not of MDPI and/or the editor(s). MDPI and/or the editor(s) disclaim responsibility for any injury to people or property resulting from any ideas, methods, instructions or products referred to in the content.

