Article

Co-Movement Among Electricity Consumption, Economic Growth and Financial Development in Portugal, Italy, Greece, and Spain: A Wavelet Analysis

by
Cosimo Magazzino
1,2,*,
Syed Kafait Hussain Naqvi
3 and
Lorenzo Giolli
4
1
Department of Political Science, Roma Tre University, 00154 Rome, Italy
2
Economic Research Center, Western Caspian University, Baku AZ1000, Azerbaijan
3
School of Economics, International Islamic University, Islamabad 44000, Pakistan
4
Department of Statistics, Pegaso University, 80133 Rome, Italy
*
Author to whom correspondence should be addressed.
Energies 2024, 17(24), 6338; https://doi.org/10.3390/en17246338
Submission received: 23 October 2024 / Revised: 2 December 2024 / Accepted: 6 December 2024 / Published: 16 December 2024
(This article belongs to the Special Issue Advances in Sustainable Power and Energy Systems)

Abstract

:
The aim of this paper is to examine the connections among time-frequency dependencies associated with electrical power consumption (EPC), economic growth, and financial development (FD) in Portugal, Italy, Greece, and Spain during the period 1970–2014. Using monthly data collected from the World Bank (WB) and Federal Reserve Bank of St. Louis (FRED), the wavelet analysis is applied, which allows for assessing the co-movement between these variables. As a first step, a classical time-domain approach is used to alternatively test the connection, including unit-root tests and cointegration. To achieve a comprehensive understanding of the relationships between EPC, economic growth, and FD, we employ Wavelet Transform Coherency (WTC) and Partial Wavelet Coherency (PWC) to explore both their temporal and phase-based dynamics. The main findings show that EPC leads FD, but in the short term, and periods dominated by economic stagnations and political crises. Otherwise, FD drives EPC in the medium term, under economic expansion periods. In both cases, economic growth is crucial, being a strong binding force of the interaction between EPC and FD. The difference in the applied results provides alternative policy implications, justifying the use of the wavelet approach.

1. Introduction

The current investigation explores the time-frequency dependencies within electric power consumption (EPC), financial development (FD), and Gross Domestic Product (GDP) across Portugal, Greece, Italy, and Spain over the period 1970–2014. The empirical approach incorporates time-series methods and utilizes wavelet analysis (WA) tools.
Time-domain analysis represents the predominant approach in the economic literature for studying time series. This method involves modeling the evolution of individual variables and evaluating multivariate relationships over time. Conversely, another strand of the literature concentrates on the frequency domain. Wavelet analysis (WA) integrates both methodologies, considering both time and frequency domains. This approach enables the distinction between short- and long-run dynamics throughout the entire sample period.
Recently, several studies have explored the link between EPC and FD. Additionally, numerous investigations have reported a significant connection between EPC, FD, and Gross Domestic Product (GDP). As indicated by various investigations [1,2,3,4,5,6,7], the empirical evidence consistently points to an association where an increase in electricity consumption is correlated with a discernible impact on both financial development and economic growth.
The intricate relationship between financial development (FD) and energy consumption has become a central area of scrutiny for researchers and policymakers worldwide. Despite numerous studies proposing a connection between FD and energy consumption, the empirical evidence consistently produces mixed results, as highlighted by [8]. Studies supporting the notion that FD positively influences energy use by stimulating economic growth, such as [9], exist. However, the direction of causality remains inconclusive, with [10] observing that energy consumption might precede FD. In contrast, refs. [9,11,12,13] demonstrated how FD drives energy consumption. Refs. [14,15,16] identified empirical support for a bidirectional (feedback) link between these two variables. Conversely, refs. [17,18] emphasized the absence of a causal nexus between energy consumption and FD. Introducing a novel perspective through the Artificial Neural Networks approach, refs. [19] underscored the significant influence of credit in propelling the advancement of the agricultural sector. Furthermore, in industrialized nations, it is noted to have a consequential impact on productivity.
In recent studies, including those of [20,21], wavelet analysis (WA) has been used to investigate the intricate relationship between energy consumption and financial development. In a parallel manner, the link between energy consumption and economic growth has been examined in studies by [22,23,24,25,26,27,28] through the application of WA.
The literature specifically addressing the influences of country risks on the association between electricity consumption and FD is very limited. To address this gap, the current study makes substantial contributions to the existing literature in multiple ways. More precisely, this study distinguishes itself from prior research by using WA to examine the co-movement between EPC and FD in Portugal, Italy, Greece, and Spain. This is a departure from most of the literature, which typically explores the relationship between these variables using cointegration and causality tests. Past research has primarily utilized Granger causality and cointegration techniques to investigate the relationship between electricity and economic growth. Despite its widespread use, the validity of using Granger causality to infer causal relationships among time series has been the subject of ongoing debate. Furthermore, while the original definition was broad, limitations in computational tools have restricted the application of Granger causality mostly to simple bivariate vector autoregressive processes or pairwise relationships among a set of variables [29]. Similarly, ref. [30] highlights the issue of measurement errors in one of the variables in tests of Granger causality. From the viewpoint presented by [31], the traditional Granger causality test operates under the assumption of a linear relationship between time series, yet it is conceivable that the true relationship could be nonlinear. To overcome these difficulties, the present study uses WA to inspect the link between electricity demand and FD, as WA is applied regardless of the unit roots and cointegration properties of the data. However, the stationarity properties of the series are checked through [32,33] tests for structural breaks. To the best of our knowledge, this is the first study that applies WA to data from Portugal, Italy, Greece, and Spain.
The adoption of the WA methodology is mainly due to the fact that it provides a significant edge over conventional time-series techniques by enabling the simultaneous examination of time and frequency domains. This dual capability is critical in identifying and interpreting the dynamic, time-varying relationships among economic growth, electricity consumption, and financial development across different time scales.
Specifically, this methodology allows us to achieve the following:
  • Capture multi-scale dynamics: Unlike traditional approaches that typically assume static relationships, wavelet analysis accounts for both short-term and long-term interactions. This is particularly relevant given the economic volatility and structural breaks in the PIGS countries during the study period.
  • Analyze phase relationships: Wavelet Transform Coherency (WTC) and Partial Wavelet Coherency (PWC) enable us to identify not only the strength of co-movements but also the lead-lag dynamics between variables. This provides deeper insights into causal relationships, particularly under varying economic conditions.
  • Address structural breaks: Given the economic crises and structural changes within the dataset period, wavelet analysis is robust to non-stationarities and structural breaks, making it an ideal choice for our study.
The gas price crisis and the shortage of supplies from Russia have prompted Europe to diversify its energy sources and intensify relations with different partners (Norway, North African countries, and Qatar). Following a well-traced European line of decisive and necessary liberation from dependence on Russian natural gas, Mediterranean countries continue their race to diversify their energy supplies, in particular, working on several fronts to have a leading role in the Mediterranean area.
The remainder of the paper is divided into the following sections: Section 2 reviews the literature, Section 3 provides an overview of the econometric methodology and the data, Section 4 provides the results, and Section 5 offers the conclusion.

2. Literature Review

In recent times, there has been a growing interest among researchers in exploring the relationships between electricity consumption, financial development (FD), and economic growth [34,35,36,37,38,39,40,41,42,43,44].
Ref. [6] contribute uniquely by investigating correlations among electricity consumption, financial development (FD), economic growth, and CO2 emissions within the Gulf Cooperation Council (GCC) nations. Their principal findings uncover a persistent and positive association between electricity consumption, economic growth, and CO2 emissions. Furthermore, a significant negative relationship between financial development (FD) and CO2 emissions is discerned. In a parallel study, ref. [42] delve into the dynamic interplay among FD, GDP, electricity consumption, and exports in Jordan, spanning the years from 1976 to 2011. Utilizing the Auto-Regressive Distributed Lags (ARDLs) approach and the Granger causality test, their results unveil a long-term equilibrium relationship between electricity consumption and GDP. Notably, this relationship is characterized by a unidirectional causality from GDP to electricity consumption.
Another set of researchers, including [45], delve into the asymmetric dynamics within the relationships involving financial development (FD), economic growth, and energy consumption. They utilize the Nonlinear ARDL (NARDL) bounds testing method to discern these connections. Their findings underscore a cointegration among the variables, highlighting that adverse shocks to FD can have repercussions on economic growth. In the examination of causal relationships among FD, GDP, and CO2 levels in GCC countries, [43] utilize the ARDL bound testing approach. The results unveil a long-term and causal association among FD, GDP, CO2, and energy consumption across all GCC nations, excluding the United Arab Emirates (UAE).
In a comprehensive study that examined 22 emerging economies, ref. [46] established a statistically significant positive correlation between financial development (FD) and energy consumption. Expanding upon this research, ref. [47] delved into nine Central and Eastern European frontier economies, consistently corroborating the positive linkage between FD and energy consumption. In a departure from these previous findings, ref. [48] adopted a unique approach by utilizing a Generalized Method of Moments (GMM) methodology within the EU-27 over the period 1990–2011. Notably, their primary findings deviated from those of earlier studies, suggesting an absence of a statistically significant relationship between FD and energy consumption.
Over the last few years, a significant strand of the literature in the field has developed around the most vanguard wavelet methodology (Table 1).
The strand of wavelet contributions reveals mixed results, depending on the targeted country, sample period and frequency, and chosen variable types. Unfortunately, no paper explores the case of Portugal, Italy, Greece, and Spain.

3. Methodology and Data

3.1. Methodology

The first step in the empirical analysis involves scrutinizing the stationarity properties of the series through the application of two unit-root tests that consider structural breaks. Considering the inclusion of the financial crisis period spanning from 2007 to 2008, the anticipation is that a breakpoint will emerge in the time series, signaling a shift in its trend. Therefore, two unit-root tests with break point are considered to test the stationarity of the series, in both level and first difference: ZA [32] and CMR [33] tests. The ZA test considers intercept, and intercept and trend, while the CMR test uses additive and innovative outliers. Furthermore, to examine the long-term relationship among the variables, we apply the [55] cointegration test.
Wavelet techniques are utilized concurrently as an alternative methodology. Wavelets function similarly to a wide-angle camera lens, enabling the capture of expansive landscape vistas while also zooming in on microscopic intricacies typically imperceptible to the human eye. In mathematical terminology, wavelets represent local orthonormal bases comprising small waves that decompose a function into layers of varying scales.
The development of the wavelet and the wavelet transform appears to be more clearly and effectively established in light of the ever-increasing demand for exciting new mathematical tools for introducing both theory and application in science and engineering. The concept of a wavelet can be introduced through a number of distinct streams of thought, taking into account the variety of fields in which wavelet analysis finds application and is of interest.
The term “wavelet” denotes a compactly supported function representing a small wave or a component within a wavelet. The requirement for this window function to have a finite length is termed “smallness”.
The property of oscillation in this function is denoted as the wave characteristic. Wavelets are a more efficient alternative to Fourier series for function representation. time-frequency signal analysis, wave propagation, and sampling theory all played a role in the development of the wavelet concept in the past. Through translation and dilation, wavelets are created from a single function called the mother wavelet.
In line with the conclusions drawn by [56], a fundamental condition for a function to qualify as a mother wavelet is its satisfaction of an admissibility criterion, also referred to as follows:
0 < C ψ : = | Ψ ( ω ) | | ω |   d ω <
where the preceding constant, Cψ, is referred to as the admissibility constant. It appears that the aforementioned admissibility condition is equivalent to necessitating that for functions exhibiting adequate decay:
Ψ ( 0 ) = ψ ( t ) d t = 0
So, it must function in a manner characteristic of a wave. Building upon the approach of [56], we begin with a mother wavelet and generate a family of wavelet daughters, ψτ,s, via the scaling and translation of ψ:
ψ τ , s ( t ) : = 1 | s | ψ t τ s ,     s , τ R , s 0
where s is a scaling or dilation factor that controls the wavelet’s width, and τ is a translation parameter that controls the wavelet’s location. Additionally, the Continuous Wavelet Transform (CWT) of a time series, x(t) ∈ L2(R), with respect to the wavelet, ψ, is a function of two variables, Wx,ψ(τ,s):
W x ; ψ ( τ , s ) = x ( t ) 1 | s | ψ * t τ s d t
where the position of the wavelet in the time domain is given by τ, and its position in the frequency domain is given by s. Drawing upon the established properties of the Fourier transform, it becomes apparent that the CWT can also be expressed in the frequency domain in the following manner:
W x ( τ , s ) = | s | 2 π Ψ * ( s ω ) X ( ω ) e i ω τ d ω
The (local) Wavelet Power Spectrum (WPS), also known as the scalogram or wavelet periodogram, can be described in terms that are analogous to those used in the Fourier case:
( W P S ) x ( τ , s ) = W a ( τ , s ) 2
In accordance with [56], and analogous to the Fourier analysis concept of coherency, one can define the complex Wavelet Transform Coherency (WTC), ρxy, of two time series, x(t) and y(t), as follows:
ϱ x y = S W x y S W x 2 S W y 2 1 / 2
where S denotes a smoothing operator in both time and scale. The polar form of the complex wavelet coherency is ρxy = |ρxy| e i ϕ a y . The wavelet coherency, or absolute value of the complex wavelet coherency, is denoted by Rx,y as follows:
R x y = S W x y S W x 2 S W y 2 1 / 2
with 0 ≤ Rx,ψ(τ,s) ≤ 1. The angle ϕxy of the complex coherency is called the phase difference (phase lead of x over y):
ϕ x y = A r c t a n I S W x y R S W x y
In time-series analysis, the phase difference between two series, ϕxy, reveals their relative movement at a specific time-frequency. When ϕxy is zero, the series move together perfectly. If 0 < ϕxy < π/2, they move in phase, but series x leads series y. Conversely, for −π/2 <ϕxy < 0, series y leads. A phase difference of π (or −π) indicates anti-phase, where series y leads when π/2 <ϕxy < π. Finally, series x leads when −π < ϕxy < π/2.
Finally, for robustness reasons, the PWC tool proposed by [57] is also considered in order to analyze the implications of a control variable, as a mediator factor, on the interested link. More precisely, the method removes the effect of control filtering its influence on the interested bi-variate relationship. The color code used for interpretation indicates the intensity of coherency, going from blue (low coherency) to yellow color (high coherency).

3.2. Data

The empirical analysis employs annual time-series data of electrical power consumption (EPC), measured in kilowatt-hours per capita; domestic credit provided by the financial sector (FD), represented as a percentage of GDP; and per capita GDP (RPCGDP) in constant 2010 US dollars for the nations of Portugal, Italy, Greece, and Spain during the period 1970–2014. The length of the dataset is dictated by official dataset availability (i.e., unfortunately, domestic credit provided by the financial sector is available until 2014 only). Data for EPC are collected from the World Development Indicator (WDI), provided by the World Bank (WDI), while FD and RPCGDP are taken from the Federal Reserve Bank of St. Louis [58]. The length of the sample is dictated by the data availability. In estimations, the variables are used in their natural logarithm forms.
Table 2 presents the descriptive data analysis (raw values). The mean and median values of each variable are positive and quite similar, which is a clue indicating a Gaussian distribution. The negative values of skewness imply left-skewed distributions, with more observations on the right.
Figure 1 and Figure 2 illustrate the evolution of these variables over time, in all considered countries. Figures show an upward trend in all series, for all countries, with a turning point during the financial crisis from 2007 to 2008. After this point, all the series exhibit a descending trend.
Figure 3 presents the scatterplot matrices of the series.
From these graphs, a positive correlation between each pair of variables, in their log forms, clearly emerges.

4. Empirical Results

Table 3 shows the result of the ZA unit-root test, with one structural break, having a null hypothesis of nonstationarity. For all considered countries and all series, the results indicate that the null hypothesis cannot be rejected, with the variables having unit roots with structural breaks for intercept and for intercept and trend.
Afterward, the CMR test is employed in Table 4. The results are mixed. Herein, EPC and FD have a unit root with a structural break, with few exceptions (e.g., EPC for Spain and RPCGDP for Portugal), while RPCGDP is rather a stationary variable.
Corroborating the results of both ZA and CMR tests, we can conclude that, for all considered countries, the series are integrated by order one (i.e., I(1)), exhibiting unit-root processes.
Next, we employ the [55] cointegration test, which is specifically designed to handle potential structural breaks within the data, as observed in Table 5.
The findings from the Gregory and Hansen cointegration procedure suggest that the null hypothesis of no cointegration cannot be rejected across all levels of significance and for all countries, with only a few exceptions based on specific assumptions. Consequently, it appears that electrical power consumption (EPC), domestic credit provided by the financial sector (FD), and per capita GDP (RPCGDP) do not demonstrate a long-term relationship. In simpler terms, these series do not move in tandem over the long run, but, rather, some short-term fluctuations are anticipated.
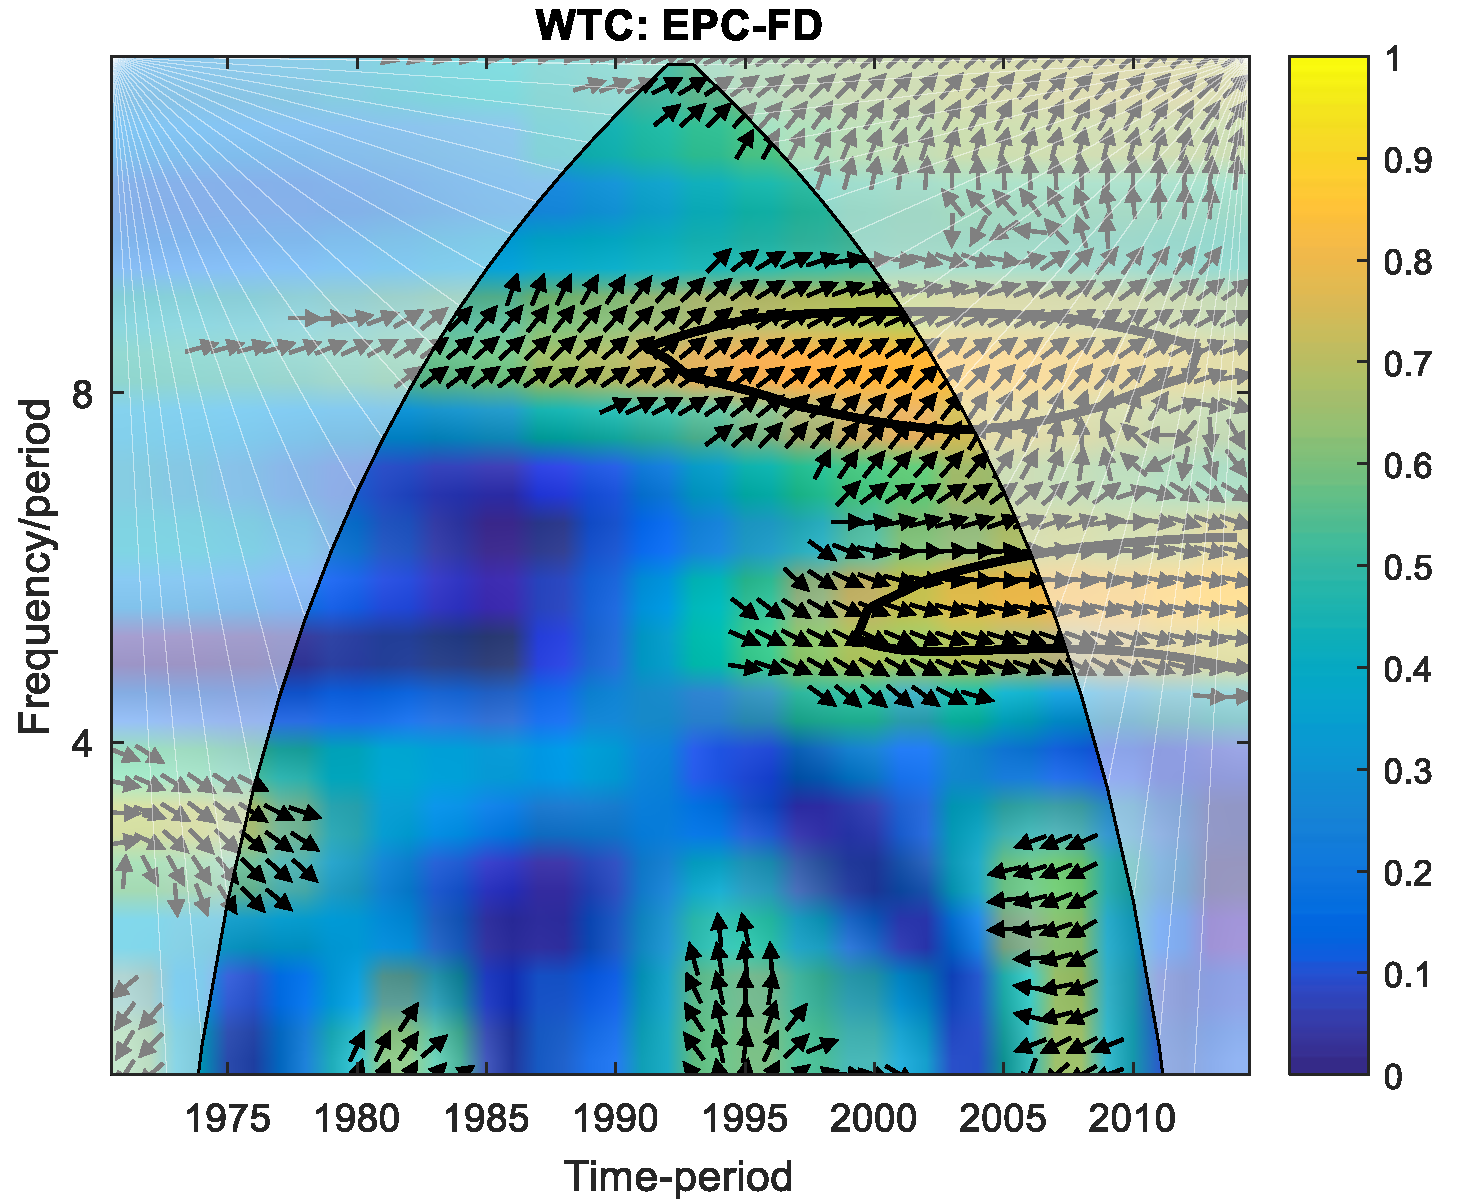
Further, expecting some short-run interactions between variables, the WTC is considered to test the co-movement between EPC and FD for each targeted country, mediated by RPCGDP via PWC. The results are plotted in Figure 4, Figure 5, Figure 6, Figure 7, Figure 8, Figure 9, Figure 10 and Figure 11.
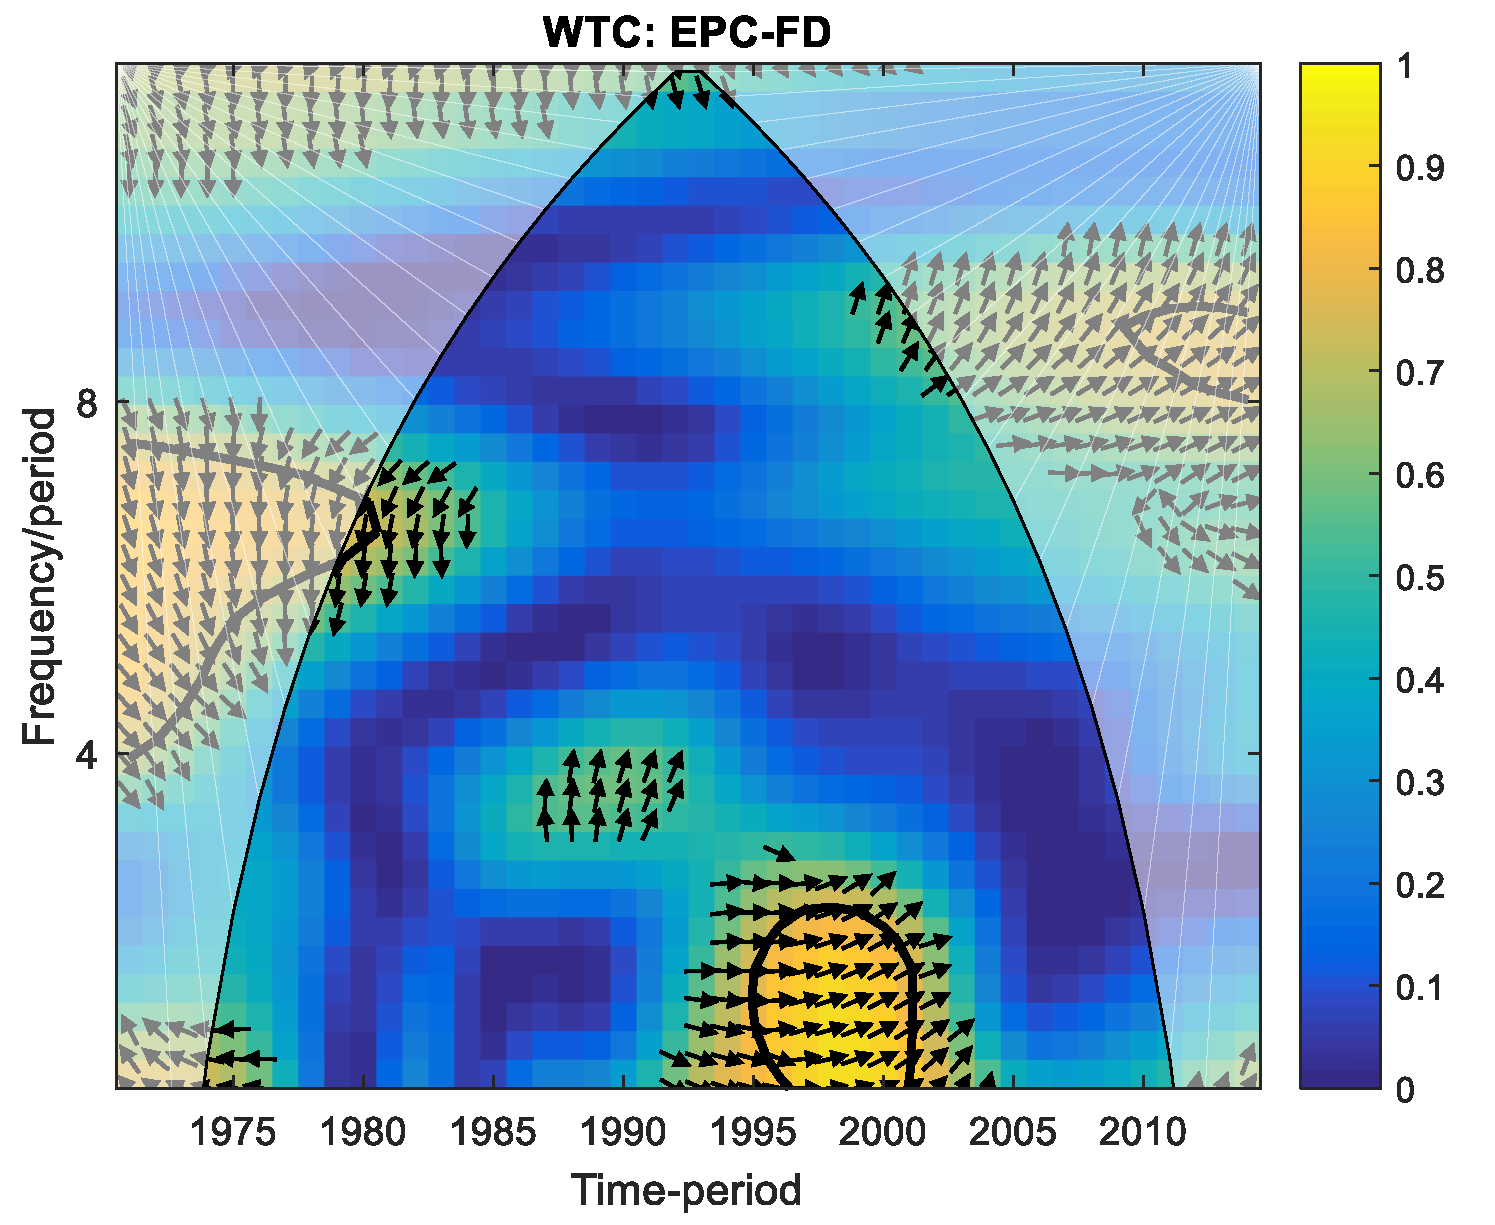
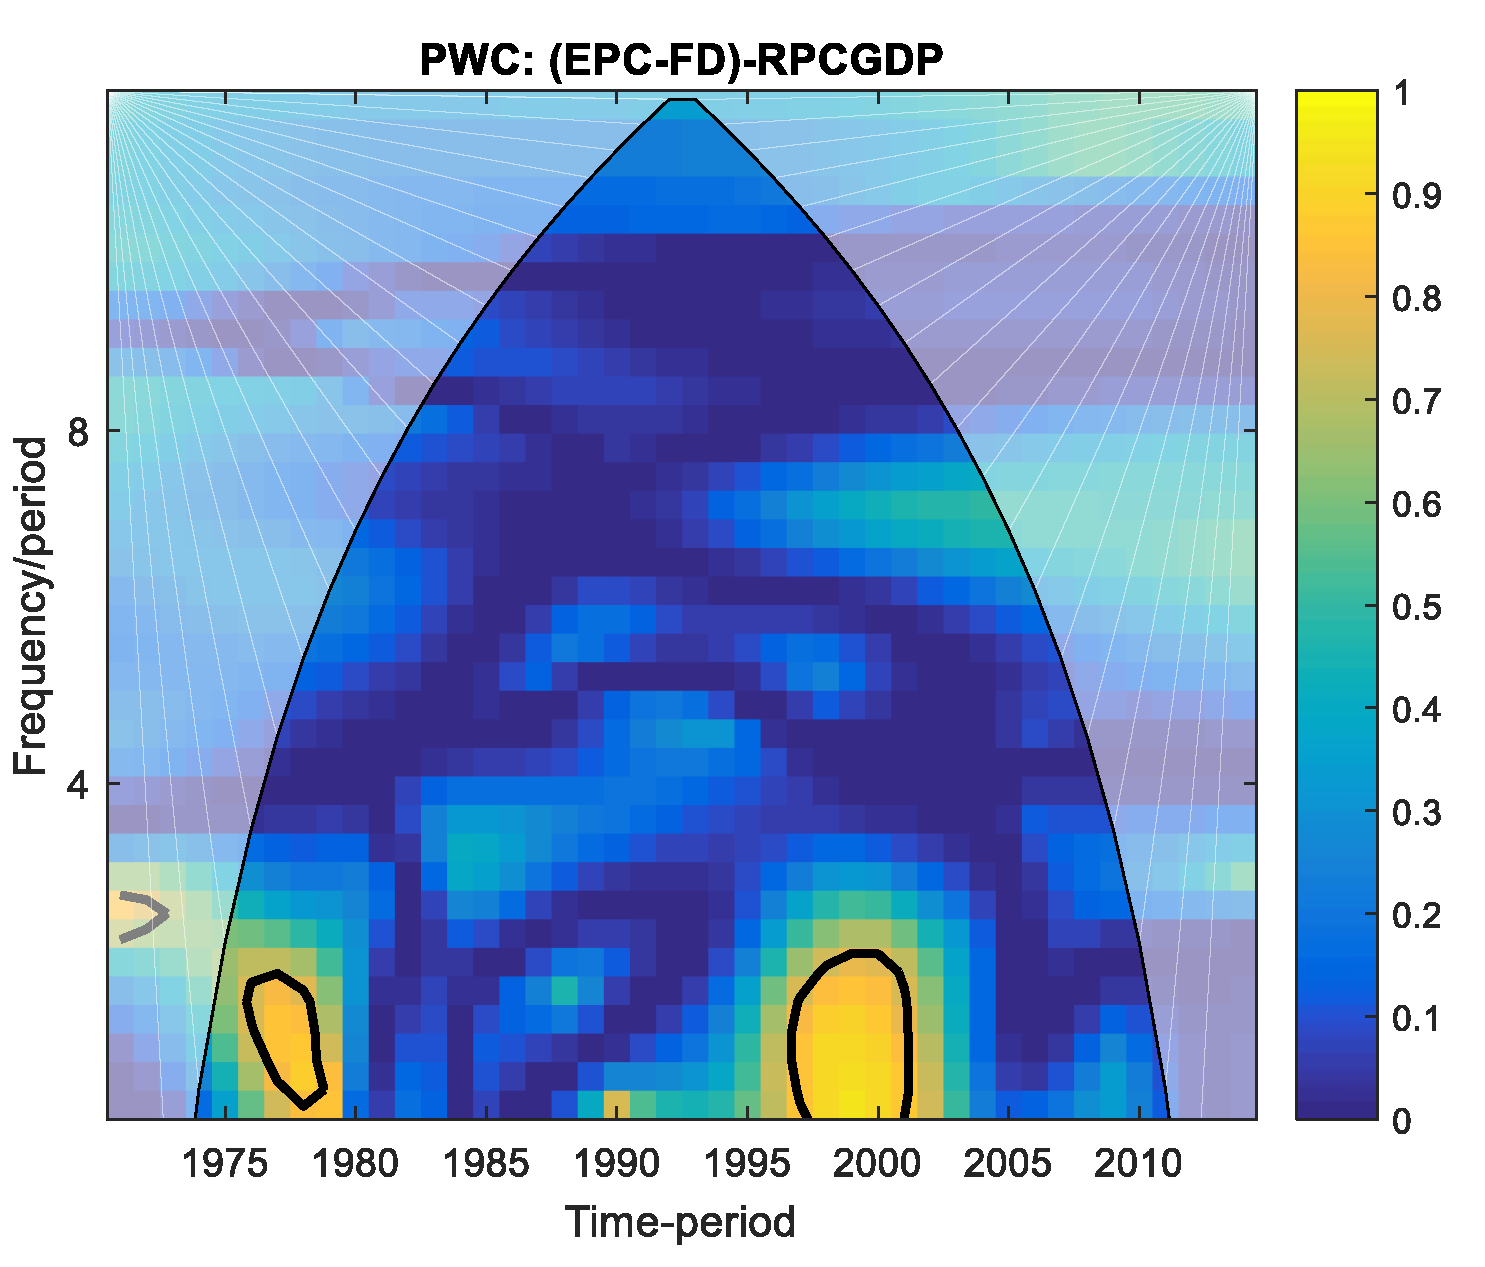
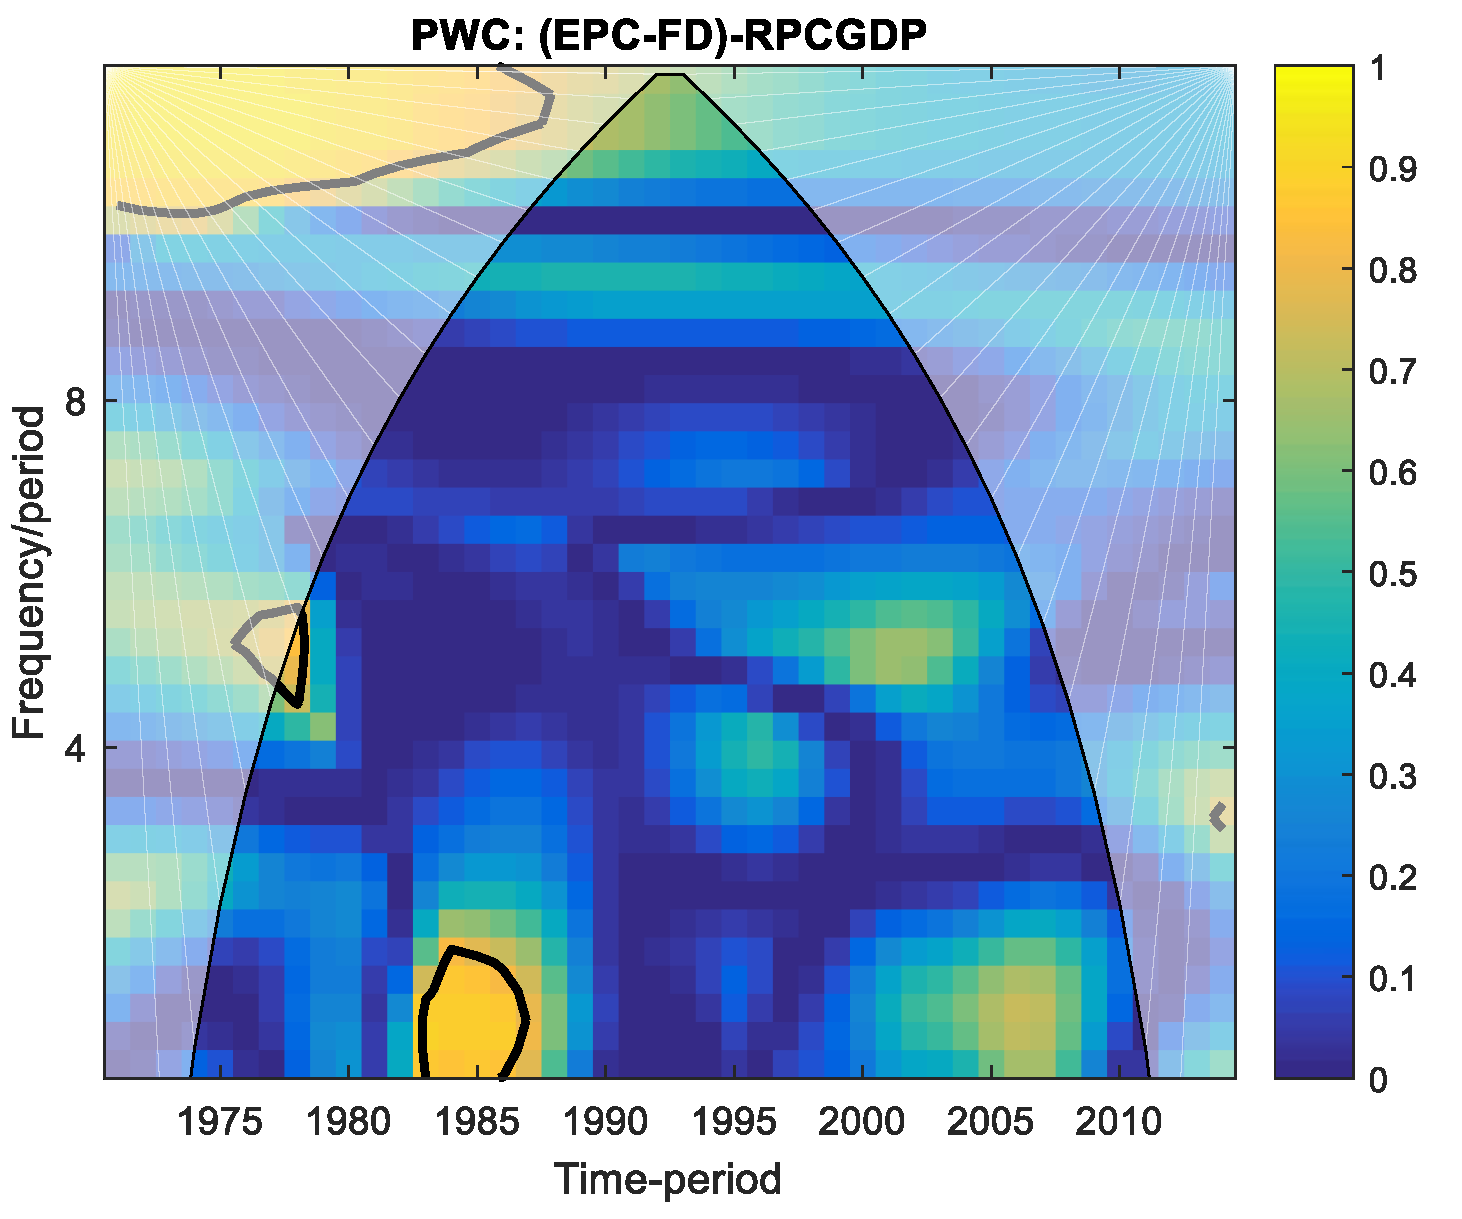
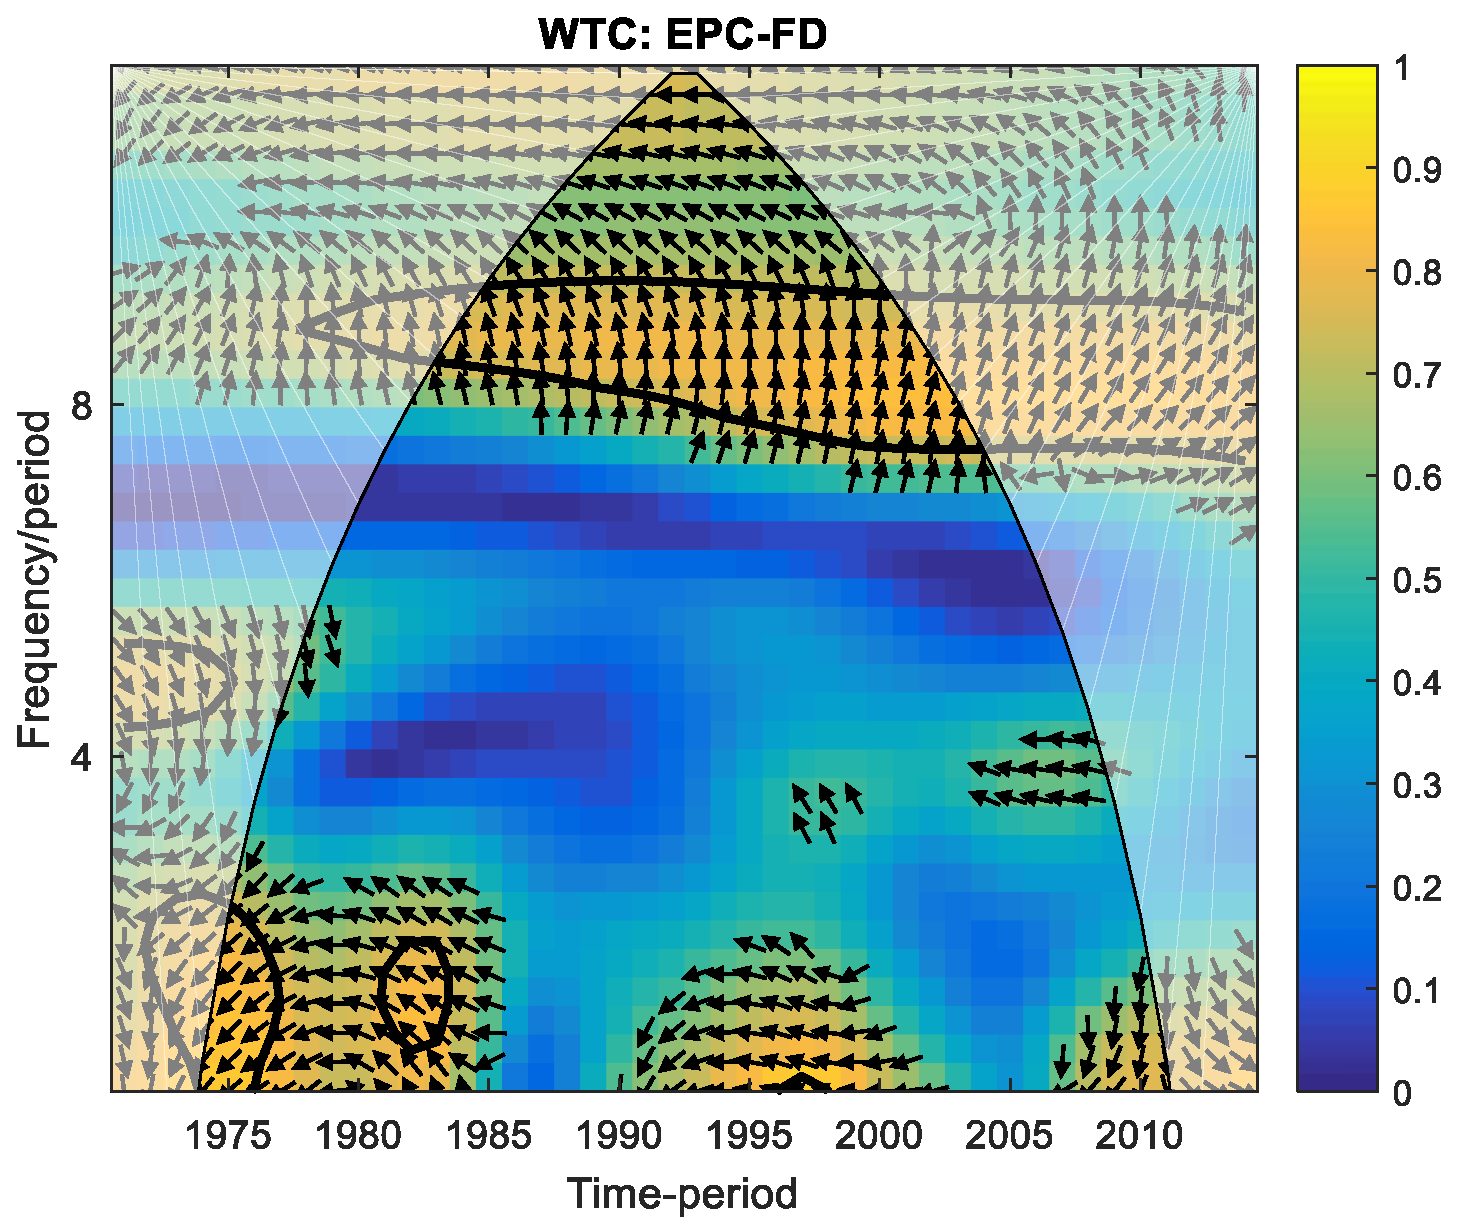
The contour plot depicting the wavelet-based measure of co-movement is presented across three dimensions. It employs a vertical axis for frequency and a horizontal axis for time. Lighter areas, tending toward blue, indicate weaker co-movement, while hotter areas signify stronger co-movement between the variables. This enables the identification of frequency strips along the vertical axis and time periods along the horizontal axis, where higher frequencies correspond to lower scales.
Time is illustrated along the horizontal axis, with frequency depicted along the vertical axis (where lower frequencies denote higher scales). In the time-frequency space, wavelet coherence identifies regions where the two time series exhibit covariance. Warmer colors, such as yellow, indicate regions with significant co-movement between the series, whereas colder colors, like blue, suggest lower dependence between the series. Cold regions outside the significant areas denote times and frequencies with no discernible dependence on the series.
Arrows in the wavelet coherence plots denote the lead/lag phase relationships between the examined series. A zero phase difference indicates the synchronous movement of the two time series at a particular scale. Arrows pointing to the right (left) signify in-phase (anti-phase) synchronization, indicating concurrent or opposite movements, respectively.
When the two series synchronize, it implies they move in the same direction, whereas being in anti-phase suggests they move in opposite directions. Arrows pointing diagonally right-downward or left-upward signify a lead in the first variable, whereas arrows pointing diagonally right-upward or left-downward indicate a lead in the second variable.
The wavelet findings for Greece are shown in Figure 4 and Figure 5. In this case, we found a similar situation encountered for Italy, since the co-movement between the variables appears essentially at low frequencies. However, in the first part of the observed period, a phase relation emerges (the arrows point to the right), and in 2011, FD leads electricity consumption. Meanwhile, since 2012, an anti-phase relation has prevailed. However, at high frequencies, electricity consumption is leading. These results integrate the findings by [59] and are in line with those by [60].
Figure 4 shows only one significant co-movement in Greece between EPC and FD, over 1996–2001, in the short run (i.e., low frequency ≈ up to 2 years band of scale). In this case, EPC positively runs FD, as the arrows are oriented to the right and up. Moreover, the effect of RPCGDP is neutral, as after its removal, the link remains stable (Figure 5). This result covers the 1990 redressing period of the Greek economy, characterized by inflation and budgetary deficit reduction. This culminated with the economic boom during 1998–2007, with stimulation of EPC that trigged additional domestic credits, but only in the short run. This intriguing finding supports the recommendations provided in the study by [60], suggesting that Greek authorities should consider reducing domestic credit to the private sector and reevaluating energy consumption-related policies to achieve a sustainable future. However, these findings stand in contrast to the research conducted by [61], which highlights significant unidirectional causal relationships, both linear and nonlinear, emanating from energy consumption to economic growth.
The case of Italy is presented in Figure 6. Two episodes are observed, also in the short run (i.e., low frequency ≈ up to 2 years band of scale). The first one is not conclusive, as the arrows are horizontally pointed, while the second episode coincides with the period 2005–2010. In this last case, the arrows are oriented to the left and down, suggesting that EPC negatively drives FD. [12] proves a contrary effect. The author claims that energy consumption helped Italy to achieve high economic and financial development. Herein, the GDP’s effect is crucial, as the variables’ interaction disappears after its removal (Figure 7). These findings align with [12], who contends that energy consumption in Italy, spanning from 1960 to 2014, has been influenced by real GDP. Additionally, ref. [62] asserts a unidirectional causality from GDP to energy consumption, providing further support for the observed results. Despite EPC’s downfall during economic stagnation over 2000–2008, mediated by compression of GDP, a slight revival of FD is observed, maybe because of growth stimulation reasons.
Figure 8 reveals the co-movement between EPC and FD in Portugal, with three interesting periods. The first period captures the years 1970–1974, also covering the Carnation Revolution from 1974, with EPC negatively leading FD (arrows pointing to the left and down), in the short run (i.e., low frequency ≈ up to 2 years band of scale). Herein, the political instability seems to have generated uncertainty that reduced the EPC, with a precarious growth status, with GDP being crucial for the EPC-FD pair (Figure 9). Despite this difficult situation, it seems that FD slowly increased to compensate for the loss of purchasing power. Also, in the short run (i.e., low frequency ≈ up to 2 years band of scale), FD negatively drove EPC, but over 1982–1984 (arrows pointed to the left and up). Still, with economic difficulty, the Portuguese’s FD compressed, and the saved purchasing power was found in an increase in EPC. Finally, a “rotated co-movement” is observed over 1980–2005, in the medium run (i.e., medium frequency ≈ 7–10 years band of scale), possibly as a result of Portugal’s EU integration and economic revival. The direction of co-movement seems to follow the FD’s U-shaped dynamic, with EPC initially driving FD with a positive sign (arrows pointed to the right and up), and then with FD negatively running EPC (arrows pointed to the left and up), as the frequency increases. Therefore, the final expansion of FD, also supported by GDP growth (Figure 9), reduced the EPC, which may be because of a complementary effect of credit debt pressure. This finding does not confirm the findings of the study of [63]. Their paper stresses that a rise in real income, FD, population, and foreign trade positively influences electricity consumption in Portugal. These results are also consistent with the research conducted by [45]. They suggest a positive connection between FD and electricity consumption in Portugal.
Finally, the case of Spain is plotted in Figure 10, with two notable events, both in the medium run (i.e., medium frequency ≈ 5–9 years band of scale). Initially, the FD positively leads EPC over 2000–2006 (arrows pointed to the right and down, for 5–6-year band of scale), with strong implications for GDP (Figure 11). The period is characterized by a significant economic expansion that stimulated domestic credit, with a positive impact on EPC. This finding is consistent with the work of [64], who demonstrate that FD indicators have a more significant impact on increasing energy demand in SAARC countries, followed by GDP per capita and FDI for the period 1975–2011. The findings do not resonate with [65], who demonstrate that FD has a substantial positive impact on energy consumption in the long term. Further, at a slightly higher frequency but also in the medium term (i.e., 7–9 years band of scale), over 1992–2005, the economic boom started in 1997 (i.e., growth is a crucial mediator, as Figure 11 shows), decompressed EPC and smoothly stimulated FD. Herein, EPC leads FD with a positive sign (arrows pointed to the left and up).
Our key findings indicate that the FD/EPC relationship is dynamic and varies across time and frequency, reflecting different phases of economic activity in the PIGS countries:
  • Short-term dynamics: The analysis reveals that in periods of economic stagnation or political crises, EPC tends to lead FD. This can be attributed to the prioritization of essential consumption during downturns that subsequently affects credit availability and financial flows.
  • Medium-term dynamics: During periods of economic expansion, FD drives EPC. This reflects increased financial activity, investments in infrastructure, and technological advancements that enhance energy consumption.
  • Role of economic growth as a mediator: Our findings highlight the crucial role of economic growth in shaping the FD/EPC nexus. Growth acts as a catalyst, reinforcing the observed co-movements and driving the direction of influence.
To conclude, several common features might be detected from single-country wavelet results. In general, for all countries, significant co-movements are only evident at low and medium frequencies, but they are strict for particular economic contexts. Not least, it is noteworthy that the growth plays a crucial role in the medium term, supporting the EPC-FD link. This strongly reinforces the absence of cointegration, as evidenced by previously used classical time-domain methodologies.

5. Conclusions and Policy Implications

This study analyzes the co-movement between EPC, FD, and economic growth in Portugal, Italy, Greece, and Spain from 1970 to 2014. The study used a mixed methodology of time-domain (i.e., unit-root and cointegration) and time-frequency-domain (i.e., wavelet) types.
Wavelet-based techniques provide a distinct advantage over conventional time-series techniques by enabling the inclusion of additional time scales. This facilitates the identification of relationship patterns across different scales in both the frequency and time domains, a task that conventional time-series models struggle to accomplish [52,66].
The empirical results reveal a pattern within the targeted countries where, in the short run, EPC takes precedence over FD. This trend is particularly noticeable during periods characterized by economic stagnation and political crises. It is suggested that this could be attributed to households giving higher priority to essential needs, cutting down expenses on non-essential items, and scaling back investments in capital goods.
Otherwise, in the medium term, FD seems to be driving EPC, but during economic expansion periods. This could stem from shifts in consumer spending patterns, business expansion, technological advancements, and demographic factors encompassing both growth and aging.
Noteworthy is the fact that the EPC-FD link is conditioned by economic growth, underlining the importance of an “economic engine” in socio-economic life. This is explained through several growth dimensions, such as individual incomes, investments, and government spending.
As for policy implications, the future energy supply is becoming a serious issue. Despite the prioritization of various countries in developing different types of new energy sources, fossil fuels such as coal and oil continue to dominate the current global energy landscape due to constraints on the widespread adoption of alternative sources. It is essential to acknowledge that traditional fossil fuels are non-renewable and are anticipated to be depleted in the next few decades, presenting significant challenges for most nations in ensuring a sustainable energy supply. Compounding this issue is the continual growth of the global population, as underscored by [49,50,51,53,54,67]. The conflict in Ukraine and the gas crisis have highlighted the theme of the search for energy independence also in the Euro–Mediterranean area. A real partnership based on shared criteria of development and sustainability is needed between European and African countries on the Mediterranean shore. The method is that of social dialogue to establish a common policy to fight climate change, to guarantee the security of supplies in harmony with the objectives related to sustainability, and for a truly common well-being.
While this study does not directly analyze CO2 emissions, we acknowledge the significant body of research suggesting a decoupling trend between GDP and CO2 emissions in Europe due to policy-driven advancements in energy efficiency, renewable energy adoption, and stricter environmental regulations. However, this decoupling might influence the relationship between financial development and electricity consumption, as cleaner energy sources and decarbonization strategies could alter electricity demand and financial dynamics.
The growing trend of electrification in Europe—spurred by initiatives such as the European Green Deal and transitions to electric heating, transportation, and appliances—warrants serious consideration. Although our dataset does not capture these recent changes, this trend may reshape the energy-finance-growth nexus in the future, especially as electrification drives greater demand for investments in smart grids, renewable energy infrastructure, and technological innovations.
The main limitation of the paper is related to the time span used in the empirical analysis. In fact, to leave out both the effects of the COVID-19 pandemic crisis and the conflict in Ukraine—which highly perturbed the analyzed series—the analysis would stop in 2019. Moreover, another limitation is the use of aggregate data for both FD and EPC, encompassing all sectors rather than isolating the domestic sector. This approach was chosen due to data availability and the study’s focus on macroeconomic dynamics at the national level. However, it assumes uniformity across sectors, potentially overlooking distinct interactions between FD and EPC in industrial, residential, and commercial domains. Sector-specific influences, such as industrial energy demands or residential financial behaviors, may significantly alter the observed relationships.
Future research should incorporate sectoral data to refine insights and provide targeted policy recommendations. Further research might include new variables able to affect energy and electricity consumption, such as trade balance, climate change, and investments. Moreover, incorporating more recent trends, including CO2-GDP decoupling and electrification, would provide valuable insights.

Author Contributions

Conceptualization: C.M. and L.G.; methodology, L.G.; software, L.G.; validation, C.M.; formal analysis, C.M. and L.G.; investigation, C.M. and L.G.; resources, C.M.; data curation, C.M. and L.G.; writing—original draft preparation, C.M. and L.G.; writing—review and editing, S.K.H.N.; visualization, C.M.; supervision, C.M.; project administration, C.M.; funding acquisition, C.M. All authors have read and agreed to the published version of the manuscript.

Funding

This research received no specific grant from any funding agency in the public, commercial, or not-for-profit sectors.

Data Availability Statement

Data are available upon reasonable request.

Conflicts of Interest

The authors declare that they have no competing interests.

References

  1. Lorde, T.; Waithe, K.; Francis, B. The importance of electrical energy for economic growth in Barbados. Energy Econ. 2010, 32, 1411–1420. [Google Scholar] [CrossRef]
  2. Apergis, N.; Payne, J.E. Renewable and non-renewable electricity consumption-growth nexus: Evidence from emerging market economies. Appl. Energy 2011, 88, 5226–5230. [Google Scholar] [CrossRef]
  3. Lai, T.M.; To, W.M.; Lo, W.C.; Choy, Y.S.; Lam, K.H. The causal relationship between electricity consumption and economic growth in a Gaming and Tourism Center: The case of Macao SAR, the People’s Republic of China. Energy 2011, 36, 1134–1142. [Google Scholar] [CrossRef]
  4. Shahbaz, M.; Lean, H.H. Does financial development increase energy consumption? The role of industrialization and urbanization in Tunisia. Energy Policy 2012, 40, 473–479. [Google Scholar] [CrossRef]
  5. Shahbaz, M.; Hye, Q.M.A.; Tiwari, A.; Leitão, N.C. Economic growth, energy consumption, financial development, international trade and CO2 emissions in Indonesia. Renew. Sustain. Energy Rev. 2013, 25, 109–121. [Google Scholar] [CrossRef]
  6. Salahuddin, M.; Gow, J.; Ozturk, I. Is the long-run relationship between economic growth, electricity consumption, carbon dioxide emissions and financial development in Gulf Cooperation Council Countries robust? Renew. Sustain. Energy Rev. 2015, 51, 317–326. [Google Scholar] [CrossRef]
  7. Faisal, F.; Tursoy, T.; Resatoglu, N.G.; Berk, N. Electricity consumption, economic growth, urbanisation and trade nexus: Empirical evidence from Iceland. Econ. Res.-Ekon. 2018, 31, 664–680. [Google Scholar] [CrossRef]
  8. Bayer, Y.; Ozkaya, M.H.; Herta, L.; Gavriletea, M.D. Financial Development, Financial Inclusion and Primary Energy Use: Evidence from the European Union Transition Economies. Energies 2021, 14, 3638. [Google Scholar] [CrossRef]
  9. Mahalik, M.K.; Babu, M.S.; Loganathan, M.; Shahbaz, M. Does financial development intensify energy consumption in Saudi Arabia? Renew. Sustain. Energy Rev. 2017, 75, 1022–1034. [Google Scholar] [CrossRef]
  10. Stern, D.I.; Cleveland, J.C. Energy and Economic Growth; Rensselaer Working Papers in Economics; Rensselaer Polytechnic Institute: Troy, NY, USA, 2004; No. 0410. [Google Scholar]
  11. Kakar, Z.K. Financial development and energy consumption: Evidence from Pakistan and Malaysia. Energy Sources Part B Econ. Plan. Policy 2016, 11, 868–873. [Google Scholar] [CrossRef]
  12. Magazzino, C. GDP, Energy Consumption and Financial Development in Italy. Int. J. Energy Sect. Manag. 2018, 12, 28–43. [Google Scholar] [CrossRef]
  13. Nkalu, C.N.; Ugwu, S.C.; Asogwa, F.O.; Kuma, M.P.; Onyeke, Q.O. Financial development and energy consumption in Sub-Saharan Africa: Evidence from Panel Vector Error Correction Model. Sage Open 2020, 10. [Google Scholar] [CrossRef]
  14. Gungor, H.; Simon, A.U. Energy consumption, finance and growth: The role of urbanization and industrialization in South Africa. Int. J. Energy Econ. Policy 2017, 7, 268–276. [Google Scholar]
  15. Roubaud, D.; Shahbaz, M. Financial development, economic growth, and electricity demand: A sector analysis of an emerging economy. J. Energy Dev. 2018, 43, 47–98. [Google Scholar]
  16. Sadraoui, T.; Hamlaoui, H.; Youness, Z.; Sadok, B.I. A dynamic panel data analysis for relationship between energy consumption, financial development and economic growth. Int. J. Econom. Financ. Manag. 2019, 7, 20–26. [Google Scholar] [CrossRef]
  17. Sare, Y.A. Effect of financial sector development on energy consumption in Africa: Is it threshold specific? Int. J. Green Energy 2019, 16, 1637–1645. [Google Scholar] [CrossRef]
  18. Yue, S.; Lu, R.; Shen, Y.; Chen, H. How does financial development affect energy consumption? Evidence from 21 transitional countries. Energy Policy 2019, 130, 253–262. [Google Scholar] [CrossRef]
  19. Magazzino, C.; Mele, M.; Santeramo, F.G. Using an Artificial Neural Networks experiment to assess the links among financial development and growth in agriculture. Sustainability 2021, 13, 2828. [Google Scholar] [CrossRef]
  20. Matar, A. Does electricity consumption impacting financial development? Wavelet analysis. Future Bus. J. 2020, 6, 18. [Google Scholar] [CrossRef]
  21. Mahmood, H.; Wen, J.; Zakaria, M.; Khalid, S. Linking electricity demand and economic growth in China: Evidence from wavelet analysis. Environ. Sci. Pollut. Res. 2022, 29, 39473–39485. [Google Scholar] [CrossRef]
  22. Ali, A.; Kamarulzaman, R.; Soetrisno, F.K.; Shahril, M.; Razimi, A. Wavelet Analysis of Renewable, Non-renewable Energy Consumption and Environmental Degradation as a Precursor to Economic Growth: Evidence from Malaysia. Int. J. Energy Econ. Policy 2020, 10, 182–189. [Google Scholar] [CrossRef]
  23. Magazzino, C.; Giolli, L. The relationship among railway networks, energy consumption, and real added value in Italy. Evidence from ARDL and Wavelet Analysis. Res. Transp. Econ. 2021, 90, 101126. [Google Scholar] [CrossRef]
  24. Magazzino, C.; Mutascu, M.; Mele, M.; Sarkodie, S.A. Energy consumption and economic growth in Italy: A wavelet analysis. Energy Rep. 2021, 7, 1520–1528. [Google Scholar] [CrossRef]
  25. Ali, D.A.; Dahir, A.M.; Midi, H. On the interactions among environmental degradation, energy consumption and economic growth: A time-frequency analysis using wavelets. Int. J. Environ. Stud. 2022, 80, 1790–1807. [Google Scholar] [CrossRef]
  26. Le, T.H. Connectedness between nonrenewable and renewable energy consumption, economic growth and CO2 emission in Vietnam: New evidence from a wavelet analysis. Renew. Energy 2022, 195, 442–454. [Google Scholar] [CrossRef]
  27. Hassan, M.S.; Mahmood, H.; Javaid, A. The impact of electric power consumption on economic growth: A case study of Portugal, France, and Finland. Environ. Sci. Pollut. Res. 2022, 29, 45204–45220. [Google Scholar] [CrossRef]
  28. Matar, A.; Fareed, Z.; Magazzino, C.; Al-Rdaydeh, M.; Schneider, N. Assessing the Co-movements Between Electricity Use and Carbon Emissions in the GCC Area: Evidence from a Wavelet Coherence Method. Environ. Model. Assess. 2023, 28, 407–428. [Google Scholar] [CrossRef]
  29. Shojaie, A.; Fox, E.B. Granger causality: A review and recent advances. Annu. Rev. Stat. Its Appl. 2022, 9, 289–319. [Google Scholar] [CrossRef]
  30. Andersson, J. Testing for Granger causality in the presence of measurement errors. Econ. Bull. 2005, 3, 1–13. [Google Scholar]
  31. Yalta, A.T. Analyzing energy consumption and GDP nexus using maximum entropy bootstrap: The case of Turkey. Energy Econ. 2011, 33, 453–460. [Google Scholar] [CrossRef]
  32. Zivot, E.; Andrews, D.W.K. Further evidence on the great crash, the oil price shock and the unit root hypothesis. J. Bus. Econ. Stat. 1992, 10, 251–270. [Google Scholar] [CrossRef]
  33. Clemente, J.; Montannes, A.; Reyes, M. Testing for a unit root in variables with a double change in the mean. Econ. Lett. 1998, 59, 175–182. [Google Scholar] [CrossRef]
  34. Onuonga, S.M. The Relationship Between Commercial Energy Consumption and Gross Domestic Income in Kenya. J. Dev. Areas 2012, 46, 305–314. [Google Scholar] [CrossRef]
  35. Ozturk, I.; Acaravci, A. The long-run and causal analysis of energy, growth, openness and financial development on carbon emissions in Turkey. Energy Econ. 2013, 36, 262–267. [Google Scholar] [CrossRef]
  36. Yildirim, E.; Aslan, A.; Ozturk, I. Energy consumption and GDP in ASEAN countries: Bootstrap-corrected panel and time series causality tests. Singap. Econ. Rev. 2014, 59, 1450010. [Google Scholar] [CrossRef]
  37. Cowan, W.N.; Chang, T.; Inglesi-Lotz, R.; Gupta, R. The nexus of electricity consumption, economic growth and CO2 emissions in the BRICS countries. Energy Policy 2014, 66, 359–368. [Google Scholar] [CrossRef]
  38. Tang, C.F.; Shahbaz, M.; Arouri, M. Re-investigating the electricity consumption and economic growth nexus in Portugal. Energy Policy 2013, 62, 1515–1524. [Google Scholar] [CrossRef]
  39. Shahbaz, M.; Uddin, S.G.; Rehman, I.U.; Imran, K. Industrialization, electricity consumption and CO2 emissions in Bangladesh. Renew. Sustain. Energy Rev. 2014, 31, 575–586. [Google Scholar] [CrossRef]
  40. Sbia, R.; Shahbaz, M.; Ozturk, I. Economic growth, financial development, urbanisation and electricity consumption nexus in UAE. Econ. Res.-Ekon. 2017, 30, 527–549. [Google Scholar] [CrossRef]
  41. Omri, A.; Daly, S.; Nguyen, D.K. A robust analysis of the relationship between renewable energy consumption and its main drivers. Appl. Econ. 2015, 47, 2913–2923. [Google Scholar] [CrossRef]
  42. Matar, A.; Bekhet, H.A. Causal interaction among electricity consumption, financial development, exports and economic growth in Jordan: Dynamic simultaneous equation models. Int. J. Energy Econ. Policy 2015, 5, 955–967. [Google Scholar]
  43. Bekhet, H.A.; Matar, A.; Yasmin, T. CO2 emissions, energy consumption, economic growth, and financial development in GCC countries: Dynamic simultaneous equation models. Renew. Sustain. Energy Rev. 2017, 70, 117–132. [Google Scholar] [CrossRef]
  44. Ntanos, S.; Skordoulis, M.; Kyriakopoulos, G.; Arabatzis, G.; Chalikias, M.; Galatsidas, S.; Batzios, A.; Katsarou, A. Renewable energy and economic growth: Evidence from European countries. Sustainability 2018, 10, 2626. [Google Scholar] [CrossRef]
  45. Shahbaz, M.; Benkraiem, R.; Miloudi, A.; Lahiani, A. Production function with electricity consumption and policy implications in Portugal. Energy Policy 2017, 110, 588–599. [Google Scholar] [CrossRef]
  46. Sadorsky, P. The impact of financial development on energy consumption in emerging economies. Energy Policy 2010, 38, 2528–2535. [Google Scholar] [CrossRef]
  47. Sadorsky, P. Financial development and energy consumption in Central and Eastern European frontier economies. Energy Policy 2011, 39, 999–1006. [Google Scholar] [CrossRef]
  48. Çoban, S.; Topcu, M. The nexus between financial development and energy consumption in the EU: A dynamic panel data analysis. Energy Econ. 2013, 39, 81–88. [Google Scholar] [CrossRef]
  49. Aslan, A.; Apergis, N.; Yildirim, S. Causality between energy consumption and GDP in the U.S.: Evidence from wavelet analysis. Front. Energy 2014, 8, 1–8. [Google Scholar] [CrossRef]
  50. Deniz, P. Electricity Consumption and Growth: Wavelet Analysis for Emerging Markets. JEBPIR 2015, 1, 1–15. [Google Scholar]
  51. Ha, J.; Tan, P.P.; Goh, K.L. Linear and nonlinear causal relationship between energy consumption and economic growth in China: New evidence based on wavelet analysis. PLoS ONE 2018, 13, e0197785. [Google Scholar] [CrossRef]
  52. Ferrer, R.; Jammazi, R.; Bolós, V.J.; Benítez, R. Interactions between financial stress and economic activity for the US: A time-and frequency-varying analysis using wavelets. Phys. A Stat. Mech. Its Appl. 2018, 492, 446–462. [Google Scholar] [CrossRef]
  53. Kristjanpoller, W.R.; Sierra, A.C.; Scavia, J.D. Dynamic co-movements between energy consumption and economic growth. A panel data and wavelet perspective. Energy Econ. 2018, 72, 640–649. [Google Scholar] [CrossRef]
  54. Ozun, A.; Cifter, A. Multi-Scale Causality between Energy Consumption and GNP in Emerging Markets: Evidence from Turkey. Invest. Manag. Financ. Innov. 2007, 4, 60–70. [Google Scholar]
  55. Gregory, A.W.; Hansen, B.E. Residual-Based Tests for Cointegration in Models with Regime Shifts. J. Econom. 1996, 70, 99–126. [Google Scholar] [CrossRef]
  56. Aguiar-Conraria, L.; Soares, M.J. The continuous wavelet transform: Moving beyond uni- and bivariate analysis. J. Econ. Surv. 2014, 28, 344–375. [Google Scholar] [CrossRef]
  57. Mihanović, H.; Orlić, M.; Pasrić, Z. Diurnal thermocline oscillations driven by tidal flow around an island in the Middle Adriatic. J. Mar. Syst. 2009, 78, S157–S168. [Google Scholar] [CrossRef]
  58. FRED. Federal Reserve Bank of St. Louis. 2024. Available online: https://fred.stlouisfed.org/ (accessed on 5 December 2024).
  59. Papaioannou, G.P.; Dikaiakos, C.; Evangelidis, G.; Papaioannou, P.G.; Georgiadis, D.S. Co-Movement Analysis of Italian and Greek Electricity Market Wholesale Prices by Using a Wavelet Approach. Energies 2015, 8, 11770–11799. [Google Scholar] [CrossRef]
  60. Atif, M. The Effects of Energy Consumption, Economic Growth, and Financial Development on CO2 Emissions in Greece. J. Bus. Manag. Account. 2021, 5, 13–26. [Google Scholar]
  61. Dergiades, T.; Martinopoulos, G.; Tsoulfidis, L. Energy consumption and economic growth: Parametric and non-parametric causality testing for the case of Greece. Energy Econ. 2013, 36, 686–697. [Google Scholar] [CrossRef]
  62. Lee, C.C. The causality relationship between energy consumption and GDP in G-11 countries revisited. Energy Policy 2006, 34, 1086–1093. [Google Scholar] [CrossRef]
  63. Tang, C.F.; Shahbaz, M. Revisiting the Electricity Consumption-Growth Nexus for Portugal: Evidence from a Multivariate Framework Analysis; MPRA 28393; University Library of Munich: Munich, Germany, 2011. [Google Scholar]
  64. Alam, A.; Malik, I.A.; Abdullah, A.B.; Hassan, A.; Awan, U.; Ali, G.; Zaman, K.; Naseem, I. Does financial development contribute to SAARC energy demand? From energy crisis to energy reforms. Renew. Sustain. Energy Rev. 2015, 41, 818–829. [Google Scholar] [CrossRef]
  65. Mukhtarov, S.; Mikayilov, J.I.; Mammadov, J.; Mammadov, E. The impact of financial development on energy consumption: Evidence from an oil-rich economy. Energies 2018, 11, 1536. [Google Scholar] [CrossRef]
  66. Antonakakis, N.; Chang, T.; Cunado, J.; Gupta, R. The relationship between commodity markets and commodity mutual funds: A wavelet-based analysis. Financ. Res. Lett. 2018, 24, 1–9. [Google Scholar] [CrossRef]
  67. Rashid, A.; Yousaf, N. Linkage of financial development with electricity-growth, nexus of India and Pakistan. EuroEconomica 2015, 34, 151–160. [Google Scholar]
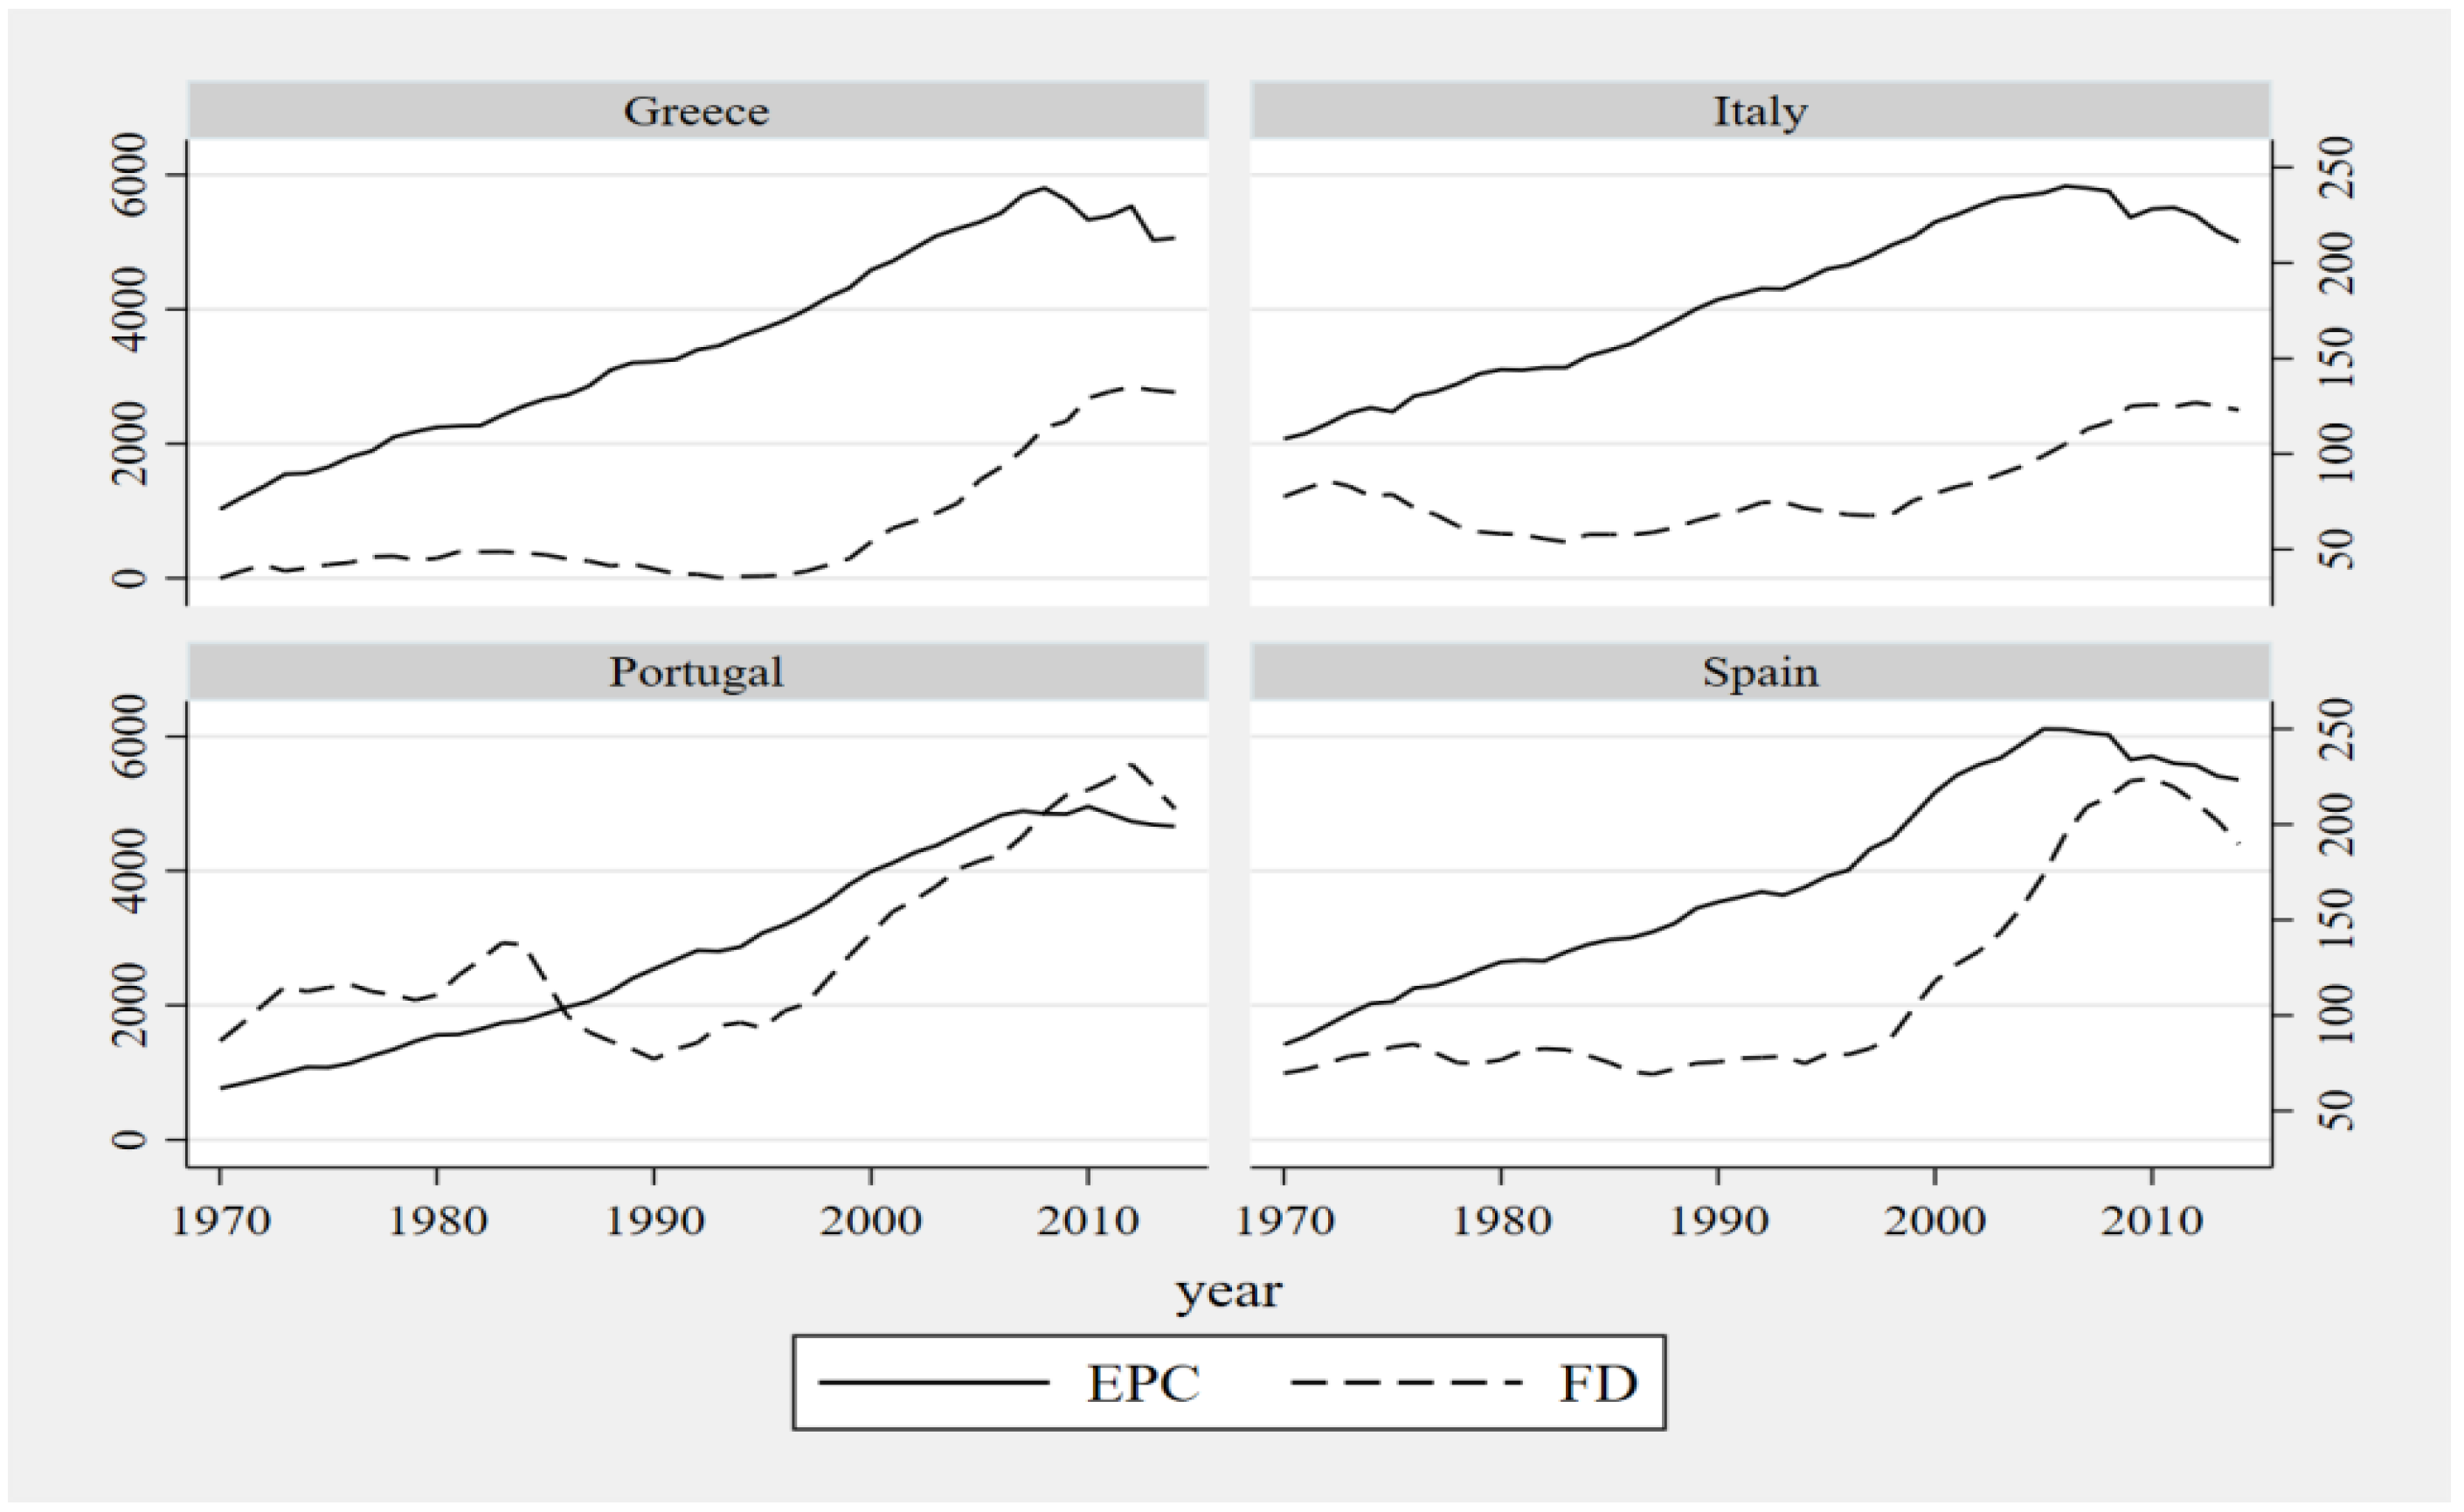
Figure 1. Electric power consumption and financial development in Portugal, Italy, Greece, and Spain (levels on the y-axis).
Energies 17 06338 g001
Figure 2. Constant GDP per capita in Portugal, Italy, Greece, and Spain (levels on the y-axis).
Energies 17 06338 g002
Figure 3. Scatterplot matrices (log-levels on the y-axis).
Energies 17 06338 g003
Figure 4. WTC of pair EPC and FD (Greece, 1970–2014).
Energies 17 06338 g004
Figure 5. PWC of pair EPC and FD by removing the effect of RPCGDP (Greece, 1970–2014).
Energies 17 06338 g005
Figure 6. WTC of pair EPC and FD (Italy, 1970–2014).
Energies 17 06338 g006
Figure 7. PWC of pair EPC and FD by removing the effect of RPCGDP (Italy, 1970–2014).
Energies 17 06338 g007
Figure 8. WTC of pair EPC and FD (Portugal, 1970–2014).
Energies 17 06338 g008
Figure 9. PWC of pair EPC and FD by removing the effect of RPCGDP (Portugal, 1970–2014).
Energies 17 06338 g009
Figure 10. WTC of pair EPC and FD (Spain, 1970–2014).
Energies 17 06338 g010
Figure 11. PWC of pair EPC and FD by removing the effect of RPCGDP (Spain, 1970–2014).
Energies 17 06338 g011
Table 1. Summary of the existing literature on the relationship between electricity consumption, financial development, and GDP through the WA approach.
Author(s)Study PeriodCountriesVariables
Aslan et al. (2014) [49]1973–2012USAReal GDP and primary energy consumption
Deniz (2015) [50]1971–201112 emerging marketsEPC and GDP growth rate
Ha et al. (2018) [51]1953–2013ChinaReal per capita GDP, real per capita capital stock, average labor population, and per capita energy consumption
Jammazi (2018) [52]1980–20136 GCC countriesPer capita CO2 emissions, annual GDP growth rate, and energy consumption
Kristjanpoller et al. (2018) [53]1972–201474 countriesEPC and real per capita GDP
Le (2022) [26]1985–2019VietnamNon-renewable energy consumption, renewable energy consumption, economic growth, and CO2 emissions
Magazzino et al. (2021) [24]1926–2008ItalyEnergy consumption and economic growth
Mahmood et al. (2022) [21]1999–2017ChinaElectricity demand and economic growth
Matar (2020) [20]1980–20176 GCC countriesFD and EPC
Ozun and Cifter (2007) [54]1968–2002TurkeyElectricity consumption and real GNP
Notes: GNP, Gross National Product; GDP, Gross Domestic Product; EPC, electric power consumption; FD, financial development; CO2, carbon dioxide. Sources: authors’ elaboration.
Table 2. Descriptive statistics.
EPC
CountryMinimumMaximumMeanMedianStd. Dev.SkewnessKurtosis
Greece1023.7925805.1923518.3233398.3841461.4530.0261.685
Italy2072.9135833.4674171.5294303.6461207.97−0.1721.628
Portugal763.9024959.0942879.9932803.2021443.9570.1071.522
Spain1415.8416111.2193879.9503638.5271490.6160.0951.631
FD
CountryMinimumMaximumMeanMedianStd. Dev.SkewnessKurtosis
Greece34.9135.161.26945.30032.5491.3333.237
Italy53.9126.981.19874.90022.6280.8892.560
Portugal77.1231.6134.729116.246.040.7692.268
Spain69.2224113.24981.554.2451.0652.454
RPCGDP
CountryMinimumMaximumMeanMedianStd. Dev.SkewnessKurtosis
Greece10,726.71624,072.79116,850.99415,691.9453366.4130.6222.593
Italy15,736.18434,081.0926,566.93727,894.2425769.363−0.4241.833
Portugal7658.74419,985.69914,618.02515,193.0554096.581−0.1281.455
Spain11,436.03327,218.44919,525.51619,403.334987.730.0821.539
Source: authors’ calculations.
Table 3. ZA test results.
Variable EPCFDRPCGDP
CountryType of OutlierLevelFirst DifferenceLevelFirst DifferenceLevelFirst Difference
GreeceIntercept−3.180 ***
[2007]
−6.146
[1994]
−3.174 ***
[2000]
−4.640 **
[1997]
−2.479 ***
[1999]
−4.728 **
[2007]
Intercept and trend−6.010
[2007]
−6.359
[1983]
−3.533 ***
[1990]
−4.435 ***
[1998]
−3.512 ***
[2003]
−4.560 ***
[1994]
ItalyIntercept−0.939
[2007]
−7.091
[1984]
−3.317 ***
[1999]
−4.783 **
[1984]
−0.330 ***
[2007]
−7.005
[2007]
Intercept and trend−3.489 ***
[2004]
−7.272
[1984]
−3.449 ***
[1978]
−4.778 ***
[1999]
−2.307 ***
[2002]
−6.987
[2000]
PortugalIntercept−0.437 ***
[2007]
−5.491
[2007]
−4.670 **
[1985]
−4.364 ***
[1991]
−2.070 ***
[1988]
−6.107
[1987]
Intercept and trend−2.774 ***
[2004]
−5.680
[1995]
−5.049 **
[1985]
−4.196 ***
[1991]
−3.168 ***
[2004]
−5.893
[1985]
SpainIntercept−2.184 ***
[2007]
−3.900 ***
[2006]
−3.810 ***
[1999]
−3.279 ***
[1995]
−3.290 ***
[2007]
−3.631 ***
[1985]
Intercept and trend−3.971 ***
[1999]
−4.422 ***
[1997]
−3.061 ***
[1982]
−4.145 ***
[1998]
−3.813 ***
[2004]
−3.947 ***
[1982]
Notes: (1) H0, the series has a unit root with a structural break; (2) *** and ** denote 1 and 5 levels of significance; and (3) […] indicates the optimal/selected breakpoint.
Table 4. CMR test results.
Variable EPCFDRPCGDP
CountryType of OutlierLevelFirst DifferenceLevelFirst DifferenceLevelFirst Difference
GreeceAdditive10.718
[1988]
−3.706
[2006]
15.330
[2002]
4.406
[1995]
9.659
[1999]
−4.041
[2009]
Innovative1.264 ***
[1981]
−3.773
[2007]
5.762
[1998]
3.062
[1995]
2.334 *
[1995]
−2.374 *
[2008]
ItalyAdditive12.356
[1989]
−4.965
[2005]
4.477
[2010]
3.522
[1981]
11.321
[1989]
−4.304
[2005]
Innovative2.303 *
[1982]
−4.176
[2006]
4.130
[1997]
3.080
[1982]
0.873 ***
[1974]
−2.718 *
[2006]
PortugalAdditive11.402
[1991]
−5.457
[2004]
10.825
[2002]
1.730 ***
[1988]
12.686
[1991]
−2.890
[2001]
Innovative0.286 ***
[1974]
−2.371 *
[2001]
3.093
[1996]
1.630 ***
[1989]
4.084
[1985]
−2.883
[1999]
SpainAdditive9.458
[1997]
−4.673
[2003]
17.766
[2001]
2.924 *
[1994]
12.290
[1991]
−3.851
[2005]
Innovative3.037
[1993]
−3.523
[2004]
2.996
[1997]
1.819 **
[1995]
2.526 *
[1984]
−3.448
[2006]
Notes: (1) H0, the series has a unit root with a structural break; (2) ***, **, and * denote rejection of the null hypothesis at the 1, 5, and 10% levels of significance; and (3) […] indicates the optimal/selected breakpoint.
Table 5. Gregory-Hansen cointegration test results.
ADF
CountryInterceptTrendRegimeRegime and Trend
Greece−2.93
[1984]
−5.01
[1989]
−3.71
[1985]
−5.94 *
[1984]
Italy−5.15 **
[1982]
−4.96
[1982]
−5.41 *
[1982]
−6.10 **
[1987]
Portugal−4.67
[1976]
−4.00
[1976]
−5.61 **
[1986]
−4.25
[1981]
Spain−4.14
[1976]
−4.06
[1976]
−3.81
[1981]
−4.39
[1987]
Z(t)
CountryInterceptTrendRegimeRegime and Trend
Greece−3.36
[1984]
−5.45 **
[1990]
−4.10
[1985]
−5.50
[1989]
Italy−4.60
[1981]
−4.66
[1981]
−5.10
[1991]
−5.69
[1986]
Portugal−4.28
[1977]
−3.53
[1987]
−4.77
[1983]
−4.29
[1985]
Spain−4.24
[1976]
−4.26
[1976]
−3.94
[1981]
−4.46
[1987]
Z(a)
CountryInterceptTrendRegimeRegime and Trend
Greece−15.20
[1984]
−28.44
[1990]
−23.81
[1985]
−37.38
[1989]
Italy−27.04
[1981]
−28.67
[1981]
−28.55
[1991]
−35.68
[1986]
Portugal−23.13
[1977]
−21.06
[1987]
−27.91
[1983]
−26.73
[1985]
Spain−24.71
[1976]
−23.84
[1976]
−23.44
[1981]
−27.07
[1987]
Notes: (1) ** and * denote 5 and 10% levels of significance; and (2) […] indicates the optimal/selected breakpoint.
Disclaimer/Publisher’s Note: The statements, opinions and data contained in all publications are solely those of the individual author(s) and contributor(s) and not of MDPI and/or the editor(s). MDPI and/or the editor(s) disclaim responsibility for any injury to people or property resulting from any ideas, methods, instructions or products referred to in the content.