

Average Model of Switched-Energy-Tank Battery Equalizer for Accelerated Performance Assessment †

Abstract
:1. Introduction
2. Accelerated Performance Assessment of the Long-Term Operation
2.1. Model Configuration
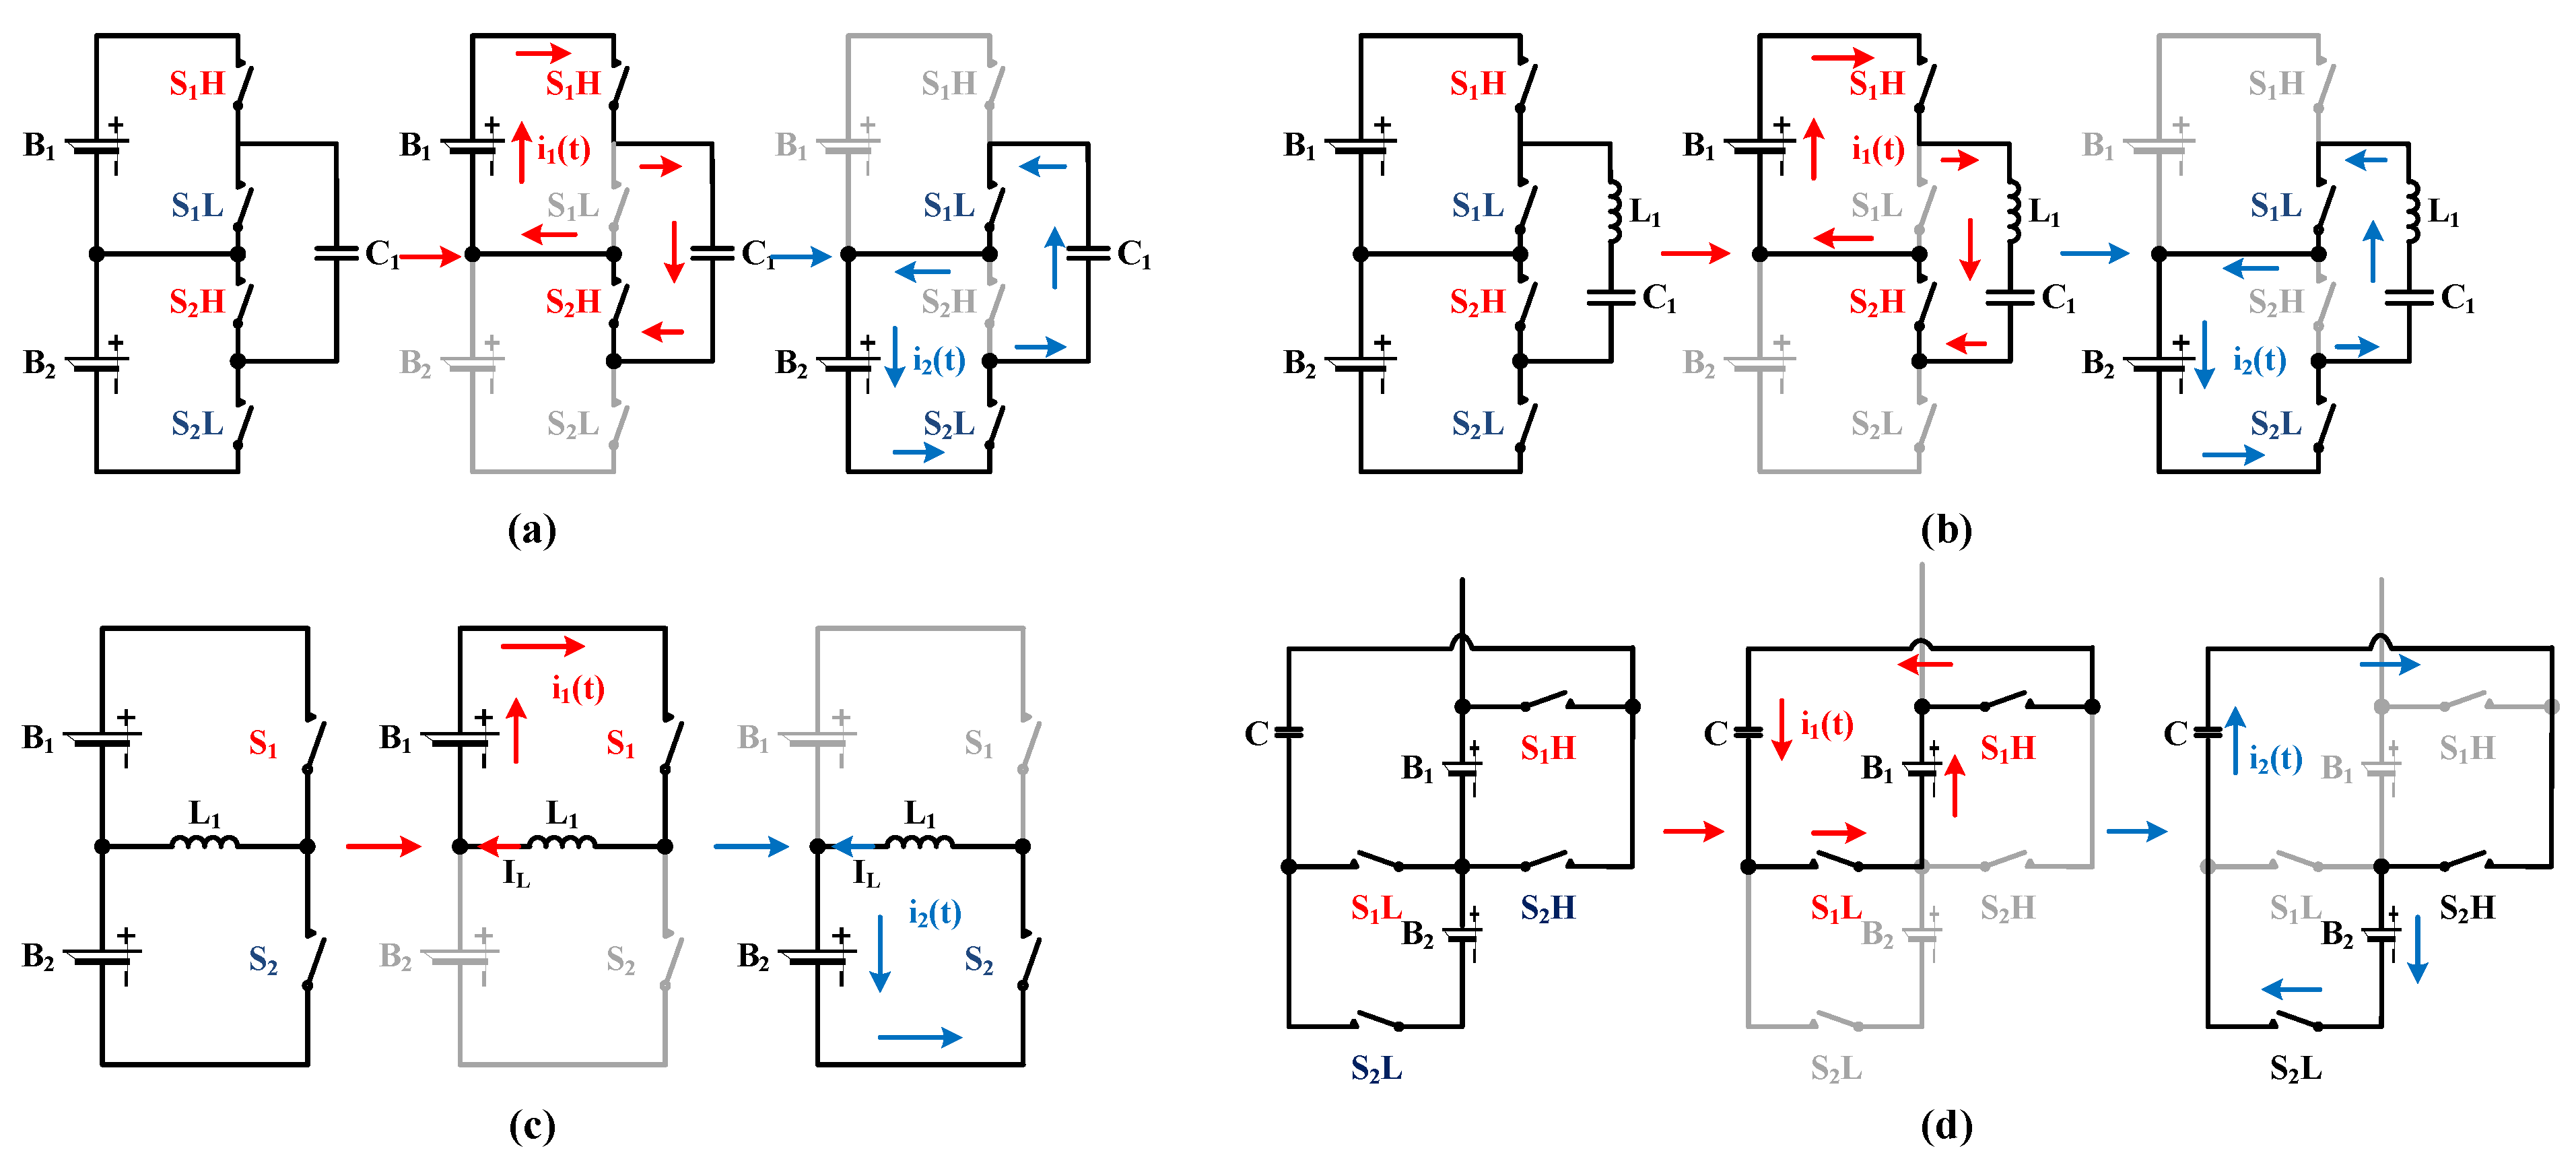
- Phase B: The switching pattern is changed to transfer the energy from the energy tank to cell . In Figure 1a–c, the switches and are activated while the other switches are turned off. Similarly, the switches and of the SMC-E in Figure 1d are turned on to do the same task. Likewise, cell is charged by an average current, .
2.2. Average Model Derivation
2.2.1. Switched-Capacitor Equalizer (SC-E) and Switch-Matrix Capacitor Equalizer (SMC-E)
2.2.2. Switched-Resonant Equalizer (SR-E)
2.2.3. Switched-Inductor Equalizer (SI-E)
3. Model Verification
3.1. Validation of Model Accuracy
3.2. Performance Comparison with the Model for Various Equalizer Topologies
4. AM Case Study
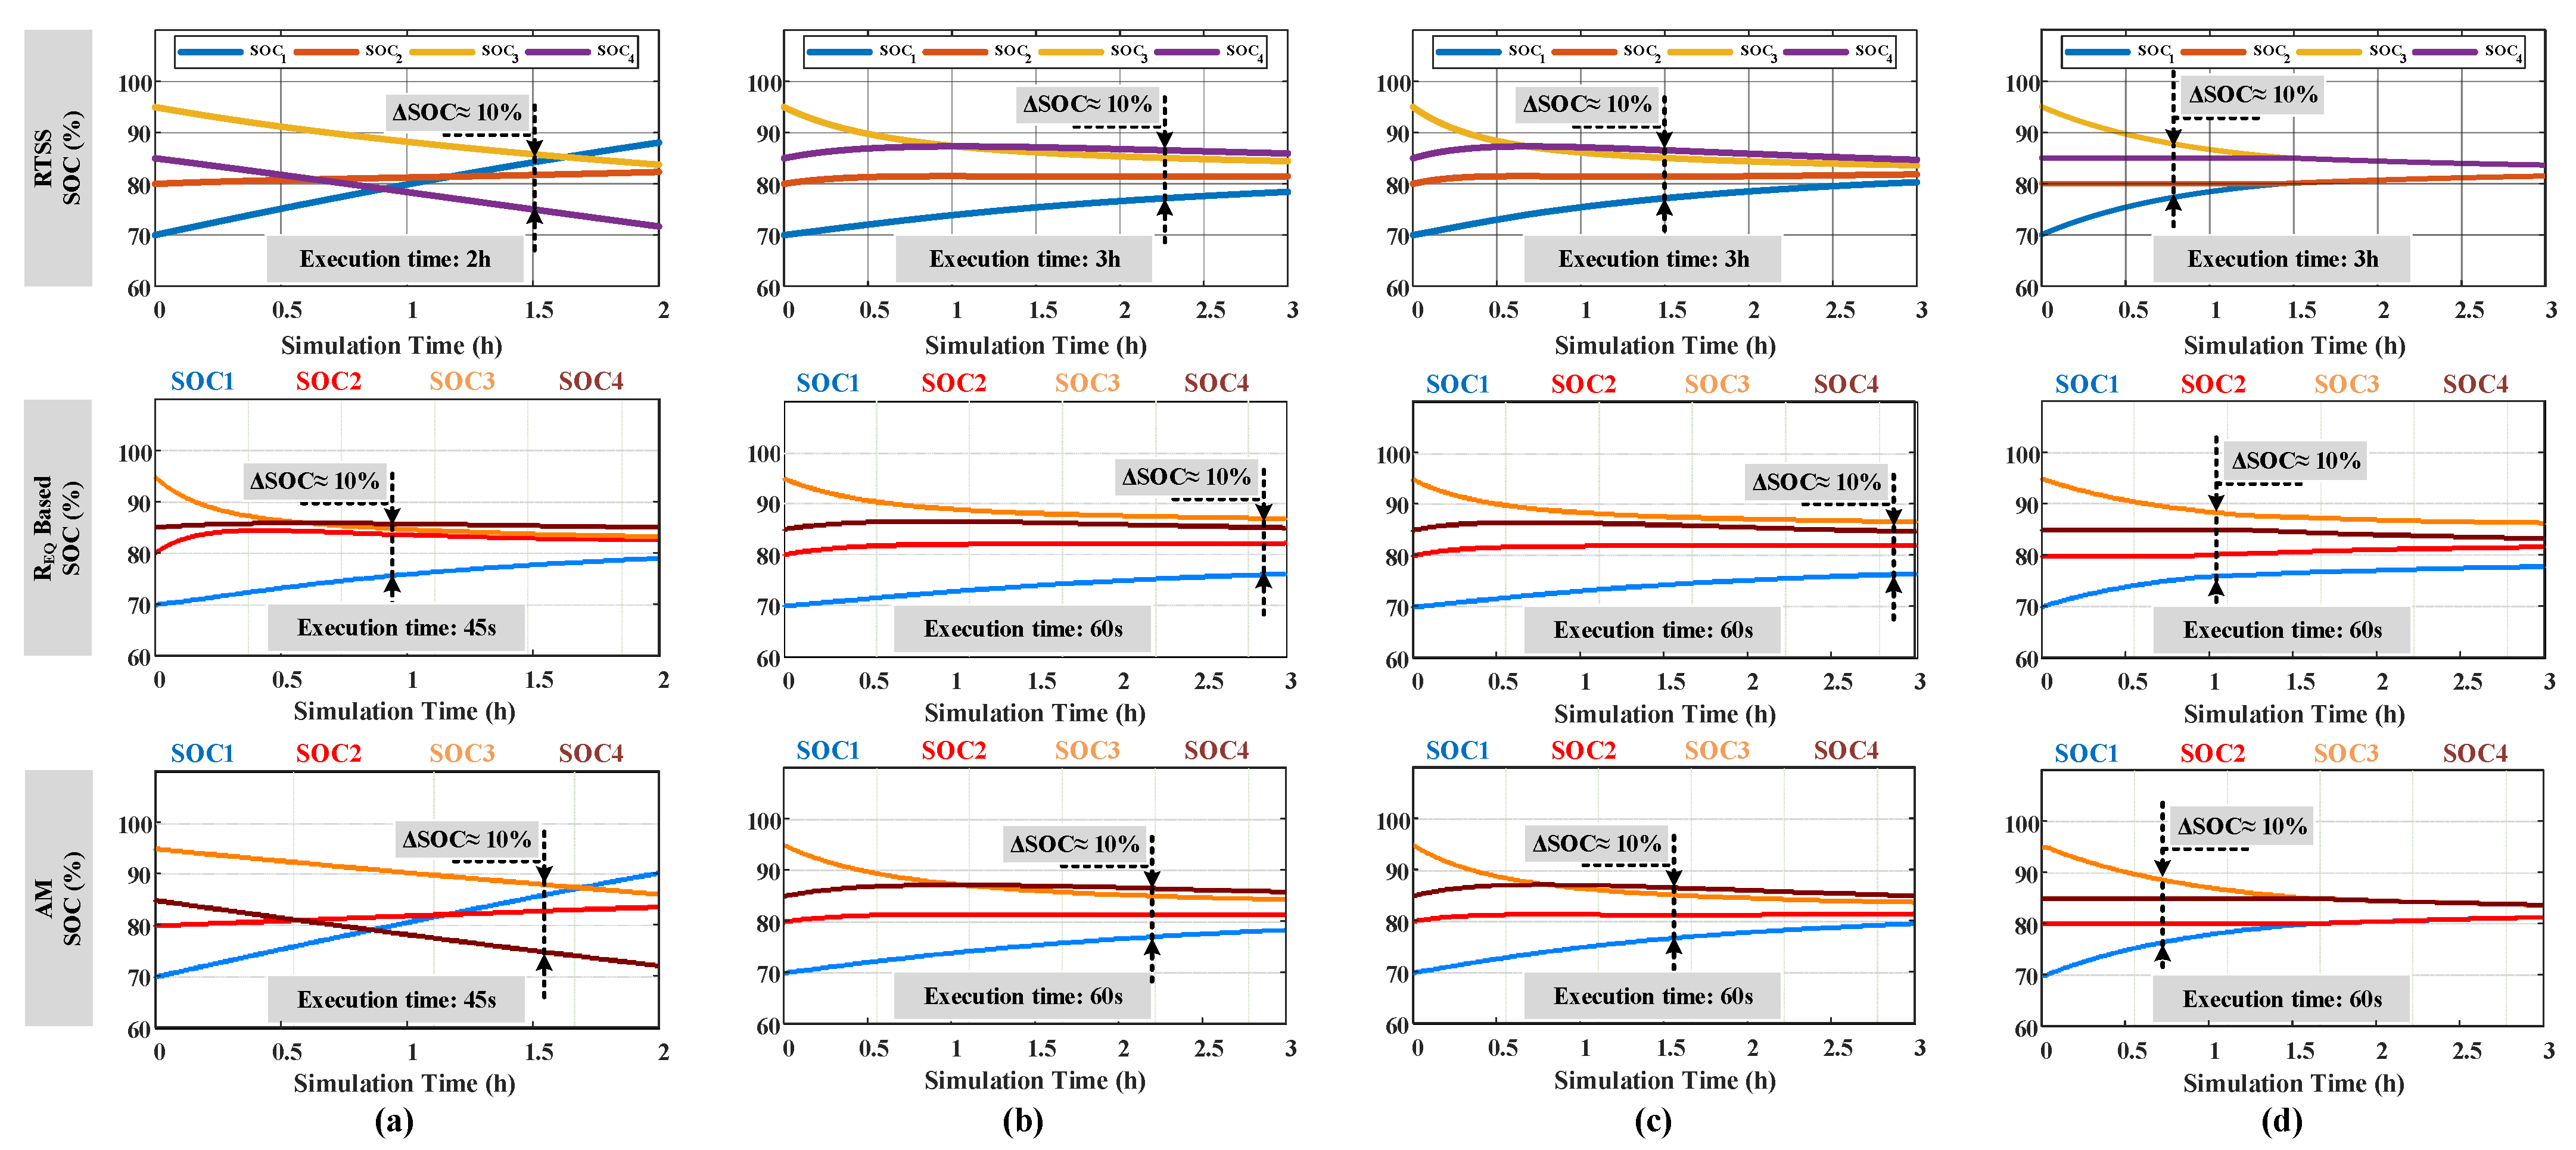
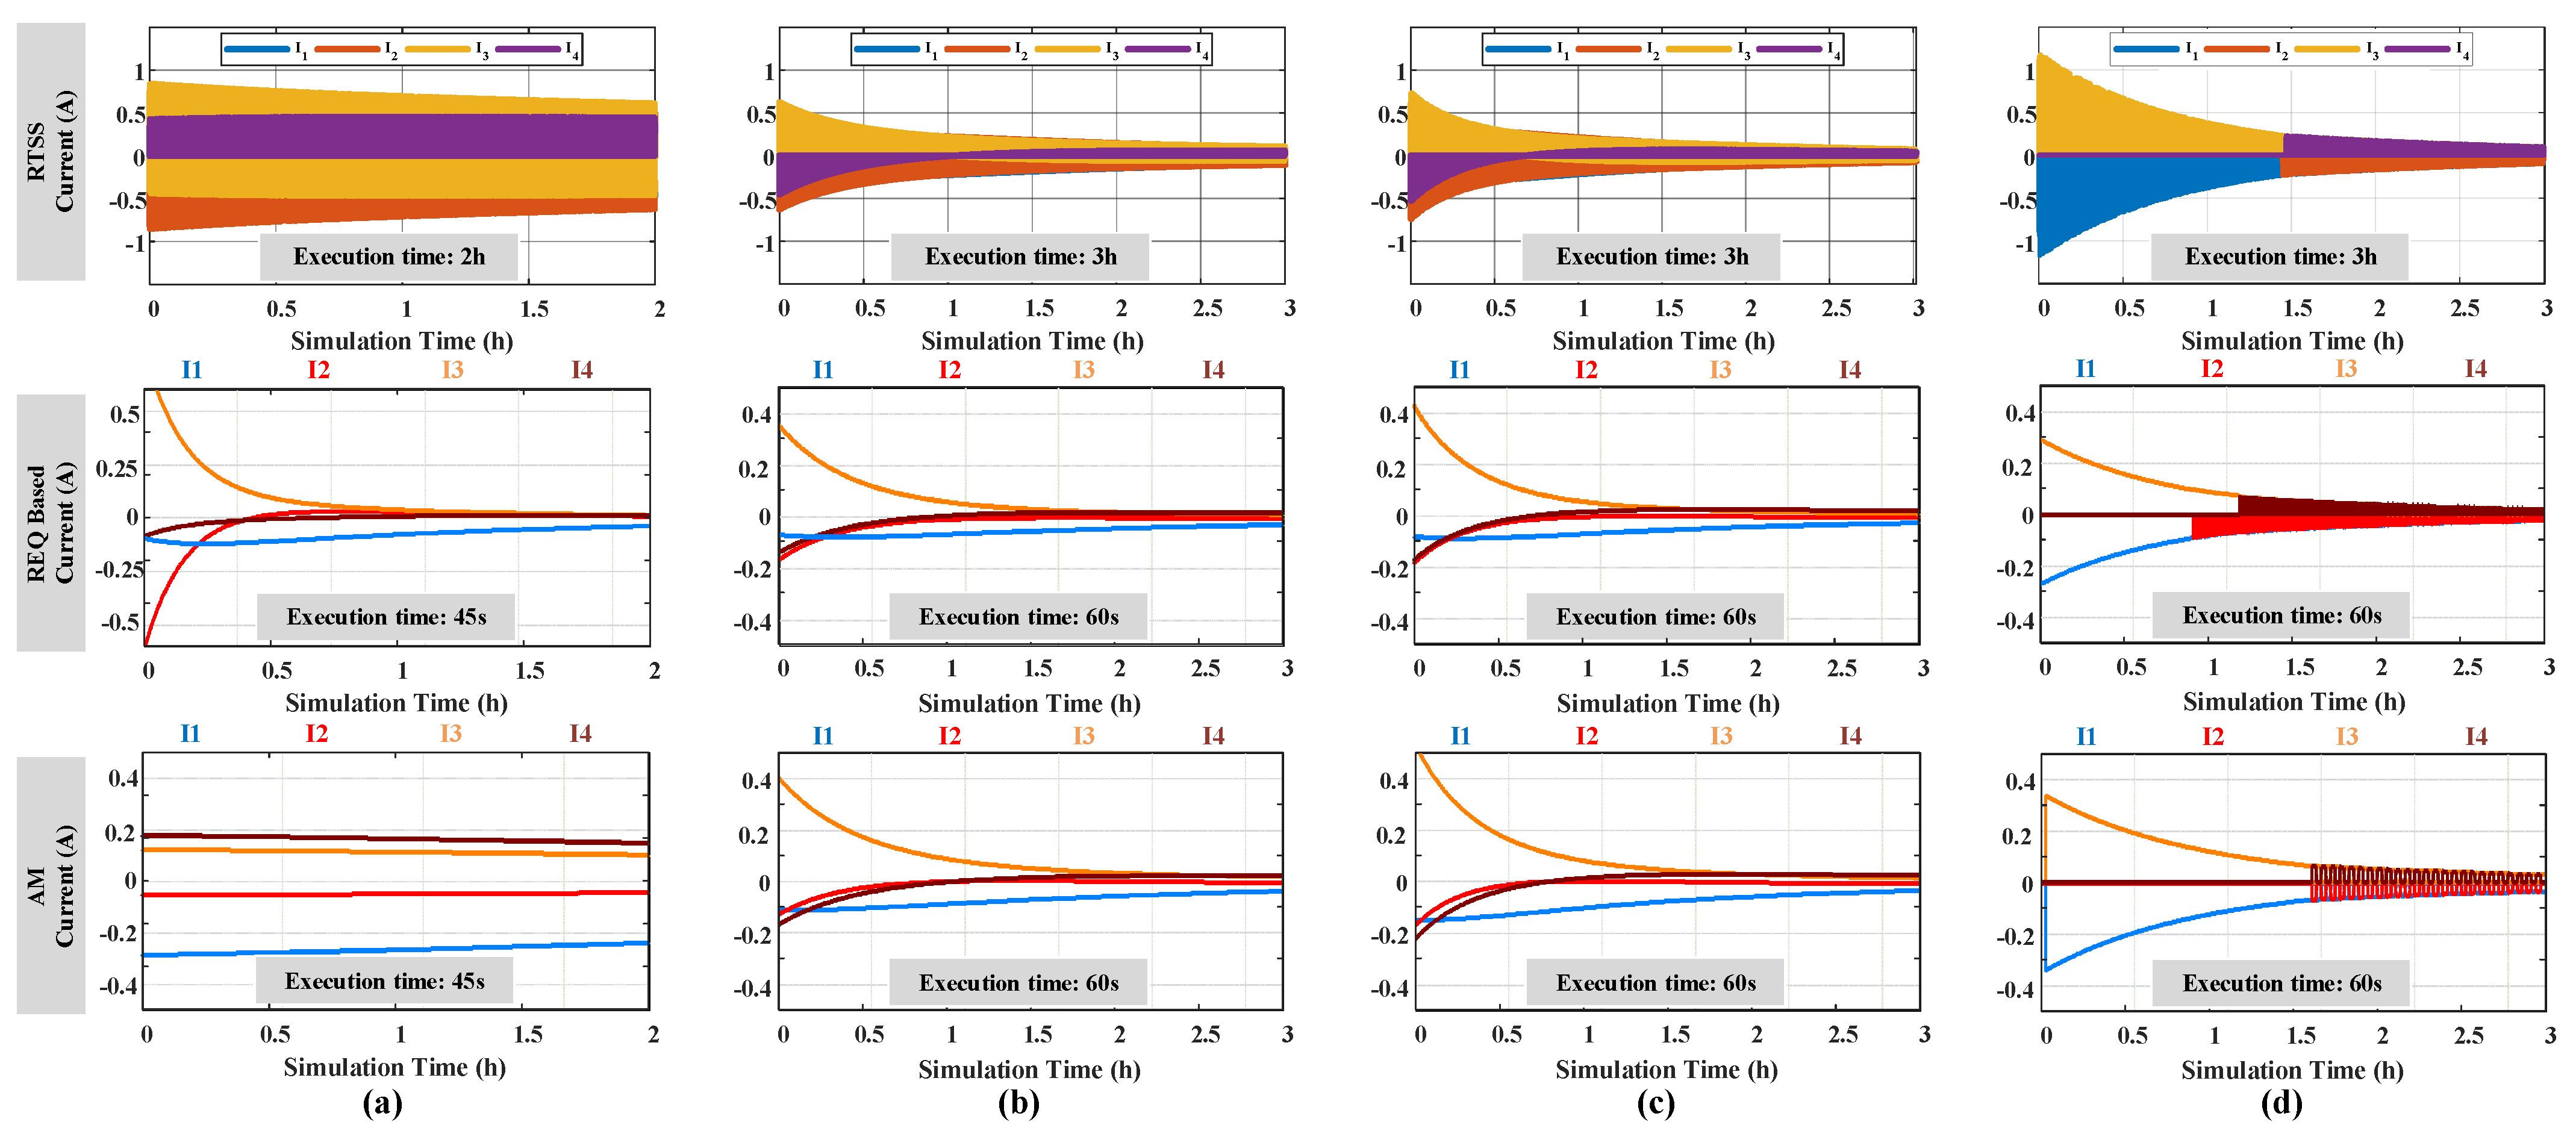
- Scenario : The SOC levels of cells to are descending, as in Figure 10a.
- Scenario : The SOC distribution exhibits a convex shape, where the high−SOC cells are located in the middle of the battery string, as in Figure 10b.
- Scenario : The SOC distribution exhibits a concave shape, where the high−SOC cells are located at two ends of the string, as in Figure 10c.
- Scenario : The number of cells is increased from Scenario to assess the dependency on the number of cells.
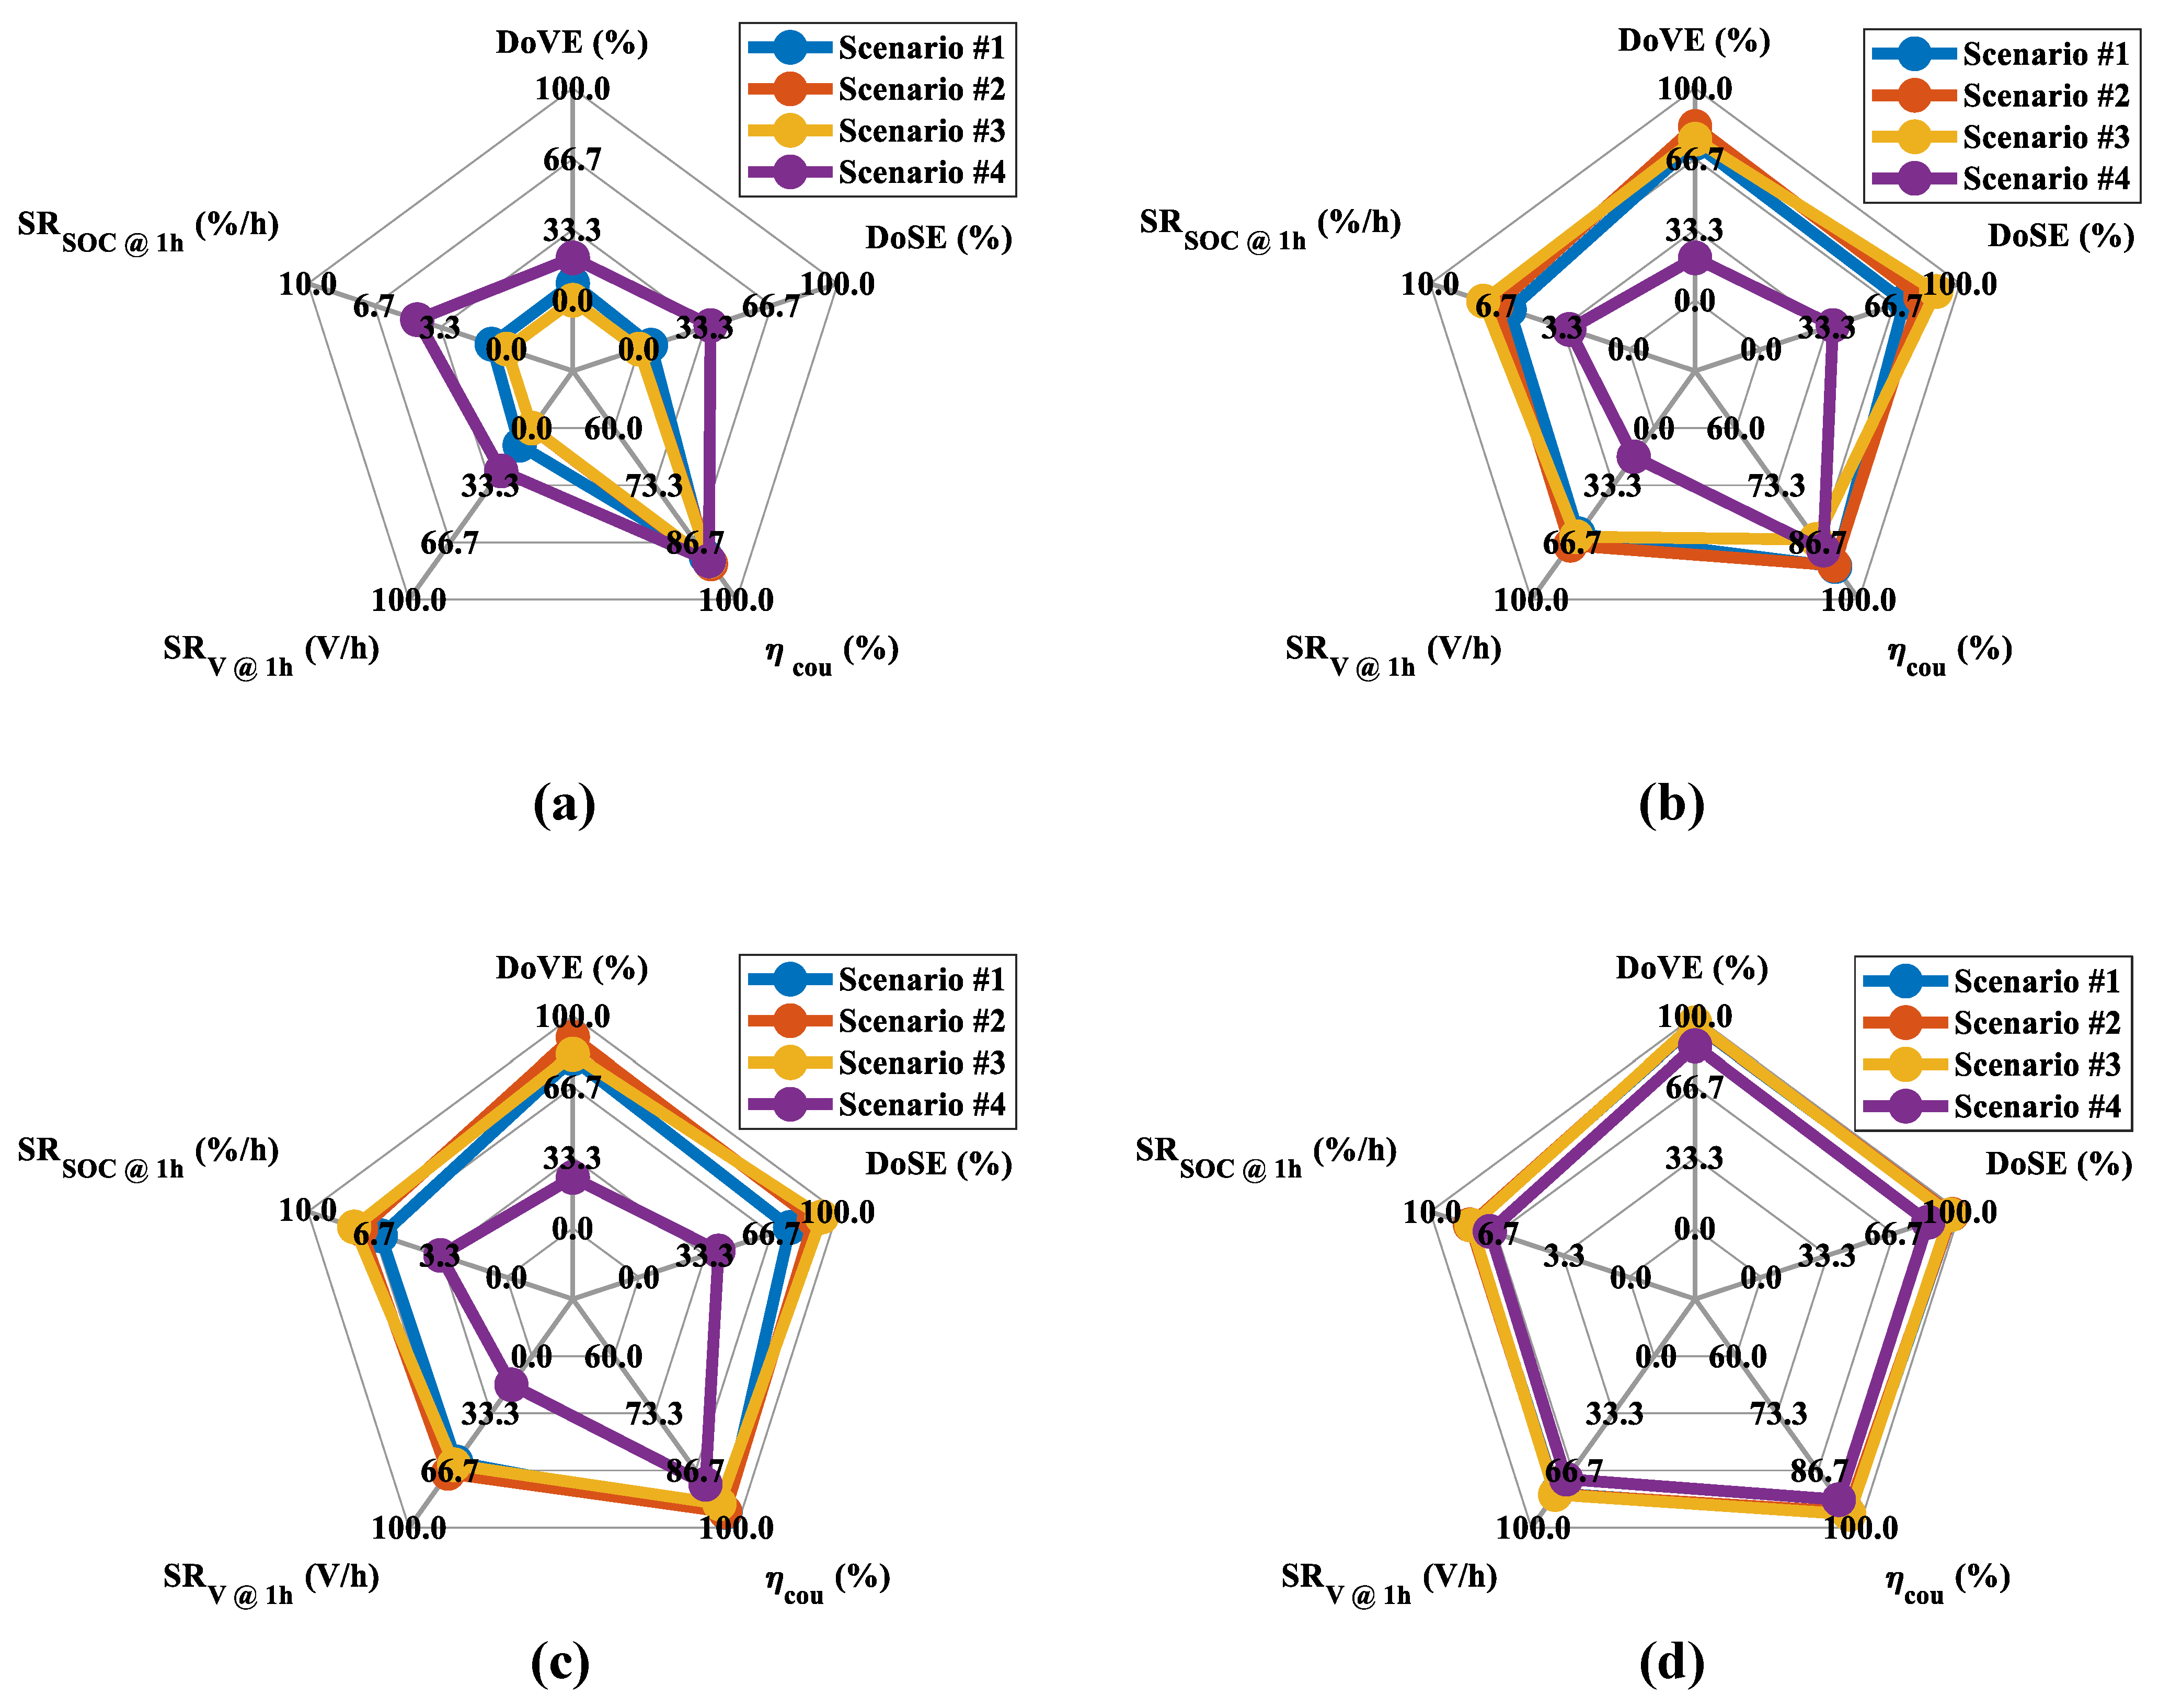
4.1. Equalizing Capability
4.2. Equalizing Speed
4.3. Coulombic Efficiency
4.4. Performance Consistency
5. Conclusions
- To choose a suitable equalizer topology to fit the purpose.
- To verify and optimize the design parameters of an equalizer through various design options and initial test conditions.
- To reduce the cost and effort by minimizing trial and error tests.
Author Contributions
Funding
Data Availability Statement
Conflicts of Interest
References
- Fu, R.; Remo, T.W.; Margolis, R.M. 2018 US Utility-Scale Photovoltaics-Plus-Energy Storage System Costs Benchmark; Technical Report; National Renewable Energy Lab (NREL): Golden, CO, USA, 2018. [Google Scholar]
- Kim, J.; Cho, B. Screening process-based modeling of the multi-cell battery string in series and parallel connections for high accuracy state-of-charge estimation. Energy 2013, 57, 581–599. [Google Scholar] [CrossRef]
- Kampker, A.; Wessel, S.; Fiedler, F.; Maltoni, F. Battery pack remanufacturing process up to cell level with sorting and repurposing of battery cells. J. Remanuf. 2021, 11, 1–23. [Google Scholar] [CrossRef]
- Zwicker, M.; Moghadam, M.; Zhang, W.; Nielsen, C. Automotive battery pack manufacturing—A review of battery to tab joining. J. Adv. Join. Process. 2020, 1, 100017. [Google Scholar] [CrossRef]
- Gong, X.; Xiong, R.; Mi, C.C. Study of the characteristics of battery packs in electric vehicles with parallel-connected lithium-ion battery cells. IEEE Trans. Ind. Appl. 2014, 51, 1872–1879. [Google Scholar] [CrossRef]
- Baumann, M.; Wildfeuer, L.; Rohr, S.; Lienkamp, M. Parameter variations within Li-Ion battery packs—Theoretical investigations and experimental quantification. J. Energy Storage 2018, 18, 295–307. [Google Scholar] [CrossRef]
- Zheng, Y.; Ouyang, M.; Lu, L.; Li, J. Understanding aging mechanisms in lithium-ion battery packs: From cell capacity loss to pack capacity evolution. J. Power Sources 2015, 278, 287–295. [Google Scholar] [CrossRef]
- Kuntz, P.; Lonardoni, L.; Genies, S.; Raccurt, O.; Azas, P. Evolution of Safety Behavior of High-Power and High-Energy Commercial Li-Ion Cells after Electric Vehicle Aging. Batteries 2023, 9, 427. [Google Scholar] [CrossRef]
- Zhang, C.; Jiang, Y.; Jiang, J.; Cheng, G.; Diao, W.; Zhang, W. Study on battery pack consistency evolutions and equilibrium diagnosis for serial-connected lithium-ion batteries. Appl. Energy 2017, 207, 510–519. [Google Scholar] [CrossRef]
- Cao, J.; Schofield, N.; Emadi, A. Battery balancing methods: A comprehensive review. In Proceedings of the 2008 IEEE Vehicle Power and Propulsion Conference, Harbin, China, 3–5 September 2008; pp. 1–6. [Google Scholar]
- Ziegler, A.; Oeser, D.; Hein, T.; Montesinos-Miracle, D.; Ackva, A. Reducing Cell to Cell Variation of Lithium-Ion Battery Packs During Operation. IEEE Access 2021, 9, 24994–25001. [Google Scholar] [CrossRef]
- Hemavathi, S. Overview of cell balancing methods for Li-ion battery technology. Energy Storage 2021, 3, e203. [Google Scholar]
- Koseoglou, M.; Tsioumas, E.; Jabbour, N.; Mademlis, C. Highly Effective Cell Equalization in a Lithium-Ion Battery Management System. IEEE Trans. Power Electron. 2019, 35, 2088–2099. [Google Scholar] [CrossRef]
- Stuart, T.A.; Zhu, W. Fast equalization for large lithium ion batteries. IEEE Aerosp. Electron. Syst. Mag. 2009, 24, 27–31. [Google Scholar] [CrossRef]
- Lee, W.C.; Drury, D.; Mellor, P. Comparison of passive cell balancing and active cell balancing for automotive batteries. In Proceedings of the 2011 IEEE Vehicle Power and Propulsion Conference, Chicago, IL, USA, 6–9 September 2011; pp. 1–7. [Google Scholar]
- Di Monaco, M.; Porpora, F.; Tomasso, G.; D’Arpino, M.; Attaianese, C. Design methodology for passive balancing circuit including real battery operating conditions. In Proceedings of the 2020 IEEE Transportation Electrification Conference and Expo (ITEC), Chicago, IL, USA, 23–26 June 2020; pp. 467–471. [Google Scholar]
- Einhorn, M.; Guertlschmid, W.; Blochberger, T.; Kumpusch, R.; Permann, R.; Conte, F.V.; Kral, C.; Fleig, J. A current equalization method for serially connected battery cells using a single power converter for each cell. IEEE Trans. Veh. Technol. 2011, 60, 4227–4237. [Google Scholar] [CrossRef]
- Hannan, M.A.; Hoque, M.M.; Peng, S.E.; Uddin, M.N. Lithium-ion battery charge equalization algorithm for electric vehicle applications. IEEE Trans. Ind. Appl. 2017, 53, 2541–2549. [Google Scholar] [CrossRef]
- Lee, K.M.; Lee, S.W.; Choi, Y.G.; Kang, B. Active balancing of Li-ion battery cells using transformer as energy carrier. IEEE Trans. Ind. Electron. 2016, 64, 1251–1257. [Google Scholar] [CrossRef]
- Lim, C.S.; Lee, K.J.; Ku, N.J.; Hyun, D.S.; Kim, R.Y. A modularized equalization method based on magnetizing energy for a series-connected lithium-ion battery string. IEEE Trans. Power Electron. 2013, 29, 1791–1799. [Google Scholar] [CrossRef]
- Park, Y.H.; Kim, R.Y.; Choi, Y.J. An Active Cascaded Battery Voltage Balancing Circuit Based on Multi-Winding Transformer with Small Magnetizing Inductance. Energies 2021, 14, 1302. [Google Scholar] [CrossRef]
- Ceylan, M.; Balikci, A. An Intermodular Active Balancing Topology for Efficient Operation of High Voltage Battery Packs in Li-Ion Based Energy Storage Systems: Switched (Flying) DC/DC Converter. Energies 2023, 16, 5608. [Google Scholar] [CrossRef]
- Nguyen, N.A.; La, P.H.; Choi, S.J. Coordinated operation algorithm of pack-chargers and cell-equalizers for SOC adjustment in second-life batteries. J. Power Electron. 2022, 22, 105–115. [Google Scholar] [CrossRef]
- Phung, T.H.; Collet, A.; Crebier, J.C. An optimized topology for next-to-next balancing of series-connected lithium-ion cells. IEEE Trans. Power Electron. 2013, 29, 4603–4613. [Google Scholar] [CrossRef]
- Kim, M.Y.; Kim, J.H.; Moon, G.W. Center-cell concentration structure of a cell-to-cell balancing circuit with a reduced number of switches. IEEE Trans. Power Electron. 2013, 29, 5285–5297. [Google Scholar] [CrossRef]
- Farzan Moghaddam, A.; Van den Bossche, A. A Ćuk Converter Cell Balancing Technique by Using Coupled Inductors for Lithium-Based Batteries. Energies 2019, 12, 2881. [Google Scholar] [CrossRef]
- Pascual, C.; Krein, P.T. Switched capacitor system for automatic series battery equalization. In Proceedings of the APEC 97-Applied Power Electronics Conference, Atlanta, GA, USA, 27 February 1997; Volume 2, pp. 848–854. [Google Scholar]
- Alvarez-Diazcomas, A.; Estévez-Bén, A.A.; Rodríguez-Reséndiz, J.; Carrillo-Serrano, R.V.; Álvarez-Alvarado, J.M. A High-Efficiency Capacitor-Based Battery Equalizer for Electric Vehicles. Sensors 2023, 23, 5009. [Google Scholar] [CrossRef] [PubMed]
- Hua, C.C.; Chuang, C.W.; Fang, Y.H. Low-cost switched capacitor charge equaliser with cancellation mechanism of alternating current. IET Power Electron. 2016, 9, 1454–1461. [Google Scholar] [CrossRef]
- Kim, M.Y.; Kim, C.H.; Kim, J.H.; Moon, G.W. A chain structure of switched capacitor for improved cell balancing speed of lithium-ion batteries. IEEE Trans. Ind. Electron. 2013, 61, 3989–3999. [Google Scholar] [CrossRef]
- La, P.H.; Choi, S.J. Direct Cell-to-Cell Equalizer for Series Battery String Using Switch-Matrix Single-Capacitor Equalizer and Optimal Pairing Algorithm. IEEE Trans. Power Electron. 2022, 37, 8625–8639. [Google Scholar] [CrossRef]
- Zeltser, I.; Evzelman, M.; Kuperman, A.; Peretz, M.M. Zero Current Switching Resonant Converter Based Parallel Balancing of Serially Connected Batteries String. IEEE Trans. Ind. Appl. 2019, 55, 7452–7460. [Google Scholar] [CrossRef]
- Liu, L.; Mai, R.; Xu, B.; Sun, W.; Zhou, W.; He, Z. Design of Parallel Resonant Switched-Capacitor Equalizer for Series-Connected Battery Strings. IEEE Trans. Power Electron. 2021, 36, 9160–9169. [Google Scholar] [CrossRef]
- Shang, Y.; Zhang, Q.; Cui, N.; Duan, B.; Zhou, Z.; Zhang, C. Multicell-to-Multicell Equalizers Based on Matrix and Half-Bridge LC Converters for Series-Connected Battery Strings. IEEE J. Emerg. Sel. Top. Power Electron. 2020, 8, 1755–1766. [Google Scholar] [CrossRef]
- Mohan, N.; Robbins, W.P.; Undeland, T.M.; Nilssen, R.; Mo, O. Simulation of power electronic and motion control systems-an overview. Proc. IEEE 1994, 82, 1287–1302. [Google Scholar] [CrossRef]
- Mihalič, F.; Truntič, M.; Hren, A. Hardware-in-the-loop simulations: A historical overview of engineering challenges. Electronics 2022, 11, 2462. [Google Scholar] [CrossRef]
- Hanselmann, H. Hardware-in-the-Loop Simulation as a Standard Approach for Development, Customization, and Production Test; Technical Report, SAE Technical Paper; SAE International: Warrendale, PA, USA, 1993. [Google Scholar]
- Bélanger, J.; Venne, P.; Paquin, J.N. The what, where and why of real-time simulation. Planet Rt 2010, 1, 25–29. [Google Scholar]
- Estrada, L.; Vázquez, N.; Vaquero, J.; de Castro, Á.; Arau, J. Real-time hardware in the loop simulation methodology for power converters using labview FPGA. Energies 2020, 13, 373. [Google Scholar] [CrossRef]
- Montoya, J.; Brandl, R.; Vishwanath, K.; Johnson, J.; Darbali-Zamora, R.; Summers, A.; Hashimoto, J.; Kikusato, H.; Ustun, T.S.; Ninad, N.; et al. Advanced laboratory testing methods using real-time simulation and hardware-in-the-loop techniques: A survey of smart grid international research facility network activities. Energies 2020, 13, 3267. [Google Scholar] [CrossRef]
- Migoni, G.; Romero, M.E.; Bergero, F.; Kofman, E. A mixed modeling approach for efficient simulation of PWM switching mode power supplies. IEEE Trans. Power Electron. 2019, 34, 9758–9767. [Google Scholar] [CrossRef]
- Lee, W.C.; Drury, D. Development of a hardware-in-the-loop simulation system for testing cell balancing circuits. IEEE Trans. Power Electron. 2013, 28, 5949–5959. [Google Scholar] [CrossRef]
- Benigni, A.; Monti, A. A parallel approach to real-time simulation of power electronics systems. IEEE Trans. Power Electron. 2014, 30, 5192–5206. [Google Scholar] [CrossRef]
- Racewicz, S.; Kutt, F.; Sienkiewicz, Ł. Power hardware-in-the-loop approach for autonomous power generation system analysis. Energies 2022, 15, 1720. [Google Scholar] [CrossRef]
- Kumar, P.; Kashyap, Y.; Castelino, R.V.; Karthikeyan, A.; Sharma K, M.; Karmakar, D.; Kosmopoulos, P. Laboratory-Scale Airborne Wind Energy Conversion Emulator Using OPAL-RT Real-Time Simulator. Energies 2023, 16, 6804. [Google Scholar] [CrossRef]
- Li, F.; Wang, Y.; Wu, F.; Huang, Y.; Liu, Y.; Zhang, X.; Ma, M. Review of real-time simulation of power electronics. J. Mod. Power Syst. Clean Energy 2020, 8, 796–808. [Google Scholar] [CrossRef]
- Sidwall, K.; Forsyth, P. A Review of Recent Best Practices in the Development of Real-Time Power System Simulators from a Simulator Manufacturer’s Perspective. Energies 2022, 15, 1111. [Google Scholar] [CrossRef]
- Sobanski, P.; Miskiewicz, M.; Bujak, G.; Szlosek, M.; Oikonomou, N.; Pietilaeinen, K. Real Time Simulation of Power Electronics Medium Voltage DC-Grid Simulator. Energies 2021, 14, 7368. [Google Scholar] [CrossRef]
- Ye, Y.; Cheng, K.W.E.; Fong, Y.C.; Xue, X.; Lin, J. Topology, modeling, and design of switched-capacitor-based cell balancing systems and their balancing exploration. IEEE Trans. Power Electron. 2016, 32, 4444–4454. [Google Scholar] [CrossRef]
- Pillai, P.; Sundaresan, S.; Kumar, P.; Pattipati, K.R.; Balasingam, B. Open-circuit voltage models for battery management systems: A review. Energies 2022, 15, 6803. [Google Scholar] [CrossRef]
- La, P.H.; Choi, S.J. Novel Dynamic Resistance Equalizer for Parallel-Connected Battery Configurations. Energies 2020, 13, 3315. [Google Scholar] [CrossRef]
- Nemeş, R.; Ruba, M.; Raia, R.; Marţiş, C.; Oprea, C. X-in the Loop based high accuracy test facility for industrial development of electric vehicles. IEEE Trans. Transp. Electrif. 2022, 9, 2778–2791. [Google Scholar] [CrossRef]
- Vorpérian, V. Simplified analysis of PWM converters using model of PWM switch. II. Discontinuous conduction mode. IEEE Trans. Aerosp. Electron. Syst. 1990, 26, 497–505. [Google Scholar] [CrossRef]
- Kimball, J.W.; Krein, P.T.; Cahill, K.R. Modeling of capacitor impedance in switching converters. IEEE Power Electron. Lett. 2005, 3, 136–140. [Google Scholar] [CrossRef]
- Ben-Yaakov, S.; Evzelman, M. Generic and unified model of switched capacitor converters. In Proceedings of the 2009 IEEE Energy Conversion Congress and Exposition, San Jose, CA, USA, 20–24 September 2009; pp. 3501–3508. [Google Scholar]
- Plakhtyna, O.; Kutsyk, A.; Semeniuk, M. Real-Time Models of Electromechanical Power Systems, Based on the Method of Average Voltages in Integration Step and Their Computer Application. Energies 2020, 13, 2263. [Google Scholar] [CrossRef]
- Rolak, M.; Twardy, M.; Soból, C. Generalized Average Modeling of a Dual Active Bridge DC-DC Converter with Triple-Phase-Shift Modulation. Energies 2022, 15, 6092. [Google Scholar] [CrossRef]
- Sun, W.; Li, Y.; Liu, L.; Mai, R. A switched-capacitor battery equalization method for improving balancing speed. IET Electr. Power Appl. 2021, 15, 555–569. [Google Scholar] [CrossRef]
- Ye, Y.; Cheng, K.W.E. Modeling and analysis of series–parallel switched-capacitor voltage equalizer for battery/supercapacitor strings. IEEE J. Emerg. Sel. Top. Power Electron. 2015, 3, 977–983. [Google Scholar] [CrossRef]
- Evzelman, M.; Ben-Yaakov, S. Average-current-based conduction losses model of switched capacitor converters. IEEE Trans. Power Electron. 2012, 28, 3341–3352. [Google Scholar] [CrossRef]
- Yang, L.; Wu, B.; Zhang, X.; Smedley, K.; Li, G.P. Dynamic modeling and analysis of constant on time variable frequency one-cycle control for switched-capacitor converters. IEEE Trans. Circuits Syst. Regul. Pap. 2017, 64, 630–641. [Google Scholar] [CrossRef]
- La, P.H.; Choi, S.J. Synthesis of balancing topologies for parallel-connected battery cells by principle of duality. In Proceedings of the 2019 10th International Conference on Power Electronics and ECCE Asia (ICPE 2019-ECCE Asia), Busan, Republic of Korea, 27–30 May 2019; pp. 1455–1459. [Google Scholar]


| Topology | SI-E | SC-E | SR-E | SMC-E |
|---|---|---|---|---|
| Circuit Parameters | kHz | kHz | kHz | kHz |
| µH | µF | µF | µF | |
| µH | ||||
| Initial SOC | ||||
Disclaimer/Publisher’s Note: The statements, opinions and data contained in all publications are solely those of the individual author(s) and contributor(s) and not of MDPI and/or the editor(s). MDPI and/or the editor(s) disclaim responsibility for any injury to people or property resulting from any ideas, methods, instructions or products referred to in the content. |
© 2024 by the authors. Licensee MDPI, Basel, Switzerland. This article is an open access article distributed under the terms and conditions of the Creative Commons Attribution (CC BY) license (https://creativecommons.org/licenses/by/4.0/).
Share and Cite
La, P.-H.; Nguyen, N.-A.; Choi, S.-J. Average Model of Switched-Energy-Tank Battery Equalizer for Accelerated Performance Assessment. Energies 2024, 17, 631. https://doi.org/10.3390/en17030631
La P-H, Nguyen N-A, Choi S-J. Average Model of Switched-Energy-Tank Battery Equalizer for Accelerated Performance Assessment. Energies. 2024; 17(3):631. https://doi.org/10.3390/en17030631
Chicago/Turabian StyleLa, Phuong-Ha, Nguyen-Anh Nguyen, and Sung-Jin Choi. 2024. "Average Model of Switched-Energy-Tank Battery Equalizer for Accelerated Performance Assessment" Energies 17, no. 3: 631. https://doi.org/10.3390/en17030631