Article

Anti-Freezing Study of High-Level Water-Collecting Natural Draft Wet-Cooling Tower Based on Its Water Temperature Distribution Characteristics

1
Jining Huayuan Thermal Power Co., Ltd., Jining 272113, China
2
Ji’nan Lanchen Energy Technology Co., Jinan 250101, China
3
School of Energy and Power Engineering, Shandong University, Jinan 250061, China
*
Author to whom correspondence should be addressed.
Energies 2024, 17(3), 651; https://doi.org/10.3390/en17030651
Submission received: 7 December 2023 / Revised: 5 January 2024 / Accepted: 15 January 2024 / Published: 30 January 2024
(This article belongs to the Special Issue Energy- and Water-Saving Advances in Cooling Systems)

Abstract

:
Thermal power units play a crucial role in the deep peak regulation of power generation. During deep peak regulation, the load of the unit changes significantly, causing fluctuations in the inlet water temperature of the cooling tower and the water temperature in the filler. Therefore, in cold regions in winter, cooling towers have a high risk of freezing, which threatens the economic and safe operation of the unit. This paper establishes a three-dimensional numerical model based on constant heat dissipation and explores the average and minimum water temperatures at the bottom of filler under different water distribution methods, crosswind velocities, and ambient temperatures. The results show that the water distribution method has a significant impact on the water temperature at the filler bottom. Reducing the water distribution area can significantly increase the minimum water temperature at the filler bottom and reduce the risk of freezing. Although the presence of crosswind is not conducive to the cooling performance of the cooling tower, the higher the crosswind velocity, the higher the minimum outlet water temperature at the filler bottom and the lower the risk of freezing. The minimum water temperature at the filler bottom is approximately linearly related to the ambient temperature and is less affected by the unit load at the same temperature.

1. Introduction

In the background of “carbon peaking and carbon neutrality goals”, the proportion of renewable energy power generation, such as wind power, hydropower, and photoelectricity, is increasing. However, renewable energy power generation is greatly affected by the natural environment and has random instability, which cannot meet the needs of the deep peak regulation of the power system [1]. Therefore, traditional thermal power plants play a pillar role in deep peak regulation in the power grid due to their advantages of stable output and rapid response [2].
During the deep peak regulation process, the thermal unit is in a low-load operating state, the turbine exhaust temperature is low, and the water temperature entering the cold-end system also decreases [3]. However, the air temperatures in this region are often as low as −20 °C in winter, and there is a great need for a cooling tower to conduct anti-freezing protection. If the thermal units are under a deep regulation process at this time, the risk of freezing could be very high. At the air inlet of the cooling tower, a large amount of ice gradually forms a wall of ice, which reduces the air ventilation and results in the cooling efficiency decreasing. Moreover, water droplets iced in the filler lead to an increase in filler weight, resulting in damage to the tower structure and cooling system failure [4]. Therefore, it is necessary to investigate the anti-freezing characteristics of the cooling tower.
The fin heat exchanger bundles of the natural draft dry-cooling tower are made of aluminum, with the thickness of tube walls only being approximately 1 mm. Consequently, the requirements for frost prevention in natural draft dry-cooling units are relatively high. Zhao et al. [5] concluded that ambient crosswinds would increase the imbalanced temperature difference in the cooling deltas using a three-dimensional numerical model, further elevating the risk of freezing under low-temperature conditions for natural draft dry-cooling towers. Goudarzi et al. [6,7] found that crosswinds have a significant impact on the performance of indirect cooling towers, reducing their heat exchange efficiency by 35% to 40%. PREEZ et al. [8] suggested that the design of the placement of radiators and windbreak walls can effectively improve the adverse effects of environmental crosswinds on the heat exchange performance of cooling towers. Li et al. [9] found that the icing of cooling columns under crosswind conditions is mainly caused by an uneven distribution of cooling air and evaluated the influence of the outlet water temperature distribution on the anti-freezing performance of a natural draft dry-cooling tower under typical operating conditions. Ma et al. [10] proposed a coupled calculation model for indirect cooling towers and condensers, which can be used for predicting the performance of units under crosswinds. The conclusions also provide a theoretical basis for determining the critical anti-freezing water temperature and critical ventilation volume for frost prevention in wet-cooling towers.
For the wet-cooling tower, there are conventional Natural Draft Wet-Cooling Towers (NDWCTs) and High-level Water Collecting Natural Draft Wet-Cooling Towers (HNDWCTs). However, anti-freezing research has focused more on conventional wet-cooling towers and there is a lack of studies on HNDWCTs. Derken et al. [11] pointed out that crosswind significantly affects the aerodynamic field inside and outside the tower through wind tunnel experiments on a scaled model of a mechanical ventilation counterflow tower. Particularly, an increase of 45% in the windward inflow and a decrease of 19% in the leeward inflow were observed. This uneven inflow was identified as the main cause of ice formation in wet-cooling towers. Based on wind tunnel tests in ref. [11], Bender et al. [12] proposed the installation of wind deflectors upstream of the inlet in cooling towers, aiming to regulate the airflow rates, and then they conducted numerical simulations to delve deeper into this proposal [13]. Zhao et al. [14] indicated that under crosswind conditions, lateral ventilation is generated, which enhances heat and mass transfer in the rain zone but reduces the longitudinal ventilation of the cooling tower. The extent of the reduction varies with crosswind speed. Matteo et al. [15,16] investigated the defrost cycles of a heat pump using dynamic simulation and evaluated the influence of frost on the performance of units.
Due to the difference in structure, the heat and mass transfer are different between NDWCTs and HNDWCTs. Compared to conventional NDWCTs, HNDWCTs have a special part called the water-collecting device, which consists of an inclined plate, baffle plate, and water-collecting tank. The inclined plate connects the bottom of the filler and the water-collecting tank, thus forming a wall that acts like a windbreak wall. Therefore, the aerodynamic field in HNDWCTs is not axisymmetric [17]. In addition, the heat transfer in high rainfall accounts for 3.2–3.5% of the total heat load [18], which is lower than that in conventional NDWCTs. The reason is that the distance between the filler bottom and the circulating water point becomes shorter [19]. Furthermore, the height of the air inlet in HNDWCTs is higher than that in conventional NDWCTs, which means the air ventilation is greater than that in NDWCTs, causing better cooling performance [20] and a higher risk of freezing in winter. Therefore, it is necessary to carry out an anti-freezing investigation of HNDWCTs.
The existing research on numerical simulations of wet-cooling towers can be divided into two categories: theoretical analysis and numerical simulation. In the early studies on cooling towers, researchers widely used one-dimensional heat and mass transfer models for tower design and performance analysis. The main theories include the Merkel theory [21,22], the e-NTU theory [23], and the Poppe theory [24]. However, one-dimensional models typically assume that the circulation of water and air is uniformly consistent within the same cross-section, and the heat and mass transfer coefficients in the rain zone are empirical values, leading to obvious calculation errors [25,26]. Majumdar et al. [27,28] argued that one-dimensional models have limitations in analyzing the performance of cooling towers and proposed a mathematical model, which assumes the flow of air is two-dimensional and the flow of water is one-dimensional. Compared to one-dimensional models, two-dimensional models can consider the radial variation of air and water. Williamson et al. [29] further extended the two-dimensional model to the outside domain of the tower, thus exploring the effects of environmental conditions, windward height, and filler height on the radial heat and mass transfer performance of wet-cooling towers.
However, two-dimensional models assume that the airflow inside the tower exhibits axially symmetrical distribution, which makes it unable to consider the influence of external crosswind. With the maturity of computer technology and numerical simulation software, the development of three-dimensional numerical models for wet-cooling towers has emerged. Al-Waked [30] established a three-dimensional numerical model for a natural draft counterflow wet-cooling tower and investigated the impact of crosswind on tower performance. Subsequent developments in numerical simulation of wet-cooling towers entered the stage of three-dimensional models [25,26].
Nevertheless, previous studies using three-dimensional numerical simulations have set the inlet water temperature of wet-cooling towers as a constant value [31,32,33]. For example, Al-Wake et al. [34] specified an inlet water temperature of 42.15 °C when exploring the enhanced efficiency of a cross-wall in wet-cooling towers. For actual operating units, the unit load continuously fluctuates, while the cooling capacity of the cooling system remains constant. Therefore, the inlet water temperature of wet-cooling towers fluctuates with the random unit load. Numerical simulation results based on a constant inlet water temperature will have certain deviations from actual conditions. In real operating conditions, the heat dissipation of the cooling tower is constant. Using a numerical simulation method with a constant heat dissipation is obviously more accurate in simulating the outlet water temperature.
In past research, the study of anti-freezing for wet-cooling towers has mainly focused on conventional wet-cooling towers, while research on the anti-freezing mechanism of HNDWCTs is relatively scarce, especially under extreme weather conditions and low-load operation. Therefore, this paper uses a constant heat dissipation method to simulate the anti-freezing characteristics of an HNDWCT under different ambient temperatures, crosswind speeds, unit loads, and water distribution methods, which provides theoretical guidance for the operation of HNDWCTs.

2. Models and Methods
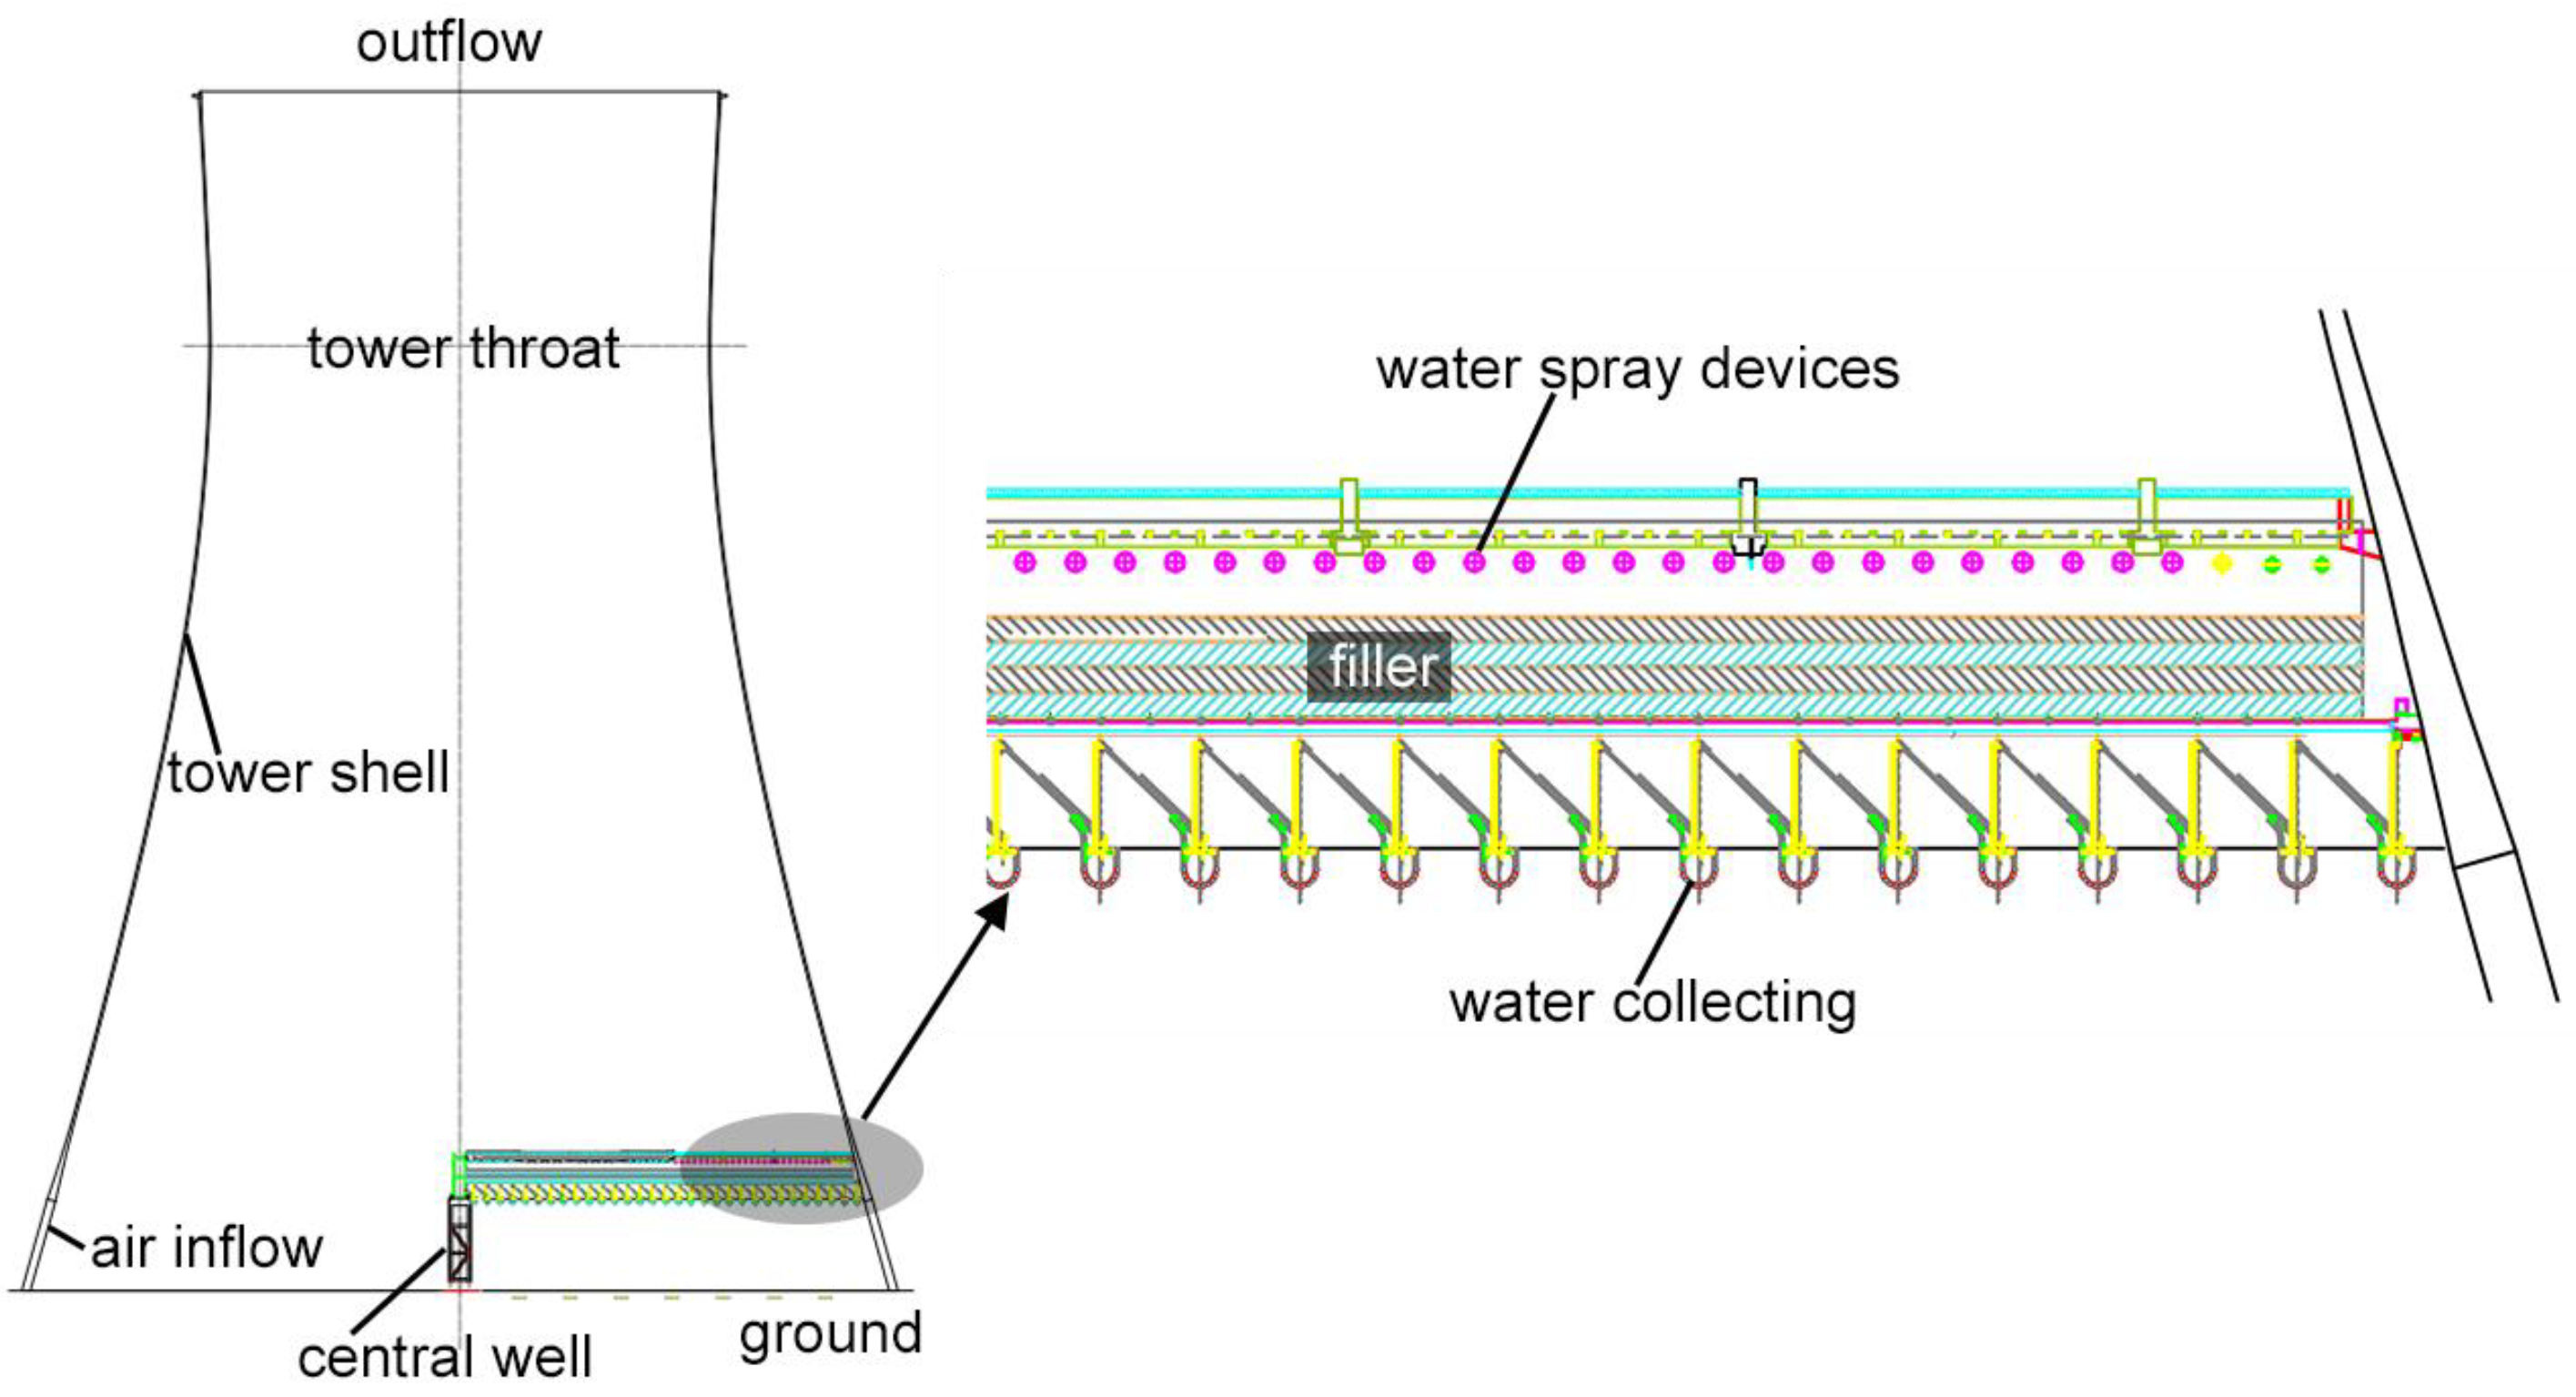
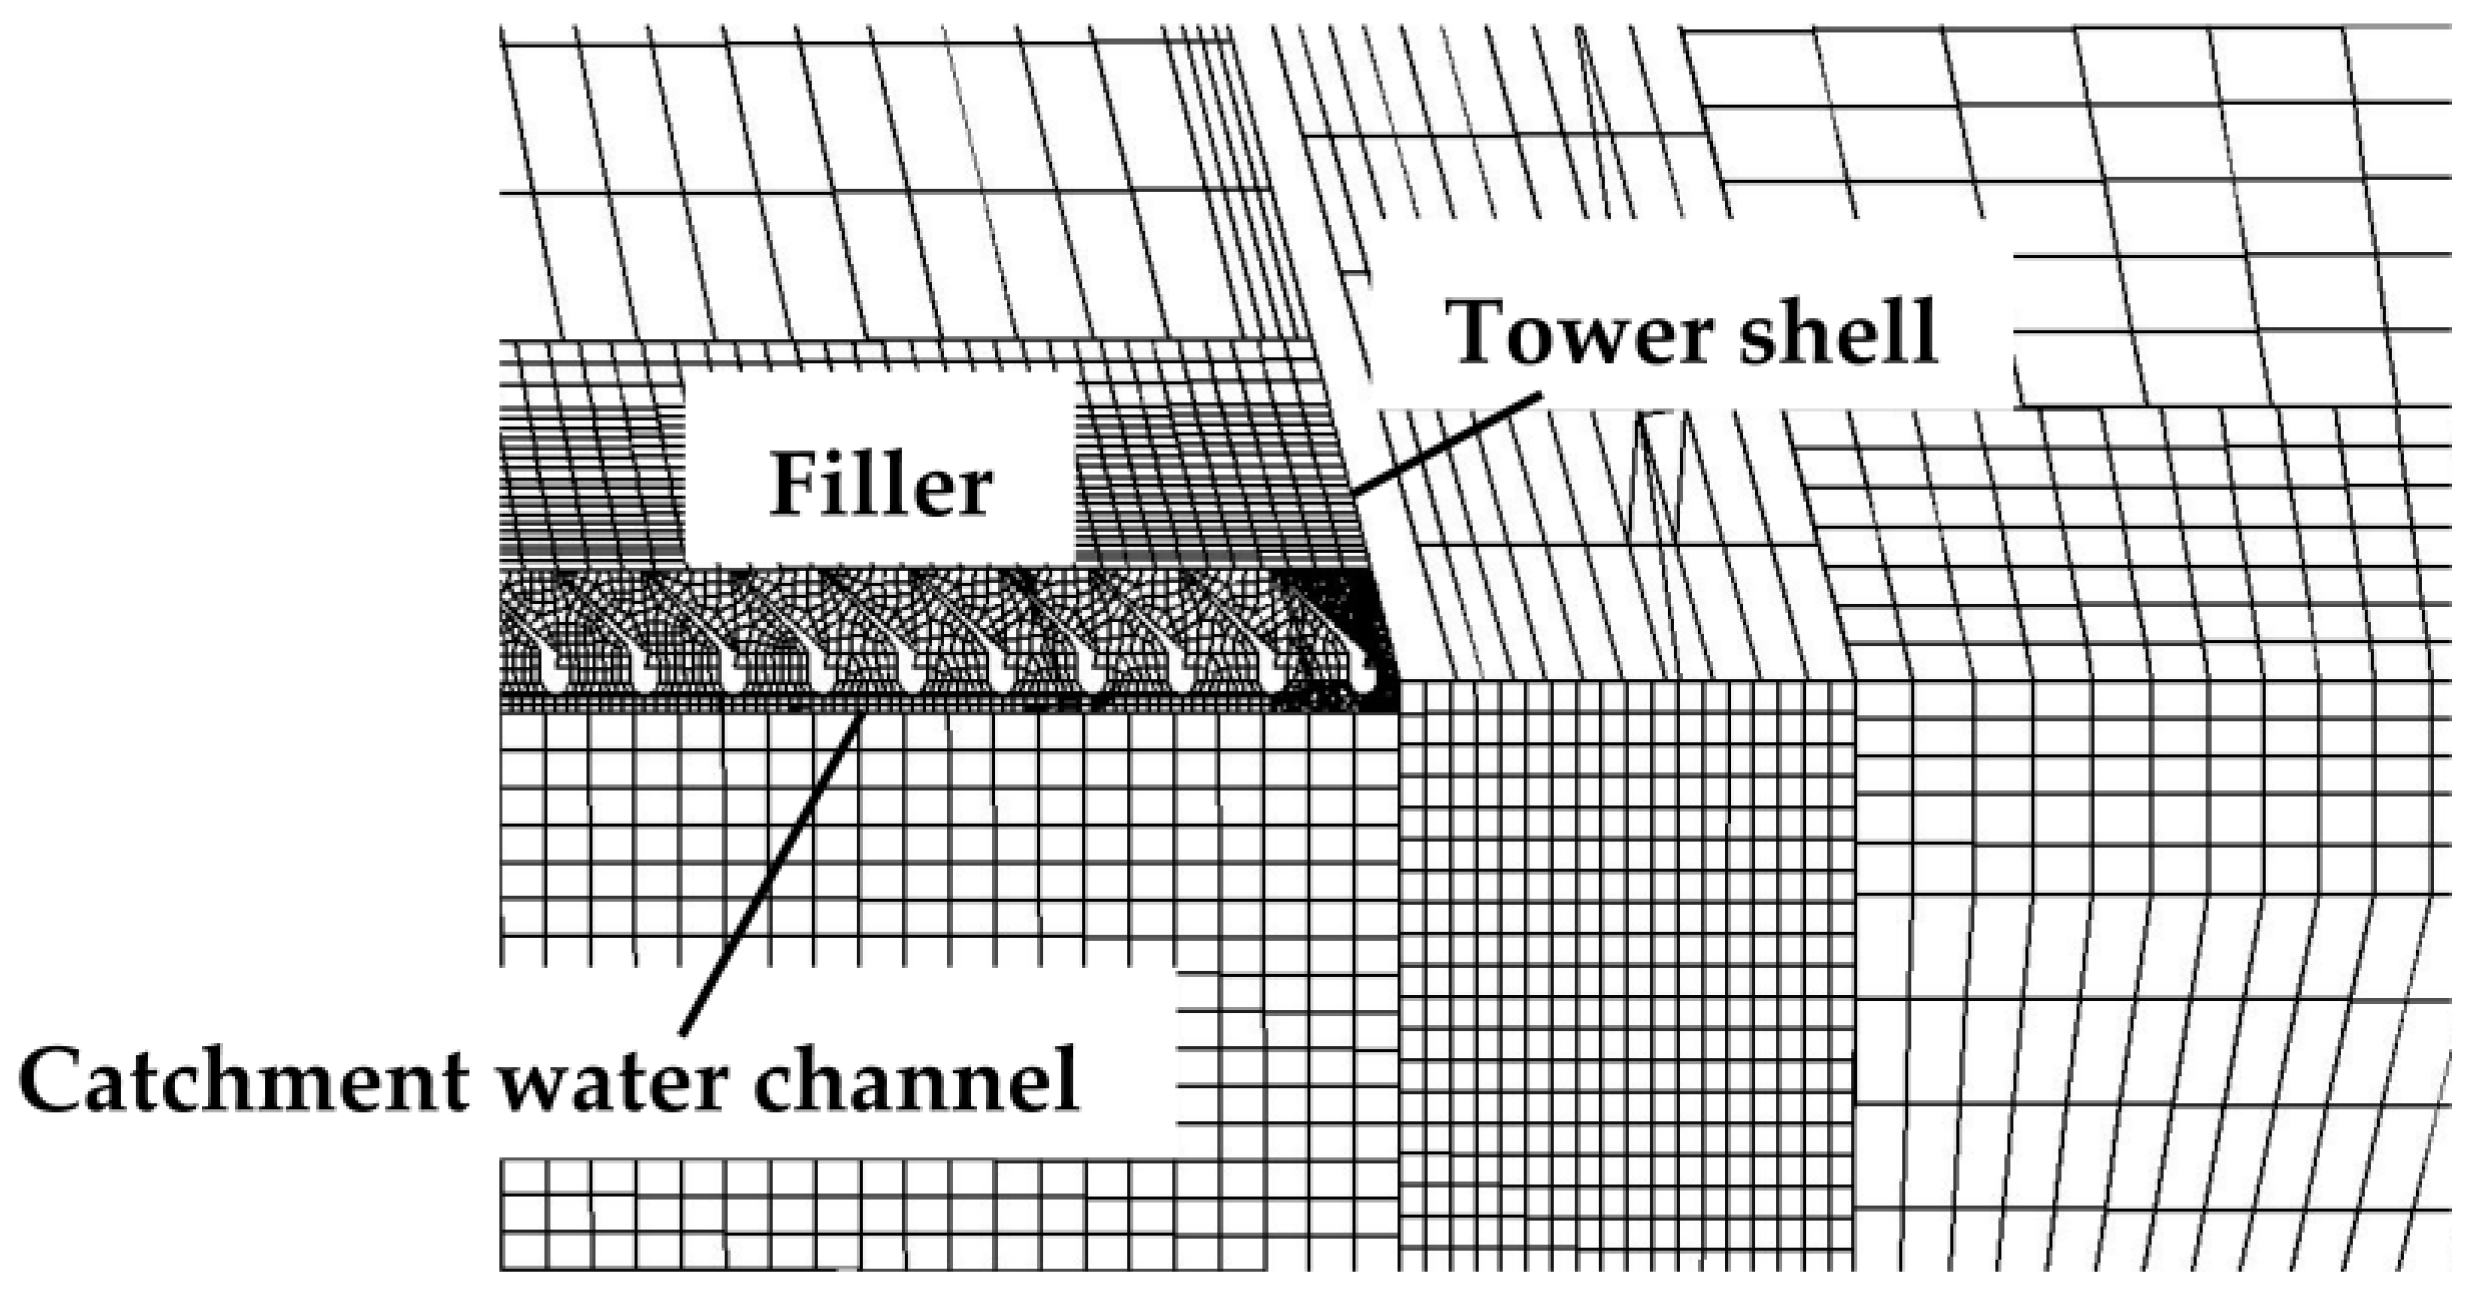
2.1. Geometry Model

This paper studies a 2 × 350 MW HNDWCT in a thermal power plant, as can be seen in Figure 1. The height of the HNDWCT is 158.22 m, the throat elevation is 126.58 m, the filler top elevation is 18.05 m, and the filler top radius is 55.07 m. The filler area uses an S-wave-shaped filler with a pitch of 30 mm and a height of 1.50 m. The water distribution method is pipe distribution with a water-spraying density of 0.98 kg/(m2·s).
A 1:1 geometric model of the cooling tower was established based on the structural parameters mentioned above. The computational domain was set as a cylindrical space with a radius of 700 m and a height of 1000 m to ensure sufficient development of the inflow at the computational domain boundary [16]. Considering the kilometer-scale size of the computational domain and the thin thickness (1.5 m) of the filler region, a multi-scale grid division was applied to address the large span of grid sizes. The primary heat and mass transfer regions, including the filler, water-collecting channel, spray zone, rain zone, etc., were refined, while the grid sizes for the tower shell and the external tower environment were relatively larger, as illustrated in Figure 2.
Three sets of grid systems were established with grid numbers of 2.8 million, 3.5 million, and 4.3 million. Grid independence validation was conducted based on field-test data, where the environmental conditions were a temperature of 4 °C, 30% relative humidity, atmospheric pressure of 102 kPa, circulating water flow rate of 34,344 m3/h, wind speed of 0.4 m/s, inlet water temperature of 21.60 °C, and outlet water temperature of 14.36 °C. The results for the three grid systems are presented in Table 1.
From Table 1, it can be observed that the outlet water temperature from the three grid systems deviates by 0.18 °C, 0.16 °C, and 0.16 °C, respectively, compared to the field-test outlet water temperature. To ensure a balance between computational accuracy and efficiency, the grid system with 3.5 million grid cells was selected for the final numerical simulation.

2.2. Numerical Model

2.2.1. Governing Equations

The airflow around the cooling tower, operating with constant parameters, can be described using the steady Reynolds Averaged Navier–Stokes equations, as shown in Equation (1).
ρ μ φ Γ φ φ = S φ i + S φ
Here, ρ is the air density, kg/m3; φ represents a generic variable: in the continuity equation, it is 1; in the momentum equation, it corresponds to the air velocity components ( u x , u y , and u z ); in the energy equation, it stands for air temperature (T); and in the component equation, it denotes the mass fraction of water. Γ φ and S φ i are the diffusion coefficients and internal sources associated with the generic variable φ , respectively. The source term S φ accounts for the influence of the liquid phase on the gas phase in the momentum, energy, and component equations.
In the simulation of raindrops falling, raindrops are commonly considered rigid spheres. The continuous phase (air) uses the Eulerian coordinate system, while particles adopt the Lagrangian coordinate system. Heat, mass, and momentum exchanges between particles and the continuous phase are accounted for by examining the difference in quantities of particles entering and exiting computational cells, automatically integrated by the software. The governing equations for raindrops are illustrated in Equation (2).
u ω , z z = ρ w ρ g ρ w u w , z F z m w u w , z
where u ω , z is the vertical falling velocity of the raindrop, m/s. ρ w and m w are the density (kg/m3) and quality of the water (kg). F z is the interaction force between the air and the raindrop in the vertical direction.
The heat transfer in the filler can be described using Equation (3).
s m = K f x x
where K f is the mass transfer coefficient obtained by experiments, kg/(m3·s). x and x represent the humidity ratio of saturated moist air and moist air, respectively. Besides, the water with temperature lower than 0 °C was assumed to be supercooled water, so the impact of water freezing could be neglected during this research.
The convective heat transfer coefficient for a single raindrop is calculated using FLUENT’s built-in Nu number correlation as shown by Equation (4):
N u = K h d p k = 2.0 + 0.6 R e d 1 2 P r 1 3
where p is the water droplet diameter in meters, m. K h is the heat transfer coefficient of air, W/(m2·K). K is the thermal conductivity of air, W/(m·K). R e is the Reynolds number calculated using the water droplet diameter and the relative velocity between the two phases, and P r is the Prandtl number of the continuous phase.
In this research, absolute humidity–actual vapor pressure is used as the humidity indicator. Firstly, the saturated vapor pressure ( e s ) is calculated using Equations (5) or (6), and then the actual vapor pressure ( e a ) is computed using Equation (7) [35]:
e s = 6.112 exp T a × 17.67 / ( T a + 243.5 )   ( T a < 0 )
e s = 6.11 exp 17.27 × T a + 243.5 273.16 ) / ( T a + 273.15 35.86 )   ( T a > 0 )
e a = e s × ( R H / 100 )
where T a is the air temperature, °C. R H is the relative humidity, %.
The wet bulb temperature T w is obtained using Equation (8) [36]:
e a = e w 0.00066 ( 1 + 0.00115 T w ) ( T a T w ) P
where P is the standard atmospheric pressure at sea level (101.325 kPa), and e w   represents the saturated vapor pressure calculated from the wet bulb temperature T w , kPa.

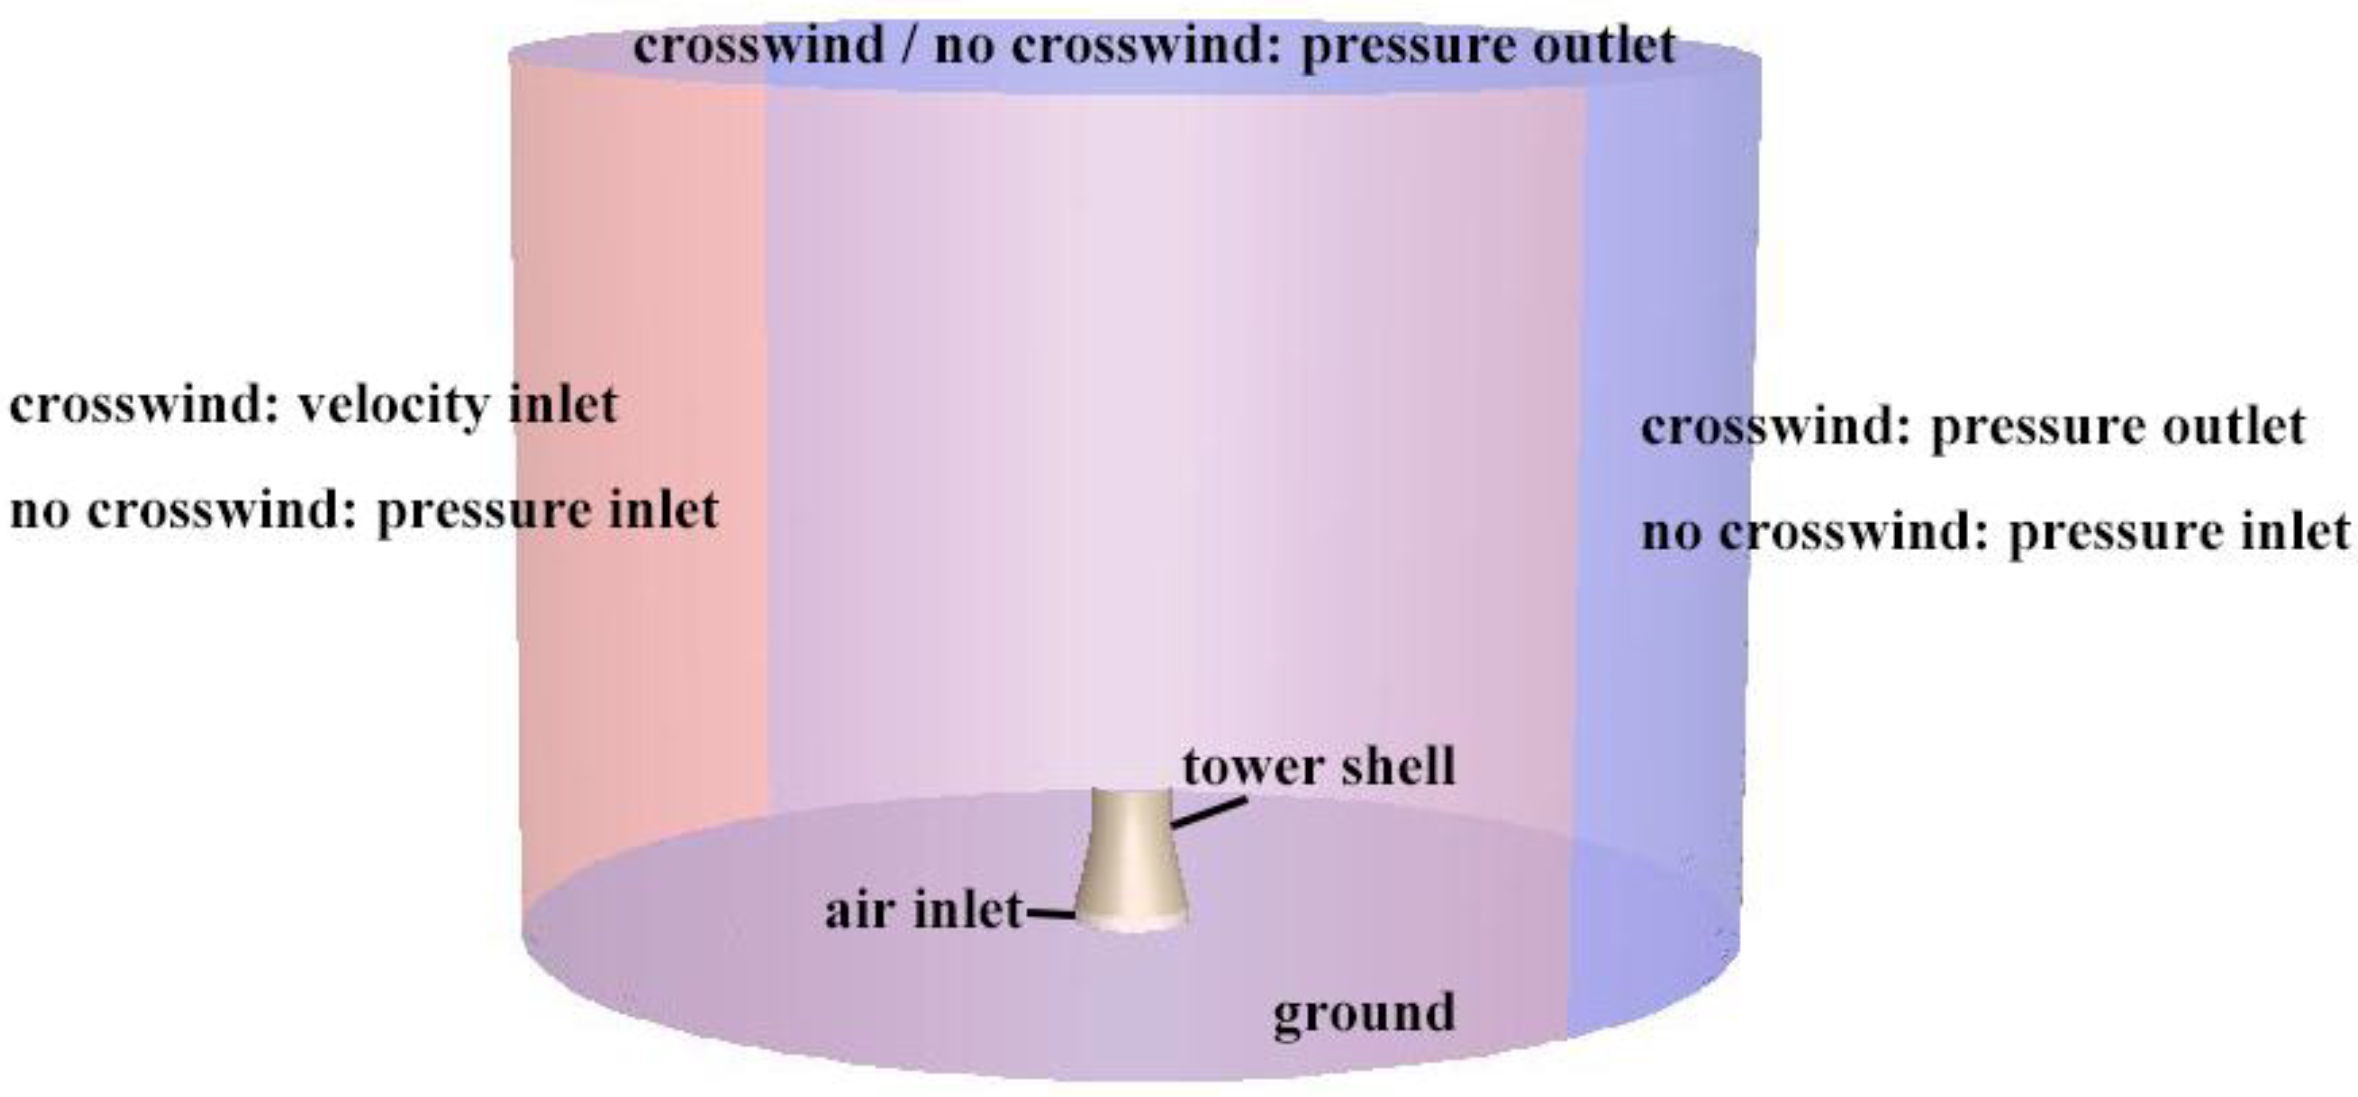
2.2.2. Boundary Conditions

In the absence of crosswind, the computational domain’s side surface is considered a pressure inlet and the top surface is considered a pressure outlet. When there is a crosswind, the windward side of the cylinder is set as a velocity inlet, the leeward side as a pressure outlet, and the top surface as a pressure outlet, as shown in Figure 3. A non-slip boundary is applied to surfaces like the ground, water surface in the pool, tower walls, etc.
The three-dimensional numerical model for the wet-cooling tower uses the finite volume method to discretize the governing equations. The convective term uses a second-order upwind scheme, while the diffusion term employs a central difference scheme. The pressure interpolation is handled using Body Force weighted, and the coupling of pressure and velocity is solved using SIMPLE. Convergence in the iterative calculations is assumed when the variation in the outlet water temperature of the cooling tower within 200 iterations is less than 0.01 °C.

2.2.3. Numerical Model Validation

Two operating conditions (C1 and C2) are chosen to validate the established 3D numerical model; the original data of C1 are from the design instructions of the unit and the original data of C2 are from the field test. A wide range of measure points, including the ambient temperature, ambient humidity, ambient pressure, crosswind velocity, circulating water flow rate, outlet water temperature, and inlet water temperature are installed in and around the cooling tower. Validation is performed under the operating conditions of C1 and C2 to obtain the results of the outlet water temperature. If the values of the outlet water temperature calculated by numerical simulation are in accordance with that measured in design or field test operating conditions, the numerical model is validated to be accurate.
The parameters and computed results for each operating condition are presented in Table 2. From Table 2, it can be observed that the absolute errors between the calculated values and test/design values for the C1 and C2 conditions are 0.14 °C and 0.16 °C, respectively. This demonstrates that the established three-dimensional numerical model for the cooling tower accurately describes the heat and mass transfer processes inside the cooling tower.

3. Results and Discussion

For operational units, the inlet water temperature fluctuates with the random load of the unit. For a specific unit, the cooling capacity of the cold-end equipment is fixed. Therefore, this study adopts the constant heat dissipation method to numerically simulate the cooling tower under winter conditions. Typically, due to the uneven water distribution in the cooling tower, the water density in the peripheral area of the filler is smaller, making the filler area the most prone to freezing. Hence, this study will focus on the variation of key surface feature temperatures such as the average water temperature at the filler bottom, the minimum water temperature at the filler bottom, etc., under different unit loads, ambient temperatures, and wind speeds.

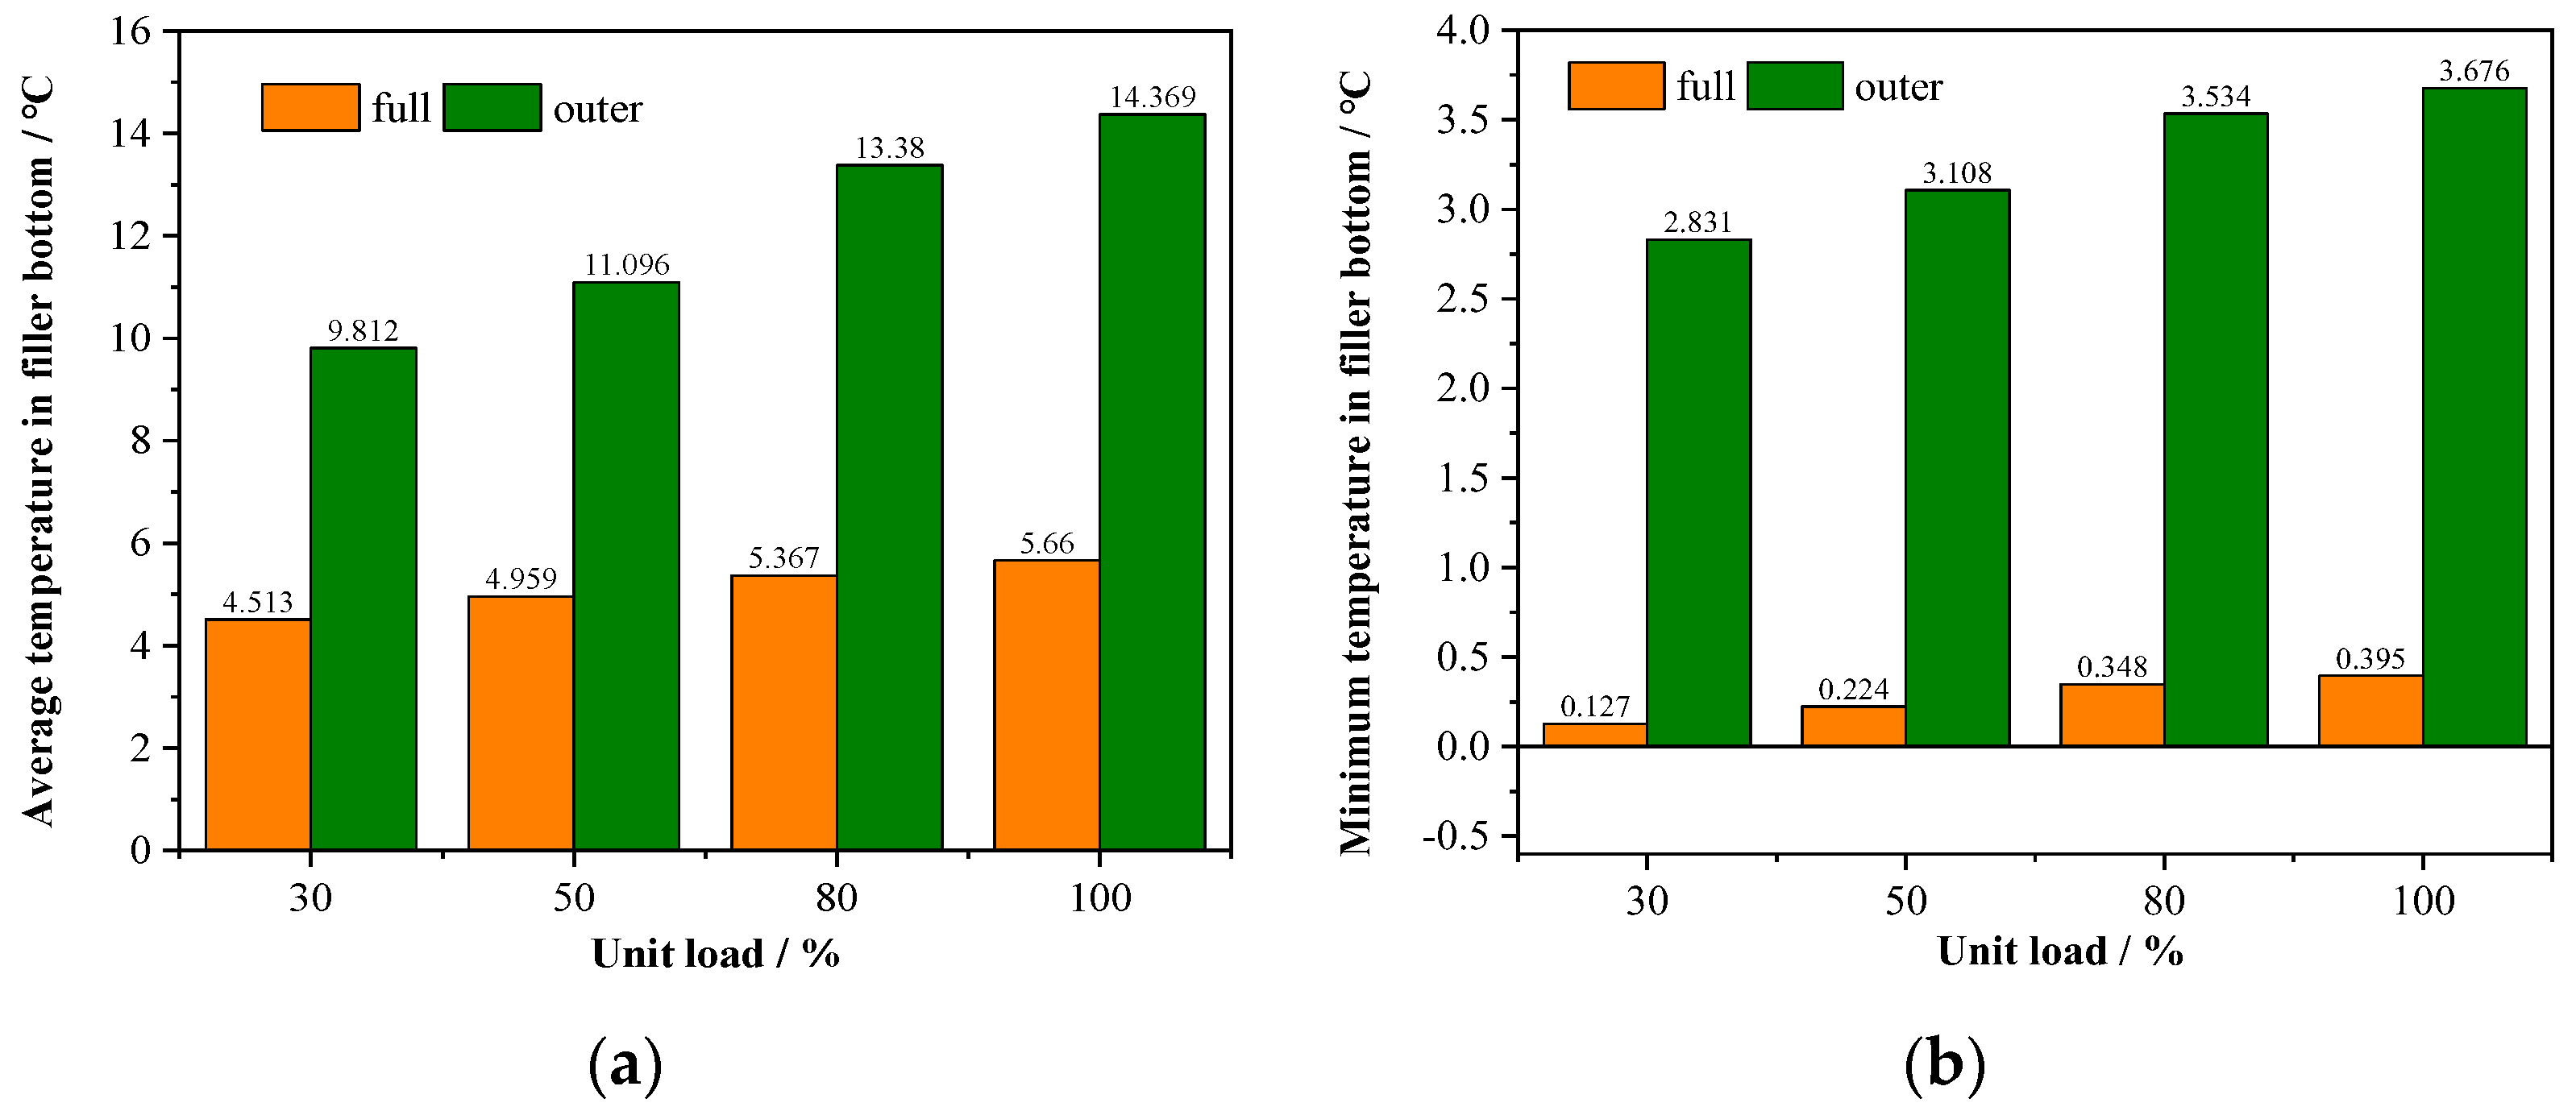
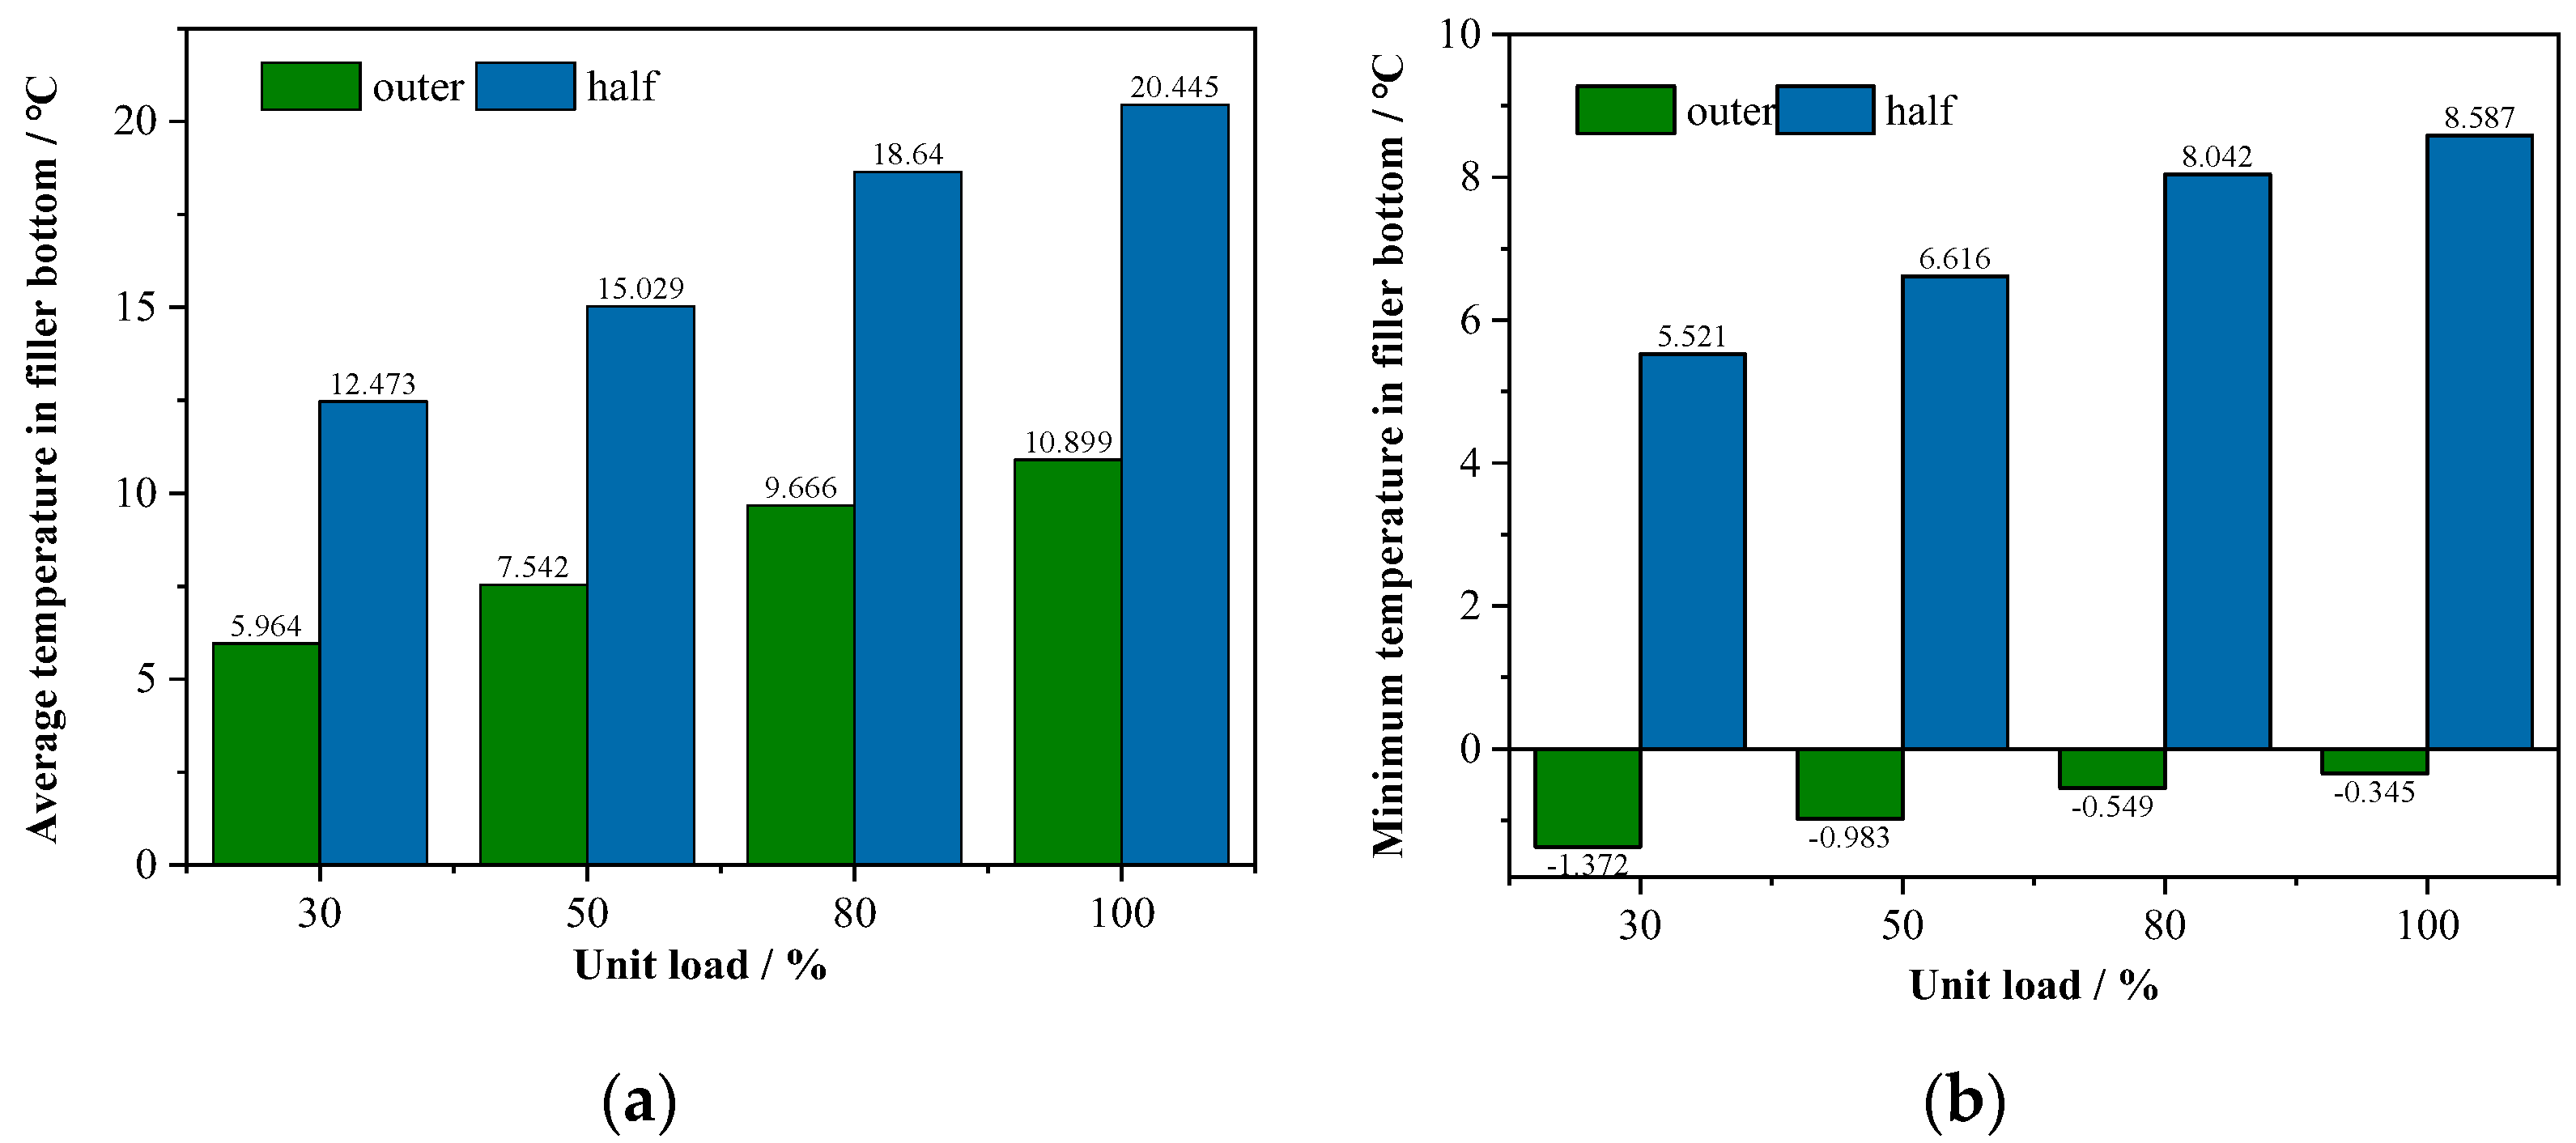
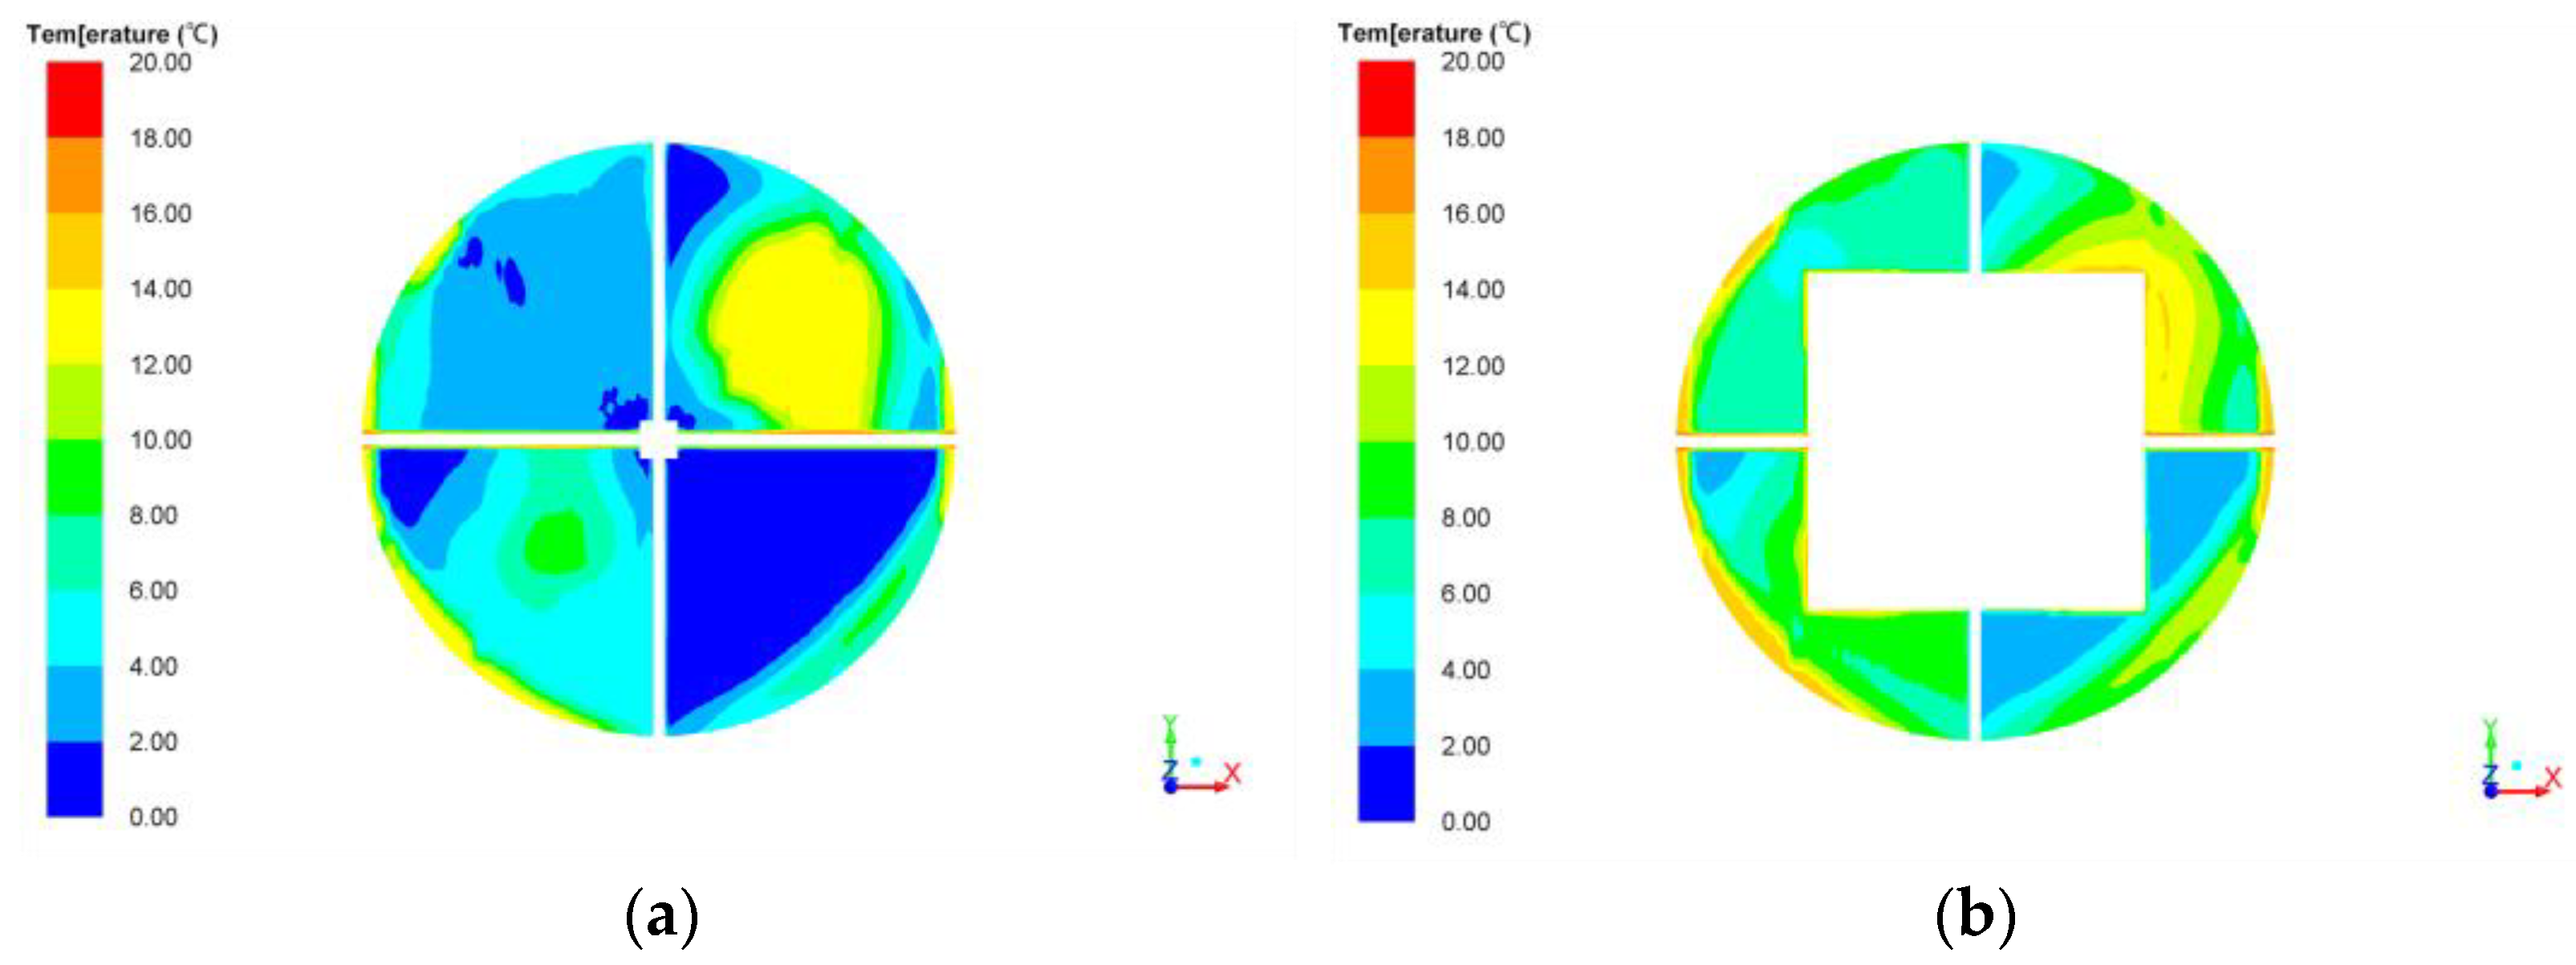
3.1. Comparison under Different Water Distribution Modes

Cooling tower full-tower water distribution refers to the uniform distribution of cooling water throughout the entire filler area. When the wet cooling tower is operating under winter conditions, the wet cooling tower is often changed to a zone water distribution for anti-freezing purposes, including outer-ring water distribution and half-outer-ring water distribution. Compared with full-tower water distribution, the outer-ring water distribution has a higher sprinkling density and lower effective ventilation, which results in an increase in the outlet water temperature of the cooling tower.
Figure 4a shows the comparison of the average water temperature at the filler bottom in full-tower water distribution and outer-ring water distribution modes when the ambient temperature is 0 °C, the ambient wind speed is 3.5 m/s, and the relative humidity is 65%. Under constant unit load and environmental conditions, switching the cooling tower from full-tower water distribution to outer-ring water distribution will cause a significant increase in the average water temperature at the filler bottom. Under each load, the average water temperature is almost twice that of full-tower water distribution. For example, when the unit is running at 100% load, switching the unit from full water distribution to outer-ring water distribution can increase the average outlet water temperature at the filler bottom by 8.709 °C; when the water distribution mode is fixed, whether it is full-tower water distribution or outer-ring water distribution, the average water temperature at the filler bottom increases with the increase in unit load, but the increase is only 1–2 °C. The same regulation can be obtained from the comparison of outer-ring water distribution and half-outer-ring water distribution under −5 °C in Figure 5a. This implies that changing the water distribution mode has a far greater effect on the outlet water temperature of the cooling tower than regulating the unit load. In harsh winters, to avoid the cooling tower from icing, the zone water distribution mode should be employed.
Figure 4b and Figure 5b compare the changes in the minimum water temperature at the filler bottom with different water distribution modes. As shown in Figure 5b, when the ambient temperature is 0 °C, if the cooling tower adopts full-tower water distribution, the local minimum water temperature will approach 0 °C under various loads, posing a risk of freezing, as shown in Figure 6. The lower the unit load, the lower the minimum water temperature. When the water distribution mode is switched to outer-ring water distribution, the minimum water temperature at the filler bottom increases by 6.9~8.9 °C, and the increasing magnitude increases with the increase in the unit load.
As the ambient temperature drops further to −5 °C, the outer-ring water distribution can no longer meet the anti-freezing requirements, and the local minimum water temperature is below 0 °C under various loads. When the water distribution mode is switched to half-outer-ring water distribution, as shown in Figure 7, the freezing phenomenon disappears, and the minimum water temperature at the filler bottom increases by 6.9~8.9 °C. Therefore, switching the water distribution mode is an effective anti-freezing measure for cooling tower operation in winter. However, the average temperature at the filler bottom continues to rise as the water distribution area decreases. When the temperature drop in the rain area is certain, the outlet water temperature of the cooling tower rises. Therefore, excessively reducing the water distribution area is not conducive to the cooling performance of the cooling tower.

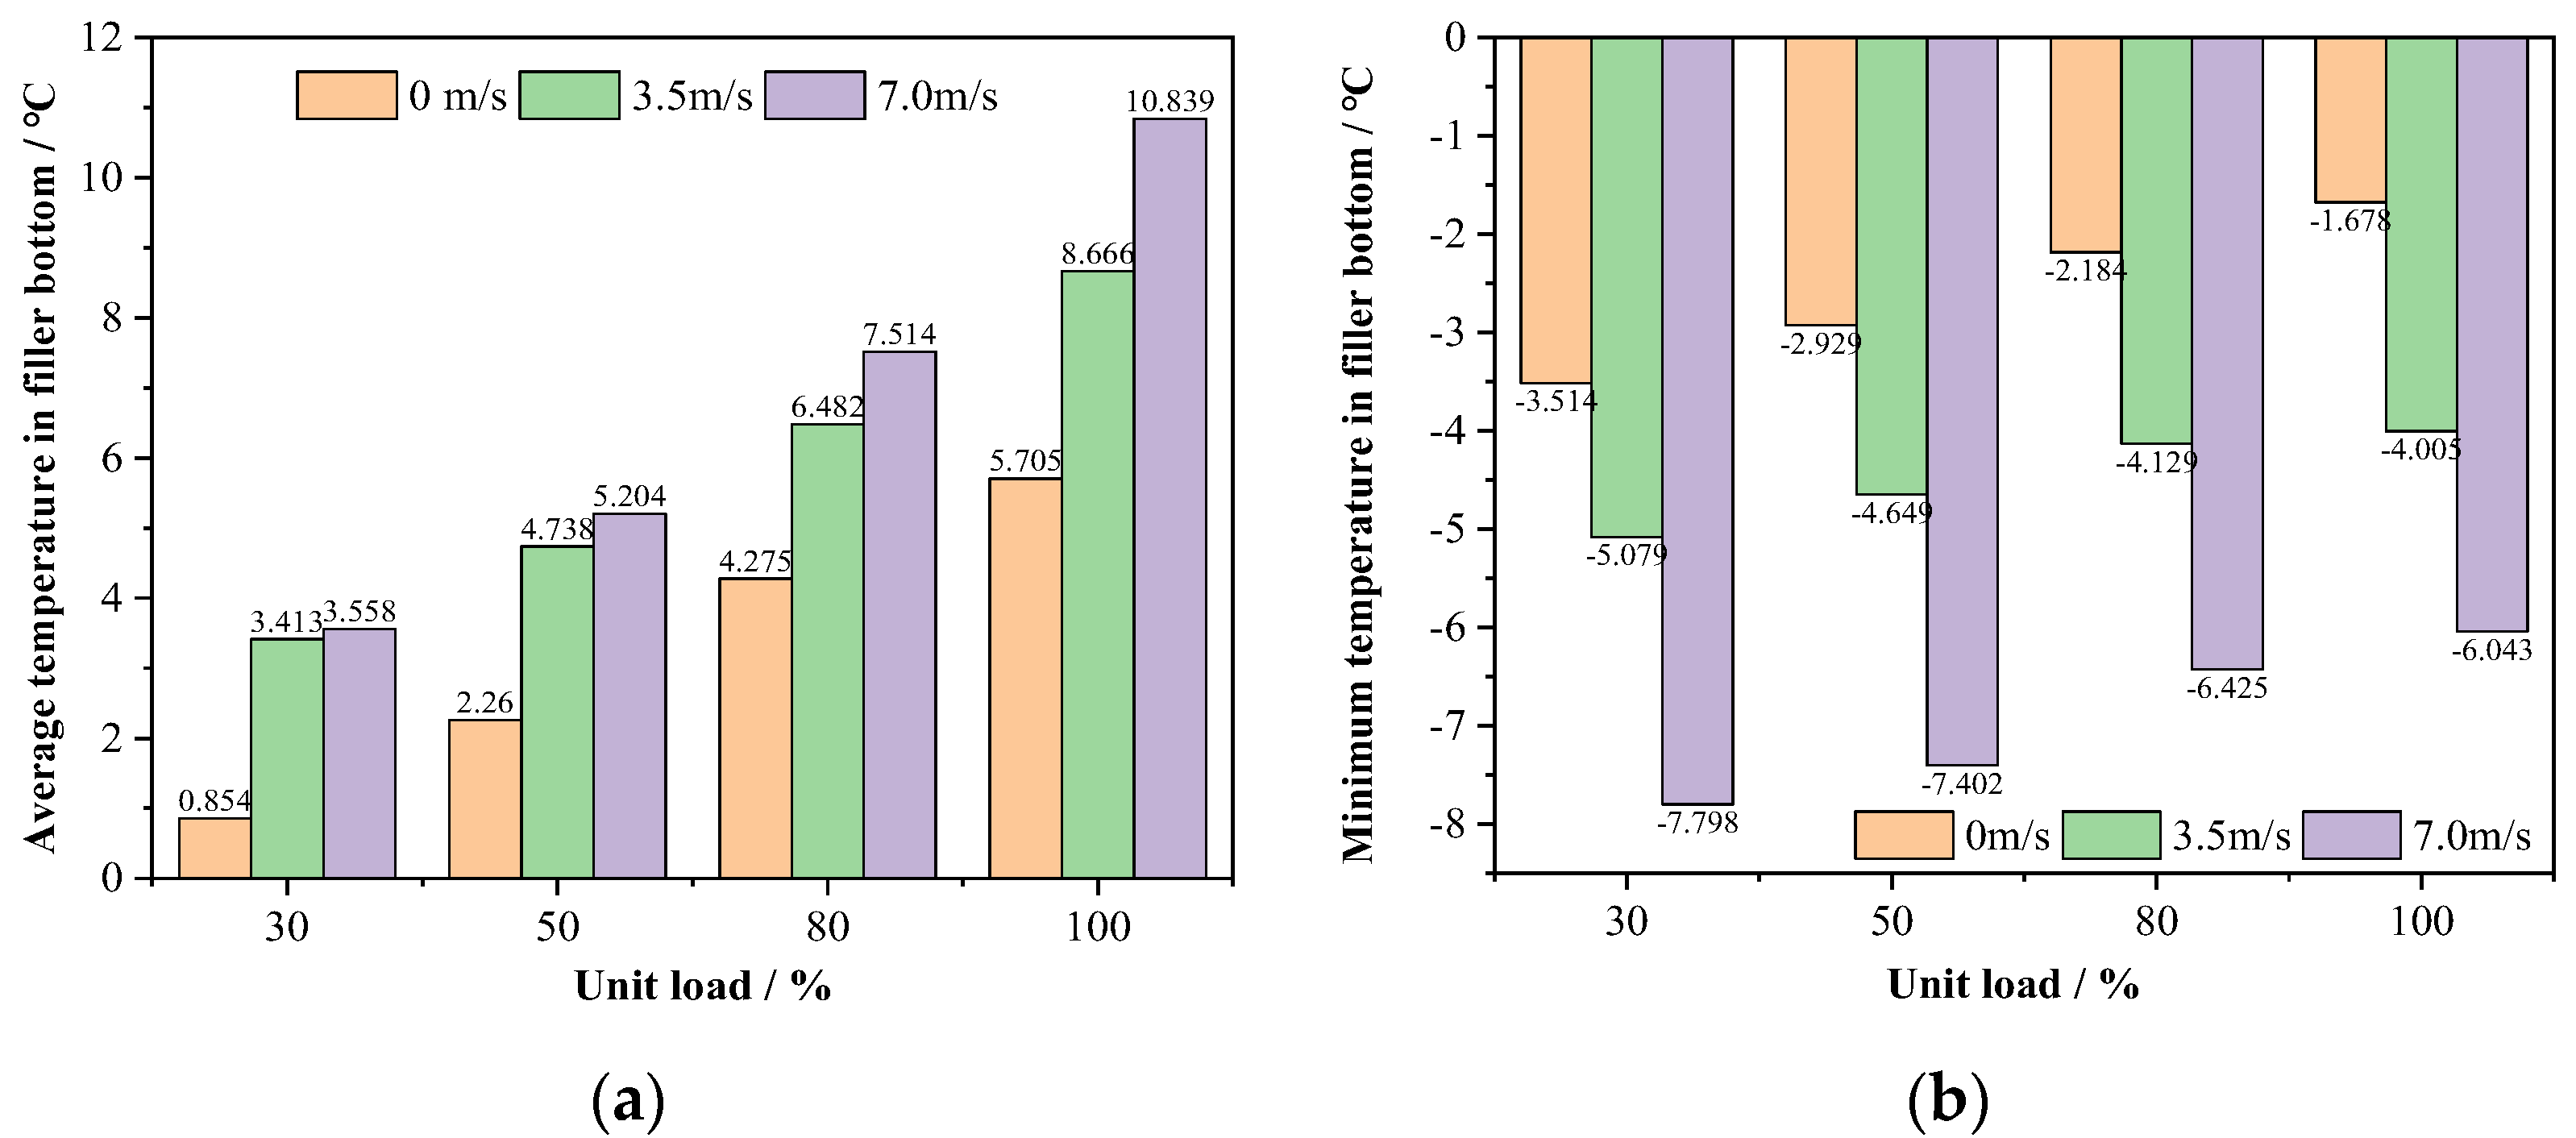
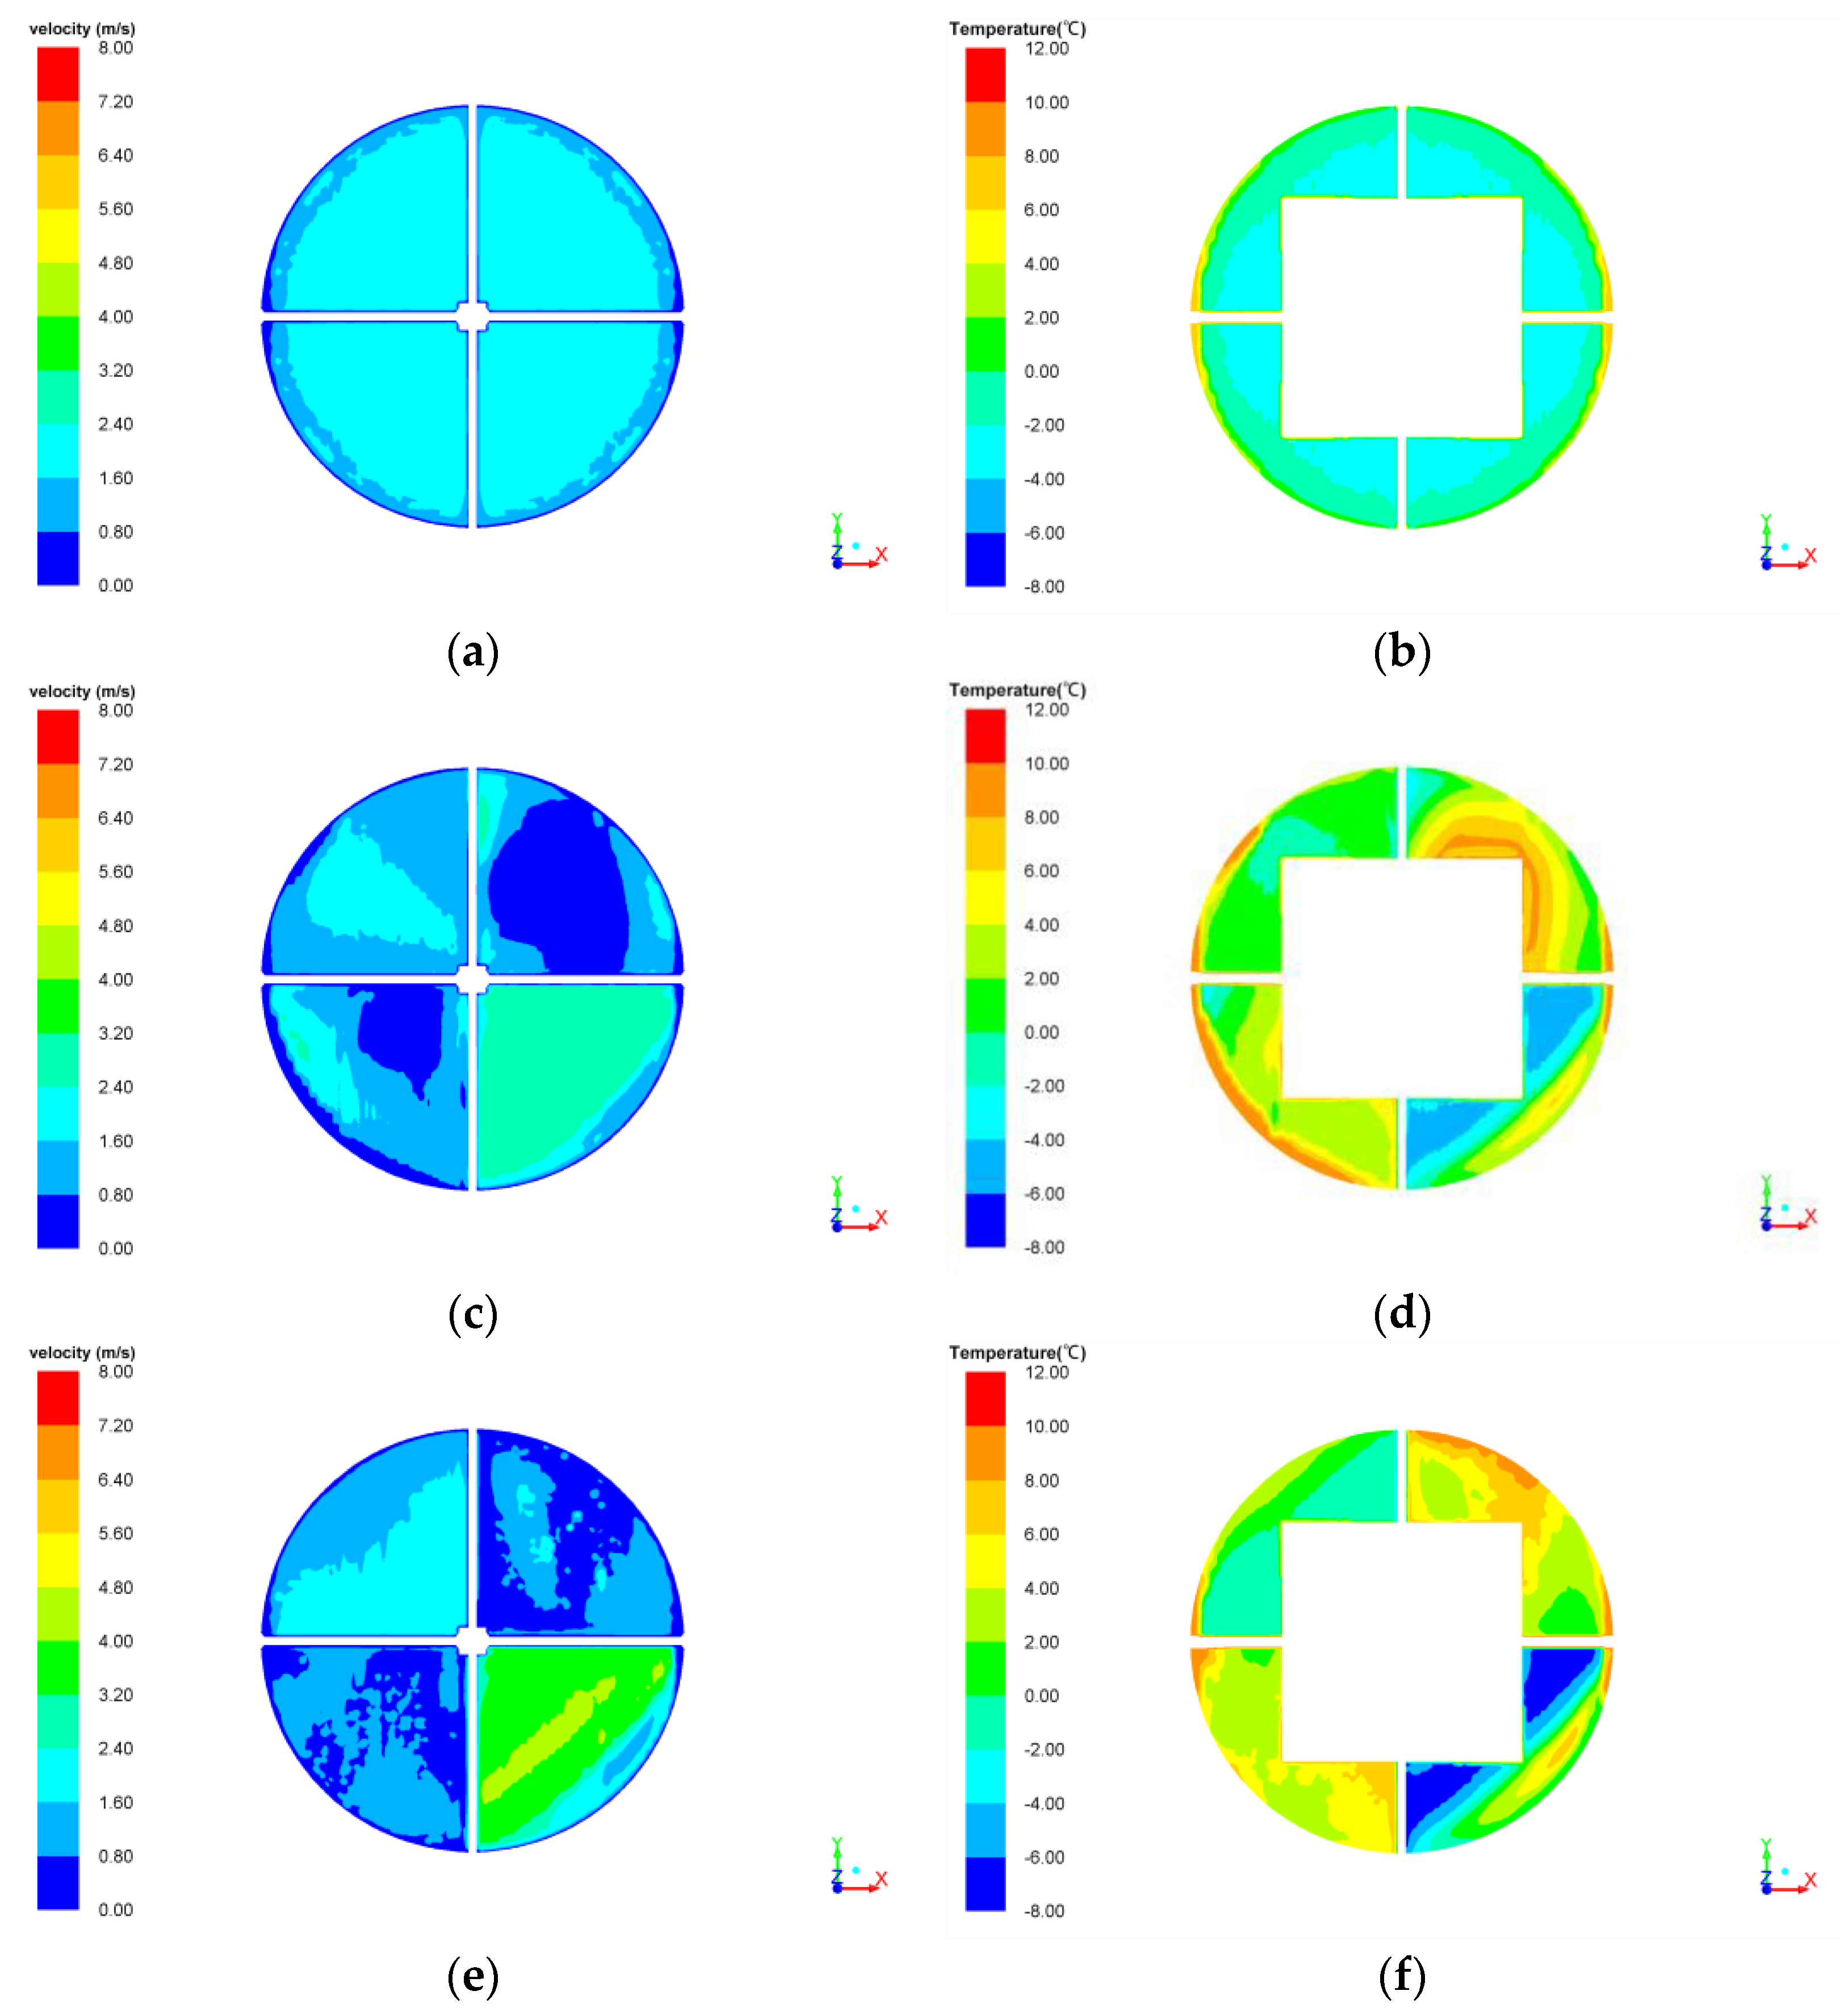
3.2. Comparison under Different Crosswind Velocities

Figure 8 shows the average and minimum water temperatures at the filler bottom under different unit loads when the ambient temperature is −10 °C and the relative humidity is 65%, at ambient wind speeds of 0 m/s, 3.5 m/s, and 7 m/s. It can be seen from the figure that the average water temperature at the filler bottom increases with the increase in the ambient crosswind velocity when the unit load is constant. This is because the crosswind causes an uneven distribution of the air flow field around the cooling tower, as shown in the wind speed distribution contours at the filler bottom in Figure 9a,c,e. When the ambient wind speed is 0 m/s, the cooling tower has a uniform inlet air flow, so the cooling performance is best; when the ambient wind speed is 3.5 m/s and 7.0 m/s, the ambient wind blows from the +x−y direction, the wind speed in the windward side filler increases significantly while the inlet air flow on the tower side drops sharply, and there are areas with wind speeds close to 0 in the +x+y and −x−y regions, indicating that low-speed vortices are formed there, resulting in the deterioration of the cooling tower performance and the increase in the average water temperature at the filler bottom.
However, the minimum water temperature at the bottom of the filler continues to decrease with the increase in the wind speed. As can be seen from Figure 9b,d,f, the minimum water temperature always occurs in the windward side +x−y region, because the wind speed in this region increases, leading to an increase in the heat transfer from the air, so the water temperature is lower than other areas of the filler.

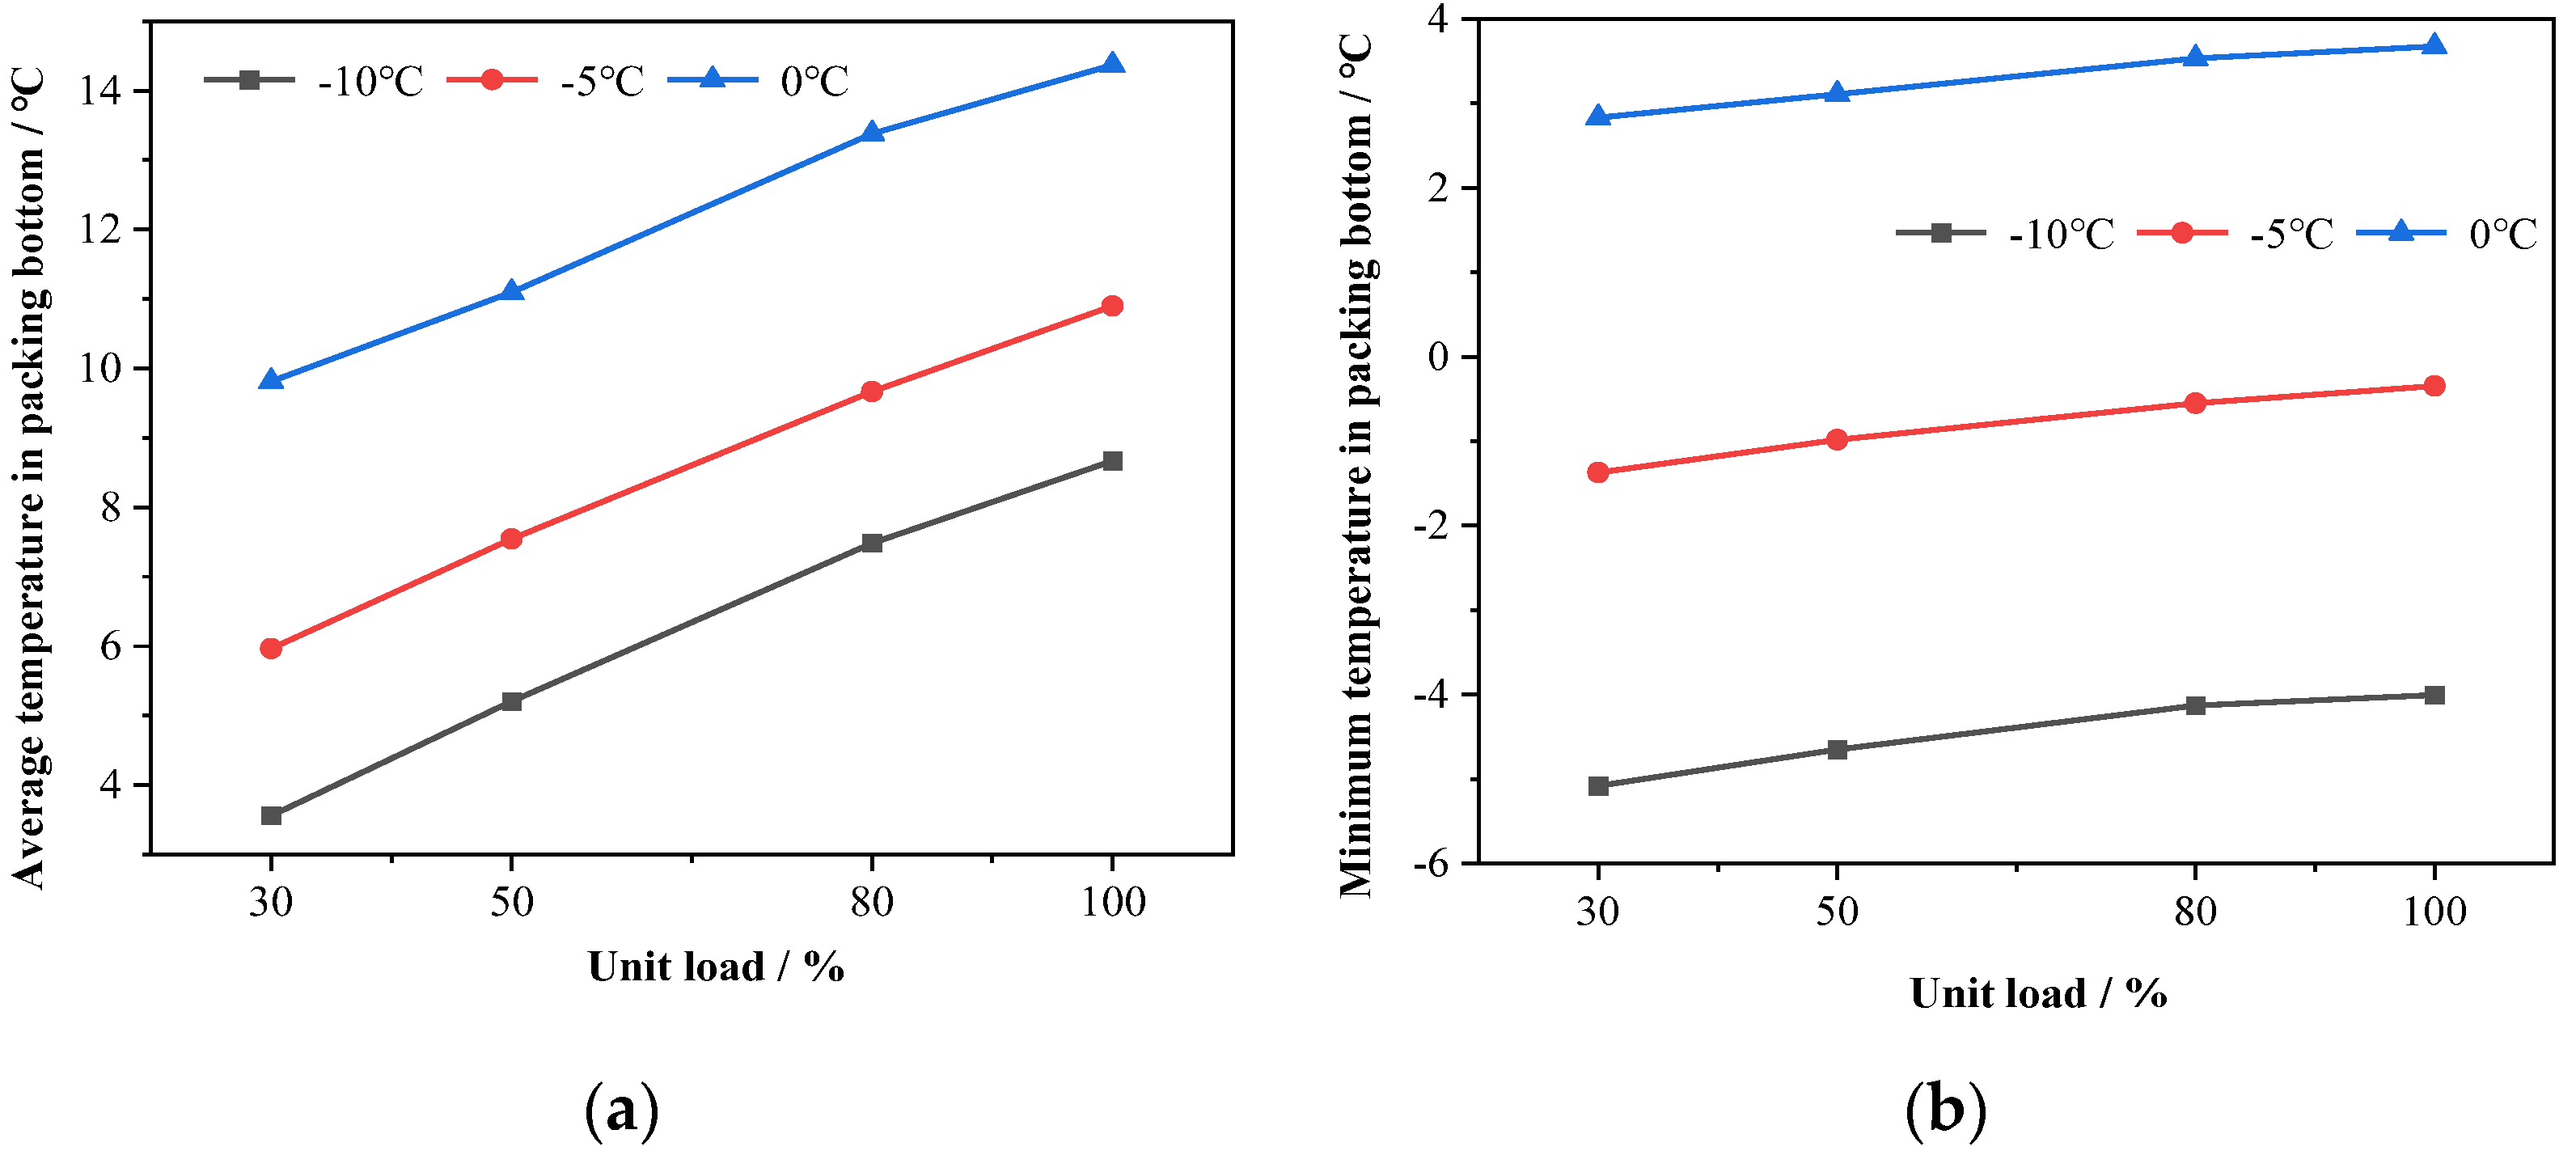
3.3. Comparison under Different Ambient Temperatures

Figure 10a shows the variation of the average water temperature at the bottom of the filler with the unit load and ambient temperature when the environmental wind speed is 3.5 m/s and the relative humidity is 65%. It can be observed that when the unit load is constant, the average water temperature at the filler bottom decreases with the decrease in the ambient temperature, and the decrease is relatively regular: under the same unit load, for every 5 °C decrease in ambient temperature, the average water temperature at the filler bottom decreases by 3~4 °C. When the ambient temperature is constant, the average water temperature at the filler bottom increases with the increase in the unit load, which is approximately linearly related: when the ambient temperature is relatively high (0 °C), with the increase in the unit load, the average water temperature at the filler bottom will increase by 2.5~4.5 °C; when the ambient temperature is relatively low (−10 °C), with the increase in the unit load, the average water temperature at the filler bottom will increase by 3.5~5 °C. This indicates that the lower the ambient temperature, the greater the change in the average water temperature at the filler bottom caused by the temperature change.
Figure 10b shows the variation of the minimum water temperature at the bottom of the cooling tower filler with the unit load and ambient temperature when the environmental wind speed is 3.5 m/s and the relative humidity is 65%. It can be seen that when the load of the unit remains constant, the minimum temperature at the filler bottom decreases linearly with the decrease in ambient temperature. Specifically, for every 5 °C decrease in ambient temperature, the range of decrease in the minimum temperature at the filler bottom remains at 4 °C. When the ambient temperature is constant, the minimum temperature at the bottom of the root increases with the increase in unit load, but the increase is approximately within 1 °C. This indicates that the impact of changes in ambient temperature on the minimum temperature at the bottom layer of the filler is far greater than the impact of changes in unit load at the same temperature.

4. Conclusions

This paper, based on the background of water temperature fluctuations in thermal power units during deep peak regulation, establishes a three-dimensional numerical simulation for cooling towers based on constant water heat dissipation under severe cold conditions. The conclusions are as follows:
The water distribution method has a significant impact on the average and minimum temperatures at the filler bottom. At the same temperature, compared to full-tower water distribution, using outer-ring water distribution can increase the minimum temperature at the filler bottom by 6.9~8.9 °C, and using half of the outer ring water distribution can increase the minimum temperature at the filler bottom by 4.1~8.2 °C compared to the outer-ring water distribution. The impact gradually increases with the increase in unit load; therefore, switching the water distribution method is an effective anti-freezing measure but is not conducive to the cooling performance of the cooling tower.
Environmental conditions also affect the freezing characteristics of cooling towers. With the increase in environmental wind speed, the average temperature at the filler bottom increases because the crosswind causes vortexes in the tower, reducing the cooling performance of the cooling tower. However, the minimum temperature at the filler bottom decreases with the increase in crosswind velocity because the crosswind increases the local wind speed and the local heat dissipation. For every 5 °C decrease in ambient temperature, the average temperature at the filler bottom can decrease by 3~4 °C under different unit loads, but the minimum temperature at the filler bottom fluctuates slightly by only 0~1 °C.

Author Contributions

Conceptualization, Z.W. and Z.Y.; methodology, W.W.; software, C.M. and C.G.; validation, X.L.; formal analysis, Z.W.; investigation, W.W.; resources, W.W. and Z.Y.; data curation, X.L. and C.G.; writing—original draft preparation, Z.W.; writing—review and editing, Y.Z.; visualization, X.L. and C.M.; supervision, Y.Z.; project administration, Z.W. and Y.Z.; funding acquisition, Y.Z. All authors have read and agreed to the published version of the manuscript.

Funding

This research received funding from both the Sci-Tech Project of China Huaneng Group Co., Ltd. Grant number HNKJ22-HF107 and the the Innovation Capability Enhancement Project for Shandong Province Small Technology-based Firms (2022TSGC1026).

Data Availability Statement

All results data are displayed in the document.

Conflicts of Interest

Authors Zhonghua Wang, Zenggang Yue, Wei Wang, Chenghui Ma, was employed by the company Jining Huayuan Thermal Power Co., Ltd. Authors Xiaoguang Li, Changmin Guo were employed by the company Ji’nan Lanchen Energy Technology Co. The remaining authors declare that the research was conducted in the absence of any commercial or financial relationships that could be construed as a potential conflict of interest.

References

  1. Lausterer, G.K. Improved Maneuverability of Power Plants for Better Grid Stability. Control Eng. Pract. 1998, 6, 1549–1557. [Google Scholar] [CrossRef]
  2. Xin, S.; Wang, H.; Li, J.; Wang, G.; Wang, Q.; Cao, P.; Zhang, P.; Lu, X. Discussion on the Feasibility of Deep Peak Regulation for Ultra-Supercritical Circulating Fluidized Bed Boiler. Energies 2022, 15, 7720. [Google Scholar] [CrossRef]
  3. Lu, H.; Huang, S.; Li, H.; Cheng, Z.; Chang, X.; Dong, L.; Kong, D.; Jing, X. Numerical Simulation of Combustion Characteristics in a 660 MW Tangentially Fired Pulverized Coal Boiler Subjected to Peak-Load Regulation. Case Stud. Therm. Eng. 2023, 49, 103168. [Google Scholar] [CrossRef]
  4. Ezhov, V.; Zakharov, A.; Ezhova, T.; Kravchenko, S.; Amelin, V. Features of Calculation Technique of the Cooling Tower in the Winter Period Taking into Account the Desigh of the Head Wall. IOP Conf. Ser. Mater. Sci. Eng. 2020, 1001, 012066. [Google Scholar] [CrossRef]
  5. Zhao, Y.; Sun, F.; Long, G.; Huang, X.; Huang, W.; Lyv, D. Comparative Study on the Cooling Characteristics of High Level Water Collecting Natural Draft Wet Cooling Tower and the Usual Cooling Tower. Energy Convers. Manag. 2016, 116, 150–164. [Google Scholar] [CrossRef]
  6. Goodarzi, M.; Keimanesh, R. Numerical Analysis on Overall Performance of Savonius Turbines Adjacent to a Natural Draft Cooling Tower. Energy Convers. Manag. 2015, 99, 41–49. [Google Scholar] [CrossRef]
  7. Goudarzi, M.A. Proposing a New Technique to Enhance Thermal Performance and Reduce Structural Design Wind Loads for Natural Drought Cooling Towers. Energy 2013, 62, 164–172. [Google Scholar] [CrossRef]
  8. Du Preez, A.F.; Kröger, D.G. The Effect of the Heat Exchanger Arrangement and Wind-Break Walls on the Performance of Natural Draft Dry-Cooling Towers Subjected to Cross-Winds. J. Wind. Eng. Ind. Aerodyn. 1995, 58, 293–303. [Google Scholar] [CrossRef]
  9. Li, W.; Wang, H.; Wang, J.; Duan, C.; Zhao, Y. Effect Mechanism of Exit-Water Temperature Distribution Characteristics on the Anti-Freezing of Natural Draft Dry Cooling Tower. Appl. Therm. Eng. 2019, 161, 114078. [Google Scholar] [CrossRef]
  10. Ma, H.; Si, F.; Li, L.; Yan, W.; Zhu, K. Effects of Ambient Temperature and Crosswind on Thermo-Flow Performance of the Tower under Energy Balance of the Indirect Dry Cooling System. Appl. Therm. Eng. 2015, 78, 90–100. [Google Scholar] [CrossRef]
  11. Derksen, D.D.; Bender, T.J.; Bergstrom, D.J.; Rezkallah, K.S. A Study on the Effects of Wind on the Air Intake Flow Rate of a Cooling Tower: Part 1. Wind Tunnel Study. J. Wind. Eng. Ind. Aerodyn. 1996, 64, 47–59. [Google Scholar] [CrossRef]
  12. Bender, T.J.; Bergstrom, D.J.; Rezkallah, K.S. A Study on the Effects of Wind on the Air Intake Flow Rate of a Cooling Tower: Part 2. Wind Wall Study. J. Wind. Eng. Ind. Aerodyn. 1996, 64, 61–72. [Google Scholar] [CrossRef]
  13. Bender, T.J.; Bergstrom, D.J.; Rezkallah, K.S. A Study on the Effects of Wind on the Air Intake Flow Rate of a Cooling Tower: Part 3. Numerical Study. J. Wind. Eng. Ind. Aerodyn. 1996, 64, 73–88. [Google Scholar] [CrossRef]
  14. Zhao, Y.; Sun, F.; Wang, K.; Gao, M.; Yan, S.; Gao, T. Numerical analysis of crosswind effect on wet cooling tower aerodynamic field. Nucl. Power Eng. 2008, 29, 35–40. [Google Scholar]
  15. Rossi Di Schio, E.; Ballerini, V.; Dongellini, M.; Valdiserri, P. Defrosting of Air-Source Heat Pumps: Effect of Real Temperature Data on Seasonal Energy Performance for Different Locations in Italy. Appl. Sci. 2021, 11, 8003. [Google Scholar] [CrossRef]
  16. Dongellini, M.; Naldi, C.; Morini, G.L. Influence of Sizing Strategy and Control Rules on the Energy Saving Potential of Heat Pump Hybrid Systems in a Residential Building. Energy Convers. Manag. 2021, 235, 114022. [Google Scholar] [CrossRef]
  17. Chen, G.; Zhao, Y.; Ge, W.; Li, W. Critical Guidelines to Cope with the Adverse Impacts of the Inner Peripheral Vortex in the High-Level Water Collecting Natural Draft Wet Cooling Tower. Appl. Therm. Eng. 2020, 168, 114819. [Google Scholar] [CrossRef]
  18. Wu, Y. Numerical Simulation of Three-Dimensional Thermal Characteristics and Optimization of Water Collecting Device for Natural Ventilation High Level Cooling Tower; Shandong University: Jinan, China, 2016. [Google Scholar]
  19. Chen, G.; Zhao, Y.; Li, W.; Ge, W. The Efficiency of High-Level Water Collecting Cooling Tower with the Installation of Cross Wall Affect by the Evolution of Aerodynamic Field. Appl. Therm. Eng. 2019, 161, 114181. [Google Scholar] [CrossRef]
  20. Ma, L.; Ren, J. The Influence and Analysis of Natural Crosswind on Cooling Characteristics of the High Level Water Collecting Natural Draft Wet Cooling Tower. IOP Conf. Ser. Earth Environ. Sci. 2018, 108, 052116. [Google Scholar] [CrossRef]
  21. Solomon, A.B.; Ramachandran, K.; Asirvatham, L.G.; Pillai, B.C. Numerical Analysis of a Screen Mesh Wick Heat Pipe with Cu/Water Nanofluid. Int. J. Heat Mass Transf. 2014, 75, 523–533. [Google Scholar] [CrossRef]
  22. Fadhl, B.; Wrobel, L.C.; Jouhara, H. CFD Modelling of a Two-Phase Closed Thermosyphon Charged with R134a and R404a. Appl. Therm. Eng. 2015, 78, 482–490. [Google Scholar] [CrossRef]
  23. Jaber, H.; Webb, R.L. Design of Cooling Towers by the Effectiveness-NTU Method. J. Heat Transfer 1989, 111, 837–843. [Google Scholar] [CrossRef]
  24. Gilani, N.; Parpanji, F. Parametric Study on the Outlet Water Temperature in a Shower Cooling Tower and Its Application in Different Iranian Provincial Capitals. Int. J. Therm. Sci. 2018, 124, 174–186. [Google Scholar] [CrossRef]
  25. Sutherland, J.W. Analysis of Mechanical-Draught Counterflow Air/Water Cooling Towers. J. Heat Transf. 1983, 105, 576–583. [Google Scholar] [CrossRef]
  26. Nahavandi, A.N.; Kershah, R.M.; Serico, B.J. The Effect of Evaporation Losses in the Analysis of Counterflow Cooling Towers. Nucl. Eng. Des. 1975, 32, 29–36. [Google Scholar] [CrossRef]
  27. Barbieri, E.S.; Melino, F.; Morini, M. Influence of the Thermal Energy Storage on the Profitability of Micro-CHP Systems for Residential Building Applications. Appl. Energy 2012, 97, 714–722. [Google Scholar] [CrossRef]
  28. Zhang, H.; Liang, W.; Liu, J.; Wang, J. Modeling and Energy Efficiency Analysis of Thermal Power Plant with High Temperature Thermal Energy Storage (HTTES). J. Therm. Sci. 2020, 29, 1025–1035. [Google Scholar] [CrossRef]
  29. Williamson, N.; Armfield, S.; Behnia, M. Numerical Simulation of Flow in a Natural Draft Wet Cooling Tower—The Effect of Radial Thermofluid Fields. Appl. Therm. Eng. 2008, 28, 178–189. [Google Scholar] [CrossRef]
  30. Al-Waked, R.; Behnia, M. CFD Simulation of Wet Cooling Towers. Appl. Therm. Eng. 2006, 26, 382–395. [Google Scholar] [CrossRef]
  31. Klimanek, A.; Cedzich, M.; Białecki, R. 3D CFD Modeling of Natural Draft Wet-Cooling Tower with Flue Gas Injection. Appl. Therm. Eng. 2015, 91, 824–833. [Google Scholar] [CrossRef]
  32. Tiwari, A.K.; Jain, S.; Karmakar, S. An Improved Three-Dimensional Numerical Model of a v-Bar Splash Fill in a Wet Cooling Tower. Int. Commun. Heat Mass Transf. 2021, 128, 105617. [Google Scholar] [CrossRef]
  33. Xi, Y.; Yu, Z.; Zhang, L.; Yu, A.; Liu, L.; Bao, B.; Zhao, Y.; Zhou, C.; Wu, B.; Dong, K. Research on Heat and Mass Transfer Characteristics of a Counterflow Wet Cooling Tower Using a New Type of Straight Wave Packing. Int. J. Therm. Sci. 2023, 193, 108540. [Google Scholar] [CrossRef]
  34. Al-Waked, R.; Behnia, M. Enhancing Performance of Wet Cooling Towers. Energy Convers. Manag. 2007, 48, 2638–2648. [Google Scholar] [CrossRef]
  35. Lu, Y.; Yang, Y.; Wu, X.; Wang, L.; Wan, Z.; Zheng, Z.; Xu, J.; Cao, C. Spatiotemporal variations of wet-bulb temperature and its impact factors of Nanjing urban neighborhoo. Chin. J. Appl. Ecol. 2021, 32, 4223–4236. [Google Scholar] [CrossRef]
  36. Moratiel, R.; Soriano, B.; Centeno, A.; Spano, D.; Snyder, R.L. Wet-Bulb, Dew Point, and Air Temperature Trends in Spain. Theor. Appl. Climatol. 2017, 130, 419–434. [Google Scholar] [CrossRef]
Figure 1. Schematic of HNDWCTs.
Energies 17 00651 g001
Figure 2. Grid division diagram.
Energies 17 00651 g002
Figure 3. Boundary condition settings.
Energies 17 00651 g003
Figure 4. (a) Comparison of average temperature at filler bottom under whole water distribution modes; (b) comparison of minimum temperature at filler bottom under outer-ring water distribution modes.
Energies 17 00651 g004
Figure 5. (a) Comparison of average temperature at filler bottom under full water distribution modes; (b) comparison of minimum temperature at filler bottom under half-outer-ring water distribution modes.
Energies 17 00651 g005
Figure 6. Temperature contour under different water distribution modes at 0 °C, (a) full, (b) outer ring.
Energies 17 00651 g006
Figure 7. Temperature contour under different water distribution modes at −5 °C, (a) outer ring, (b) half outer ring.
Energies 17 00651 g007
Figure 8. (a) Comparison of average temperature at filler bottom under different wind velocities; (b) comparison of minimum temperature at filler bottom under different wind velocities.
Energies 17 00651 g008
Figure 9. Temperature contour and velocity magnitude contour under different crosswind velocities, (a,b) is under 0 m/s, (c,d) is under 3.5 m/s, and (e,f) is under 7.0 m/s.
Energies 17 00651 g009
Figure 10. (a) Comparison of average temperature at filler bottom under different ambient temperatures; (b) Comparison of minimum temperature at filler bottom under different ambient temperatures.
Energies 17 00651 g010
Table 1. Grid independence validation.
Grid Number 2,801,4813,526,8404,337,846
Outlet water temperature, °C14.5414.5214.52
Absolute error, °C0.180.160.16
Circulating water temperature drop, °C7.067.087.08
Table 2. Numerical model validation.
Operation ConditionsC1C2
Ambient temperature, °C14.84
Relative humidity, %6130
Crosswind velocity, m/s3.50.4
Atmosphere pressure, kPa101.02102
Circulating water flow rate, m3/h82,77634,344
Water distribution modesFullOuter ring
Test/design inlet water temperature, °C28.5421.60
Test/design outlet water temperature, °C19.8714.36
Outlet water temperature calculated by numerical model, °C20.0114.52
Absolute error, °C0.140.16
Disclaimer/Publisher’s Note: The statements, opinions and data contained in all publications are solely those of the individual author(s) and contributor(s) and not of MDPI and/or the editor(s). MDPI and/or the editor(s) disclaim responsibility for any injury to people or property resulting from any ideas, methods, instructions or products referred to in the content.

