Article

Experimental Study on Rejuvenation of Aged Power Cables via Simulation Operation

1
State Key Laboratory of Nuclear Power Safety Monitoring Technology and Equipment, Shenzhen 518172, China
2
School of Automation, Guangdong Polytechnic Normal University, Guangzhou 510665, China
*
Author to whom correspondence should be addressed.
Energies 2024, 17(3), 655; https://doi.org/10.3390/en17030655
Submission received: 23 October 2023 / Revised: 20 December 2023 / Accepted: 11 January 2024 / Published: 30 January 2024
(This article belongs to the Special Issue Electrical Engineering, High Voltage and Insulation Technology)

Abstract

:
Thermal effects play a crucial role in the evolution of insulation performance in power cables during long-term operation. Before the experiments, crosslinked polyethylene (XLPE) sheets and cables were thermally aged at 105 °C for up to 180 days. Then, the heat treatments on XLPE sheets and cables were conducted in three stages. Firstly, the aged sheets were subjected to heat treatment with a temperature range of 90 to 115 °C at intervals of 5 °C, with each step lasting for 20 h. Secondly, a 7-year-serviced cable underwent simulated cable operation at the same temperature as the XLPE sheets. Thirdly, two 15- and 30-year-serviced cables were treated at temperatures ranging from 90 to 105 °C, adhering to the same intervals as the second stage. The differential scanning calorimetry (DSC), cross-linking degree, DC conduction, and breakdown strength were measured. The results show that both heat treatment methods are effective in enhancing crystallization characteristics and conductivity for XLPE sheets and aged cables, and the optimum values were achieved at decreasing temperatures as the aging period extended. Moreover, the heat treatment on retired cables yielded similar results, suggesting that a heat treatment resembling cable operation at higher temperatures would initially be beneficial for cable rejuvenation.

1. Introduction

With the rapid development of the city and the increasing demand for electric power, the stability and reliability of power transmission have become the main factors. Cross-linked polyethylene (XLPE) has emerged as a prominent insulation material in high-voltage power cables due to its excellent electrical and thermal properties. However, the long-term performance and reliability of XLPE are shadowed by concerns related to thermal pressures [1,2]. In the short term, extensive research has been conducted to investigate the effects of controlled thermal processes on the morphology and performance of XLPE [3,4].
The thermal processes involved in XLPE, including both heating-cooling and duration phases, play a critical role in determining the microstructure, crystallinity, and electrical conductivity of XLPE [5]. Therefore, understanding the influence of heat treatment on XLPE is crucial for optimizing the manufacturing and operational conditions and ultimately enhancing its performance [6]. During cable operation, the temperature typically ranges between room temperature and 90 °C, which positively impacts crystallization if the time duration is long enough. Cables that have been in service for 7–10 years have demonstrated higher crystallinity, melting point, and a narrower melting range as a result of the heat effects, ultimately leading to enhanced thermal–electrical performance [7,8]. However, as cables were serviced for decades, insulation degradation inevitably occurred even when the temperature was always below 90 °C [9]. On the one hand, aging tests conducted on cables or XLPE sheets in the early stages revealed intensified damage to crystallinity, particularly in thicker lamellae and larger crystals. On the other hand, initial damage to network molecules in the early stage proves conducive to subsequent changes and promotes crystallization [10,11].
When a cable reaches its designed service life, its morphology and thermal–electrical performance become decisive factors in determining the possibility of extending its operation. In this paper, a comprehensive study was conducted on cable insulation degradation and heat treatment through the simulation of cable operation. Firstly, the insulation degradation was simulated by subjecting XLPE sheets and cables to thermal aging for various durations. Subsequently, short-term heat treatment was performed by heat ovens and cable operation simulation at temperatures ranging from 90 °C to the melting point of XLPE. After each treatment phase, the insulation XLPE was peeled off and underwent measurements of thermal and electrical properties. Additionally, two more retired cables were selected for the same heat treatment and performance measurement. Finally, the improvement in thermal and electrical performance of the cable was evaluated, taking into consideration the cable insulation degradation and heat treatment temperature. As a result, the rejuvenation of insulation-degraded cables through the simulation of operation at a higher temperature was proposed.

2. Sample Preparation and Performance Setting

2.1. Aging Test and Sample Preparation

The experiments were conducted in three stages. In the first stage, heat treatment was performed on XLPE sheets peeled from a new and a 7-year-serviced cable, and their specifications are given in Table 1. The two cables were sourced from different manufacturers, and there was a significant variation in their production year. The 7-year-serviced cable was obtained from a cable line replacement, and no overheating history or physical damage was reported. All the XLPE sheets were initially thermally aged at 105 °C using a heated oven (DKM310C, Yamato Scientific, Chuo, Tokyo), and samples were taken for three phases with a gap of 60 days. Subsequently, the sheets collected from each phase were divided into seven groups, with the first six groups undergoing thermal treatment at temperatures ranging from 90 to 115 °C with a 5 °C increment of 20 h using a heated oven (DKM310C, Yamato Scientific).
In the second stage, a 5 m long section of the 7-year-serviced 110 kV cable from the first stage was prepared. The cable was cut into four isometric short sections, and the first three sections were subjected to thermal aging using a heat oven (DKM610C, Yamato Scientific) for 60, 120, and 180 days, respectively. Subsequently, the cable was thermally treated to simulate cable operation on a current test platform, as shown in Figure 1a. The simulation involved applying a constant current to the cable; the temperature in the conductor was raised to the preset temperature in 6 h and maintained for 20 h, finally naturally cooling to room temperature. Temperature fluctuation during the experiment was considered, and a difference within 3 °C between the heating stage and the preset temperature was deemed acceptable. Due to the short cable length, XLPE samples were taken from one end of each cable after the heat treatment at each treatment temperature, and the cable’s performance was assessed based on these samples. Prior to the heat treatment, the currents corresponding to each treatment temperature were measured using the unaged cable, and the results are listed in Table 2. Since each aged cable had a length of 1.2 m, a continuous-step treatment process, as shown in Figure 1b, was employed for the heat treatment, with the XLPE taken from one end after the completion of heat treatment at each temperature.
In the third stage, two retired cables with service years of 17 and 32 years were selected; their specifications are provided in Table 3. Since there were no new cables corresponding to them, the extent of insulation degradation remains unknown. However, it should be noted that the temperature in both cables remained below 90 °C during their previous operation. The same heat treatment was conducted as in the second stage, including the treatment temperature, duration, and sample collection. Prior to the treatment process, the current corresponding to each preset temperature was measured, as shown in Table 4, taking into account the difference in the sectional area of the metal conductor and the insulation thickness.

2.2. Performance Test

Differential scanning calorimetry (DSC) was performed to assess the crystallinity and thermal performance of XLPE. In each test, the sample weighing 0.5 mg was placed into an aluminum crucible, heated from 25 to 140 °C at a rate of 10 K/min, maintained for 5 min, and finally cooled to 25 °C at a rate of −10 K/min.
The cross-linking degree of the sample was tested according to ISO 10147: 1994 [12]. In each test, the sample of 0.5 mg was wrapped with a fine copper wire mesh, immersed in a xylene solution, and then placed in an incubator at 140 °C for 8 h. Then, the sample was taken out, wiped clean, and put in a drying oven, kept at a constant temperature of 60 °C for 8 h, and weighed; the rate of remaining weight and the initial 0.5 mg are the cross-linking degrees.
The DC conduction was measured using a typical three-electrode system. The sample was inserted between the electrodes and placed in an incubator. The electric field of 20 kV/mm was applied, the current was recorded for 3600 s, and the measurement temperature was set at 90 °C. Based on the average value of test data in the last 60 s, the conductivity σ is calculated based on Equation (1),
σ = I E S
where I is the average current of the last 60 s, E is the applied electric field, and S is the electrode cross-sectional area.
The breakdown strength was measured using ZJC-100 (ZDCX, Beijing, China). A pair of plate electrodes with a diameter of 30 mm was used, and the sample was inserted between the electrodes and immersed in silicone oil. An AC voltage with a power frequency was applied and increased at a rate of 1 kV/s from 0 until the sample breakdown. The same test was repeated six times, and the average value was calculated and taken as the result.

3. Results

3.1. Aging Status of the Cables

Figure 2 illustrates the first cooling curves of the two aged sheets, with corresponding labeling of the crosslinking degree. Cable B underwent a thermal process during its operation, which could account for the difference observed in the cooling curves during the same aging test. As the sheets aged for 60 days, the cooling peak of sheet B shifted towards higher temperatures. Similar changes were observed as both sheets aged for longer days, although the change in sheet A was minimal when the aging time reached 120 days. Similar phenomena have been reported in [13], primarily attributed to two reasons: (1) the aging temperature is lower than the melting temperature of the sample, and the thicker lamellae corresponding to the melting peak experienced secondary growth; (2) the molecular chain generation via the initial degradation in the service stage promotes the growth of crystals. A continuous decrease in the crosslinking degree, along with damage to network molecules and subsequent chain regeneration, has been shown to be beneficial for crystallization [14]. At the aging duration of 180 days, the cooling peak noticeably shifted to a lower temperature in sheet B, while the position in sheet A remained relatively unchanged. Conversely, a significant decrease in crosslinking degree is a notable indicator of XLPE degradation.

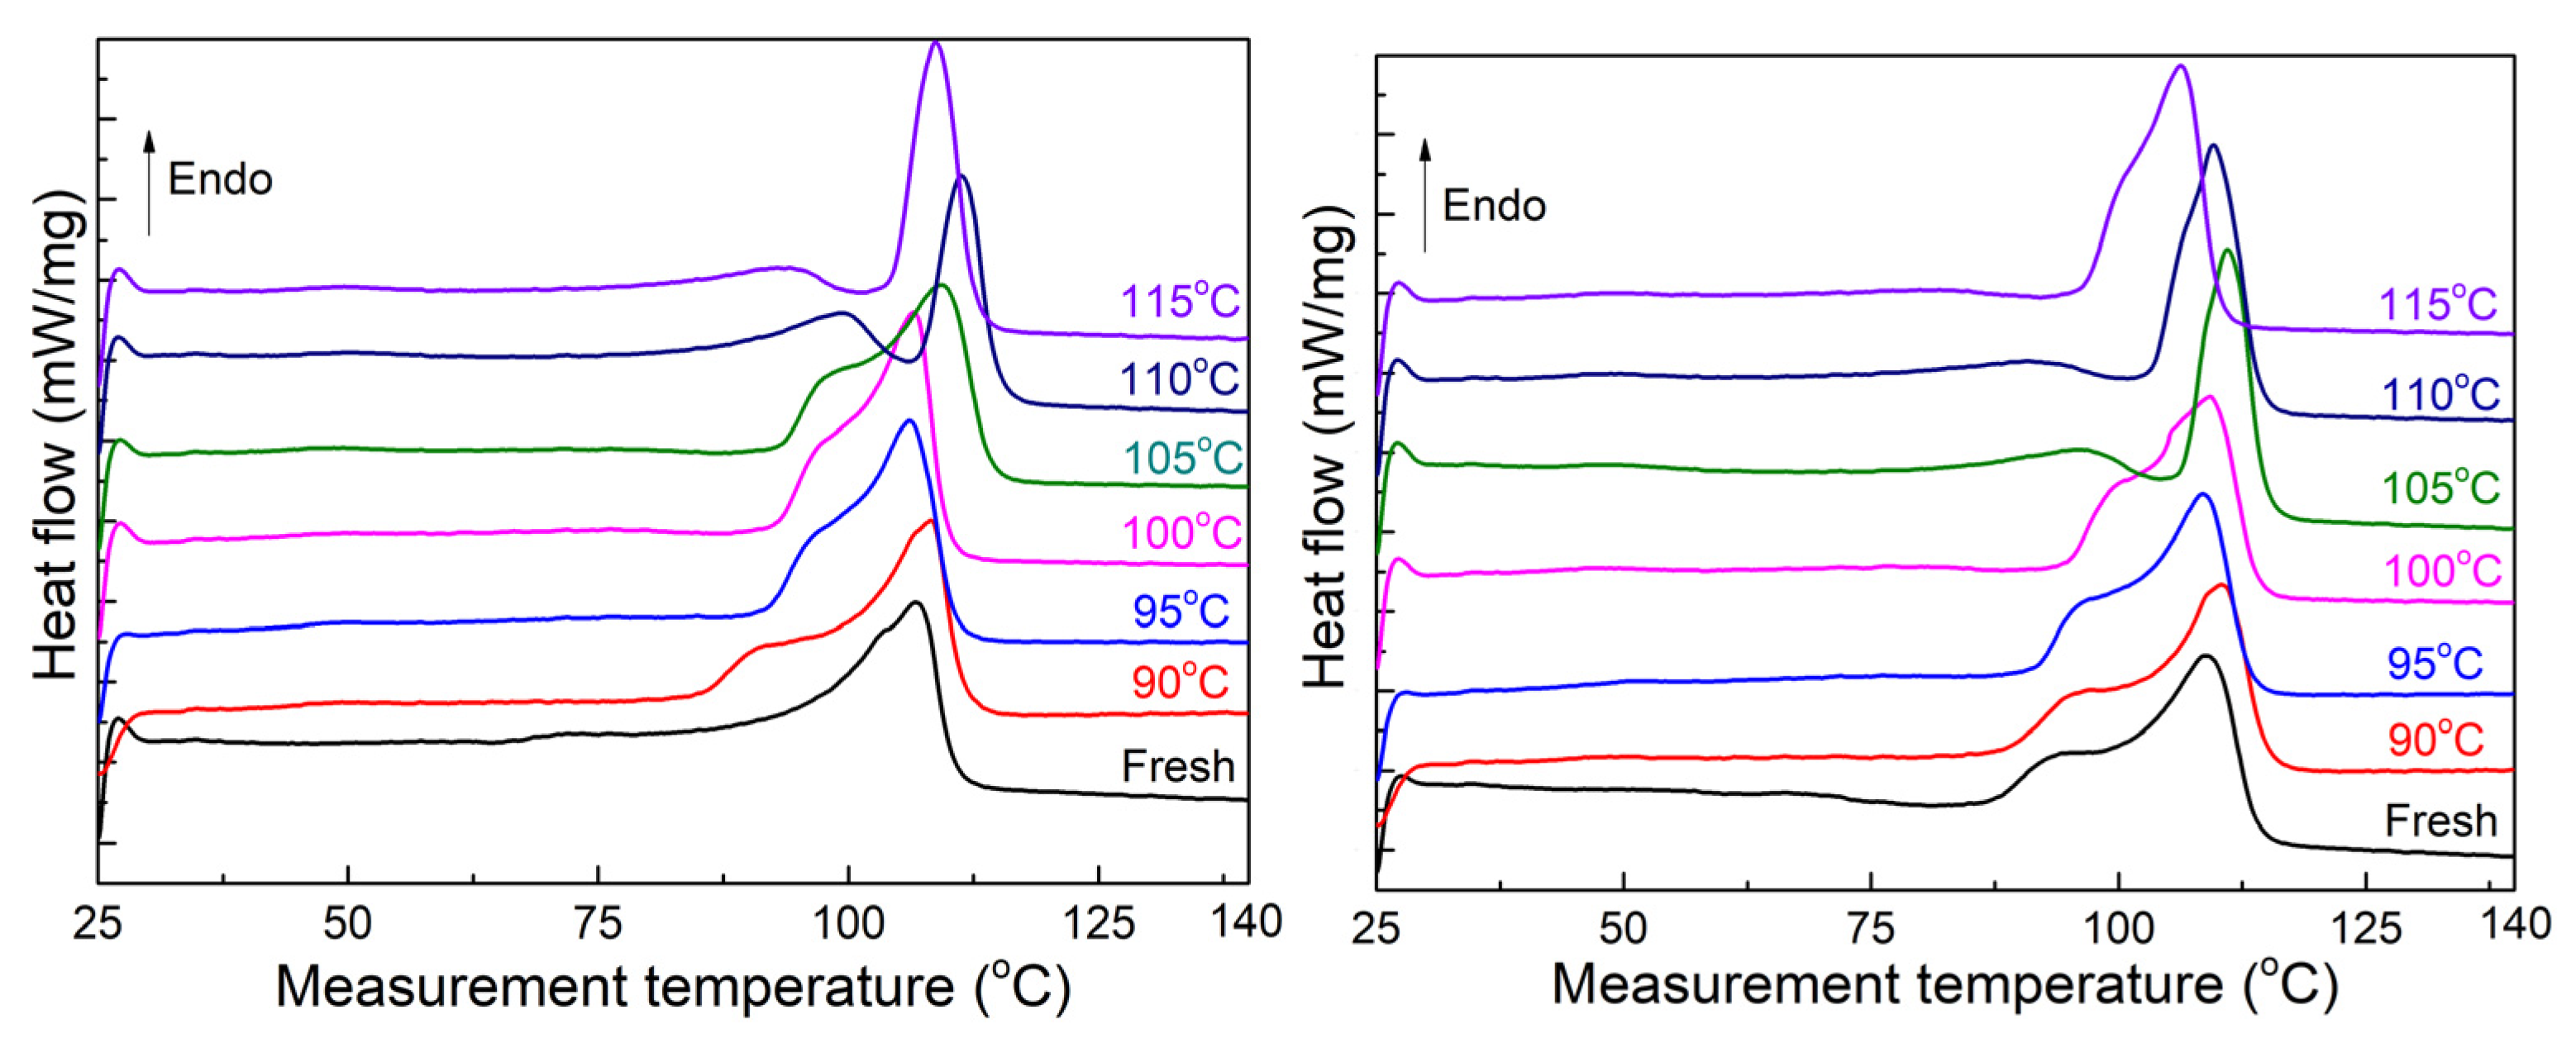
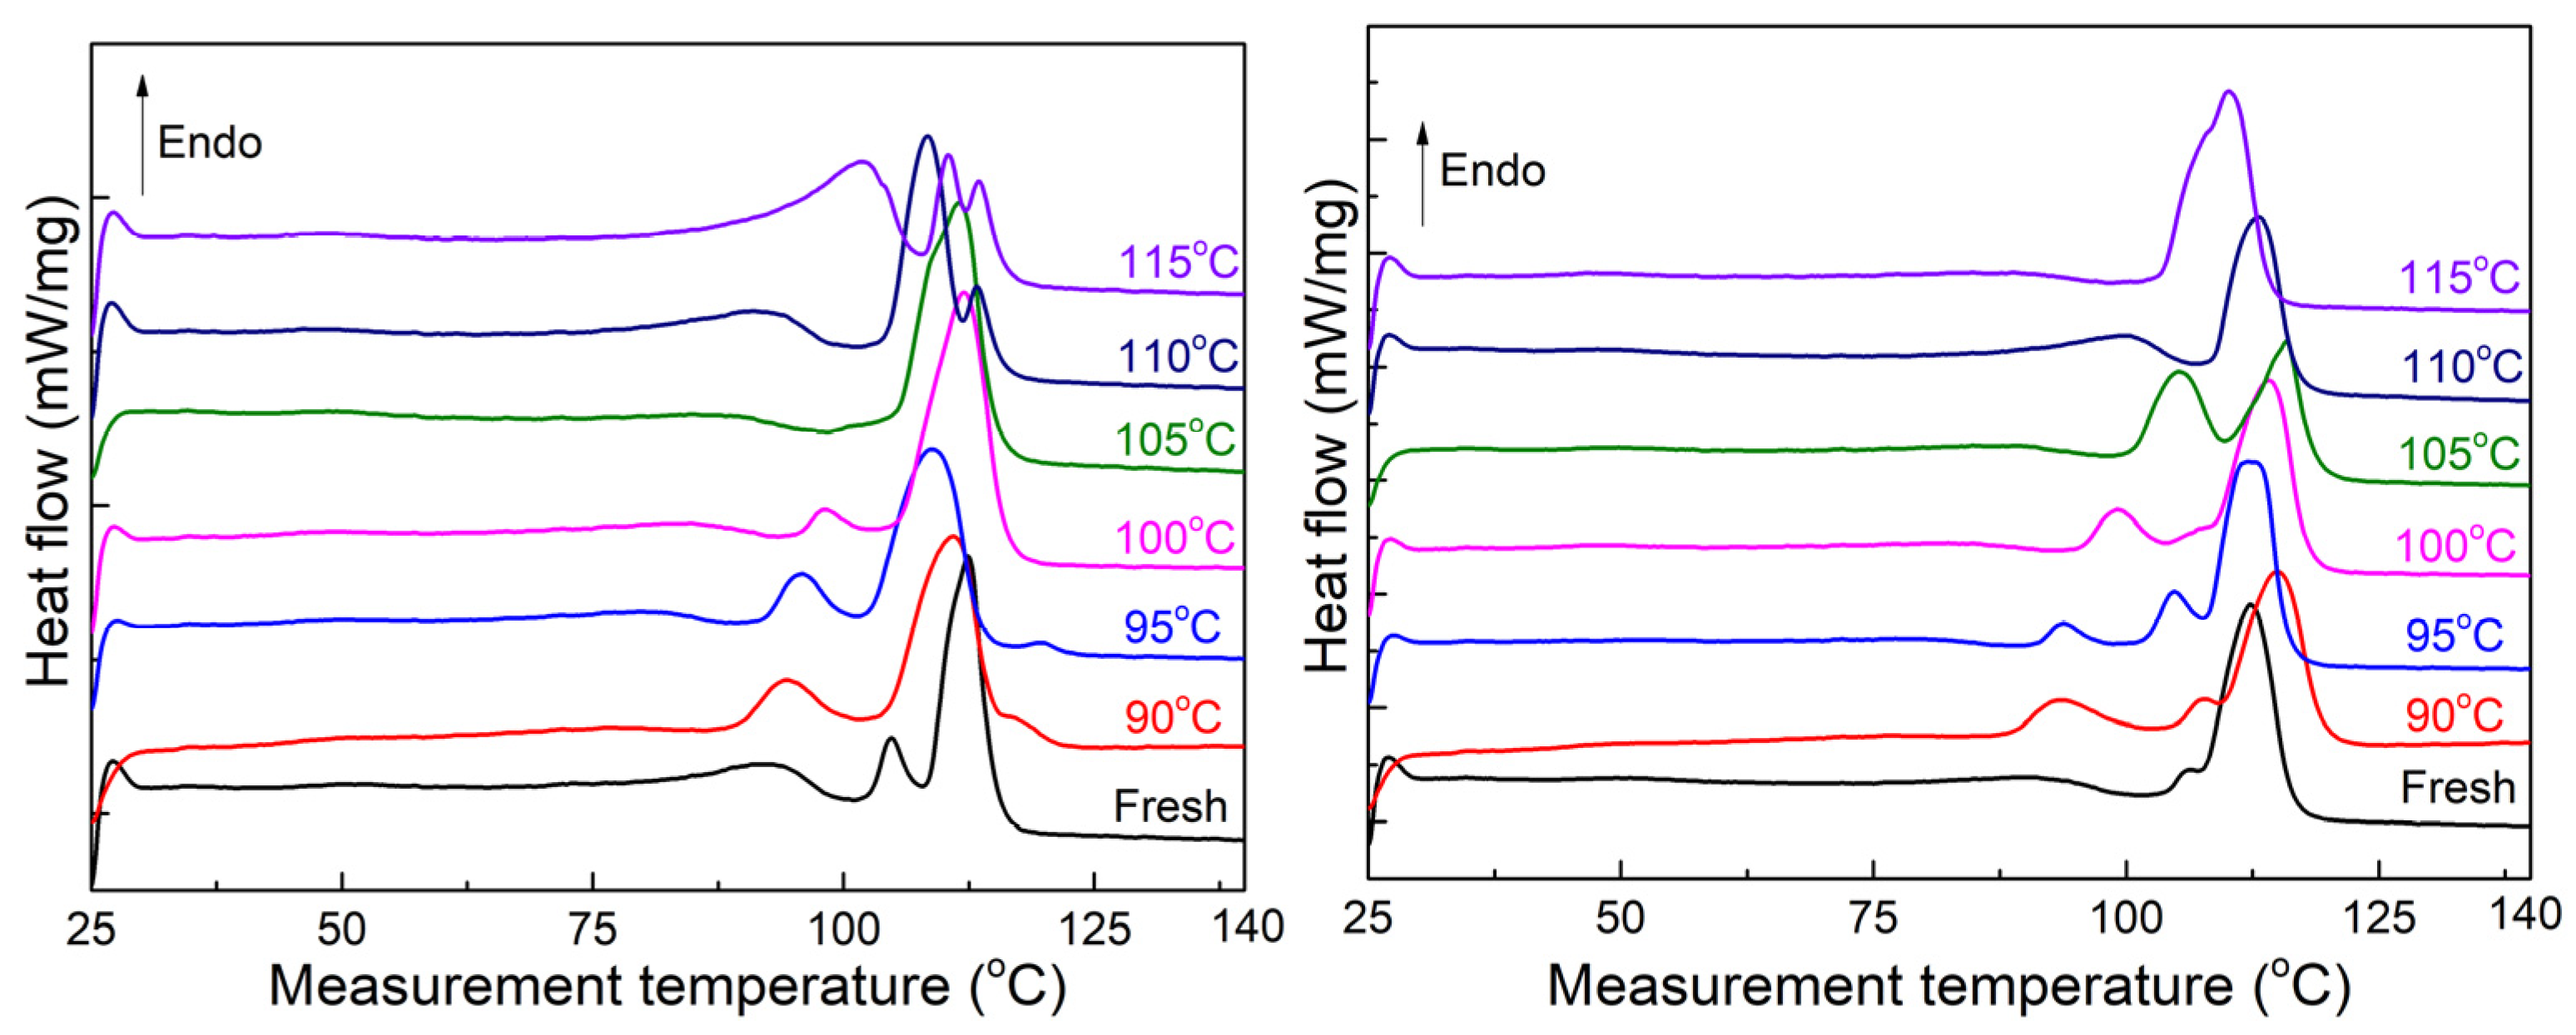
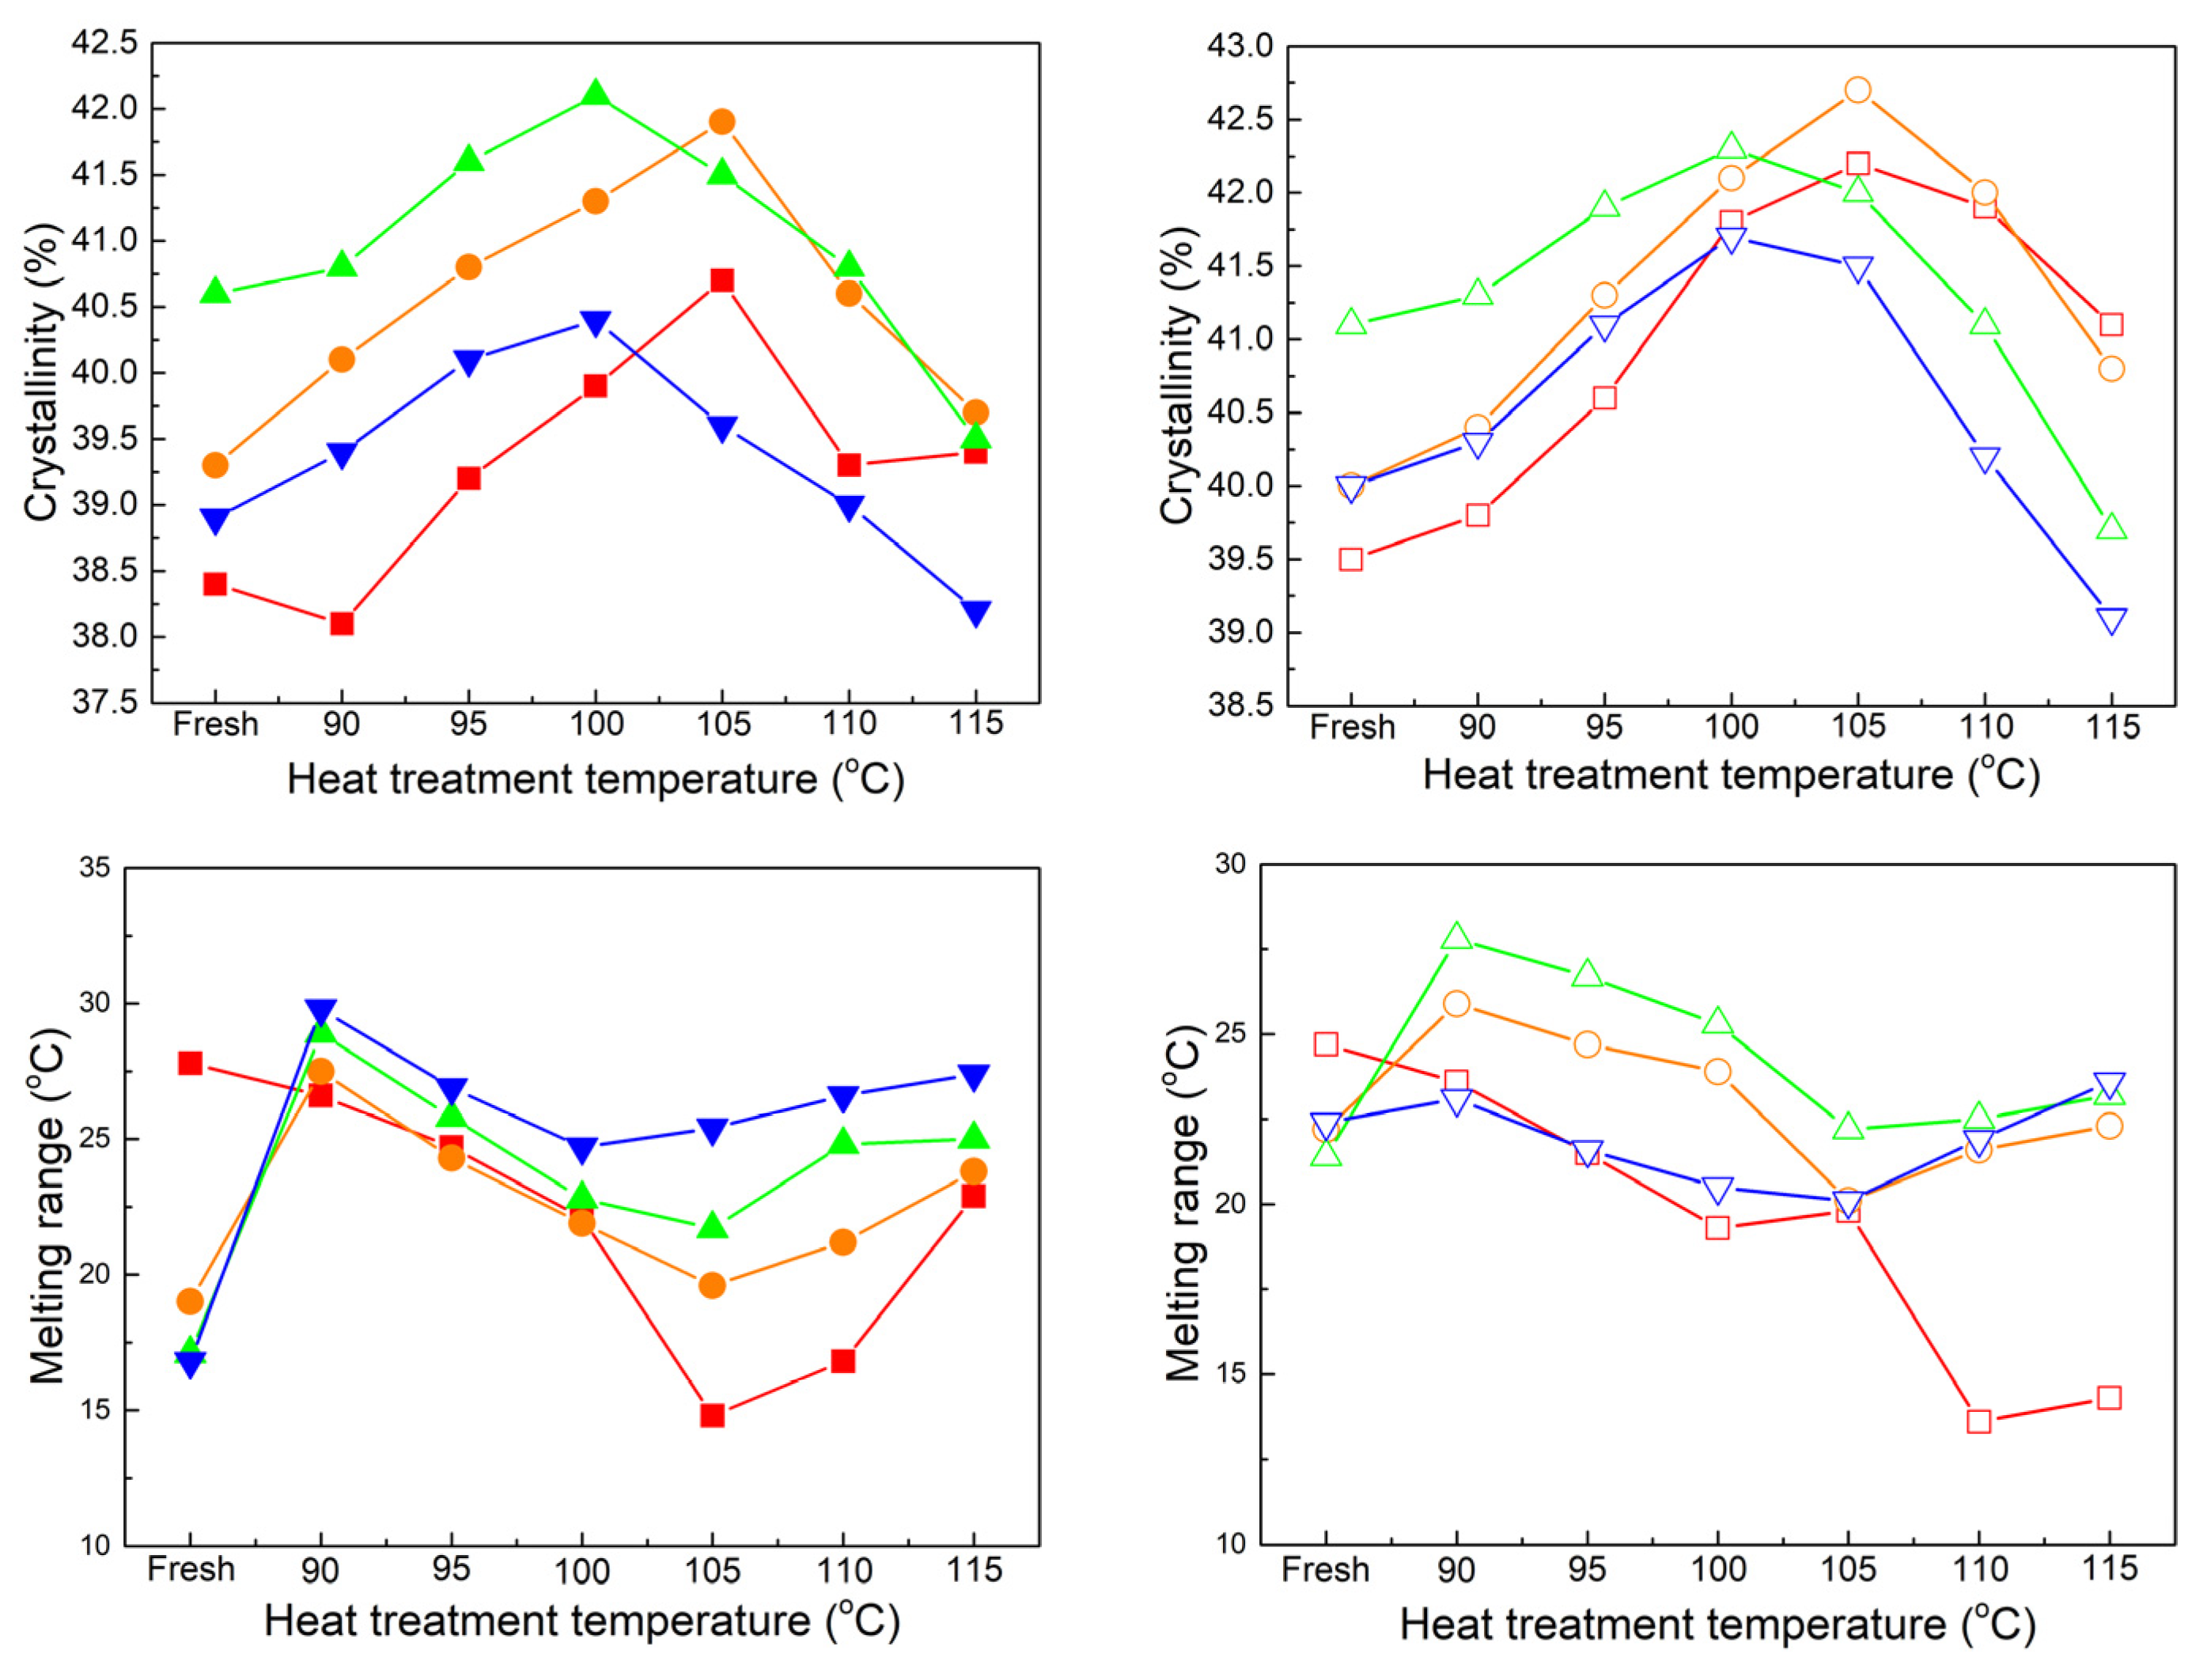
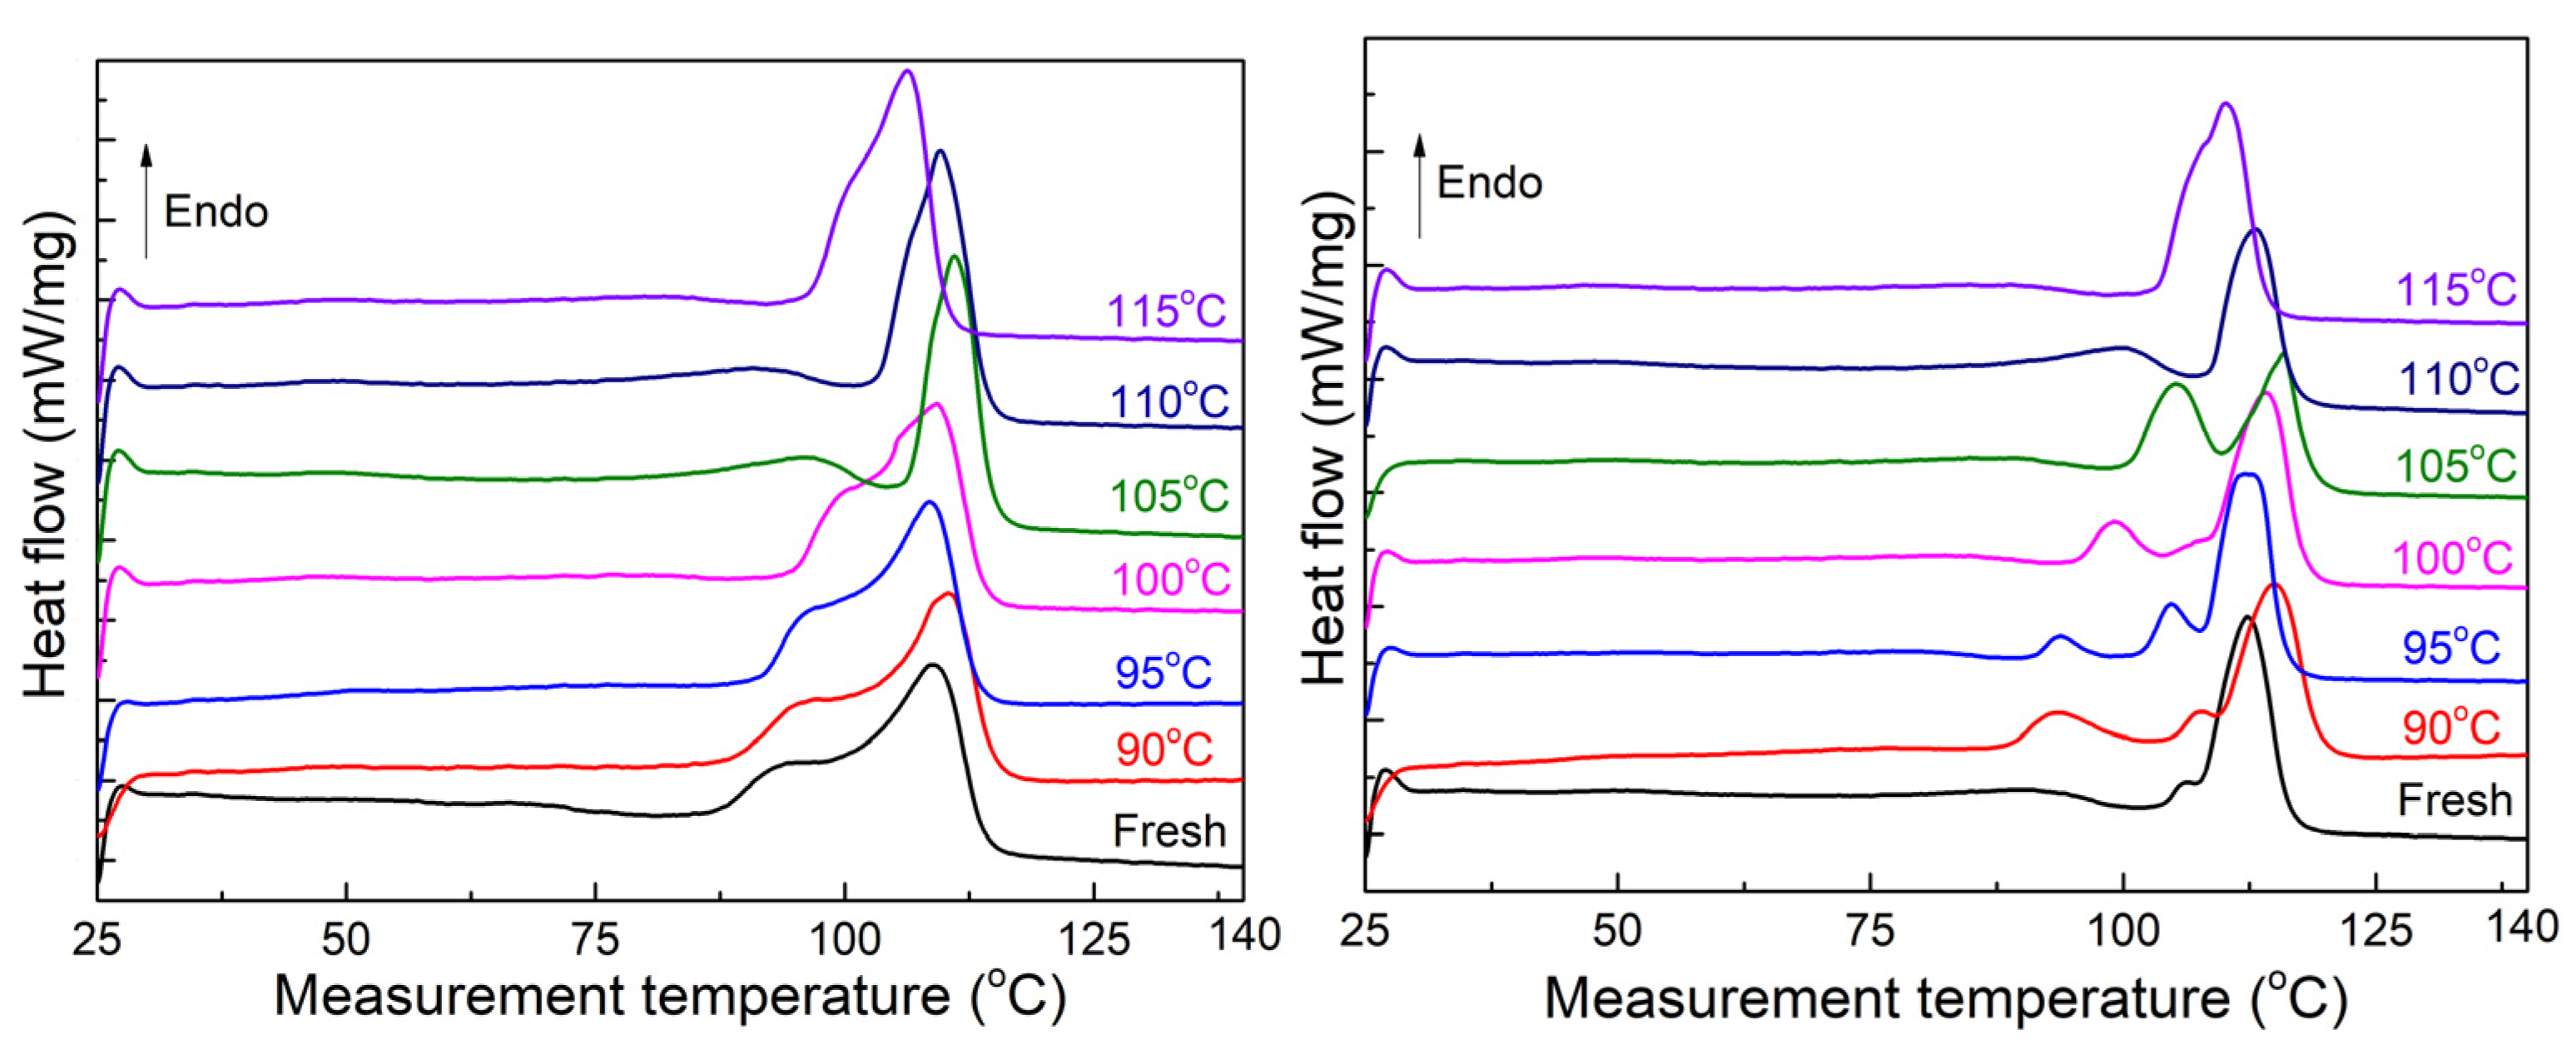
3.2. Heat Treatment on XLPE Sheets

Figure 3 displays the first melting curve of the unaged sheets as a function of the heat treatment temperature. At the heat treatment temperature of 90 °C, a shoulder melting peak appears on the left side of the main melting peak, indicating the formation of new crystals, while the main melting peak remains unchanged due to the limited growth of the thicker lamellae associated with it at a lower temperature [15]. As the heat treatment temperature increases, the main melting peak of both sheets fluctuates, possibly due to the dynamic conversion between the crystal region and the amorphous region under high temperatures [16]. Meanwhile, the shoulder melting peak in both sheets sequentially shifts to the higher temperature and partially overlaps with the main melting peak. At the heat treatment temperature of 100 °C, the main melting peak of sheet B slightly shifts to a higher temperature and adopts a pointed shape; a similar change is observed in sheet A when the treatment temperature reaches 105 °C. Starting at 105 °C, the main melting peak of sheet B shifts toward lower temperatures and splits into two interconnected peaks. On the other hand, the main melting peak of sheet A continues to shift towards higher temperatures until it reaches 110 °C, after which it reverses its movement towards lower temperatures at the highest treatment temperature.
Figure 4 presents the melting curve of 120-day-aged sheets after heat treatment. A shoulder melting peak still appears on the left side of the main melting peak in both sheets. With the increasing heat treatment temperature, the shoulder melting peak in sheet A steadily shifts to higher temperatures. In contrast, sheet B shows a discrete shoulder melting peak and a weaker amplitude with the increasing heat treatment temperature, indicating more severe degradation, the generation of small molecules and polar groups, and their thermal vibration inhibiting crystal growth at high temperatures [17,18]. Similarly, the position of the main melting peak in the two sheets hardly changed even at 100 or 105 °C, while the shape of the main melting peak gradually became more pointed, indicating slower crystal growth and a smaller size distribution [19]. When the heat treatment temperature reaches 105 °C, the main melting peak of sheet A shifts towards a lower temperature and broadens in shape. Concurrently, the shoulder melting peak of sheet B exhibits discrete changes, indicating that the melting of internal crystals and the newly generated crystals cannot grow to match the larger size of the original crystals. At the heat treatment temperature of 105 °C, the melting peak of sheet B is divided into two peaks, and the main melting peak shifts towards the low-temperature side as the temperature rises further.
Figure 3 and Figure 4 show that the relative position, shape, and amplitude of the shoulder and main melting peaks undergo significant changes as the two sheets are subjected to heat treatment treatments. Consequently, the melting range T m and crystallinity X are calculated using the following two formulas [20]:
X = H 0 H × 100 %
T m = T m e T m s
where H 0 is the measured melting enthalpy, H is the equivalent crystallization enthalpy when the crystallinity is 100%, T m s is the melting starting temperature, and T m e is the melting ending temperature. The results of two crystallinity calculations are shown in Figure 5. In the case of multiple independent melting peaks in a sample, their sum is calculated individually.
As depicted in Figure 5, the crystallinity of the fresh sheet in the top two graphs increases until it reaches its highest value after aging for 120 days. Based on the cooling curves and values of crosslinking degree shown in Figure 2, it can be observed that the 120-day-aged sheets have undergone mild degradation while promoting the regeneration of chains in such an initial stage of XLPE aging. During this period, the changes in molecules are conducive to crystallization, and the negative effects on crystal characteristics can be overlooked [21]. However, there is a sudden decrease in crystallinity after 180 days of aging in both samples, which is a commonly observed phenomenon in XLPE aging [20]. Furthermore, the melting range in all three aging stages in the bottom two graphs is significantly lower compared to that of the unaged sheets. This can be attributed to the changes in crystal distribution, particularly the further growth of thicker lamellae and melting of thinner lamellae during the aging test, and the lack of notable distinction among the samples may be due to the disruption caused by damage to network molecules [22]. After the heat treatment, both the unaged and 60-day-aged sheets exhibit a similar trend: higher crystallinity is achieved at higher heat treatment temperatures, accompanied by a decrease in the melting range. The highest crystallinity and lowest melting range are reached at the same temperature of 105 °C. Although the crystallinity of the 60-day-aged sample at each heat treatment temperature is significantly higher than that of the unaged sample, there is no difference in the melting range. For 120-day-aged sheets, they exhibit increasing crystallinity before reaching the highest value, and the corresponding heat treatment temperature is reduced to 100 °C. Similarly, the melting range at the same treatment temperature is always higher than that of the 60-day-aged sheets. Evidently, more small crystals with thinner lamellae are formed during the heat treatment at the same temperature, even under such a mild degradation of molecules [19]. When the two samples are aged for 180 days, the increase in crystallinity becomes weak and reaches its highest value when the heat treatment temperature reaches 100 °C. Then, its value falls below that of the fresh sheet. This can be attributed to two reasons: (1) the temperature of the aging test is lower than the melting point of the two samples, allowing the crystals corresponding to the main melting peak to still exist and further grow; (2) the effect of damage in molecules cannot be ignored during this aging period and the subsequent heat treatment, resulting in weaker increases in crystallinity and a noticeable decrease in the melting range [23]. Additionally, in the bottom two graphs, the difference in melting range between the unaged sheet and the 180-day-aged sheet at the same heat treatment temperature becomes ambiguous.
Figure 6 illustrates the changes in electrical conductivity as a function of heat treatment temperature. At 90 °C, the melting of tiny crystals and stimulation of carrier density and migration rate both change and contribute to enhanced charge transportation [24]. As the aging days increase, the electrical conductivity of both sheets initially decreases, reaching its lowest point at 60 days, and then increases inversely with further aging days. After the heat treatment, the electrical conductivity of each aged sheet follows a similar pattern of initially decreasing and subsequently increasing with higher heat treatment temperatures. As shown in Figure 5, higher crystallinity and a lower melting range indicate a compact crystalline structure, effectively hindering charge migration and resulting in lower conductivity [25,26]. Following heat treatment corresponding to each aging stage of sheet A, the lowest electrical conductivity is observed at 105, 100, 100, and 95 °C, respectively. In contrast, for sheet B, the lowest conductivity at each aging stage is observed at the same temperature of 95 °C, although the tendency as a function of heat treatment temperature weakens as the sheets age for 120 and 180 days.

3.3. Heat Treatment on Aged Cables

The results in Section 3.2 highlight a key finding regarding the impact of heat treatment on thermal-aged XLPE sheets. It is crucial to note that the thermal processes, spanning from the heating to the cooling phase, are critical factors influencing the morphology and thermal–electrical performance of XLPE [27].
Figure 7 displays the melting curve of unaged and 120-day-aged XLPE sheets extracted from the insulation layer of cable B. Since the temperature in XLPE during the initial service phase remains below 90 °C, the melting curve of the fresh sheet exhibits a weak shoulder melting peak below 90 °C, indicating the previous thermal history of the cable [28]. The main melting peak represents the thicker lamellae primarily formed during the cable manufacturing stage. Consequently, the heat treatment at 90 °C did not cause a shift in the main melting peak position. As the heat treatment temperature increases, the changes in the shoulder and main melting peaks of the two states correspond to the trends observed in unaged XLPE sheets in Section 3.2. In Figure 7-left, the shoulder melting peak of unaged sheets moves towards high temperatures and partially overlaps with the main melting peak, while the shoulder melting peak of 120-day-aged sheets exhibits a series of discrete states in Figure 7-right. Upon reaching a heat treatment temperature of 105 °C, the shoulder melting peak of sheet A coincides with the main melting peak, shifting significantly toward a high temperature and showing a pointed shape. On the other hand, sheet B exhibits two melting peaks with almost equal amplitudes. At higher heat treatment temperatures, the main melting peak shifts towards the lower temperature side and widens. During the heat treatment with continuous temperature changes, the main melting peak of the two sheets does not shift towards higher temperatures. When the heat treatment temperature reaches 105 °C, the melting peak of sheet A takes on a pointed shape, while sheet B exhibits two peaks of similar amplitude. As the heat treatment temperature increases further, only one main melting peak appears and gradually shifts towards a lower temperature.
Figure 8 illustrates the calculation of crystallinity X and melting range T m based on Equations (1) and (2). Although the heat treatment was simulated through cable simulation, different from the conditions in a heated oven, the changes in the two factors demonstrate a similar trend, as discussed in Section 3.2. With increasing heat treatment temperatures, the crystallinity initially increases while the melting range decreases. The optimum value of the crystallinity for each sheet was determined by gradually decreasing the temperature, resulting in 105 °C for unaged and 60-day-aged sheets and 100 °C for 120 and 180-day-aged sheets. Conversely, the optimum value of the melting range for each sheet appears to be reached at 105 °C, but the amplitude increases with longer aging days.
For each aged sheet, the difference in molecules can be disregarded, and the changes in crystallinity can be attributed to variations in conductivity and breakdown strength as a function of heat treatment temperature, as shown in Figure 9. Similar observations were made in Figure 6, where 60-day-aged samples of both sheets consistently exhibited the lowest conductivity and the highest breakdown strength, while 180-day-aged samples exhibited the highest conductivity and the lowest breakdown strength. After the heat treatment, the lowest conductivity and the highest breakdown strength for each aging phase are observed at different temperatures. Specifically, the lowest conductivity is observed at temperatures of 105, 100, 95, and 95 °C, respectively, for each aging phase, while the highest value of the breakdown strength for each aging phase is observed at the same temperature of 95 °C. By focusing on the melting curves shown in Figure 7, a discrete distribution of shoulder melting peaks indicates discrepancies in crystal size, which has been revealed to be beneficial for charge carrier transportation.

3.4. Heat Treatment on Retired Cables

Based on the findings presented in Section 3.1, the melting point of cables C and D is approximately 104 °C. The optimum values for crystallinity, melting range, and conductivity discussed in Section 3.2 and Section 3.3 were achieved at heat treatment temperatures below 110 °C. Therefore, the maximum heat treatment temperature for the simulation test of the two retired cables was set at 105 °C.
Figure 10 illustrates the melting curves of the XLPE insulation from both cables as a function of heat treatment temperature. The changes observed in the two melting peaks follow a similar pattern to those described in Section 3.2 and Section 3.3. The shoulder melting peak of both samples appears and shifts towards higher temperatures, while slight changes are observed in the main melting peak. When the heat treatment temperature reaches 100 °C, the shoulder and main melting peaks overlap and shift to higher temperatures, resulting in a pointed shape. However, as the treatment temperature reaches 105 °C, the peak moves to lower temperatures and widens.
Figure 11 shows the crystallinity and melting range of the two samples as a function of heat treatment temperature. It is reasonable to observe an increase in crystallinity and a decrease in melting range with the increasing heat treatment temperature, reaching optimum values at the same temperature of 100 °C. As a consequence of the evolution in crystallinity for the two samples, Figure 12 demonstrates a gradual decrease in conductivity and an increase in breakdown strength. The lowest conductivity and the highest breakdown strength are achieved at a temperature of 90 °C for cable D. Similarly, cable C exhibits its highest breakdown strength at 95 °C, while the lowest conductivity is observed at 100 °C. However, the difference in values between 95 and 100 °C is relatively weak.

4. Discussions

4.1. Aging Effect on the Heat Treatment Temperatures for the Highest or Lowest Value of Crystal Characteristics or Conductivity

If we pay attention to the highest values for crystal characters and lowest conductivity for aged 7-year-serviced cable, as shown in Figure 13. It can be observed that the temperature required for the highest crystallinity, the melting range, and conductivity decrease with increasing aging days. When considering the two retired cables as well, it is noted that the treatment temperature for achieving the lowest conductivity is lower than the values of crystal characteristics.
For semi-crystalline polymers, crystal characteristics mainly depend on the thermal effects. When the temperature is above the glass transit point, molecule movement promotes nucleation, growth, melting, and recrystallization until the melting point [28]. At an elevated temperature, the rate of nucleation, crystal growth, melting, and recrystallization would synchronously accelerate, and the crystal–amorphous morphology evolution could be divided into three phases [29]. In the first phase, nucleation and growth plays the leading role in the expansion of crystal volume. Including temperature increases and duration extensions are feasible methods for crystallization. Considering that the chain movement is strongly related to the temperature, relative enhanced crystal characteristics—such as the crystallinity, crystal size, and distribution, etc.—would be reached at one point. In the second phase, temperature increases greatly promote the chain movement, vibration, and the rate of nucleation; crystal growth is equal to the crystal melting, and a dynamic balance is reached. In this phase, with more unstable nucleation and small crystal melting, the optimum crystal characters, including the highest crystallinity, uniform distribution of crystal, and compact arrangement of lamellae would be obtained, and the corresponding point is also called the optimum treatment point [30]. When the temperature further increases until above the melting point, which is the third phase, the crystal melting dominates this dynamic phase, and more crystal melting until converted into the amorphous phase. On the contrary, chains in the amorphous region are randomly arranged and lack long-range order, and charge transportation is easier compared with the crystal region [31]. Although the crystal region is enlarged after the heat treatment, the amorphous region is beneficial for stimulated charge transportation corresponding to severe aged XLPE [32]. At the optimum heat treatment temperature, which is a relatively higher temperature, more small crystals and thin lamellae melt, and the ionization effects contribute to more charge carriers. The above changes would result in a lower conductivity.

4.2. Heat Treatment Method on the Crystal Performance

Two typical heat treatment methods involving a heated oven or cable operation simulation have been widely used on XLPE or cable. It is widely known that with the higher heat resistance of XLPE, the heat transfer is rapid in a thin sheet while quite slow in a cable, especially in the heating and cooling phases, as shown in Figure 14. It is apparent that the heating and cooling phases in the thermal process via cable operation simulation are the two crucial factors for crystallization characteristics [33]. Considering the temperature evolution during the two phases, the same range and the different period mean the time duration and temperature rate. It is widely known that a longer duration or slower rate is beneficial for chains or section movement and rearrangement, which would contribute to more ordered crystalline and higher crystallinity. As shown in Figure 15, with the highest values of crystallinity and the lowest conductivity for the XLPE sheet of 7-year-serviced cable, no difference was observed, just a small variation, indicating that such short-term heat treatment, no matter the treatment methods, would result in a good similarity.

5. Conclusions

In the present study, a series of heat treatments were conducted on thermal-aged XLPE sheets or cables. The primary method used for heat treatment was applied to XLPE sheets, which served as the basis for the research. Subsequently, heat treatment was performed on the aged cable by cable operation simulation. Finally, the heat treatment was replicated on two retired cables. Based on the experimental studies mentioned above, the following conclusions were obtained:
(1)
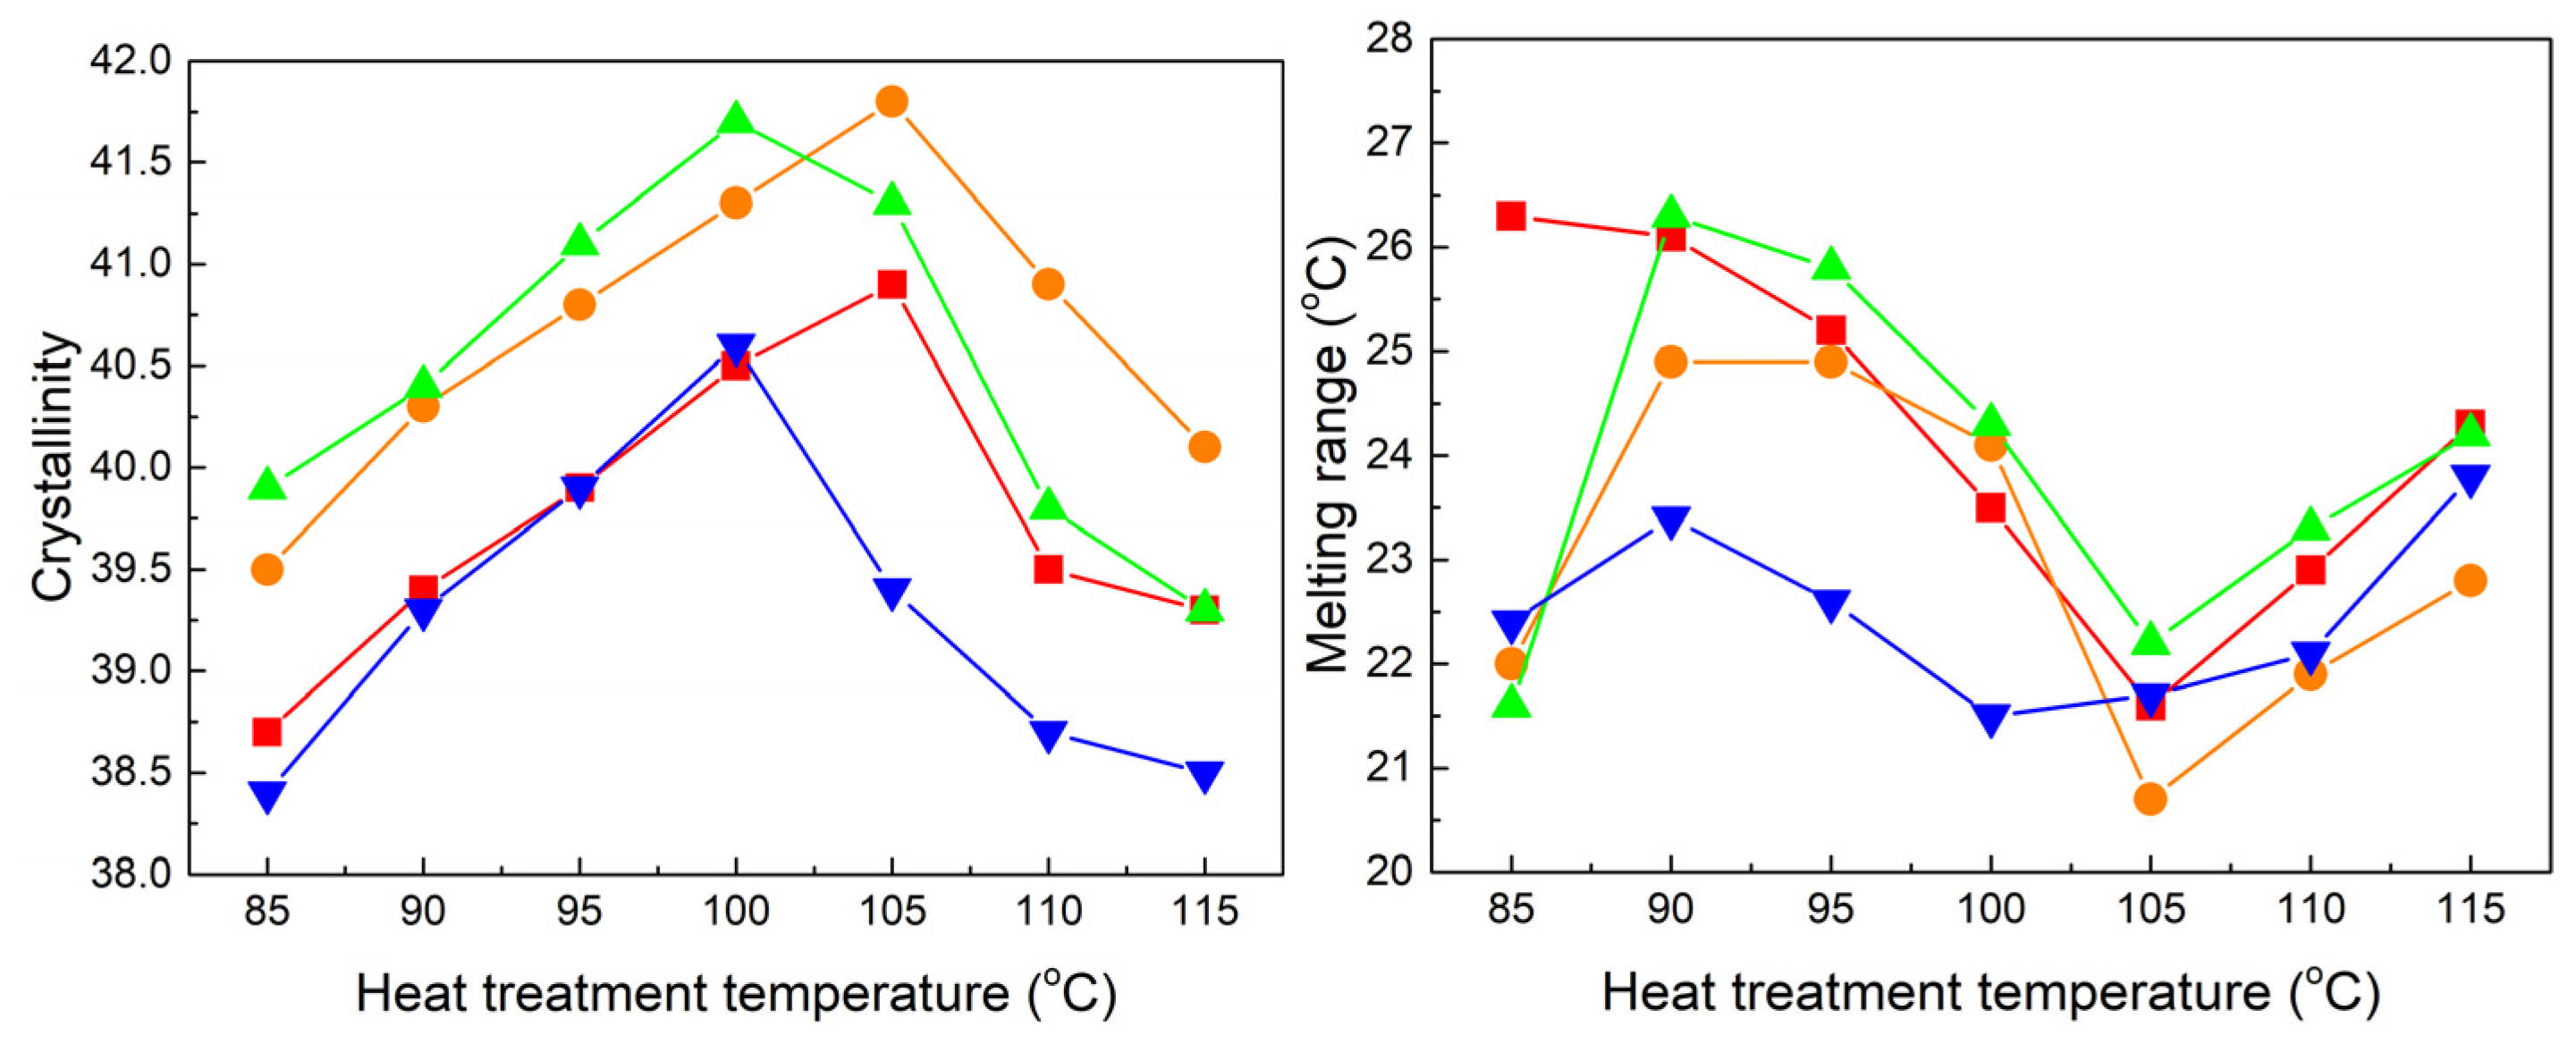
Regarding the aged XLPE sheets, it was consistently observed that the sheets aged for 60 days yielded the most favorable results in terms of fresh and thermal treatment. The highest and lowest values for crystallinity and melting range were achieved at treatment temperatures of 105, 105, 100, and 100 °C, respectively, while the conductivity showed optimal values at lower temperatures of 100, 100, 95, and 95 °C;
(2)
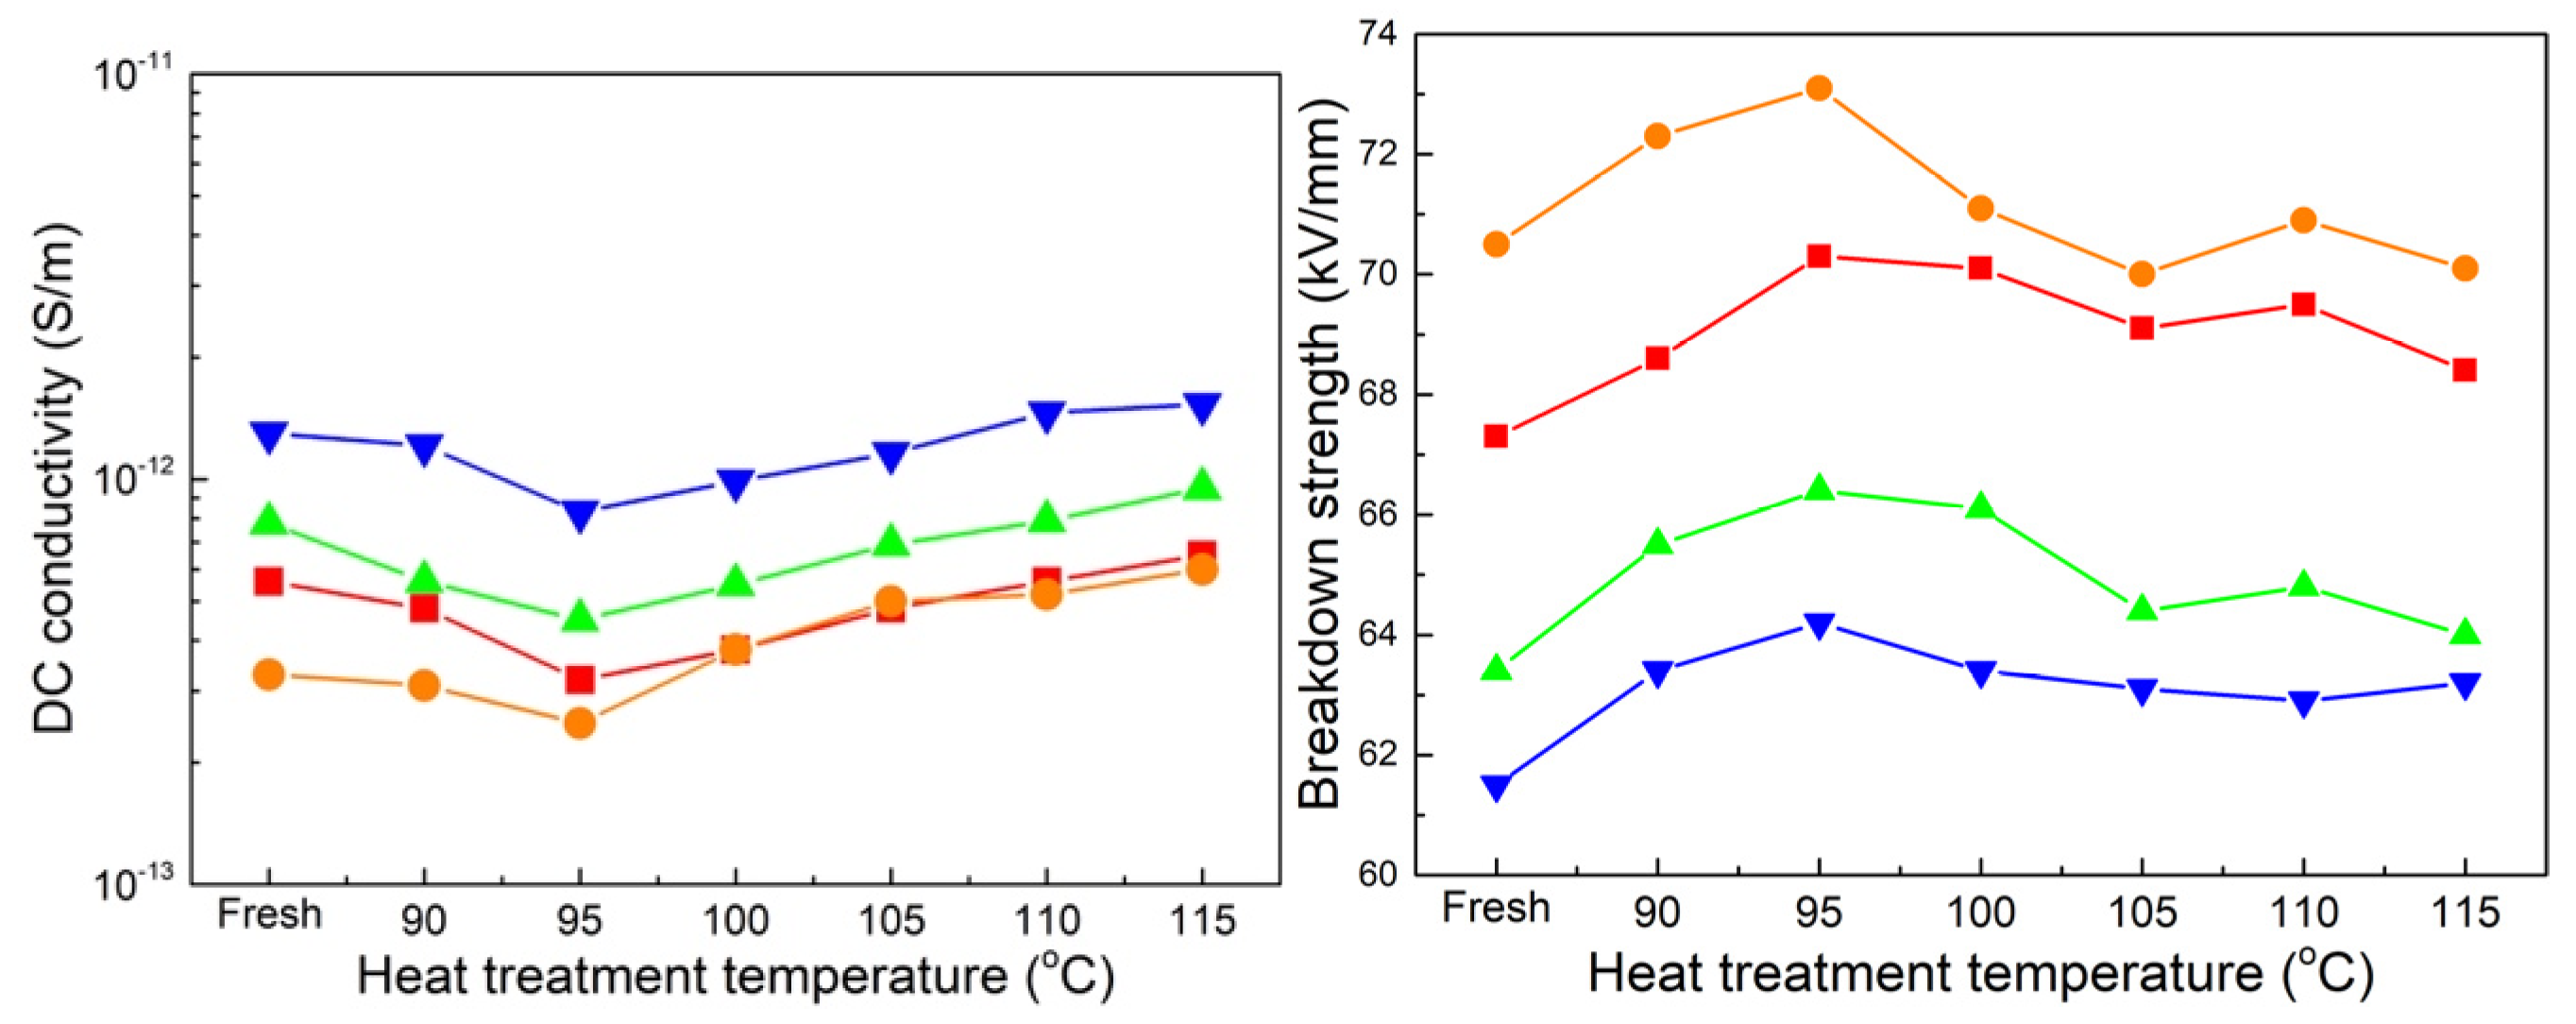
The cable operation simulation revealed that the variation tendencies in crystallinity and conductivity at each aging phase aligned with those obtained from the XLPE sheet treatment in the first stage. Additionally, the simulation conducted at 95 °C resulted in the highest breakdown strength, corresponding to the three aging phases. Minor fluctuations were observed in the changes in crystallinity and conductivity during the two short heat treatment processes;
(3)
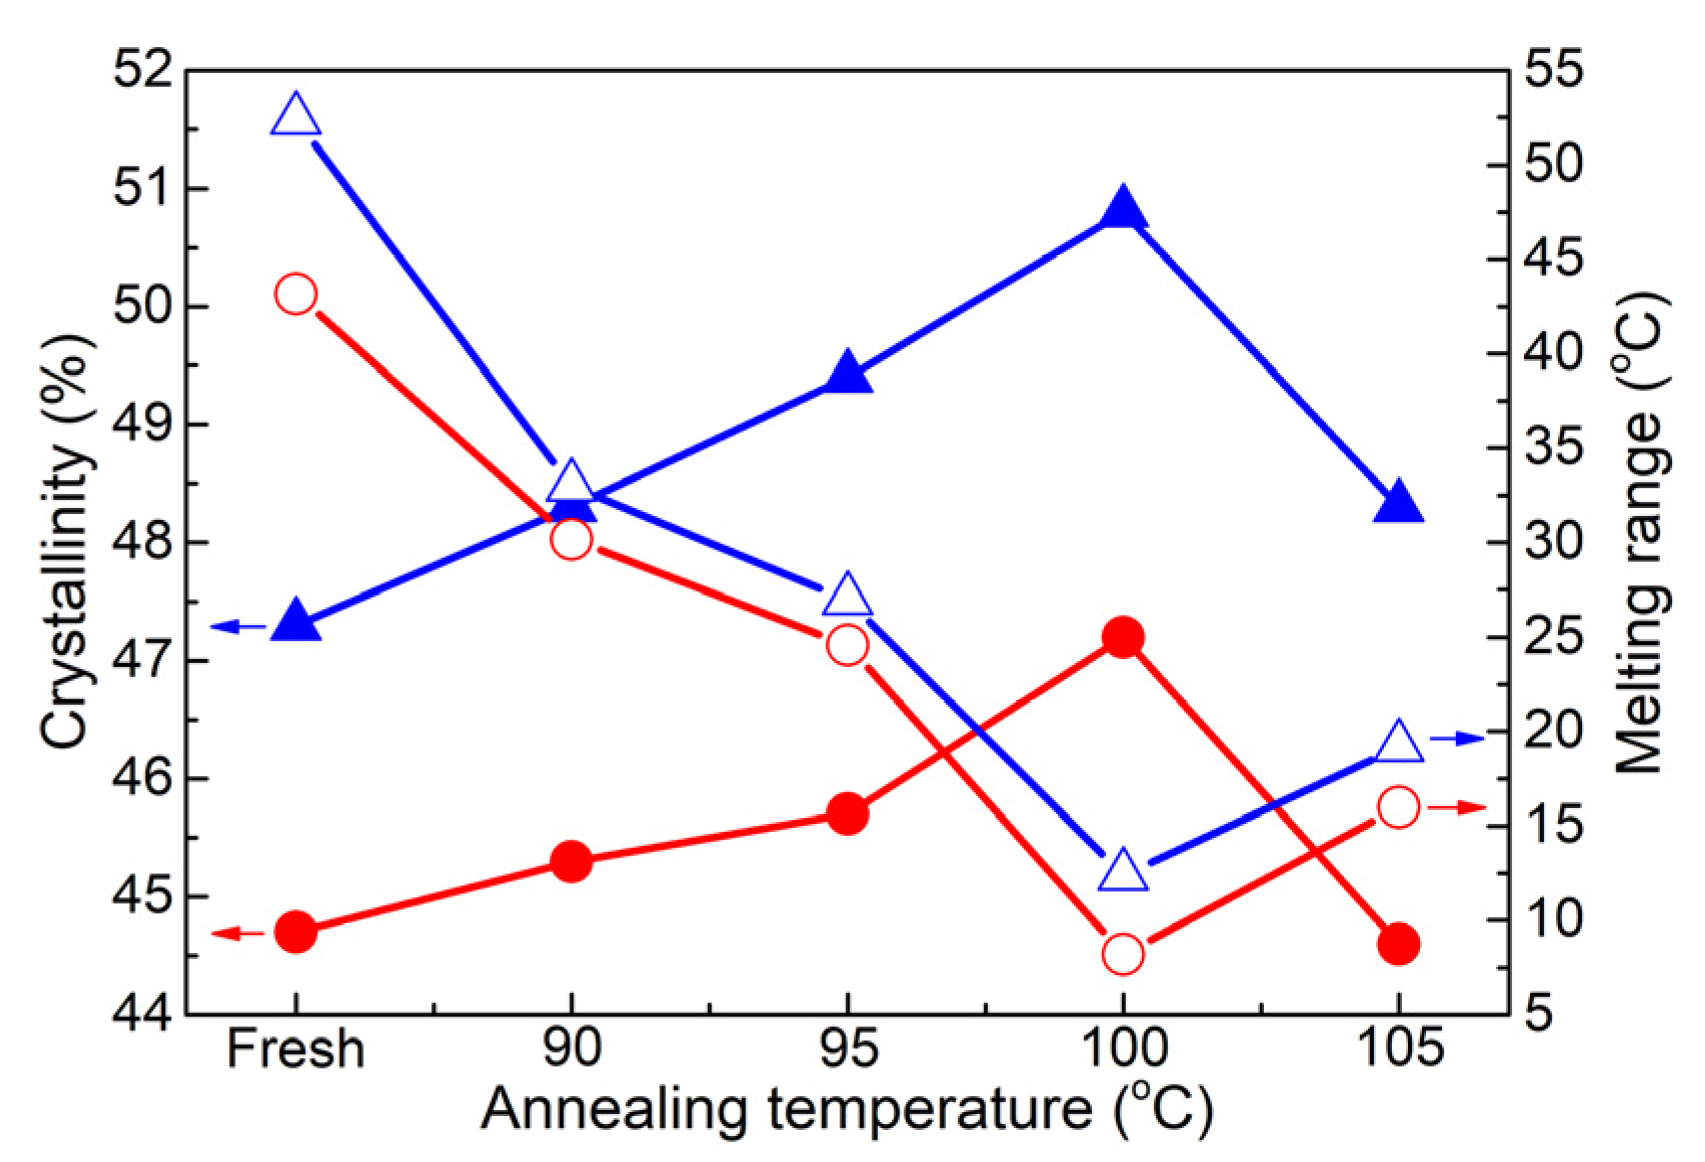
The heat treatment applied to the two retired cables demonstrated that the crystallinity, conductivity, and breakdown strength could be enhanced through the simulation of cable operation, even when the original conditions varied from those of the previous cables.

Author Contributions

Conceptualization, Y.X.; Methodology, Y.X.; Formal analysis, Y.Z., Y.L., J.Z. and Y.X.; Investigation, Y.L. and J.Z.; Visualization, Y.L.; Writing—original draft, Y.Z., J.Z. and Y.X.; Writing—review and editing, Y.X. All authors have read and agreed to the published version of the manuscript.

Funding

This research was funded by the projects of the State Key Laboratory of Nuclear Power Safety Monitoring Technology and Equipment, grant number K-A2021.425.

Data Availability Statement

Data is contained within the article.

Acknowledgments

All the authors acknowledge the support from the China Nuclear Power Engineering Co., Ltd. (Shenzhen, China), including the power and signal cable samples, detailed information about the metal tray, cable installment, etc.

Conflicts of Interest

The authors declare no conflicts of interest.

References

  1. Mook, K.H.; Kim, D.-H.; Gu, J.-U.; Choi, N.-S. Effect of Heat Treatment on Mechanical Properties of Cross-Linked Ultra-High Molecular Weight Polyethylene Used for Artificial Joint Liner. Compos. Res. 2009, 22, 227–233. [Google Scholar]
  2. Brown, K.; Wilson, S.; Thompson, G. Influence of Molecular Weight and Branching on the Crystallization Behavior of Cross-Linked Polyethylene. J. Polym. Sci. Part B Polym. Phys. 2019, 57, 550–558. [Google Scholar]
  3. Wang, L.; Zhang, Y.; Zhou, S. Evaluation of Environmental Aging and Durability of Retired Cables. Polym. Degrad. Stab. 2014, 108, 31–39. [Google Scholar]
  4. Liu, Y.; Sun, J.; Chen, S.; Sha, J.; Yang, J. Thermophysical properties of cross-linked polyethylene during thermal aging. Thermochim. Acta Int. J. Concerned Broader Asp. Thermochem. Its Appl. Chem. Probl. 2022, 713, 179231. [Google Scholar] [CrossRef]
  5. Chen, Y.; Liu, S.; Wang, P. Effect of Molecular Structure on the Crystalline Structure and Thermal Properties of Cross-Linked Polyethylene. Polym. Eng. Sci. 2018, 58, 230–237. [Google Scholar]
  6. Miyazaki, Y.; Hirai, N.; Ohki, Y. Changes in Chemical Structure and Mechanical Properties Induced in Cross-linked Polyethylene by Thermal and Radiation Aging. In Proceedings of the 2020 IEEE 3rd International Conference on Dielectrics (ICD), Virtual, 6–31 July 2020; IEEE: Piscataway, NJ, USA, 2020. [Google Scholar]
  7. Smith, J.; Johnson, R.; Anderson, L. Effect of Annealing on the Thermal and Mechanical Properties of Cross-Linked Polyethylene. J. Polym. Sci. Part B Polym. Phys. 2018, 56, 789–798. [Google Scholar]
  8. Huang, C.; Chen, G.; Li, Y. Crystalline Characteristics and Mechanical Properties of Cross-Linked Polyethylene with Different Molecular Structures. Polym. Degrad. Stab. 2017, 138, 56–64. [Google Scholar]
  9. Brown, K.; Wilson, S.; Thompson, G. Thermal Aging of Cross-Linked Polyethylene Insulation: A Review. IEEE Trans. Dielectr. Electr. Insul. 2015, 22, 3292–3306. [Google Scholar]
  10. Wang, L.; Zhang, Y.; Zhou, S. Influence of Molecular Structure on the Crystallinity and Electrical Properties of Cross-Linked Polyethylene. J. Appl. Polym. Sci. 2014, 131, 1–8. [Google Scholar]
  11. Mansour, D.A.; Abdel-Gawad, N.M.K.; El Dein, A.Z.; Ahmed, H.M.; Darwish, M.M.F.; Lehtonen, M. Recent Advances in Polymer Nanocomposites Based on Polyethylene and Polyvinylchloride for Power Cables. Materials 2021, 14, 66. [Google Scholar] [CrossRef]
  12. ISO 10147:1994; Estimation of the Degree of Crosslinking by Determination of the Gel Content. International Organization for Standardization: Delft, The Netherlands, 1994.
  13. Chen, X.; Li, Q.; Wang, L. Influence of Thermal Treatment on the Microstructure and Electrical Properties of Crosslinked Polyethylene. Polym. Eng. Sci. 2012, 52, 2658–2666. [Google Scholar]
  14. Garcia, E.; Martinez, F.; Fernandez, A. Characterization of Cross-Linked Polyethylene Treated with Thermal and Mechanical Methods. Mater. Sci. Forum 2011, 654–656, 885–888. [Google Scholar]
  15. Li, X.; Zhang, H.; Wang, J. Correlation between Crystallinity and Thermal-Electrical Performance of Cross-Linked Polyethylene. IEEE Trans. Dielectr. Electr. Insul. 2020, 27, 880–887. [Google Scholar]
  16. Johnson, D.; Roberts, L.; Davis, R. Thermal Treatment of Cross-Linked Polyethylene: Effects on Structure and Properties. J. Appl. Polym. Sci. 2008, 110, 1320–1329. [Google Scholar]
  17. Zhang, H.; Li, X.; Wang, J. Effects of Temperature on Crystallinity and Mechanical Properties of Cross-Linked Polyethylene. Polym. Eng. Sci. 2019, 59, 607–614. [Google Scholar]
  18. Chen, Y.; Liu, S.; Wang, P. Effects of Crystallinity on the Thermal Conductivity and Electrical Breakdown Strength of Cross-Linked Polyethylene. J. Appl. Polym. Sci. 2019, 136, 1–9. [Google Scholar]
  19. Brown, K.; Wilson, S.; Thompson, G. Effects of Crystallinity on the Thermal Aging Properties of Cross-Linked Polyethylene Insulation. IEEE Trans. Dielectr. Electr. Insul. 2019, 26, 1571–1578. [Google Scholar]
  20. Smith, J.; Johnson, R.; Anderson, L. Effects of Molecular Structure on the Crystalline Morphology and Properties of Cross-Linked Polyethylene. Polymer 2020, 191, 122267. [Google Scholar]
  21. Chen, Y.; Liu, S.; Wang, P. Investigating the Influence of Temperature on the Crystallinity of Cross-Linked Polyethylene. J. Appl. Polym. Sci. 2017, 134, 1–8. [Google Scholar]
  22. Huang, C.; Chen, G.; Li, Y. Temperature-Dependent Crystallization Behavior and Morphology of Cross-Linked Polyethylene. Polym. Bull. 2016, 73, 3425–3444. [Google Scholar]
  23. Smith, J.; Johnson, R.; Anderson, L. Evaluation of Electrical Performance of Retired Cables for Reuse. IEEE Trans. Power Deliv. 2020, 35, 1489–1497. [Google Scholar]
  24. Chen, Y.; Liu, S.; Wang, P. Influence of Crystallinity on the Thermal Aging Performance of Cross-Linked Polyethylene. Polym. Eng. Sci. 2018, 58, 1467–1474. [Google Scholar]
  25. Wang, L.; Zhang, Y.; Zhou, S. Crystallinity-Related Electrical Properties of Cross-Linked Polyethylene for High-Voltage Cable Insulation. Polym. Eng. Sci. 2017, 57, 1321–1327. [Google Scholar]
  26. Wang, L.; Zhang, Y.; Zhou, S. Influence of Temperature on the Crystallization Kinetics of Cross-Linked Polyethylene. Polym. Eng. Sci. 2015, 55, 1355–1361. [Google Scholar]
  27. Yang, S.; Lin, Y.; Chen, X. Effect of Temperature on the Crystallinity and Electrical Properties of Cross-Linked Polyethylene. J. Polym. Res. 2014, 21, 1–8. [Google Scholar]
  28. Brown, K.; Wilson, S.; Thompson, G. Assessment of Mechanical Properties and Aging Behavior of Retired Cables. J. Mater. Sci. 2019, 54, 11557–11567. [Google Scholar]
  29. Huang, C.; Chen, G.; Li, Y. Influence of Crystallinity on the Thermal Aging Behavior and Electrical Properties of Cross-Linked Polyethylene. Polym. Degrad. Stab. 2018, 149, 233–243. [Google Scholar]
  30. Qin, S.; Liu, R.; Wang, Q.; Chen, X.; Shen, Z.; Hou, Z.; Ju, Z. Study on the molecular structure evolution of long-term-operation XLPE cable insulation materials. Energy Rep. 2022, 8, 1249–1256. [Google Scholar] [CrossRef]
  31. Yang, S.; Lin, Y.; Chen, X. Effect of Crystallinity on the Thermal Conductivity and Electrical Breakdown Behavior of Cross-Linked Polyethylene. J. Polym. Res. 2016, 23, 1–9. [Google Scholar]
  32. Smith, J.; Johnson, R.; Anderson, L. Impact of Crystallinity on the Thermal Aging Behavior of Cross-Linked Polyethylene. J. Polym. Sci. Part B: Polym. Phys. 2020, 58, 241–250. [Google Scholar]
  33. Huang, C.; Chen, G.; Li, Y. Performance Testing and Analysis of Retired Cables for Insulation Integrity. J. Appl. Polym. Sci. 2017, 134, 45547. [Google Scholar]
Figure 1. Diagram of heat treatment experiments via cable operation simulation.
Energies 17 00655 g001
Figure 2. First cooling curves for thermally aged XLPE peels of the two sheets. Left is A; right is B.
Energies 17 00655 g002
Figure 3. Melting curves of the unaged samples. Left is sheet A; right is sheet B.
Energies 17 00655 g003
Figure 4. Melting curves of the 120-day-aged sheets. Left is sheet A; right is sheet B.
Energies 17 00655 g004
Figure 5. Results of crystallinity and melting range. (Solid symbols ■, ●, ▲, and ▼ represent the unaged, 60-, 120-, and 180-day-aged samples of sheet A; open symbols □, ○, △, and ▽ represent the unaged, 60-, 120-, and 180-day-aged samples of sheet B).
Energies 17 00655 g005
Figure 6. Electric conductivity measured at 90 °C. (■, ●, ▲, and ▼ represent the unaged, 60-, 120-, and 180-day-aged samples; Left is sheet A, and right is sheet B).
Energies 17 00655 g006
Figure 7. Melting curves for the unaged samples. Left is the unaged sheet; right is the 120-day-aged sheet.
Energies 17 00655 g007
Figure 8. Crystallinity and melting range as a function of heat treatment temperature. (■, ●, ▲, and ▼ represent the unaged, 60-, 120-, and 180-day-aged samples).
Energies 17 00655 g008
Figure 9. DC conductivity for all treated samples. (■, ●, ▲, and ▼ represent the unaged, 60-, 120-, and 180-day-aged samples).
Energies 17 00655 g009
Figure 10. Melting curves of the two cables. Left is cable C; right is cable D.
Energies 17 00655 g010
Figure 11. Crystallinity and melting range as a function of heat treatment temperature. (● and ▲ represent the samples from cables C and D; solid symbols represent the crystallinity, and open symbols represent the melting range).
Energies 17 00655 g011
Figure 12. DC conductivity and breakdown strength as a function of heat treatment temperature. (■ and ▲ represent the samples from cables C and D).
Energies 17 00655 g012
Figure 13. Heat treatment temperature corresponding to the highest crystallinity and the lowest conductivity for the aged sheets. (■ and ● represent the crystallinity and conductivity).
Energies 17 00655 g013
Figure 14. Diagram of temperature evolution process via heater and cable operation simulation.
Energies 17 00655 g014
Figure 15. Diagram of temperature evolution process via heater and cable operation simulation (■ and ● represent the XLPE sheet and peels after treatment on cable, solid symbols are the crystallinity, open symbol symbols are the DC conductivity).
Energies 17 00655 g015
Table 1. Specifications of two selected cables.
LabelService YearConductor Area
(mm2)
Insulation Thickness
(mm)
Insulation
Material
Conductor
Material
Service Period
A050019.8XLPECu2017–2023
B7100019.8XLPECu2010–2017
Table 2. Measured currents correspond to preset temperatures for cable B.
Preset TemperatureApplied Current (A)Preset TemperatureApplied Current (A)
9014501051675
9515201101770
10015951151865
Table 3. Specifications of two retired cables.
LabelService YearConductor Area
(mm2)
Insulation Thickness
(mm)
Insulation
Material
Conductor
Material
Service Period
C1570020XLPECu1985–2000
D3070020XLPECu1985–2015
Table 4. Applied currents correspond to preset temperatures for cables C and D.
Preset TemperatureApplied Current (A)Preset TemperatureApplied Current (A)
9011401051340
9511951101405
10012601151475
Disclaimer/Publisher’s Note: The statements, opinions and data contained in all publications are solely those of the individual author(s) and contributor(s) and not of MDPI and/or the editor(s). MDPI and/or the editor(s) disclaim responsibility for any injury to people or property resulting from any ideas, methods, instructions or products referred to in the content.

