Article

The Effect of the Vertical Layout on Underground Cable Current Carrying Capacity

1
GENETEK Power and Energy Company, 41275 Kocaeli, Türkiye
2
MERAM DSO Company, 42250 Konya, Türkiye
3
Electrical Engineering Department, Engineering Faculty, Kocaeli University, 41001 Kocaeli, Türkiye
*
Author to whom correspondence should be addressed.
Energies 2024, 17(3), 674; https://doi.org/10.3390/en17030674
Submission received: 21 December 2023 / Revised: 13 January 2024 / Accepted: 19 January 2024 / Published: 31 January 2024

Abstract

:
Underground cable installation in historical areas, natural protected areas, narrow streets, or residential areas with high traffic flows is very difficult due to both legal permits and the conditions of the work sites. The trefoil layout requires a smaller channel than the flat layout. However, the trefoil layout carries some risks, such as damage to the cables together in the event of short circuit faults and reduced ampacity in single-side-bonded systems. This study’s scope examines the current carrying capacities and thermal effects of directly buried underground cables in trefoil and vertical layouts using CYMCAP power cable analysis software. A field investigation was also carried out to verify the analysis results. The performance of the recommended method was evaluated by considering current and temperature measurements from the fieldwork and analysis. According to the studied cable design, the current carrying capacities of the cables in flat and vertical layouts are similar and higher than in the trefoil layout. However, it should be taken into consideration that these results will vary depending on a cable system’s design parameters. As a result, this article emphasizes that a vertical layout can be considered as a layout option in certain areas.

1. Introduction

Residential areas are rapidly changing from villages and rural areas to cities. With this population movement, the energy needed in urban areas will inevitably increase. To meet this need, new energy transmission lines are being installed as underground cables because overhead lines frequently malfunction due to bird strikes or branch falls. Finding the needed distribution line corridors in cities is difficult, and using high-voltage underground cables does not create visual pollution [1].
Numerous studies in the literature investigate the changes in the current carrying capacity of cables in the case of directly buried or thermally filled materials using either flat or trefoil placement methods [2]. Previous research studies [3,4,5] have focused on examining the impact of different factors on the ampacity of cables in varying thermal conditions. These factors include cable placement near heat sources, like steam pipes, using different backfill materials for underground cables, and air temperature for free-air cables. The studies conducted in [6,7,8,9] have examined changes in the thermal properties of different cable layers when the cable is placed in various environments, such as inside a tunnel or casing pipe or submerged in water. These studies also investigated the effects of changes in phase sequences on the cable. Various studies have highlighted the advantages of computer-based calculators and finite element methods for thermal calculations regarding cables. The reliability and accuracy of the results acquired using these methods have been demonstrated [10,11].
Thermal monitoring is a popular subject in the literature related to cable studies. By constantly monitoring the temperatures of cables online, studies could calculate the remaining life of the cables, perform dynamic calculations of ampacity values, plan dynamic line loading, and analyze critical loading conditions [12].
According to a review of the literature, much research has been conducted on the installation and operation phases of underground cables, and solutions have been investigated to solve many problems [13]. However, some difficulties have been encountered during the installation of underground cables [14].
Field installation of medium-voltage underground cable systems in Turkey is carried out according to standards set by the Turkey Electricity Distribution Company (TEDAS). The scope of these standards is limited for special cases. To install a new underground cable system, it is necessary to intervene in traffic flow and social life during the excavations. Another difficulty is that acquiring the permits necessary for excavation works to be carried out in protected areas has become very difficult in terms of the procedures involved. When all these difficulties were considered, our aim became to carry out an installation different from the usual installations and to examine the results.
In this article, a vertical layout method that requires a narrower cable duct to facilitate excavation works was studied to solve the problem. The current carrying capacities of the cables for the vertical and trefoil layouts were examined in CYMCAP V8.2 Rev.3 power cable analysis software. In this context, the methodology is explained in detail in Section 2. Also, the modeling studies carried out with CYMCAP power cable analysis software are explained in Section 3. The channel dimensions of the relevant layouts were calculated according to the analysis results. Field installation was carried out for these determined channel structures and layouts, as explained in Section 4. The performance of the recommended method was evaluated by taking current and temperature measurements from the field installation.

2. Methodology

This section explains the general structure of medium-voltage cables, frequently used cable installation systems, current carrying capacity calculation methods, and temperature monitoring techniques.

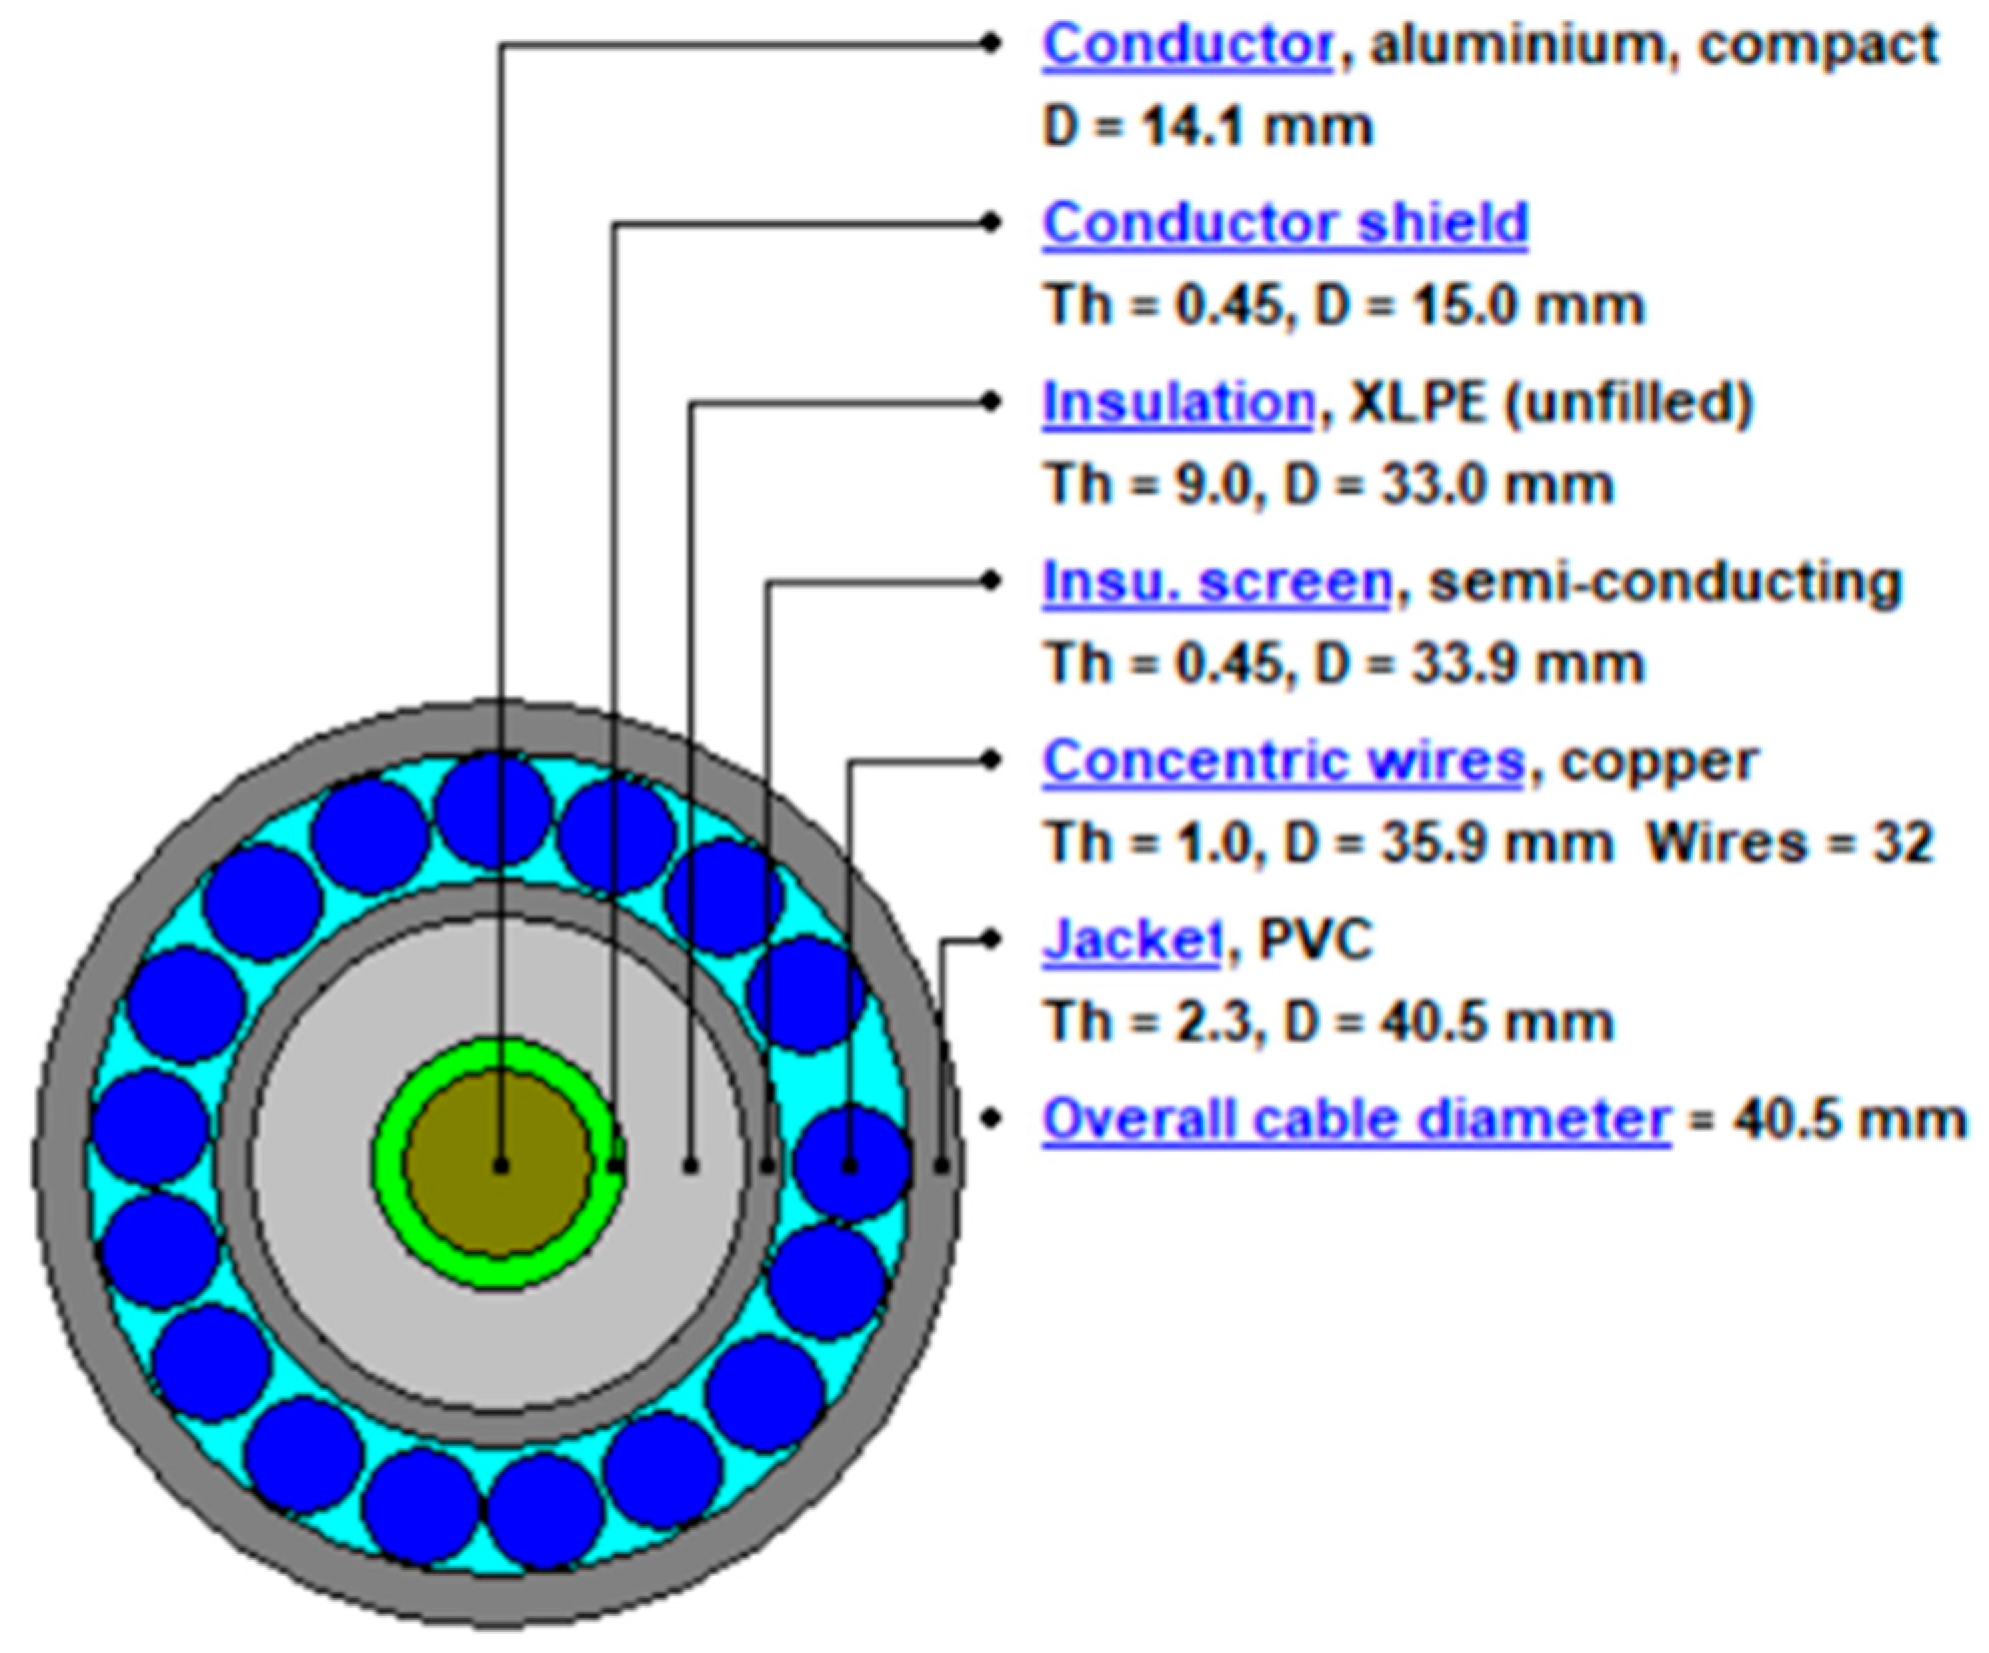
2.1. Cable Structure

Underground power cables used at medium-voltage levels are generally made of copper or aluminum conductors. The cables have conductive and insulating parts. Also, they contain semiconductor transition layers to regulate the electric field and minimize electrostatic stresses. Generally, a medium-voltage power cable has the following layers from inside to outside: conductor core (copper or aluminum), inner semiconductor, insulation (XLPE or PVC), outer semiconductor, metallic screen (copper or aluminum), inner sheath (PVC or PE), armor (copper or aluminum), and outer sheath (PVC or PE). Cables are also produced without armor, covered with an outer sheath over a metallic screen, and the most common types are these two cable structures [15]. The general structure of a medium-voltage cable is shown in Figure 1.
The insulating layer material determines the maximum allowed temperatures of the cable core. The allowed operating temperature for the cable core is 90 °C, and 70 °C for the cables with XLPE and PVC insulation material, respectively. The current carrying capacity of the cable depends on the permissible operating temperature.
The cable layout, soil thermal resistance, burial depth, and many other parameters affect the current carrying capacity. If a current flows over the current carrying capacity of a cable, the cable layers will not be able to withstand the heat and will be damaged. Over time, there will be malfunctions, such as partial discharge and cable bursts. For this reason, it is very important to calculate the current carrying capacity [16].

2.2. Cable Installation Systems

The installation method of the cable and the environmental conditions are very important regarding the current carrying capacity. The known cable layouts are flat and trefoil, and the generally preferred cable installation environments are as follows [17]:
  • Burying directly under the ground;
  • Tunnel;
  • Troughs;
  • Duct bank;
  • Casing pipe;
  • Free air.
When installing medium-voltage underground cables in Turkey, the observance of the conditions specified by TEDAS is compulsory for electricity distribution companies. The excavation works for the currently used cable channels affect the residential environment and take long time because the channel is wide and deep. The minimum dimensions of the standard cable channel specified in the legislation published by TEDAS are shown in Figure 2. In the legislation, it is stated that the depth of the cable channel should be at least 80 cm, the bottom width should be 40 cm, and the top width should be 60 cm [18].

2.3. Ampacity Equations

The current carrying capacity calculation is based on the IEC 60287 standard. The calculation method is similar to calculating the voltage drop in an electrical circuit. Since the cable layers’ conductive parts (core, metallic screen, and armor) generate heat, they are similar to a current source. Electrical resistances represent insulating layers due to their resistance to heat spreading [19,20,21]; this analogy is shown in Figure 3.
T resistances are calculated as in Equation (1):
T = ρ 2 π ln r 2 r 1
where
ρ: Thermal conductivity of the layer ( W m 1 K 1 ).
r 1 : Inner radius of the layer (mm).
r 2 : Outer radius of the layer (mm).
The thermal loss of the core is calculated as in Equation (2):
W c = R ac I 2
where
Rac: AC resistance of the core (Ohm).
I: Current flowing through the core (A).
The thermal loss of the metallic screen is calculated as in Equation (3):
W s = λ 1 W c
where
λ 1 : Loss factor of the metallic screen.
The thermal loss of the armor is calculated as in Equation (4):
W a = λ 2 W c
where λ 2 : Loss factor of the armor.
The thermal loss of the semiconductor is calculated as in Equation (5):
W d = 2 π f   U 0 2 tan ( δ )
where
f: Frequency (Hz).
U 0 : Phase to ground voltage (V).
tan ( δ ) : Insulator loss factor.
After the values of the resistances and current sources are calculated, the current carrying capacity is calculated as in Equation (6):
I = t - W d ( 1 2 T 1 + T 2 + T 3 + T 4 ) R ac T 1 + R ac ( 1 + λ 1 + λ 2 ) ( T 3 + T 4 )
The t in Equation (6) is the difference between the ambient temperature and the maximum permissible operating temperature, and it is calculated as in Equation (7):
t = t i   -   t a
where
t i : Maximum permissible operating temperature.
t a : Ambient temperature.
Although the IEC method is the most preferred method for calculating the current-carrying capacity of cables, there are also up-to-date studies on how to calculate the ampacity more precisely. In the CIGRE technical brochure 640 shared in 2015, the deficiencies of existing methods and suggestions to eliminate these deficiencies were made [22]. Also, other popular methods for current carrying capacity calculation are computer-based analytical and numerical (finite element method) programs [23,24].

2.4. Cable-Monitoring Techniques

The thermal monitoring of cable temperatures is becoming increasingly popular as it improves system security and efficiency. By monitoring the cable temperature, the remaining cable life can be calculated, and investment costs can be evaluated. By planning predictive maintenance applications according to temperature values, malfunctions can be prevented, and safer energy transmission can be achieved. In addition, temperature monitoring systems provide advantages such as dynamic loading and flexible feeding conditions.
There are two thermal monitoring methods that can be utilized. One is the Distributed Temperature Sensing (DTS) method, which measures the temperature inside the cable directly with the fiber line along the cable. The other is the Real-Time Temperature Rating (RTTR) method, in which the cable’s internal temperature is calculated with the temperature measurements taken from the cable sheath [25,26].

3. Modeling Studies

For directly buried underground cables, the flat and trefoil layouts could be preferred for installations. This study examined the vertical layout as an alternative to these two layout methods. CYMCAP Power Cable analysis software was used in the analyses to evaluate the electrical performances of the different layout methods [27].
During the simulation study, (N)A2XSY 150 mm2 cable was used. The dimensions of the cable are shown in Table 1.
The cable model created in CYMCAP software for the dimensions in Table 1 is shown in Figure 4.
The conditions and assumptions created for the analyses are as follows:
  • According to the IEC 60287 standard, the ambient temperature of soil is assumed to be 20 °C.
  • According to the network regulation, the frequency and voltage levels are 50 Hz and 34.5 kV, respectively.
  • The cables are grounded at both ends.
  • The burial depth is 1 m.
  • For vertical and flat layouts, the distance between phases is 7 cm.
  • The soil thermal resistance is 1 °C m/W.
The results of the current carrying capacity analysis for the flat, trefoil, and vertical layout situations are shown in Figure 5, Figure 6 and Figure 7, respectively.
The calculated current carrying capacities are shown in Table 2. According to the results, the current carrying capacity does not change for the flat and vertical layouts. However, the trefoil layout’s current carrying capacity is slightly less for the analyzed design.
The screens of cables are grounded at both ends, and it should be considered that in the flat and vertical layouts, screen currents affect the current carrying capacity more negatively than the trefoil method. In applications where the screens of cables will be grounded from one side, better results will be obtained with the vertical method than with the trefoil method regarding the current carrying capacity. On the other hand, since all three phase cables come into contact with each other in the trefoil layout, the other two cables will be affected by any negative effects, such as burning or an explosion, that may occur in one cable. However, there is no such problem in a vertical layout.
The trefoil layout can be preferred when narrower cable ducts are needed where excavation work is difficult, but the mentioned risks necessitated the search for an alternative to this layout. For this reason, field studies were carried out to evaluate the application performance of the vertical layout, which was analyzed within the scope of this study.

4. Field Studies

According to the analysis results shown in Section 3, the vertical method is applicable regarding the electrical parameters. Thereupon, its performance was evaluated using field application.

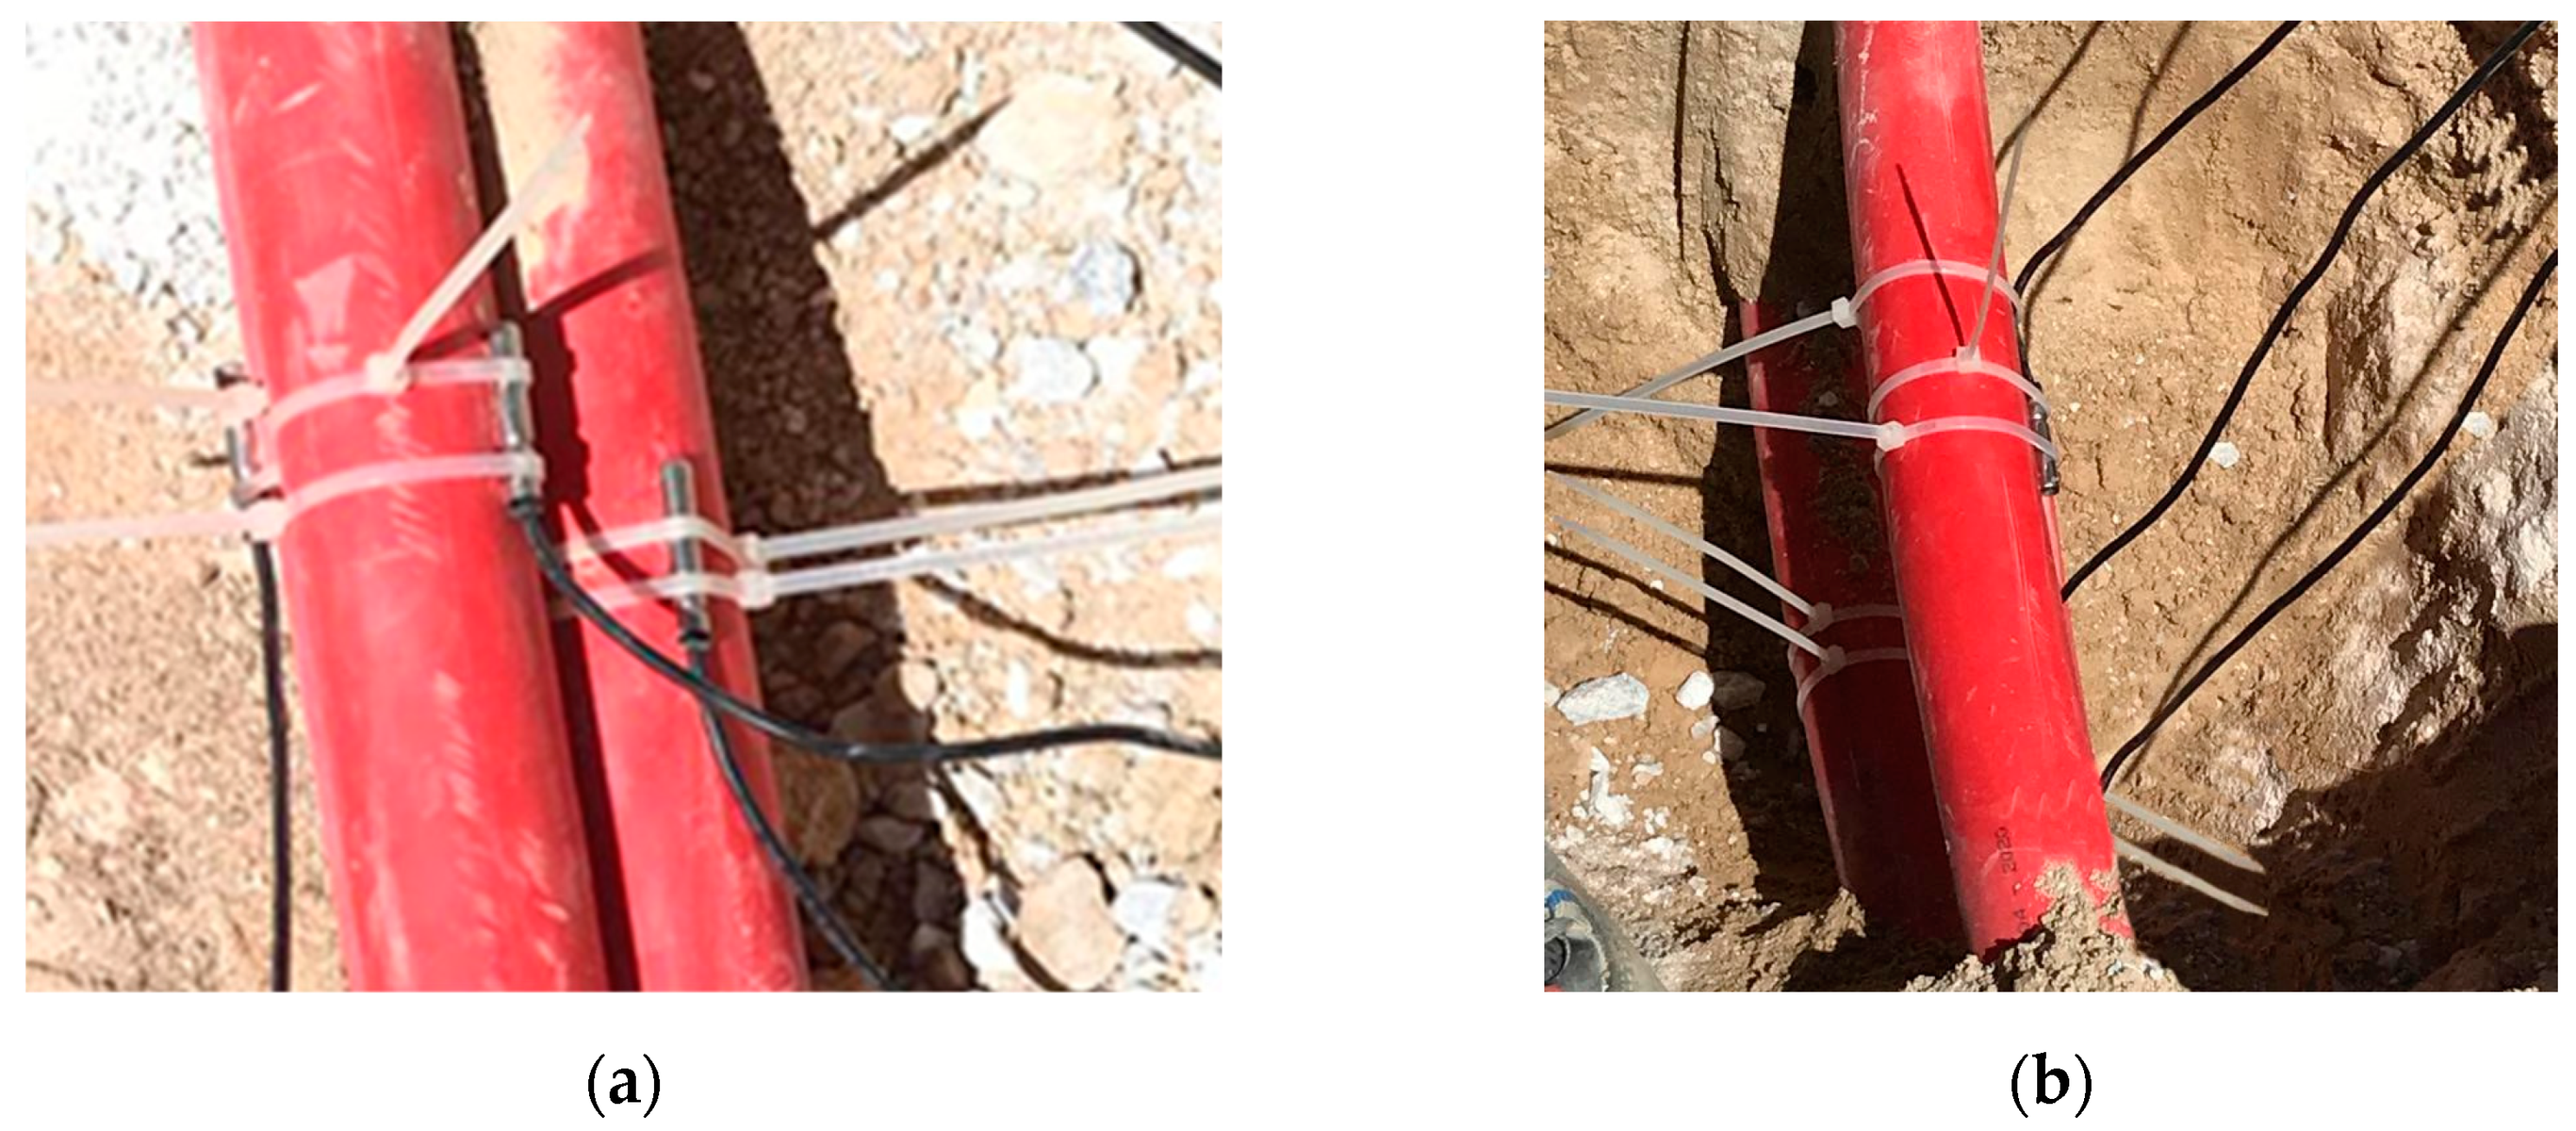
4.1. Channel Scheme and Excavations

Applying the existing channel structure shown in Section 2 affects daily life in a wider environment and for a longer period. It is also very difficult to obtain the necessary permissions for excavation operations to be carried out in such dimensions in areas with many protected areas and historical buildings, such as Konya, the application region.
As can be seen in Figure 2, in standard cable ducts, approximately 65 cm should be left between the top of the channel and the cable. This study proposes an alternative to underground cable installation by reducing channel sizes in harsh environments where large channels cannot be excavated. However, using double rows of bricks in the channel, considering the risks that mechanical effects may cause, these bricks should be 5 cm thick, as defined in the standards. The recommended channel dimensions for vertical and trefoil cable installations that require less depth and narrower channels are calculated as follows. For the vertical layout, the necessary cable channel to be excavated is shown in Figure 8.
The 10 cm filling material should be laid on the channel floor for bedding. Then, each cable should be pulled one by one and covered with filler. After the last cable is pulled and covered with filling material, the brick used for security purposes should be placed on top of each other in double rows. The channel should be filled and closed with 5 cm between the brick and the warning tape, and 10 cm between the warning tape and the floor. Accordingly, the channel height is calculated as in Equation (8):
H = 25   c m + 3 d + 3 k + 2 t
k = 7   cm , d < 7   cm        d , d 7   cm
where
H : Channel depth (cm).
d : Cable diameter (cm).
k : Distance between the cables and between the top cable and brick (if the cable diameter d is less than 7 cm, then k = 7 cm; if cable diameter d is greater than 7 cm, then k = d).
t : The height of the protective brick (cm).
The channel width was determined as minimum 30 cm considering the excavation possibilities and the risk of slipping of the soil. Channel width is calculated as in Equation (10):
G = 30   cm , d < 7   cm d + 2 a , d 7   cm
a = 2 d
where
G : Channel width (of the cable diameter d is less than 7 cm, then G = 30 cm; if cable diameter d is greater than 7 cm, then G = d + 2a).
d : Cable diameter.
a : Distance between the cable and channel wall.
Since the diameter of the 150 mm2 aluminum cable that is used in the application is 4 cm, the channel height is calculated as 68 cm according to Equation (8). The channel width is calculated as 30 cm according to Equation (10).
For the trefoil layout, the cable channel to be excavated is shown in Figure 9.
The 10 cm filling material should be laid on the channel floor for bedding. Then, two cables should be laid side-by-side and adjacent, and the third one should be laid on them in a triangular bundle. The cables should be covered with filling material. The bricks used for security purposes should be placed on top of each other in double rows. Finally, the channel should be filled and closed with 5 cm between the brick and the warning tape, and 10 cm between the warning tape and the floor. Accordingly, the channel height is calculated as in Equation (12):
H = 25   c m + 2 d + k + 2 t
k = 7   cm , d < 7   cm        d , d 7   cm
where
H : Channel depth.
d : Cable diameter.
k : Distance between the cables and between the top cable and brick (If the cable diameter d is less than 7 cm, then k = 7 cm; if cable diameter d is greater than 7 cm, then k = d ).
t : The height of the protective brick.
The channel width was determined as minimum 30 cm considering the excavation possibilities and the risk of slipping of the soil. Channel width is calculated as in Equation (14):
G =      30   cm , d < 5   cm    2 d + 2 a , d 5   cm
a = 2 d
where
G : (If the cable diameter d is less than 5 cm, then G = 30 cm; if cable diameter d is greater than 5 cm, then G = 2 d + 2 a ).
d : Cable diameter.
a : Distance between the cable and channel wall.
Since the diameter of the 150 mm2 aluminum cable is 4 cm, the channel height is calculated as 50 cm according to Equation (12). The channel width is calculated as 30 cm according to Equation (14).
In the application, a channel is proposed with a narrower structure than the previously used cable channels. Digging equipment suitable for excavation is not available since these channels have not been applied before. For this reason, a 30 cm wide digger mouth was produced specifically to dig the proposed channels (Figure 10).

4.2. Measurement System and Data

After the cables were laid in the opened channel, the necessary systems were established to record the data. The temperatures of the cables were measured with PT100 temperature sensors fixed to the cable surfaces (Figure 11).
The temperature values measured with the sensors were recorded with a data logger device that recorded minute averages. A web-based remote monitoring interface was designed to continuously monitor the recorded data (Figure 12).
During the measurement, an energy analyzer communicating with the SCADA system was placed in the medium voltage cell, to which the cables were connected. With this energy analyzer, the current flowing through the cable was recorded in 10 min averages. The measured current value was also applied on the same scale in the analysis studies.
Soil thermal resistance, a very important parameter in current carrying capacity, was measured at the beginning of the field studies. Information on the thermal resistance of the backfill used in the bedding process, which can affect the cables thermally, was obtained from the material supplier. The two materials have similar thermal properties, and the thermal resistance for both is 1 °C m/W.
The measurement data includes the dates between 24 July 2020 and 17 September 2020. However, the measurement data for one day were shared on the charts for a simple narrative. The dashed line in the graphs shows phase currents, the dashed lines marked with shapes show the cable’s surface temperatures for the trefoil placement, and the straight lines marked with shapes show the cable’s surface temperatures for the vertical placement. The current and temperature measurement for the day dated 27 July 2020 is shown in Figure 13.
It is seen that the current value flowing through the cables peaked at 21:00:00 and reached 285.5 amperes. At this moment, the highest temperature measured from the cable surfaces for the vertical layout is 43.9 °C. For the trefoil layout at the same time, the highest temperature of the cable surface is 50.0 °C.

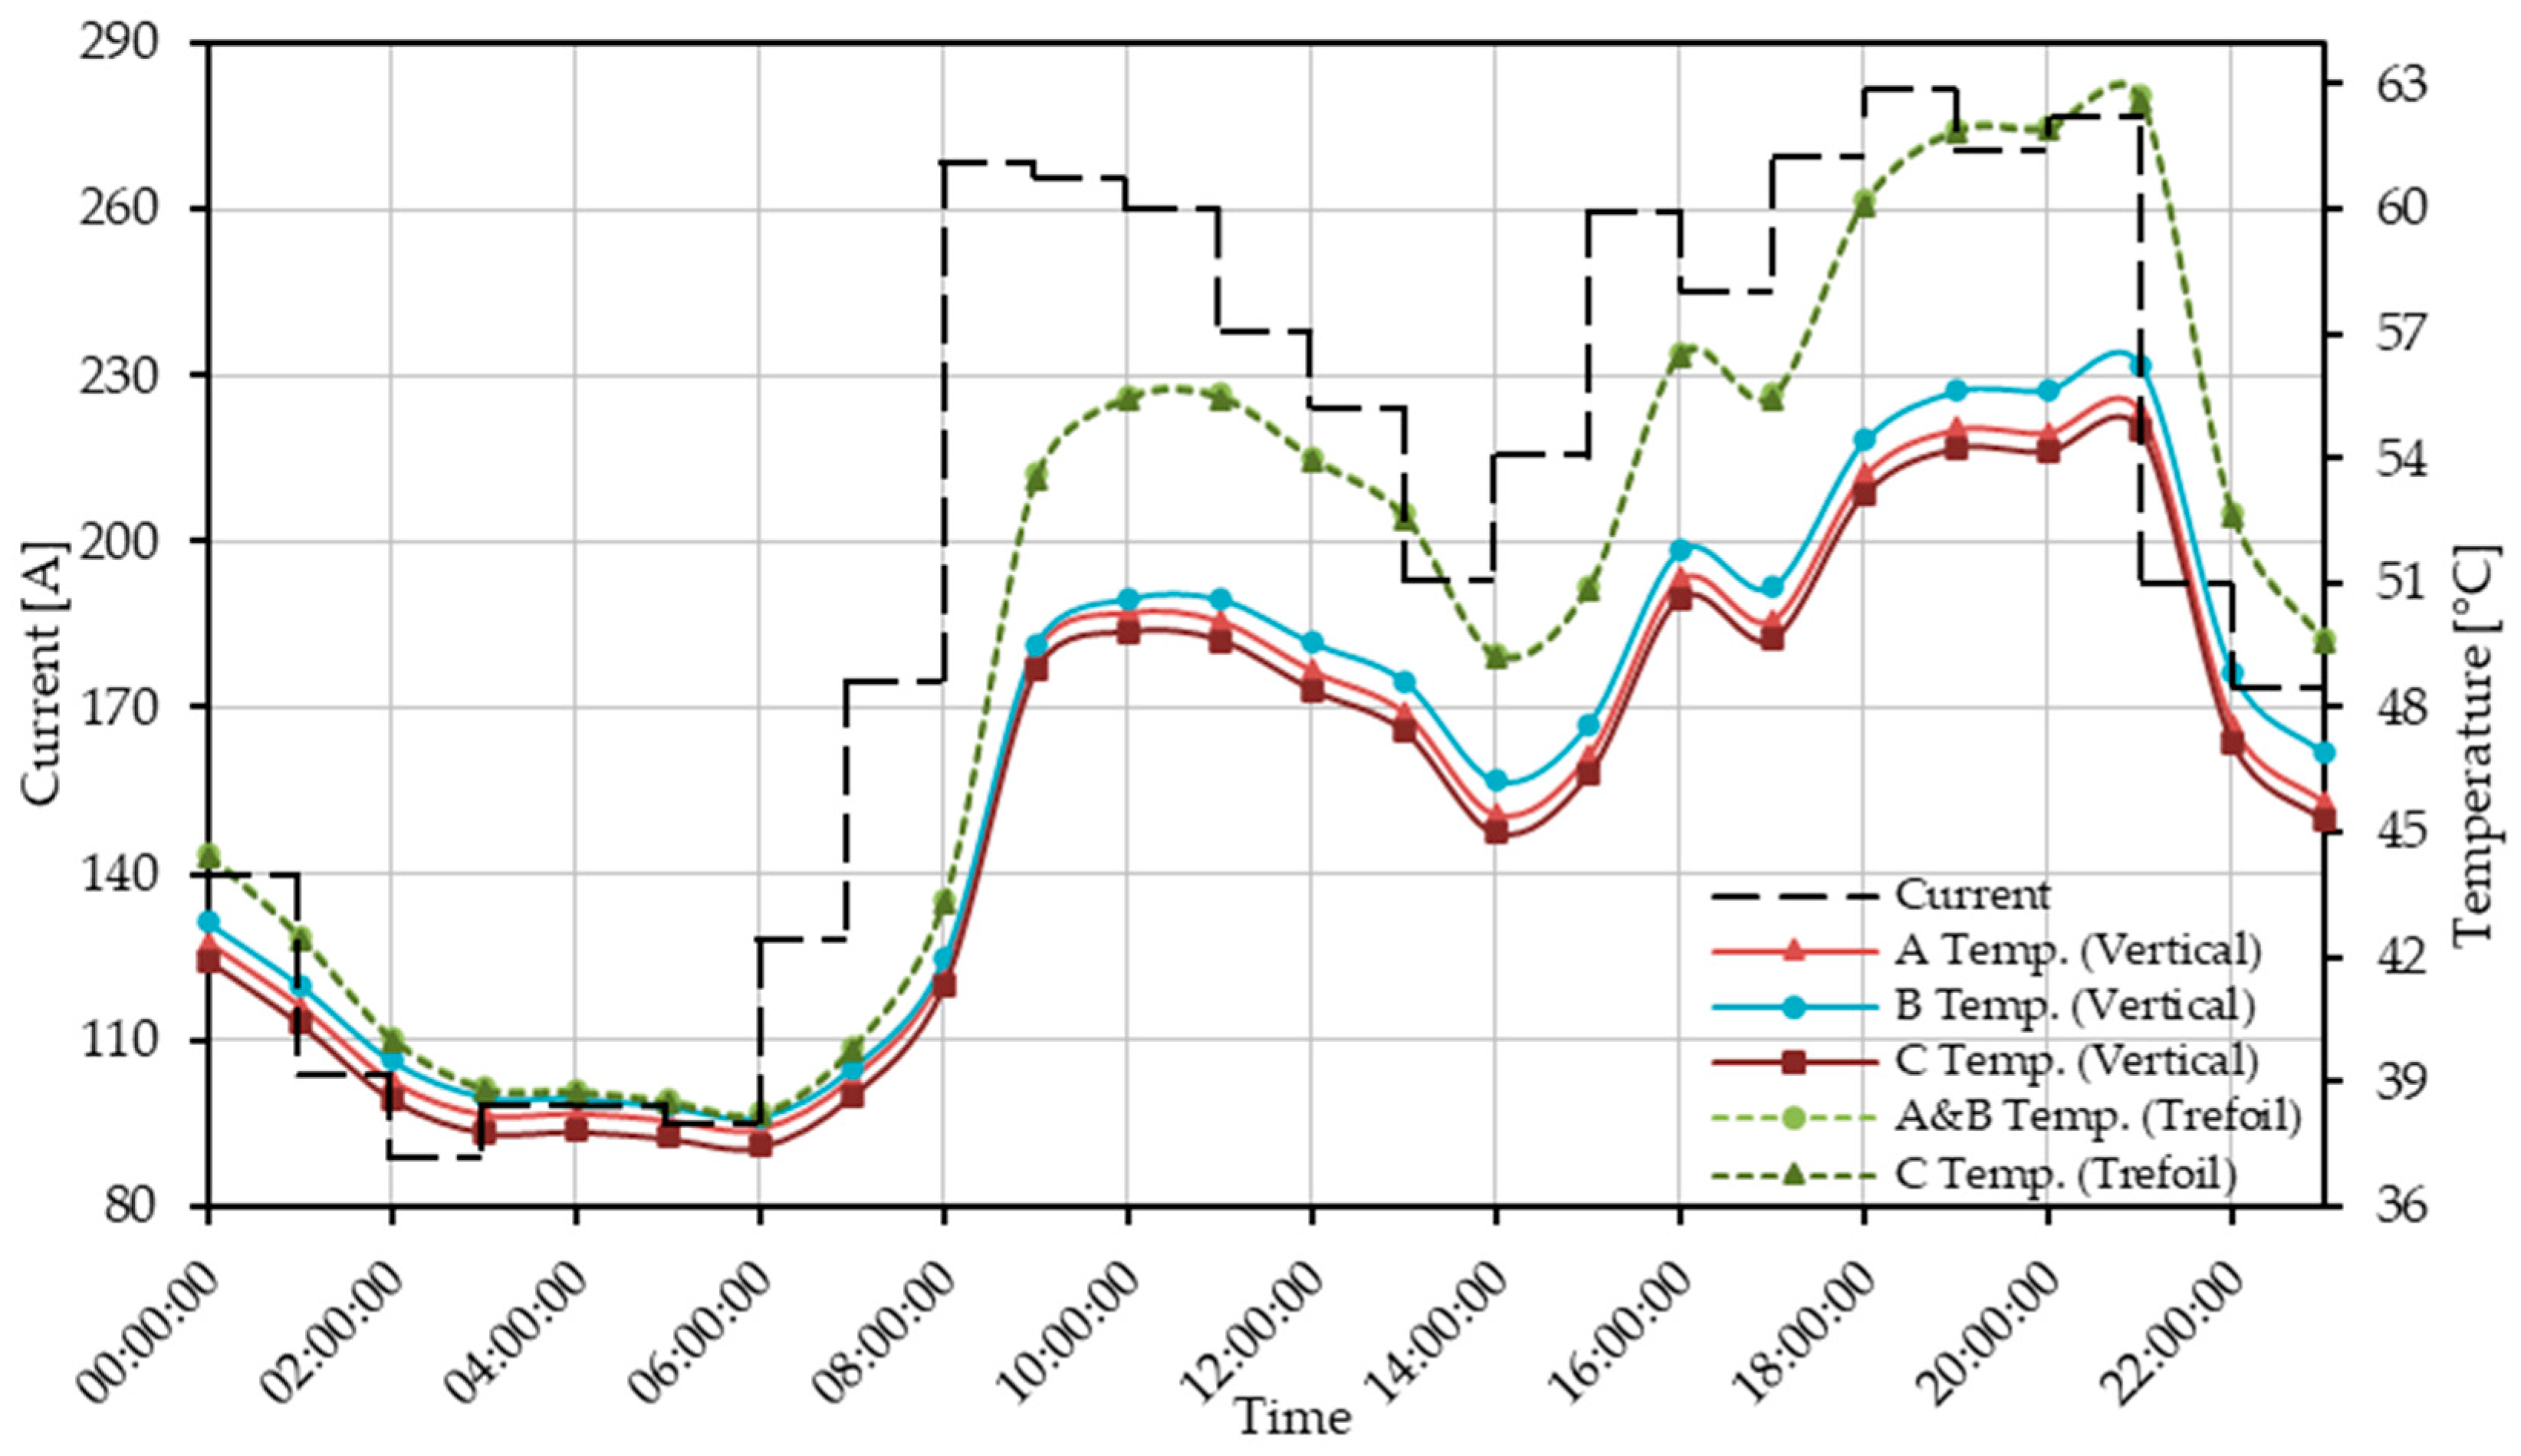
4.3. Analysis Results

The data shared by the Turkish State Meteorological Service was considered for ambient temperature information, which is one of the most important parameters affecting the analysis results. Based on the data, the soil temperature remained at 27 °C throughout the day with no significant fluctuations. For this reason, the analysis studies were conducted at an ambient temperature of 27 °C.
According to the measurement data, the load profile was defined to the vertical and trefoil layout models created in CYMCAP analysis software. Analysis results were obtained for the cable’s surface temperature according to time and the applied load profile. On 27 July 2020, the cable surface temperature results obtained for the trefoil and vertical layouts are shown in Figure 14.
The measurement and analysis data show that the surface temperature results were consistent. Both the shared measurement data and the analysis result show that the moment when the cable surface reaches the highest temperature value is 21:00:00. The measurement and analysis results at this moment were determined for both placement methods and are shown in Table 3.
Even the highest difference observed between the measurement data and analysis results does not exceed 2%. Thus, the analyses were confirmed with measurement data.
As it is known, compared with the surface temperature of the cable, the core temperature of the cable is a more critical value in terms of both current carrying capacity and life studies. However, if a temperature sensor is not placed inside the cable during manufacturing, the core temperature can be determined using analysis and calculation methods instead of direct measurement. For this reason, the analyses were repeated for the same current profile, and the temperatures of the cable cores were determined for both layout methods. According to the analysis, the results obtained for the trefoil and vertical layouts are shown in Figure 15.
When the results are examined, the cable cores in the trefoil layout reach a maximum of 63 °C, and in the vertical layout, the highest core temperature is 56 °C. As seen in the analysis results, cables in vertical layout heat less with the same current profile. In this case, the vertical layout emerges as an advantage regarding providing optimum benefit from cables and a sustainable energy distribution system.

5. Discussion

In this study, the layouts of underground power cables were examined. This study was carried out for a single-core, solidly bonded, three-phase, and single-circuit cable system. For power cables, side-by-side and 7 cm distances between phases are widely used. However, it becomes difficult to apply a flat layout in places such as narrow streets or historically protected areas where there is not enough excavation area. Within the scope of this study, the vertical and trefoil layout methods were evaluated as alternatives to flat layouts. Current carrying capacities and thermal effects were analyzed for the proposed methods. CYMCAP analysis software was used to calculate the current carrying capacity in non-standard layouts.
Based on the results of the analysis, a field application was carried out in the Konya state of TURKEY using the vertical and trefoil layout methods. In the application, temperature and current measurements were taken from the cables for the vertical and trefoil layouts. The application conditions performed with the obtained data were modeled again in CYMCAP software, and the accuracy of the analysis was verified.
As a result of this study, it was concluded that cables in the vertical layout have the same current carrying capacity as cables in the flat layout. In contrast, the current carrying capacity of cables in the trefoil layout changes slightly. For the trefoil layout, the change in current carrying capacity may increase or decrease depending on the cable structure, the ratio between the core cross-section and the metallic screen cross-section, and the bonding type. It is seen that vertical and trefoil layouts can be an alternative to flat layouts.
It is observed that the current carrying capacities of cables can vary based on their layout and ambient conditions. It is recommended to model the cable system and environmental conditions with analysis software. This will determine the most efficient cable assembly method and ensure correct cable operation for years.

Author Contributions

Conceptualization, validation, supervision, and writing—review and editing, B.A. (Bora Alboyaci). Methodology, software, formal analysis, visualization, and writing—original draft preparation, A.O., B.A. (Burak Altun), and Y.B.D. All authors have read and agreed to the published version of the manuscript.

Funding

This project is an R&D Project supported by EMRA with EBIS Number 705086.

Data Availability Statement

Data are contained within the article.

Acknowledgments

The authors would like to thank Electricity Distribution Inc. (MEDAS) for their support during the field studies.

Conflicts of Interest

Authors Ahmet Ozyesil and Yunus Berat Demirol were employed by the GENETEK Power and Energy Company. Author Burak Altun was employed by the MERAM DSO Company. The remaining authors declare that the research was conducted in the absence of any commercial or financial relationships that could be construed as a potential conflict of interest.

References

  1. Kara, S.; Alboyacı, B.; Ozyesil, A. Analysis of Armor Grounding Methods in Medium Voltage Underground Power Cables. J. Polytech. 2022, 25, 1587–1594. [Google Scholar] [CrossRef]
  2. Czapp, S.; Ratkowski, F. Optimization of Thermal Backfill Configurations for Desired High-Voltage Power Cables Ampacity. Energies 2021, 14, 1452. [Google Scholar] [CrossRef]
  3. Enescu, D.; Colella, P.; Russo, A. Thermal Assessment of Power Cables and Impacts on Cable Current Rating: An Overview. Energies 2020, 13, 5319. [Google Scholar] [CrossRef]
  4. Masnicki, R.; Mindykowski, J.; Palczynska, B. Experiment-Based Study of Heat Dissipation from the Power Cable in a Casing Pipe. Energies 2022, 15, 4518. [Google Scholar] [CrossRef]
  5. Brakelmann, H.; Anders, G.J.; Zajac, P. Fundamentals of the Thermal Analysis of Complex Arrangements of Underground Heat Sources. Energies 2021, 14, 6813. [Google Scholar] [CrossRef]
  6. Zhu, W.; Zhao, Y.; Han, Z.; Wang, X.; Wang, Y.; Liu, G.; Xie, Y.; Zhu, N. Thermal Effect of Different Laying Modes on Cross-Linked Polyethylene (XLPE) Insulation and a New Estimation on Cable Ampacity. Energies 2019, 12, 2994. [Google Scholar] [CrossRef]
  7. Cywiński, A.; Chwastek, K.; Kusiak, D.; Jabłoński, P. Optimization of Spatial Configuration of Multistrand Cable Lines. Energies 2020, 13, 5923. [Google Scholar] [CrossRef]
  8. Riba, J.-R.; Llauradó, J. A Model to Calculate the Current–Temperature Relationship of Insulated and Jacketed Cables. Materials 2022, 15, 6814. [Google Scholar] [CrossRef]
  9. Zhang, Y.; Chen, X.; Zhang, H.; Liu, J.; Zhang, C.; Jiao, J. Analysis on the Temperature Field and the Ampacity of XLPE Submarine HV Cable Based on Electro-Thermal-Flow Multiphysics Coupling Simulation. Polymers 2020, 12, 952. [Google Scholar] [CrossRef]
  10. Zhu, H.; Han, Z.; Yang, J.; Zhang, R.; Liu, C.; Chen, W.; Cao, Y. Multi-factor simulation analysis of operation characteristics of side-by-side directly buried cables. Electr. Power Syst. Res. 2023, 218, 109143. [Google Scholar] [CrossRef]
  11. Szczegielniak, T.; Jabłoński, P.; Kusiak, D. Analytical Approach to Current Rating of Three-Phase Power Cable with Round Conductors. Energies 2023, 16, 1821. [Google Scholar] [CrossRef]
  12. Enescu, D.; Colella, P.; Russo, A.; Porumb, R.F.; Seritan, G.C. Concepts and Methods to Assess the Dynamic Thermal Rating of Underground Power Cables. Energies 2021, 14, 2591. [Google Scholar] [CrossRef]
  13. Oclon, P.; Rerak, M.; Rao, R.V.; Cisek, P.; Vallati, A.; Jakubek, A.; Rozegnal, B. Multiobjective optimization of underground power cable systems. Energy 2021, 215, 119089. [Google Scholar] [CrossRef]
  14. WG B1.61. Installation of Underground HV Cable Systems; CIGRE: Paris, France, 2022. [Google Scholar]
  15. WG B1.44. Guidelines for Safe Work on Cable Systems under Induced Voltages or Currents; CIGRE: Paris, France, 2020. [Google Scholar]
  16. Holyk, C.; Anders, G.J. Power cable rating calculations—A historical perspective. IEEE Ind. Appl. Mag. 2015, 21, 6–64. [Google Scholar] [CrossRef]
  17. WG B1.56. Power Cable Rating Examples for Calculation Tool Verification; CIGRE: Paris, France, 2022. [Google Scholar]
  18. Project and Facility Department. Elektrik Dagitim Sebekeleri Enerji Kablolari Montaj (Uygulama) Usul ve Esaslari; TEDAS: Ankara, Turkey, 2021. [Google Scholar]
  19. IEC Standard 60287-1:2023; Calculation of the Current Rating, Part 1. International Electrotechnical Commission: Geneva, Switzerland, 2023.
  20. IEC Standard 60287-2:2023; Calculation of the Current Rating, Part 2. International Electrotechnical Commission: Geneva, Switzerland, 2023.
  21. Neher, J.H.; McGrath, M.H. The Calculation of the Temperature Rise and Load Capability of Cable Systems. AIEE Trans. Part III Power Appar. Syst. 1957, 76, 752–772. [Google Scholar] [CrossRef]
  22. WG B1.35. A Guide for Rating Calculations of Insulated Cables; CIGRE: Paris, France, 2015. [Google Scholar]
  23. Demirol, Y.B.; Kalenderli, O. Investigation of effect of laying and bonding parameters of high-voltage underground cables on thermal and electrical performances by multiphysics FEM analysis. Electr. Power Syst. Res. 2024, 227, 109987. [Google Scholar] [CrossRef]
  24. Alboyaci, B.; Cinar, M.A.; Demirol, Y.B. Evaluation of cable and busbar system in multiconductor distribution systems interms of current and magnetic field distributions. Turk. J. Electr. Eng. Comput. Sci. 2021, 29, 3119–3132. [Google Scholar] [CrossRef]
  25. WG B1.45. Thermal Monitoring of Cable Circuits and Grid Operators’ Use of Dynamic Rating Systems; CIGRE: Paris, France, 2019. [Google Scholar]
  26. IEEE Std 1718-2012; IEEE Guide for Temperature Monitoring of Cable Systems. IEEE: Piscataway, NJ, USA, 2012.
  27. Fu, C.; Si, W.; Zhu, L.; Liang, Y.; Li, H. Rapid Transfer Matrix-Based Calculation of Steady-State Temperature Rises in Cable Ducts Containing Groups of Three Phase Cable. IEEE Power Energy Technol. Syst. J. 2019, 6, 208–213. [Google Scholar] [CrossRef]
Figure 1. General cable layers.
Energies 17 00674 g001
Figure 2. The minimum dimensions of the TEDAS standard cable channel.
Energies 17 00674 g002
Figure 3. Electrical equivalent thermal model of cable layers. T 1 : Thermal resistance of the insulation (°C m/W). T 2 : Thermal resistance of the inner sheath (°C m/W). T 3 : Thermal resistance of the outer sheath (°C m/W). T 4 : Thermal resistance of the soil (°C/W). W c : Thermal loss of the core (W). W d : Thermal loss of the semiconductor (dielectric) (W). W s : Thermal loss of the metallic screen (W). W a : Thermal loss of the armor (W).
Energies 17 00674 g003
Figure 4. CYMCAP model of the (N) A2XSY 150 mm2 cable.
Energies 17 00674 g004
Figure 5. CYMCAP current carrying capacity analysis results for the flat layout.
Energies 17 00674 g005
Figure 6. CYMCAP current carrying capacity analysis results for the trefoil layout.
Energies 17 00674 g006
Figure 7. CYMCAP current carrying capacity analysis results for the vertical layout.
Energies 17 00674 g007
Figure 8. Channel dimension for the vertical layout.
Energies 17 00674 g008
Figure 9. Channel dimension for the trefoil layout.
Energies 17 00674 g009
Figure 10. (a) Specially produced digger mouth. (b) Channel digging works.
Energies 17 00674 g010
Figure 11. (a) Temperature sensor (PT100) connections for the trefoil layout. (b) Temperature sensor connections for the vertical layout.
Energies 17 00674 g011
Figure 12. (a) The data logger device. (b) The web-based remote monitoring interface.
Energies 17 00674 g012
Figure 13. Current and temperature measurements dated 27 July 2020 for vertical- and trefoil-placed cables.
Energies 17 00674 g013
Figure 14. CYMCAP analysis results of cable surface temperatures for the current dated 27 July 2020 for the vertical and trefoil layouts.
Energies 17 00674 g014
Figure 15. CYMCAP analysis results of cable core temperatures for the current dated 27 July 2020 for the vertical and trefoil layouts.
Energies 17 00674 g015
Table 1. Cable dimensions.
Cable LayerMaterialDiameter (mm)
CoreAluminum14.1
Inner semiconductorSemiconductor15.0
InsulationXLPE33.0
Outer semiconductorSemiconductor33.9
Metallic screenCopper35.9
Outer sheathPVC40.5
Table 2. Analysis results.
LayoutAmpacity
(A)
Maximum Screen Current
(A)
Total Losses of Three Phase
(W/m)
Flat336.059.396.27
Trefoil318.019.981.61
Vertical336.159.296.29
Table 3. Temperature measurement and analysis results dated 27 July 2020—21:00.
LayoutResult TypeTemperature (°C)
Phase APhase BPhase C
TrefoilMeasurement 49.9449.8849.48
TrefoilAnalysis49.9749.9749.91
VerticalMeasurement 43.5246.0644.73
VerticalAnalysis43.8045.4544.27
Disclaimer/Publisher’s Note: The statements, opinions and data contained in all publications are solely those of the individual author(s) and contributor(s) and not of MDPI and/or the editor(s). MDPI and/or the editor(s) disclaim responsibility for any injury to people or property resulting from any ideas, methods, instructions or products referred to in the content.

