
Application of the Typology Approach for Energy Renovation Planning of Public Buildings’ Stocks at the Local Level: A Case Study in Greece

 , , , ,
  ,
,
Abstract
1. Introduction
- Initially, the Greek policy environment is briefly presented concerning public building energy efficiency planning;
- A clustering method is introduced, aiming at the determination of the optimal buildings’ classification criteria and the identification of representative typologies, under special constraints considering the retrofit relevance of key building features and reasonable computational effort. The RMSE index is used as the objective function on the basis of the available primary energy consumption for each building;
- The IMPULSE Interreg-MED project tools are then used for the examined building stock and typologies towards the fast production of the KPI database for the whole building stock and for alternative retrofit scenarios and, finally, towards a reliable gradual renovation plan based on user-defined conditions including the desired annual renovation rate.
2. Materials and Methods
2.1. The Greek Policy Context
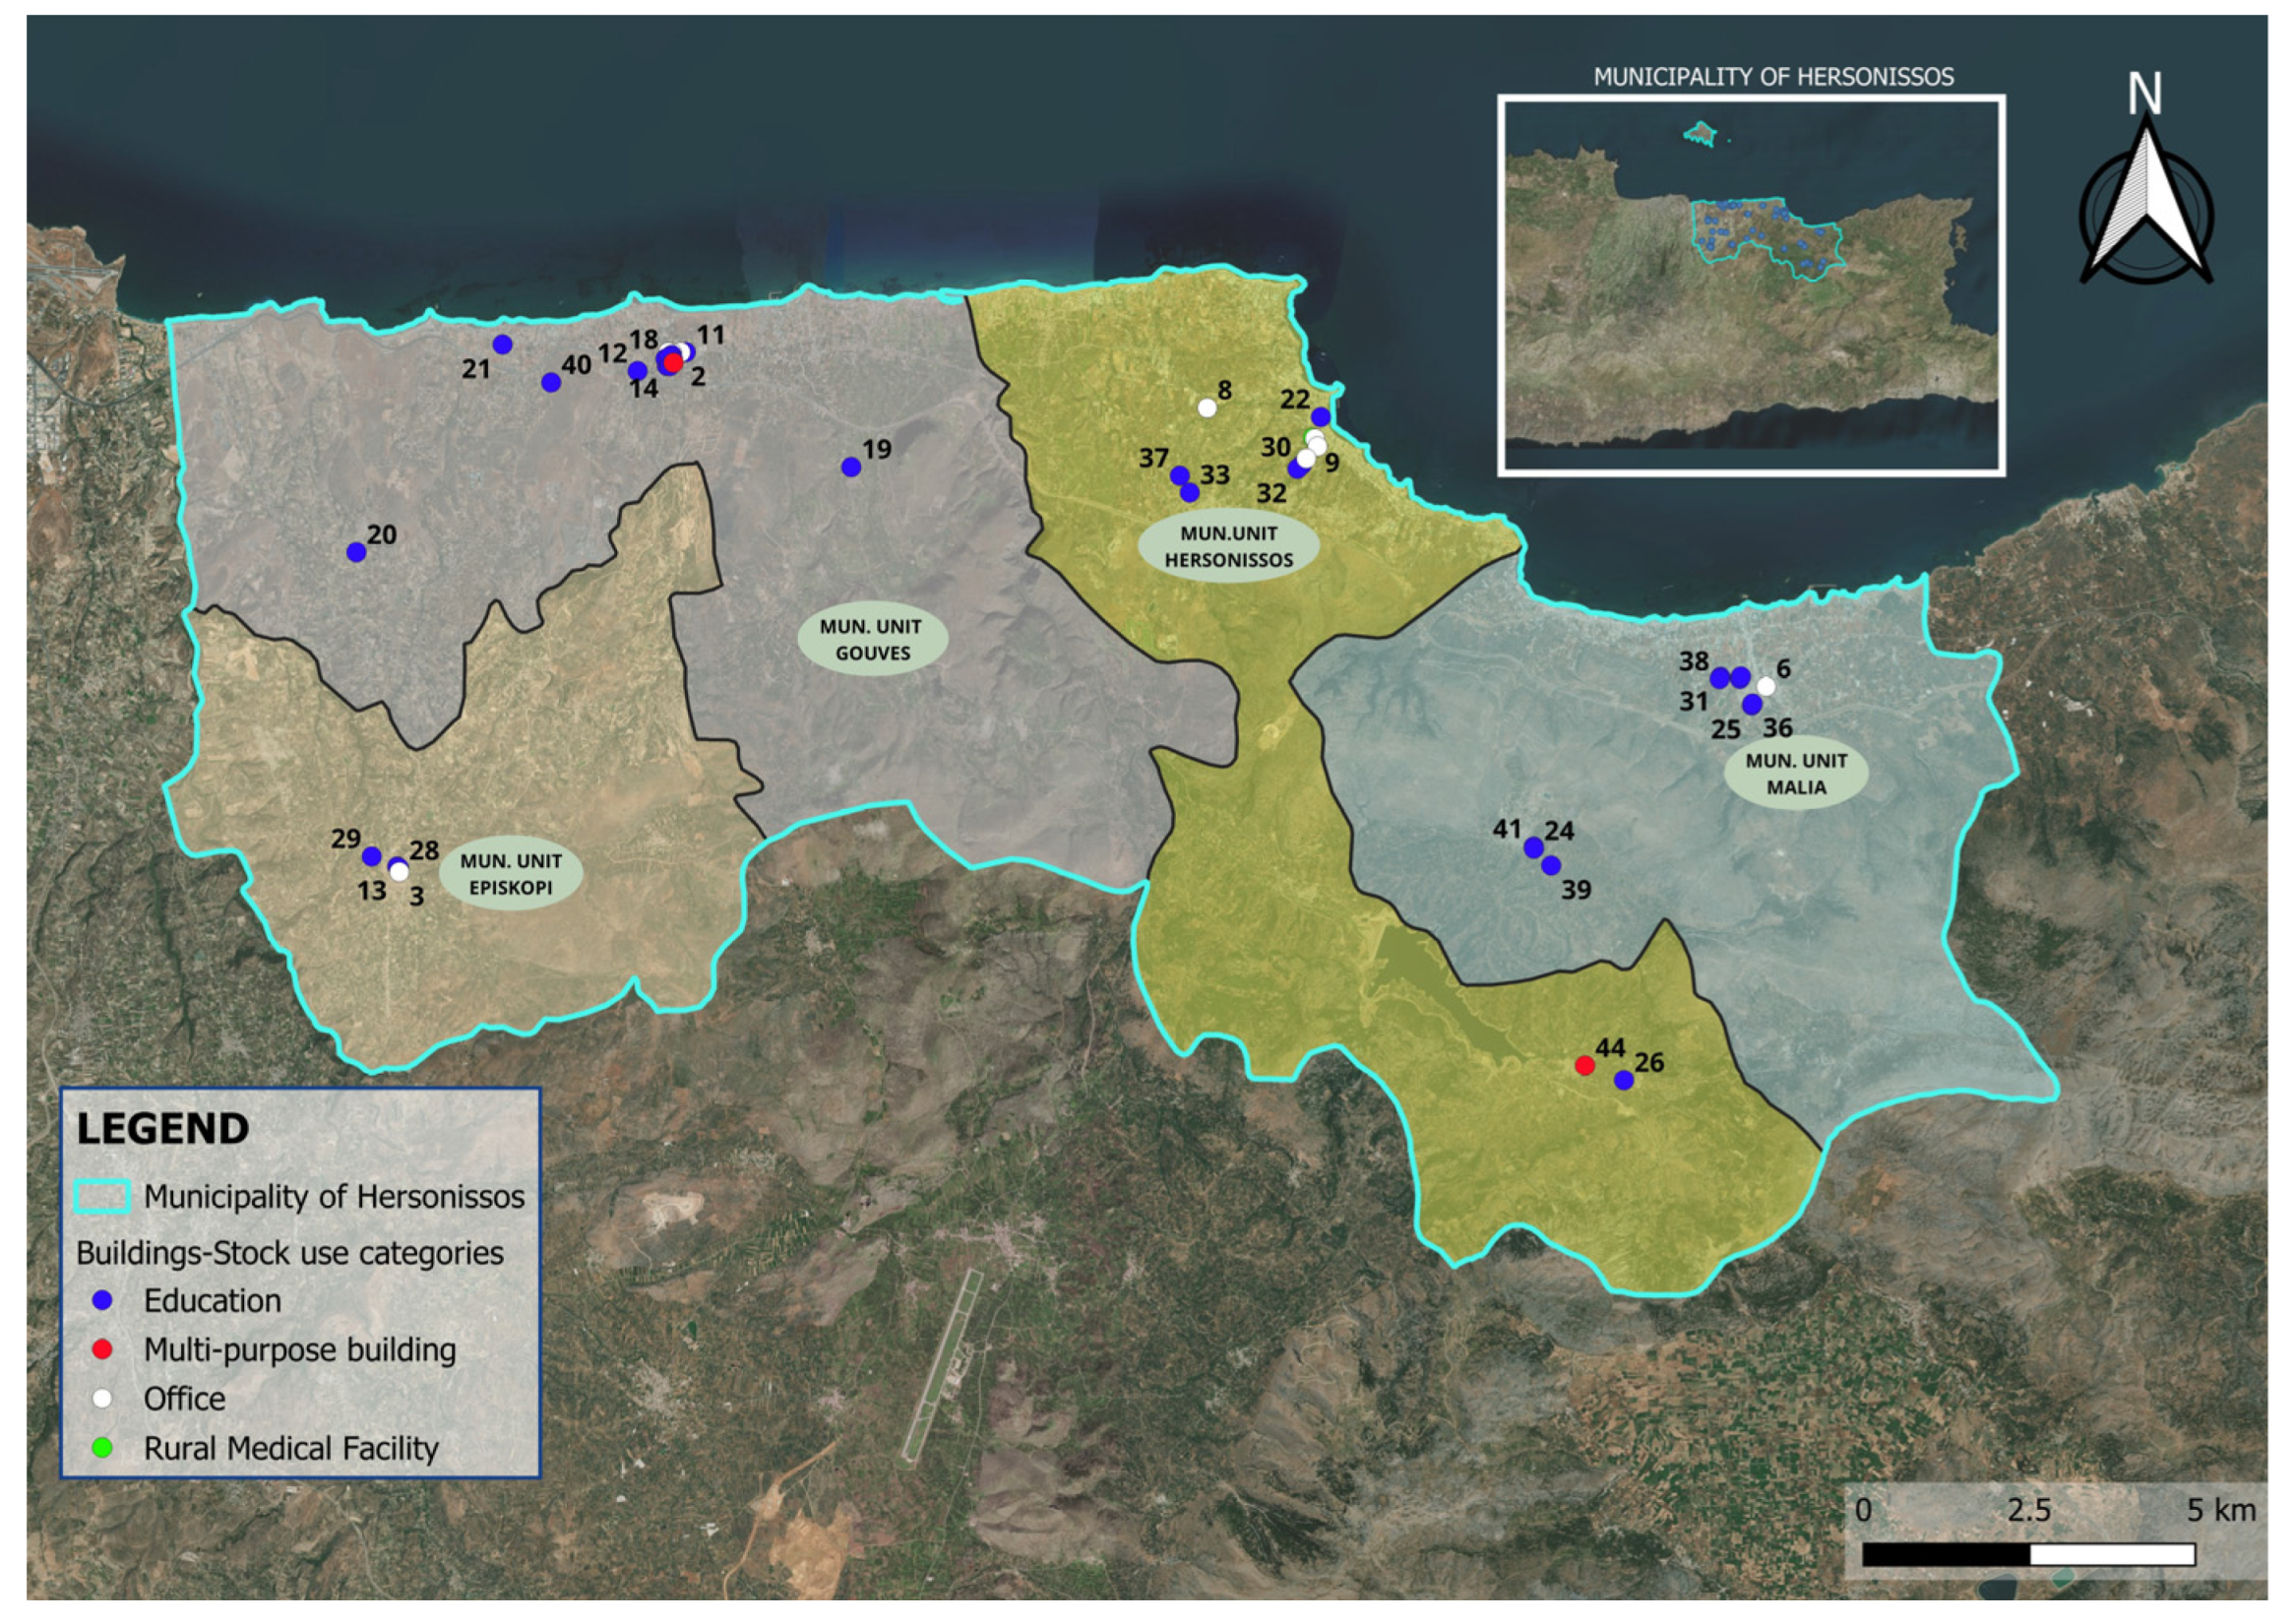
2.2. The Case Study Considered
2.3. Building-Stock Clustering Approach
- At first, based on the scientific experience regarding energy-related building typologies, the most relevant options are assigned to each building feature.
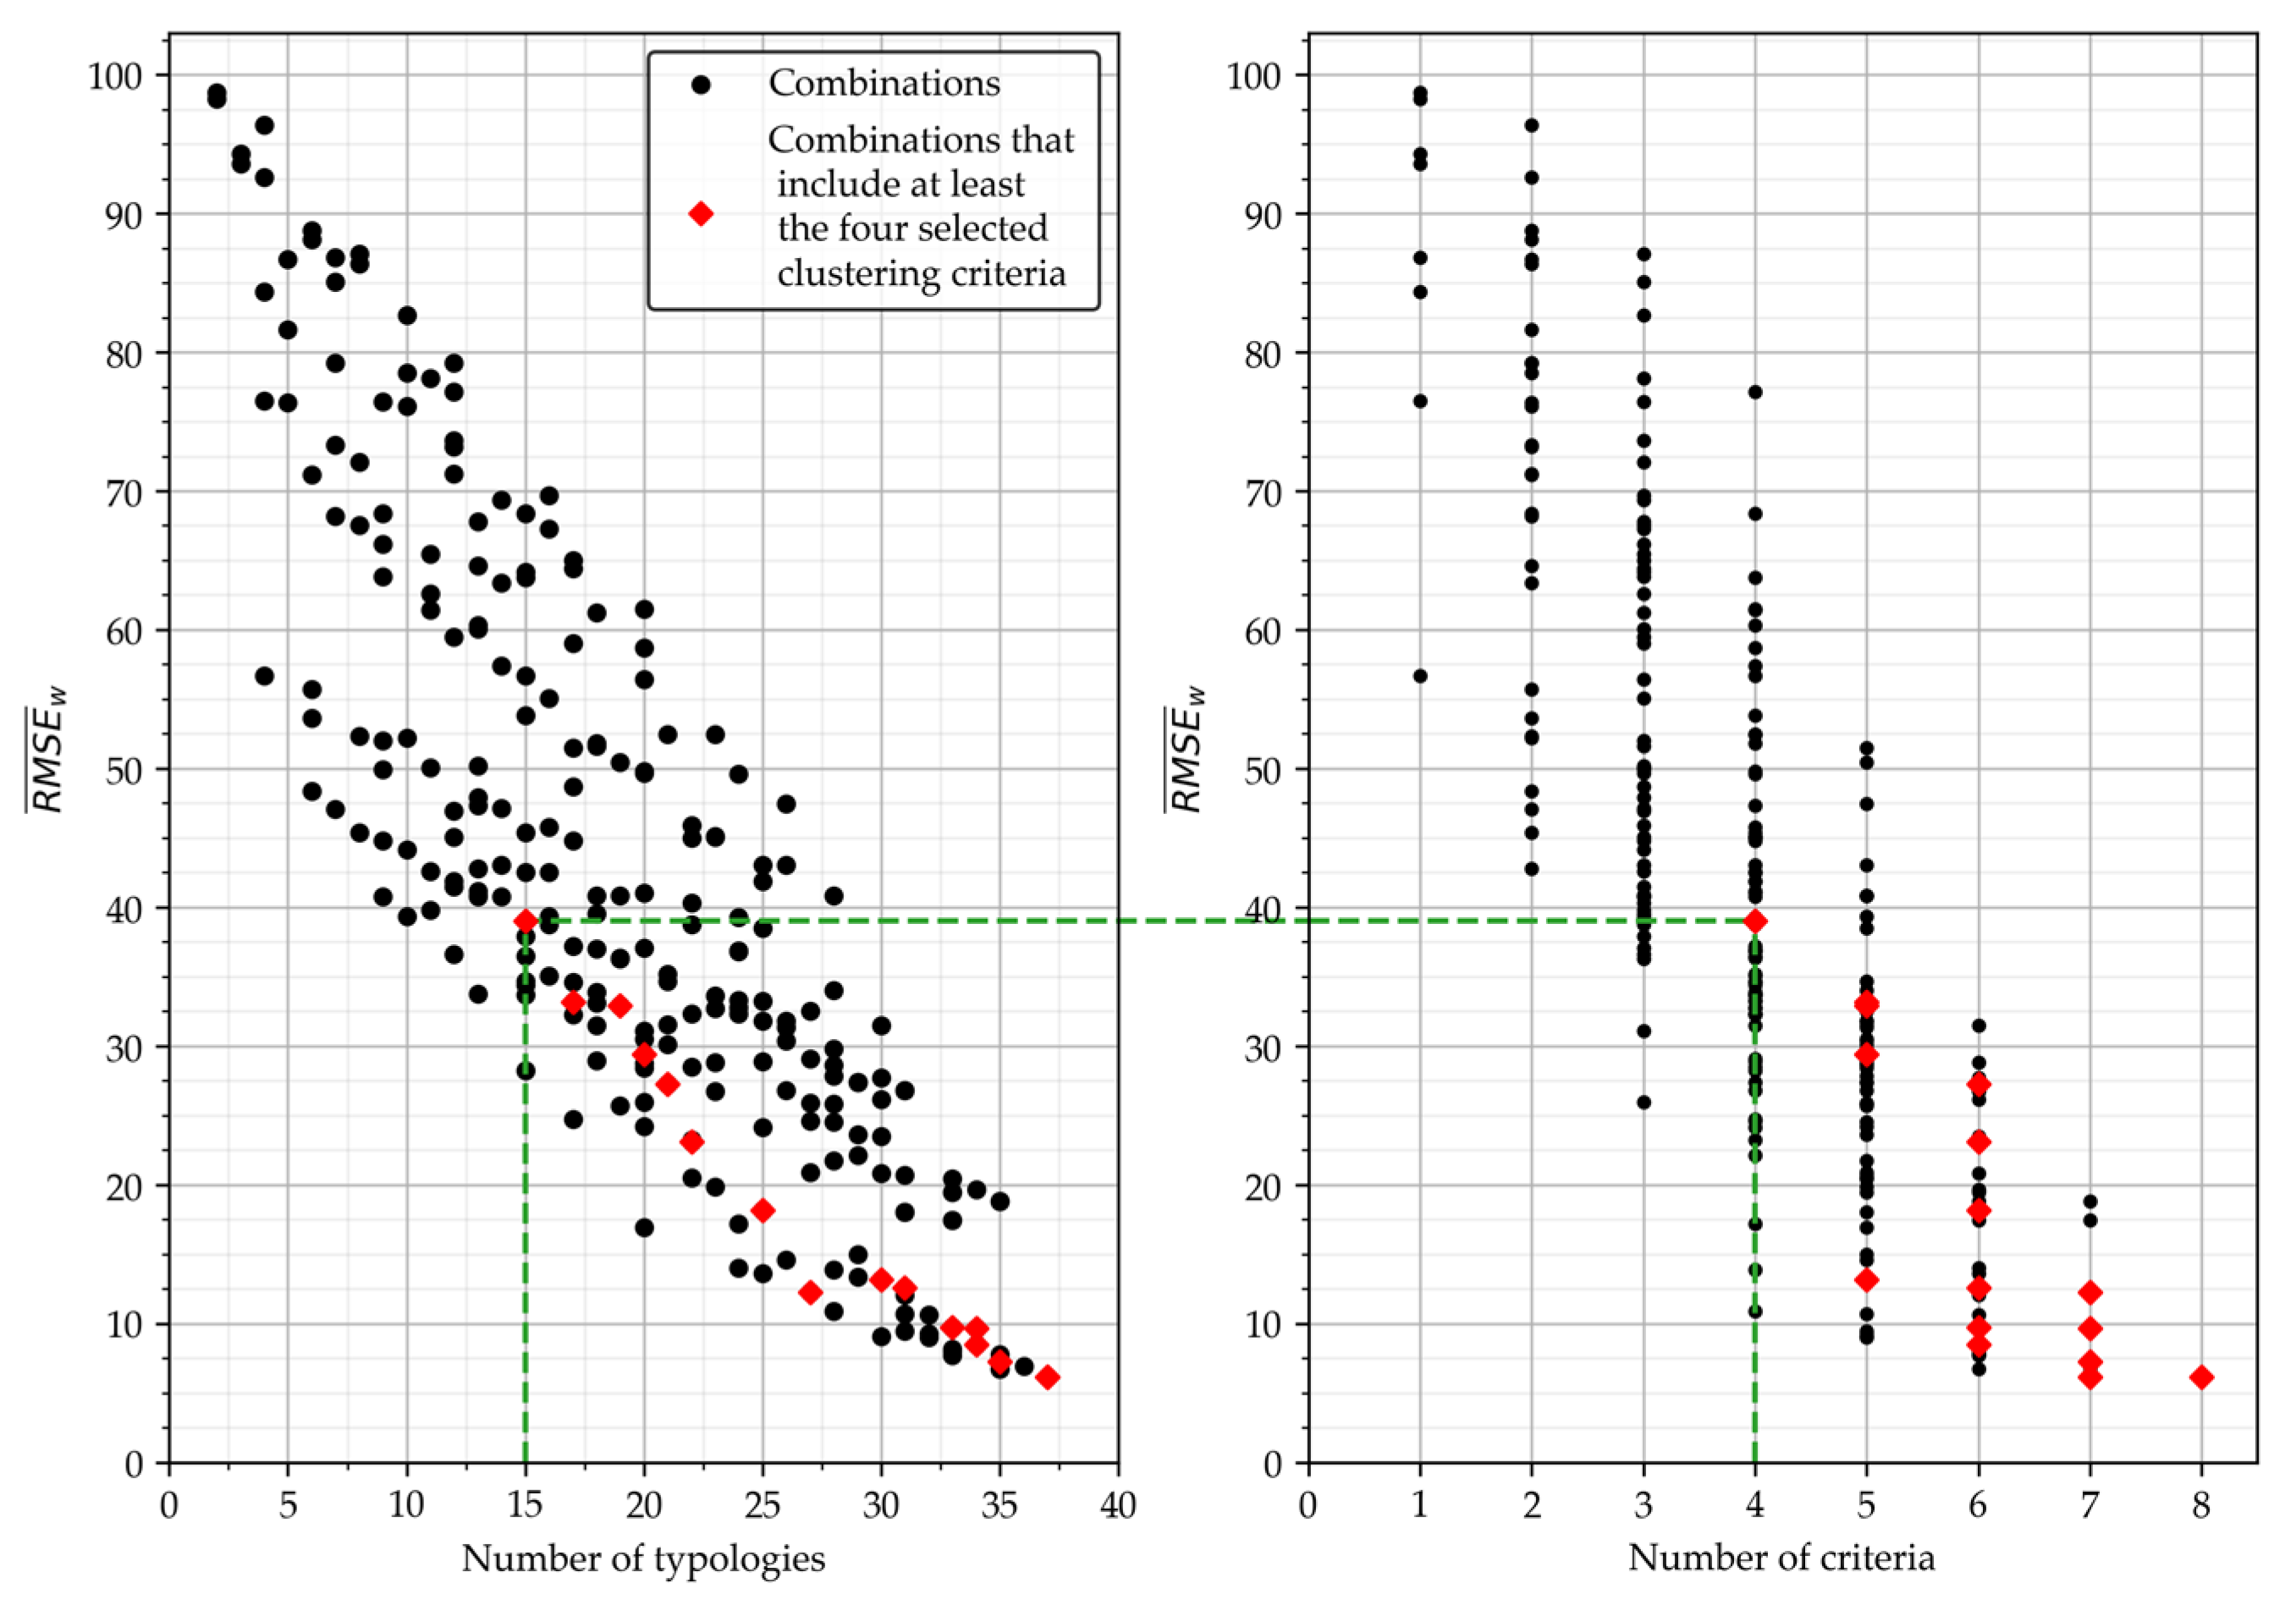
- Secondly, a clustering algorithm is developed in a computer code, aiming at grouping buildings with the same building features. The algorithm tests all possible combinations of building features and retrieves the optimal set of clustering criteria and final typologies, which correspond to the minimum value of the RMSE index based on the available primary energy consumption of each object/building. The algorithm encompasses two additional constraints: (a) a minimum set of specific building features ensuring (as far as possible) the retrofit relevance, i.e., ensuring the suitability of interventions to both the representative building of each typology and the rest buildings of the typology and (b) a maximum number of typologies.
2.3.1. Definition of Clustering Criteria
2.3.2. The Clustering Algorithm Applied
- Considering the specific building stock and the retrofit relevance of building features, the following key criteria should definitely be included in the optimal set of clustering criteria: building use, construction year, heating system, and cooling system;
- A maximum limit of 15 building typologies is set, which is also in compliance with the capabilities of the IMPULSE tools [8] employed later in the planning procedure.
2.4. Typologies’ Manipulation towards an ERB Plan
- MEPR: Each upgrading intervention included in the renovation scenario meets the minimum energy performance requirements according to the Greek EPBD;
- nZEB: The interventions included achieve a nearly zero-energy building. According to the Greek policy context (Ministerial Decision 5447B/2018), an existing building is considered nZEB if it belongs to the B+ energy class as per the Greek EPBD.
- Desired annual renovation rate: at least 3% of the total building-stock floor area;
- Desired duration of foreseen projects’ implementation: 12 years;
- A reasonable investment cost not exceeding EUR 1 million annually should be ensured;
- Priority should be given to projects achieving the highest possible reduction in energy consumption per carrier, i.e., electricity and heating oil;
- Projects leading to nZEB transformation are the top priority;
- Priority should be given to projects regarding educational buildings;
- A reliable and manageable plan is desired with no more than three projects each year within the first 6 years of implementation.
3. Results
3.1. Identification of Building-Stock Representative Typologies
3.2. Building-Stock Energy Performance Assessment and Production of the KPI Database
3.3. Development of the Gradual Energy Renovation Plan
- DC1: Annual savings of fossil fuel consumption;
- DC2: Annual electricity savings;
- DC3: Estimated investment cost.
4. Discussion
- Application of the suggested approach using actual energy consumption data, e.g., collected from energy bills, comparisons with the current findings, and identification of margins for improvements;
- Execute the clustering approach taking into account the location of the buildings as well as the revised unit costs of interventions in the context of economies of scale depending on the level of scattering of renovation works.
5. Conclusions
- In working beyond building-stock benchmarking towards the development of an ERB plan at the municipal level, retrofit-relevant building features should definitely be included as clustering criteria in the framework of the typology approach, for the studied case the following criteria apply: building use, period of construction, heating system, and cooling system;
- Bundled buildings’ energy upgrading is more cost-efficient than individual retrofitting projects per building;
- Deep retrofitting (nZEB) including RES-PV integration corresponds to a viable investment in terms of acceptable simple payback period for common municipal building typologies (offices and educational buildings);
- Imposing more bias on the final energy saving in the decision-making scheme leads to a more “aggressive” launching of the renovation plan by means of high CO2 emissions reduction in the early years without necessarily having an increased number of projects;
- The proposed methodology is cost-effective as it ensures a rapid and rigorous development of the gradual renovation plan taking into account crucial policy priorities and using freely available tools found in official resources of previous research projects;
- For the case study in focus, it was found that with a 7% annual renovation rate, a 12-year renovation roadmap is produced, envisaging the nZEB transformation of the whole building stock and yielding a 5657 MWh primary energy saving, an 1892 t avoidance of CO2 emissions, and an energy-cost saving of around EUR 0.5 million, under a total investment of EUR 7 million.
Author Contributions
Funding
Data Availability Statement
Conflicts of Interest
Appendix A

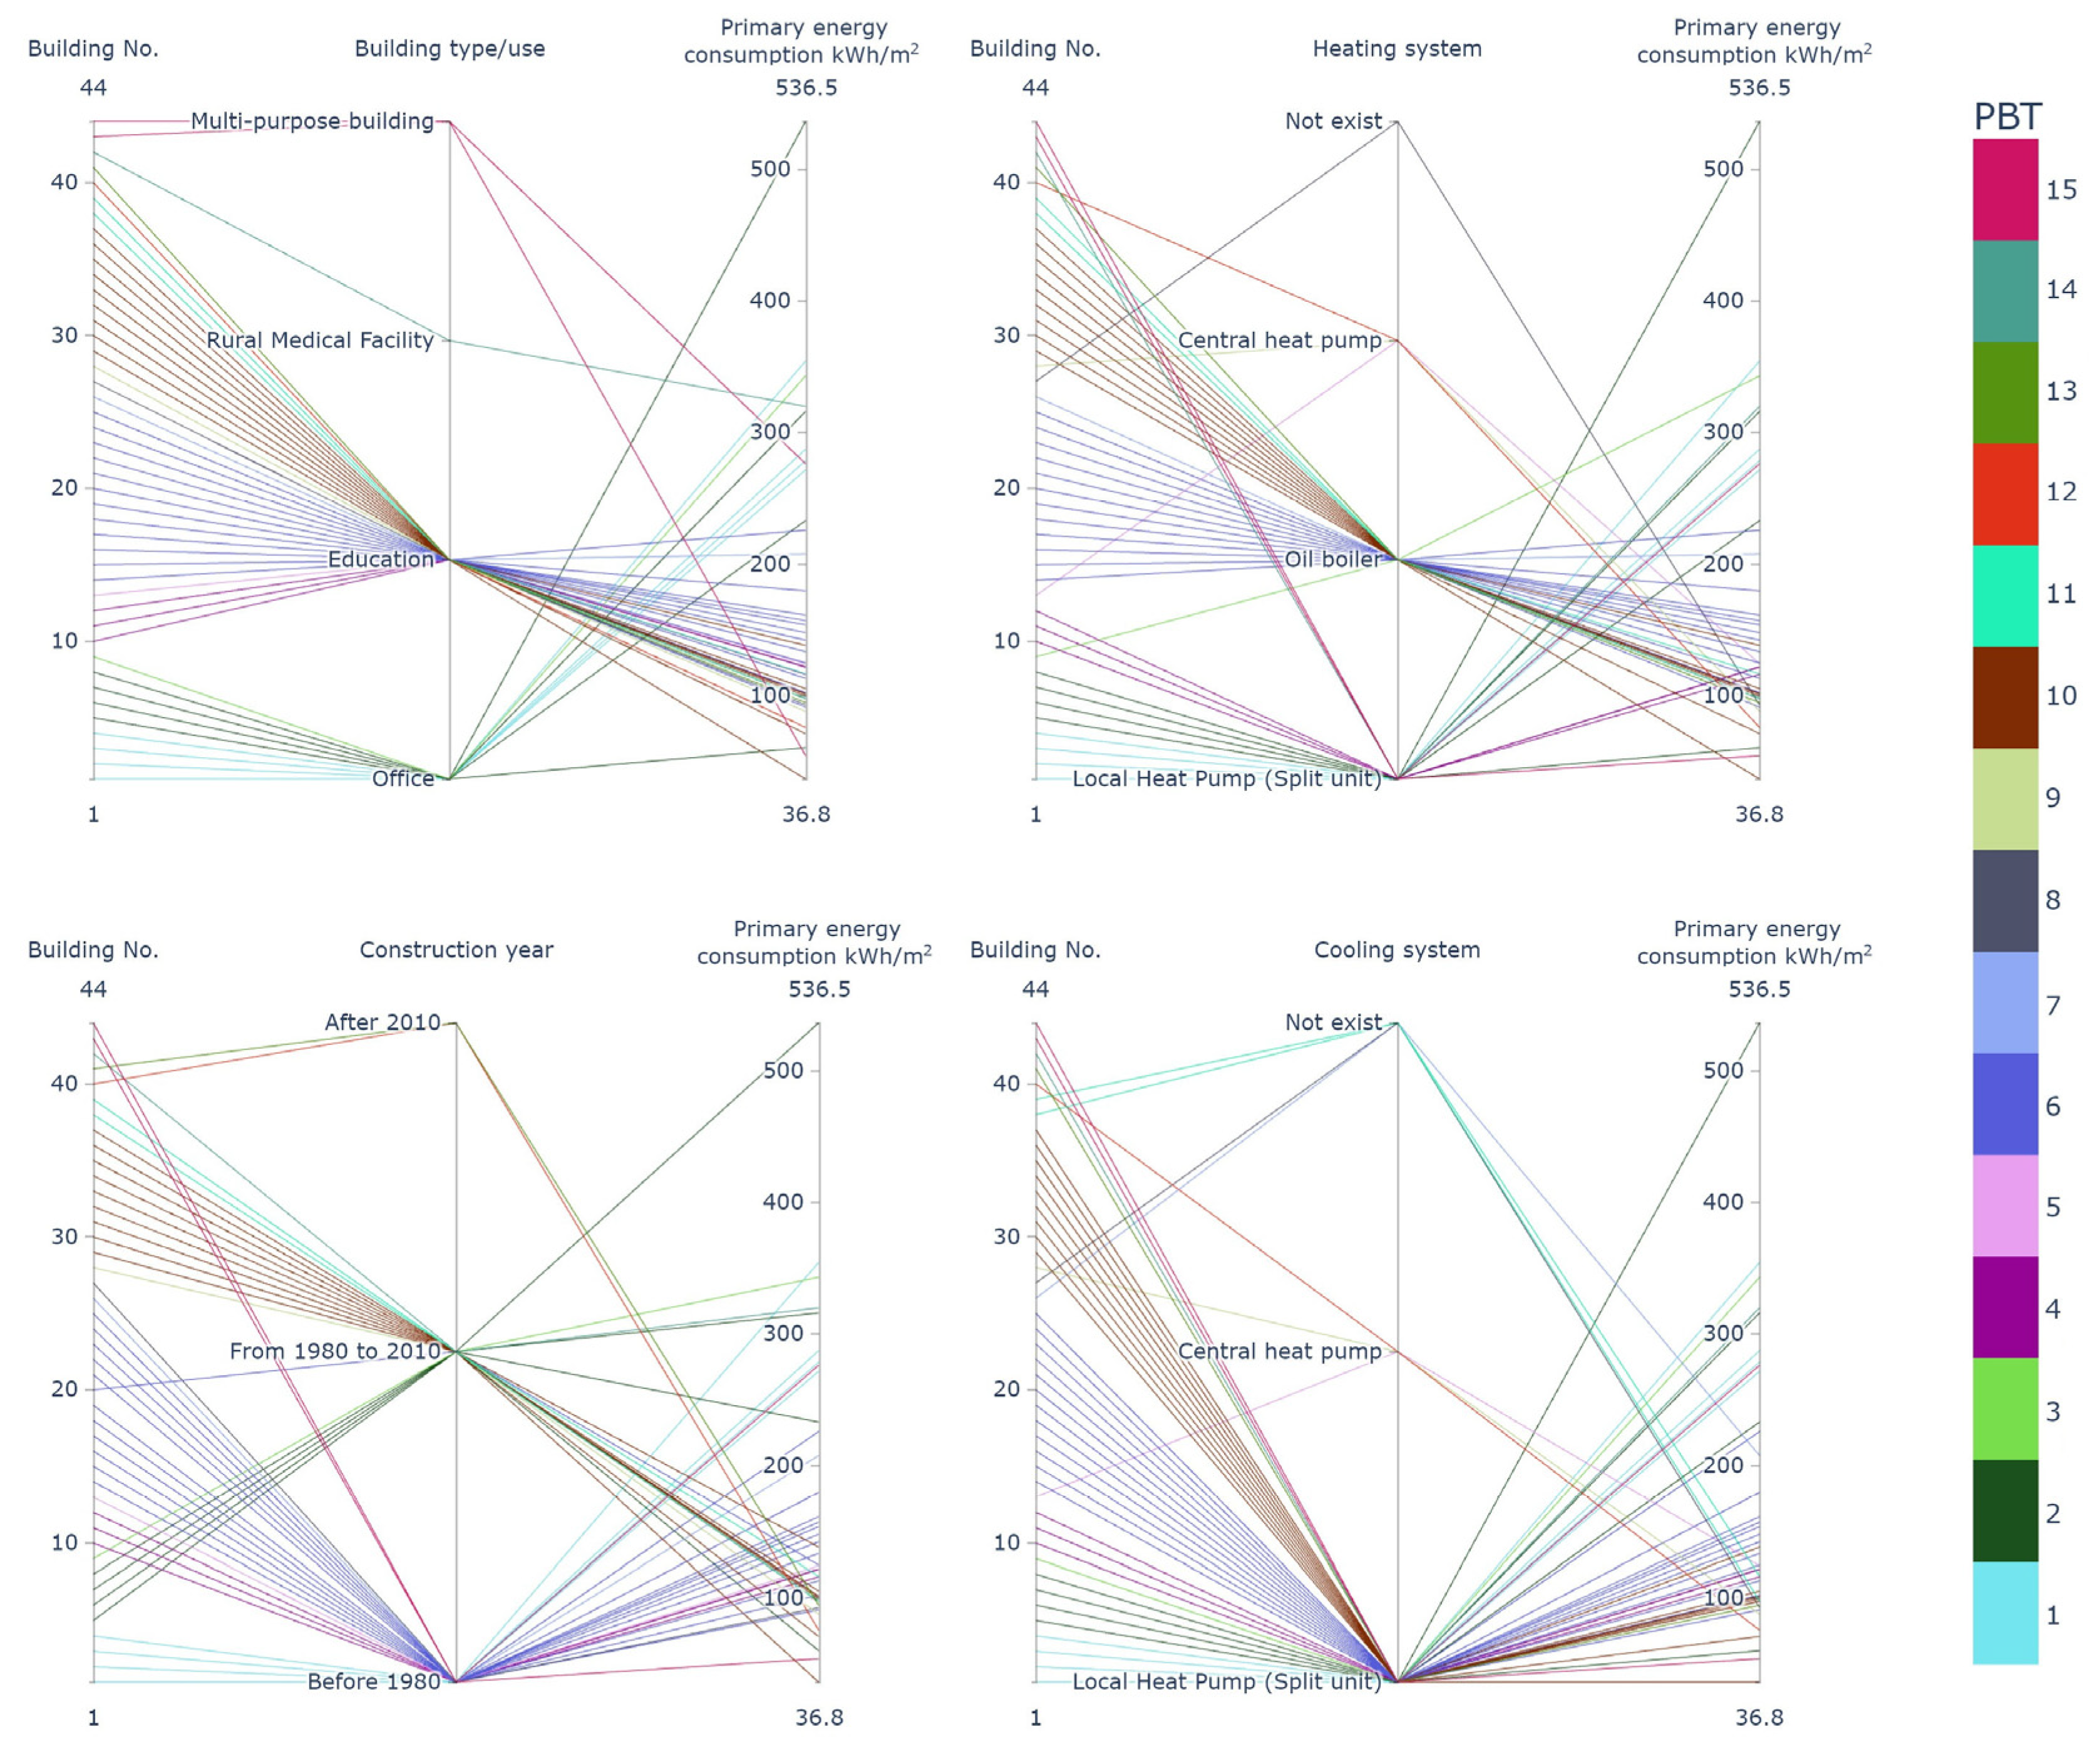
| Building No. | Name of Building | Building Features | Primary Energy Consumption kWh/m2 (EPC) | |||||||
|---|---|---|---|---|---|---|---|---|---|---|
| Building Type/Use | Construction Year | Heating System | Cooling System | Floor No | Type of Building Envelope | Thermal Insulation | Windows Type | |||
| 1 | City Hall | Office | 1964 | Local Heat Pump (Split unit) | Local Heat Pump (Split unit) | 2 | Reinforced concrete and brick wall | No | Single glazed, aluminum frames | 287.4 |
| 2 | Building 202 | Office | 1964 | Local Heat Pump (Split unit) | Local Heat Pump (Split unit) | 1 | Reinforced concrete and brick wall | No | Double glazed, aluminum frames (insufficient according to the EPBD 2) | 278.7 |
| 3 | Municipal Store of Episkopi | Office | 1972 | Local Heat Pump (Split unit) | Local Heat Pump (Split unit) | 2 | Reinforced concrete and brick wall | No | Single glazed, wooden frames | 271.7 |
| 4 | Building 154 | Office | 1964 | Local Heat Pump (Split unit) | Local Heat Pump (Split unit) | 1 | Reinforced concrete and brick wall | No | Single glazed, aluminum frames | 354.4 |
| 5 | Municipal Store of Hersonissos Port | Office | 1998 | Local Heat Pump (Split unit) | Local Heat Pump (Split unit) | 2 | Reinforced concrete and brick wall | Insufficient according to the TIR 1 | Double glazed, aluminum frames (insufficient according to the EPBD) | 233.2 |
| 6 | Municipal Store of Malia | Office | 1991 | Local Heat Pump (Split unit) | Local Heat Pump (Split unit) | 2 | Reinforced concrete and brick wall | Insufficient according to the TIR | Double glazed, aluminum frames (insufficient according to the EPBD) | 316.1 |
| 7 | Fire Brigade Building | Office | 1998 | Local Heat Pump (Split unit) | Local Heat Pump (Split unit) | 2 | Reinforced concrete and brick wall | No | Single glazed, wooden frames | 536.5 |
| 8 | Former office Building of Municipal Water and Sewerage Company | Office | 2000 | Local Heat Pump (Split unit) | Local Heat Pump (Split unit) | 1 | Reinforced concrete and brick wall | No | Single glazed, aluminum frames | 60.6 |
| 9 | Former Courthouse | Office | 1996 | Oil boiler | Local Heat Pump (Split unit) | 2 | Reinforced concrete and brick wall | Insufficient according to the EPBD | Single glazed, aluminum frames | 343.2 |
| 10 | Computer room of Gouves senior high School (688) | Education | 1964 | Local Heat Pump (Split unit) | Local Heat Pump (Split unit) | 1 | Reinforced concrete and brick wall | No | Double glazed, aluminum frames (insufficient according to the EPBD) | 116.3 |
| 11 | Gournes Elementary School (“Eirini”—Building 207) | Education | 1964 | Local Heat Pump (Split unit) | Local Heat Pump (Split unit) | 1 | Reinforced concrete and brick wall | No | Single glazed, aluminum frames | 122.1 |
| 12 | Gournes Elementary School | Education | 1970 | Local Heat Pump (Split unit) | Local Heat Pump (Split unit) | 2 | Reinforced concrete and brick wall | No | Single glazed aluminum frames, double glazed aluminum frames (insufficient according to the EPBD) | 121.8 |
| 13 | Episkopi Elementary School | Education | 1949 | Central heat pump | Central heat pump | 2 | Stonework | No | Single glazed, aluminum frames | 124.4 |
| 14 | Gouves senior High School (156) | Education | 1964 | Oil boiler | Local Heat Pump (Split unit) | 1 | Reinforced concrete and brick wall | No | Double glazed, aluminum frames (insufficient according to the EPBD) | 142.4 |
| 15 | Gouves Junior High School (156 and 158) | Education | 1964 | Oil boiler | Local Heat Pump (Split unit) | 1 | Reinforced concrete and brick wall | No | Double glazed, aluminum frames (insufficient according to the EPBD) | 148.1 |
| 16 | 2nd Vocational Training Institute of Heraklion (Building 303) | Education | 1964 | Oil boiler | Local Heat Pump (Split unit) | 2 | Reinforced concrete and brick wall | No | Double glazed, aluminum frames (insufficient according to the EPBD) | 225.9 |
| 17 | School of Fine Arts (Building 301) | Education | 1964 | Oil boiler | Local Heat Pump (Split unit) | 2 | Reinforced concrete and brick wall | No | Double glazed, aluminum frames (insufficient according to the EPBD) | 113.3 |
| 18 | Music School (Building 308) | Education | 1964 | Oil boiler | Local Heat Pump (Split unit) | 3 | Reinforced concrete and brick wall | No | Double glazed, aluminum frames (insufficient according to the EPBD) | 133.6 |
| 19 | Gouves Elementary School | Education | 1924 | Oil boiler | Local Heat Pump (Split unit) | 1 | Stonework | No | Double glazed wooden frames (insufficient according to the EPBD), single glazed aluminum frames | 179.7 |
| 20 | Elia Elementary School | Education | 1980 | Oil boiler | Local Heat Pump (Split unit) | 1 | Reinforced concrete and brick wall | Insufficient according to the TIR | Double glazed, aluminum frames (insufficient according to the EPBD) | 125.0 |
| 21 | Kokkini-Chani Elementary School | Education | 1978 | Oil boiler | Local Heat Pump (Split unit) | 1 | Reinforced concrete and brick wall | No | Single glazed aluminum frames, double glazed aluminum frames (insufficient according to the EPBD) | 161.4 |
| 22 | Hersonissos Port Kindergarten | Education | 1960 | Oil boiler | Local Heat Pump (Split unit) | 1 | Stonework | No | Single glazed, aluminum frames | 157.2 |
| 23 | 1st Elementary School of Malia (Building 1) | Education | 1967 | Oil boiler | Local Heat Pump (Split unit) | 1 | Reinforced concrete and brick wall | Insufficient according to the TIR | Single glazed, aluminum frames | 102.5 |
| 24 | Mochos Elementary School | Education | 1970 | Oil boiler | Local Heat Pump (Split unit) | 3 | Reinforced concrete and brick wall | No | Single glazed, aluminum frames | 153.9 |
| 25 | Malia Kindergarten (One Building—Old) | Education | 1965 | Oil boiler | Local Heat Pump (Split unit) | 1 | Reinforced concrete and brick wall | No | Single glazed, wooden frames | 91.4 |
| 26 | Kindergarten and Elementary School of Gonies | Education | 1930 | Oil boiler | Not exist | 1 | Stonework | No | Double glazed, aluminum frames (insufficient according to the EPBD) | 207.7 |
| 27 | Music School (Building 302) | Education | 1964 | Not exist | Not exist | 2 | Reinforced concrete and brick wall | No | Double glazed, aluminum frames (insufficient according to the EPBD) | 93.1 |
| 28 | Episkopi Kindergarten | Education | 1990 | Central heat pump | Central heat pump | 2 | Reinforced concrete and brick wall | Insufficient according to the TIR | Single glazed, aluminum frames | 88.2 |
| 29 | Episkopi Junior and Senior High School | Education | 1985 | Oil boiler | Local Heat Pump (Split unit) | 2 | Reinforced concrete and brick wall | Insufficient according to the TIR | Single glazed, aluminum frames | 98.0 |
| 30 | Hersonissos Port Junior and Senior High School | Education | 1999 | Oil boiler | Local Heat Pump (Split unit) | 2 | Reinforced concrete and brick wall | Yes | Double glazed, aluminum frames (insufficient according to the EPBD) | 97.9 |
| 31 | Malia Junior and Senior High School -Building A | Education | 1989 | Oil boiler | Local Heat Pump (Split unit) | 2 | Reinforced concrete and brick wall | Yes | Double glazed, aluminum frames (insufficient according to the EPBD) | 71.3 |
| 32 | Hersonissos Port Elementary School | Education | 1999 | Oil boiler | Local Heat Pump (Split unit) | 2 | Reinforced concrete and brick wall | Insufficient according to the TIR | Single glazed aluminum frames, double glazed aluminum frames (insufficient according to the EPBD) | 99.9 |
| 33 | Elementary School of Hersonissos old village | Education | 1998 | Oil boiler | Local Heat Pump (Split unit) | 2 | Reinforced concrete and brick wall | Insufficient according to the TIR | Double glazed, aluminum frames (insufficient according to the EPBD) | 101.7 |
| 34 | 2nd Elementary School of Malia | Education | 2004 | Oil boiler | Local Heat Pump (Split unit) | 2 | Reinforced concrete and brick wall | Insufficient according to the TIR | Double glazed, aluminum frames (insufficient according to the EPBD) | 101.4 |
| 35 | 1st Elementary School of Malia (Building 2) | Education | 1994 | Oil boiler | Local Heat Pump (Split unit) | 2 | Reinforced concrete and brick wall | Insufficient according to the TIR | Single glazed, aluminum frames | 105.5 |
| 36 | Malia Kindergarten | Education | 2004 | Oil boiler | Local Heat Pump (Split unit) | 1 | Reinforced concrete and brick wall | Yes | Double glazed, aluminum frames (insufficient according to the EPBD) | 36.8 |
| 37 | Hersonissos Elementary School | Education | 1990 | Oil boiler | Local Heat Pump (Split unit) | 1 | Reinforced concrete and brick wall | Insufficient according to the TIR | Single glazed, aluminum frames (insufficient according to the EPBD) | 138.4 |
| 38 | Malia Junior and Senior High School-Building B | Education | 1992 | Oil boiler | Not exist | 2 | Reinforced concrete and brick wall | Yes | Double glazed, aluminum frames (insufficient according to the EPBD) | 98.0 |
| 39 | Mochos High School | Education | 1984 | Oil boiler | Not exist | 2 | Reinforced concrete and brick wall | Insufficient according to the TIR | Single glazed, aluminum frames | 116.7 |
| 40 | New School Complex of Primary Education in Kokkini-Chani (Elementary School–Kindergarten) | Education | 2016 | Central heat pump | Central heat pump | 2 | Reinforced concrete and brick wall | Yes | Double glazed, aluminum frames | 76.0 |
| 41 | Mochos Kindergarten | Education | 2011 | Oil boiler | Local Heat Pump (Split unit) | 1 | Reinforced concrete and brick wall | Yes | Double glazed, aluminum frames | 94.9 |
| 42 | Cultural Center of Hersonissos Port | Rural Medical Facility | 1998 | Local Heat Pump (Split unit) | Local Heat Pump (Split unit) | 3 | Reinforced concrete and brick wall | Insufficient according to the TIR | Double glazed, aluminum frames (insufficient according to the EPBD) | 320.0 |
| 43 | Library—Venue of Multiple Usage (310) | Multi-purpose building | 1964 | Local Heat Pump (Split unit) | Local Heat Pump (Split unit) | 1 | Reinforced concrete and brick wall | No | Double glazed, aluminum frames (insufficient according to the EPBD) | 276.4 |
| 44 | Avdou Primary School (New-Building) | Multi-purpose building | 1970 | Local Heat Pump (Split unit) | Local Heat Pump (Split unit) | 1 | Stonework | No | Single glazed, wooden frames | 54.5 |
Appendix B
| Building No. 1 | PBT | Existing Situation 2 | Scenario 1: MEPR 2 | Scenario 2: nZEB 2 | |||||||||||||||||||
|---|---|---|---|---|---|---|---|---|---|---|---|---|---|---|---|---|---|---|---|---|---|---|---|
| FEC (MWh/y) | HOFC (MWh/y) | t-CO2 (t/y) | t-EC (kEUR/y) | FEC (MWh/y) | HOFC (MWh/y) | t-CO2 (t/y) | t-EC (kEUR/y) | IC (kEUR) | ΔFEC (MWh/y) | ΔHOFC (MWh/y) | ΔCO2 (t/y) | SPP (yrs) | FEC (MWh/y) | HOFC (MWh/y) | t-CO2 (t/y) | t-EC (kEUR/y) | IC (kEUR) | ΔFEC (MWh/y) | ΔHOFC (MWh/y) | ΔCO2 (t/y) | SPP (yrs) | ||
| 1 | PBT1 | 95.64 | 0.00 | 94.57 | 22.95 | 50.14 | 0.00 | 49.56 | 12.03 | 149.39 | 45.50 | 0.00 | 45.01 | 13.68 | 2.13 | 0.00 | 2.13 | 0.51 | 198.71 | 93.51 | 0.00 | 92.44 | 8.85 |
| 2 | PBT1 | 98.31 | 0.00 | 97.21 | 23.59 | 51.54 | 0.00 | 50.94 | 12.37 | 153.56 | 46.77 | 0.00 | 46.27 | 13.68 | 2.19 | 0.00 | 2.19 | 0.53 | 204.26 | 96.12 | 0.00 | 95.02 | 8.85 |
| 3 | PBT1 | 34.63 | 0.00 | 34.24 | 8.31 | 18.16 | 0.00 | 17.95 | 4.36 | 54.09 | 16.47 | 0.00 | 16.30 | 13.68 | 0.77 | 0.00 | 0.77 | 0.19 | 71.95 | 33.86 | 0.00 | 33.47 | 8.85 |
| 4 | PBT1 | 81.81 | 0.00 | 80.90 | 19.63 | 42.89 | 0.00 | 42.39 | 10.29 | 127.79 | 38.92 | 0.00 | 38.50 | 13.68 | 1.82 | 0.00 | 1.82 | 0.44 | 169.97 | 79.98 | 0.00 | 79.07 | 8.85 |
| 5 | PBT2 | 148.45 | 0.00 | 146.78 | 35.62 | 115.03 | 0.00 | 113.74 | 27.60 | 285.62 | 33.42 | 0.00 | 33.05 | 35.62 | 4.06 | 0.00 | 4.06 | 0.97 | 397.44 | 144.38 | 0.00 | 142.72 | 11.47 |
| 6 | PBT2 | 125.02 | 0.00 | 123.62 | 30.00 | 96.88 | 0.00 | 95.79 | 23.25 | 240.55 | 28.15 | 0.00 | 27.83 | 35.62 | 3.42 | 0.00 | 3.42 | 0.82 | 334.73 | 121.60 | 0.00 | 120.20 | 11.47 |
| 7 | PBT2 | 21.39 | 0.00 | 21.15 | 5.13 | 16.57 | 0.00 | 16.39 | 3.98 | 41.15 | 4.81 | 0.00 | 4.76 | 35.62 | 0.59 | 0.00 | 0.59 | 0.14 | 57.26 | 20.80 | 0.00 | 20.56 | 11.47 |
| 8 | PBT2 | 34.19 | 0.00 | 33.81 | 8.20 | 26.49 | 0.00 | 26.20 | 6.36 | 65.78 | 7.70 | 0.00 | 7.61 | 35.62 | 0.94 | 0.00 | 0.94 | 0.22 | 91.54 | 33.25 | 0.00 | 32.87 | 11.47 |
| 9 | PBT3 | 66.82 | 28.32 | 73.56 | 19.90 | 26.99 | 0.00 | 26.72 | 6.48 | 123.52 | 39.83 | 28.32 | 46.85 | 9.20 | 1.32 | 0.00 | 1.32 | 0.32 | 148.90 | 65.50 | 28.32 | 72.24 | 7.60 |
| 10 | PBT4 | 11.41 | 0.00 | 11.35 | 2.74 | 4.25 | 0.00 | 4.19 | 1.02 | 50.42 | 7.16 | 0.00 | 7.16 | 29.34 | 1.33 | 0.00 | 1.30 | 0.32 | 54.63 | 10.07 | 0.00 | 10.05 | 22.59 |
| 11 | PBT4 | 15.91 | 0.00 | 15.83 | 3.82 | 5.92 | 0.00 | 5.84 | 1.42 | 70.31 | 9.98 | 0.00 | 9.98 | 29.34 | 1.86 | 0.00 | 1.82 | 0.45 | 76.18 | 14.05 | 0.00 | 14.01 | 22.59 |
| 12 | PBT4 | 18.87 | 0.00 | 18.78 | 4.53 | 7.02 | 0.00 | 6.93 | 1.69 | 83.42 | 11.85 | 0.00 | 11.85 | 29.34 | 2.20 | 0.00 | 2.16 | 0.53 | 90.38 | 16.67 | 0.00 | 16.62 | 22.59 |
| 13 | PBT5 | 17.78 | 0.00 | 17.57 | 4.27 | 12.35 | 0.00 | 12.23 | 2.96 | 58.78 | 5.43 | 0.00 | 5.35 | 45.12 | 2.03 | 0.00 | 1.99 | 0.49 | 71.01 | 15.75 | 0.00 | 15.58 | 18.79 |
| 14 | PBT6 | 36.04 | 35.63 | 45.00 | 12.12 | 15.03 | 0.00 | 14.83 | 3.61 | 204.12 | 21.01 | 35.63 | 30.17 | 23.99 | 5.56 | 0.00 | 14.83 | 1.34 | 219.00 | 30.48 | 35.63 | 30.17 | 20.33 |
| 15 | PBT6 | 16.47 | 16.28 | 20.57 | 5.54 | 6.87 | 0.00 | 6.78 | 1.65 | 93.29 | 9.60 | 16.28 | 13.79 | 23.99 | 2.54 | 0.00 | 6.78 | 0.61 | 100.09 | 13.93 | 16.28 | 13.79 | 20.33 |
| 16 | PBT6 | 64.23 | 63.49 | 80.19 | 21.59 | 26.79 | 0.00 | 26.42 | 6.43 | 363.73 | 37.43 | 63.49 | 53.77 | 23.99 | 9.91 | 0.00 | 26.42 | 2.39 | 390.25 | 54.32 | 63.49 | 53.77 | 20.33 |
| 17 | PBT6 | 67.03 | 66.26 | 83.69 | 22.53 | 27.96 | 0.00 | 27.58 | 6.71 | 379.59 | 39.07 | 66.26 | 56.11 | 23.99 | 10.34 | 0.00 | 27.58 | 2.50 | 407.26 | 56.68 | 66.26 | 56.11 | 20.33 |
| 18 | PBT6 | 82.18 | 81.24 | 102.61 | 27.63 | 34.28 | 0.00 | 33.81 | 8.23 | 465.43 | 47.90 | 81.24 | 68.80 | 23.99 | 12.68 | 0.00 | 33.81 | 3.06 | 499.36 | 69.50 | 81.24 | 68.80 | 20.33 |
| 19 | PBT6 | 14.86 | 14.69 | 18.56 | 5.00 | 6.20 | 0.00 | 6.12 | 1.49 | 84.18 | 8.66 | 14.69 | 12.44 | 23.99 | 2.29 | 0.00 | 6.12 | 0.55 | 90.31 | 12.57 | 14.69 | 12.44 | 20.33 |
| 20 | PBT6 | 14.16 | 13.99 | 17.67 | 4.76 | 5.90 | 0.00 | 5.82 | 1.42 | 80.17 | 8.25 | 13.99 | 11.85 | 23.99 | 2.18 | 0.00 | 5.82 | 0.53 | 86.01 | 11.97 | 13.99 | 11.85 | 20.33 |
| 21 | PBT6 | 13.55 | 13.39 | 16.92 | 4.55 | 5.65 | 0.00 | 5.57 | 1.36 | 76.74 | 7.90 | 13.39 | 11.34 | 23.99 | 2.09 | 0.00 | 5.57 | 0.50 | 82.33 | 11.46 | 13.39 | 11.34 | 20.33 |
| 22 | PBT6 | 10.68 | 10.55 | 13.33 | 3.59 | 4.45 | 0.00 | 4.39 | 1.07 | 60.46 | 6.22 | 10.55 | 8.94 | 23.99 | 1.65 | 0.00 | 4.39 | 0.40 | 64.86 | 9.03 | 10.55 | 8.94 | 20.33 |
| 23 | PBT6 | 22.58 | 22.33 | 28.20 | 7.59 | 9.42 | 0.00 | 9.29 | 2.26 | 127.91 | 13.16 | 22.33 | 18.91 | 23.99 | 3.48 | 0.00 | 9.29 | 0.84 | 137.23 | 19.10 | 22.33 | 18.91 | 20.33 |
| 24 | PBT6 | 27.97 | 27.65 | 34.92 | 9.40 | 11.67 | 0.00 | 11.51 | 2.80 | 158.38 | 16.30 | 27.65 | 23.41 | 23.99 | 4.31 | 0.00 | 11.51 | 1.04 | 169.92 | 23.65 | 27.65 | 23.41 | 20.33 |
| 25 | PBT6 | 10.50 | 10.38 | 13.11 | 3.53 | 4.38 | 0.00 | 4.32 | 1.05 | 59.47 | 6.12 | 10.38 | 8.79 | 23.99 | 1.62 | 0.00 | 4.32 | 0.39 | 63.80 | 8.88 | 10.38 | 8.79 | 20.33 |
| 26 | PBT7 | 7.52 | 30.78 | 15.56 | 4.80 | 5.55 | 0.00 | 5.50 | 1.33 | 74.24 | 1.96 | 30.78 | 10.06 | 21.40 | 1.24 | 0.00 | 1.24 | 0.30 | 79.74 | 6.27 | 30.78 | 14.31 | 17.71 |
| 27 | PBT8 | 64.76 | 0.00 | 64.00 | 15.54 | 15.58 | 0.00 | 15.38 | 3.73 | 279.83 | 49.17 | 0.00 | 48.62 | 23.70 | 3.03 | 0.00 | 3.03 | 0.73 | 292.24 | 61.73 | 0.00 | 60.97 | 19.73 |
| 28 | PBT9 | 9.73 | 0.00 | 9.64 | 2.07 | 4.88 | 0.00 | 4.82 | 1.04 | 37.68 | 4.85 | 0.00 | 4.82 | 36.52 | 1.61 | 0.00 | 1.58 | 0.34 | 41.97 | 8.13 | 0.00 | 8.06 | 24.28 |
| 29 | PBT10 | 65.15 | 18.71 | 69.45 | 17.46 | 41.50 | 0.00 | 41.07 | 9.96 | 172.30 | 23.65 | 18.71 | 28.38 | 22.97 | 11.40 | 0.00 | 11.18 | 2.73 | 212.95 | 53.75 | 18.71 | 58.27 | 14.46 |
| 30 | PBT10 | 113.46 | 32.58 | 120.95 | 30.41 | 72.27 | 0.00 | 71.52 | 17.35 | 300.09 | 41.19 | 32.58 | 49.43 | 22.97 | 19.85 | 0.00 | 19.47 | 4.76 | 370.90 | 93.62 | 32.58 | 101.48 | 14.46 |
| 31 | PBT10 | 41.33 | 11.87 | 44.06 | 11.08 | 26.33 | 0.00 | 26.05 | 6.32 | 109.31 | 15.00 | 11.87 | 18.00 | 22.97 | 7.23 | 0.00 | 7.09 | 1.74 | 135.10 | 34.10 | 11.87 | 36.96 | 14.46 |
| 32 | PBT10 | 86.43 | 24.82 | 92.14 | 23.17 | 55.06 | 0.00 | 54.49 | 13.21 | 228.60 | 31.38 | 24.82 | 37.65 | 22.97 | 15.12 | 0.00 | 14.83 | 3.63 | 282.55 | 71.32 | 24.82 | 77.31 | 14.46 |
| 33 | PBT10 | 61.94 | 17.79 | 66.03 | 16.60 | 39.46 | 0.00 | 39.05 | 9.47 | 163.83 | 22.49 | 17.79 | 26.99 | 22.97 | 10.84 | 0.00 | 10.63 | 2.60 | 202.49 | 51.11 | 17.79 | 55.40 | 14.46 |
| 34 | PBT10 | 14.42 | 4.14 | 15.37 | 3.87 | 9.19 | 0.00 | 9.09 | 2.20 | 38.14 | 5.24 | 4.14 | 6.28 | 22.97 | 2.52 | 0.00 | 2.47 | 0.61 | 47.14 | 11.90 | 4.14 | 12.90 | 14.46 |
| 35 | PBT10 | 21.16 | 6.07 | 22.55 | 5.67 | 13.48 | 0.00 | 13.34 | 3.23 | 55.96 | 7.68 | 6.07 | 9.22 | 22.97 | 3.70 | 0.00 | 3.63 | 0.89 | 69.16 | 17.46 | 6.07 | 18.92 | 14.46 |
| 36 | PBT10 | 34.22 | 9.82 | 36.47 | 9.17 | 21.79 | 0.00 | 21.57 | 5.23 | 90.50 | 12.42 | 9.82 | 14.91 | 22.97 | 5.99 | 0.00 | 5.87 | 1.44 | 111.85 | 28.23 | 9.82 | 30.60 | 14.46 |
| 37 | PBT10 | 20.42 | 5.86 | 21.77 | 5.47 | 13.01 | 0.00 | 12.87 | 3.12 | 54.01 | 7.41 | 5.86 | 8.90 | 22.97 | 3.57 | 0.00 | 3.50 | 0.86 | 66.76 | 16.85 | 5.86 | 18.27 | 14.46 |
| 38 | PBT11 | 20.48 | 13.70 | 23.91 | 6.10 | 10.75 | 0.00 | 10.62 | 2.52 | 71.79 | 9.73 | 13.70 | 13.29 | 20.04 | 3.36 | 0.00 | 3.29 | 0.79 | 82.19 | 17.13 | 13.70 | 20.62 | 15.46 |
| 39 | PBT11 | 57.74 | 38.62 | 67.39 | 17.20 | 30.32 | 0.00 | 29.93 | 7.10 | 202.39 | 27.42 | 38.62 | 37.46 | 20.04 | 9.46 | 0.00 | 9.27 | 2.22 | 231.69 | 48.28 | 38.62 | 58.12 | 15.46 |
| 40 | PBT12 | 115.84 | 0.00 | 114.52 | 27.83 | 115.84 | 0.00 | 114.52 | 27.83 | 0.00 | 0.00 | 0.00 | 0.00 | 0.00 | 27.41 | 0.00 | 27.41 | 6.61 | 86.39 | 88.43 | 0.00 | 87.10 | 4.07 |
| 41 | PBT13 | 5.17 | 6.33 | 6.79 | 2.10 | 3.88 | 0.00 | 3.85 | 0.93 | 18.15 | 1.29 | 6.33 | 2.94 | 15.47 | 0.55 | 0.00 | 0.55 | 0.13 | 21.45 | 4.62 | 6.33 | 6.24 | 10.87 |
| 42 | PBT14 | 109.82 | 9.68 | 111.26 | 23.77 | 69.85 | 0.00 | 69.13 | 14.60 | 149.61 | 39.97 | 9.68 | 42.14 | 16.32 | 10.30 | 0.00 | 10.20 | 2.15 | 209.32 | 99.52 | 9.68 | 101.07 | 9.69 |
| 43 | PBT15 | 38.18 | 0.00 | 37.78 | 9.16 | 14.86 | 0.00 | 14.70 | 3.57 | 59.17 | 23.32 | 0.00 | 23.08 | 10.57 | 5.68 | 0.00 | 5.60 | 1.36 | 73.88 | 32.50 | 0.00 | 32.18 | 9.47 |
| 44 | PBT15 | 36.31 | 0.00 | 35.93 | 8.71 | 14.13 | 0.00 | 13.98 | 3.39 | 56.26 | 22.18 | 0.00 | 21.95 | 10.57 | 5.40 | 0.00 | 5.32 | 1.30 | 70.25 | 30.91 | 0.00 | 30.60 | 9.47 |
References
- European Commission, Secretariat-General. Communication from the Commission to the European Parliament, the European Council, the Council, the European Economic and Social Committee and the Committee of the Regions; The European Green Deal, COM (2019) 640 final; European Commission: Brussels, Belgium, 2019. [Google Scholar]
- Directive 2012/27/EU of the European Parliament and of the Council of 25 October 2012, on energy efficiency, amending Directives 2009/125/EC and 2010/30/EU and repealing Directives 2004/8/EC and 2006/32/EC, L315/1. Off. J. Eur. Union 2012, 315, 1–56. Available online: https://eur-lex.europa.eu/legal-content/EN/ALL/?uri=CELEX:32012L0027 (accessed on 1 January 2024).
- In Focus: Energy Efficiency in Buildings. Available online: https://commission.europa.eu/news/focus-energy-efficiency-buildings-2020-02-17_en (accessed on 20 December 2023).
- Directive (EU) 2023/1791 of the European Parliament and of the Council of 13 September 2023 on energy efficiency and amending Regulation (EU) 2023/955 (recast), L231/1. Off. J. Eur. Union 2023, 231, 1–111. Available online: https://eur-lex.europa.eu/legal-content/en/ALL/?uri=CELEX:32023L1791&qid=1706619805653 (accessed on 1 January 2024).
- D’Oca, S.; Ferrante, A.; Ferrer, C.; Pernetti, R.; Gralka, A.; Sebastian, R.; Veld, P.O. Technical, Financial, and Social Barriers and Challenges in Deep Building Renovation: Integration of Lessons Learned from the H2020 Cluster Projects. Buildings 2018, 8, 174. [Google Scholar] [CrossRef]
- Salvia, M.; Simoes, S.G.; Herrando, M.; Čavar, M.; Cosmi, C.; Pietrapertosa, F.; Gouveia, J.P.; Fueyo, N.; Gómez, A.; Papadopoulou, K.; et al. Improving policy making and strategic planning competencies of public authorities in the energy management of municipal public buildings: The PrioritEE toolbox and its application in five mediterranean areas. Renew. Sustain. Energy Rev. 2021, 135, 110106. [Google Scholar] [CrossRef]
- Shu, L.; Zhao, D. Decision-Making Approach to Urban Energy Retrofit—A Comprehensive Review. Buildings 2023, 13, 1425. [Google Scholar] [CrossRef]
- Stavrakakis, G.M.; Zervas, P.L.; Terzis, K.; Langouranis, P.; Saranti, P.; Stephanedes, Y.J. Exploitation of Mediterranean Cooperation Projects’ Tools for the Development of Public Buildings’ Energy Efficiency Plans at Local Level: A Case Study in Greece. Energies 2023, 16, 3352. [Google Scholar] [CrossRef]
- Pristerà, G.; Allacker, K.; Rock, M.; Sala, S. Archetype selection process for the development of a building stock model. IOP Conf. Ser. Earth Environ. Sci. 2023, 1196, 012013. [Google Scholar] [CrossRef]
- Verellen, E.; Allacker, K. Developing a Building Stock Model to Enable Clustered Renovation—The City of Leuven as Case Study. Sustainability 2022, 14, 5769. [Google Scholar] [CrossRef]
- Dong, J.; Schwartz, Y.; Mavrogianni, A.; Korolija, I.; Mumovic, D. A review of approaches and applications in building stock energy and indoor environment modelling. Building Serv. Eng. Res. Technol. 2023, 44, 333–354. [Google Scholar] [CrossRef]
- Droutsa, K.G.; Kontoyiannidis, S.; Balaras, C.A.; Dascalaki, E.G.; Argiriou, A.A. Representative typology of buildings: Case study of hellenic non residential buildings. Energy Sources Part A Recovery Util. Environ. Eff. 2022, 1–21. [Google Scholar] [CrossRef]
- Gangolells, M.; Casals, M.; Ferré-Bigorra, J.; Forcada, N.; Macarulla, M.; Gaspar, K.; Tejedor, B. Office representatives for cost-optimal energy retrofitting analysis: A novel approach using cluster analysis of energy performance certificate databases. Energy Build. 2020, 206, 109557. [Google Scholar] [CrossRef]
- Ruggieri, G.; Andreolli, F.; Zangheri, P. A Policy Roadmap for the Energy Renovation of the Residential and Educational Building Stock in Italy. Energies 2023, 16, 1319. [Google Scholar] [CrossRef]
- IMPULSE/IMPULSE PLUS Project. Available online: https://impulse.interreg-med.eu/ (accessed on 20 December 2023).
- Perney, M.E.P.; D’Angelo, G. Local Governance Support Tools for Disaster Risk Reduction and Climate Adaptation Strategies: The EU Contribution in the Case Study of the Municipality of Naples. Sustainability 2023, 15, 11716. [Google Scholar] [CrossRef]
- Deb, C.; Lee, S.E. Determining key variables influencing energy consumption in office buildings through cluster analysis of pre- and post-retrofit building data. Energy Build. 2018, 159, 228–245. [Google Scholar] [CrossRef]
- Gao, X.; Malkawi, A. A new methodology for building energy performance benchmarking: An approach based on intelligent clustering algorithm. Energy Build. 2014, 84, 607–616. [Google Scholar] [CrossRef]
- Marasco, D.E.; Kontokosta, C.E. Applications of machine learning methods to identifying and predicting building retrofit opportunities. Energy Build. 2016, 128, 431–441. [Google Scholar] [CrossRef]
- Hsu, D. Comparison of integrated clustering methods for accurate and stable prediction of building energy consumption data. Appl. Energy 2015, 160, 153–163. [Google Scholar] [CrossRef]
- Benavente-Peces, C.; Ibadah, N. Buildings Energy Efficiency Analysis and Classification Using Various Machine Learning Technique Classifiers. Energies 2020, 13, 3497. [Google Scholar] [CrossRef]
- Ignjatović, D.; Bojana, Z.; Ćuković Ignjatović, N.; Đukanović, L.; Radivojević, A.; Rajčić, A. Methodology for Residential Building Stock Refurbishment Planning—Development of Local Building Typologies. Sustainability 2021, 13, 4262. [Google Scholar] [CrossRef]
- Dascalaki, E.G.; Balaras, C.A.; Kontoyiannidis, S.; Droutsa, K.G. Modeling energy refurbishment scenarios for the Hellenic residential building stock towards the 2020 & 2030 targets. Energy Build. 2016, 132, 74–90. [Google Scholar]
- Heeren, N.; Jakob, M.; Martius, G.; Gross, N.; Wallbaum, H. A component based bottom-up building stock model for comprehensive environmental impact assessment and target control. Renew. Sustain. Energy Rev. 2013, 20, 45–56. [Google Scholar] [CrossRef]
- Österbring, M.; Mata, É.; Thuvander, L.; Mangold, M.; Johnsson, F.; Wallbaum, H. A differentiated description of building-stocks for a georeferenced urban bottom-up building-stock model. Energy Build. 2016, 120, 78–84. [Google Scholar] [CrossRef]
- European Parliament and the Council. Directive 2018/2002/EU of the European Parliament and of the Council of 11 December 2018, amending Directive 2012/27/EU on energy efficiency, L328/210. Off. J. Eur. Union 2018, 328, 210–229.
- Energy Efficiency Plans for Regional and Municipal Buildings. Available online: https://ypen.gov.gr/energeia/energeiaki-exoikonomisi/ktiria/schedio-energeiakis-apodosis-ktirion-perifereion-kai-dimon/ (accessed on 20 December 2023).
- Software of the Buildings’ Energy Performance Regulation—Technical Chamber of Greece. Available online: https://web.tee.gr/kenak/logismiko-tee-kenak/ (accessed on 20 December 2023).
- Efthymiou, E.N.; Yfanti, S.; Kyriakarakos, G.; Zervas, P.L.; Langouranis, P.; Terzis, K.; Stavrakakis, G.M. A Practical Methodology for Building a Municipality-Led Renewable Energy Community: A Photovoltaics-Based Case Study for the Municipality of Hersonissos in Crete, Greece. Sustainability 2022, 14, 12935. [Google Scholar] [CrossRef]
- IMPULSE-Building Typologies and Performance Indicators Platforms. Available online: https://impulse.interreg-med.eu/what-we-achieve/deliverable-database/detail/?tx_elibrary_pi1%5Blivrable%5D=3123&tx_elibrary_pi1%5Baction%5D=show&tx_elibrary_pi1%5Bcontroller%5D=Frontend%5CLivrable&cHash=661c222449fa8c5ae7eea9b1d0696d9f (accessed on 20 December 2023).
- IMPULSE PLUG-IN KPIs’ Processor Tool. Available online: https://impulse.interreg-med.eu/what-we-achieve/deliverable-database/detail/?tx_elibrary_pi1%5Blivrable%5D=16103&tx_elibrary_pi1%5Baction%5D=show&tx_elibrary_pi1%5Bcontroller%5D=Frontend%5CLivrable&cHash=09091e4a5cc917f3e0c0b91fc66c4945 (accessed on 6 March 2023).
- Ministerial Decision 974B/2021. Report on the long-term strategy for renovating the stock of public and private buildings and transforming it into a decarbonised and highly energy efficient stock of buildings by 2050, facilitating the cost-effective transformation of existing buildings into nearly zero-energy buildings. Available online: https://energy.ec.europa.eu/topics/energy-efficiency/energy-efficient-buildings/long-term-renovation-strategies_en (accessed on 20 December 2023).
- Tsirigoti, D.; Zenginis, D.; Bikas, D. Sustainable Development Scenarios for Urban Blocks: Energy Renovation and Quality of Life in the Greek City. Environ. Sci. Proc. 2022, 15, 37. [Google Scholar]
- Pallis, P.; Gkonis, N.; Varvagiannis, E.; Braimakis, K.; Karellas, S.; Katsaros, M.; Katsaros, M.; Vourliotis, P.; Sarafianos, D. Towards NZEB in Greece: A comparative study between cost optimality and energy efficiency for newly constructed residential buildings. Energy Build. 2019, 198, 115–137. [Google Scholar] [CrossRef]


| Classification Criterion | Assigned Options (for Classification Purposes) | Justification/Explanation |
|---|---|---|
| Building use | Office; Educational; Multi-purpose building; Rural medical center |
|
| Construction year | Before 1980; From 1980 to 2010; After 2010 |
|
| No. of floors (including ground floor) | 1; 1 to 3 |
|
| Heating system | Oil boiler; Local heat pump (Split unit); Central heat pump; Not exist |
|
| Cooling system | Local heat pump (Split unit); Central heat pump; Not exist |
|
| Construction type | Heavy construction (bricks and reinforced concrete); Very heavy construction (stonework) |
|
| Insulation applied | Yes; No; Insufficient according to the TIR 2; Insufficient according to the EPBD 3 |
|
| Window type | Single-glazed aluminum frames; Double-glazed aluminum frames; Single-glazed wooden frames; Single-glazed aluminum and double-glazed wooden frames; Double-glazed aluminum and single-glazed wooden frames |
|
| Decision-Making Parameter | Decision-Making Target | Treatment in the IMPULSE PLUGIN Tool |
|---|---|---|
| Desired annual renovation rate | At least 3% of the total building-stock floor area | Determined through sensitivity analysis, starting from a renovation rate equal to 3% as initial input condition. |
| Desired duration of foreseen projects’ implementation | Up to 12 years | Output of the PLUGIN tool. Treated as a convergence criterion of the sensitivity analysis. |
| Annual investment cost | Not exceeding EUR 1 million | Output of the PLUGIN tool. Treated as a convergence criterion of the sensitivity analysis. |
| Priority to projects with the highest possible reduction in energy consumption per carrier | Maximum reduction in electricity and oil consumption | The indicators electricity savings and savings of fossil-fuel consumption are included in the set of the decision-making KPIs. The weights of the KPIs are determined after convergence of a sensitivity analysis. |
| Buildings’ energy performance after renovation | nZEB | Only the nZEB renovation scenarios are included in the decision-making scheme. |
| Building types of top priority | Educational buildings | The following is included as a convergence criterion in the sensitivity analysis: % of school projects within the first 6 years >60%. |
| No. of projects | Not more than 3 projects each year within the first 6 years of implementation | The following is included as a convergence criterion in the sensitivity analysis: No. of years within the first 6 yrs of implementation with up to 3 projects >4. |
| Public Building Typology | Classification Criteria | Buildings 1 | |||
|---|---|---|---|---|---|
| Building Type/Use | Construction Year | Heating System | Cooling System | ||
| PBT1 | Office | Before 1980 | Local heat pump (Split unit) | Local heat pump (Split unit) | City Hall; Building 202; Municipal Store of Episkopi; Building 154 |
| PBT2 | Office | 1980–2010 | Local heat pump (Split unit) | Local heat pump (Split unit) | Municipal Store of Hersonissos Port; Municipal Store of Malia; Fire Brigade Building; Former office Building of Municipal Water and Sewerage Company of Hersonissos |
| PBT3 | Office | 1980–2010 | Oil boiler | Local heat pump (Split unit) | Former Courthouse |
| PBT4 | Education | Before 1980 | Local heat pump (Split unit) | Local heat pump (Split unit) | Computer room of Gouves senior high School (688); Gournes Elementary School (“Eirini”—Building 207); Gournes Elementary School |
| PBT5 | Education | Before 1980 | Central heat pump | Central heat pump | Episkopi Elementary School |
| PBT6 | Education | Before 1980 | Oil boiler | Local heat pump (Split unit) | Gouves senior high School (156); Gouves Junior High School (156 and 158); 2nd Vocational Training Institute of Heraklion (Building 303); School of Fine Arts (Building 301); Music School (Building 308); Gouves Elementary School; Elia Elementary School; Kokkini-Chani Elementary School; Hersonissos Port Kindergarten; 1st Elementary School of Malia (Building 1); Mochos Elementary School; Malia Kindergarten (One Building—Old) |
| PBT7 | Education | Before 1980 | Oil boiler | Not exist | Kindergarten and Elementary School of Gonies |
| PBT8 | Education | Before 1980 | Not exist | Not exist | Music School (Building 302) |
| PBT9 | Education | 1980–2010 | Central heat pump | Central heat pump | Episkopi Kindergarten |
| PBT10 | Education | 1980–2010 | Oil boiler | Local heat pump (Split unit) | Episkopi Junior and Senior High School; Hersonissos Port Junior and Senior High School; Malia Junior and Senior High School -Building A; Hersonissos Port Elementary School; Elementary School of Hersonissos old village; 2nd Elementary School of Malia; 1st Elementary School of Malia (Building 2); Malia Kindergarten; Hersonissos Elementary School |
| PBT11 | Education | 1980–2010 | Oil boiler | Not exist | Malia Junior and Senior High School-Building B; Mochos Junior High School- High School |
| PBT12 | Education | After 2010 | Central heat pump | Central heat pump | New School Complex of Primary Education in Kokkini-Chani (Elementary School–Kindergarten) |
| PBT13 | Education | After 2010 | Oil boiler | Local heat pump (Split unit) | Mochos Kindergarten |
| PBT14 | Rural Medical Facility | 1980–2010 | Local heat pump (Split unit) | Local heat pump (Split unit) | Cultural Center of Hersonissos Port |
| PBT15 | Multi-purpose building | Before 1980 | Local heat pump (Split unit) | Local heat pump (Split unit) | Library—Multi-purpose building (310); Avdou Elementary School (New-Building) |
| Intervention 1 | PBT1 | PBT2 | PBT3 | PBT4 | PBT5 | PBT6 | PBT7 | PBT8 | PBT9 | PBT10 | PBT11 | PBT12 | PBT13 | PBT14 | PBT15 |
|---|---|---|---|---|---|---|---|---|---|---|---|---|---|---|---|
| Scenario 1: MEPR (Major Retrofit) | |||||||||||||||
| WTI-EPS7 | 490 m2 | 1102 m2 | 534 m2 | 249 m2 | 458 m2 | 666 m2 | 340 m2 | 897 m2 | 251 m2 | − | − | − | − | 551 m2 | 359 m2 |
| RTI-EPS7 | 683 m2 | 673 m2 | 450 m2 | 377 m2 | 316 m2 | 1005 m2 | 265 m2 | 1362 m2 | 157 m2 | − | − | − | − | 371 m2 | 403 m2 |
| WR-DG-LE | 214 m2 | 226 m2 | 76 m2 | 59 m2 | 67 m2 | 251 m2 | 65 m2 | 207 m2 | 43 m2 | 542 m2 | 83 m2 | − | − | 134 m2 | 37 m2 |
| CHP-H | − | − | − | 52 kW | − | 122 kW | 50 kW | − | − | 291 kW | 80 kW | − | 50 kW | − | − |
| CHP-HC | − | 196 kW | 73 kW | − | − | − | − | 184 kW | − | − | − | − | − | 91 kW | − |
| LHP | − | − | − | − | − | − | 38 kW | − | − | 155 kW | 69 kW | − | − | − | 37 kW |
| LED | 4.0 kW | 7.8 kW | 3.0 kW | 1.0 kW | 0.7 kW | 3.2 kW | 0.7 kW | 4.1 kW | 0.8 kW | 11.2 kW | 2.7 kW | − | 0.8 kW | 3.6 kW | 0.9 kW |
| Scenario 2: nZEB (Deep retrofit, built on top of Scenario 1) | |||||||||||||||
| Scenario 1 | ✓ | ✓ | ✓ | ✓ | ✓ | ✓ | ✓ | ✓ | ✓ | ✓ | ✓ | - | ✓ | ✓ | ✓ |
| PV | 31 kWp | 72 kWp | 16 kWp | 4 kWp | 8 kWp | 9 kWp | 3 kWp | 8 kWp | 3 kWp | 45 kWp | 7 kWp | 55 kWp | 2 kWp | 38 kWp | 9 kWp |
| PBT | KPIs—Existing Situation 1 | KPIs—Scenario 1 (MEPR) 1 | KPIs—Scenario 2 (nZEB) 1 | ||||||||||||||||
|---|---|---|---|---|---|---|---|---|---|---|---|---|---|---|---|---|---|---|---|
| FECe (kWh/m2.a) | HOFCe (kWh/m2.a) | REGe (kWh/m2.a) | t-CO2,e (kg/m2.a) | t-ECe (EUR/m2.a) | FECSc1 (kWh/m2.a) | HOFCSc1 (kWh/m2.a) | REGSc1 (kWh/m2.a) | t-CO2,Sc1 (kg/m2.a) | t-ECSc1 (EUR/m2.a) | n-ICSc1 (EUR/m2) | SPPSc1( yrs) | FECSc2 (kWh/m2.a) | HOFCSc2 (kWh/m2.a) | REGSc2 (kWh/m2.a) | t-CO2,Sc2 (kg/m2.a) | t-ECSc2 (EUR/m2.a) | n-ICSc2 (EUR/m2) | SPPSc2 (yrs) | |
| PBT1 | 98.8 | 0.0 | 0.0 | 97.7 | 23.7 | 51.8 | 0.0 | 0.0 | 51.2 | 12.4 | 12,034 | 13.7 | 2.2 | 0.0 | 49.7 | 2.2 | 0.5 | 511 | 8.9 |
| PBT2 | 80.4 | 0.0 | 0.0 | 79.5 | 19.3 | 62.3 | 0.0 | 0.0 | 61.6 | 15.0 | 27,601 | 35.6 | 2.2 | 0.0 | 68.4 | 2.2 | 0.5 | 974 | 11.5 |
| PBT3 | 101.0 | 42.8 | 0.0 | 111.1 | 30.1 | 40.8 | 0.0 | 0.0 | 40.3 | 9.8 | 6483 | 9.2 | 2.0 | 0.0 | 38.8 | 2.0 | 0.5 | 317 | 7.6 |
| PBT4 | 41.1 | 0.0 | 0.0 | 40.9 | 9.9 | 15.3 | 0.0 | 0.0 | 15.1 | 3.7 | 1421 | 29.3 | 4.8 | 0.0 | 9.7 | 4.7 | 1.2 | 445 | 22.6 |
| PBT5 | 42.9 | 0.0 | 0.0 | 42.4 | 10.3 | 29.8 | 0.0 | 0.0 | 29.5 | 7.2 | 2963 | 45.1 | 4.9 | 0.0 | 20.3 | 4.8 | 1.2 | 487 | 18.8 |
| PBT6 | 35.0 | 34.6 | 0.0 | 43.7 | 11.8 | 14.6 | 0.0 | 0.0 | 14.4 | 3.5 | 3608 | 24.0 | 5.4 | 0.0 | 9.5 | 14.4 | 1.3 | 1342 | 20.3 |
| PBT7 | 27.2 | 111.4 | 0.0 | 56.3 | 17.4 | 20.1 | 0.0 | 0.0 | 19.9 | 4.8 | 1331 | 21.4 | 4.5 | 0.0 | 10.8 | 4.5 | 1.1 | 298 | 17.7 |
| PBT8 | 42.8 | 0.0 | 0.0 | 42.3 | 10.3 | 10.3 | 0.0 | 0.0 | 10.1 | 2.5 | 3733 | 23.7 | 2.0 | 0.0 | 8.3 | 2.0 | 0.5 | 726 | 19.7 |
| PBT9 | 30.9 | 0.0 | 0.0 | 30.6 | 6.6 | 15.5 | 0.0 | 0.0 | 15.3 | 3.3 | 1038 | 36.5 | 5.1 | 0.0 | 9.0 | 5.0 | 1.1 | 341 | 24.3 |
| PBT10 | 30.3 | 8.7 | 0.0 | 32.3 | 8.1 | 19.3 | 0.0 | 0.0 | 19.1 | 4.6 | 17,345 | 23.0 | 5.3 | 0.0 | 12.7 | 5.2 | 1.3 | 4763 | 14.5 |
| PBT11 | 29.9 | 20.0 | 0.0 | 34.9 | 8.9 | 15.7 | 0.0 | 0.0 | 15.5 | 3.7 | 2519 | 20.0 | 4.9 | 0.0 | 12.6 | 4.8 | 1.2 | 786 | 15.5 |
| PBT12 | 26.2 | 0.0 | 0.0 | 25.9 | 6.3 | 26.2 | 0.0 | 0.0 | 25.9 | 6.3 | 27,834 | 0.0 | 6.2 | 0.0 | 20.0 | 6.2 | 1.5 | 6611 | 4.1 |
| PBT13 | 18.8 | 23.0 | 0.0 | 24.7 | 7.7 | 14.1 | 0.0 | 0.0 | 14.0 | 3.4 | 931 | 15.5 | 2.0 | 0.0 | 12.1 | 2.0 | 0.5 | 132 | 10.9 |
| PBT14 | 106.6 | 9.4 | 0.0 | 108 | 23.1 | 67.8 | 0.0 | 0.0 | 67.1 | 14.2 | 14,598 | 16.3 | 10.0 | 0.0 | 65.0 | 9.9 | 2.1 | 2153 | 9.7 |
| PBT15 | 94.8 | 0.0 | 0.0 | 93.8 | 22.8 | 36.9 | 0.0 | 0.0 | 36.5 | 8.9 | 3567 | 10.6 | 14.1 | 0.0 | 35.4 | 13.9 | 3.4 | 1363 | 9.5 |
| Combination | Weights | Duration of Implementation (yrs) | Max Annual Investment (EUR) | Years with Up to 3 Projects in the First 6 yrs | % School Projects in the First 6 yrs |
|---|---|---|---|---|---|
| Convergence When: | ≤12 | ≤1,000,000 | >4 | >60% | |
| Comb1 | DC1: 30% DC2: 10% DC3: 60% | 12 | 928,073 | 2 | 82% |
| Comb2 | DC1: 10% DC2: 30% DC3: 60% | 12 | 851,927 | 3 | 52% |
| Comb3 | DC1: 60% DC2: 10% DC3: 30% | 11 | 906,620 | 4 | 91% |
| Comb4 | DC1: 10% DC2: 60% DC3: 30% | 12 | 902,326 | 6 | 43% |
| Comb5 | DC1: 30% DC2: 60% DC3: 10% | 13 | 896,799 | 6 | 45% |
| Comb6 | DC1: 60% DC2: 30% DC3: 10% | 12 | 906,621 | 5 | 65% |
| Year of Implementation | 2024 | 2025 | 2026 | 2027 | 2028 | 2029 | 2030 | 2031 | 2032 | 2033 | 2034 | 2035 | |
|---|---|---|---|---|---|---|---|---|---|---|---|---|---|
| Annual absolute | Floor area retrofitted m² | 4263.04 | 5579.64 | 5445.22 | 3906.35 | 4780.34 | 3684.64 | 4421.52 | 3630.62 | 3305.49 | 3490.26 | 3310.44 | 846.15 |
| Investment EUR | 906,621 | 761,148 | 663,138 | 825,766 | 797,339 | 543,976 | 86,393 | 603,874 | 474,150 | 556,820 | 579,631 | 166,562 | |
| Cost savings EUR/yr | 44,600 | 44,844 | 54,108 | 67,032 | 56,766 | 43,820 | 21,223 | 55,904 | 27,746 | 30,543 | 47,501 | 7372 | |
| Avoided CO2 kg/yr | 124,907 | 155,245 | 207,668 | 273,960 | 216,192 | 169,331 | 87,104 | 222,272 | 93,100 | 115,889 | 196,281 | 30,631 | |
| Energy Savings kWh/yr | 413,515 | 482,809 | 636,176 | 806,741 | 652,948 | 489,892 | 256,448 | 627,591 | 295,116 | 349,375 | 558,735 | 87,577 | |
| Annual accumulated | Floor area retrofitted m² | 4263 | 9843 | 15,288 | 19,194 | 23,975 | 27,659 | 32,081 | 35,711 | 39,017 | 42,507 | 45,818 | 46,664 |
| Investment EUR | 906,621 | 1,667,769 | 2,330,907 | 3,156,673 | 3,954,012 | 4,497,988 | 4,584,381 | 5,188,255 | 5,662,405 | 6,219,225 | 6,798,857 | 6,965,418 | |
| Cost savings EUR/yr | 44,600 | 89,444 | 143,552 | 210,584 | 267,349 | 311,169 | 332,393 | 388,297 | 416,043 | 446,586 | 494,087 | 501,459 | |
| Avoided CO2 kg/yr | 124,907 | 280,152 | 487,820 | 761,781 | 977,972 | 1,147,303 | 1,234,407 | 1,456,679 | 1,549,778 | 1,665,667 | 1,861,949 | 1,892,579 | |
| Energy savings kWh/yr | 413,515 | 896,324 | 1,532,499 | 2,339,240 | 2,992,188 | 3,482,080 | 3,738,528 | 4,366,119 | 4,661,235 | 5,010,610 | 5,569,345 | 5,656,922 | |
| DEEP RETROFIT PROJECTS PER YEAR | PBT6—Music School (Building 308); PBT6—School of Fine Arts (Building 301) | PBT6—2nd Vocational Training Institute of Heraklion (Building 303); PBT10—Hersonissos Port Junior and Senior High School | PBT11—Mochos High School; PBT3—Former Courthouse; PBT10—Hersonissos Port Primary School | PBT6—Gouves senior high School; PBT2—Municipal Store of Hersonissos Port; PBT14—Cultural Center of Hersonissos Port | PBT7—K/garten and Primary School of Gonies; PBT6—Mochos Primary School; PBT10—Episkopi High School; PBT2—Municipal Store of Malia | PBT10—Elementary School of Hersonissos Old village; PBT6—1st Primary School of Malia (Building 1); PBT1—Building 202 | PBT12—New School Complex of Primary Education in Kokkini-Chani | PBT1—City Hall; PBT1—Building 154; PBT10—Malia High School -Building A; PBT6-Gouves Junior High School (156 and 158) | PBT11—Malia High School -Building B; PBT6—Gouves Primary School; PBT13—Mochos Kindergarten; PBT6—Elia Primary School; PBT10—Malia Kindergarten; PBT6—Kokkini-Chani Primary School | PBT8—Music School (Building 302); PBT6—Hersonissos Port Kindergarten; PBT6—Malia Kindergarten (Old building); PBT10—1st Primary School of Malia (Building 2); PBT10—Hersonissos Primary School | PBT10—2nd Primary School of Malia; PBT1—Municipal Store of Episkopi; PBT15—Library—Venue of Multiple Use (310); PBT15—Avdou Primary School; PBT2—Former office Building of Municipal Water and Sewerage Company of Hersonissos; PBT2—Fire Brigade Building; PBT9—Episkopi Kindergarten; PBT5—Episkopi Primary School; PBT4—Computer room of Gouves High School (688) | PBT4—Gournes Secondary School; PBT4—Gournes Primary School (“Eirini”—Building 207) | |
Disclaimer/Publisher’s Note: The statements, opinions and data contained in all publications are solely those of the individual author(s) and contributor(s) and not of MDPI and/or the editor(s). MDPI and/or the editor(s) disclaim responsibility for any injury to people or property resulting from any ideas, methods, instructions or products referred to in the content. |
© 2024 by the authors. Licensee MDPI, Basel, Switzerland. This article is an open access article distributed under the terms and conditions of the Creative Commons Attribution (CC BY) license (https://creativecommons.org/licenses/by/4.0/).
Share and Cite
Stavrakakis, G.M.; Bakirtzis, D.; Drakaki, K.-K.; Yfanti, S.; Katsaprakakis, D.A.; Braimakis, K.; Langouranis, P.; Terzis, K.; Zervas, P.L. Application of the Typology Approach for Energy Renovation Planning of Public Buildings’ Stocks at the Local Level: A Case Study in Greece. Energies 2024, 17, 689. https://doi.org/10.3390/en17030689
Stavrakakis GM, Bakirtzis D, Drakaki K-K, Yfanti S, Katsaprakakis DA, Braimakis K, Langouranis P, Terzis K, Zervas PL. Application of the Typology Approach for Energy Renovation Planning of Public Buildings’ Stocks at the Local Level: A Case Study in Greece. Energies. 2024; 17(3):689. https://doi.org/10.3390/en17030689
Chicago/Turabian StyleStavrakakis, George M., Dimitris Bakirtzis, Korina-Konstantina Drakaki, Sofia Yfanti, Dimitris Al. Katsaprakakis, Konstantinos Braimakis, Panagiotis Langouranis, Konstantinos Terzis, and Panagiotis L. Zervas. 2024. "Application of the Typology Approach for Energy Renovation Planning of Public Buildings’ Stocks at the Local Level: A Case Study in Greece" Energies 17, no. 3: 689. https://doi.org/10.3390/en17030689
APA StyleStavrakakis, G. M., Bakirtzis, D., Drakaki, K.-K., Yfanti, S., Katsaprakakis, D. A., Braimakis, K., Langouranis, P., Terzis, K., & Zervas, P. L. (2024). Application of the Typology Approach for Energy Renovation Planning of Public Buildings’ Stocks at the Local Level: A Case Study in Greece. Energies, 17(3), 689. https://doi.org/10.3390/en17030689