

An Estimation of the Available Spatial Intensity of Solar Energy in Urban Blocks in Wuhan, China
Abstract
1. Introduction
1.1. Background
1.2. Literature Review
1.2.1. Urban Block Form and ASI of Solar Energy
1.2.2. Quantification Method of ASI of Solar Energy
1.3. Research Objectives and Structure
- (1)
- Does the form of urban blocks have an impact on the ASI? Which urban form indicators have the most significant impact?
- (2)
- How do we orderly develop and plan the available space for solar energy to ensure the rational utilization of solar energy resources and urban space?
2. Methods and Materials
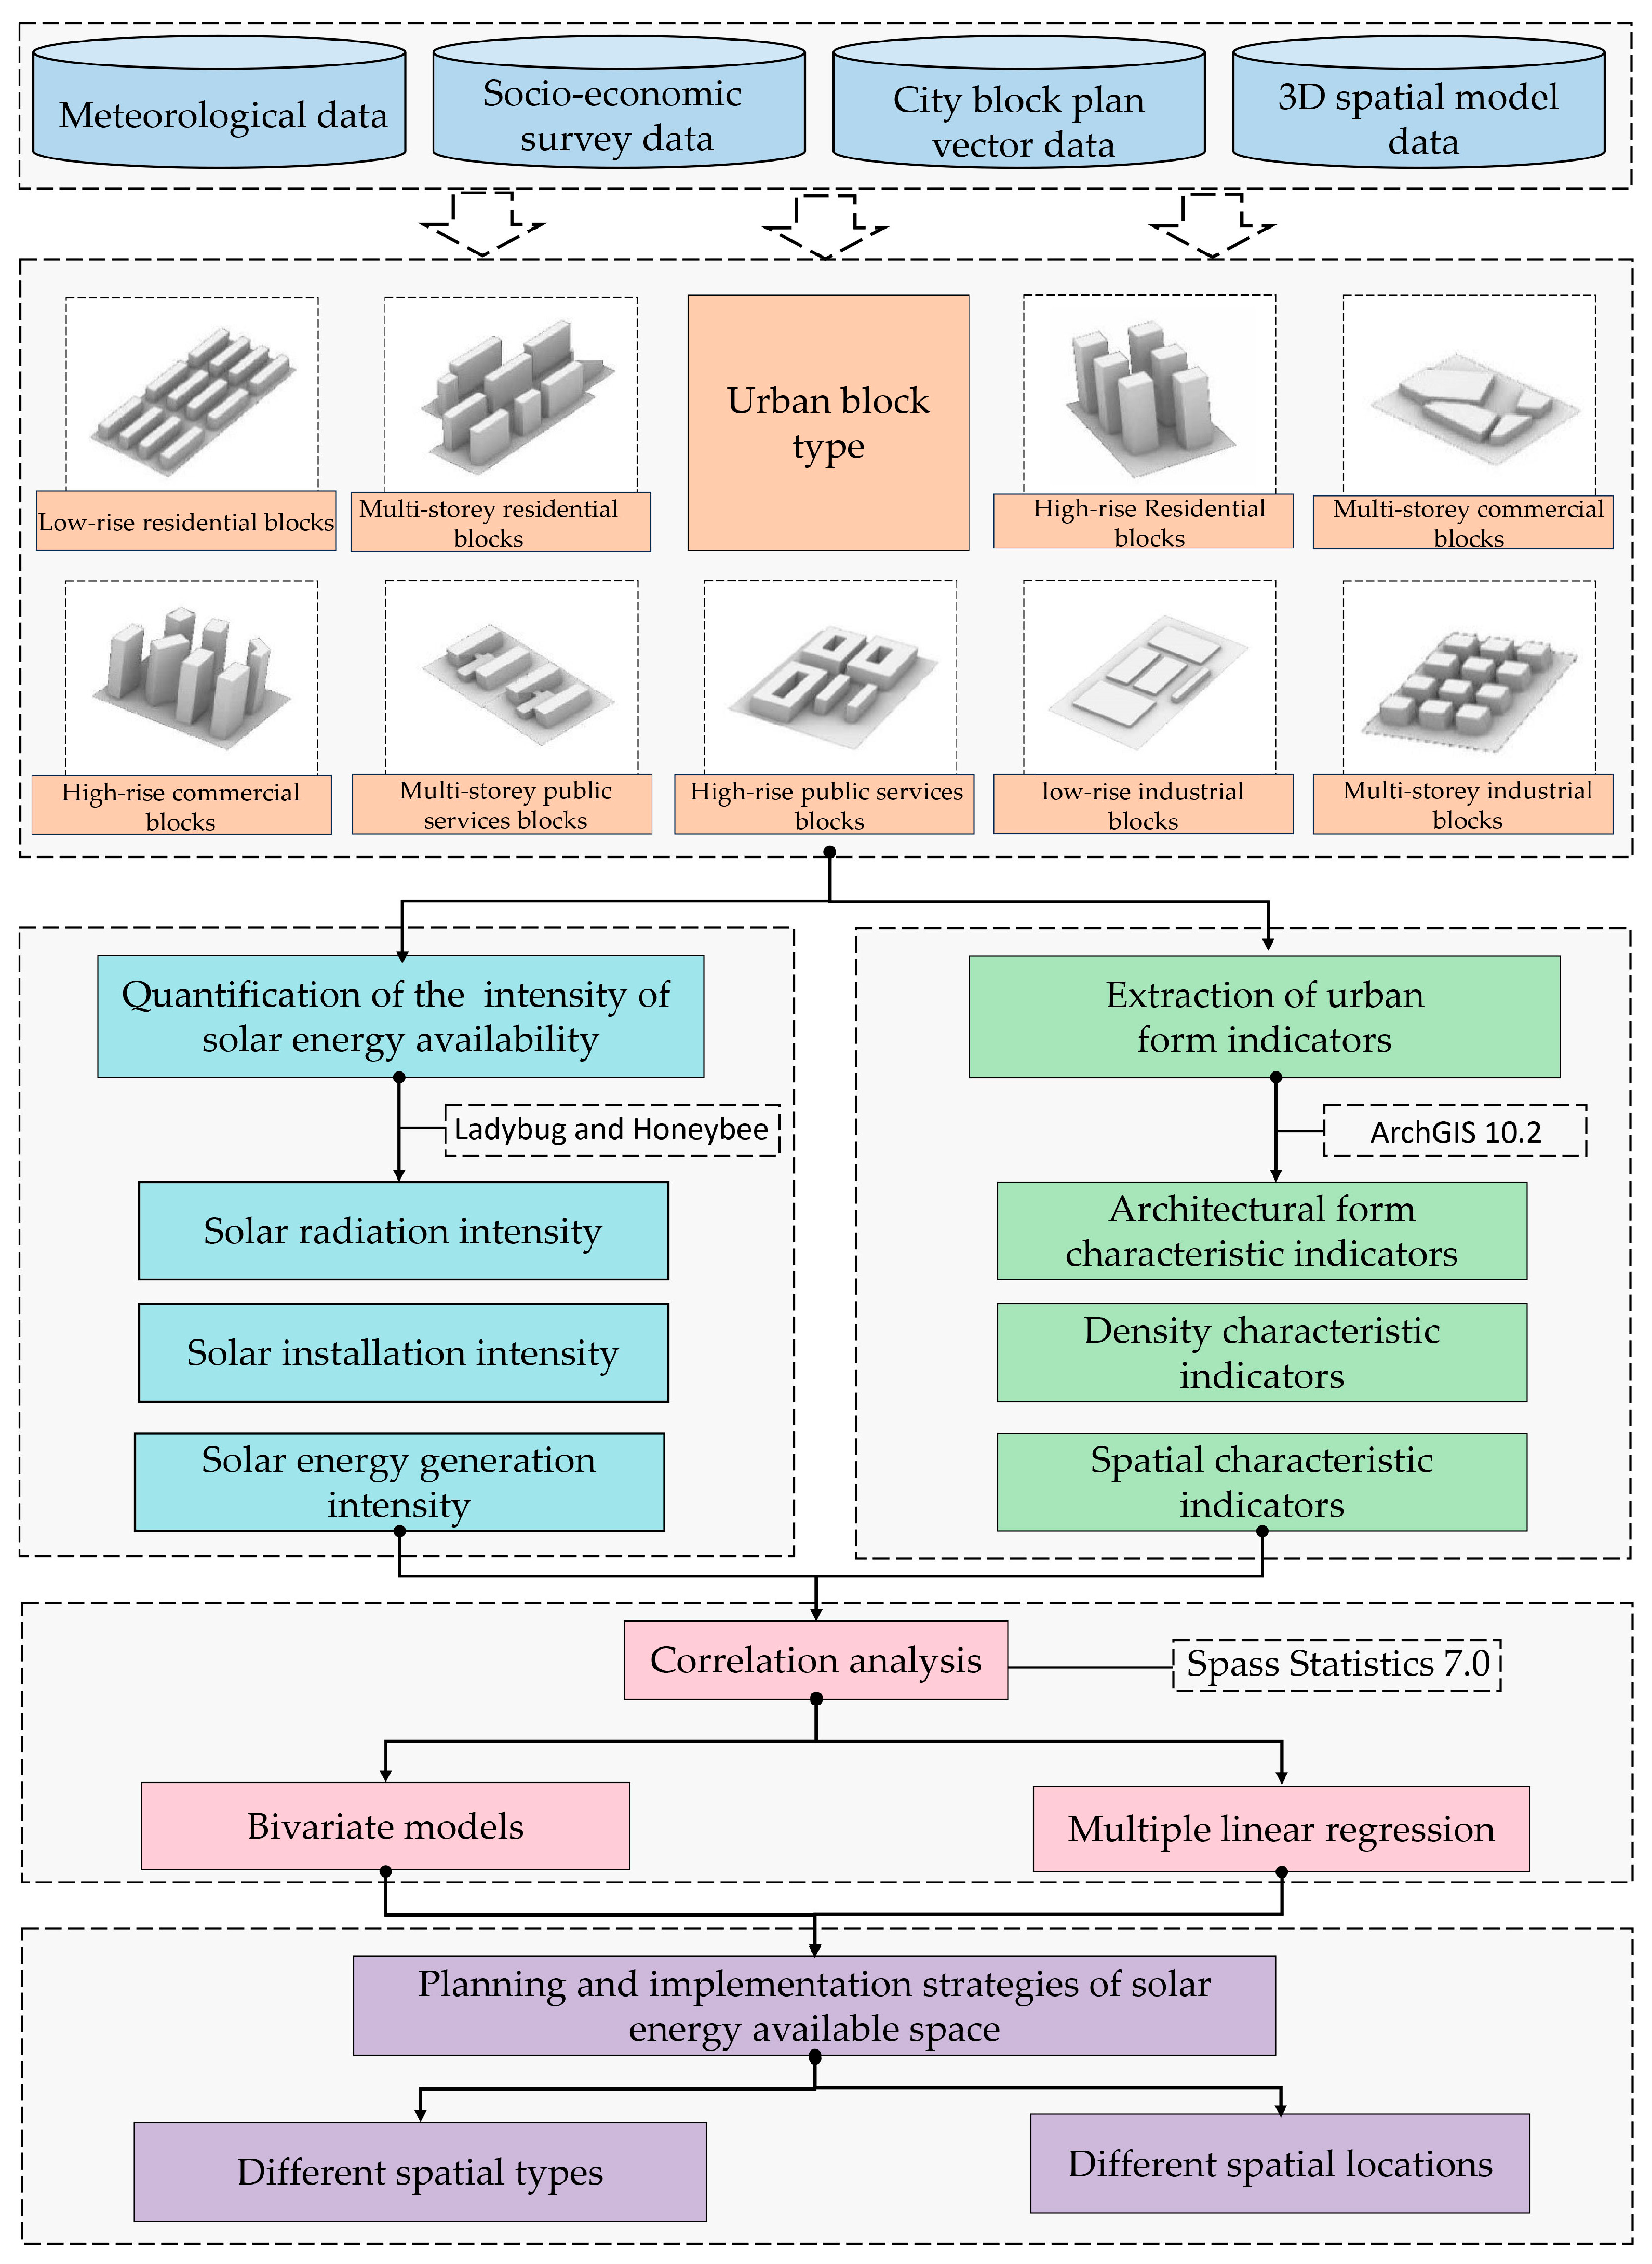
2.1. Framework for Evaluating the ASI of Solar Energy in Urban Blocks
2.2. Study Site
2.3. Type of Investigation
2.4. Data Sources and Pre-Processing
2.5. Urban Form Indicators
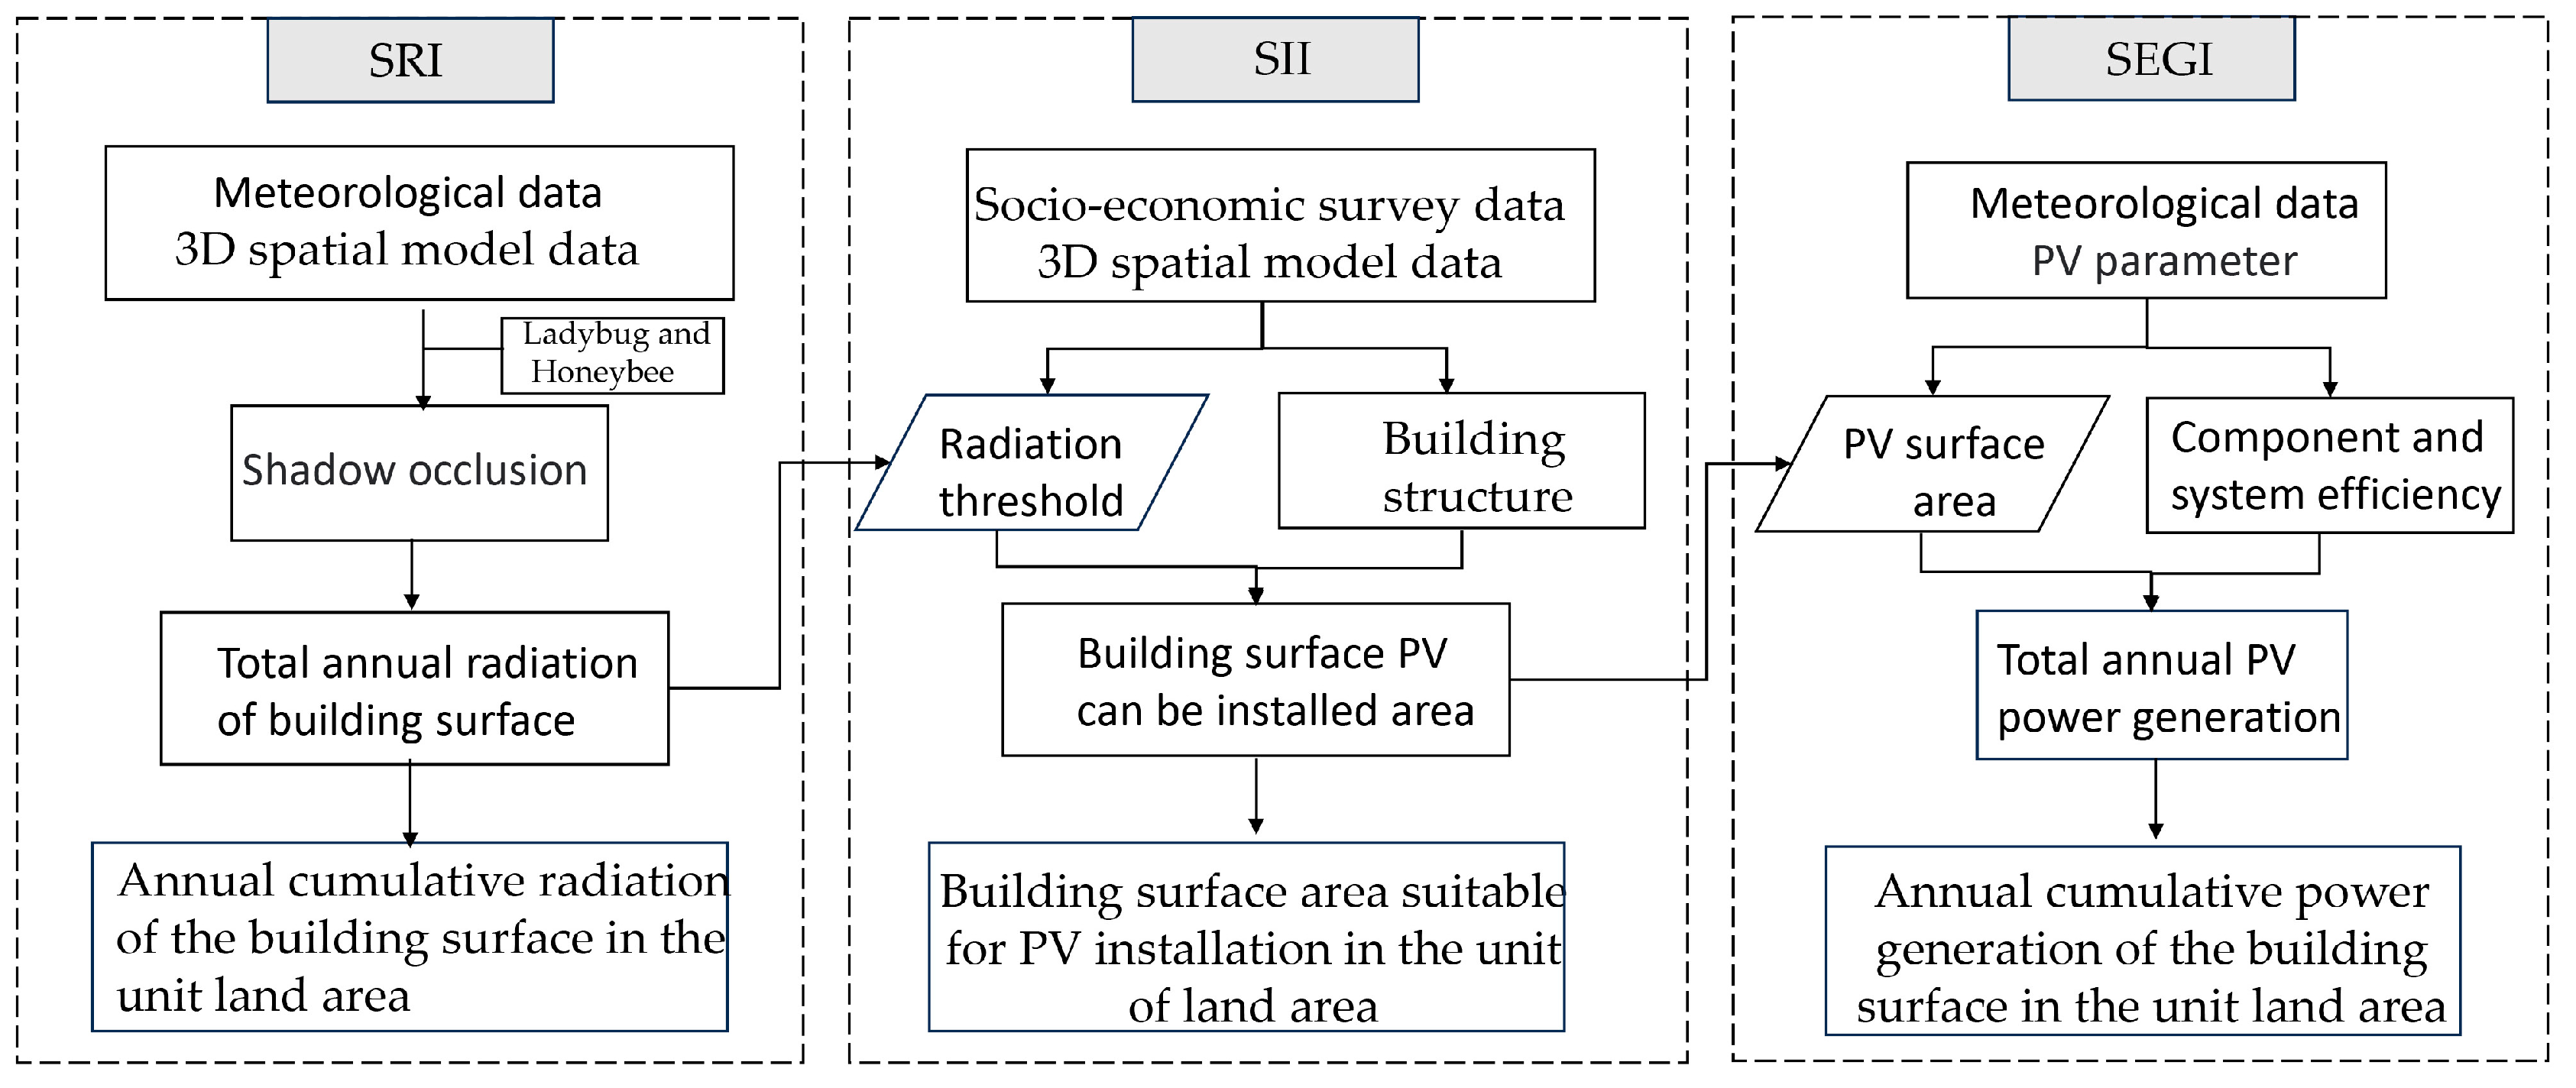
2.6. Quantitative Modeling of ASI of Solar Energy
2.6.1. Solar Radiation Intensity Calculation Method
2.6.2. Solar Installation Intensity Calculation Method
2.6.3. Solar Electricity Generation Intensity Calculation Method
2.7. Statistical Analysis
3. Result and Analysis
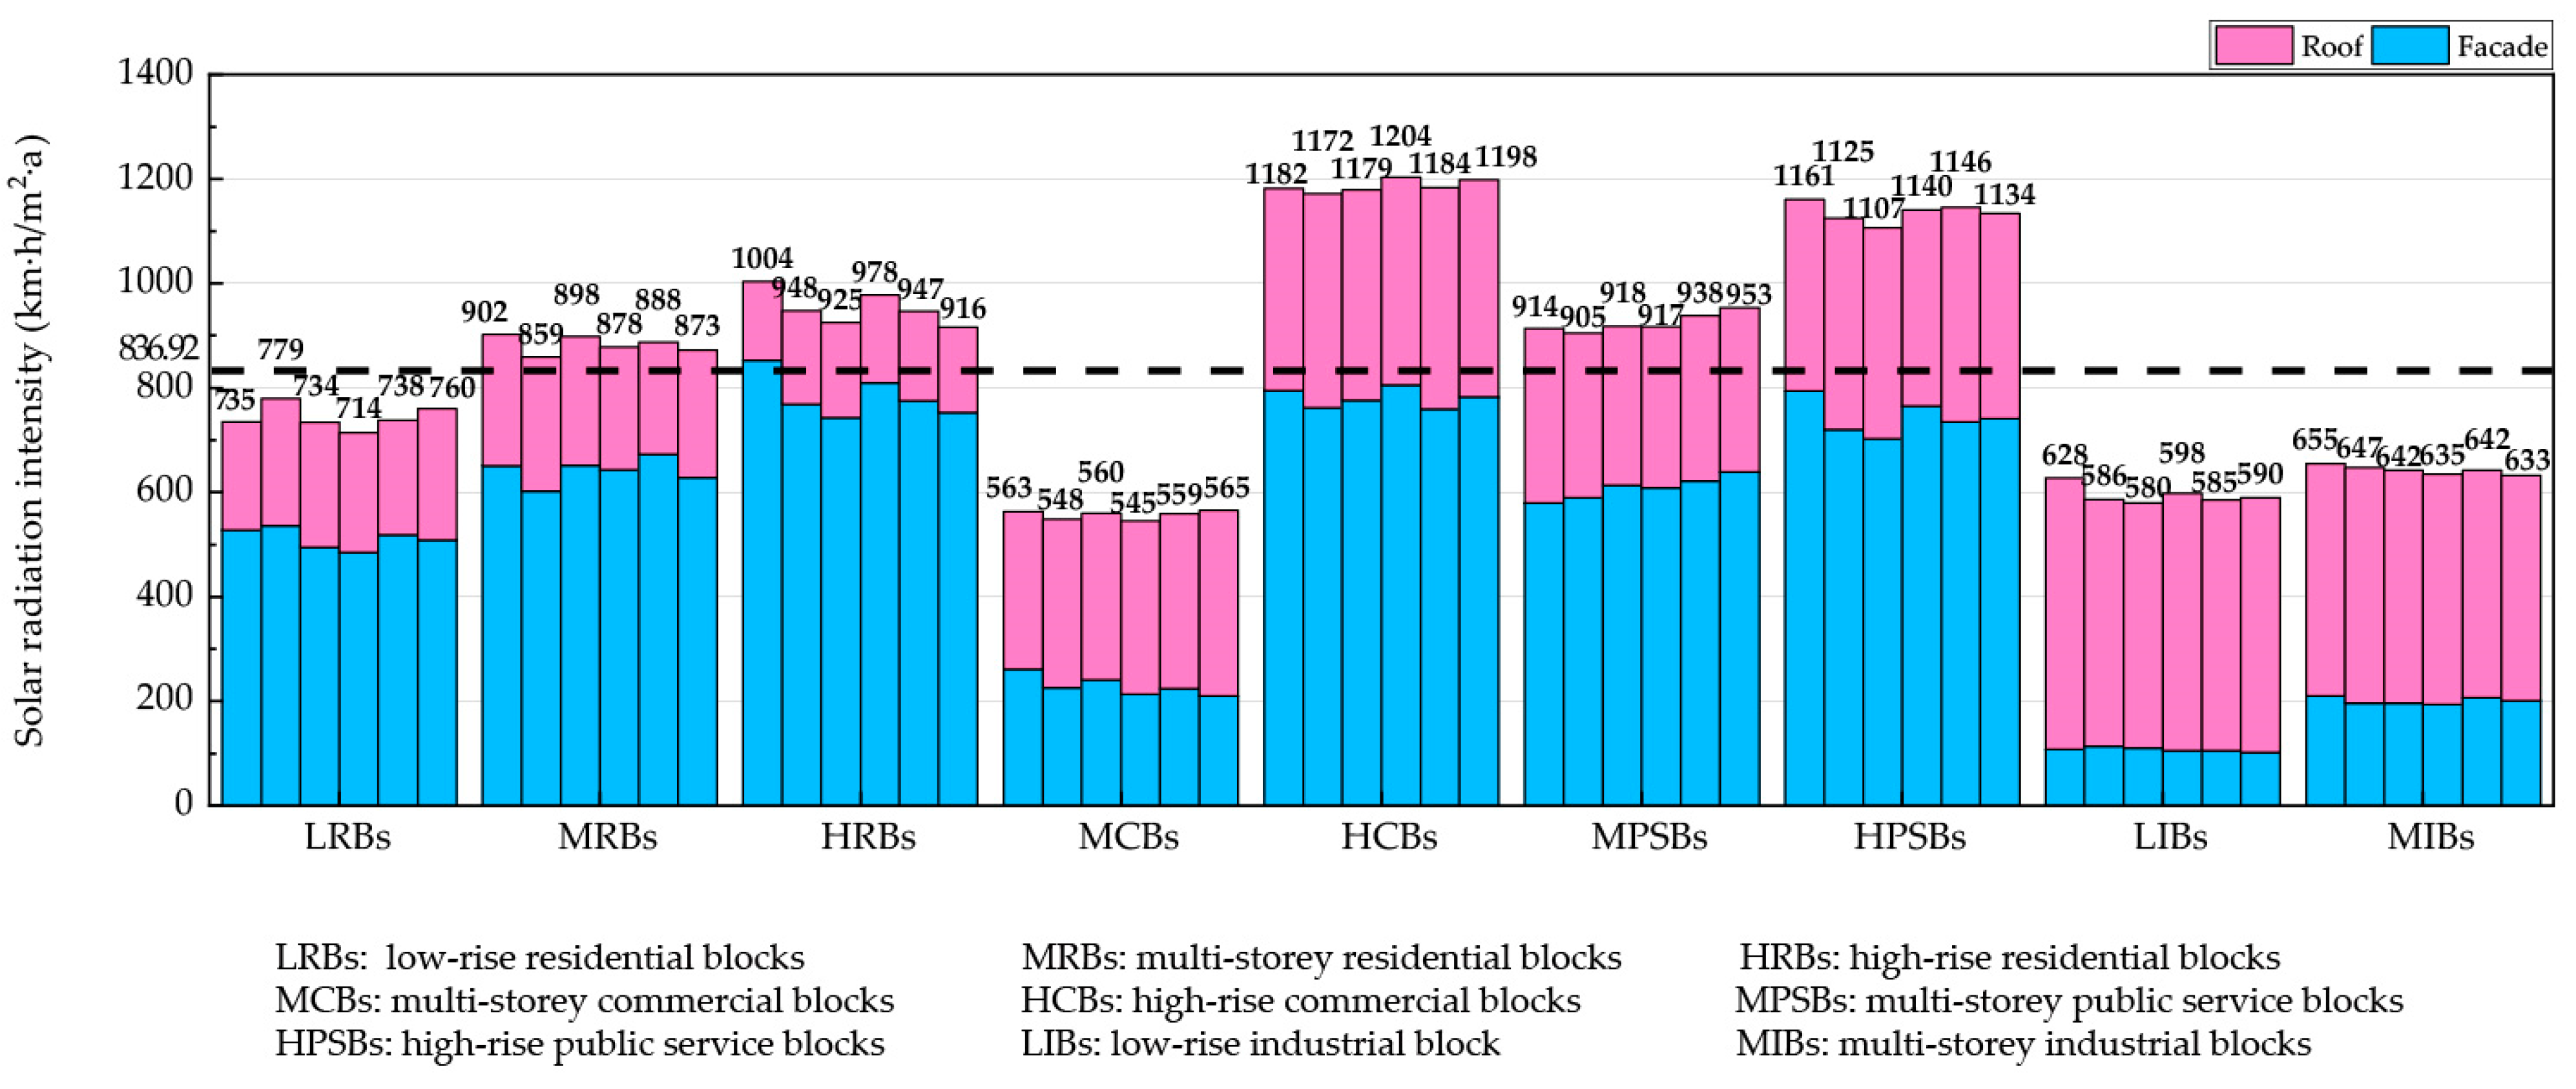
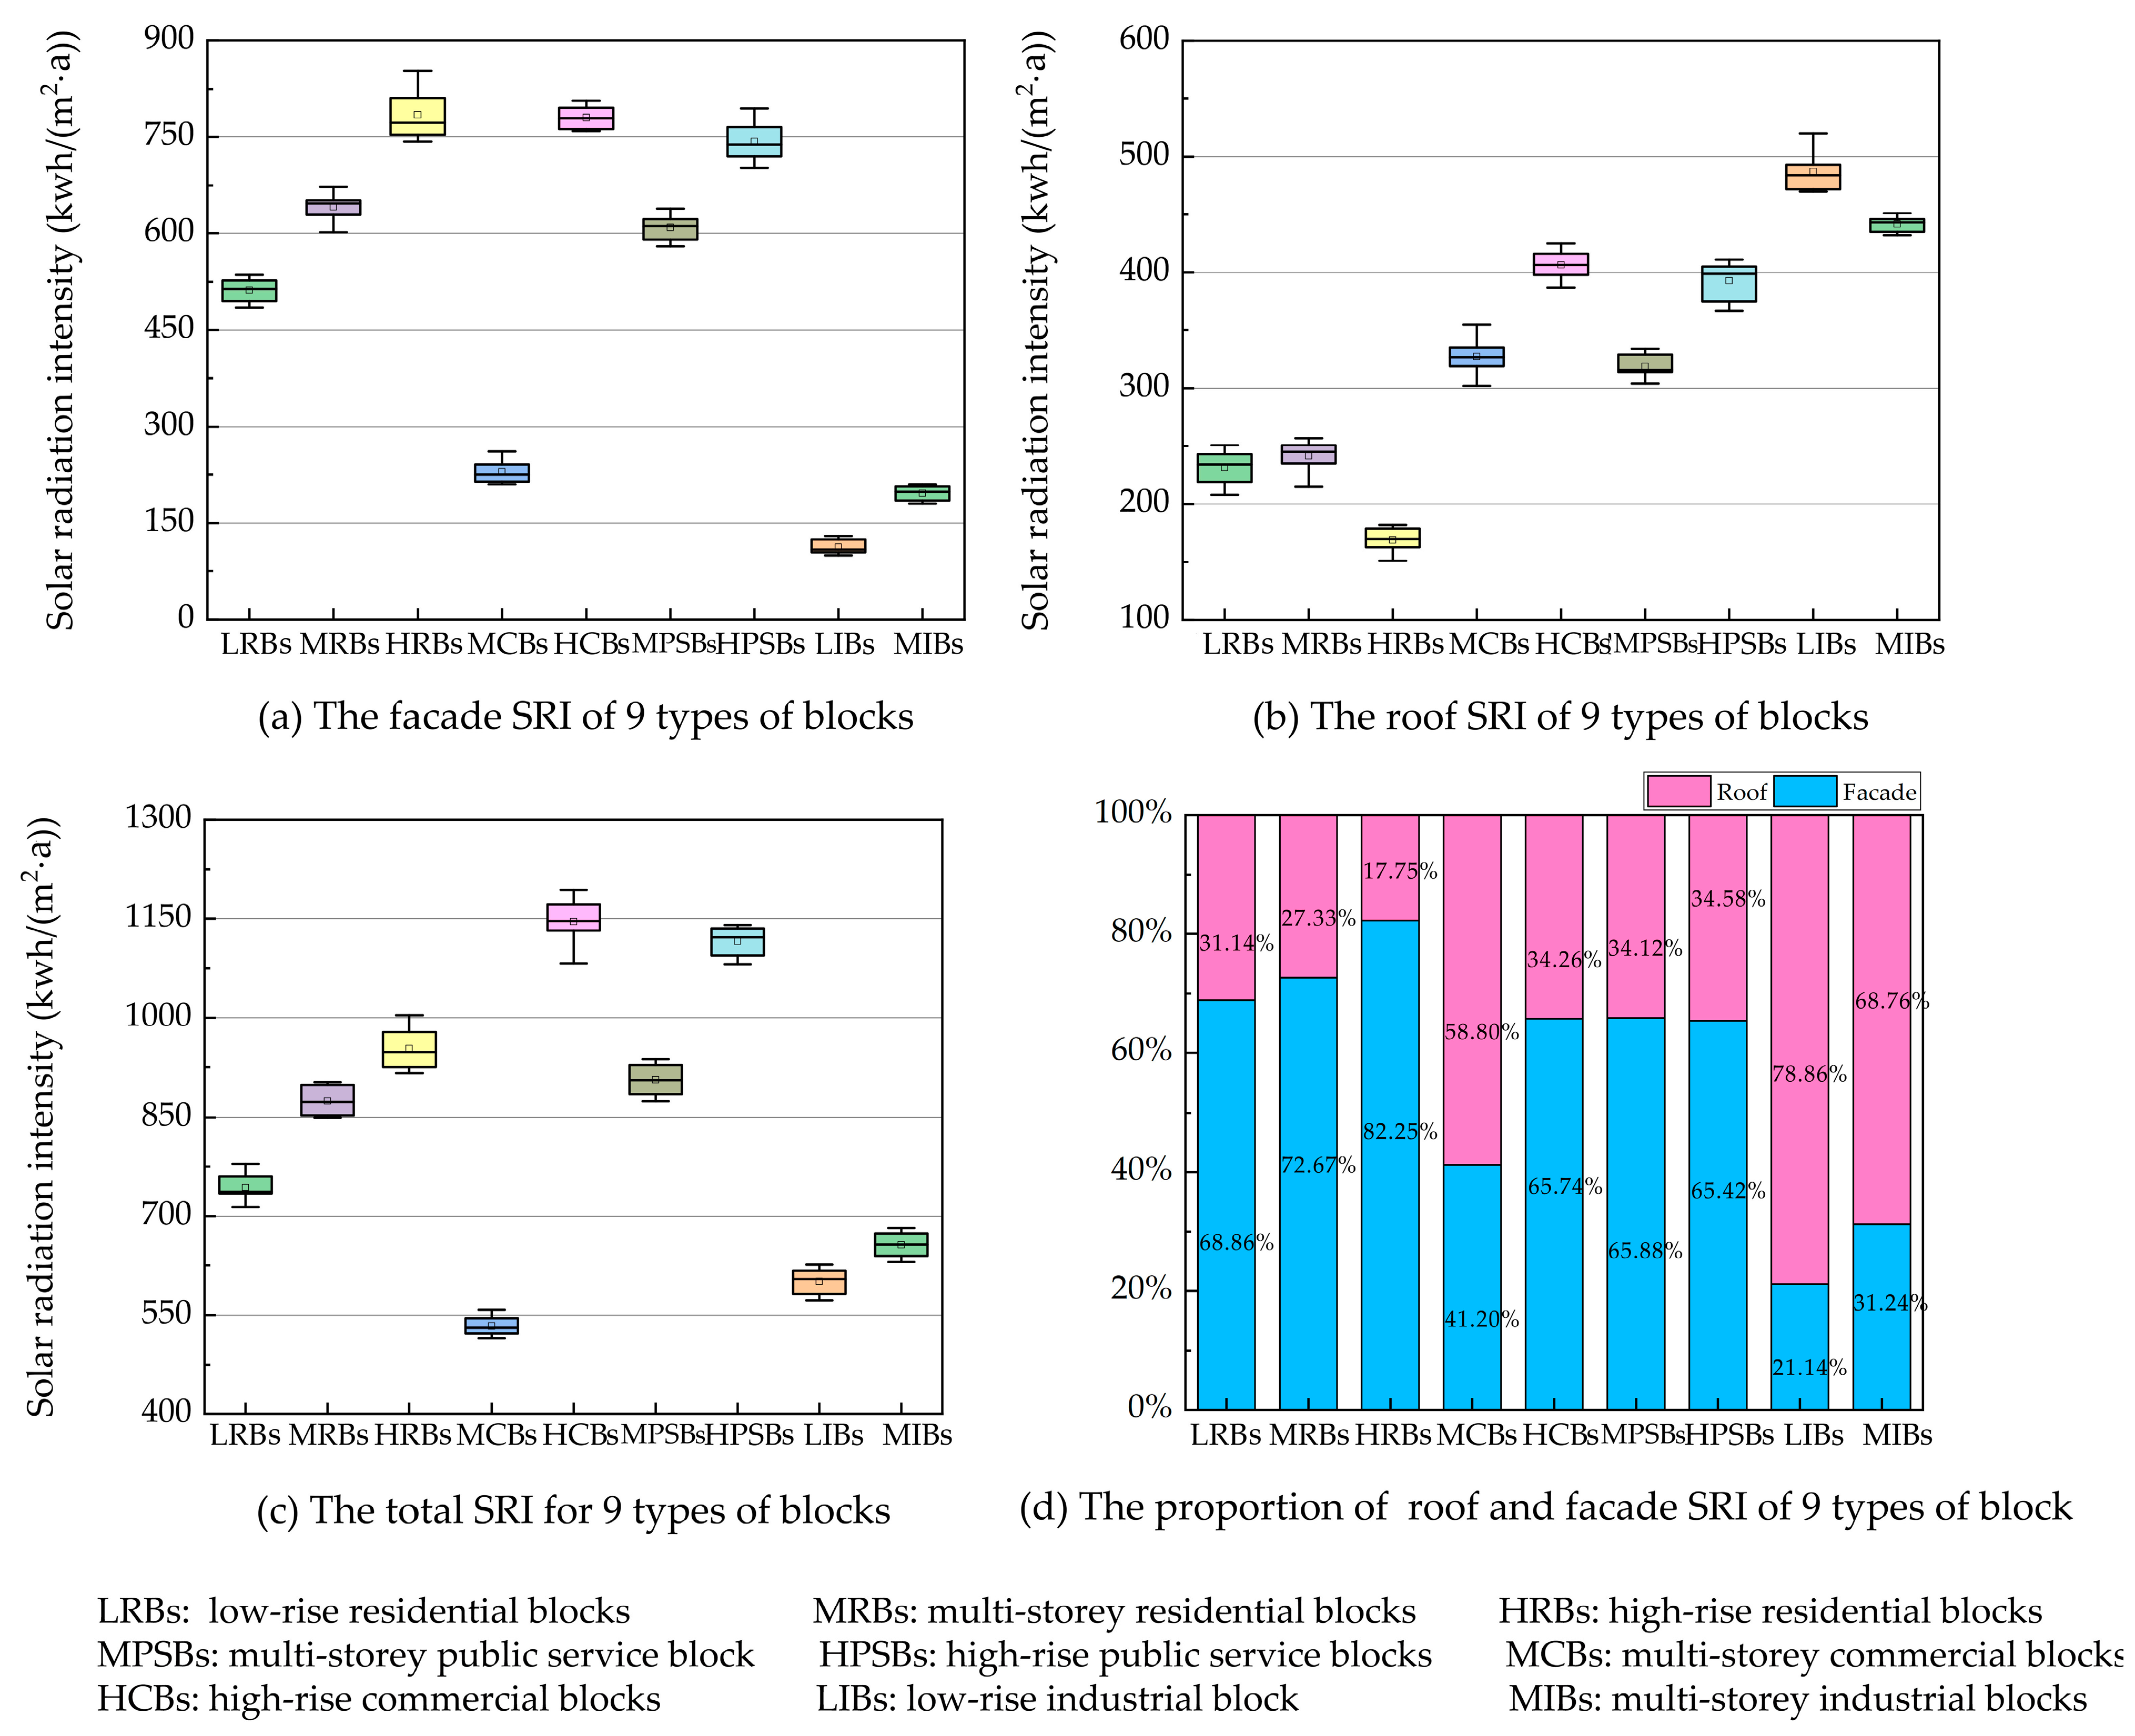
3.1. Solar Radiation Intensity
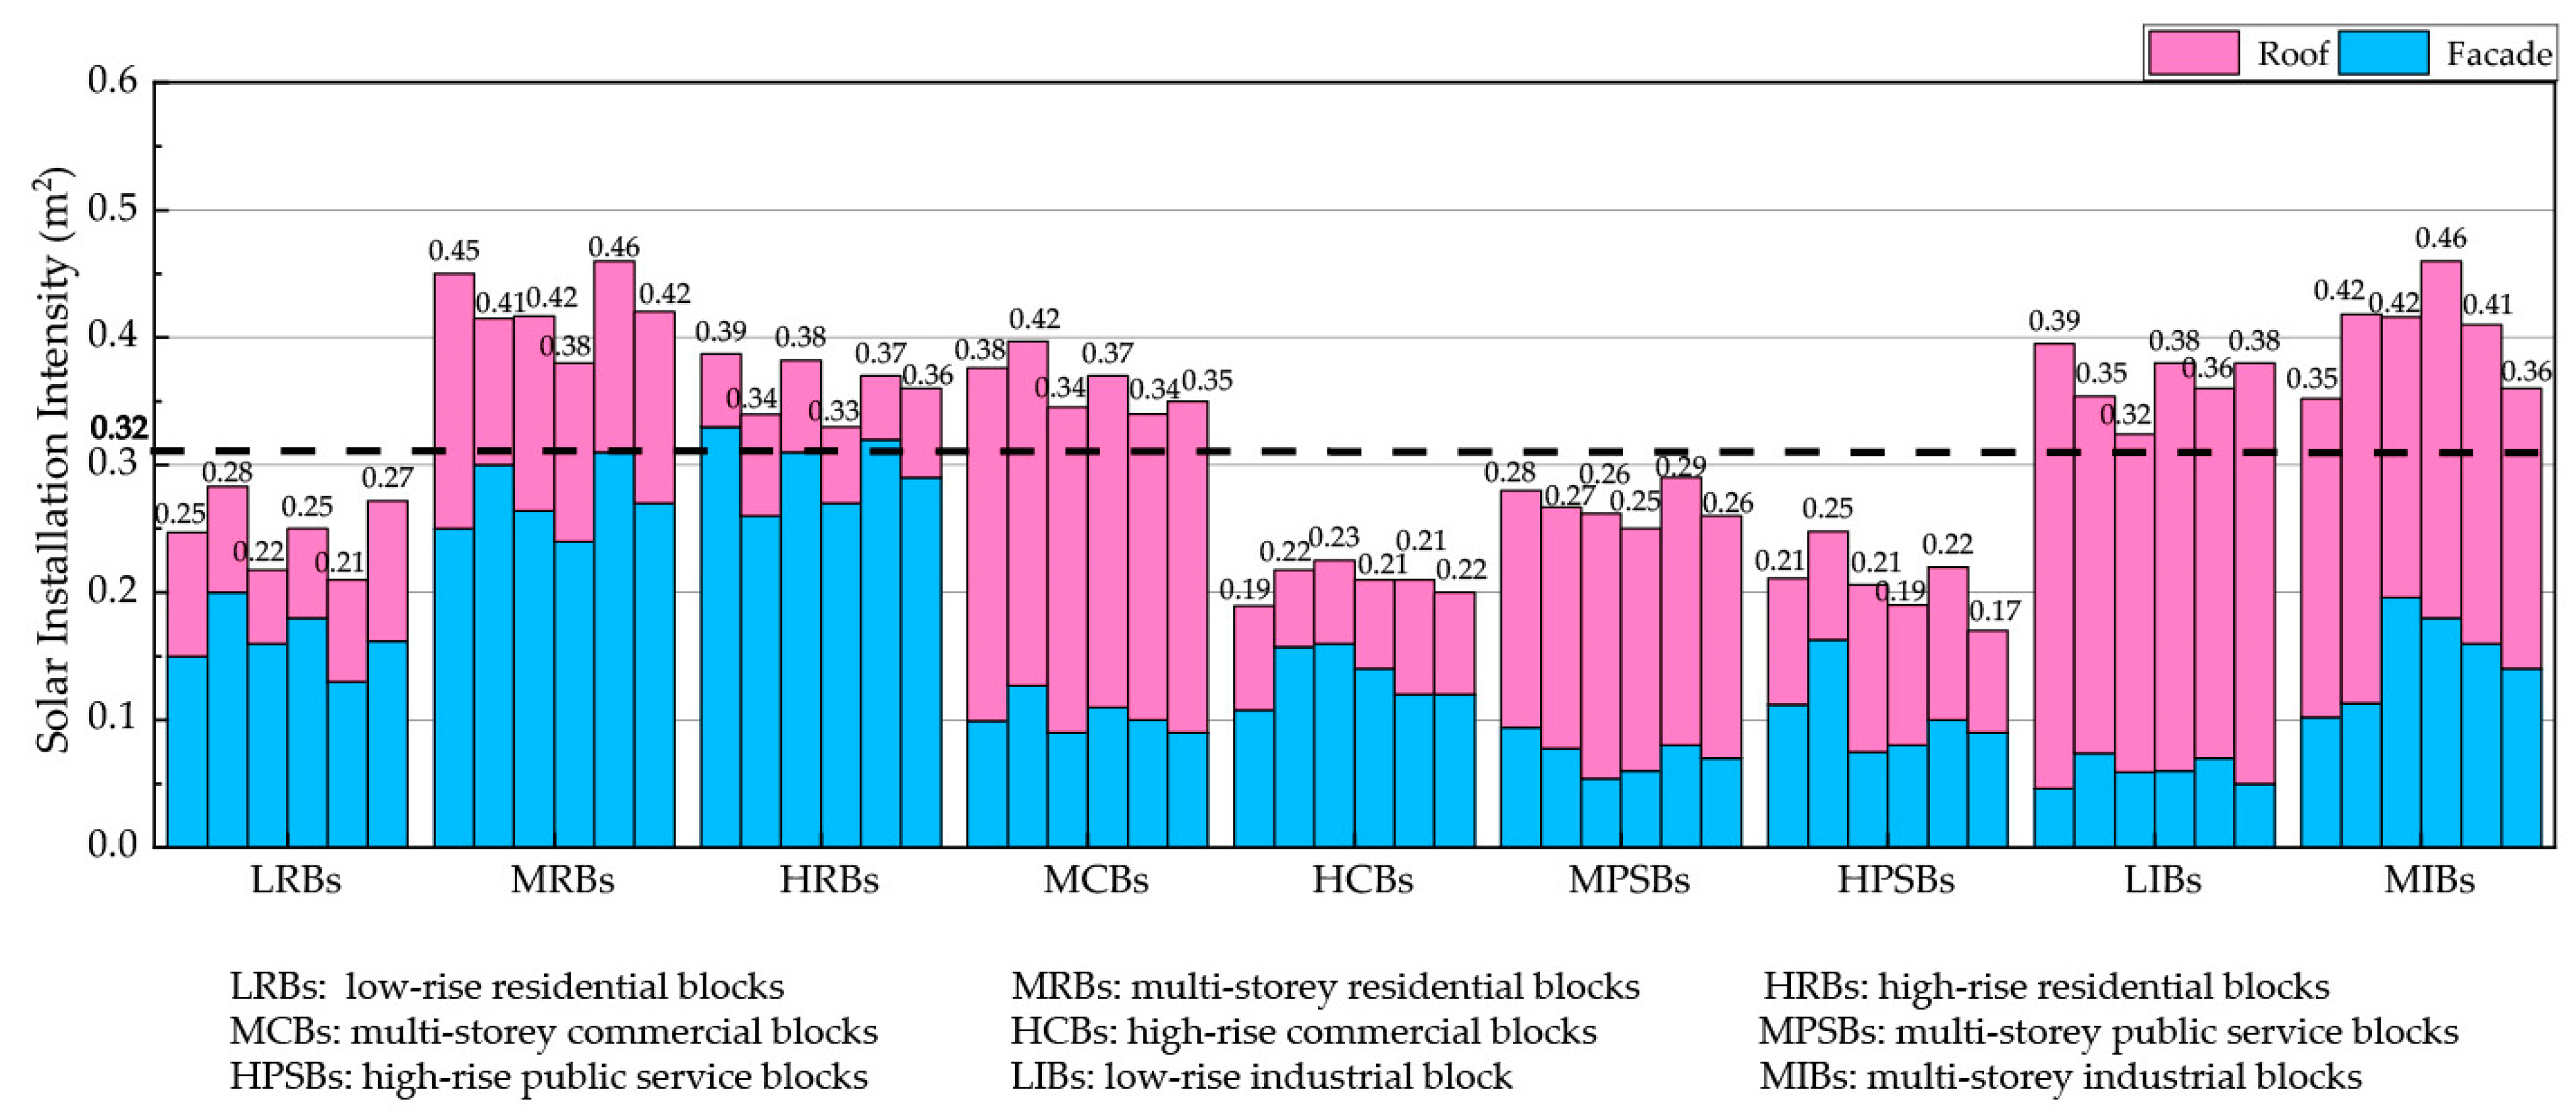
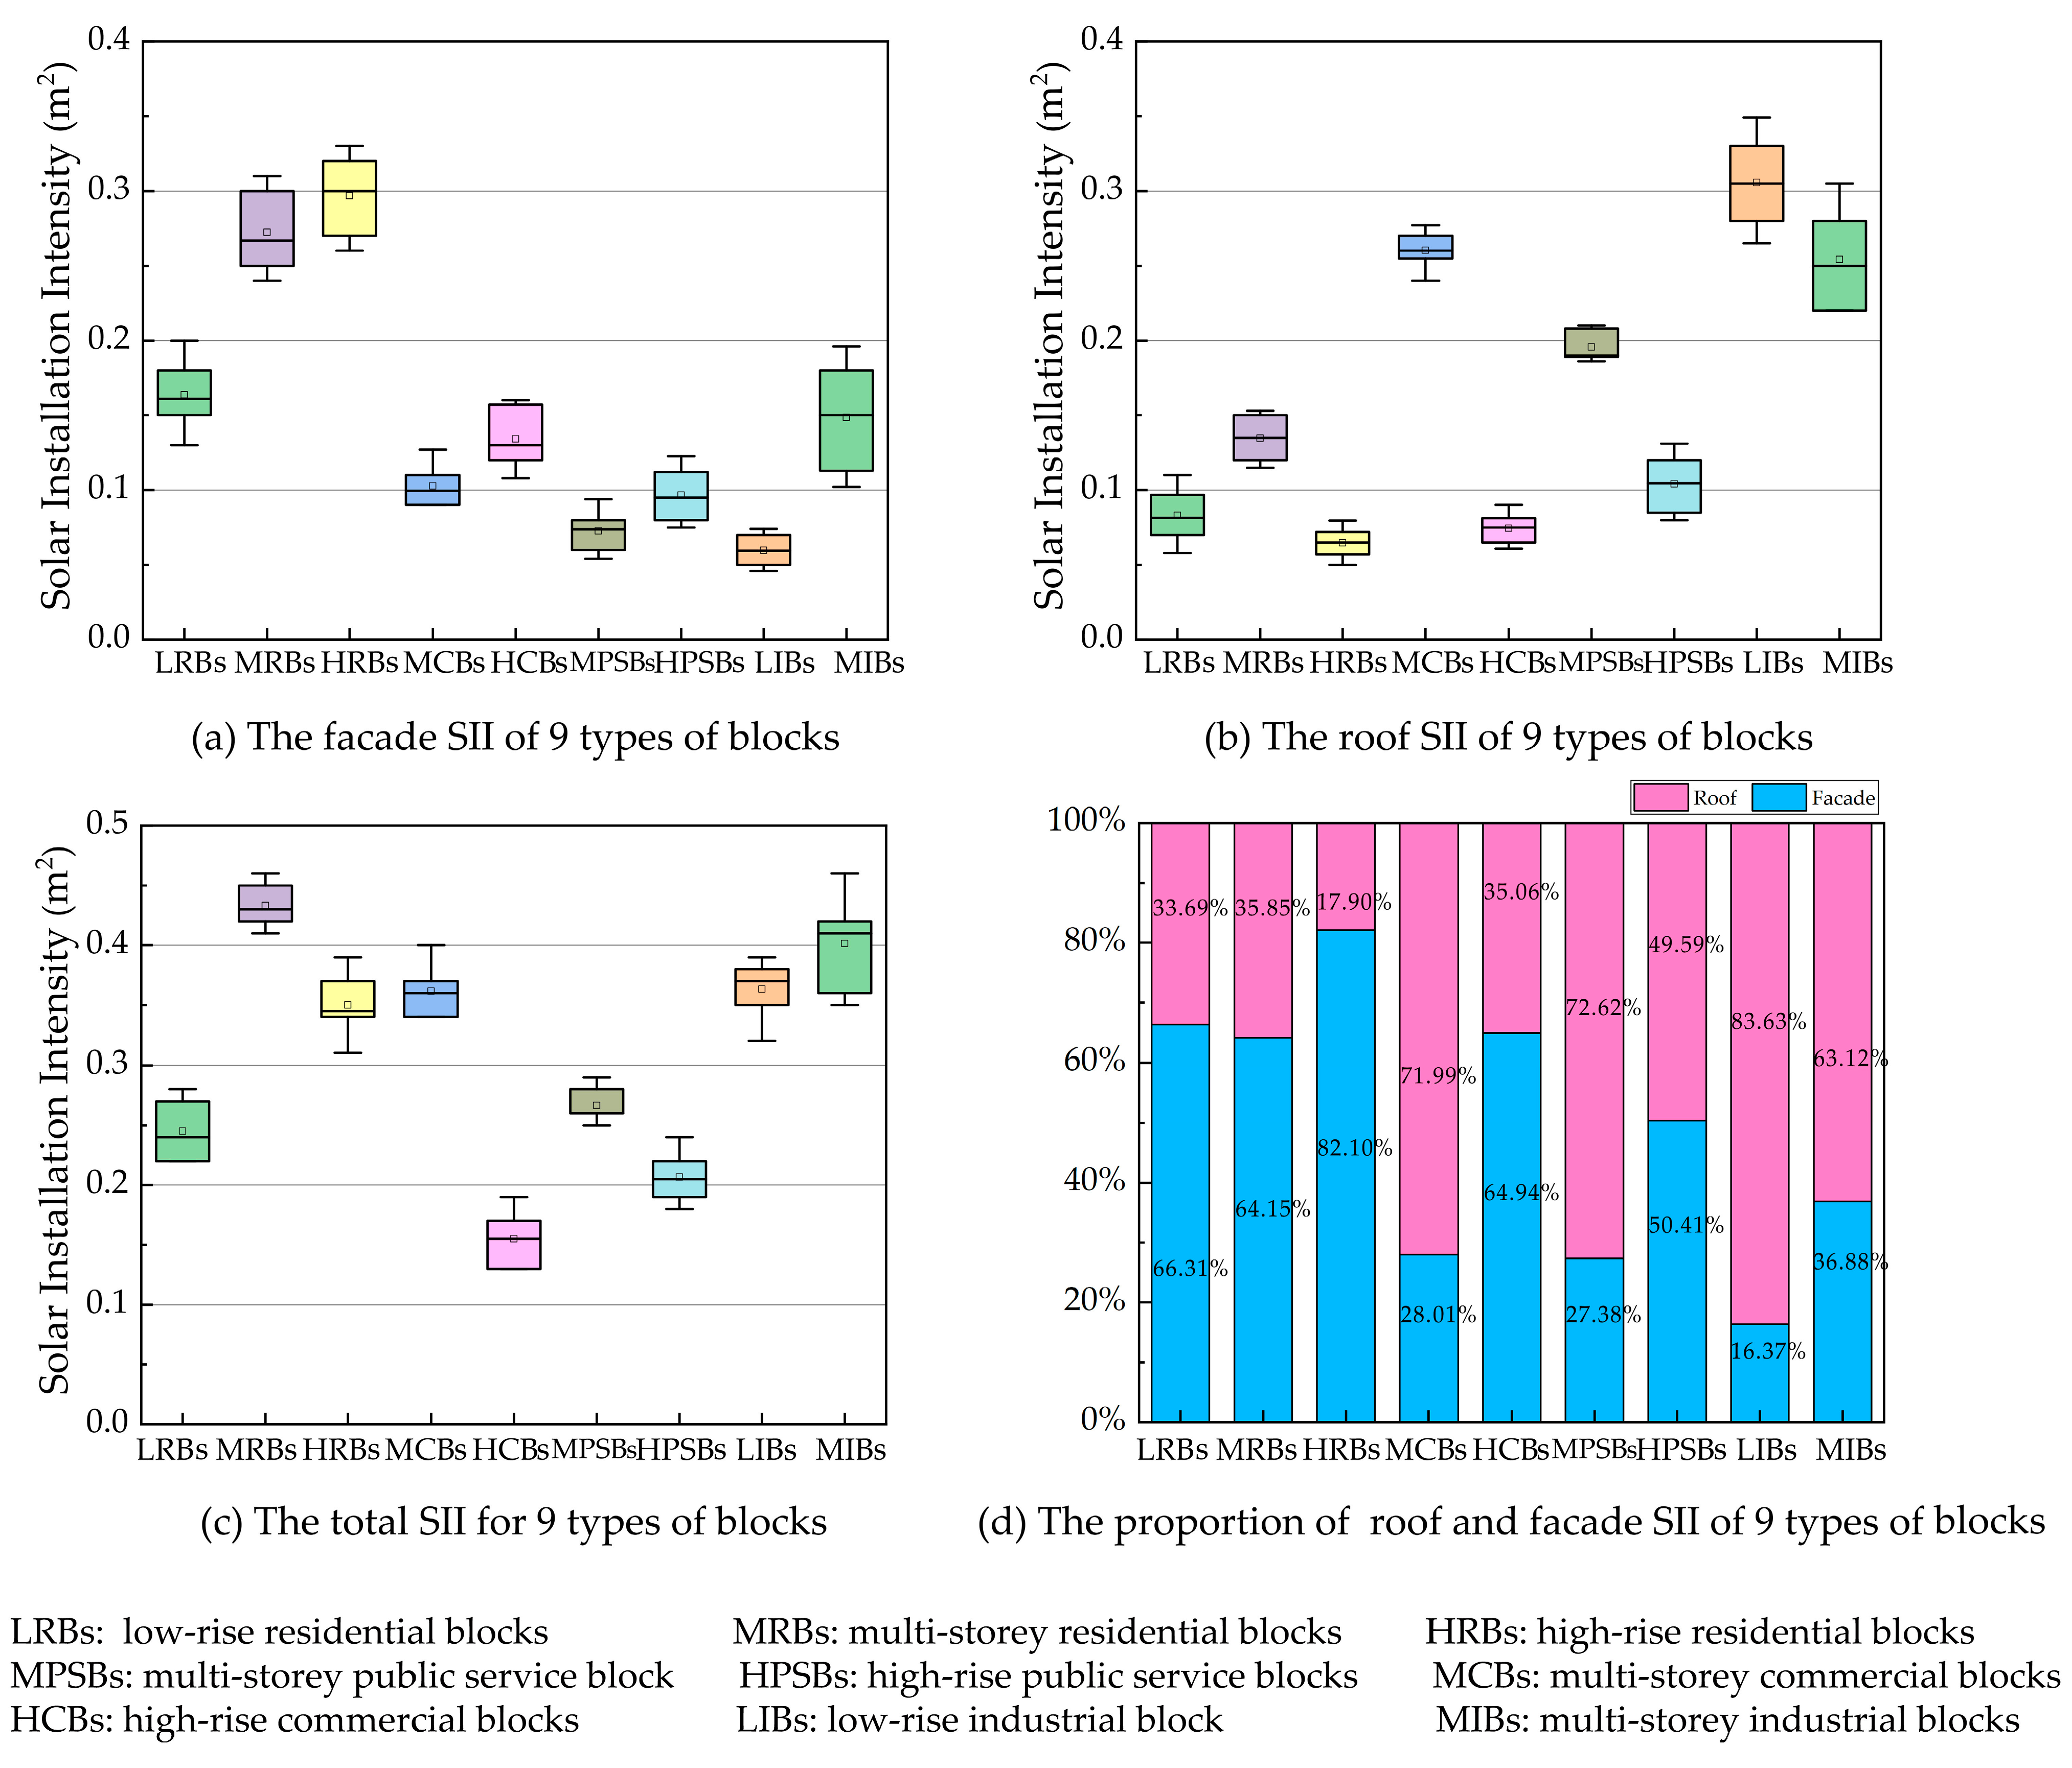
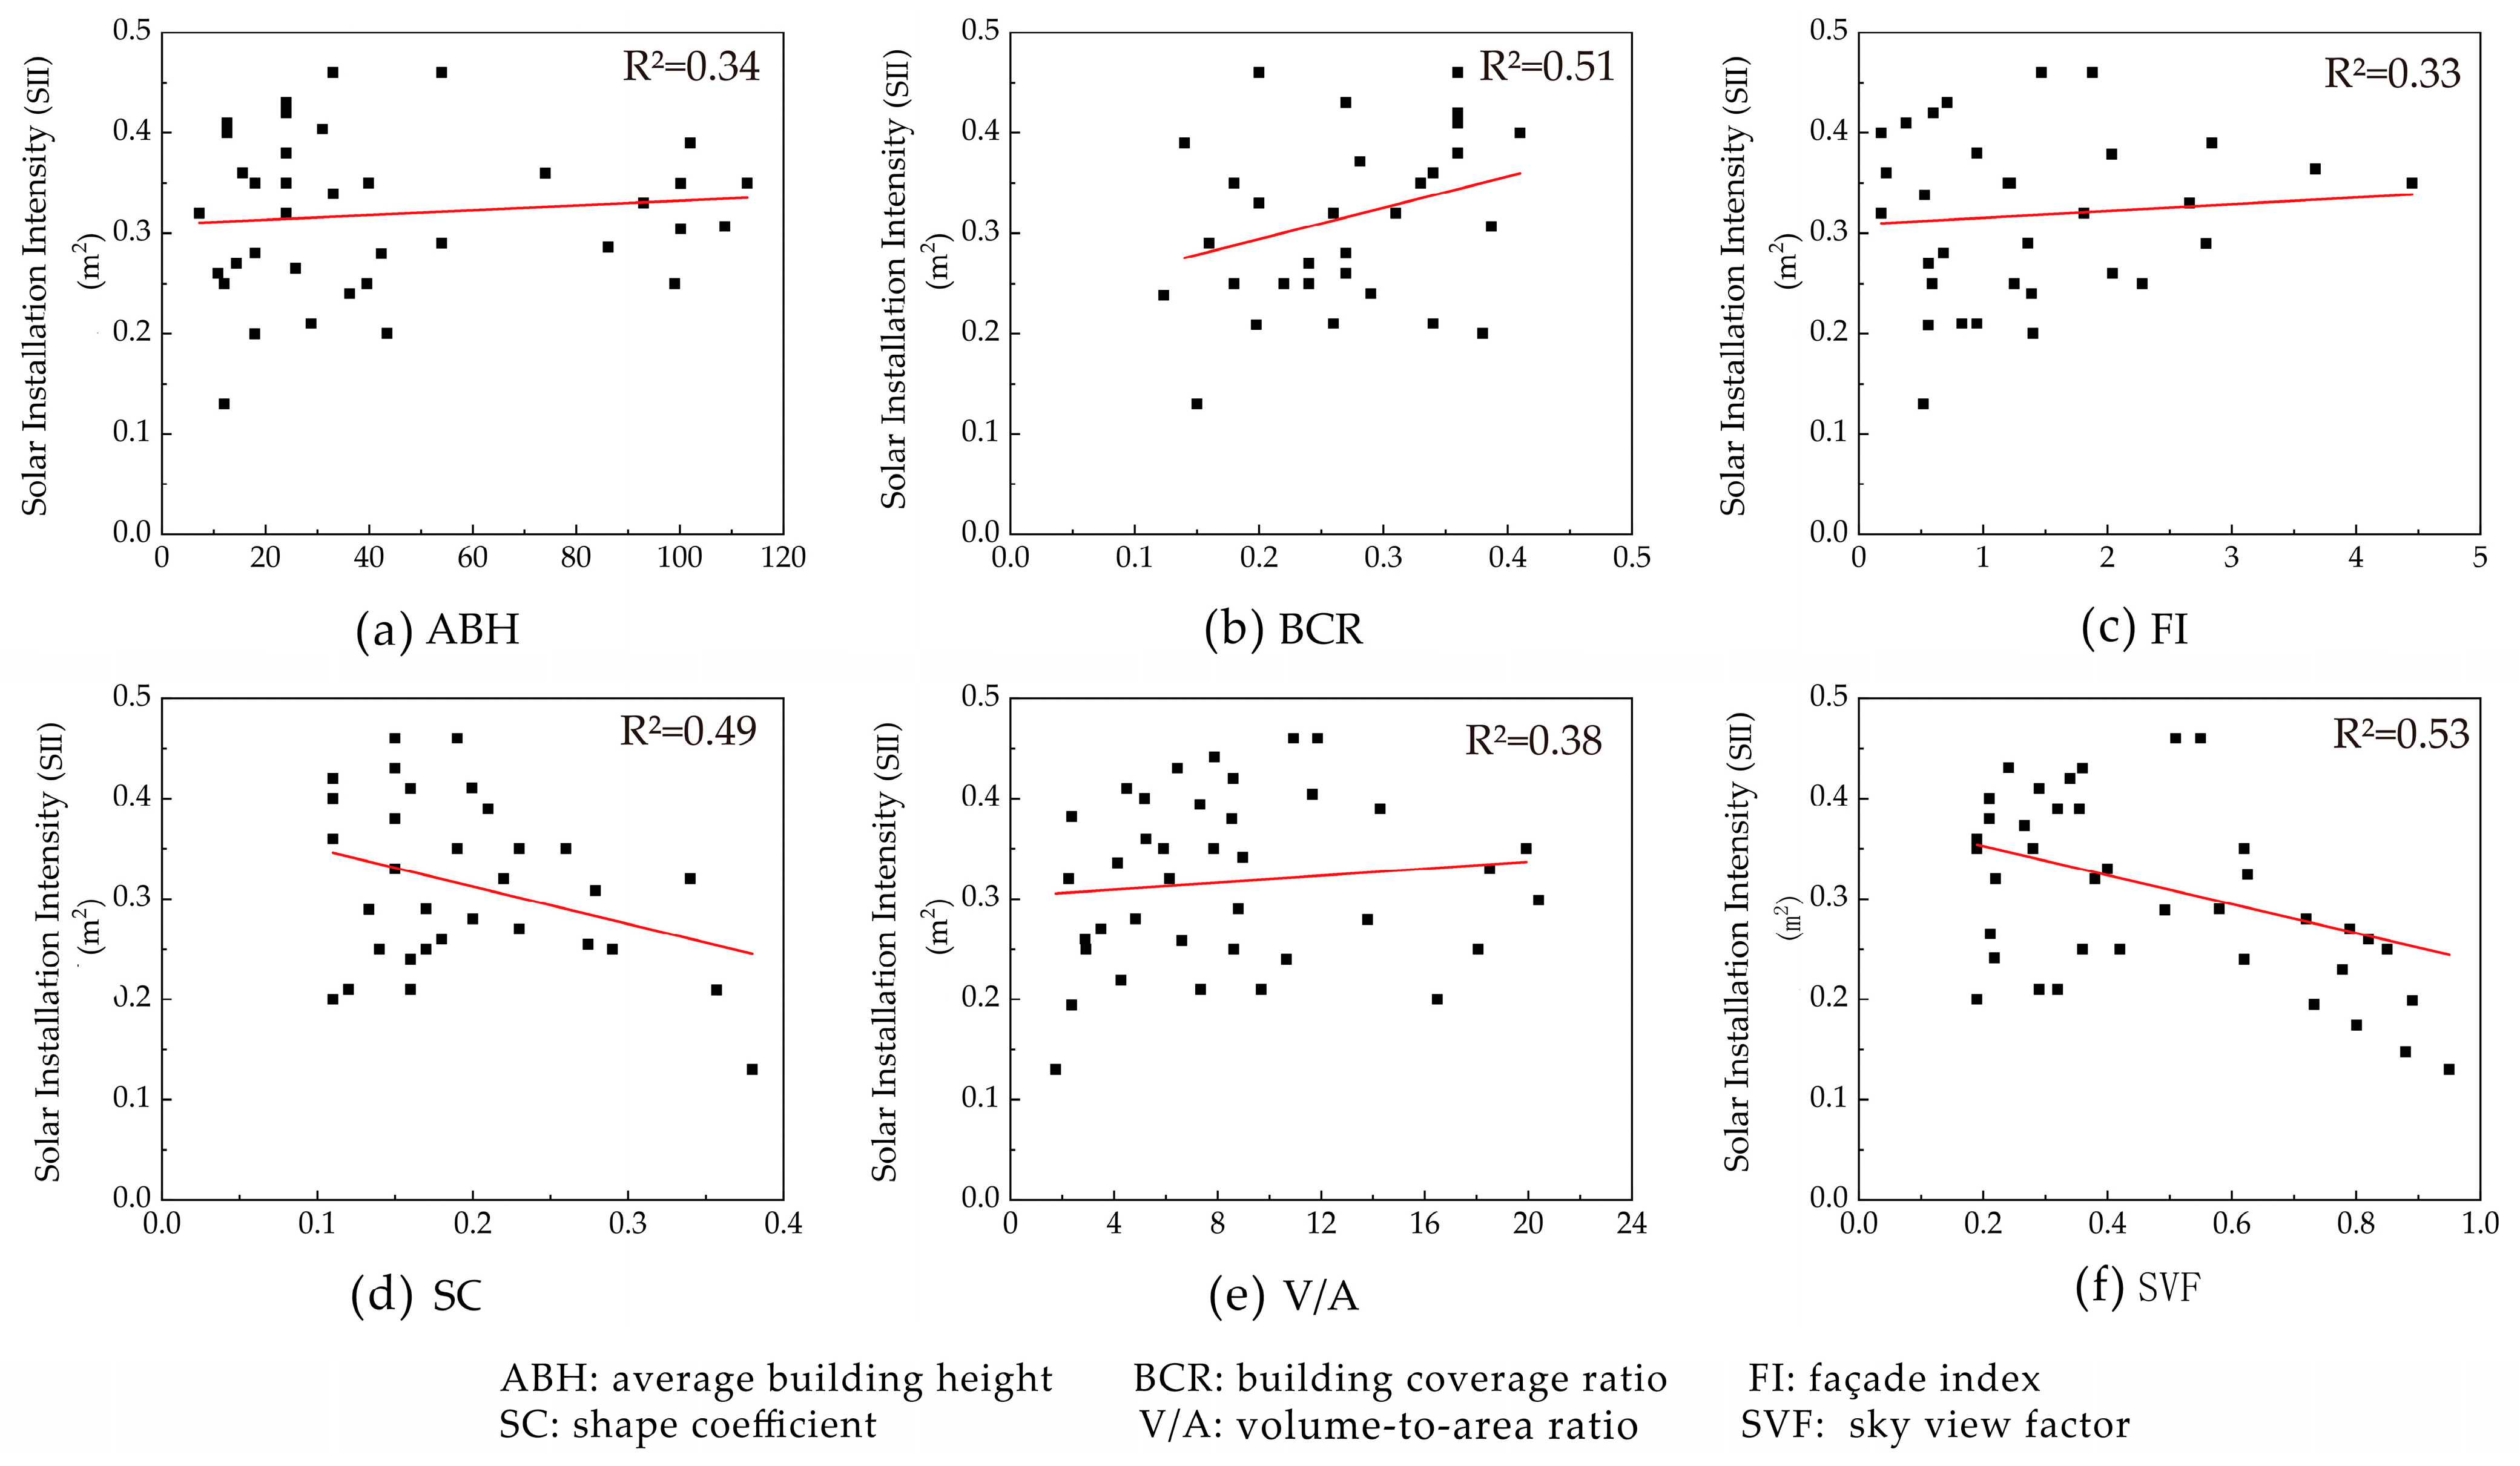
3.2. Solar Installation Intensity
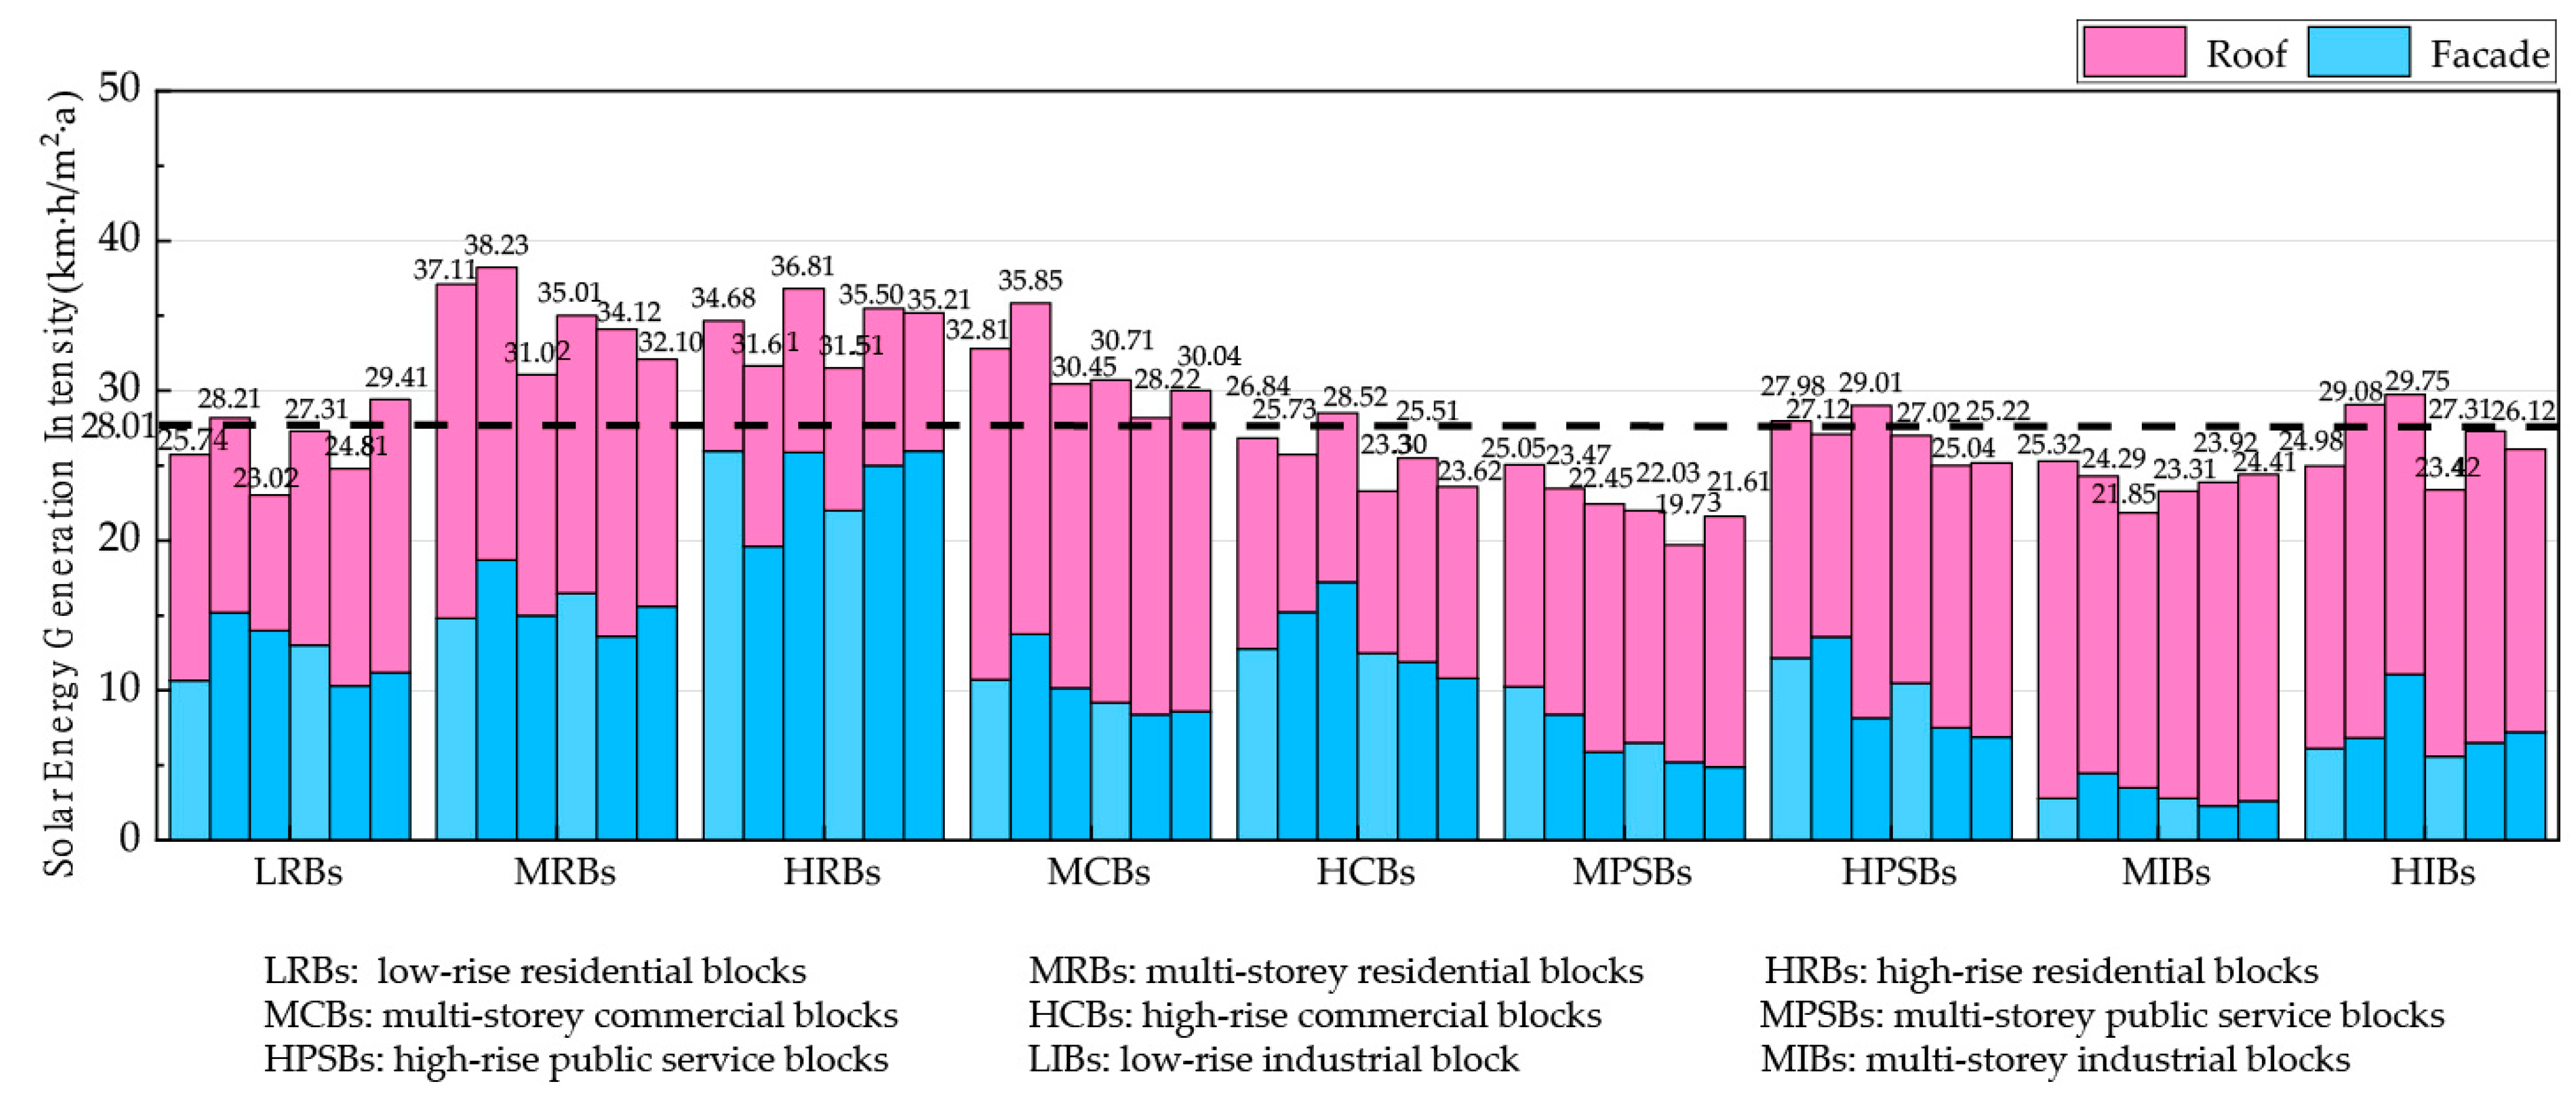
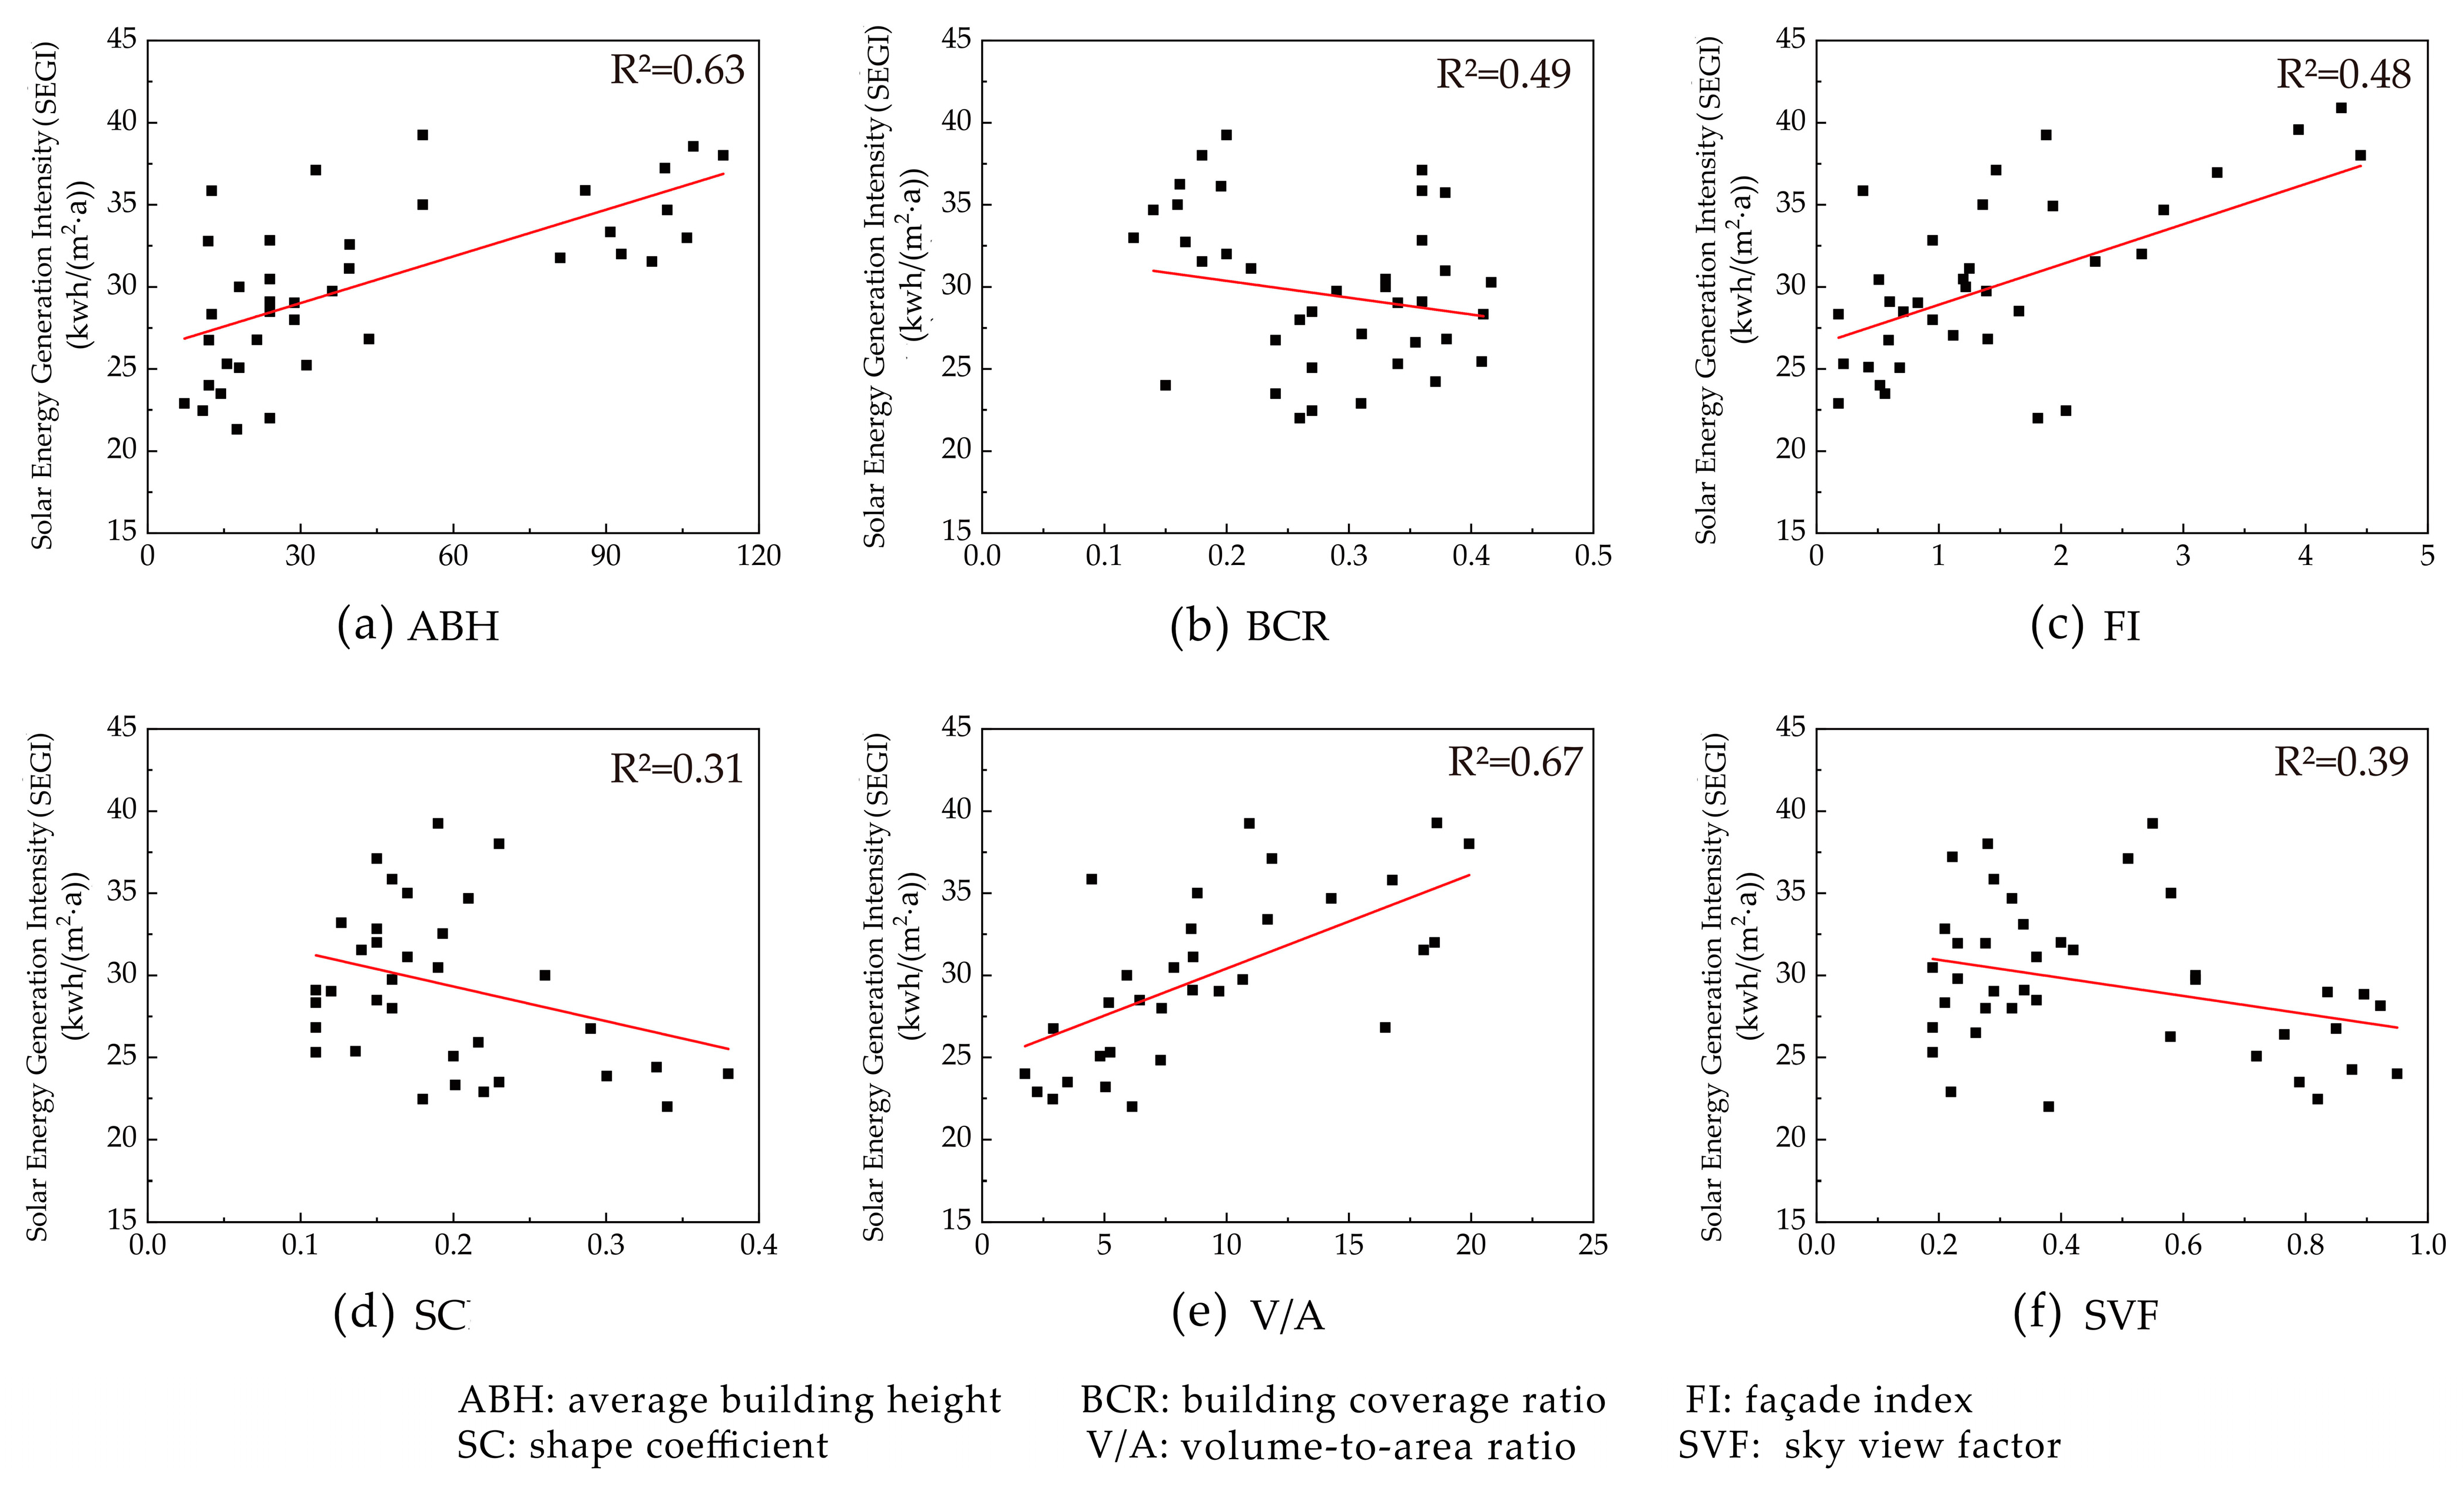
3.3. Solar Energy Generation Intensity
4. Discussion
4.1. The Effect of Urban Form Indicators on the ASI of Solar Energy
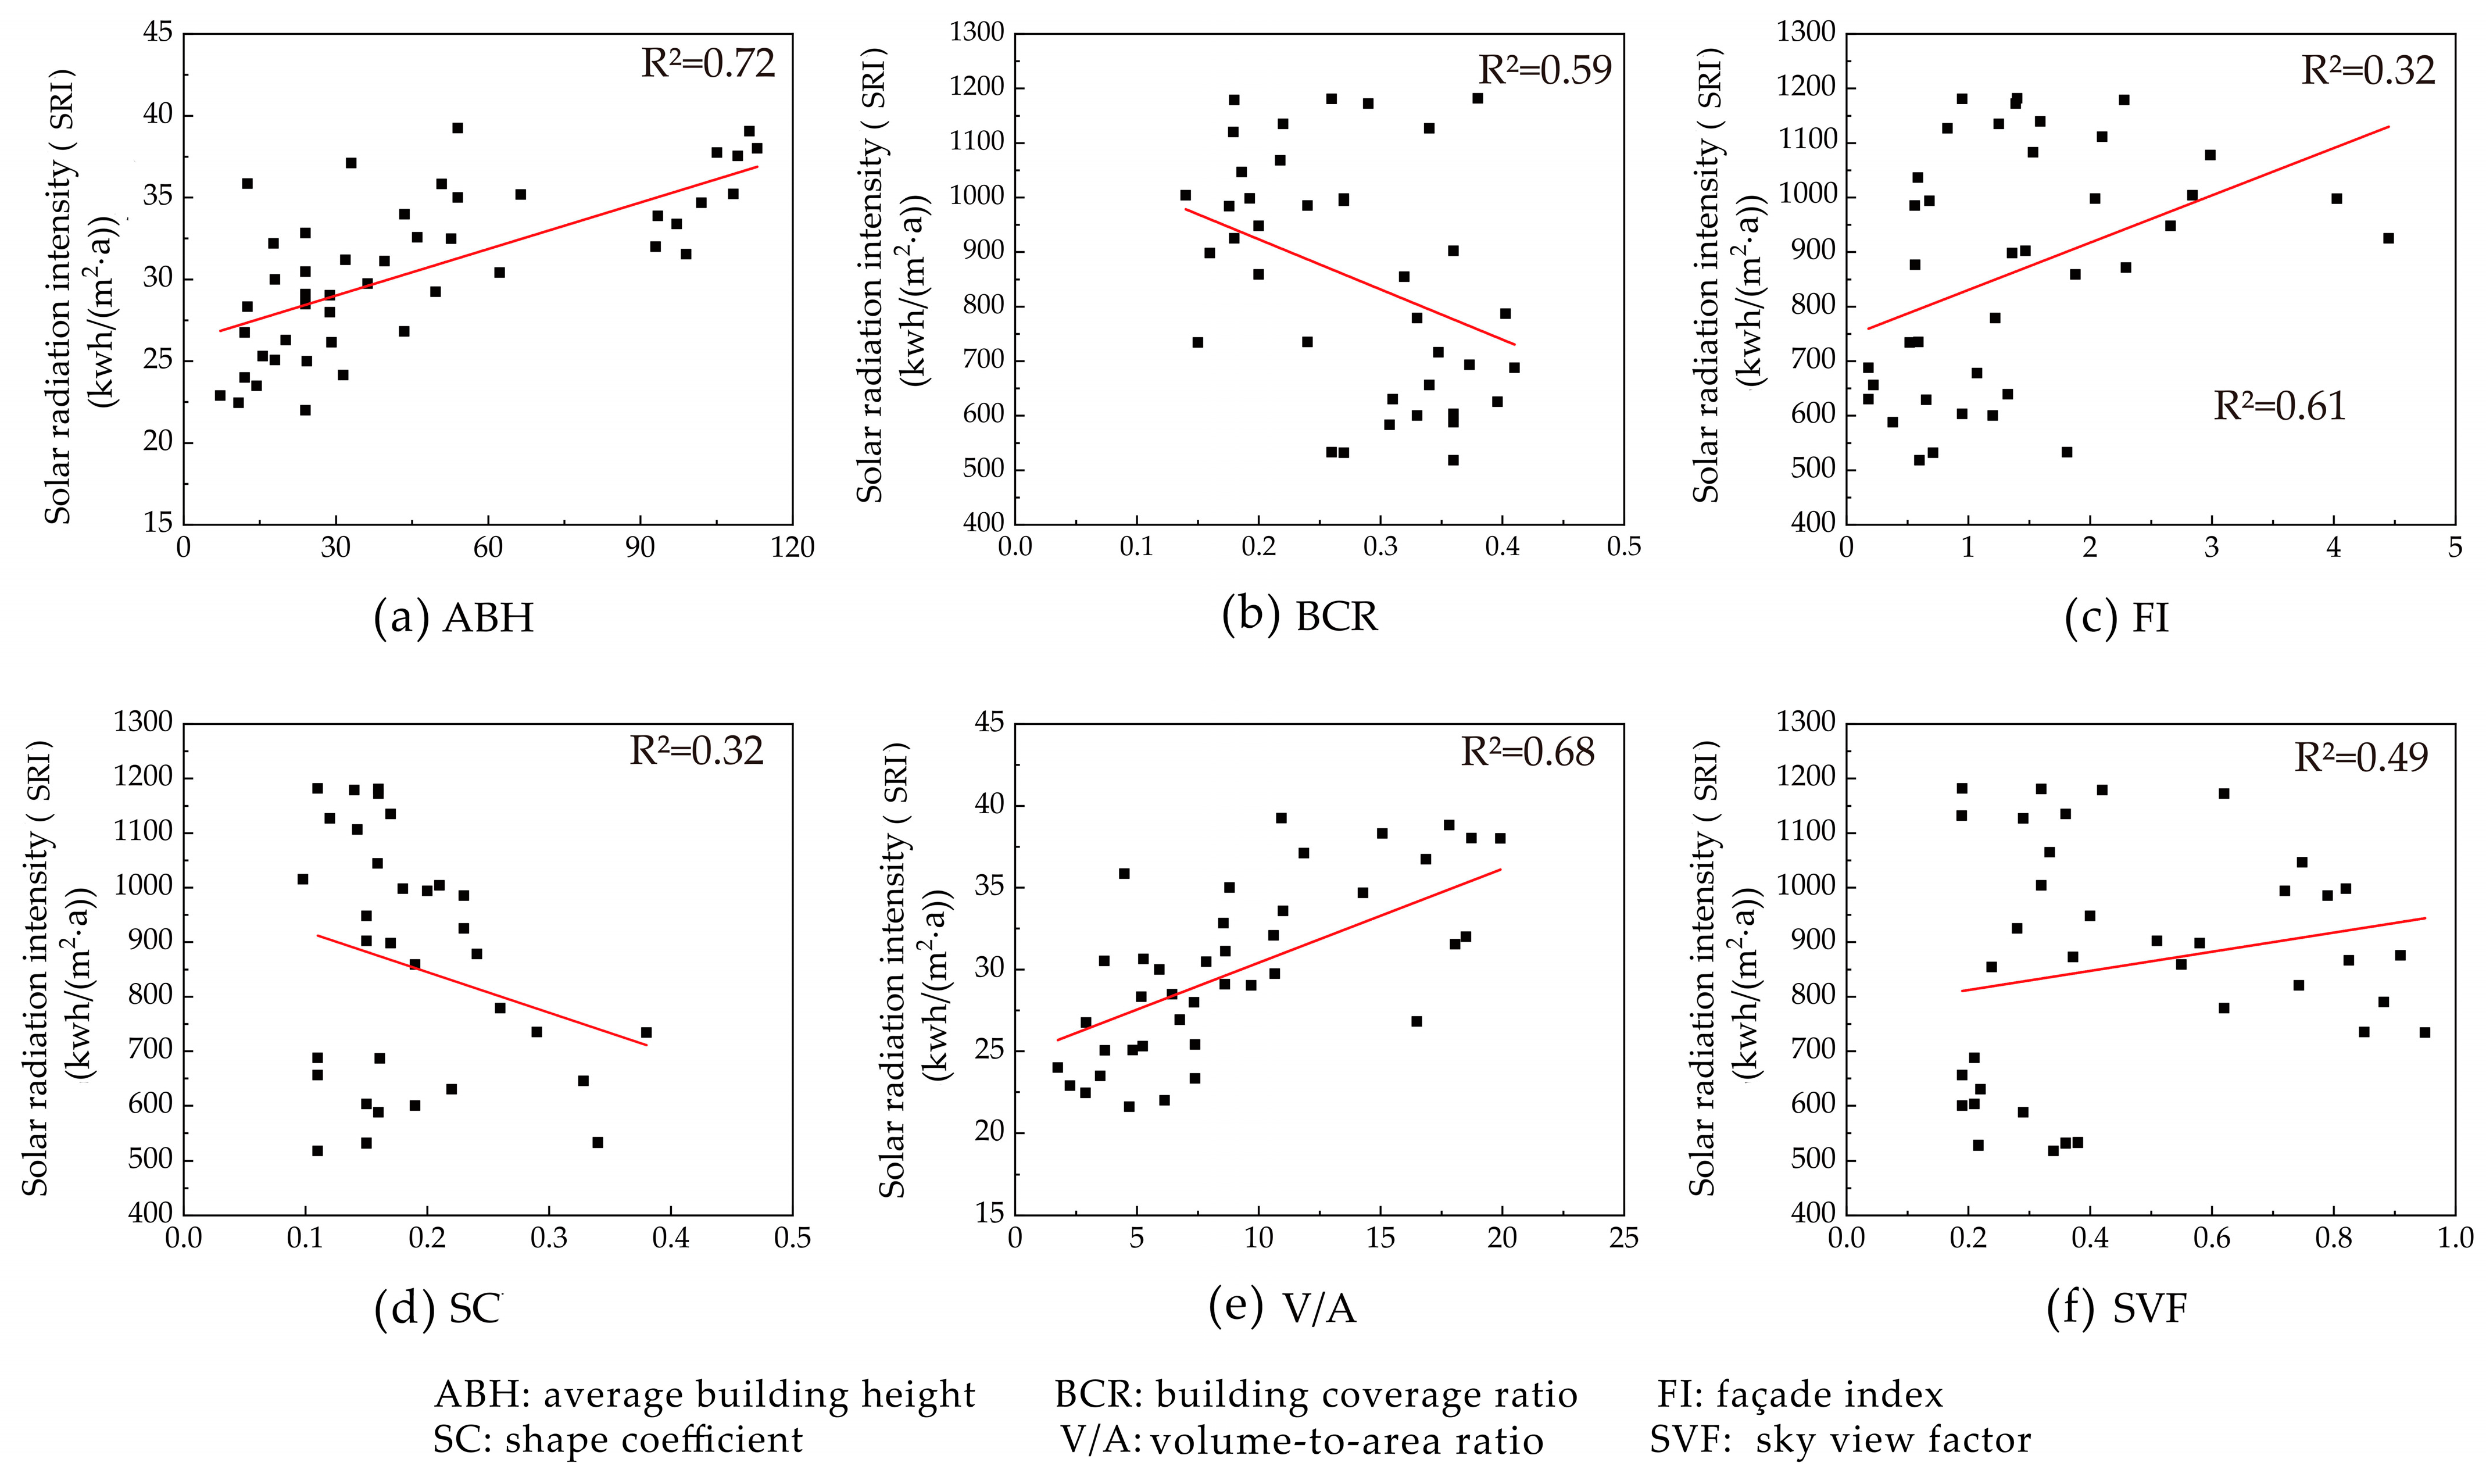
4.1.1. Correlation of Form Indicators with the ASI of Solar Energy
4.1.2. Multiple Linear Regression Model Predicts ASI of Solar Energy
4.2. Planning Strategies for Solar Available Space in Urban Blocks
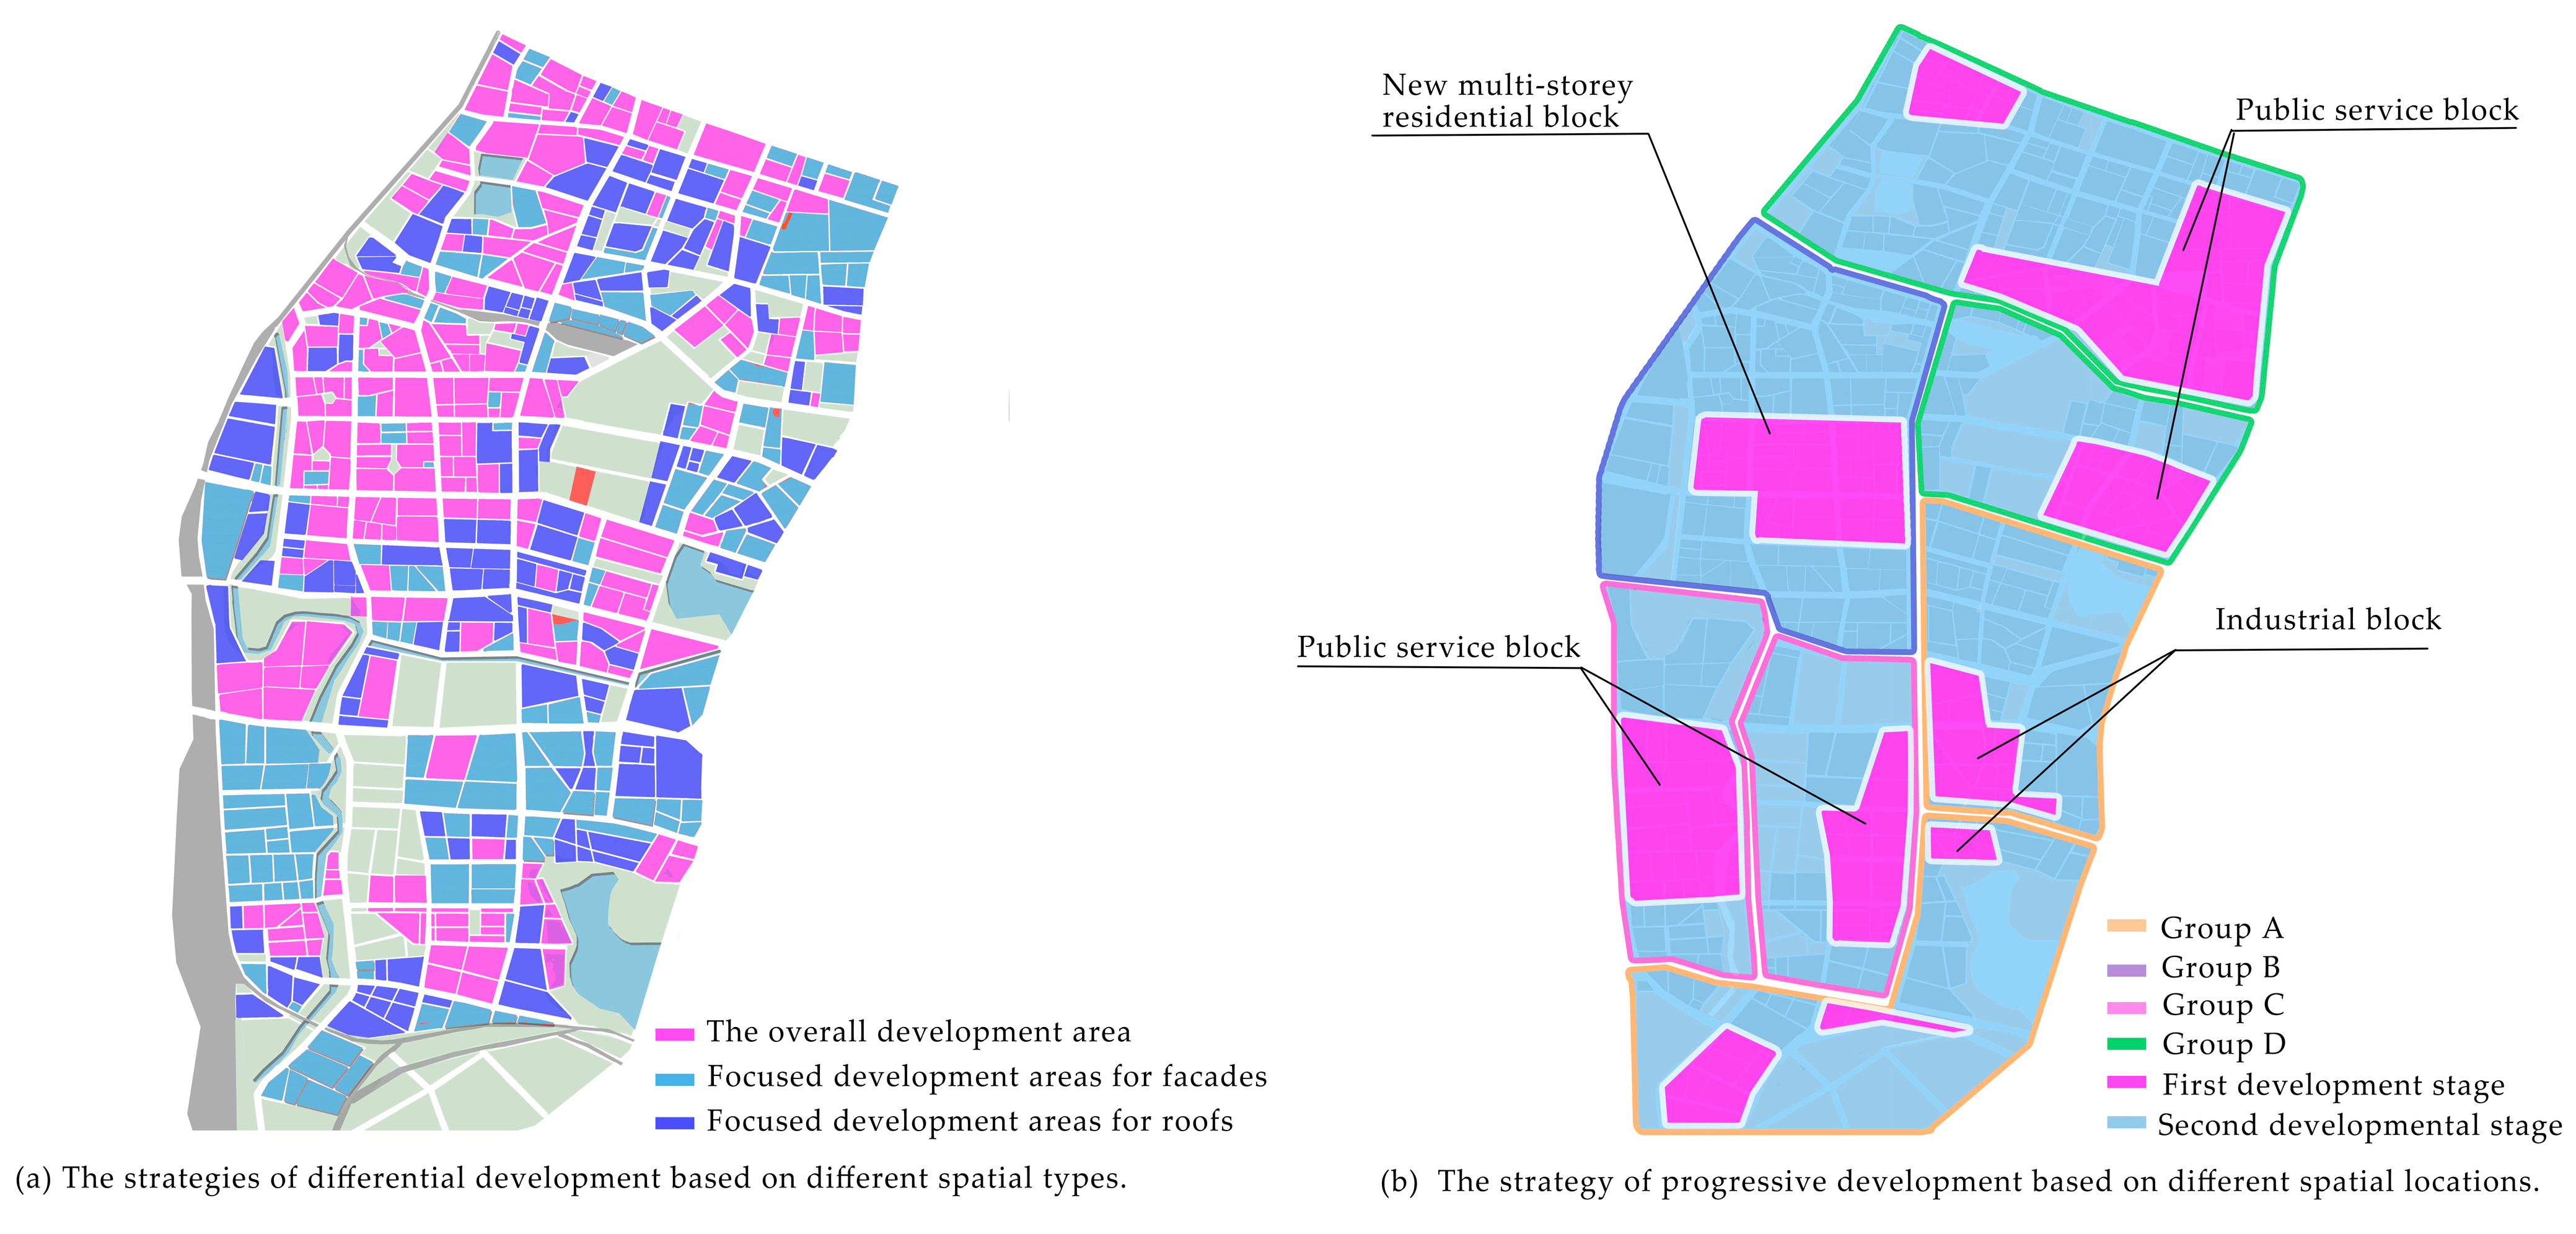
4.2.1. The Strategies of Differential Development Based on Different Spatial Types
4.2.2. The Strategy of Gradual Development Based on Different Spatial Locations
4.3. Limitations
5. Conclusions
- Urban form leads to significant differences in SRI, SII and SEGI, reaching differences of 114.61%, 162.50% and 61.01%, respectively. Multi-storey and high-rise residential blocks all had average values, corresponding to intermediate levels of available space for solar energy.
- According to the results of the correlation analysis, ASI is mainly affected by three form indicators: the building coverage ratio, the average building height, and the volume-to-area ratio. The established multiple linear regression model can effectively predict the SRI, SII and SEGI, the fit degrees of which are 0.71, 0.53 and 0.68.
- It is suggested to focus on the utilization of solar energy on the roofs of industrial blocks, public service blocks, and multi-storey commercial blocks; the facades of high-rise residential blocks; and the entirety of low-rise residential blocks, multi-storey residential blocks, and high-rise commercial blocks. The development of available space for solar energy in urban blocks should be realized in a gradual and orderly development from point to surface.
Author Contributions
Funding
Data Availability Statement
Acknowledgments
Conflicts of Interest
Appendix A

| Abbreviations | Meaning | Abbreviations | Meaning |
|---|---|---|---|
| ASI | available space intensity | LRBs | low-rise residential blocks |
| SRI | solar radiation intensity (kwh/(m2·a)) | MRBs | multi-storey residential blocks |
| SII | solar installation intensity (m2) | HRBs | high-rise residential blocks |
| SEGI | solar energy generation intensity (kwh/(m2·a)) | LIBs | low-rise industrial blocks |
| SC | shape coefficient | MIBs | multi-storey industrial block |
| ABH | average building height | MCBs | multi-storey commercial blocks |
| BCR | building coverage ratio | HCBs | high-rise commercial blocks |
| V/A | volume-to-area ratio | MPSBs | multi-storey public service blocks |
| FI | façade index | HPSB | high-rise public service blocks |
| SVF | sky view factor |
References
- Kammen, D.M.; Sunter, D.A. City-Integrated Renewable Energy for Urban Sustainability. Science 2016, 352, 922–928. [Google Scholar] [CrossRef] [PubMed]
- Rogelj, J.; Den Elzen, M.; Höhne, N.; Fransen, T.; Fekete, H.; Winkler, H.; Schaeffer, R.; Sha, F.; Riahi, K.; Meinshausen, M. Paris Agreement Climate Proposals Need a Boost to Keep Warming Well below 2 °C. Nature 2016, 534, 631–639. [Google Scholar] [CrossRef]
- DeAngelo, J.; Azevedo, I.; Bistline, J.; Clarke, L.; Luderer, G.; Byers, E.; Davis, S.J. Energy Systems in Scenarios at Net-Zero CO2 Emissions. Nat. Commun. 2021, 12, 6096. [Google Scholar] [CrossRef]
- Cheng, Y.; Chung, M.; Tsang, K. Electricity Market Reforms for Energy Transition: Lessons from China. Energies 2023, 16, 905. [Google Scholar] [CrossRef]
- Liu, B.; Song, C.; Wang, Q.; Wang, Y. Forecasting of China’s Solar PV Industry Installed Capacity and Analyzing of Employment Effect: Based on GRA-BiLSTM Model. Environ. Sci. Pollut. Res. 2022, 29, 4557–4573. [Google Scholar] [CrossRef]
- Kabir, E.; Kumar, P.; Kumar, S.; Adelodun, A.A.; Kim, K.-H. Solar Energy: Potential and Future Prospects. Renew. Sustain. Energy Rev. 2018, 82, 894–900. [Google Scholar] [CrossRef]
- Guo, X.; Dong, Y.; Ren, D. CO2 Emission Reduction Effect of Photovoltaic Industry through 2060 in China. Energy 2023, 269, 126692. [Google Scholar] [CrossRef]
- Seto, K.C.; Churkina, G.; Hsu, A.; Keller, M.; Newman, P.W.G.; Qin, B.; Ramaswami, A. From Low- to Net-Zero Carbon Cities: The Next Global Agenda. Annu. Rev. Environ. Resour. 2021, 46, 377–415. [Google Scholar] [CrossRef]
- Smith, A.; Kern, F.; Raven, R.; Verhees, B. Spaces for Sustainable Innovation: Solar Photovoltaic Electricity in the UK. Technol. Forecast. Soc. Chang. 2014, 81, 115–130. [Google Scholar] [CrossRef]
- Javanroodi, K.; Perera, A.T.D.; Hong, T.; Nik, V.M. Designing Climate Resilient Energy Systems in Complex Urban Areas Considering Urban Morphology: A Technical Review. Adv. Appl. Energy 2023, 12, 100155. [Google Scholar] [CrossRef]
- Boccalatte, A.; Fossa, M.; Gaillard, L.; Menezo, C. Microclimate and Urban Morphology Effects on Building Energy Demand in Different European Cities. Energy Build. 2020, 224, 110129. [Google Scholar] [CrossRef]
- Li, S.; Zhou, C.; Wang, S.; Hu, J. Dose Urban Landscape Pattern Affect CO2 Emission Efficiency? Empirical Evidence from Megacities in China. J. Clean. Prod. 2018, 203, 164–178. [Google Scholar] [CrossRef]
- Taleghani, M.; Kleerekoper, L.; Tenpierik, M.; van den Dobbelsteen, A. Outdoor Thermal Comfort within Five Different Urban Forms in the Netherlands. Build. Environ. 2015, 83, 65–78. [Google Scholar] [CrossRef]
- Ramachandra, T.V.; Shruthi, B.V. Spatial Mapping of Renewable Energy Potential. Renew. Sustain. Energy Rev. 2007, 11, 1460–1480. [Google Scholar] [CrossRef]
- Cajot, S.; Peter, M.; Bahu, J.-M.; Guignet, F.; Koch, A.; Maréchal, F. Obstacles in Energy Planning at the Urban Scale. Sustain. Cities Soc. 2017, 30, 223–236. [Google Scholar] [CrossRef]
- Freitas, S.; Catita, C.; Redweik, P.; Brito, M.C. Modelling Solar Potential in the Urban Environment: State-of-the-Art Review. Renew. Sustain. Energy Rev. 2015, 41, 915–931. [Google Scholar] [CrossRef]
- National Energy Administration. The 14th Five-Year Plan for Modernized Energy System. Available online: https://www.ndrc.gov.cn/xxgk/zcfb/ghwb/202203/t20220322_1320016.html (accessed on 23 December 2023).
- Poon, K.H.; Kämpf, J.H.; Tay, S.E.R.; Wong, N.H.; Reindl, T.G. Parametric Study of URBAN Morphology on Building Solar Energy Potential in Singapore Context. Urban Clim. 2020, 33, 100624. [Google Scholar] [CrossRef]
- Lauka, D.; Haine, K.; Gusca, J.; Blumberga, D. Solar Energy Integration in Future Urban Plans of the South and Nordic Cities. Energy Procedia 2018, 152, 1127–1132. [Google Scholar] [CrossRef]
- Kanters, J.; Wall, M.; Kjellsson, E. The Solar Map as a Knowledge Base for Solar Energy Use. Energy Procedia 2014, 48, 1597–1606. [Google Scholar] [CrossRef]
- Jin, S.; Zhang, H.; Huang, X.; Yan, J.; Yu, H.; Gao, N.; Jia, X.; Wang, Z. Solar Energy Utilization Potential in Urban Residential Blocks: A Case Study of Wuhan, China. Sustainability 2023, 15, 15988. [Google Scholar] [CrossRef]
- Lau, K.K.-L.; Lindberg, F.; Johansson, E.; Rasmussen, M.I.; Thorsson, S. Investigating Solar Energy Potential in Tropical Urban Environment: A Case Study of Dar Es Salaam, Tanzania. Sustain. Cities Soc. 2017, 30, 118–127. [Google Scholar] [CrossRef]
- Dall’O’, G.; Norese, M.; Galante, A.; Novello, C. A Multi-Criteria Methodology to Support Public Administration Decision Making Concerning Sustainable Energy Action Plans. Energies 2013, 6, 4308–4330. [Google Scholar] [CrossRef]
- De Marco, A.; Petrosillo, I.; Semeraro, T.; Pasimeni, M.R.; Aretano, R.; Zurlini, G. The Contribution of Utility-Scale Solar Energy to the Global Climate Regulation and Its Effects on Local Ecosystem Services. Glob. Ecol. Conserv. 2014, 2, 324–337. [Google Scholar] [CrossRef]
- Blecic, I.; Cecchini, A.; Prastacos, P.; Trunfio, G.A.; Verigos, E. Modelling Urban Dynamics with Cellular Automata: A Model of the City of Heraklion. In Proceedings of the 7th AGILE Conference on Geographic Information Science, Heraklion, Greece, 29 April–1 May 2004. [Google Scholar]
- Kämpf, J.H.; Montavon, M.; Bunyesc, J.; Bolliger, R.; Robinson, D. Optimisation of Buildings’ Solar Irradiation Availability. Sol. Energy 2010, 84, 596–603. [Google Scholar] [CrossRef]
- Morganti, M.; Salvati, A.; Coch, H.; Cecere, C. Urban Morphology Indicators for Solar Energy Analysis. Energy Procedia 2017, 134, 807–814. [Google Scholar] [CrossRef]
- de Lemos Martins, T.A.; Adolphe, L.; Bastos, L.E.G.; de Lemos Martins, M.A. Sensitivity Analysis of Urban Morphology Factors Regarding Solar Energy Potential of Buildings in a Brazilian Tropical Context. Sol. Energy 2016, 137, 11–24. [Google Scholar] [CrossRef]
- Vermeulen, T.; Knopf-Lenoir, C.; Villon, P.; Beckers, B. Urban Layout Optimization Framework to Maximize Direct Solar Irradiation. Comput. Environ. Urban Syst. 2015, 51, 1–12. [Google Scholar] [CrossRef]
- Li, D.; Liu, G.; Liao, S. Solar Potential in Urban Residential Buildings. Sol. Energy 2015, 111, 225–235. [Google Scholar] [CrossRef]
- Sharaf, F.M.; Al-Salaymeh, A. A Comparative Study of the Use of Energy Conservation Techniques in Office Building: Passive and Solar Energy Applications: The Case of Jordan. Sustain. Cities Soc. 2012, 5, 16–22. [Google Scholar] [CrossRef]
- Lin, P.; Gou, Z.; Lau, S.; Qin, H. The Impact of Urban Design Descriptors on Outdoor Thermal Environment: A Literature Review. Energies 2017, 10, 2151. [Google Scholar] [CrossRef]
- Lu, M.; Zhang, Y.; Xing, J.; Ma, W. Assessing the Solar Radiation Quantity of High-Rise Residential Areas in Typical Layout Patterns: A Case in North-East China. Buildings 2018, 8, 148. [Google Scholar] [CrossRef]
- Gong, F.-Y.; Zeng, Z.-C.; Ng, E.; Norford, L.K. Spatiotemporal Patterns of Street-Level Solar Radiation Estimated Using Google Street View in a High-Density Urban Environment. Build. Environ. 2019, 148, 547–566. [Google Scholar] [CrossRef]
- Xu, S.; Jiang, H.; Xiong, F.; Zhang, C.; Xie, M.; Li, Z. Evaluation for Block-Scale Solar Energy Potential of Industrial Block and Optimization of Application Strategies: A Case Study of Wuhan, China. Sustain. Cities Soc. 2021, 72, 103000. [Google Scholar] [CrossRef]
- Karteris, M.; Theodoridou, I.; Mallinis, G.; Papadopoulos, A.M. Façade Photovoltaic Systems on Multifamily Buildings: An Urban Scale Evaluation Analysis Using Geographical Information Systems. Renew. Sustain. Energy Rev. 2014, 39, 912–933. [Google Scholar] [CrossRef]
- Amado, M.; Poggi, F. Solar Urban Planning: A Parametric Approach. Energy Procedia 2014, 48, 1539–1548. [Google Scholar] [CrossRef]
- Assouline, D.; Mohajeri, N.; Scartezzini, J.-L. Quantifying Rooftop Photovoltaic Solar Energy Potential: A Machine Learning Approach. Sol. Energy 2017, 141, 278–296. [Google Scholar] [CrossRef]
- Assouline, D.; Mohajeri, N.; Scartezzini, J.-L. Large-Scale Rooftop Solar Photovoltaic Technical Potential Estimation Using Random Forests. Appl. Energy 2018, 217, 189–211. [Google Scholar] [CrossRef]
- Byrne, J.; Taminiau, J.; Kurdgelashvili, L.; Kim, K.N. A Review of the Solar City Concept and Methods to Assess Rooftop Solar Electric Potential, with an Illustrative Application to the City of Seoul. Renew. Sustain. Energy Rev. 2015, 41, 830–844. [Google Scholar] [CrossRef]
- Defaix, P.R.; van Sark, W.G.J.H.M.; Worrell, E.; de Visser, E. Technical Potential for Photovoltaics on Buildings in the EU-27. Sol. Energy 2012, 86, 2644–2653. [Google Scholar] [CrossRef]
- Strzalka, A.; Alam, N.; Duminil, E.; Coors, V.; Eicker, U. Large Scale Integration of Photovoltaics in Cities. Appl. Energy 2012, 93, 413–421. [Google Scholar] [CrossRef]
- Buffat, R.; Grassi, S.; Raubal, M. A Scalable Method for Estimating Rooftop Solar Irradiation Potential over Large Regions. Appl. Energy 2018, 216, 389–401. [Google Scholar] [CrossRef]
- Lin, S.; Zhang, C.; Ding, L.; Zhang, J.; Liu, X.; Chen, G.; Wang, S.; Chai, J. Accurate Recognition of Building Rooftops and Assessment of Long-Term Carbon Emission Reduction from Rooftop Solar Photovoltaic Systems Fusing GF-2 and Multi-Source Data. Remote Sens. 2022, 14, 3144. [Google Scholar] [CrossRef]
- Cheng, J.; Masser, I. Urban Growth Pattern Modeling: A Case Study of Wuhan City, PR China. Landsc. Urban Plan. 2003, 62, 199–217. [Google Scholar] [CrossRef]
- GB 50137-2011; Code for Classification of Urban Land Use and Planning Standards of Development Land. Available online: https://www.mohurd.gov.cn/gongkai/zhengce/zhengcefilelib/201201/20120104_208247.html (accessed on 23 December 2023).
- Quan, S.J.; Li, C. Urban Form and Building Energy Use: A Systematic Review of Measures, Mechanisms, and Methodologies. Renew. Sustain. Energy Rev. 2021, 139, 110662. [Google Scholar] [CrossRef]
- Lowry, J.H.; Lowry, M.B. Comparing Spatial Metrics That Quantify Urban Form. Comput. Environ. Urban Syst. 2014, 44, 59–67. [Google Scholar] [CrossRef]
- Ferreira, L.S.; Duarte, D.H.S. Exploring the Relationship between Urban Form, Land Surface Temperature and Vegetation Indices in a Subtropical Megacity. Urban Clim. 2019, 27, 105–123. [Google Scholar] [CrossRef]
- Pili, S.; Grigoriadis, E.; Carlucci, M.; Clemente, M.; Salvati, L. Towards Sustainable Growth? A Multi-Criteria Assessment of (Changing) Urban Forms. Ecol. Indic. 2017, 76, 71–80. [Google Scholar] [CrossRef]
- Izquierdo, S.; Rodrigues, M.; Fueyo, N. A Method for Estimating the Geographical Distribution of the Available Roof Surface Area for Large-Scale Photovoltaic Energy-Potential Evaluations. Sol. Energy 2008, 82, 929–939. [Google Scholar] [CrossRef]
- Saber, E.M.; Lee, S.E.; Manthapuri, S.; Yi, W.; Deb, C. PV (Photovoltaics) Performance Evaluation and Simulation-Based Energy Yield Prediction for Tropical Buildings. Energy 2014, 71, 588–595. [Google Scholar] [CrossRef]
- Sanchez-Lorenzo, A.; Calbó, J.; Wild, M. Global and Diffuse Solar Radiation in Spain: Building a Homogeneous Dataset and Assessing Their Trends. Glob. Planet. Chang. 2013, 100, 343–352. [Google Scholar] [CrossRef]
- Bre, F.; e Silva Machado, R.M.; Lawrie, L.K.; Crawley, D.B.; Lamberts, R. Assessment of Solar Radiation Data Quality in Typical Meteorological Years and Its Influence on the Building Performance Simulation. Energy Build. 2021, 250, 111251. [Google Scholar] [CrossRef]
- Gordon, J.M.; Kreider, J.F.; Reeves, P. Tracking and Stationary Flat Plate Solar Collectors: Yearly Collectible Energy Correlations for Photovoltaic Applications. Sol. Energy 1991, 47, 245–252. [Google Scholar] [CrossRef]
- Yang, R.J. Overcoming Technical Barriers and Risks in the Application of Building Integrated Photovoltaics (BIPV): Hardware and Software Strategies. Autom. Constr. 2015, 51, 92–102. [Google Scholar] [CrossRef]
- Sun, L.; Lu, L.; Yang, H. Optimum Design of Shading-Type Building-Integrated Photovoltaic Claddings with Different Surface Azimuth Angles. Appl. Energy 2012, 90, 233–240. [Google Scholar] [CrossRef]
- Rothwarf, A.; Böer, K.W. Direct Conversion of Solar Energy through Photovoltaic Cells. Prog. Solid State Chem. 1975, 10, 71–102. [Google Scholar] [CrossRef]
- Hwang, T.; Kang, S.; Kim, J.T. Optimization of the Building Integrated Photovoltaic System in Office Buildings—Focus on the Orientation, Inclined Angle and Installed Area. Energy Build. 2012, 46, 92–104. [Google Scholar] [CrossRef]
- Lobaccaro, G.; Carlucci, S.; Croce, S.; Paparella, R.; Finocchiaro, L. Boosting Solar Accessibility and Potential of Urban Districts in the Nordic Climate: A Case Study in Trondheim. Sol. Energy 2017, 149, 347–369. [Google Scholar] [CrossRef]
- Abunima, H.; Teh, J.; Jabir, H.J. A New Solar Radiation Model for a Power System Reliability Study. IEEE Access 2019, 7, 64758–64766. [Google Scholar] [CrossRef]
- de Sousa Freitas, J.; Cronemberger, J.; Soares, R.M.; Amorim, C.N.D. Modeling and Assessing BIPV Envelopes Using Parametric Rhinoceros Plugins Grasshopper and Ladybug. Renew. Energy 2020, 160, 1468–1479. [Google Scholar] [CrossRef]
- Qing, L.; Yunlong, W.; Xiaokai, F.; Hanbin, W.; Sulala, A.H. Solution of integrated reflection for cities. J. Civ. Archit. Environ. Eng. 2015, 37, 7–11. [Google Scholar] [CrossRef]
- Veisi, O.; Shakibamanesh, A. Analysis of Solar Radiation towards Optimization and Location of The Urban Blocks in The Neighborhood Units. Environ. Sci. Sustain. Dev. 2022, 7, 66–90. [Google Scholar] [CrossRef]
- Gassar, A.A.A.; Cha, S.H. Review of Geographic Information Systems-Based Rooftop Solar Photovoltaic Potential Estimation Approaches at Urban Scales. Appl. Energy 2021, 291, 116817. [Google Scholar] [CrossRef]
- Compagnon, R. Solar and Daylight Availability in the Urban Fabric. Energy Build. 2004, 36, 321–328. [Google Scholar] [CrossRef]
- Li, J.; Li, Z.; Wang, Y.; Zhang, H. Energy Utilization and Carbon Reduction Potential of Solar Energy in Residential Blocks: A Case Study on a Tropical High-Density City in China. Sustainability 2023, 15, 12975. [Google Scholar] [CrossRef]
- Bergamasco, L.; Asinari, P. Scalable Methodology for the Photovoltaic Solar Energy Potential Assessment Based on Available Roof Surface Area: Application to Piedmont Region (Italy). Sol. Energy 2011, 85, 1041–1055. [Google Scholar] [CrossRef]
- Tian, J.; Xu, S. A Morphology-Based Evaluation on Block-Scale Solar Potential for Residential Area in Central China. Sol. Energy 2021, 221, 332–347. [Google Scholar] [CrossRef]
- Zhang, H.; Wang, L.; Li, Z. Research on PV Energy Potential of Rooftop in Urban Area. Urban Probl. 2018, 2, 33–39. [Google Scholar] [CrossRef]
- GB 55015-2021; General Code for Energy Efficiency and Renewable Energy Application in Buildings. Available online: https://www.mohurd.gov.cn/gongkai/zhengce/zhengcefilelib/202110/20211013_762460.html (accessed on 23 December 2023).
- Kumar, M.; Kumar, A. Performance Assessment and Degradation Analysis of Solar Photovoltaic Technologies: A Review. Renew. Sustain. Energy Rev. 2017, 78, 554–587. [Google Scholar] [CrossRef]
- Zhong, Q.; Nelson, J.R.; Tong, D.; Grubesic, T.H. A Spatial Optimization Approach to Increase the Accuracy of Rooftop Solar Energy Assessments. Appl. Energy 2022, 316, 119128. [Google Scholar] [CrossRef]
- Sarralde, J.J.; Quinn, D.J.; Wiesmann, D.; Steemers, K. Solar Energy and Urban Morphology: Scenarios for Increasing the Renewable Energy Potential of Neighbourhoods in London. Renew. Energy 2015, 73, 10–17. [Google Scholar] [CrossRef]
- Olivieri, L.; Caamaño-Martín, E.; Sassenou, L.-N.; Olivieri, F. Contribution of Photovoltaic Distributed Generation to the Transition towards an Emission-Free Supply to University Campus: Technical, Economic Feasibility and Carbon Emission Reduction at the Universidad Politécnica de Madrid. Renew. Energy 2020, 162, 1703–1714. [Google Scholar] [CrossRef]
- Lee, J.; Chang, B.; Aktas, C.; Gorthala, R. Economic Feasibility of Campus-Wide Photovoltaic Systems in New England. Renew. Energy 2016, 99, 452–464. [Google Scholar] [CrossRef]
- Li, Z.; Su, S.; Jin, X.; Xia, M.; Chen, Q.; Yamashita, K. Stochastic and Distributed Optimal Energy Management of Active Distribution Network with Integrated Office Buildings. CSEE J. Power Energy Syst. 2022, 76, 1–12. [Google Scholar] [CrossRef]


| Type | Block Model | |||||
|---|---|---|---|---|---|---|
| LRBs |  |  |  |  |  |  |
| A1 | A2 | A3 | A4 | A5 | A6 | |
| MRBs |  |  |  |  |  |  |
| B1 | B2 | B3 | B4 | B5 | B6 | |
| HRBs |  |  |  |  |  |  |
| C1 | C2 | C3 | C4 | C5 | C6 | |
| MCBs |  |  |  |  |  | 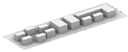 |
| D1 | D2 | D3 | D4 | D5 | D6 | |
| HCBs |  |  |  |  |  |  |
| E1 | E2 | E3 | E4 | E5 | E6 | |
| MPSBs |  |  |  |  |  |  |
| F1 | F2 | F3 | F4 | F5 | F6 | |
| HPSBs |  |  |  |  |  |  |
| G1 | G2 | G3 | G4 | G5 | G6 | |
| LIBs |  |  |  |  |  |  |
| H1 | H2 | H3 | H4 | H5 | H6 | |
| MIBs |  |  |  |  |  |  |
| I1 | I2 | I3 | I4 | I5 | I6 | |
| Urban Form Indicators | Definition | Formula | Diagram |
|---|---|---|---|
| Ratio of total building surface area to volume | 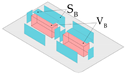 | ||
| Height of individual buildings weighted according to their respective footprints | 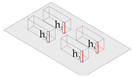 | ||
| Ratio of total building façade area to site area | 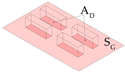 | ||
| Ratio of total building coverage |  | ||
| Ratio of total building façade area to site area |  | ||
| Degree of confinement of urban space |  |
| Parameter | Setting |
|---|---|
| Computing grid | 1 × 1 m2 |
| Weather data | China standard weather data |
| Computation period | 00:00 on 1 January to 4:00 on 31 December |
| Computing interval | 1 h |
| Reflectance of building and ground | 0.2 |
| Location | Wuhan |
| Typology | Existing Research Values (Cr) [70] | Average Value (Value of This Study) | Existing Research Values (Cf) [71] | Average Value (Value of This Study) |
|---|---|---|---|---|
| LRB | 0.30–0.50 | 0.40 | 0.6–0.8 | 0.7 |
| MRB | 0.44–0.69 | 0.57 | 0.6–0.8 | 0.7 |
| HRB | 0.25–0.41 | 0.41 | 0.6–0.8 | 0.7 |
| MCB, MPSB | 0.7–0.85 | 0.78 | 0.4–0.6 | 0.5 |
| HCB, HPSB | 0.22–0.56 | 0.39 | 0.4–0.6 | 0.5 |
| LIB, MIB | 0.8–0.9 | 0.85 | 0.9 | 0.9 |
| Product Model | Component Size | Rated Power | Peak Voltage | Peak Current | Conversion Efficiency | System Efficiency |
|---|---|---|---|---|---|---|
| TSM-250-PD05 | 1650 × 992 × 35 mm3 | 250 Wp | 30.3 V | 8.27 A | 22% | 90% |
| Building Surface | SRI | SII | SEGI | |||
|---|---|---|---|---|---|---|
| F | p | F | p | F | p | |
| Roof | 69.06 | 0.01 | 14.01 | 0.02 | 13.21 | 0.02 |
| Facade | 32.86 | 0.00 | 18.11 | 0.02 | 18.67 | 0.01 |
| Block | 22.44 | 0.01 | 12.65 | 0.03 | 15.42 | 0.02 |
| Dependent Variable | Predictive Variable | Nonstandard Coefficient | Standard Coefficient | Sig. | VIF | R2 | Durbin–Watson | |
|---|---|---|---|---|---|---|---|---|
| B | Standard Error | Beta | ||||||
| SRI | Constant | 399.76 | 63.42 | - | 0.01 | - | 0.71 | 1.51 |
| V/A | 37.64 | 12.54 | 0.85 | 0.01 | 3.47 | |||
| FI | −62.47 | 36.42 | −0.26 | 0.01 | 3.00 | |||
| SVF | 478.35 | 52.36 | 0.48 | 0.01 | 1.38 | |||
| SII | Constant | 0.19 | 0.09 | - | 0.01 | - | 0.53 | 1.45 |
| BCR | 0.46 | 0.25 | 0.41 | 0.00 | 1.07 | |||
| FI | 0.03 | 0.02 | 0.34 | 0.01 | 1.41 | |||
| SC | −0.21 | 0.12 | −0.21 | 0.01 | 1.48 | |||
| SEGI | Constant | 29.61 | 2.16 | - | 0.00 | - | 0.68 | 1.56 |
| V/A | 0.52 | 0.17 | 0.55 | 0.00 | 2.08 | |||
| SC | −8.72 | 3.23 | −0.25 | 0.00 | 2.23 | |||
| SVF | 1.85 | 2.33 | 0.14 | 0.01 | 3.21 | |||
Disclaimer/Publisher’s Note: The statements, opinions and data contained in all publications are solely those of the individual author(s) and contributor(s) and not of MDPI and/or the editor(s). MDPI and/or the editor(s) disclaim responsibility for any injury to people or property resulting from any ideas, methods, instructions or products referred to in the content. |
© 2024 by the authors. Licensee MDPI, Basel, Switzerland. This article is an open access article distributed under the terms and conditions of the Creative Commons Attribution (CC BY) license (https://creativecommons.org/licenses/by/4.0/).
Share and Cite
Zhang, H.; Huang, X.; Wang, Z.; Jin, S.; Xiao, B.; Huang, Y.; Zhong, W.; Meng, A. An Estimation of the Available Spatial Intensity of Solar Energy in Urban Blocks in Wuhan, China. Energies 2024, 17, 1025. https://doi.org/10.3390/en17051025
Zhang H, Huang X, Wang Z, Jin S, Xiao B, Huang Y, Zhong W, Meng A. An Estimation of the Available Spatial Intensity of Solar Energy in Urban Blocks in Wuhan, China. Energies. 2024; 17(5):1025. https://doi.org/10.3390/en17051025
Chicago/Turabian StyleZhang, Hui, Xiaoxi Huang, Zhengwei Wang, Shiyu Jin, Benlin Xiao, Yanyan Huang, Wei Zhong, and Aofei Meng. 2024. "An Estimation of the Available Spatial Intensity of Solar Energy in Urban Blocks in Wuhan, China" Energies 17, no. 5: 1025. https://doi.org/10.3390/en17051025
APA StyleZhang, H., Huang, X., Wang, Z., Jin, S., Xiao, B., Huang, Y., Zhong, W., & Meng, A. (2024). An Estimation of the Available Spatial Intensity of Solar Energy in Urban Blocks in Wuhan, China. Energies, 17(5), 1025. https://doi.org/10.3390/en17051025