
Study on the near Wake Aerodynamic Characteristics of Floating Offshore Wind Turbine under Combined Surge and Pitch Motion


Abstract
1. Introduction
2. Methodology
3. Model Description
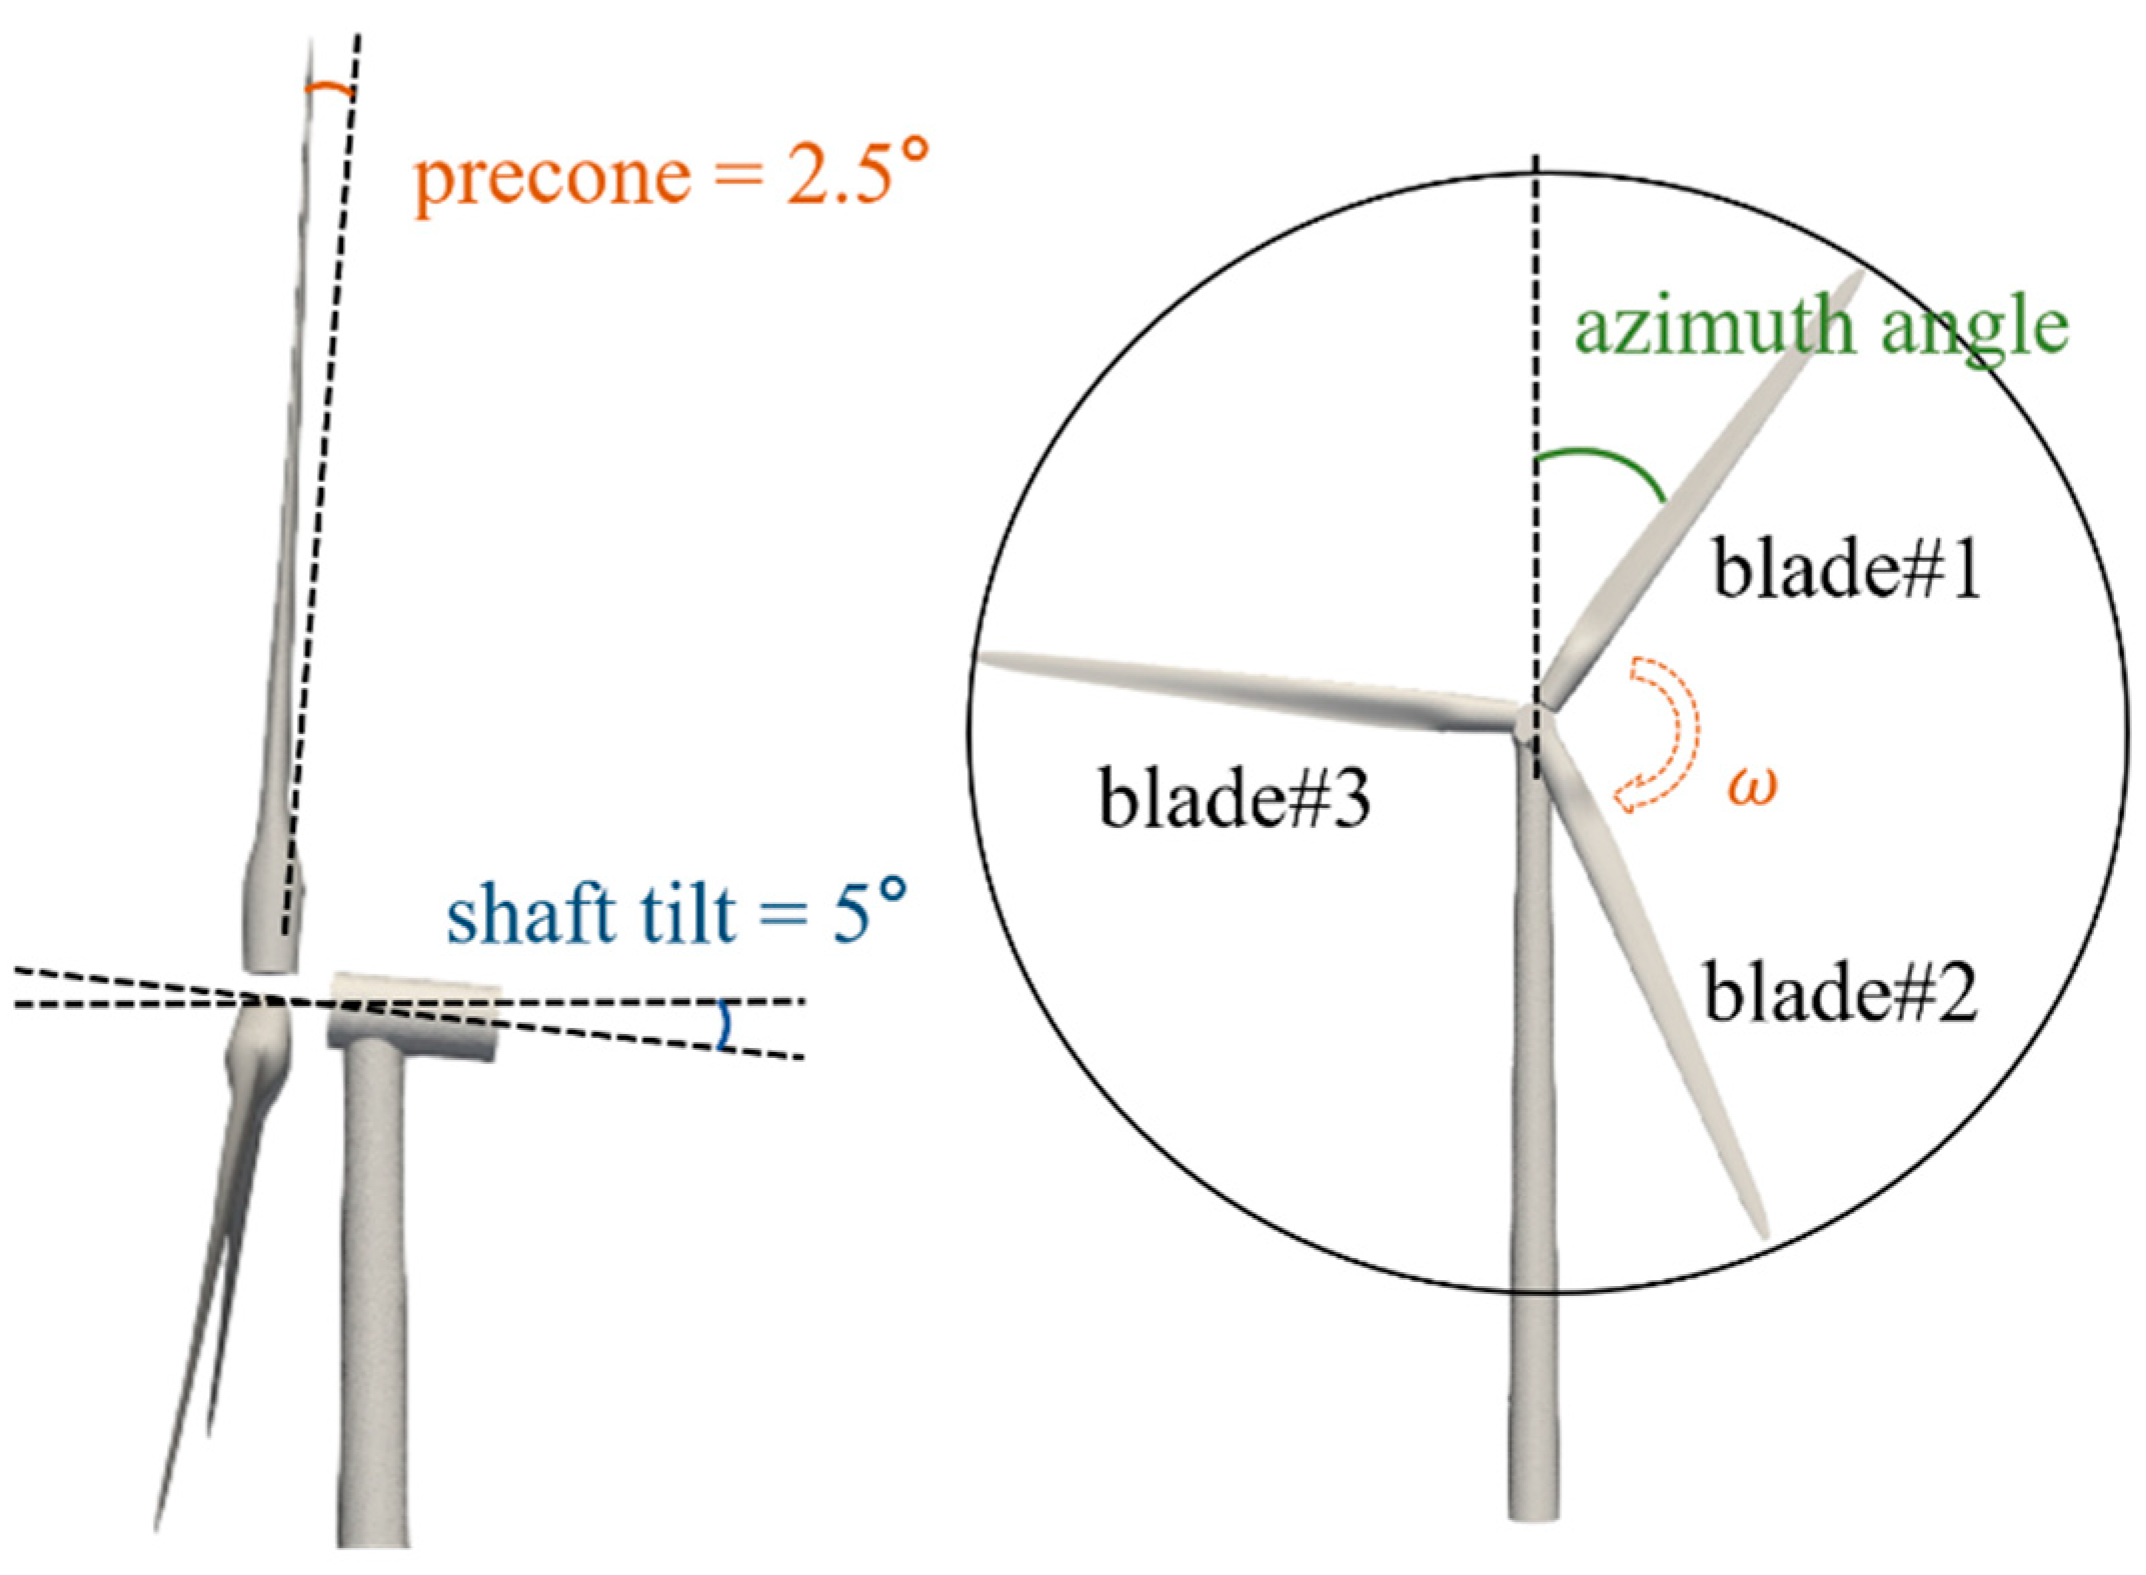
3.1. Description of Wind Turbine Model
3.2. Description of Wind Turbine Motion
3.2.1. Description of Wind Turbine Surge Motion
3.2.2. Description of Wind Turbine Pitch Motion
3.2.3. Description of Wind Turbine Coupled Surge-Pitch Motion
4. Description and Validation of Modeling Method
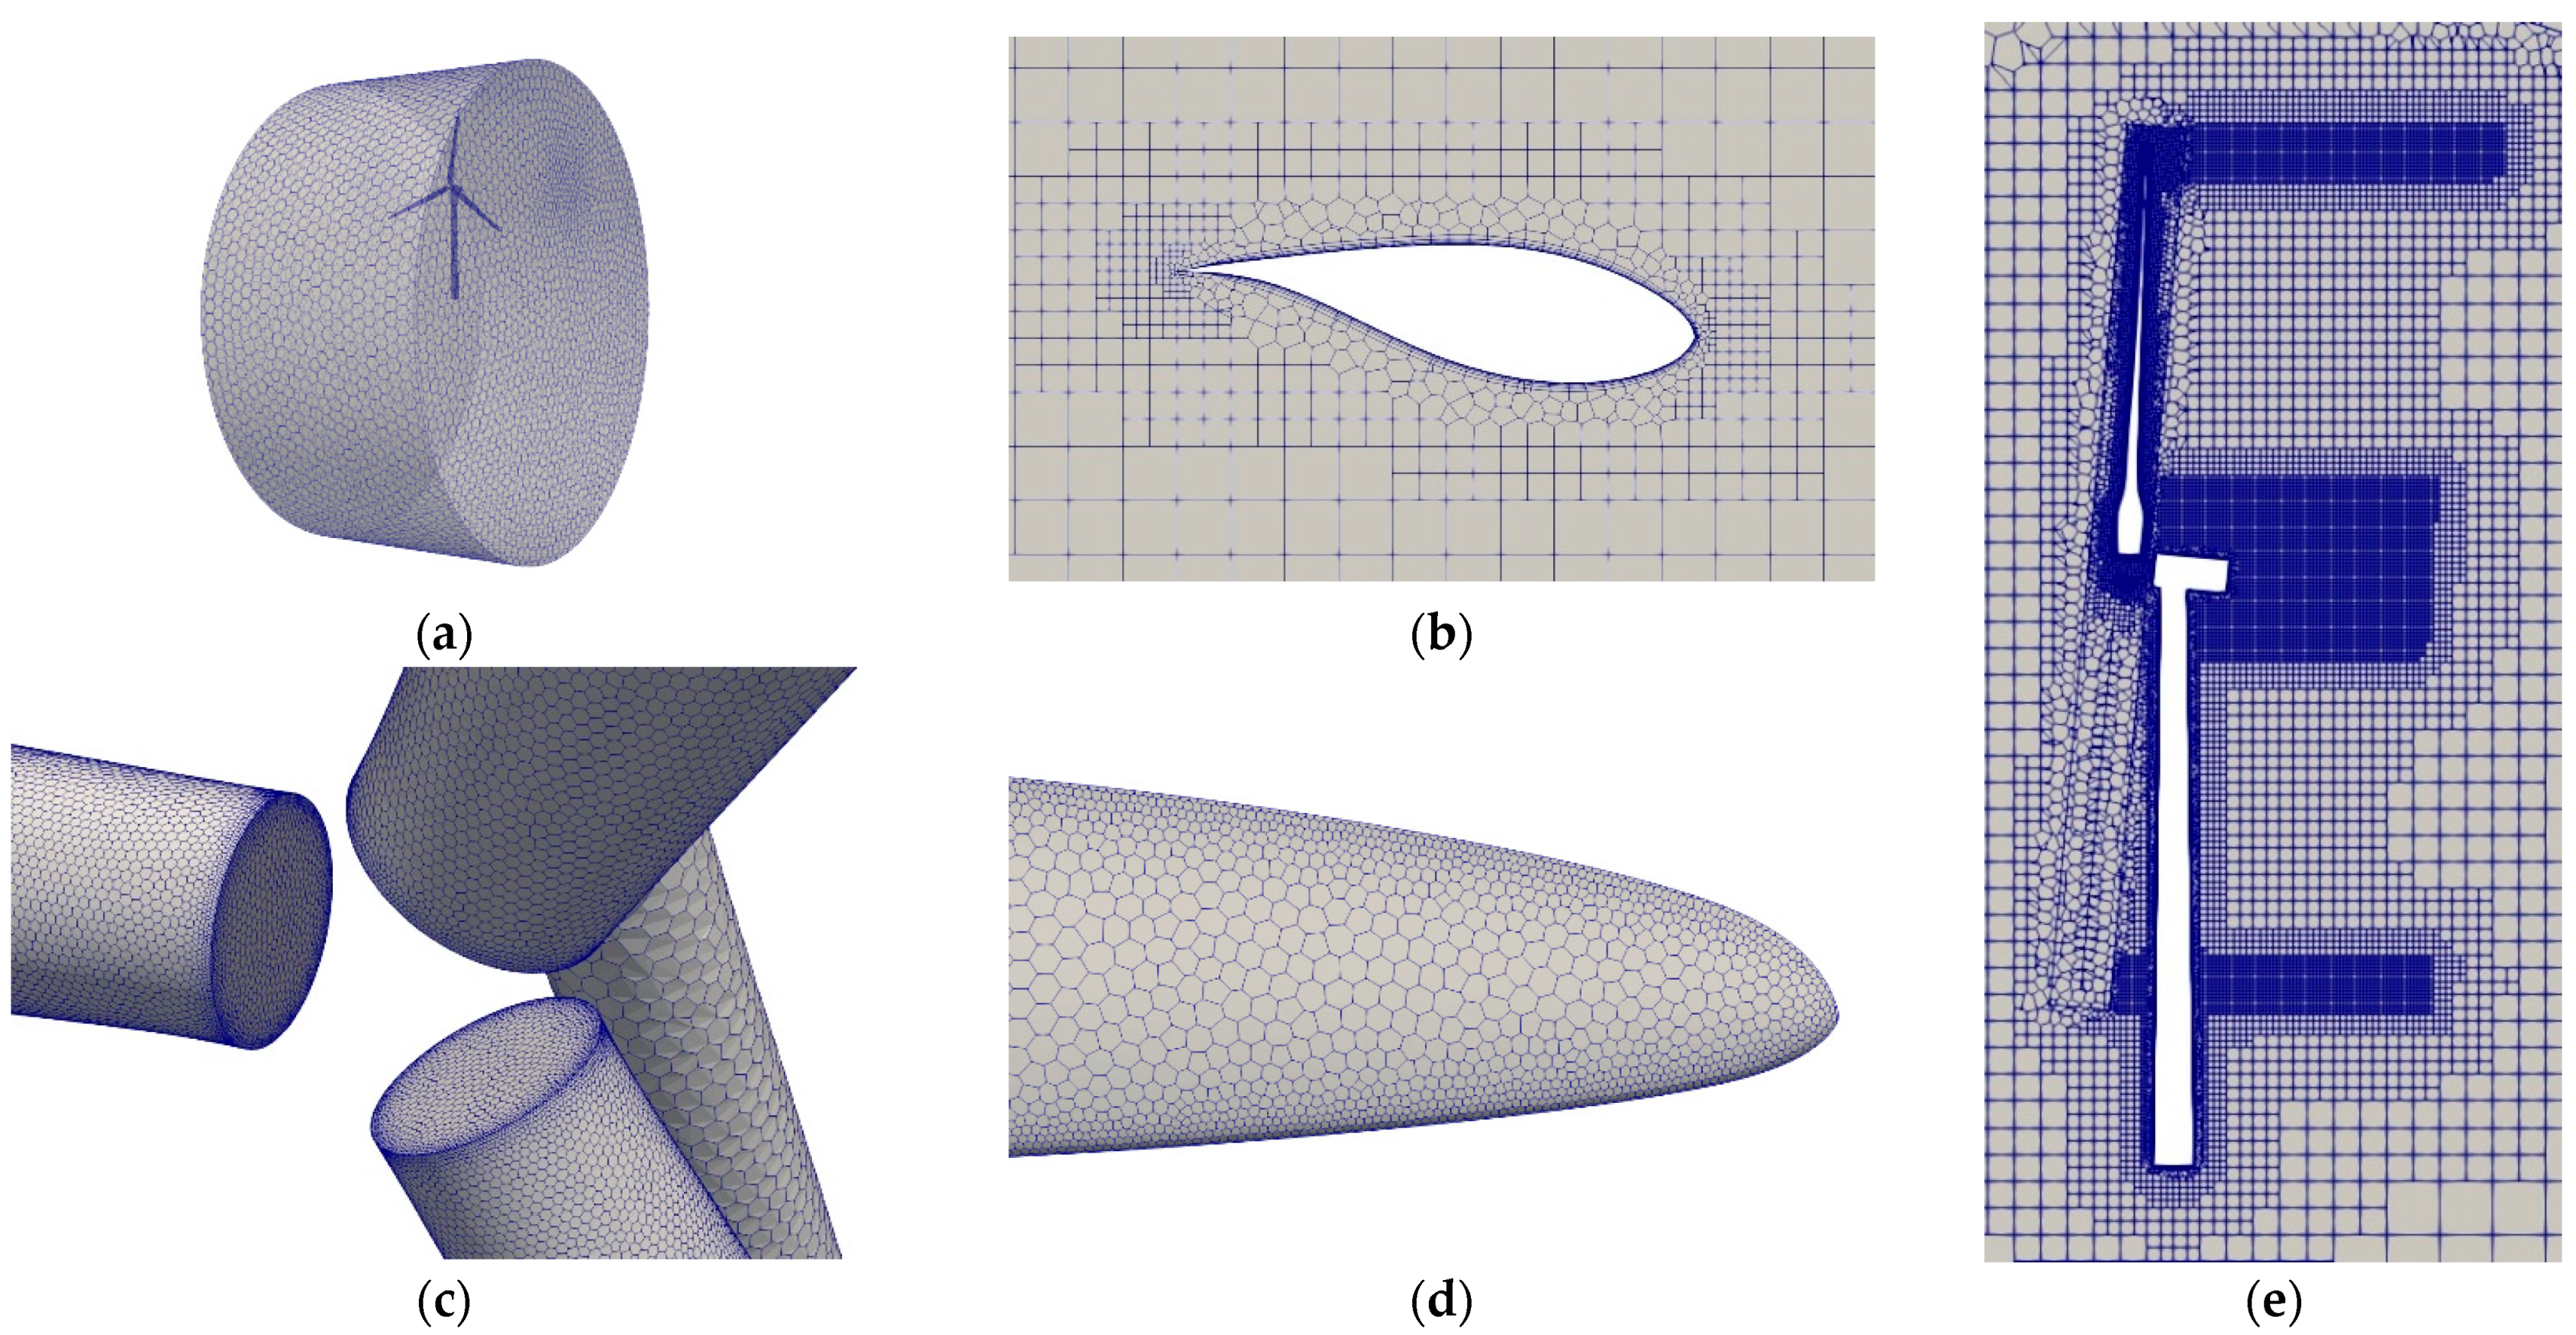
4.1. Description of Modeling Method
4.2. Validation of Modelling Method
5. Results and Discussion
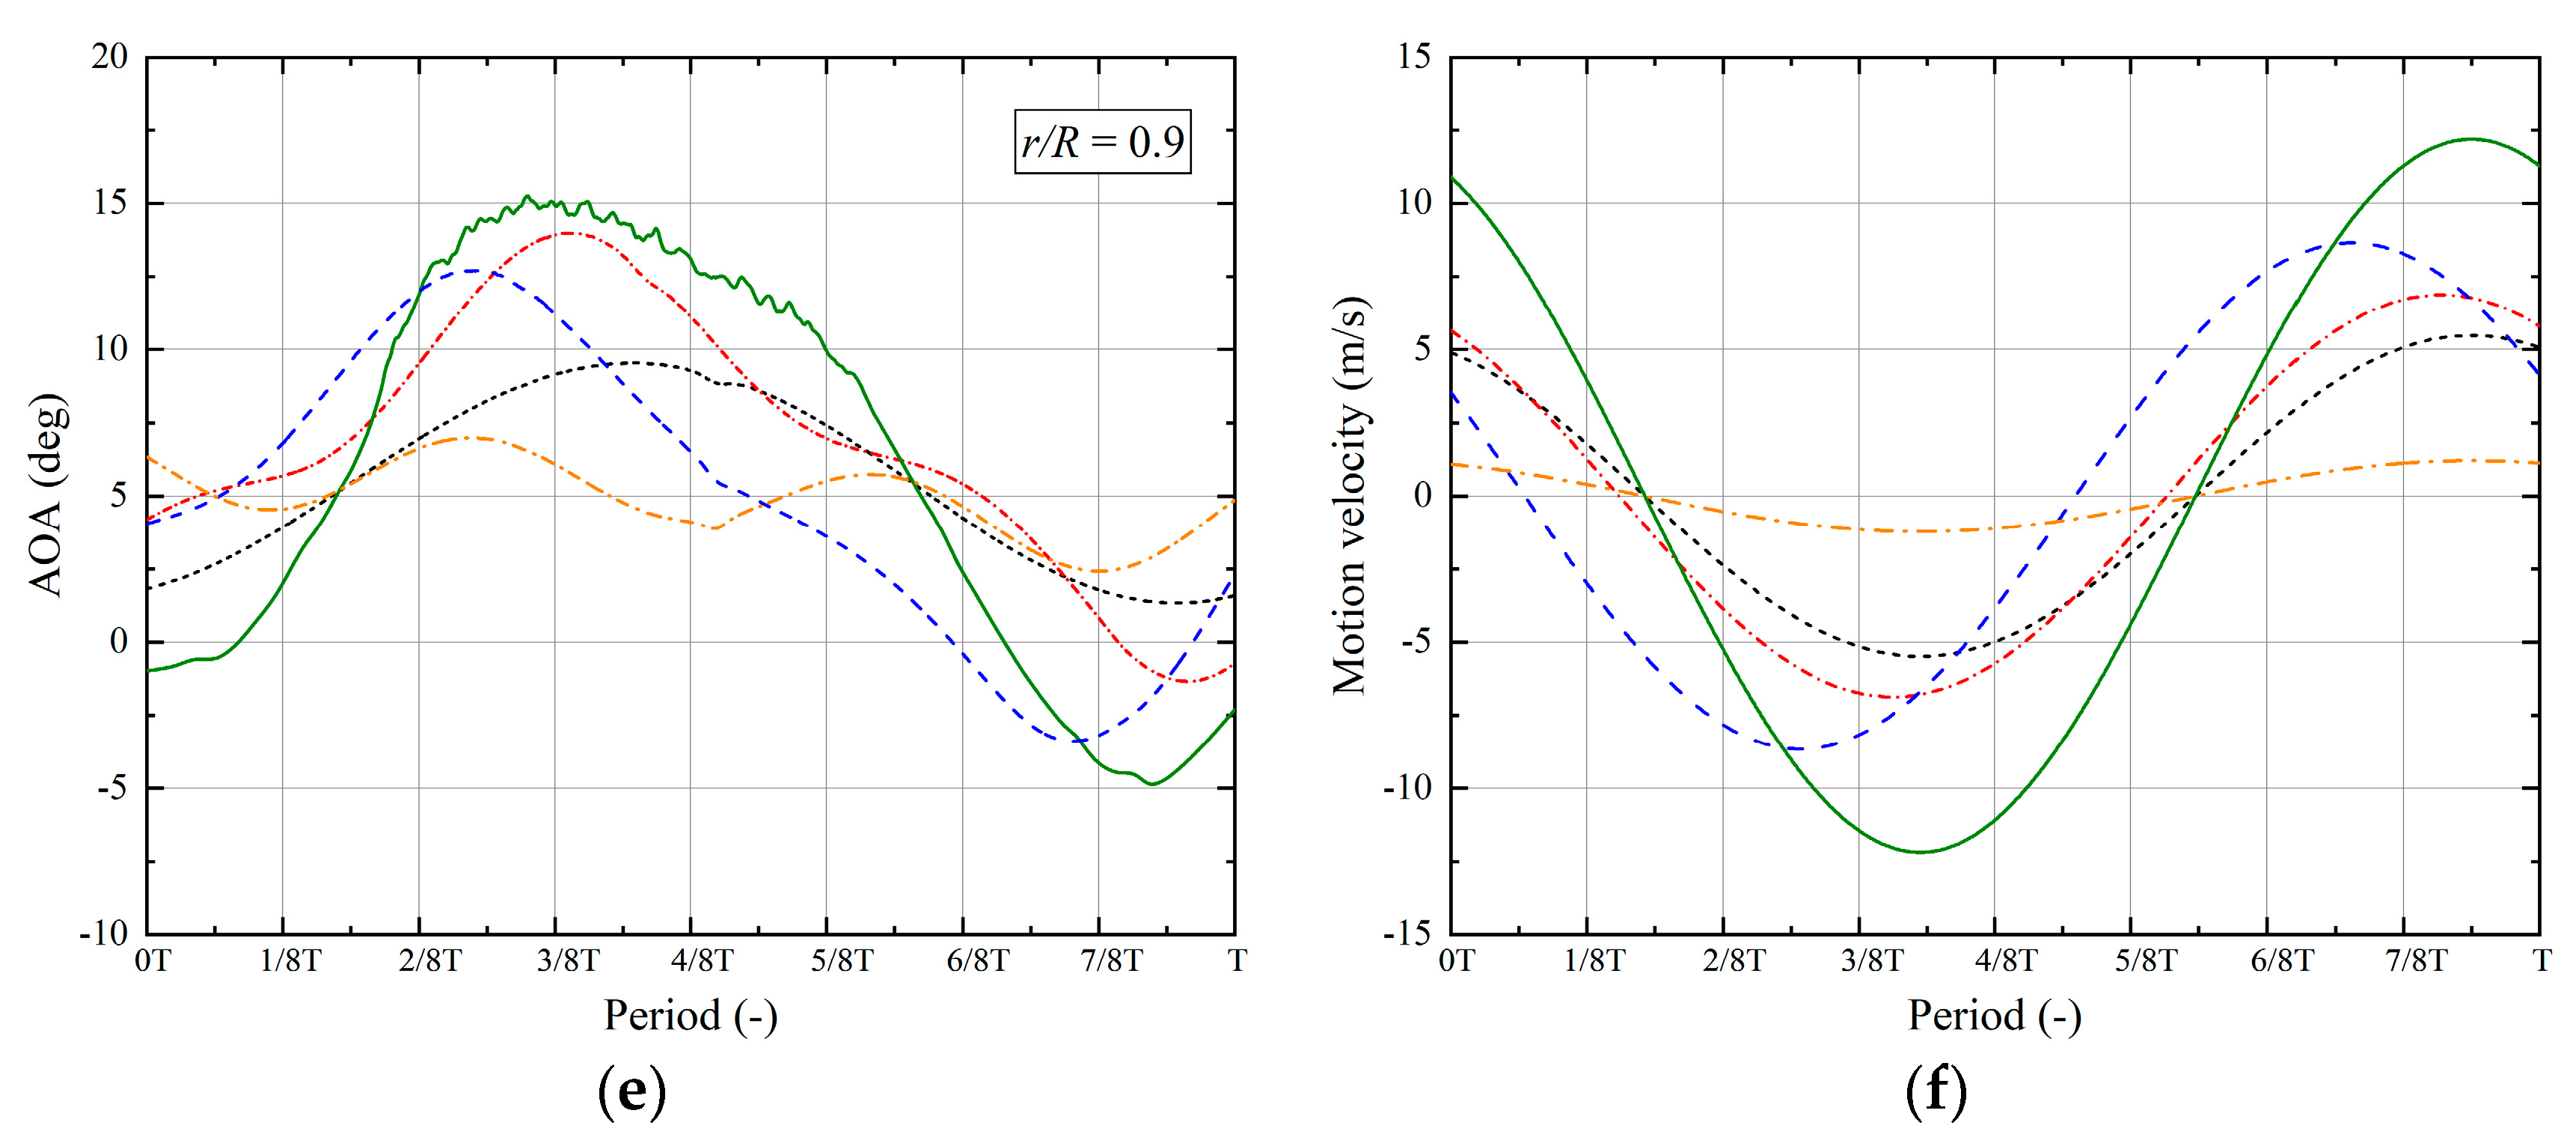
5.1. Aerodynamic Characteristics of Rotor under Different Platform Movement
5.2. Velocity Distribution under Different Platform Motion
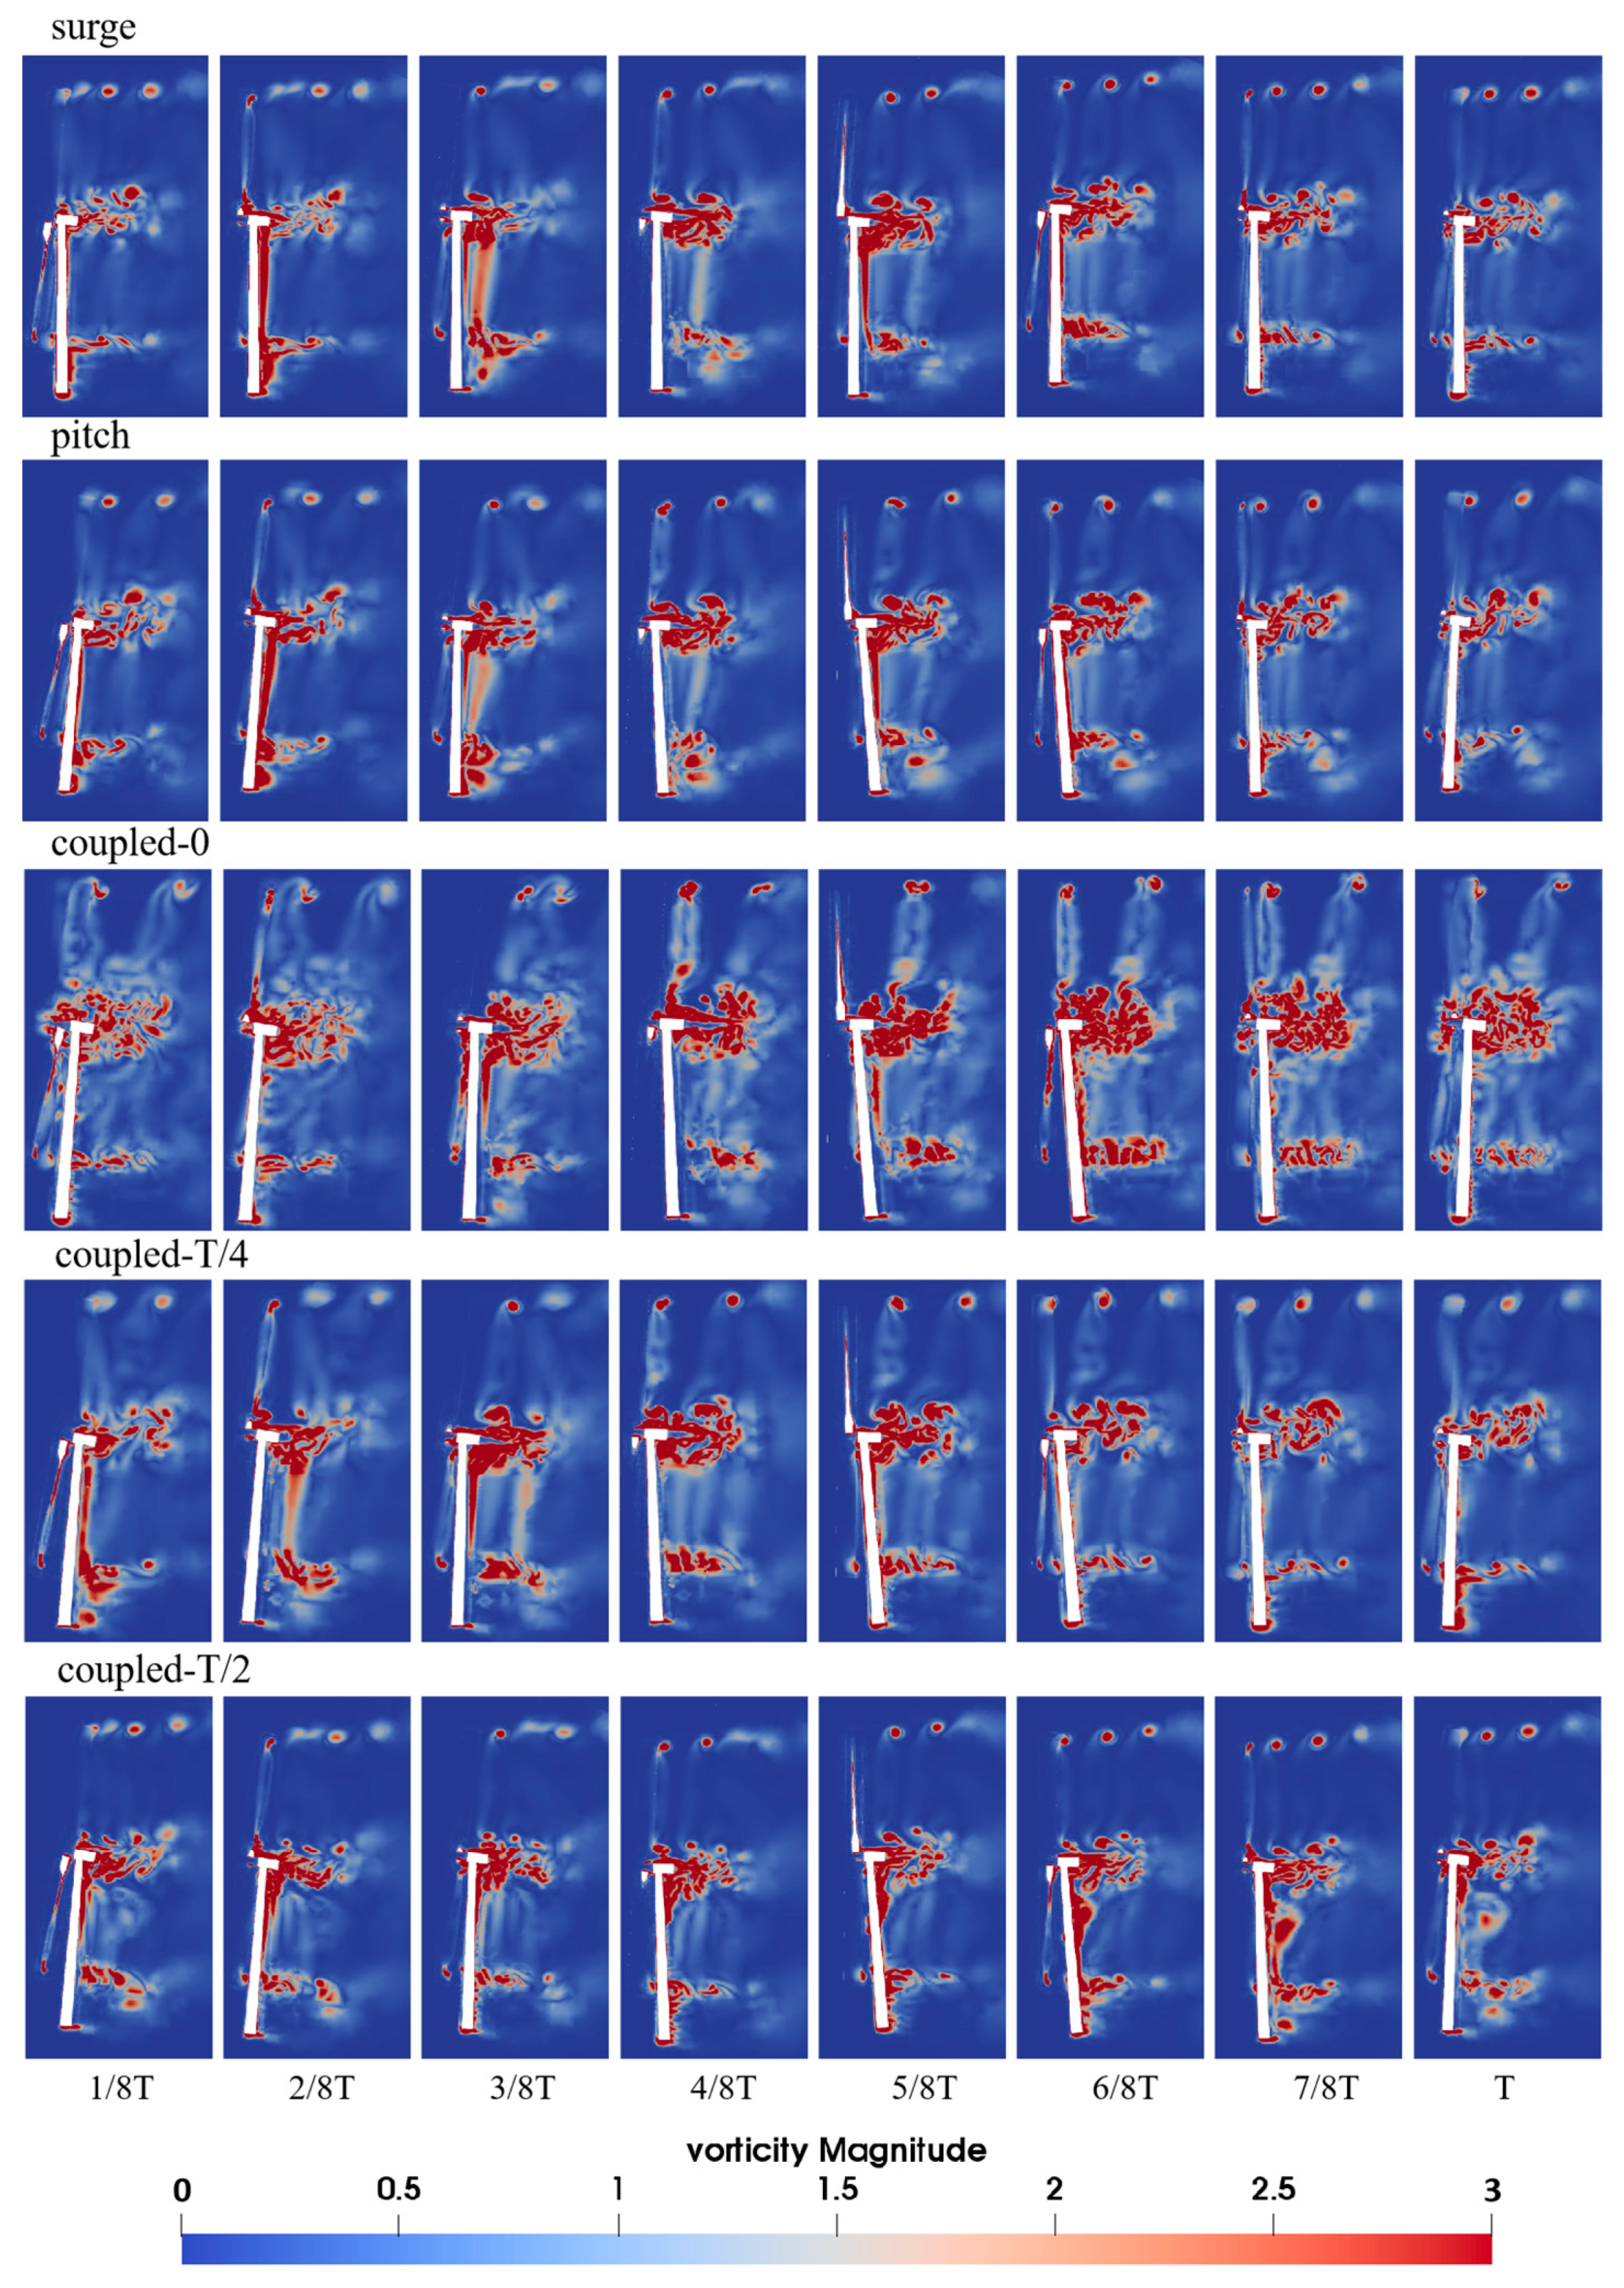
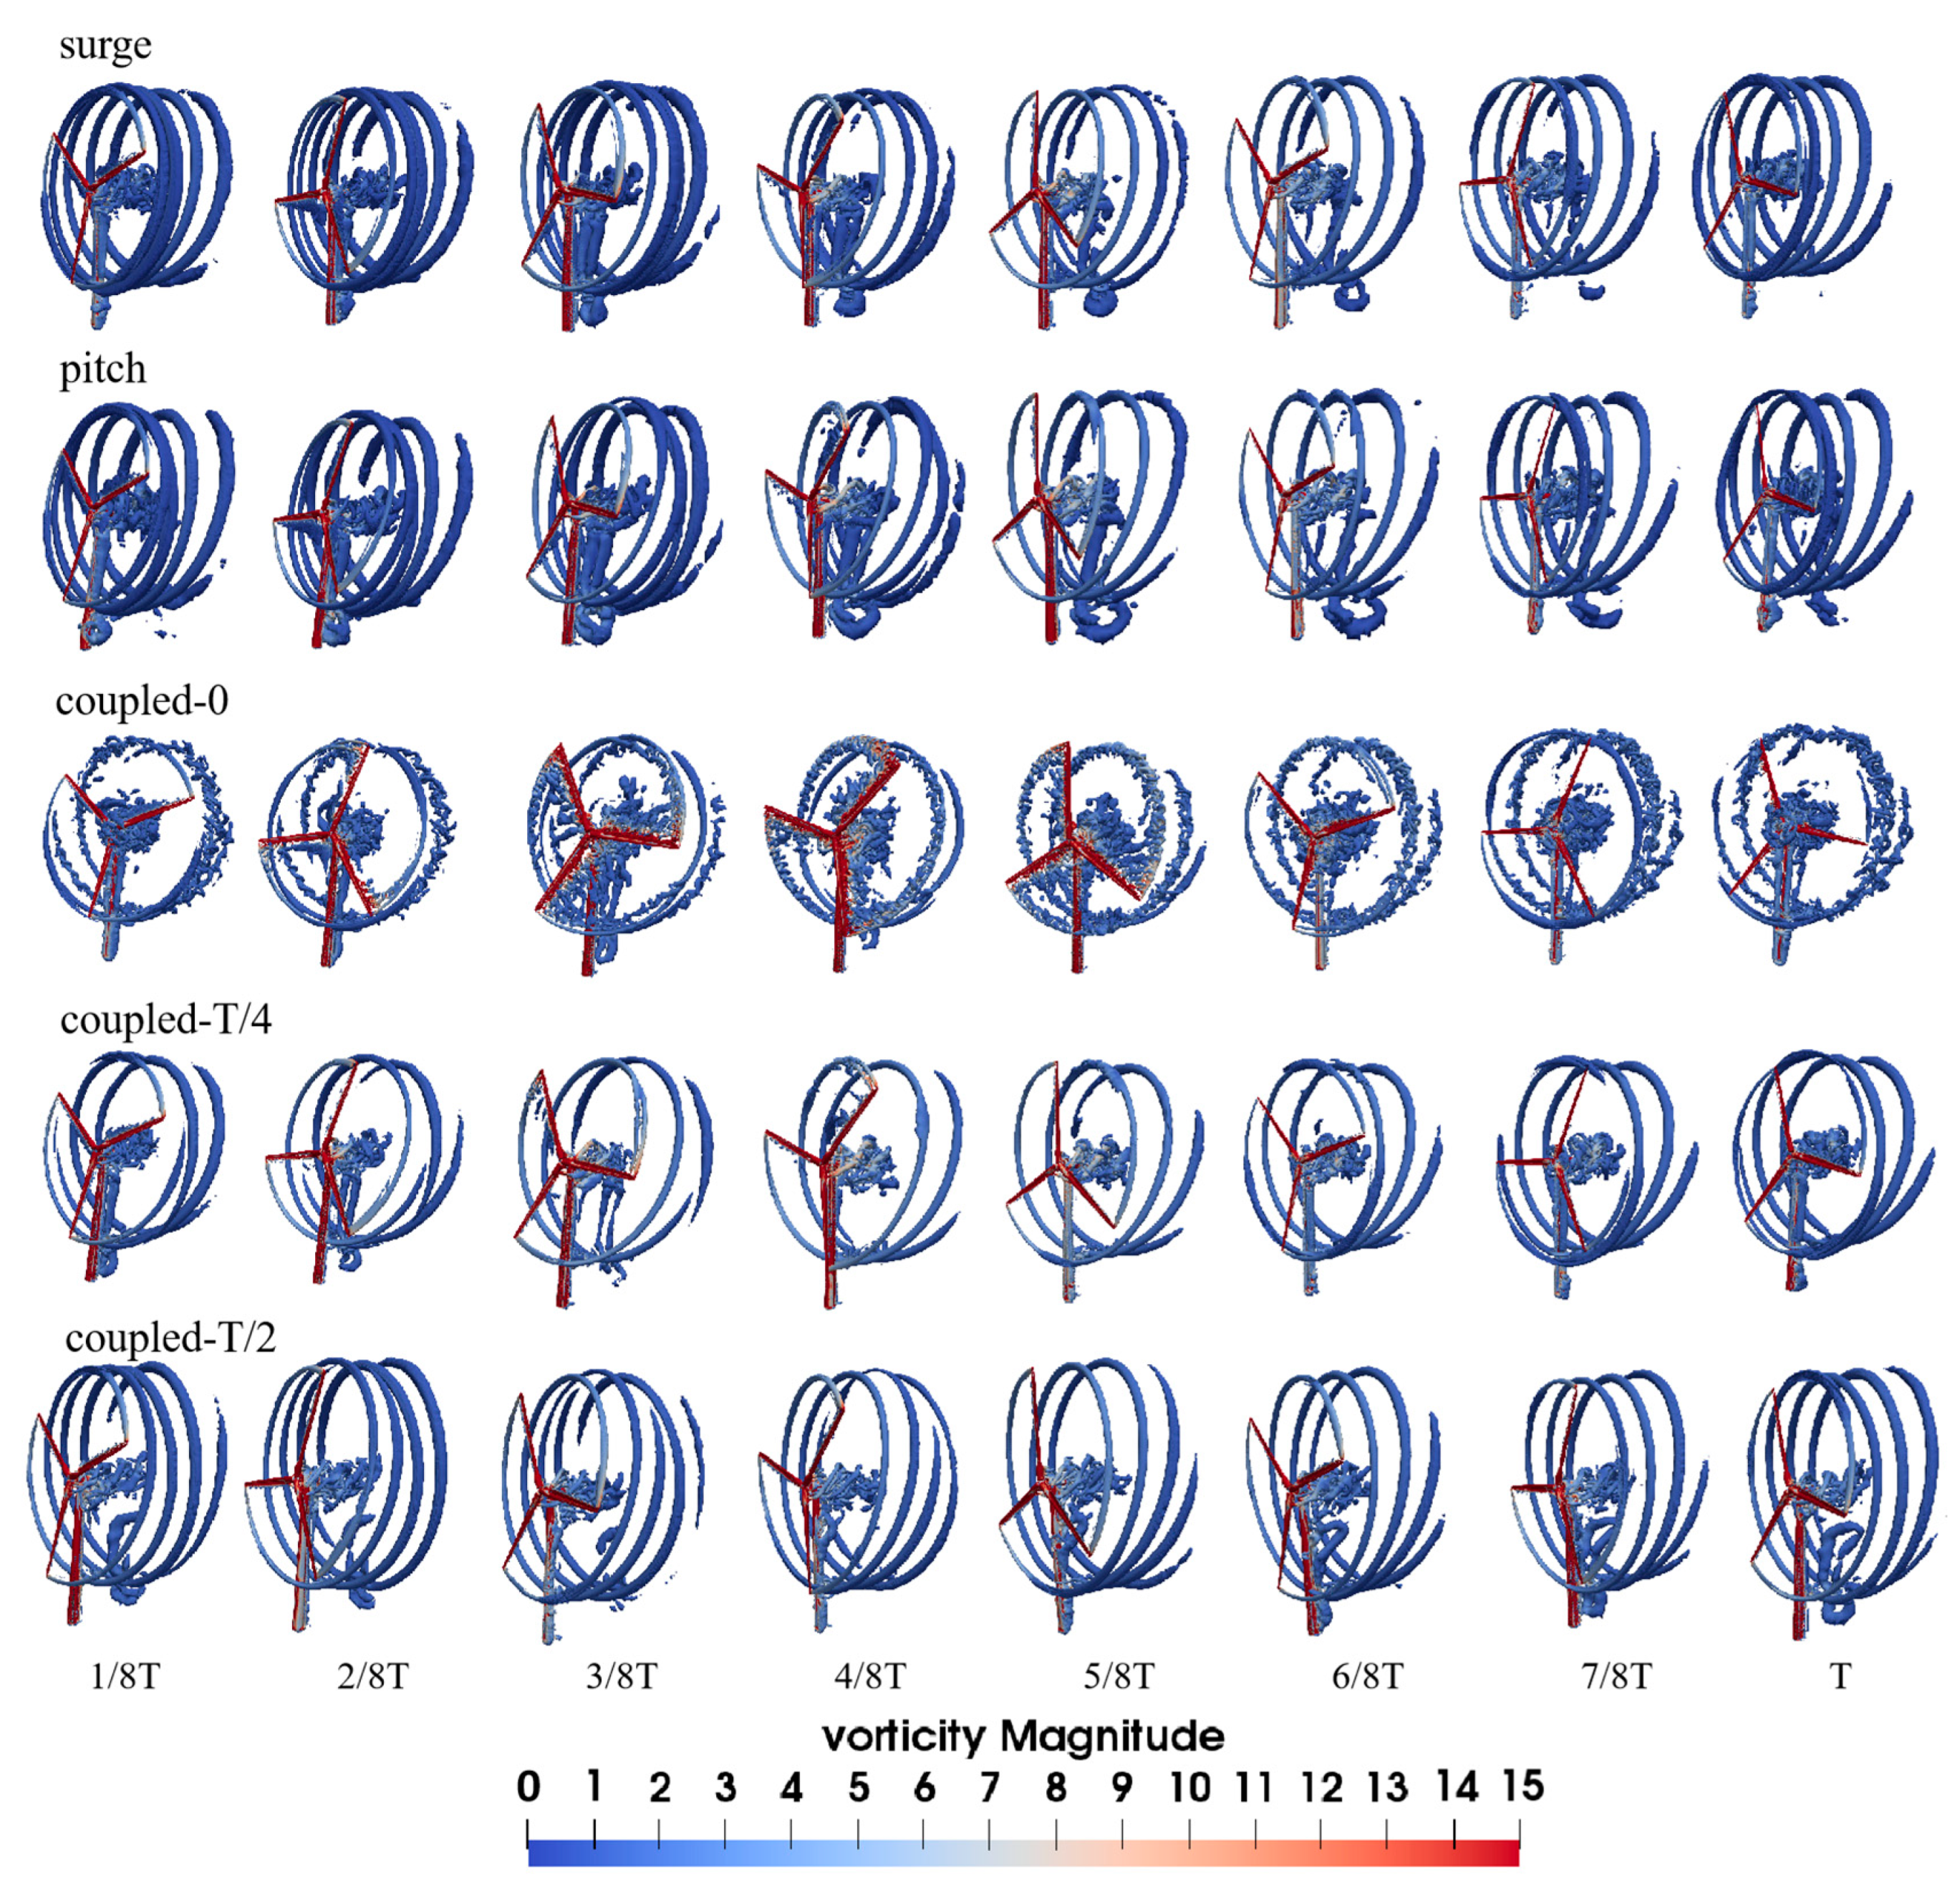
5.3. Vortex Characteristics behind Rotor
6. Conclusions
- (1)
- Different platform movements cause different rotor motion velocities, which affect the aerodynamic characteristics of the wind turbine, such as thrust, torque, and AOA. When the wind turbine is affected by the in-phase surge–pitch motion, the rotor load fluctuation amplitude is the largest, even resulting in negative thrust and torque. The amplitude of the wind turbine load change also decreases with the lag of the surge motion. When the surge motion lags by T/2, the amplitude of wind turbine load change is the smallest due to the counteracting effect between the surge and the pitch motion.
- (2)
- The wake velocity field changes dramatically under the influence of complex platform motion. When the amplitude of the platform motion is small, the velocity of the wake center is larger, and the velocity deficit in other regions is about 0.6. When the platform experiences the same phase-coupled surge–pitch motion, the wake center velocity fluctuates sharply, and the maximum velocity even exceeds the free flow velocity.
- (3)
- When the platform moves forward, the gap between blade tip vortices increases, and it decreases when it moves backward. When the forward motion speed of the wind turbine is high, the blade may experience dynamic stall and a large amount of vorticity shed along the whole blade. When the wind turbine moves backward with a higher velocity, the distance between blade tip vortices decreases and vortices even cross, resulting in interactions between vortexes. Moreover, when the wind turbine is undergoing the same phase-coupled surge–pitch motion, a large number of vortices gather behind the nacelle and gradually decrease with the lag of the surge motion.
Author Contributions
Funding
Data Availability Statement
Conflicts of Interest
References
- GWEC. Global Wind Report 2022; GWEC: Brussels, Belgium, 2022. [Google Scholar]
- Bossuyt, J.; Scott, R.; Ali, N.; Cal, R.B. Quantification of wake shape modulation and deflection for tilt and yaw misaligned wind turbines. J. Fluid Mech. 2021, 917, A3. [Google Scholar] [CrossRef]
- Fercak, O.; Bossuyt, J.; Ali, N.; Cal, R.B. Decoupling wind-wave-wake interactions in a fixed-bottom offshore wind turbine. Appl. Energy 2022, 309, 118358. [Google Scholar] [CrossRef]
- Kadum, H.; Rockel, S.; Hoelling, M.; Peinke, J.; Cal, R.B. Wind turbine wake intermittency dependence on turbulence intensity and pitch motion. J. Renew. Sustain. Energy 2019, 11, 053302. [Google Scholar] [CrossRef]
- Zhao, H.; Hu, Y.; Bi, C.; Li, X. Numerical study on hydrodynamic behaviors of and flow field around UHMWPE plane nets. Aquac. Eng. 2024, 106, 102397. [Google Scholar] [CrossRef]
- Hand, M.M.; Simms, D.A.; Fingersh, L.J.; Jager, D.W.; Cotrell, J.R.; Schreck, S.; Larwood, S.M. Unsteady Aerodynamics Experiment Phase VI: Wind Tunnel Test Configurations and Available Data Campaigns; Technical Report NREL/TP-500-29955; National Renewable Energy Lab.: Golden, CO, USA, 2001. [Google Scholar]
- Bartl, J.; Mühle, F.; Schottler, J.; Sætran, L.; Peinke, J.; Adaramola, M.; Hölling, M. Wind tunnel experiments on wind turbine wakes in yaw: Effects of inflow turbulence and shear. Wind Energy Sci. 2018, 3, 329–343. [Google Scholar] [CrossRef]
- Schottler, J.; Bartl, J.; Mühle, F.; Sætran, L.; Peinke, J.; Hölling, M. Wind tunnel experiments on wind turbine wakes in yaw: Redefining the wake width. Wind Energy Sci. 2018, 3, 257–273. [Google Scholar] [CrossRef]
- Wang, G.; Zhang, L.; Shen, W.Z. LES simulation and experimental validation of the unsteady aerodynamics of blunt wind turbine airfoils. Energy 2018, 158, 911–923. [Google Scholar] [CrossRef]
- Fontanella, A.; Bayati, I.; Mikkelsen, R.; Belloli, M.; Zasso, A. UNAFLOW: A holistic wind tunnel experiment about the aerodynamic response of floating wind turbines under imposed surge motion. Wind Energy Sci. 2021, 6, 1169–1190. [Google Scholar] [CrossRef]
- Dai, J.C.; Hu, Y.P.; Liu, D.S.; Long, X. Aerodynamic loads calculation and analysis for large scale wind turbine based on combining BEM modified theory with dynamic stall model. Renew. Energy 2011, 36, 1095–1104. [Google Scholar] [CrossRef]
- Zhong, W.; Shen, W.Z.; Wang, T.; Li, Y. A tip loss correction model for wind turbine aerodynamic performance prediction. Renew. Energy 2020, 147, 223–238. [Google Scholar] [CrossRef]
- Rodriguez, S.N.; Jaworski, J.W. Strongly-coupled aeroelastic free-vortex wake framework for floating offshore wind turbine rotors. Part 2: Application. Renew. Energy 2020, 149, 1018–1031. [Google Scholar] [CrossRef]
- Jeon, M.; Lee, S.; Lee, S. Unsteady aerodynamics of offshore floating wind turbines in platform pitching motion using vortex lattice method. Renew. Energy 2014, 65, 207–212. [Google Scholar] [CrossRef]
- Farrugia, R.; Sant, T.; Micallef, D. A study on the aerodynamics of a floating wind turbine rotor. Renew. Energy 2016, 86, 770–784. [Google Scholar] [CrossRef]
- Réthoré, P.; van der Laan, P.; Troldborg, N.; Zahle, F.; Sørensen, N.N. Verification and validation of an actuator disc model. Wind Energy 2014, 17, 919–937. [Google Scholar] [CrossRef]
- Micallef, D.; Ferreira, C.; Herráez, I.; Höning, L.; Yu, W.; Capdevila, H. Assessment of actuator disc models in predicting radial flow and wake expansion. J. Wind Eng. Ind. Aerodyn. 2020, 207, 104396. [Google Scholar] [CrossRef]
- Ravensbergen, M.; Bayram Mohamed, A.; Korobenko, A. The actuator line method for wind turbine modelling applied in a variational multiscale framework. Comput. Fluids 2020, 201, 104465. [Google Scholar] [CrossRef]
- Arabgolarcheh, A.; Jannesarahmadi, S.; Benini, E. Modeling of near wake characteristics in floating offshore wind turbines using an actuator line method. Renew. Energy 2022, 185, 871–887. [Google Scholar] [CrossRef]
- Wu, C.K.; Nguyen, V. Aerodynamic simulations of offshore floating wind turbine in platform-induced pitching motion. Wind Energy 2017, 20, 835–858. [Google Scholar] [CrossRef]
- Tran, T.; Kim, D.; Song, J. Computational Fluid Dynamic Analysis of a Floating Offshore Wind Turbine Experiencing Platform Pitching Motion. Energies 2014, 7, 5011–5026. [Google Scholar] [CrossRef]
- Kyle, R.; Lee, Y.C.; Früh, W. Propeller and vortex ring state for floating offshore wind turbines during surge. Renew. Energy 2020, 155, 645–657. [Google Scholar] [CrossRef]
- Cai, Y.; Zhao, H.; Li, X.; Liu, Y. Effects of yawed inflow and blade-tower interaction on the aerodynamic and wake characteristics of a horizontal-axis wind turbine. Energy 2023, 264, 126246. [Google Scholar] [CrossRef]
- Tran, T.T.; Kim, D. Fully coupled aero-hydrodynamic analysis of a semi-submersible FOWT using a dynamic fluid body interaction approach. Renew. Energy 2016, 92, 244–261. [Google Scholar] [CrossRef]
- Liu, Y.; Xiao, Q.; Ackermann, K.; Peyrard, C.; Wan, D. Establishing a fully coupled CFD analysis tool for floating offshore wind turbines. Renew. Energy 2017, 112, 280–301. [Google Scholar] [CrossRef]
- Zhou, Y.; Xiao, Q.; Liu, Y.; Incecik, A.; Ackermann, K.; Wan, D.; Pan, G.; Li, S. Exploring inflow wind condition on floating offshore wind turbine aerodynamic characterisation and platform motion prediction using blade resolved CFD simulation. Renew. Energy 2022, 182, 1060–1079. [Google Scholar] [CrossRef]
- Cai, Y.; Zhao, H.; Li, X.; Liu, Y. Aerodynamic analysis for different operating states of floating offshore wind turbine induced by pitching movement. Energy 2023, 285, 129538. [Google Scholar] [CrossRef]
- Ren, N.; Li, Y.; Ou, J. Coupled wind-wave time domain analysis of floating offshore wind turbine based on Computational Fluid Dynamics method. J. Renew. Sustain. Energy 2014, 6, 023106. [Google Scholar] [CrossRef]
- Huang, Y.; Wan, D. Investigation of Interference Effects Between Wind Turbine and Spar-Type Floating Platform Under Combined Wind-Wave Excitation. Sustainability 2020, 12, 246. [Google Scholar] [CrossRef]
- Aliyar, S.; Ducrozet, G.; Bouscasse, B.; Bonnefoy, F.; Sriram, V.; Ferrant, P. Numerical coupling strategy using HOS-OpenFOAM-MoorDyn for OC3 Hywind SPAR type platform. Ocean Eng. 2022, 263, 112206. [Google Scholar] [CrossRef]
- Cheng, P.; Huang, Y.; Wan, D. A numerical model for fully coupled aero-hydrodynamic analysis of floating offshore wind turbine. Ocean Eng. 2019, 173, 183–196. [Google Scholar] [CrossRef]
- Tran, T.T.; Kim, D. The coupled dynamic response computation for a semi-submersible platform of floating offshore wind turbine. J. Wind Eng. Ind. Aerodyn. 2015, 147, 104–119. [Google Scholar] [CrossRef]
- Guo, Y.; Wang, X.; Mei, Y.; Ye, Z.; Guo, X. Effect of coupled platform pitch-surge motions on the aerodynamic characters of a horizontal floating offshore wind turbine. Renew. Energy 2022, 196, 278–297. [Google Scholar] [CrossRef]
- Arabgolarcheh, A.; Rouhollahi, A.; Benini, E. Analysis of middle-to-far wake behind floating offshore wind turbines in the presence of multiple platform motions. Renew. Energy 2023, 208, 546–560. [Google Scholar] [CrossRef]
- Jasak, H. Error Analysis and Estimation for the Finite Volume Method with Applications to Fluid Flows. Ph.D. Thesis, Imperial College London, University of London, London, UK, 1996. [Google Scholar]
- Menter, F.R. Review of the shear-stress transport turbulence model experience from an industrial perspective. Int. J. Comput. Fluid D 2009, 23, 305–316. [Google Scholar] [CrossRef]
- Philippe, M.; Babarit, A.; Ferrant, P. Modes of response of an offshore wind turbine with directional wind and waves. Renew. Energy 2013, 49, 151–155. [Google Scholar] [CrossRef]
- Fugro GEOS. Wind and Wave Frequency Distributions for Sites Around the British Isles; OTO Report 01030; HSE Books: Norwich, UK, 2001. [Google Scholar]


| Turbine | Value |
|---|---|
| Rated power (MW) | 5 |
| Rotor diameter (m) | 126 |
| Hub diameter (m) | 3 |
| Hub height (m) | 90 |
| Cut-in wind speed (m/s) | 3 |
| Rated wind speed (m/s) | 11.4 |
| Cut-out wind speed (m/s) | 25 |
| Cut-in rotor speed (rpm) | 6.9 |
| Rated rotor speed (rpm) | 12.1 |
| Rated tip speed (m/s) | 80 |
| Label | Surge Amplitude (m) | Surge Period (s) | Pitch Amplitude (deg) | Pitch Period (s) | Surge Lags Period |
|---|---|---|---|---|---|
| surge | 7.07 | 8.1 | - | - | - |
| pitch | - | - | 4.95 | 8.1 | - |
| coupled-0 | 7.07 | 8.1 | 4.95 | 8.1 | 0 |
| coupled-T/4 | T/4 | ||||
| coupled-T/2 | T/2 |
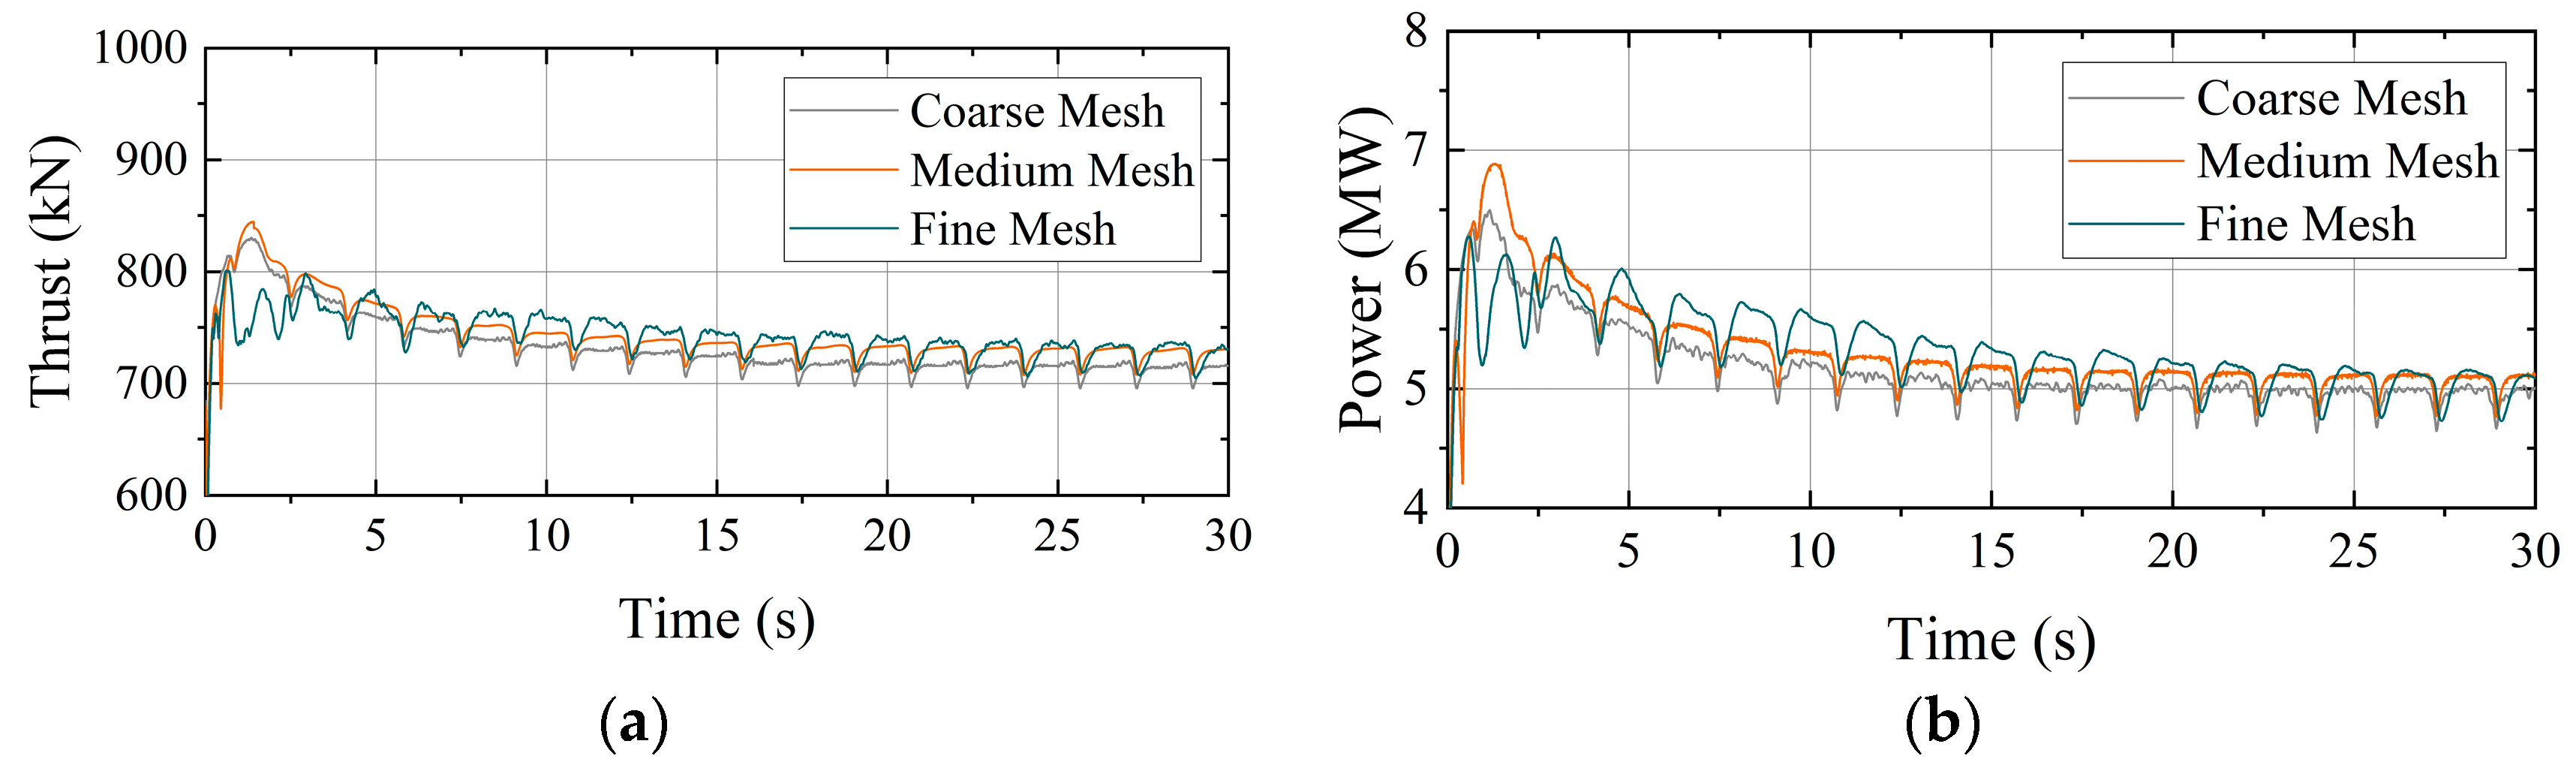
| Grid | Mesh Number (in Million) | Thrust (kN) /Relative Error | Power (MW)/ Relative Error | Simulation Time per Time Step (s) |
|---|---|---|---|---|
| Coarse | 2.24 | 713.96/2.10% | 5.005/2.34% | 3.88 |
| Medium | 3.43 | 727.74/0.22% | 5.119/0.12% | 5.32 |
| Fine | 4.08 | 729.31/0.00% | 5.125/0.00% | 6.54 |
Disclaimer/Publisher’s Note: The statements, opinions and data contained in all publications are solely those of the individual author(s) and contributor(s) and not of MDPI and/or the editor(s). MDPI and/or the editor(s) disclaim responsibility for any injury to people or property resulting from any ideas, methods, instructions or products referred to in the content. |
© 2024 by the authors. Licensee MDPI, Basel, Switzerland. This article is an open access article distributed under the terms and conditions of the Creative Commons Attribution (CC BY) license (https://creativecommons.org/licenses/by/4.0/).
Share and Cite
Leng, S.; Cai, Y.; Zhao, H.; Li, X.; Zhao, J. Study on the near Wake Aerodynamic Characteristics of Floating Offshore Wind Turbine under Combined Surge and Pitch Motion. Energies 2024, 17, 744. https://doi.org/10.3390/en17030744
Leng S, Cai Y, Zhao H, Li X, Zhao J. Study on the near Wake Aerodynamic Characteristics of Floating Offshore Wind Turbine under Combined Surge and Pitch Motion. Energies. 2024; 17(3):744. https://doi.org/10.3390/en17030744
Chicago/Turabian StyleLeng, Shudong, Yefeng Cai, Haisheng Zhao, Xin Li, and Jiafei Zhao. 2024. "Study on the near Wake Aerodynamic Characteristics of Floating Offshore Wind Turbine under Combined Surge and Pitch Motion" Energies 17, no. 3: 744. https://doi.org/10.3390/en17030744
APA StyleLeng, S., Cai, Y., Zhao, H., Li, X., & Zhao, J. (2024). Study on the near Wake Aerodynamic Characteristics of Floating Offshore Wind Turbine under Combined Surge and Pitch Motion. Energies, 17(3), 744. https://doi.org/10.3390/en17030744