Abstract
High voltage connections will discharge through inductive voltage and combined transformers when they are switched off. In the past, there was a wide margin between the required capabilities and the actual capabilities of these components. Nowadays, however, this aspect is becoming more prominent due to a higher penetration by cable systems into the grid. Currently, none of the relevant international standards contain any definitions or requirements for line discharge, nor test methods which would validate the ability of the transformer to discharge a line of certain capacitance at a certain voltage. This is why the aim of this paper is to provide a foundation for how to specify, assess and verify the capacitive discharge performance of instrument transformers. This paper will present the basic theory, influencing parameters, multiple test sequences and acceptance criteria for cable discharge. It is clear that capacitive discharges present both thermal and mechanical stress to the unit, which is why this paper will detail how to guarantee both aspects. The idea is that this paper serves as a literal blueprint which can then be transferred to the relevant clauses in upcoming international standards. All conclusions within this paper are achieved through calculations and testing on actual 123 kV inductive voltage transformers and combined units.
1. Introduction
When switching off an unloaded line or cable circuit with a circuit-breaker, the circuit voltage is at its crest value at the moment of current interruption and the capacitance of the line remains charged at that voltage []. Furthermore, in the case of a fault within the power grid, there is a danger of a significant overvoltage once the power is switched back on after the fault has been cleared []. The trapped charge will always discharge through the path of minimal resistance, which can cause inadvertent damage to connected devices and systems, especially if the number of switching operations is large []. For that reason, it is of interest for every transmission system operator to ensure adequate means for discharging overhead lines or cable systems.
Naturally, the higher the equivalent capacitance of the system, the higher the energy amount of trapped charge which needs to be removed from the system. This fact makes cable systems even more demanding for discharging []. Since the penetration by cable systems is as prominent as ever, additional emphasis should be placed on the safe removal of trapped charge from the power system. Reference [] gives very useful information on the discharge behavior of different combinations of cable and overhead line systems if there is not an adequate way for their discharge. An example is given for different combinations at 145 kV. It is shown that the discharge time varies between approximately 5 and 25 min, depending on the combinations. Naturally, the length of the “natural discharge” increases as the content of the cable conductors increases.
It is a known fact that inductive voltage and combined transformers are recognized as an adequate solution for line discharge due to a typically very fast decay of trapped charge in the literature, such as [,,].
However, there is little guidance available on how to define, verify and quantify the performance of instrument transformers in discharge conditions. Additionally, the discharge capability of instrument transformers is not defined by relevant standards [,,,].
Most of the available literature dates back to over 50 years ago. An article [] from 1969 recognizes the behavior of a potential transformer during discharge and the idea behind it, but does not go into depth when presenting limiting factors nor does it propose any testing sequence. Similarly, a newer reference [] from 1992 justifies the usage of a simplified circuit for testing and gives some suggestions for the main parameters for proposed testing approaches, but does not go into detail about acceptance criteria.
In a more recent article [], the authors gave an overview of a proposed testing method, which will be presented throughout this article as well. However the main focus of this paper is to give more context around the entire discharge process, providing more information about the dependence of the discharge parameters and including different units in the discharge tests, while specifying exact test sequences and acceptance criteria, which were not proposed before.
It should be noted that the cable discharge not only presents thermal stress to the instrument transformer, but it is also the most critical occurrence for it to mechanically withstand high-voltage winding. As a rule of thumb, it can be said that the discharge current is typically at least one order of magnitude higher than a short circuit current originating from a secondary short-circuit on the same unit [].
With that in mind, there are two aims to this paper. The first is to present the basic parameters of a capacitive discharge, such as dependency on transformer design (resistance and inductance), as well as on system parameters (discharge voltage and capacitance), which will be carried out through a combination of measurements and calculations. The second aim is to present a testing sequence and acceptance criteria to verify the ability of an instrument transformer to discharge a line of a certain capacitance. All conclusions in this paper will be presented on three actual transformer samples, two inductive transformers and one combined unit (of the inductive type for the voltage transforming part), all at 123 kV. The main parameters of the units considered within this paper are given in Table 1, with the units shown in Figure 1. It should be noted that units 1 and 2 were not designed specifically for any line discharge requirement, while unit 3 was designed for line discharge of 8 µF at √3∙123 kV.

Table 1.
Basic parameters of units considered.
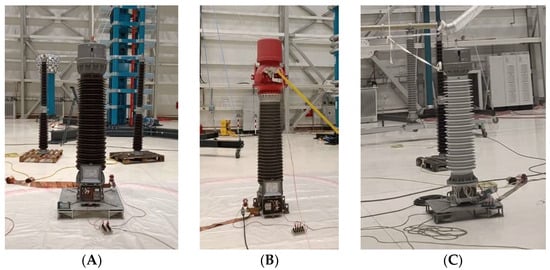
Figure 1.
Units considered within this paper with parameters as per Table 1; (A) unit 1, (B) unit 2, (C) unit 3.
2. Main Principles and Influencing Parameters of Line Discharge
This paper will give a theoretical overview of capacitive discharge and provide the main influencing parameters that need to be considered. The variation in influencing parameters is based on a saturated, linear numerical model that was presented and verified in []. While non-linear numerical models can be used, they add little value for this purpose, as the core of the transformer is heavily saturated, as explained in references [,,]. The basic equivalent diagram of capacitive discharge and the model used (as drawn in ATPDraw software, Windows version 5.5) in this paper are given in Figure 2.
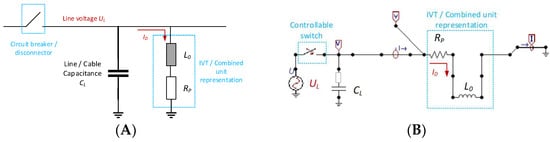
Figure 2.
Line discharge: (A) equivalent diagram, (B) linear numerical model.
Once the line is switched off, the circuit voltage is at its crest value at the moment of current interruption and the capacitance of the line remains charged at that voltage (UL). Consequently, the discharge current ID starts flowing through the primary winding of the connected instrument transformer into the ground. The typical wave shape of that current is of aperiodic damped oscillation, provided the resistance RP is high enough []. The peak value of the discharge current is defined by the line capacitance (CL), line voltage () and the resistance of the primary winding (RP). This chapter will showcase the influence of all these parameters. The discharge current is responsible for mechanical stress in the primary winding [,].
The second aspect of every discharge activity is the discharge energy. Discharge energy (ED) is dissipated along the primary winding as excess heat that causes an adiabatic temperature rise of the winding. Discharge energy is equal to the energy contained in the electric field of the capacitance CL and can be estimated by Equation (1).
Equation (2) is used to assess the winding temperature rise () as a result of one discharge under adiabatic conditions. Here, m is the total mass of the primary winding conductor, and c is the thermal capacitance of the conductor material (either copper or aluminum).
The first considered parameter is the capacitance CL, which is defined by the system configuration []. This value depends on the length of conductors, their type, spacing between phases and the ratio of cable and overhead lines. It is also important to look at the amount of installed voltage transformers in a connection, since it is common practice to have one on each side of a connection, so that the current will actually be divided.
Based on this, the exact value is difficult to predict accurately. Some guidance is shown in Table 2, based on the withdrawn IEC 60056 standard []. These values provide an excellent starting point for defining the required value of capacitance. However, a larger penetration by cable systems is expected in modern grids, especially at lower voltages, so the realistic values may be higher. It is advisable to check the connection capacitances with the grid development department.
Table 2.
Values of CL from different sources.
This only means that individual utilities are responsible for analyzing typical configurations of their network and using that data to define the capacitance values that an instrument transformer should discharge. Another important aspect is the approximate number of consecutive discharges, which depends on how the grid is operated. It is also advisable to communicate with the manufacturers so that a realistic grasp of what is feasible is obtained. The best approach is to tie a singular value of capacitance to a voltage level Um, and the requested capacitance values, which consider a combination of cable and overhead lines are given in Table 2. As expected, these requirements are higher than what was historically advised in [].
Figure 3 shows the influence of capacitance on all relevant discharge parameters. The basis for this analysis, as well as others within this chapter is unit 1, as per Table 1. As can be seen, the peak value of current ID has a nonlinear relationship with capacitance CL, but a higher capacitance also contributes to a higher current. On the other hand, the total energy ED has a linear relationship with capacitance, which is logical from Equation (1). In short, this means that a discharge of a higher capacitance value of capacitance will also cause a higher temperature rise in the winding. Furthermore, as seen in Figure 3B, a higher capacitance will take a longer time to discharge. In the considered case, the difference can be as high as 400 ms.
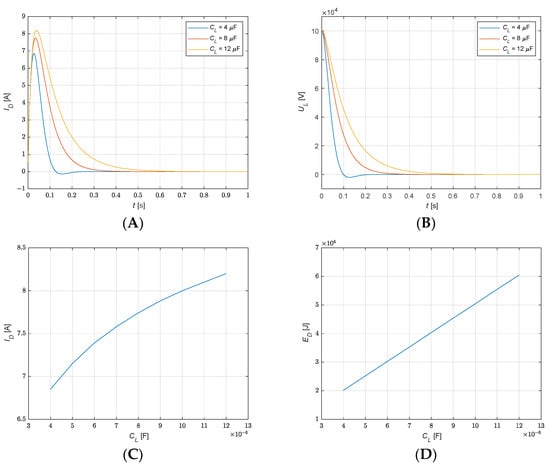
Figure 3.
Dependance of discharge parameters on CL. (A) Discharge current waveshapes, (B) discharge voltage waveshapes, (C) ID dependance on CL, (D) ED dependance on CL.
The next considered parameter is the line voltage UL. The dependance of the relevant discharge parameters is shown in Figure 4. As expected, discharge current increases linearly with voltage, while total discharge energy increases with the square of the voltage, as does the temperature rise in the winding. This means that the rated voltage factor (Fv) has a drastic influence on both the thermal and mechanical aspects of capacitive discharge. Fv is a consequence of how the system grounding is executed, and consequently what is the maximal voltage a conductor can rise to during a fault on adjacent phases. The calculation performed considered the rated Fv inherited from standards [,] (i.e., 1.5 and 1.9, respectively). However, the maximum voltage that may be expected will be up to either 1.4 or 1.73 per unit, depending on the grounding of the system, with the extra 10% (e.g., the difference between 1.4 and 1.5) attributed to a margin in flux density which is important for cable discharge. For that reason, the recommendation is to use 1.4 and 1.73 as the referent voltage for cable discharge performance verification []. It should be noted that, while the decay profile differs with the voltage, the curve will reach zero at exactly the same time, meaning that UL has a negligible effect on the efficiency of the discharge.
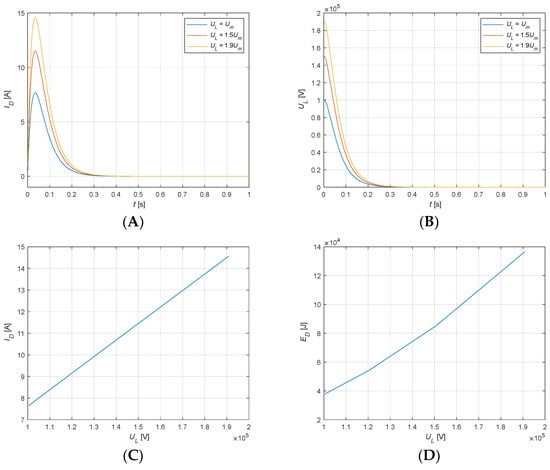
Figure 4.
Dependance of discharge parameters on UL. (A) Discharge current waveshapes, (B) discharge voltage waveshapes, (C) ID dependance on UL, (D) ED dependance on UL.
The last parameter considered is the geometry of the winding. While the effect of RP and L0 could be analyzed separately, it is not completely realistic, as the two parameters are geometrically linked. For that reason, both parameters are connected to the total number of turns of the primary winding w []. It is assumed that R~w and L0 ~w2. Otherwise, the relationship between resistance and discharge current would be linear []. The first conclusion that can be drawn from Figure 5 is that the energy of the discharge does not depend on the transformer design. Naturally, the different geometries of the winding and the overall resistance will influence the temperature rise, but not the energy itself. On the other hand, the value of the discharge current is influenced by the winding design, with a decaying square relationship with the total number of turns. Logically, a higher value of RP and L0 will limit the current ID. On the other hand, a higher number of turns will also mean a longer discharge voltage decay time. There are two main conclusions that can be drawn from this. The first is that different designs of instrument transformers will have a different discharge performance for the same system conditions. The second is that it is recommended to use the value of resistance at 20 °C when performing thermal and mechanical analyses as it will give a slightly higher discharge current.
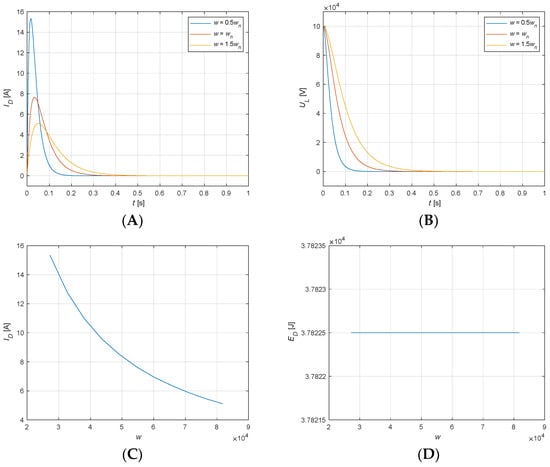
Figure 5.
Dependance of discharge parameters on winding geometry. (A) Discharge current waveshapes, (B) discharge voltage waveshapes, (C) ID dependance on winding geometry (D) ED dependance on winding geometry.
3. Test Sequence for Verifying Capacitive Discharge Capability
From data presented in the previous chapter, it is clear that there is a multitude of influencing parameters on line discharge. Since the rated withstand parameters (i.e., mechanical stress due to current ID and winding temperature rise) are determined both by system parameters and transformer design, it is not recommended to specify line discharge as a type test. Furthermore, not all transformers necessarily need to be dimensioned for cable discharge. For that reason, cable discharge should be introduced into standards [,,,] as a special test. In addition, as indicated in [], accurate models of line discharge exist, and can be used to verify the thermal performance accurately []. It is also true that there is not a lot of data on the mechanical withstand of instrument transformers under discharge currents, which is a much larger mechanical stress than the short-circuit conditions for which instrument transformers are commonly designed and verified [,]. The applicability of mechanical withstand calculations between different designs would be proprietary to each manufacturer and a subject of mutual agreement.
The authors of this paper performed substantial research and defined several possible test sequences to verify the performance of instrument transformers during capacitive discharge. While multiple approaches are suitable for individual specifications of a utility, a standard should define a single referent sequence if possible. For that reason, this paper will contrast different testing approaches and provide a recommendation as to which sequence should be used, and what the recommended test parameters and acceptance criteria are.
3.1. Proposed Testing Approaches and Test Circuit
It is clear that both the thermal and mechanical aspects of transformer performance need to be verified during capacitive discharge; therefore, the proposed test approaches need to reflect that. The main parameters of the proposed approaches used as input data for this paper are given in Table 3, where Um represents the rated voltage level.
Table 3.
Main parameters of capacitive discharge tests.
The first approach divides the testing into two separate sequences, thermal and mechanical. The main difference between the two is the level of applied voltage and the number of consecutive discharges. As discussed in the previous chapters, a higher test voltage will result in a higher current ID and consequently higher mechanical stress, while the higher number of consecutive discharges will result in a higher cumulative temperature rise in the windings. However, it should be noted that while the heating of the winding is immediate and adiabatic conditions can be assumed, the cooling rate of each unit depends on its thermal constant and the elapsed time. The most conservative approach is to test with a short time between discharges. For practical reasons, the test time between two discharges should be determined by practical aspects (i.e., circuit charging time, recording of cooling curves, data logging, etc.,) and should ideally be under 5 min, and should under no circumstances exceed 10 min. This will be illustrated in the later chapters of the paper.
Alternatively, the second approach combines both previously mentioned sequences into a single test by specifying three consecutive discharges at Fv ∙ ∙ Um. The assumption based on Equation (1) is that three consecutive discharges will produce a similar amount of total energy as eight discharges at lower voltage, while simultaneously incurring maximal mechanical stress on the unit. This approach is also corroborated by the fact that three consecutive tests with asymmetric current are used when performing short-circuit tests on power transformers []. When comparing the two approaches, the first is more practical for situations when a larger number of consecutive discharges is expected. However, this test lasts longer, and requires an intermediate check of the transformer parameters between the two tests, which complicates test execution. The second approach is more strenuous from both thermal and mechanical aspects and at the same time simpler and quicker to execute. While both are considered applicable, it is the opinion of the authors that the second approach should be used as the referent for inclusion into international standards.
Regardless of the test approach used, the test circuit remains conceptually the same. The test circuit used on all tests presented within this paper is shown in Figure 6. The basic principle is that a combination of capacitance of an impulse generator is used to achieve the required capacitance CL. That configuration is then charged at the required voltage through a step-up transformer. By connecting the controllable spark gap, the trapped charge is discharged over the test object. The discharge current is measured at the shunt connected to the end of the primary winding. A similar approach was used in []. What is not shown in the diagram is the DC circuit for recording the cooling curve of the winding. This is a same, well-known circuit commonly used when performing conventional temperature rise tests, so it was not specifically listed here.
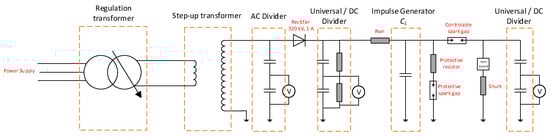
Figure 6.
Schematic representation of the circuit used.
3.2. Acceptance Criteria
Again, the acceptance criteria have to reflect both the mechanical and thermal aspect of capacitive discharge. Naturally, basic checks should be performed (visual checks, analyses of current and voltage wave forms, etc.). Mechanical withstand should be proven experimentally, by repeating an array of routine tests.
The mechanical impact on the primary winding can be quantified through two main tests. The first is the error measurement. This approach is analogous with the leakage impedance measurement of power transformers []. As mentioned in [], voltage and phase errors of a voltage or combined transformer are dependent on the transformer geometry. If that geometry changes, so does the accuracy. For short-circuit tests, standards [,,] allow an error difference of less than half the accuracy limits of each respective class (e.g., ±0.1% and ±5 min for accuracy class 0.2). It should be noted that during short-circuit tests, which are the closest in terms of mechanical strain to this test, both windings are stressed, whereas during discharge, only the primary winding is stressed. Furthermore, assuming the unit is built for a low accuracy class (e.g., 3P), this would allow for very high errors to be recorded, which is why it is advisable to use the values given above as representative, independently of the rated designated accuracy class.
Since the primary winding typically has a very high number of individual turns (e.g., 50,000 or higher), accuracy alone is not an adequate criterion, since a single turn can theoretically be displaced or deformed. For that reason, partial discharge measurements in conjunction with power frequency withstand test need to be taken. Moreover, it is advisable to use a stricter criterion for partial discharges, specifically less than 10 pC at power frequency withstand voltage, as suggested in []. Furthermore, for this purpose no reduction in pre-stress voltage should be allowed.
In terms of thermal withstand, it should be assumed that, in a real operation, the unit is at its rated temperature rise and maximal ambient temperature. The total temperature rise of the discharge is then superimposed to that value. Since it can be assumed that the temperature rise during discharge is adiabatic, the conservative approach is to simply add the temperature rise of all recorded discharges. The same assumption is used when assessing the thermal withstand during short circuit tests []. While the measurement of cooling curves is a valuable data resource, it can be argued that temperature rise calculated using Equation (2) is sufficient []. For the sake of practicality, it is advisable to use the same criteria for the temperature rise in winding as with the short circuit. While less current intensive, a short-circuit test is typically longer lasting test than a capacitive discharge, typically lasting 1 or 2 s []. In short, the total temperature rise in a winding during consecutive discharges can be calculated using
and has to be under 200 °C for aluminum conductors and 250 °C for copper conductors [].
In the above equation, θ1 is the final temperature of the winding, while θ0 is the starting temperature before discharge, n is the number of consecutive discharges and θi is the temperature rise of one discharge, obtained either through measurement or calculation. For practicality, it is advisable to use the maximal allowed temperature rise in the winding for the temperature rise class as defined in [,], either 55 K or 65 K, respectively.
It is advisable to perform the above-mentioned tests at the end of both the thermal and mechanical sequence of approach 1, as both incur thermal and mechanical stress. It is sufficient to perform the tests at the end of the complete test sequence for approach 2. Additionally, it is also highly advisable to perform the dissolved gas analyses at the end of a testing sequence. The gases to typically pay attention to are acetylene (for arcing discharge) or CO and CO2 for thermal damage. The criteria from IEC 61181, Table B.1 are recommended to be used in this instance []. Other optional tests, such as frequency response or winding resistance measurement can be added as optional but should not be mandatory. The summary of all acceptance criteria is given in Table 4.
Table 4.
Acceptance criteria summary.
4. Capacitive Discharge Test Results on Considered Units
This chapter will use tests performed on units specified in Table 1 to illustrate different points and stipulations given in chapters 2 and 3. All units were tested for capacitive discharge of 8µF at 123 KV level, as per Table 2.
The first stipulation that is worth re-checking is the accuracy of the model used in chapter 2. An illustration of model accuracy is shown in Figure 7, which shows calculated and measured waveforms for ID and UL for the first discharge of the thermal test performed on unit 1. The test results are in line with the expectation showcased in [], which again verified the model as adequate.
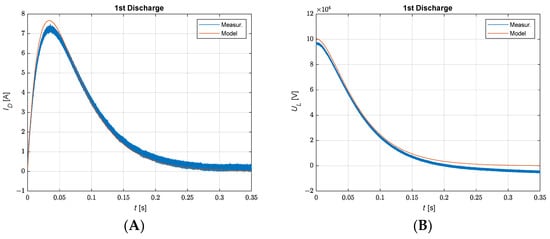
Figure 7.
Comparison of measured and modelled discharge parameters. (A) Discharge current waveshapes, (B) discharge voltage waveshapes.
The second stipulation is the difference between temperature rise in the thermal portion of the first test and the combined sequence. Again, this is showcased on unit 1. Figure 8 shows the comparison of cooling curves recorded during both tests. A ten-minute recording period was used between discharges in both cases. Since the test duration was not equal, with the thermal test lasting roughly 83 min and mechanical test lasting 30 min, the duration on the horizontal axis of Figure 8 is specified relatively. Further analysis of the data is given in Table 5. There are several conclusions that can be drawn from this data. The first is that using simple calculations gives results for individual discharges very comparable to measured values (roughly 10% difference). The second is that the combined test sequence yields a greater temperature rise than the thermal test sequence. The third conclusion is that if adiabatic conditions are assumed, all approaches yield similar values of θ1. The assessment was performed assuming an average winding temperature rise of 65 K and ambient temperature of 40 °C.
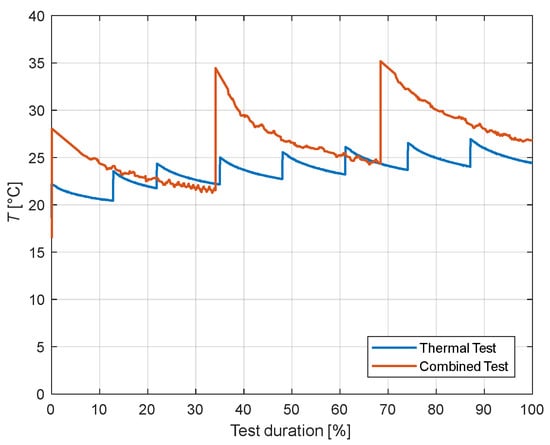
Figure 8.
Cooling curve comparison for thermal and combined test.
Table 5.
Thermal comparison of different tests.
This approach is the most conservative and, in the authors’ opinion, should be used to verify the thermal withstand aspect of capacitive discharge. It is clear that, depending on the cooling time allowed, the actual temperature rise in successive discharges can be drastically smaller than when adiabatic conditions are assumed. Additionally, if the effect of cooling is neglected, there is no need to record the cooling curves, making thermal calculation sufficient to verify the thermal withstand, which simplifies the testing circuit and procedure.
The next point this paper tries to make is that the mechanical aspects of capacitive discharge may be worse than the thermal ones. Units 1 and 2 will be used to make this point. This will be achieved solely through the analysis of the disclosed parameters, as a numerical analysis of forces and mechanical withstand would exceed the scope of this paper and was indicatively performed in reference []. The relevant parameters of both units are given in Table 6.
Table 6.
Discharge parameters of units 1 and 2 during thermal and mechanical tests.
The main reason the two are compared is due to the fact that unit 2 did not satisfy the mechanical test, and suffered winding collapse at first discharge. When we compare the parameters of both units, it is clear that the discharge current is approximately 35% higher for the same CL of 8 µF, which also indicates a higher mechanical stress on the primary winding. On the other hand, it is clear that, due to its construction (larger conductor cross section), the unit is less thermally stressed. In the end, both units are thermally far removed from the limit proposed in Table 4. That being said, it is clear that the mechanical aspect is more perilous. It is worth noting that some mechanical effects were visible in the accuracy class measurements performed on unit 2 after the thermal test. This only proves that this is an adequate acceptance criterion. Furthermore, the extent of damage is shown in Figure 9, and this corresponds to the trends observed during electric measurements.
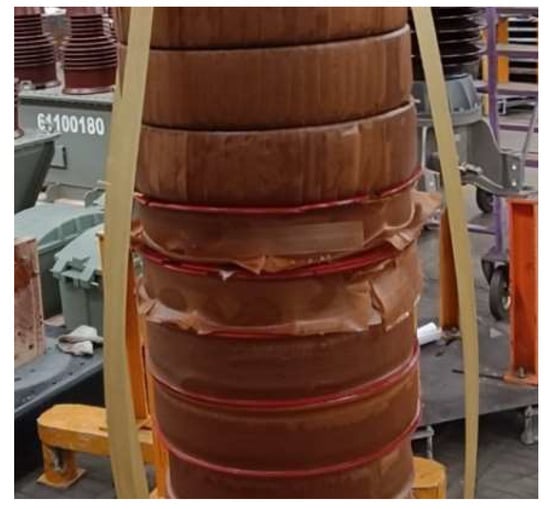
Figure 9.
Mechanical damage to the primary winding of unit 2.
With all the considerations above taken into account, it was decided to use unit 3 as the benchmark for the recommended testing sequence. That being said, unit 3 was tested only in the combined test sequence with the assumption of adiabatic temperature rise. The discharge waveforms for the third discharge are given in Figure 10. Since they are the same, only the last recorded oscillogram was added to the paper.
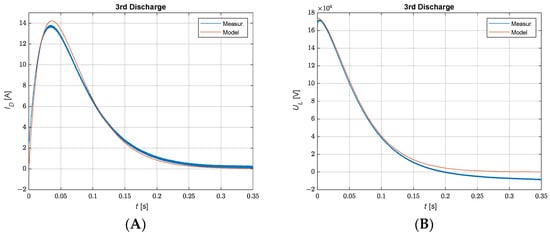
Figure 10.
Recorded discharge oscillograms for unit 3. (A) Discharge current waveshape, (B) discharge voltage waveshape.
All the necessary parameters are given in Table 7. As can be seen, the unit satisfied both the thermal and mechanical aspects of three consecutive capacitive discharges of 8 µF at line voltage. It can be seen that the total temperature θ1, assuming adiabatic conditions, peaked at 142.02 °C, which is significantly lower than the limit of 250 °C for copper conductors. In addition, the partial discharge at rated voltage was below ambient interference, and lower than 5 pC at power frequency withstand voltage both before and after the test. Winding resistance measurements were performed with very little deviation between measurements, which is also true for the accuracy performance.
Table 7.
Discharge parameters of unit 3 during combined test.
As indicated in chapter 3, the dissolved gas analysis was performed both before and after the test. Neither acetylene nor CO and CO2 values increased noticeably, and under the limits specified in [,]. All recorded values for gas concentrations are given in Table 8.
Table 8.
Dissolved gas analysis of unit 3 before and after the combined test.
Taking all the presented results into account, the combined testing sequence, as demonstrated in the example of unit 3 is the recommended test procedure for verifying the performance of instrument transformers during capacitive discharge and as such should be included in relevant international standards [,,,].
5. Conclusions
Although their primary purpose is not line discharging, inductive voltage and combined transformers are recognized as a suitable solution for line discharge due to a typically very fast decay of trapped charge, which is again clearly showcased in this paper. The discharge capability of instrument transformers is not defined by relevant standards, and generally little guidance is available on how to define, verify and quantify the performance of instrument transformers in discharge conditions.
For that reason, this paper gives explicit test requirements, a test setup example and the acceptance criteria for verifying the performance of instrument transformers during capacitive discharge.
Given the vast variance in input parameters, both from the system end, and in instrument transformer design, cable discharge should be specified as a special test, which is requested when the validation of performance is needed. When the test is requested, the utility should specify the value of capacitance that needs to be discharged.
It was proven within this paper that cable discharge is a more demanding requirement from the mechanical aspect than it is from thermal. While multiple testing sequences are possible, it is the recommendation of the authors that the combined sequence is specified as the referent for international standards. The reason is simplicity, duration and higher mechanical stress imposed on the unit. It should be noted that cable discharge is the highest mechanical stress a voltage transformer or a combined unit can encounter in the field. For that reason, guaranteeing cable discharge performance through short circuit tests should not be accepted, as currents are one order lower than in typical cable discharge.
This paper also underlines the accuracy of linear models for cable discharge and it could be claimed that thermal performance can be easily and universally determined based on modelling alone. However, mechanical withstand cannot. These two aspects will be researched further in order to develop models that contain the cooling properties of the units as well as, in order to form mechanical withstand criteria, which are basically non-existent in the relevant literature.
In the end, this paper is intended to be used as a blueprint for specific clauses in the upcoming IEC 61869-3 and IEEE C57.13 standards, which are currently being written and are poised to address the capacitive discharge performance of instrument transformers.
Author Contributions
Conceptualization, I.Ž.; Methodology, A.G., I.Ž., I.T. and R.H.; Validation, I.N.; Investigation, Z.H. All authors have read and agreed to the published version of the manuscript.
Funding
This research received no external funding.
Data Availability Statement
Data are contained within the article.
Conflicts of Interest
Authors Andrea Grđan and Igor Žiger were employed by the company Končar—Instrument Transformers Inc. Author Imre Tannemaat was employed by the company TenneT TSO B.V. Author Ralf Huth was employed by the company TenneT TSO GmbH. Author Ivan Novko was employed by the company Končar—Electrical Engineering Institute Ltd. The authors declare that the research was conducted in the absence of any commercial or financial relationships that could be construed as a potential conflict of interest.
References
- Study Committee A3. Brochure 394–State of the Art of Instrument Transformers; CIGRE: Cavtat, Croatia, 2009. [Google Scholar]
- Konta, I.; Papić, D.; Filipović-Grčić, D.; Brezak, D. Line Discharge Capability of Inductive Voltage and Combined Transformers. In Proceedings of the 5th International Colloquium Transformer Research and Asset Management, Opatija, Croatia, 9–12 October 2019. [Google Scholar]
- Križan, A.; Žiger, I.; Hanić, Z.; Novko, I. Test Methods for Validating Instrument Transformer Performance during Line Discharge. In Proceedings of the 16th HRO Cigre Conference, Šibenik, Croatia, 5–8 November 2023. [Google Scholar]
- Rahimi Pordanjani, I.; Wang, Y.; Cui, R.; Amiri, E. Discharge Characteristics of Trapped Charge in Power Lines with Underground Cable and Overhead Line Segments. In Proceedings of the 2016 IEEE/IAS 52nd Industrial and Commercial Power Systems Technical Conference (I&CPS), Detroit, MI, USA, 1–5 May 2016. [Google Scholar]
- Csida, S.; Kromer, L.I. An Improvement Method for Determining Line Discharge through Potential Transformers. IEEE Trans. Power Appar. Syst. 1978, PAS-97, 79–89. [Google Scholar] [CrossRef]
- Kano, K.; Kawabuchi, Y.; Uchida, K.; Yashiro, T.; Shibata, T. Line Trapped Charge Discharging Characteristic of Gas Insulated Magnetic Voltage Transformer. Trans. Power Deliv. 1992, 7, 370–375. [Google Scholar] [CrossRef]
- Marks, L.W. Line Discharge by Potential Transformers. IEEE Trans. Power Appar. Syst. 1969, PAS-88, 4. [Google Scholar] [CrossRef]
- IEEE Standard C57.13.5; IEEE Standard for Performance and Test Requirements for Instrument Transformers of a Nominal System Voltage of 115 kV and above. IEEE: Piscataway Township, NJ, USA, 2019.
- IEC 61869-3; Instrument Transformers–Part 3: Additional Requirements for Inductive Voltage Transformers. International Electrotechnical Commission: Geneva, Switzerland, 2011.
- IEC 61869-4; Instrument Transformers–Part 4: Additional Requirements for Combined Transformers. International Electrotechnical Commission: Geneva, Switzerland, 2013.
- IEC/IEEE 63253-5713-8 ED1; Station Service Voltage Transformers, 38/708/CDV. International Electrotechnical Commission: Geneva, Switzerland, 2022.
- Žiger, I.; Krajtner, D.; Šimec, I. Short-Ciruit Testing of Power Voltage Transformers. In Proceedings of the 12th HRO Cigre Conference, Šibenik, Croatia, 9–11 November 2015. [Google Scholar]
- Bego, V. Mjerni Transformatori; Školska Knjiga: Zagreb, Croatia, 1977. [Google Scholar]
- Poljak, M.; Bojanić, B. Method for the reduction of in-service instrument transformer explosions. Eur. Trans. Electr. Power 2010, 20, 927–937. [Google Scholar] [CrossRef]
- IEC 61181; Mineral Oil-Filled Electrical Equipment-Application of Dissolved Gas Analysis (DGA) to Factory Tests on Electrical Equipment. International Electrotechnical Commission: Geneva, Switzerland, 2007.
Disclaimer/Publisher’s Note: The statements, opinions and data contained in all publications are solely those of the individual author(s) and contributor(s) and not of MDPI and/or the editor(s). MDPI and/or the editor(s) disclaim responsibility for any injury to people or property resulting from any ideas, methods, instructions or products referred to in the content. |
© 2024 by the authors. Licensee MDPI, Basel, Switzerland. This article is an open access article distributed under the terms and conditions of the Creative Commons Attribution (CC BY) license (https://creativecommons.org/licenses/by/4.0/).