Article

Research on the Dispatching of Electric Vehicles Participating in Vehicle-to-Grid Interaction: Considering Grid Stability and User Benefits

1
School of Electrical Engineering, Xi’an University of Technology, Xi’an 710048, China
2
State Grid Shaanxi Electric Power Co., Ltd., Electric Power Research Institute, Xi’an 710048, China
*
Author to whom correspondence should be addressed.
Energies 2024, 17(4), 812; https://doi.org/10.3390/en17040812
Submission received: 22 December 2023 / Revised: 22 January 2024 / Accepted: 6 February 2024 / Published: 8 February 2024
(This article belongs to the Section E: Electric Vehicles)

Abstract

:
As the prevalence of electric vehicles (EVs) continues to grow, their charging and discharging behaviors pose a challenge to the stable operation of power systems. Therefore, this paper analyzes the charging demand of EV users through GPS trajectory data and proposes an EV-discharging-optimization model based on vehicle-to-grid interaction (V2G). Firstly, the spatial–temporal distribution of EV-charging demand is obtained by cleaning and mining the big data of traveling vehicles, considering dynamic energy consumption theory and users’ willingness; secondly, a probabilistic model of EV users’ participation in V2G-demand response is constructed based on expected utility theory, which both considers the heterogeneity of users and reflects the interactive influence of users’ decisions; finally, a scheduling model of EV discharging in the regional grid is established. The results show that the proposed model can explore the potential of user participation in V2G in the study area, and the V2G response resources can reduce the grid fluctuation and enable users to obtain certain benefits, which achieves a win–win situation between the grid side and the user side.

1. Introduction

Under the background of “carbon peak and carbon neutrality”, the electric vehicle (EV), as a low-carbon and environmentally friendly means of transportation, plays an important role in alleviating energy pressure and reducing greenhouse gas emissions, and has been strongly supported and promoted by the state, and its development speed is accelerating [1]. EV users’ charging and discharging behaviors are highly stochastic and volatile across time and space. Therefore, modeling EV users’ charging and discharging intentions and loads, taking into account subjective and objective factors, is the basis for conducting research on the location and capacity of charging stations, the interaction between EVs and the grid (V2G) and the coordination between EVs and other energy sources.
Currently, the widely used EV-charging-load modeling methods can be classified into two categories: a model-driven method and data-driven method [2]. Among them, the data-driven method mainly focuses on the correspondence between scene information and charging load data, and its applicable scope is limited by actual data. Reference [3] classifies EV types using the national household travel survey (NHTS) data, and analyzes the travel characteristics and charging load demands of different types of electric vehicles. However, this study simulated EV-charging behavior under a relatively ideal scenario, and used foreign vehicle travel data, which would not highlight the actual situation of domestic EVs. Reference [4] uses a variational autoencoder to extract charging behavior characteristics from historical data, and proposes a charging-load-prediction method based on multi-correlated daily scenarios. However, the lack of actual charging data in EV access scenarios brings limitations to model training. Reference [5] integrates an urban road network and EV data to provide a data-driven analysis method for the interaction of EVs, power grids, and transportation networks, but does not consider other factors affecting car owners’ charging decisions. The model-driven method generally analyze the formation mechanism of the charging load from the aspects of user travel, vehicle power consumption, and charging selection. Reference [6] analyzed the probability distribution characteristics of the whole vehicle and obtained the charging load using the Monte Carlo sampling method. Reference [7] considers the impact of traffic conditions and ambient temperature on the energy consumption of electric vehicles, and makes corresponding corrections to the power consumption per unit mileage of vehicles. Reference [8] analyzed the spatial–temporal distribution of charging load by combining the network structure and traffic-congestion degree. References [6,7,8] used fixed energy consumption or a unit mileage power consumption calculation for the modeling of electric vehicle power consumption. However, the driving conditions of electric vehicles in actual travel are constantly changing, so the energy consumption calculation method based on unit mileage consumption will have a large deviation.
V2G refers to the technology of EVs using charge and discharge facilities to discharge electricity to the grid; when the grid has surplus or unused electricity, electric vehicles can be charged during off-peak load. In the case of grid power shortages, car owners can release the remaining battery power to the grid at a higher price during peak periods. Therefore, electric car owners can earn a reasonable profit. At the same time, this behavior of users participating in V2G can provide peak regulation, frequency modulation, and other services for the power grid when necessary, so as to relieve the load pressure of the power grid, thereby improving the stability of the power system. Secondly, V2G can also provide flexible energy storage resources for the power grid to cope with power fluctuations and uncertainties, and further enhance the stability of the power system [9,10,11]. Reference [12] proposes a charging guidance method based on TOU, which will reduce the charging cost for EV owners and further motivate them to participate in the discharge demand response. Liu et al. [13] provided the elastic curve of users, which reflected the sensitivity of unresponsive users to price changes. EV charging and V2G demand would be affected by price fluctuations in different periods. The price elasticity matrix is defined to reflect the response of EV charging and V2G to prices at different periods [14]. The above references are all from the perspective of power grid or a single perspective of EV load aggregators, ignoring the objective conditions and subjective willingness of vehicle owners to participate in V2G-demand response. Reference [15] proposes a distribution-system flexibility-evaluation method based on RESs and an EV-charging and -discharging control strategy. In the model of electric vehicle battery capacity, a travel plan and transportation network is established, which promotes the sustainable development of an electric power system. However, the balance between the flexibility of the distribution system, the battery life of electric vehicles and the efficiency of charging and discharging needs to be considered comprehensively to ensure the stability and reliability of the power system. Reference [16] proposed a power supply cost model that incorporated electric vehicles into the power system to reduce the total power cost, and studied the load demand, power supply cost and power grid fluctuation under the three operating modes of random charging, controlled charging, and V2G. However, the goal of this study was only to optimize the power supply cost of the grid, without taking into account the interests of car owners. In addition, some researchers have established a bilateral negotiation model of discharge price based on fuzzy Bayes learning, in order to maximize the benefits of car owners and encourage car owners to participate in demand response. Although the pricing mechanism of electric vehicle discharge electricity price [17] is provided, it is quite different from the implementation criteria of domestic EV participation in discharge response.
Based on the above analysis, this paper first starts with the GPS track data of users in the study area, judges real-time energy consumption during vehicle driving according to the dynamic energy consumption theory, accurately obtains the spatiotemporal distribution of charging demand points, and then classifies EV users, establishes a hierarchical charging-decision-making model based on the fuzzy control theory, and calculates the charging demand load in the region. Secondly, the expected utility theory is used to establish a demand response decision model for users to participate in V2G discharge. The above research process emphasizes the subjective-choice behavior of users under the premise of respecting objective conditions. Finally, according to the discharge compensation benefits and the current domestic discharge compensation policy regulations, the more realistic reference value of V2G-response capacity and the economic benefits are studied, and the ability of electric vehicles and photovoltaic energy storage to adjust the load curve of the grid is analyzed.
In view of the shortcomings mentioned in the above literature, the main contributions of this paper are as follows:
(1)
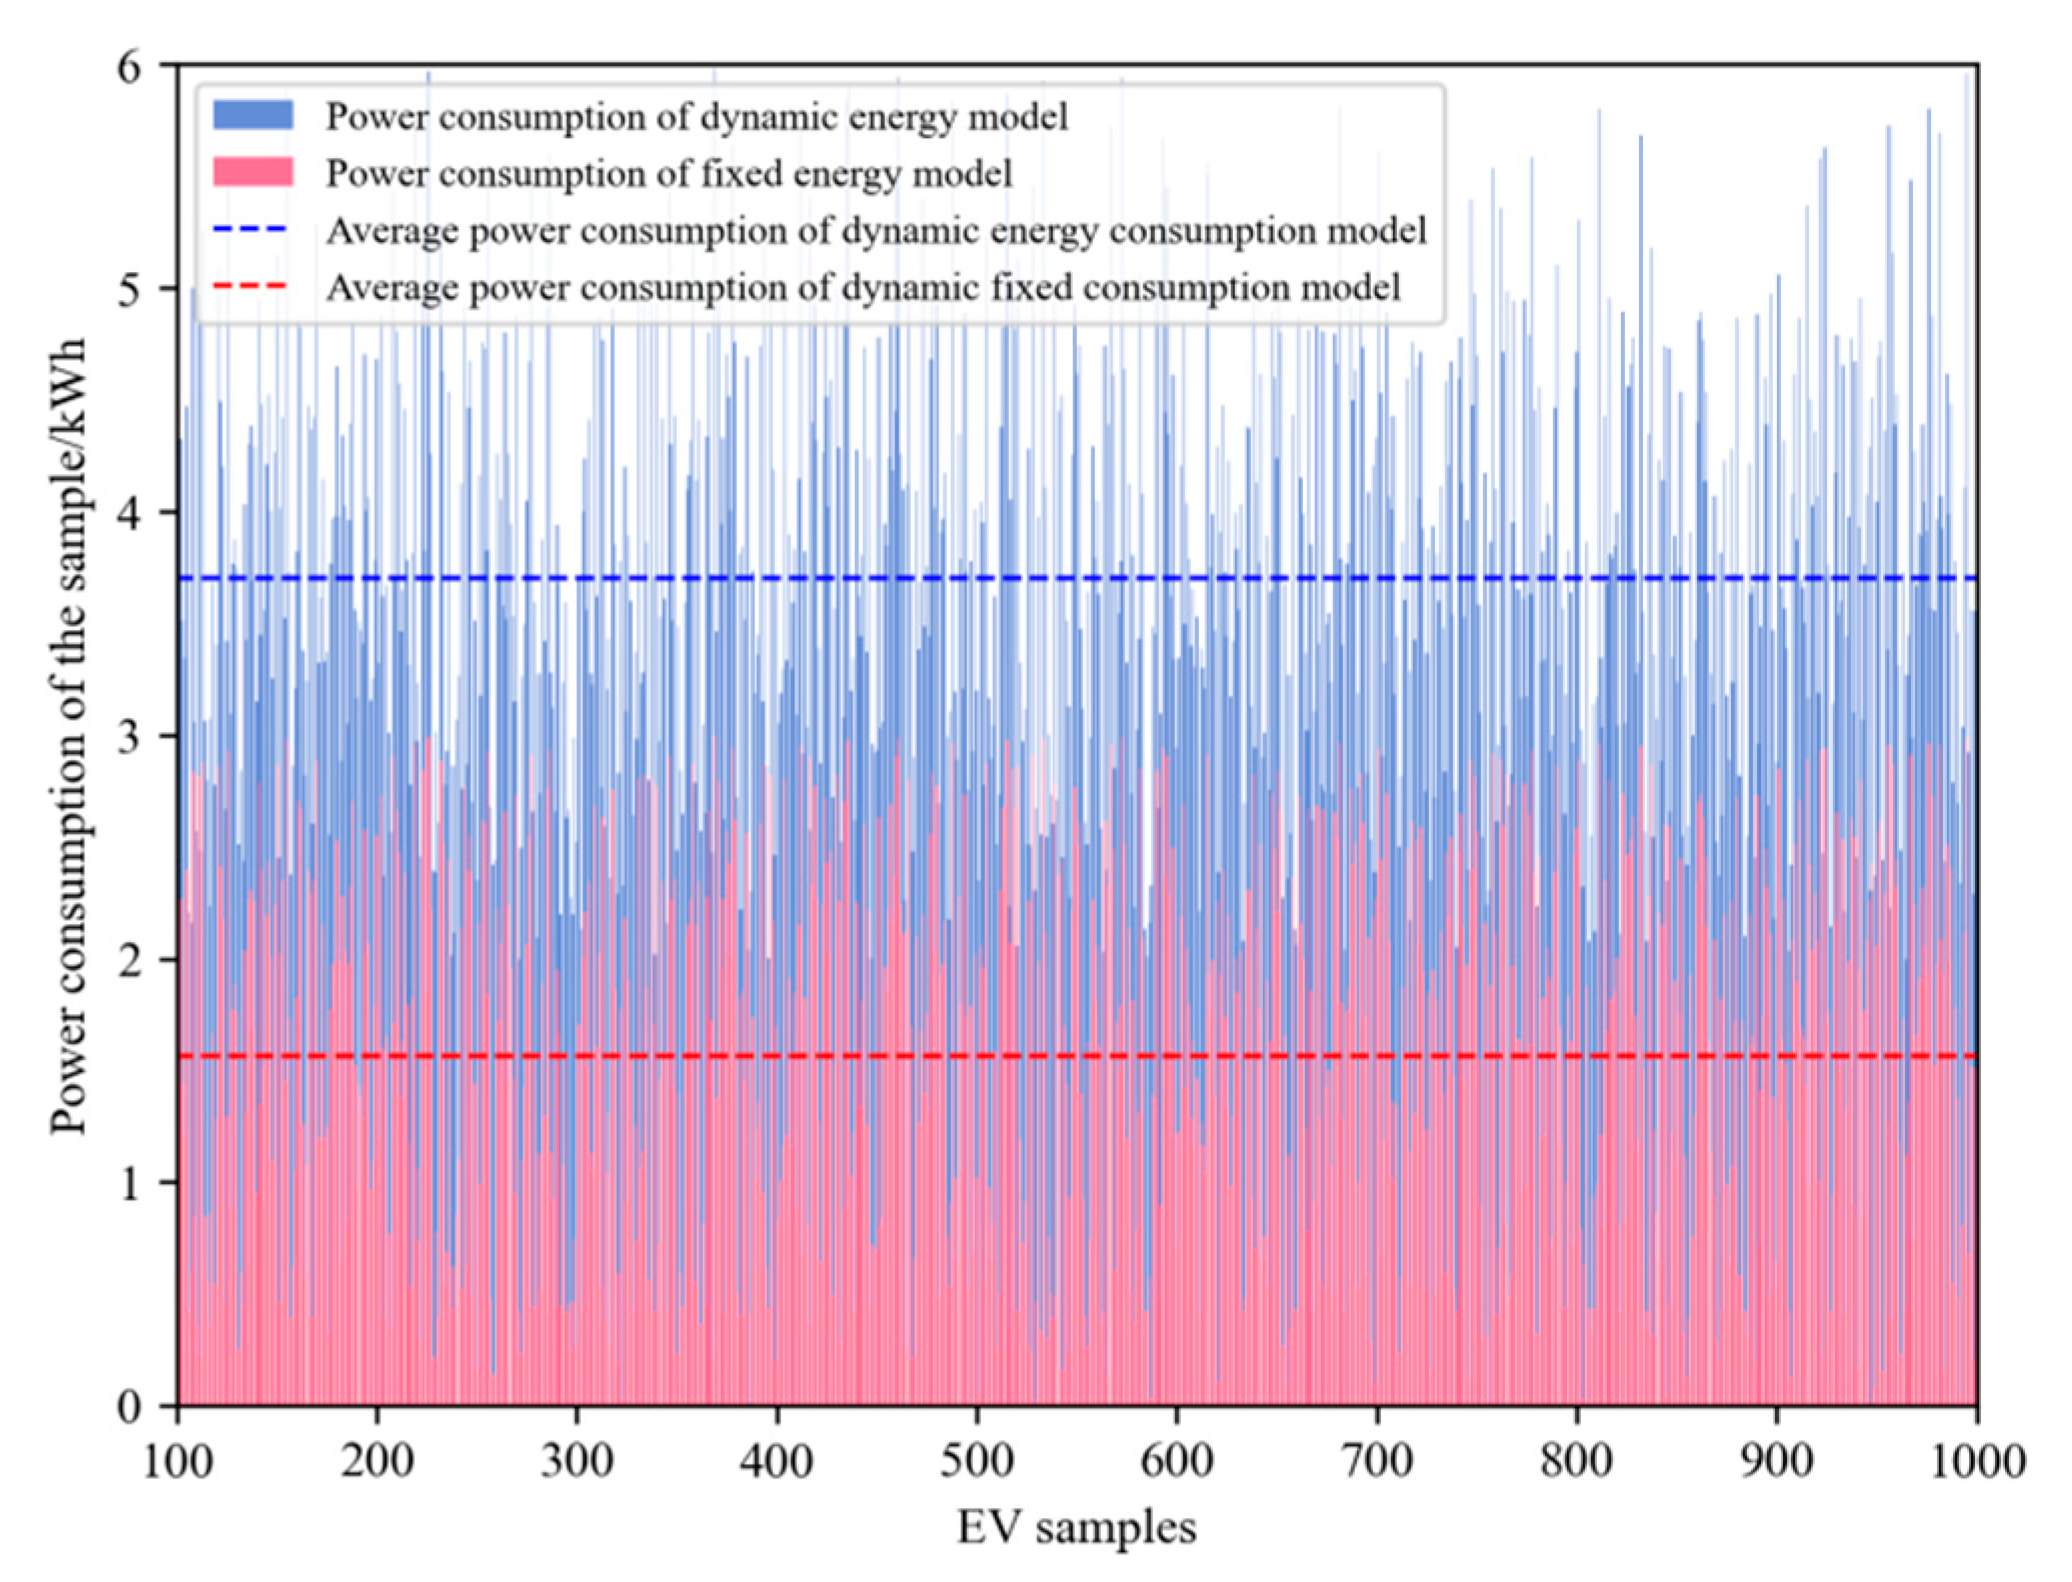
Based on the changes in speed and acceleration of electric vehicles during driving, a dynamic microscopic energy consumption model of electric vehicles is established, and the energy consumption of electric vehicles under four scenarios of acceleration, deceleration, constant speed and idle speed is analyzed, which improves the accuracy of energy consumption calculations for electric vehicles.
(2)
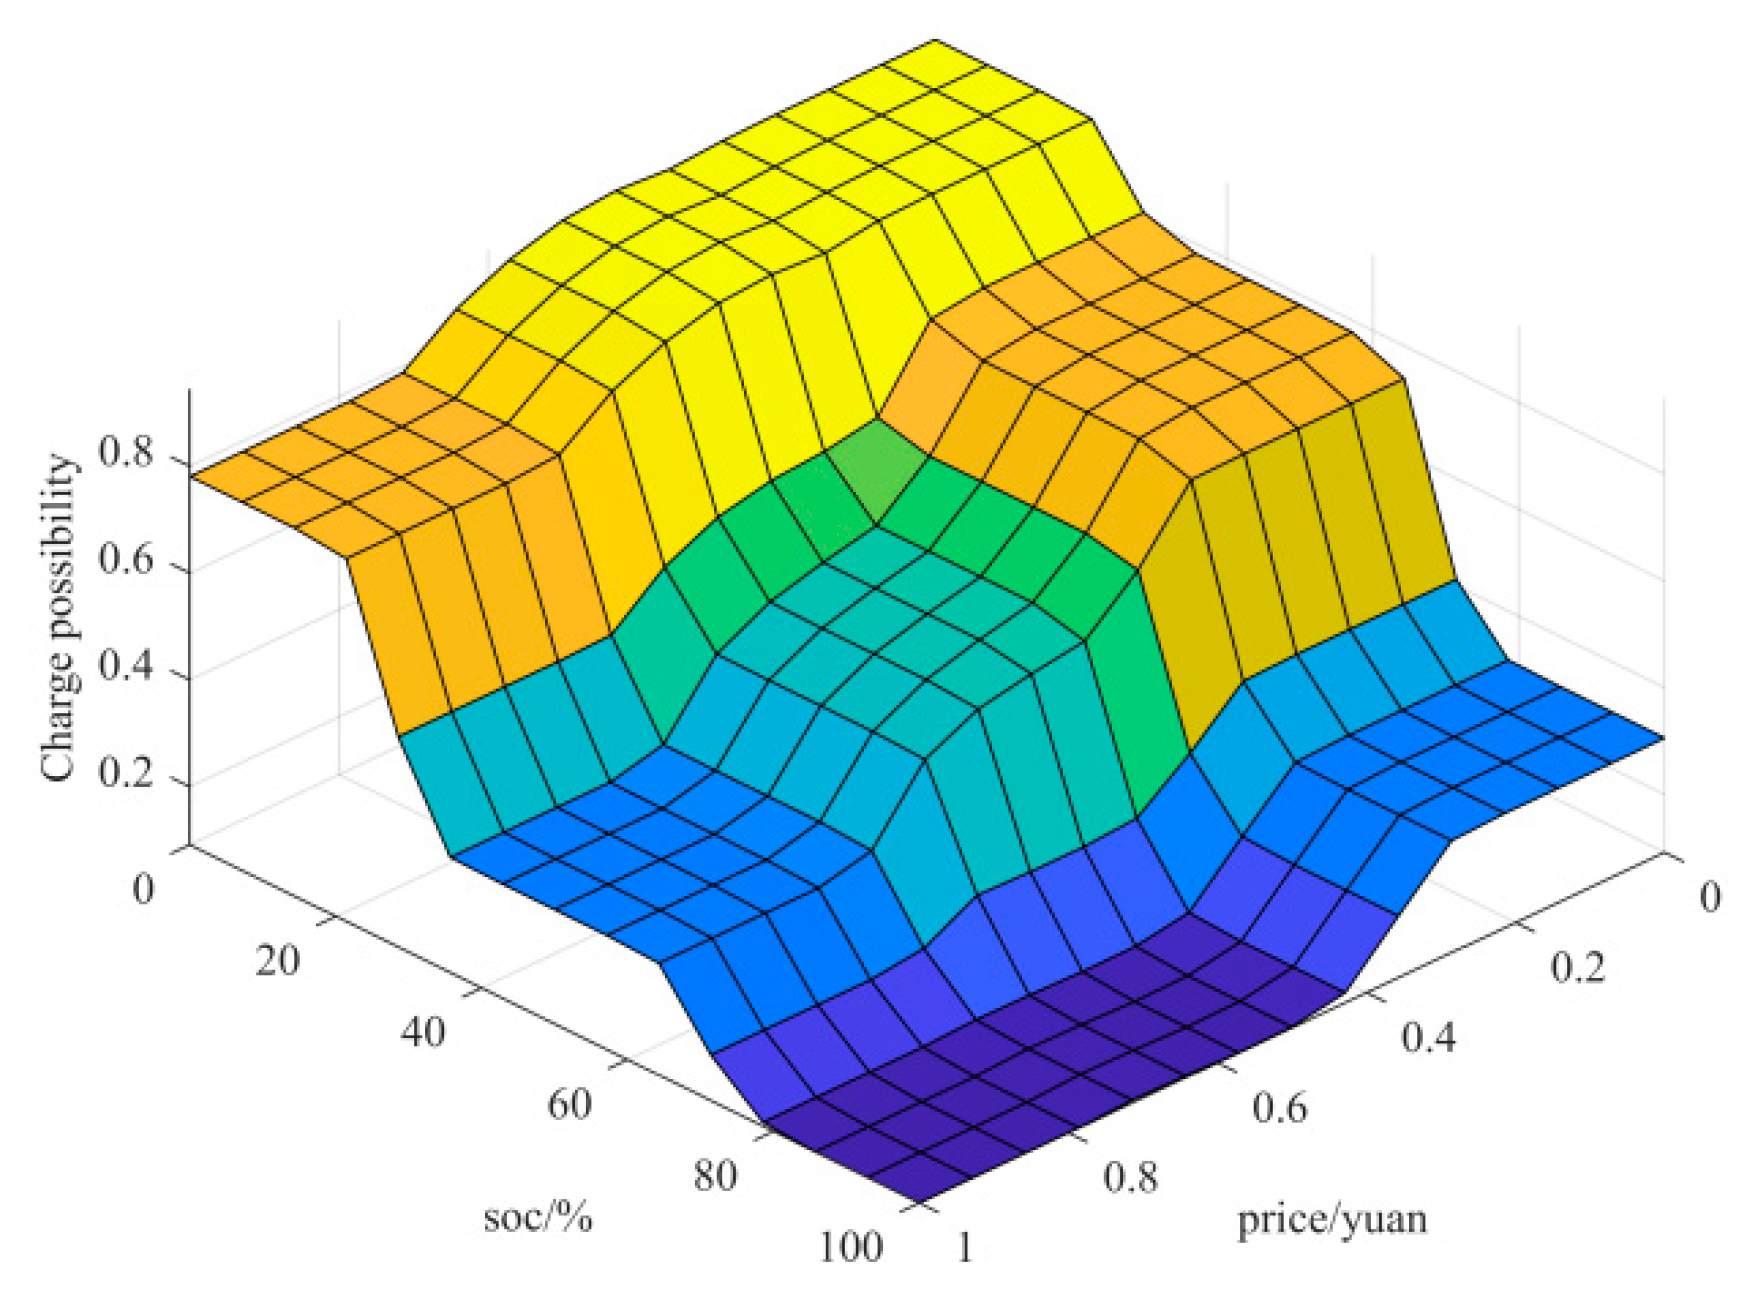
Considering the TOU price and the state of remaining power, hierarchical decision making and analysis of electric vehicle users’ charging willingness are carried out based on the fuzzy reasoning system.
(3)
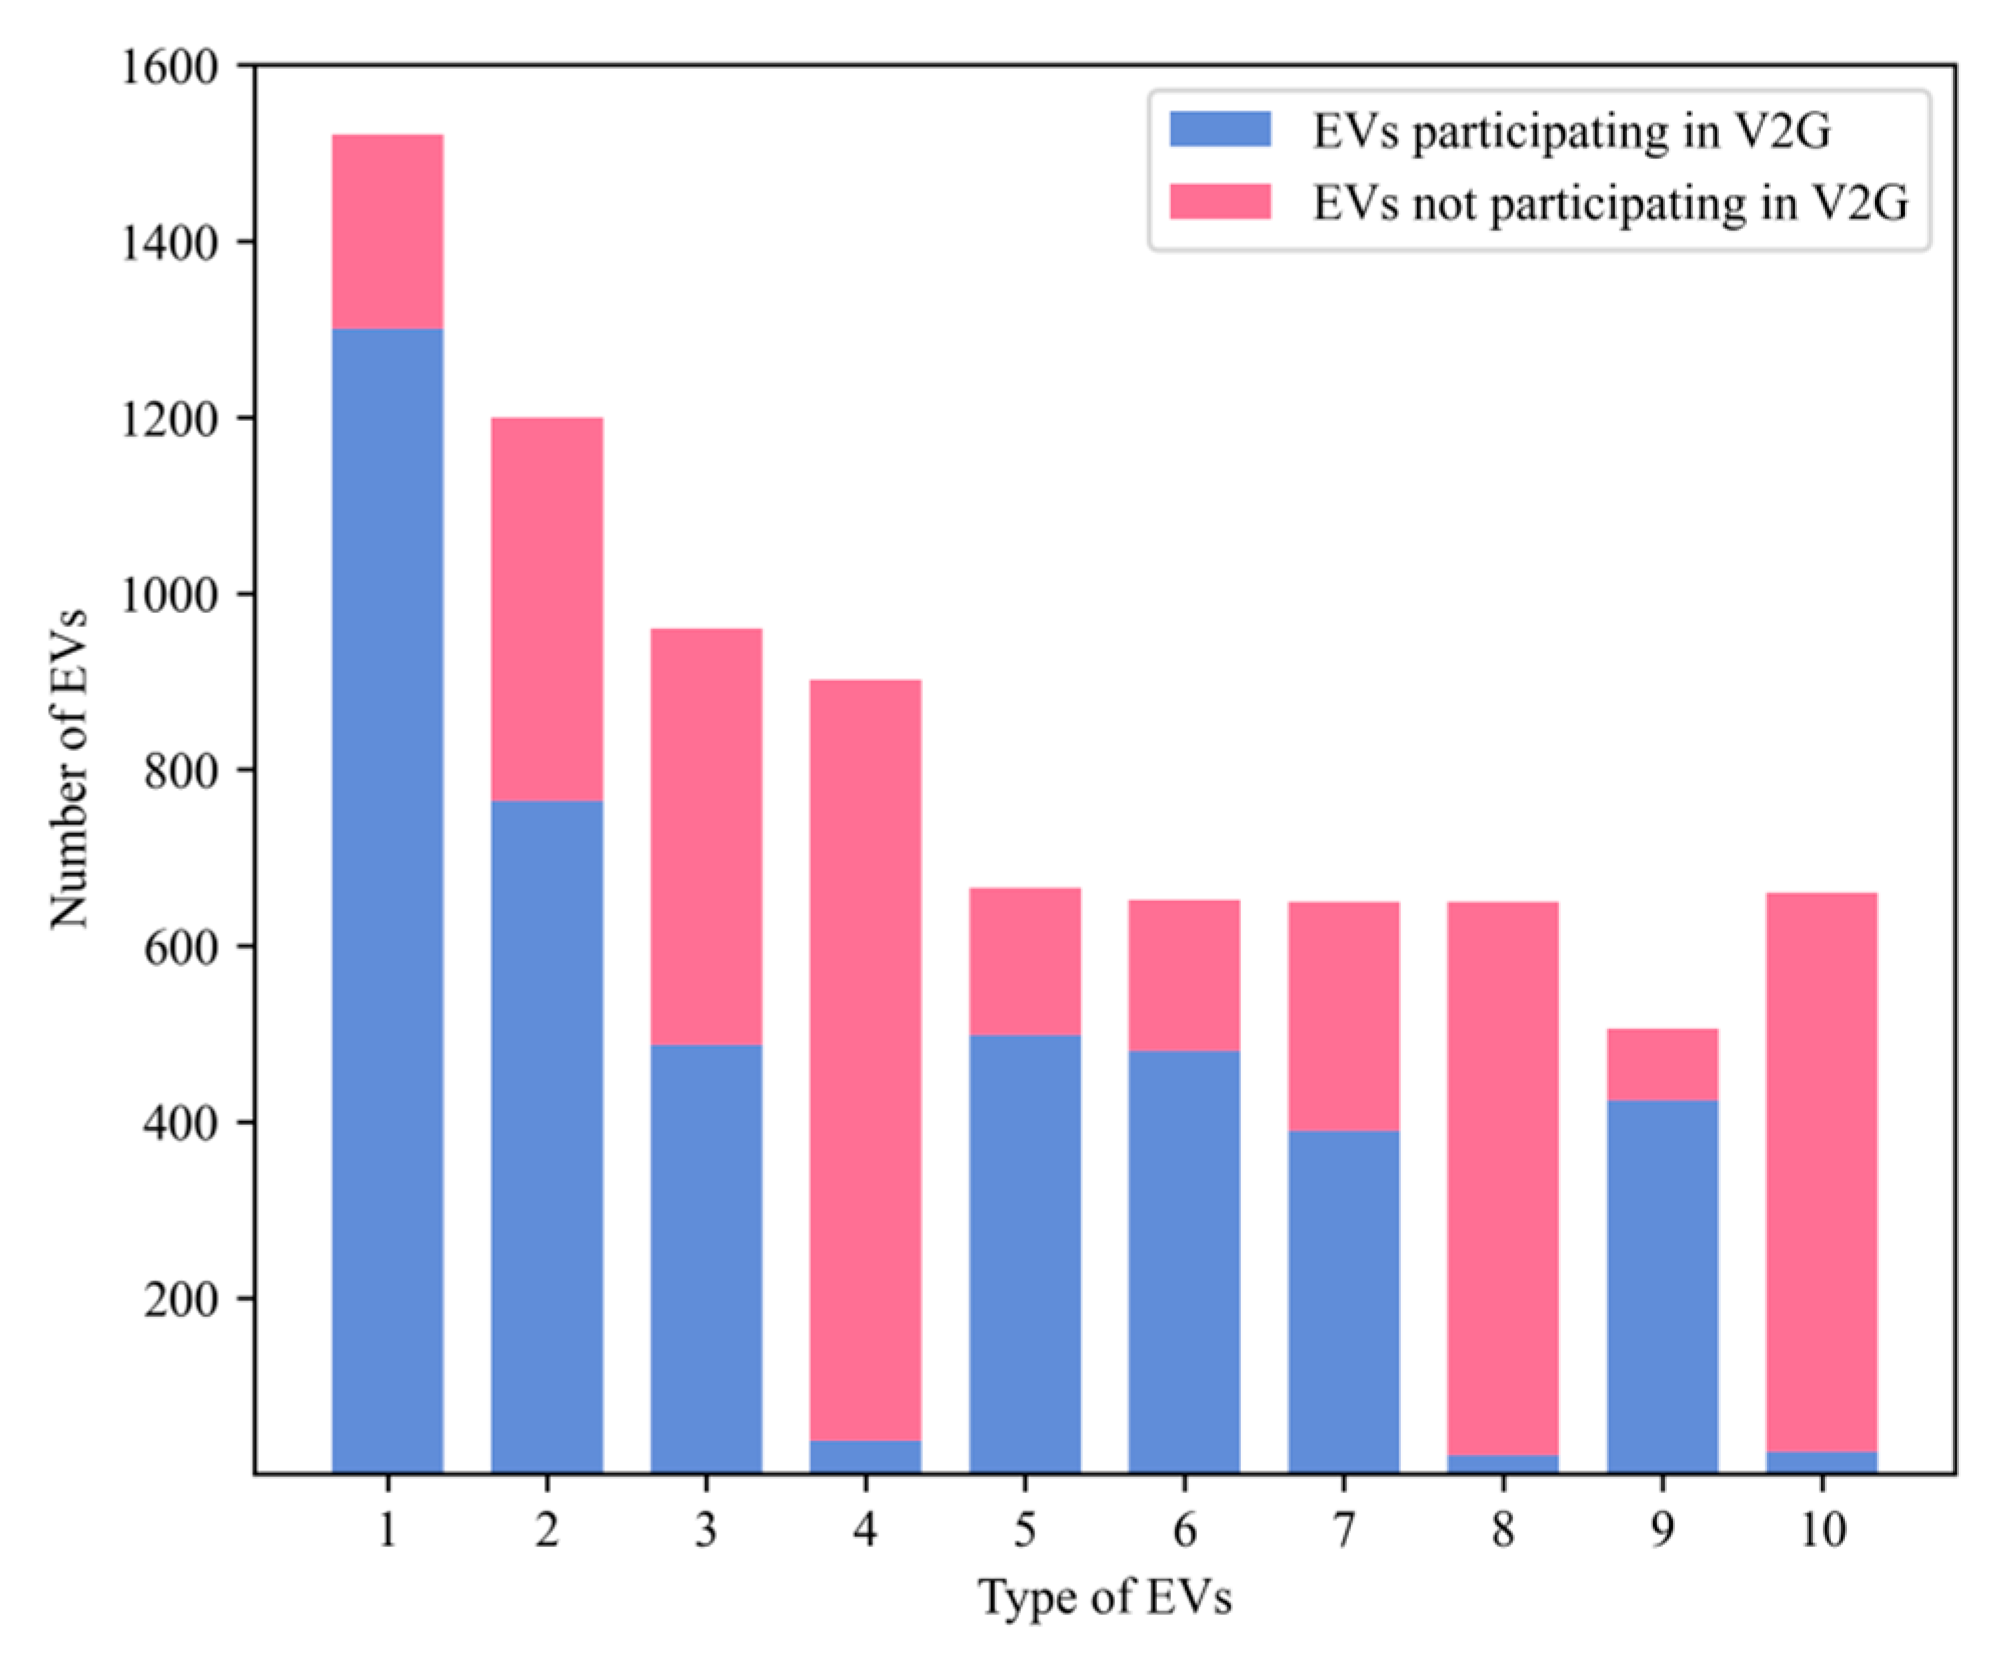
The theory of social behavior is introduced to analyze the willingness of EV users to participate in V2G response based on the expected utility model, which improves the subjective initiative of users.
(4)
Subsidies for electric vehicles to participate in V2G are in line with the policies being implemented in the relevant regions in China and are more in line with reality.
The rest of this article is organized as follows. Section 2 introduces the charging demand model of EV. In Section 3, the scheduling model of EV users participating in V2G response is introduced, and in Section 4, the effectiveness and feasibility of the proposed method are verified using an example analysis. Finally, Section 5 summarizes the thesis. The overall framework of this paper is shown in Figure 1.

2. EV-Charging and -Discharging-Demand Model

2.1. GPS Data Pre-Processing

The travel orders and order of GPS positioning data of some areas of a city in China within one week are used in this paper. The time interval of the data link is 2 s~4 s, containing about 270,000 pieces of data in total. The data format and specific processing process are shown in Table A1 and Formulas (A1)–(A3) in Appendix A.

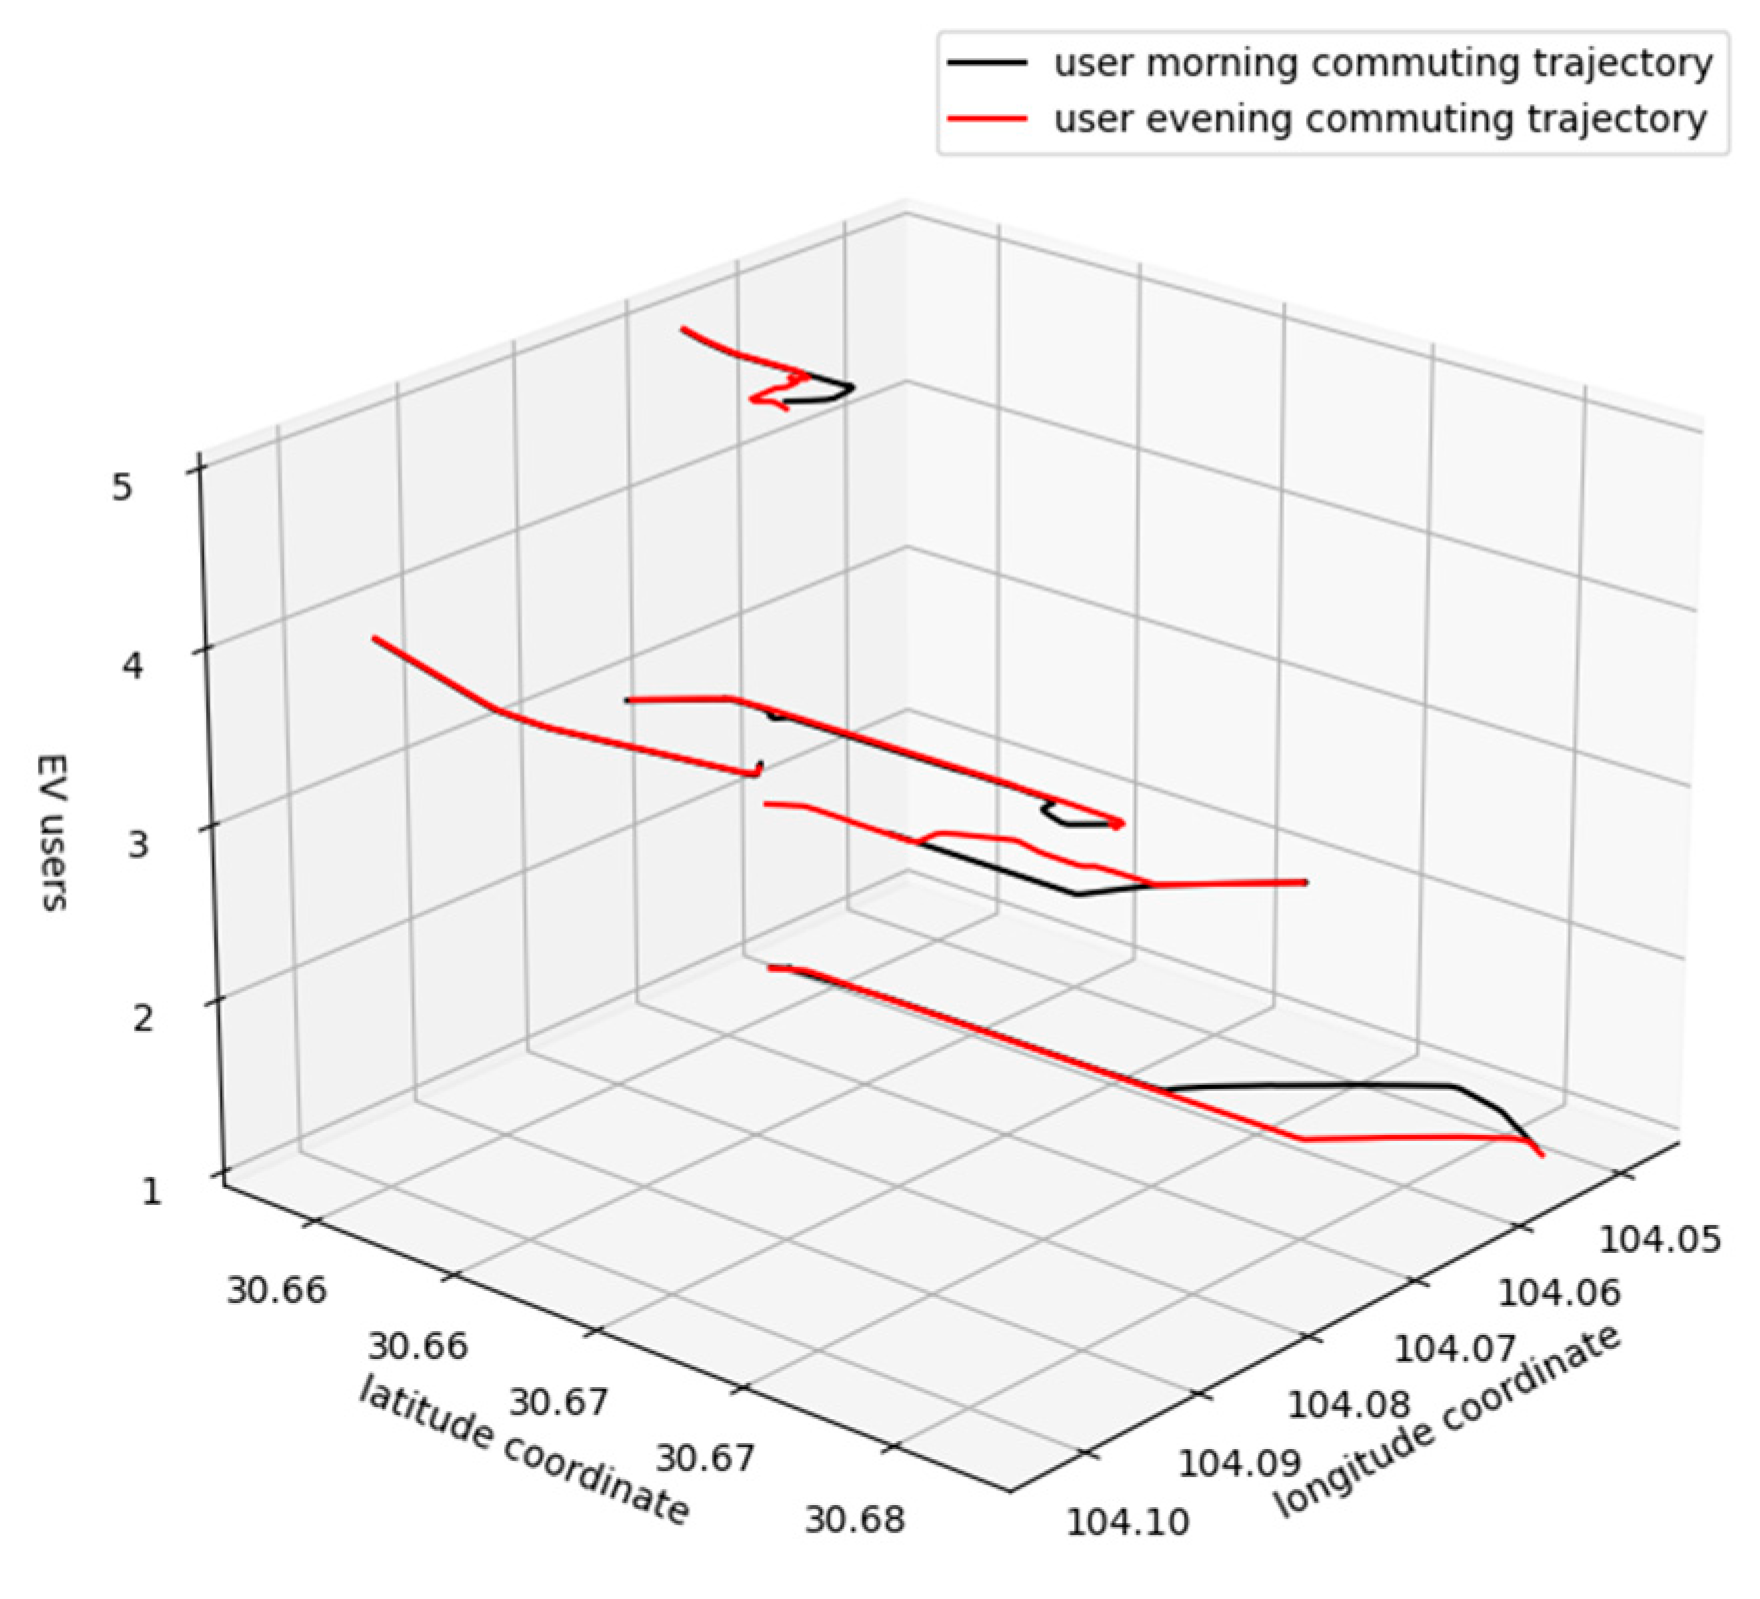
2.2. Travel Chain Construction

Using the regenerated data set processed in the previous section, find the optimal matching result for the coordinates of the start and end points of the trajectory, and construct a travel chain that conforms to the travel habits of EV users. The specific construction process is as follows.
(1)
Construct the matching relationship between the early travel chain Cm(i) and the late travel chain C e ( j ) :
C m ( i ) = { ( x 0 , m , y 0 , m , t 0 , m ) , ( x 1 , m , y 1 , m , t 1 , m ) , , ( x n , m , y n , m , t n , m ) }
C f ( j ) = { ( x 0 , f , y 0 , f , t 0 , f ) , ( x 1 , f , y 1 , f , t 1 , f ) , , ( x l , f , y l , f , t l , f ) }
where x i , m , y i , m , t i , m are the real-time longitudinal and latitudinal coordinates and time stamps corresponding to the i-th message in the m-th morning-commute-trajectory data, respectively, where i = 0 , 1 , , n , n is the total length of the trip chain; x j , f , y j , f , t j , f are the real-time longitudinal and latitudinal coordinates and timestamps corresponding to the j-th message in the e-th evening-commute-trajectory data, respectively, where j = 0 , 1 , , l , l is the total length of the trip chain.
(2)
Match the early and late trajectory data obtained through mining in the spatial position:
O ( x ) = { [ C m ( i ) , C f ( j ) ] } x 0 , m x l , f < α la | x 0 , f x n , m | < α la
O ( y ) = { [ ( C m ( i ) , C f ( j ) ] } y 0 , m y l , f < α l o n | y 0 , f y n , m | < α l o n
C ( z ) = O ( x ) O ( y )
where O ( x ) , O ( y ) are the set of travel chain trajectories obtained by matching the beginning and end longitudinal and latitudinal coordinates, respectively; α la , α l o n are the minimum value of distance error allowed in the matching process; C ( z ) is the set of successfully matched travel chain data ensemble; and z is the number of successful matches, z = 1 , 2 , , n .
Figure 2 shows the results of five sets of EV users’ morning- and evening-commuting-trip chains matched with Equations (1)–(5) (only partial results, about 8000 trip chains were successfully matched according to the above equations).
From Figure 2, it can be seen that users automatically choose the optimal driving path according to the road conditions during the travel process, so as to avoid traffic jams and other situations. Compared with the traditional fixed-trip chains, the results obtained using this data mining method can more accurately reflect the impact of urban road conditions and driving status information on charging demand (the round-trip time and distance of the trip are different).

2.3. EV-Driving Characteristics

2.3.1. Battery Initial State of Charge

According to the average daily energy consumption of private cars, EV users charge about 1.3 times per week [18]. Therefore, the charge state of the first-trip battery is set to obey a normal distribution N ( 0.5 , 0.1 ) [19], as shown in Equation (6).
f ( S , u , σ ) = 1 σ 2 π e ( S u ) 2 2 σ 2
E 0 , k = C k S k
where u , σ are the parameters associated with the normal distribution; S is the initial value of the EV battery-charge state; E 0 , k is the initial charge at the moment of travel corresponding to the k-th class EV; C k is the battery capacity of the k-th class EV; and S k is the charge state of the k-th class EV battery, k = 1 , 2 , , 10 .

2.3.2. EV Dynamic Energy Consumption Model

According to the microscopic dynamic energy consumption quantification model proposed in the literature [20], based on the second-by-second GPS trajectory data, the dynamic energy consumption model of an EV under different driving conditions is given:
{ E V C A = d = 0 j ( w A v d a d )    a d > 0 E V C D = d = 0 j ( w D v d a d )    v d < 0 E V C U = d = 0 j ( w U v d )     a d = 0 , v d 0 E V C I = E c        a d = 0 , v d = 0
v d = ( G d + 1 ( x ) G d ( x ) ) 2 + ( G d + 1 ( y ) G d ( y ) ) 2 g
a d = v d v d 1 g
where E V C A , E V C D , E V C U , E V C I are the EV power consumption under four operating states of acceleration, deceleration, uniform speed, and idling, respectively; w A , w D , w U are the regression coefficients obtained in this experiment for each driving condition [20]; E c is the fixed electric power consumption under idling condition; vd is the instantaneous speed corresponding to d moments, which is determined using the GPS positioning coordinates Gd at d moments; g indicates the time interval of GPS data; and a d is the instantaneous acceleration corresponding to d moments.

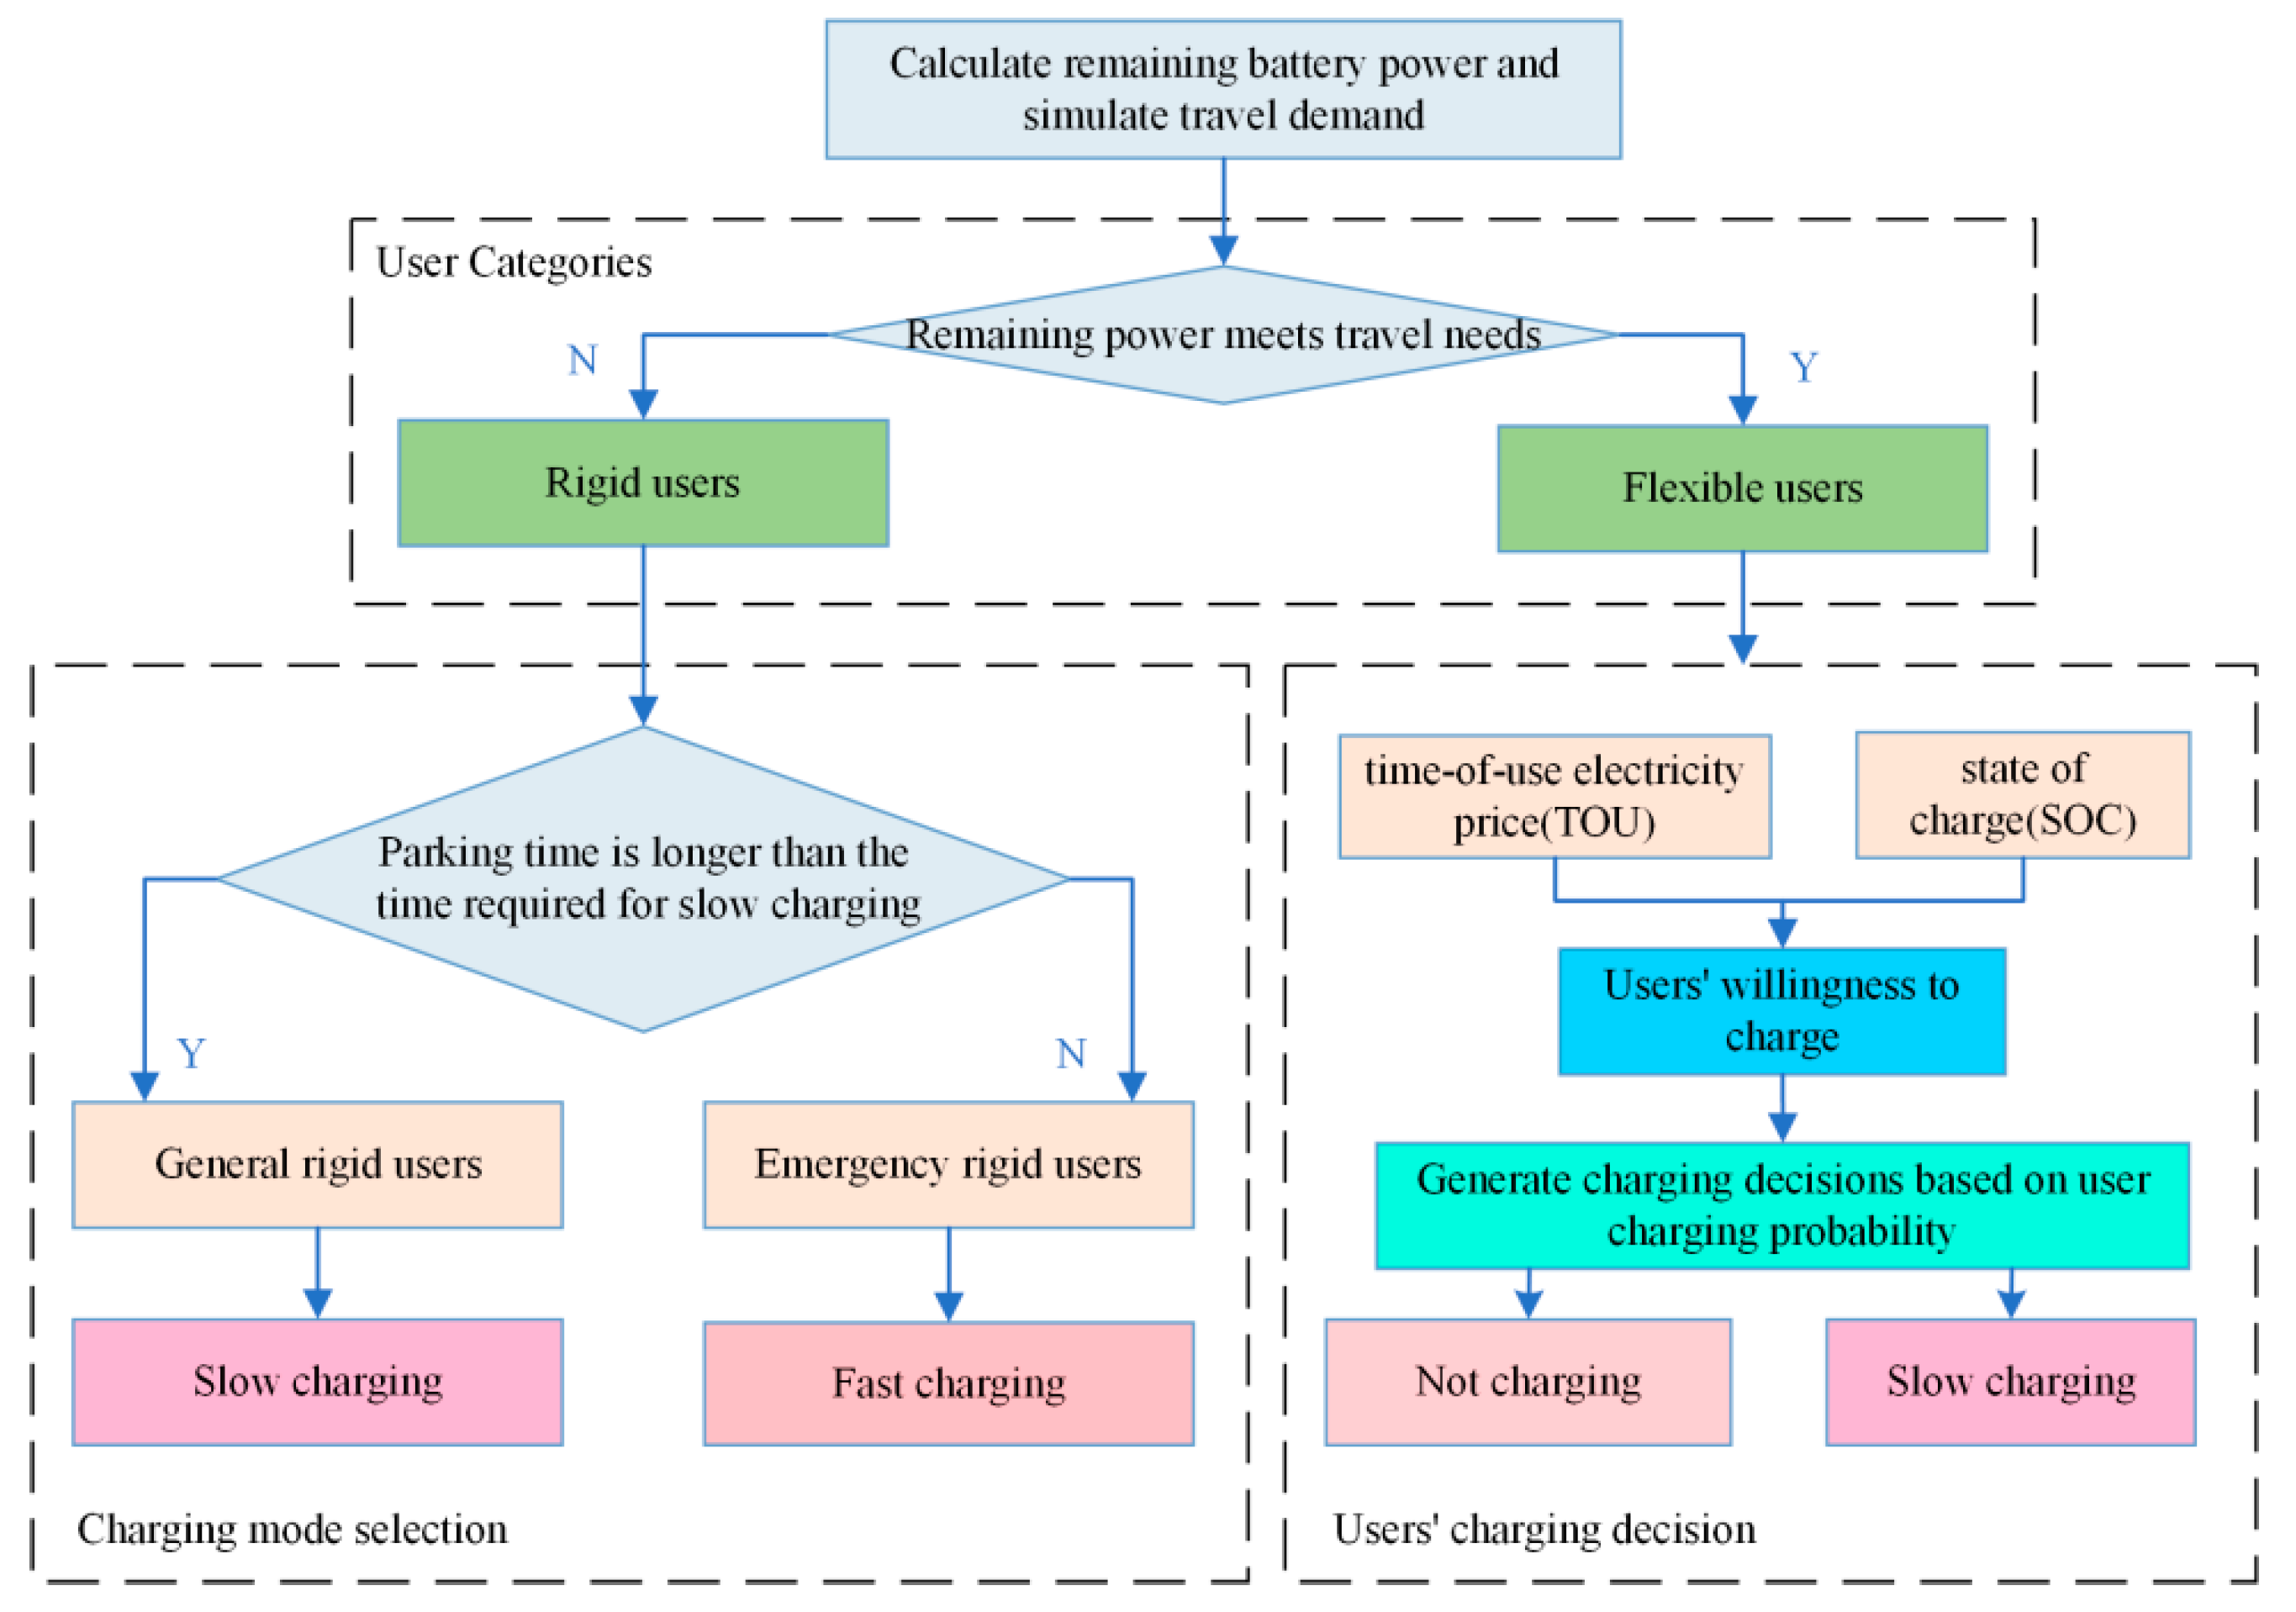
2.4. Hierarchical Charging Decision Model for EV Users

2.4.1. Classification of Users Based on Travel Needs

Calculate the remaining power E t , k and state of charge of the battery S O C t , k at time t according to Equations (11)–(13).
Δ E t , k = h { A , D , U , I } E V C h t
E t , k = E 0 , k Δ E t , k
S O C t , k = E t 1 , k Δ E t , k C k
where h indicates the different operating states during EV driving.
After the energy consumption calculation and battery status update are completed, the power consumption of the next trip is estimated in advance, and users are classified according to the power demand. The specific classification process is shown in Equation (14) below. If the current remaining power cannot meet the demand of the next leg of the trip, that is S O C t + 1 , k 20 % , at that time, the user is divided into rigid users. In order to ensure normal travel, the user must be charged; at this time, EV users will choose the nearest charging station to charge. In this paper, the nearest geometric distance (Equation (15)) is used as the basis for the selection of charging stations. If the remaining power of other users is relatively sufficient, that is S O C t + 1 , k > 20 % , the user is classified as an elastic user. At the same time, the charging-decision coefficient c is set as the decision number of charging behavior (if it needs to be charged, c is set to 1, otherwise set to 0).
S O C t + 1 , k = S O C t , k Δ E t + 1 , k C k
d ( u ) = min u = 1 , 2 , , 62 [ ( x u , c x z ) 2 + ( y u , c y w ) 2 ]
where u denotes the charging station closest to the end of the trip, the number of charging stations in the study area, and the corresponding POI coordinates of the charging stations; x u , c , y u , c are the latitudinal and longitudinal coordinates of the u-th charging station, respectively; x z , y w are the latitudinal and longitudinal coordinates of the corresponding location when the EV triggers the charging demand, respectively.

2.4.2. Charging Mode Selection for Rigid Users

In terms of charging mode selection, most of the literature uses fixed charging modes in different types of areas [21,22]. This paper considers the influence of parking time on the charging mode selection of rigid users. When the parking time meets the charging time required by slow charging, in order to reduce the impact on battery life, slow charging is usually adopted. When the parking time does not meet the charging time required for slow charging, it becomes an emergency rigid user, which urgently needs to charge to the expected state in a short time, and needs to use the fast charging mode. The charging mode selection is based on the following:
P u = { P u sc    t u p t u sc P u fc    t u p < t u sc
where P u is the charging power selected by the user in the charging station u; t u sc is the charging time required when slow charging is used; t u p is the parking duration; P u sc , P u fc are the slow-charging and fast-charging power of the charging station u, respectively.

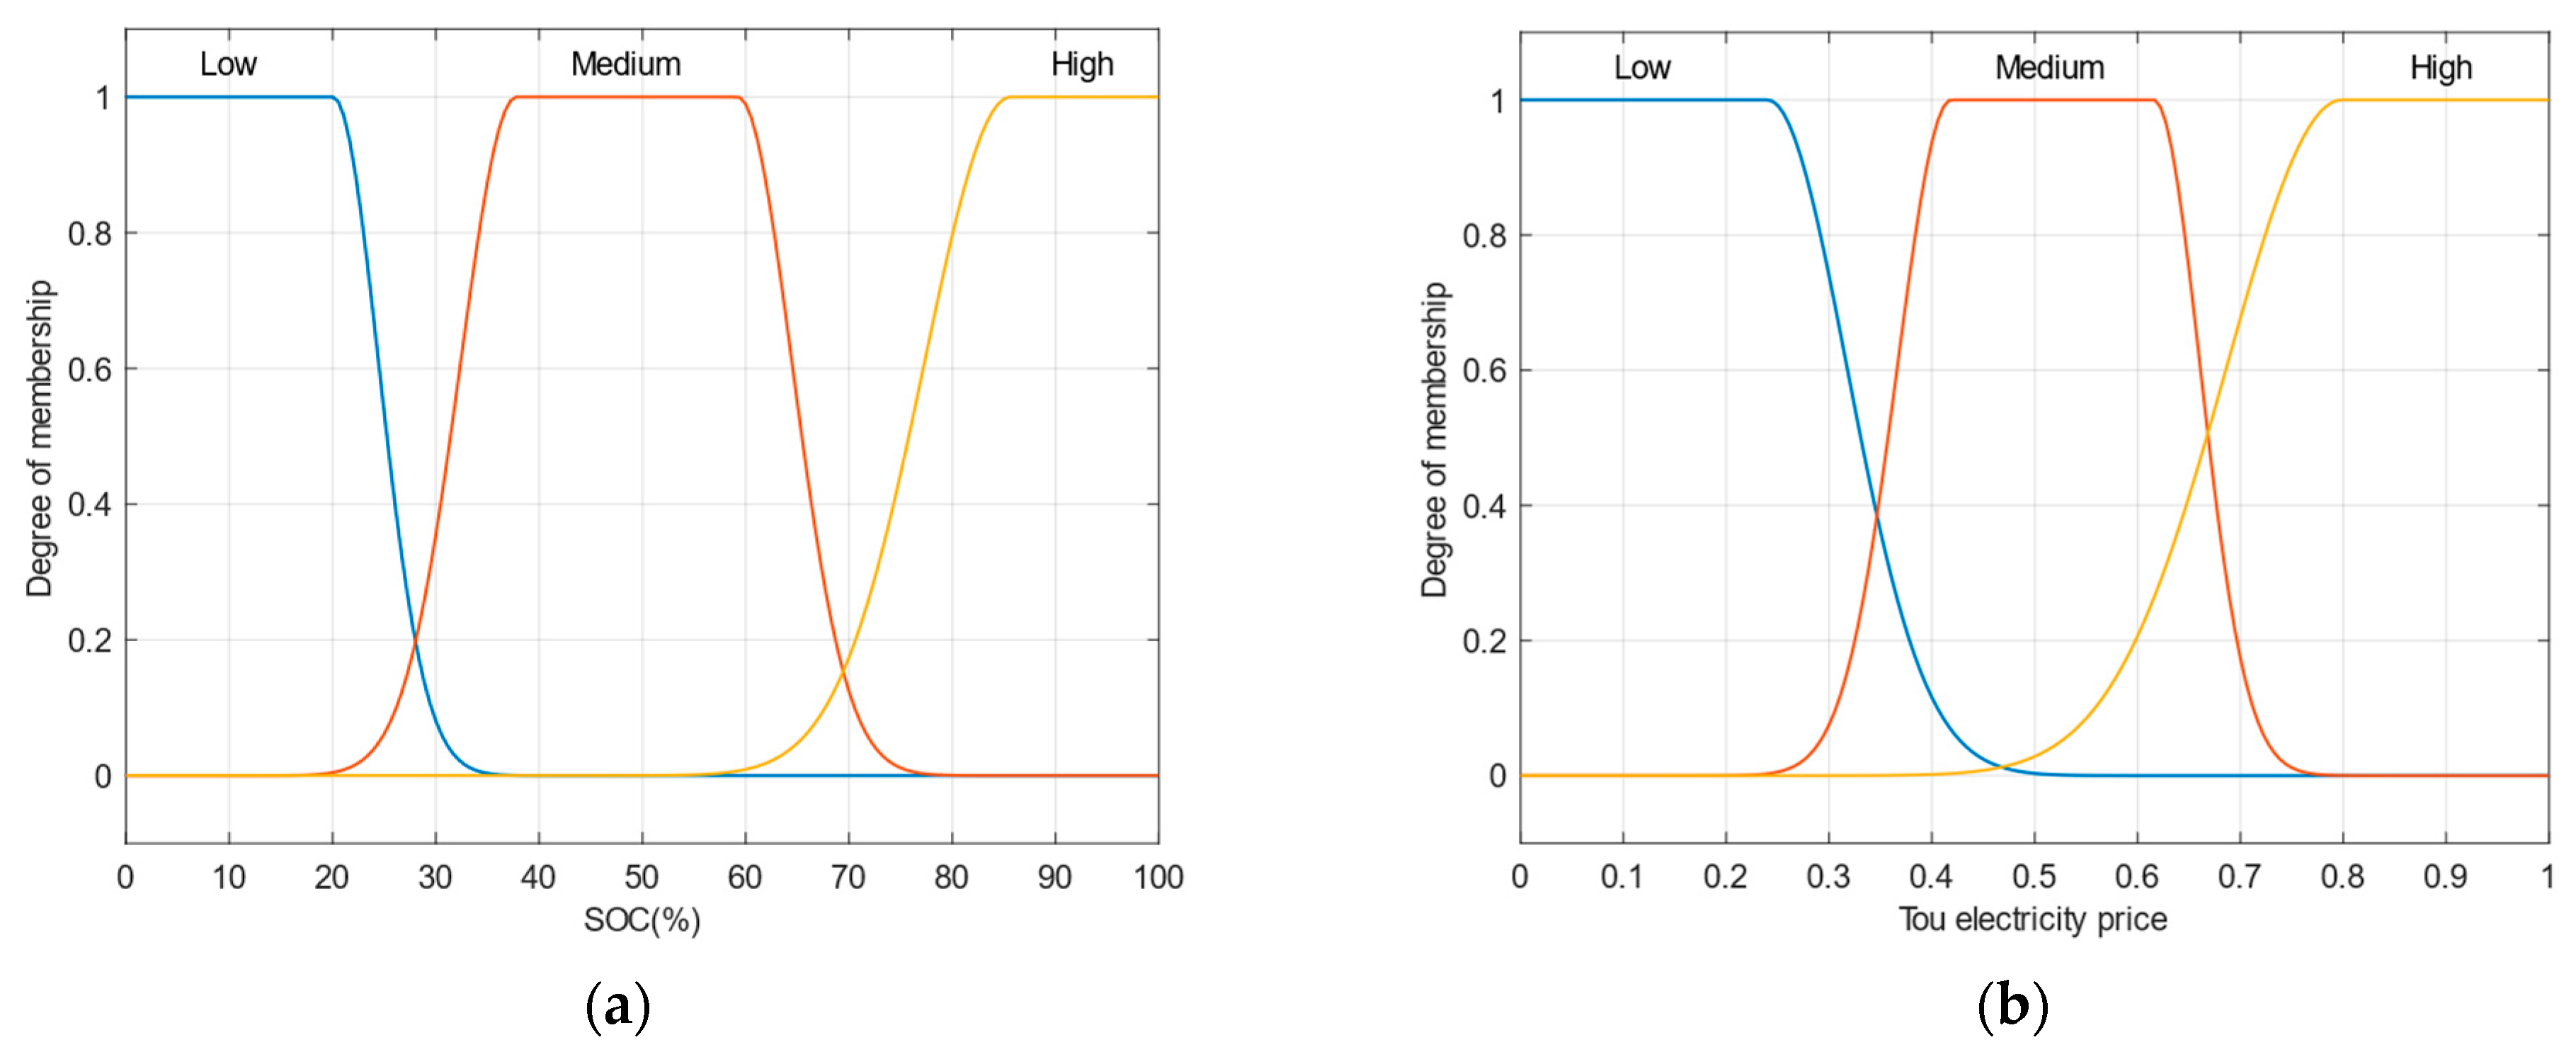
2.4.3. Charging-Probability Analysis for Flexible Users

This paper focuses on the impact of the remaining power adequacy and electricity price on the user’s willingness to charge. Since it is difficult to quantitatively analyze the user’s psychology, the charging probability that describes the user’s willingness to charge is generated based on the fuzzy reasoning system.
Firstly, the TOU price and SOC are taken as the input of the fuzzy inference system model, and the membership function of the input is set. Secondly, we edit the fuzzy inference system to set fuzzy rules. Finally, we use “defuzzification” to generate the exact output value, that is, the user’s charging probability, to generate the user’s charging-decision coefficient c.
(1)
Battery-charging status
SOC adequacy is an important indicator of charging decision. In the input membership function 1, three fuzzy subsets are used to describe the state of the battery SOC, namely “insufficient, moderate, and sufficient”. In the research process, it is generally believed that when SOC ≥ 80%, users have a greater willingness to charge; when SOC ≤ 20%, users have less desire to charge; and when 20% < SOC< 80%, consideration of other factors is involved.
(2)
Time-of-use electricity price
Tou price also has a certain degree of influence on users’ willingness to charge. By guiding users to charge during off-peak hours through electricity prices, partial load transfer can be realized, and the adverse impact of electric vehicles gathering for charging during peak hours on the power grid can be reduced. In the input membership function 2, the three-stage fuzzy subset “cheap, moderate and expensive” is used to describe the user’s judgment on the electricity price, and the electricity price membership function can be adjusted according to the charging electricity price in different cities. The grid electricity price of the studied area is shown in Table A2 in Appendix A. The above two input membership functions and the charging probability of the output are shown in Figure 3 and Figure 4.
The overall framework of layered charging-decision modeling is shown in Figure 5 below.
(1)
Calculate the remaining power of the EV and judge whether its charge status can satisfy the next trip; based on this the users are classified into rigid users and flexible users.
(2)
For rigid users, if their parking time is sufficient, they are defined as ordinary rigid users and choose the slow-charging method; if slow charging cannot meet the demand of the next trip within the parking time, they are defined as emergency rigid users and choose fast-charging method.
(3)
For flexible users, the charging tariff and the state of charge are considered to judge whether they are charged or not. Considering the battery life, the flexible users who choose to charge will give priority to the slow-charging method.

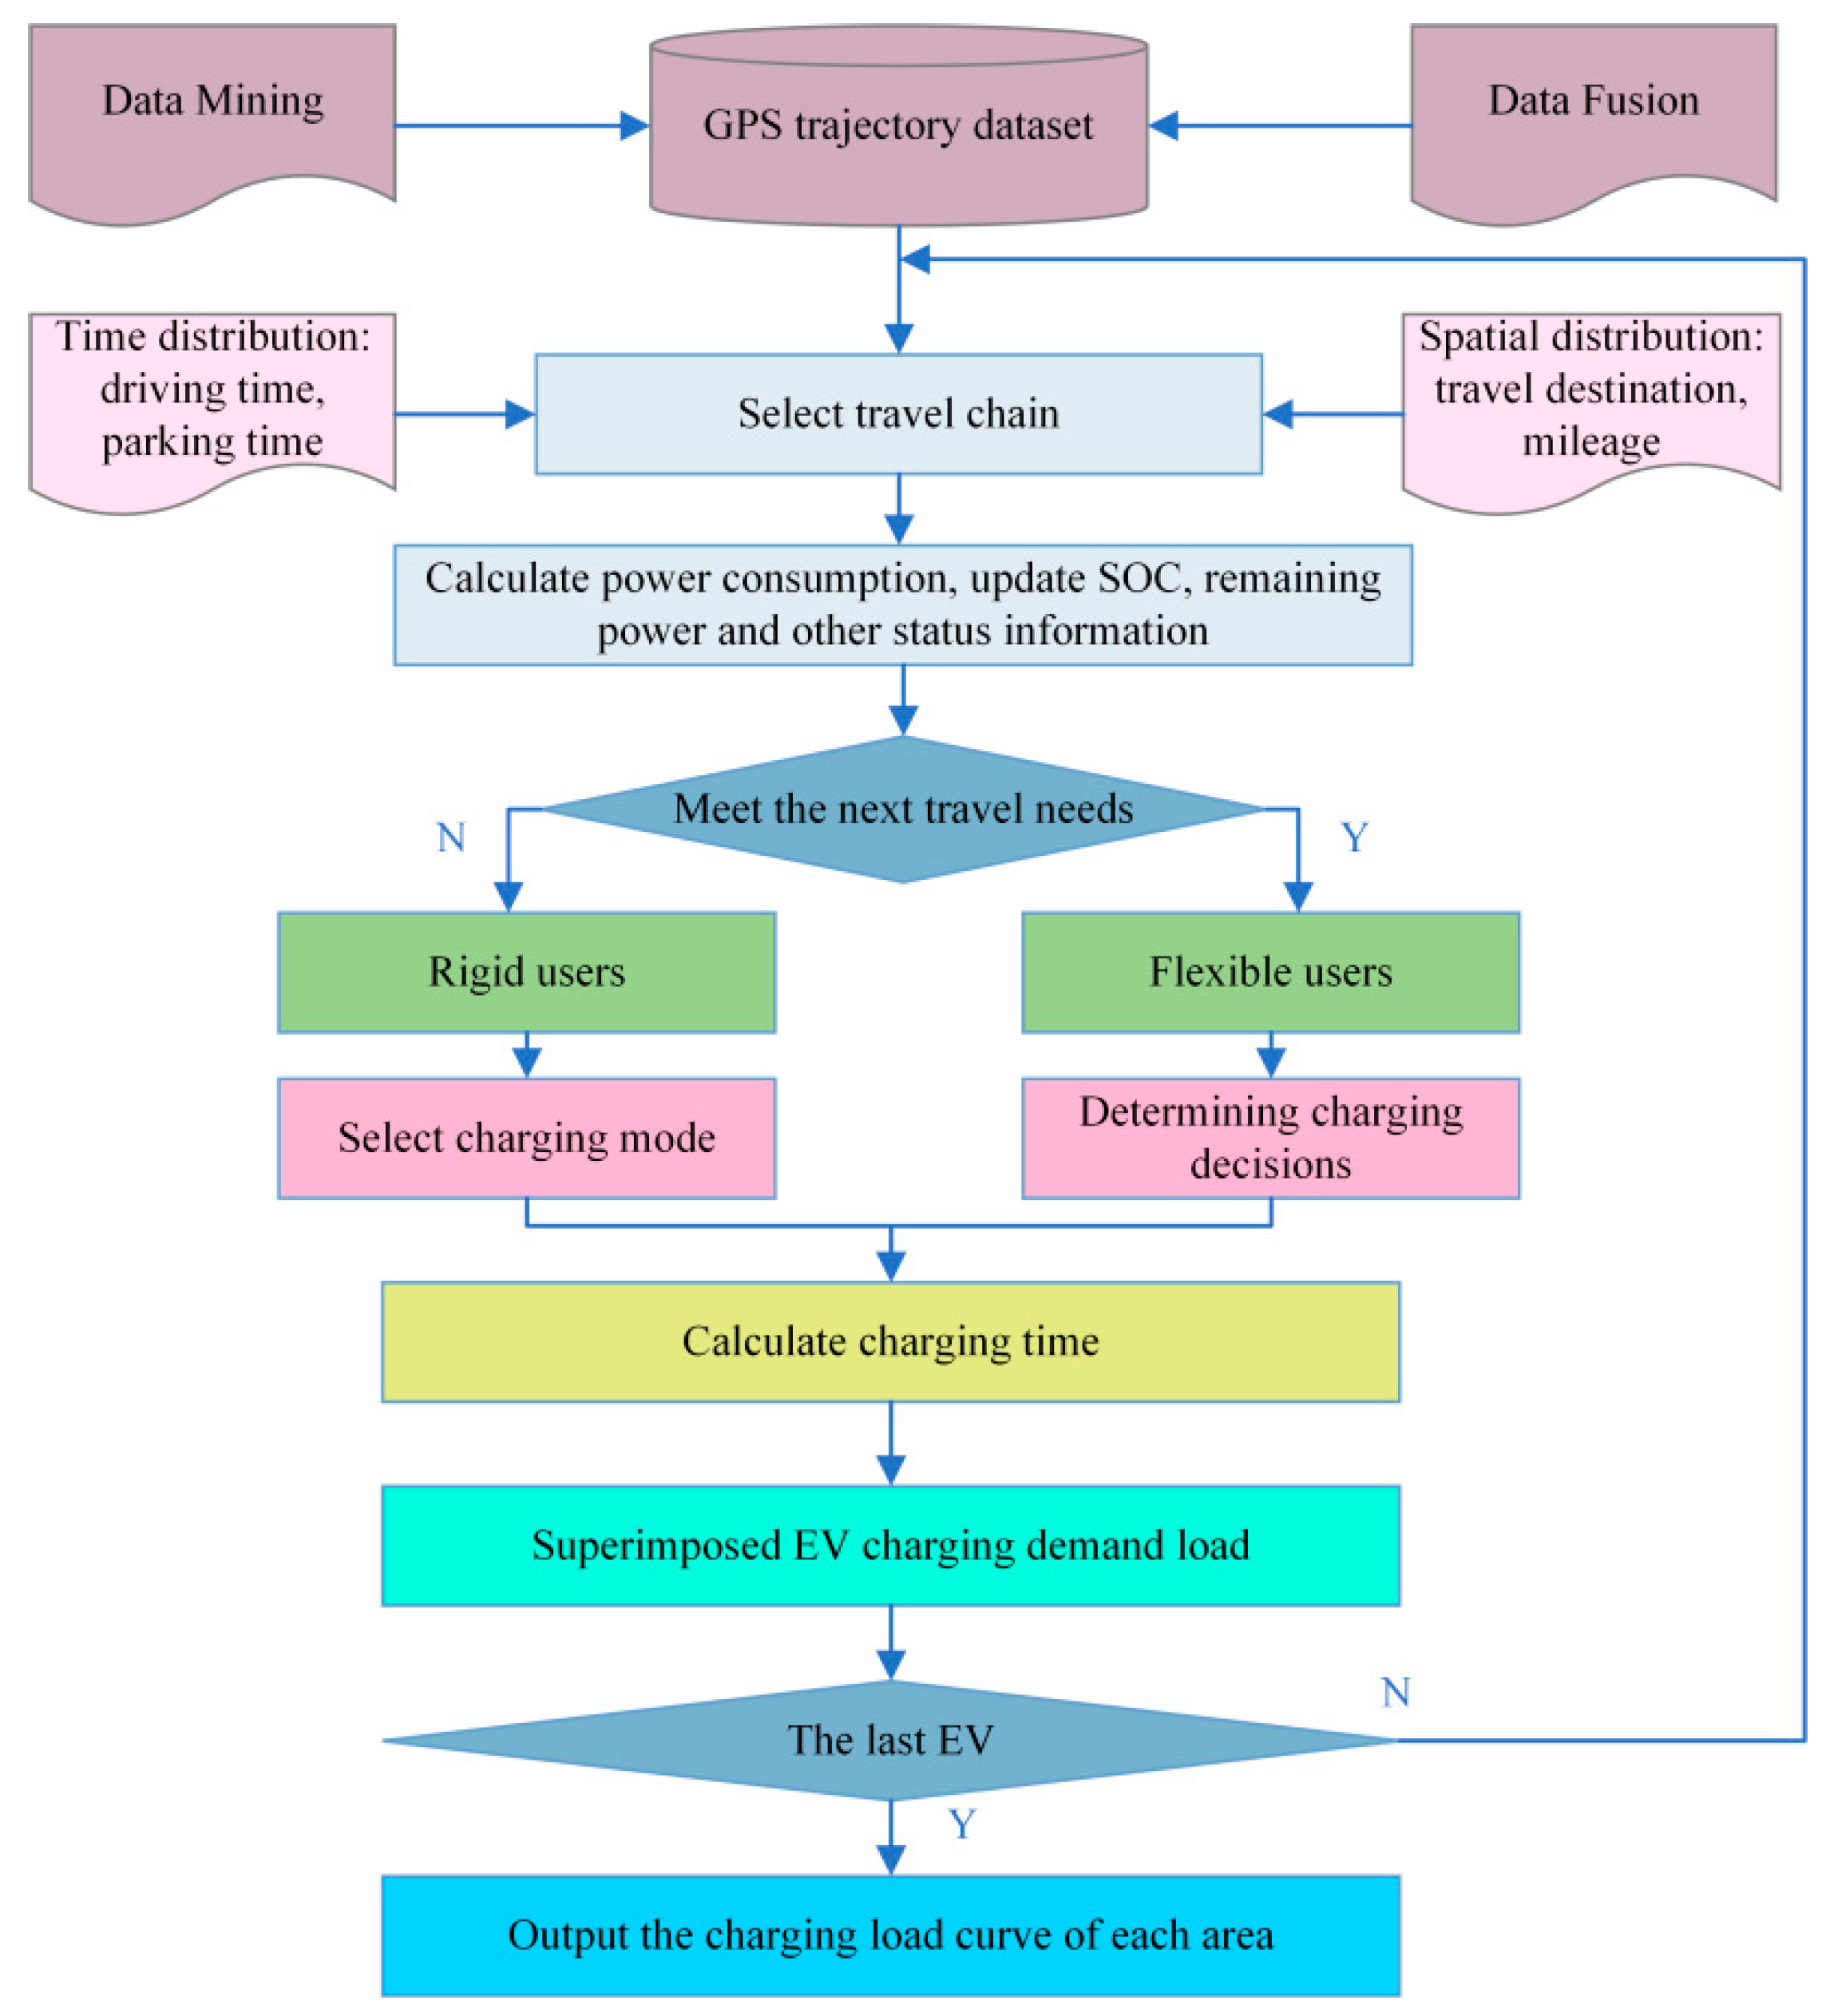
2.5. Charging-Demand Load Calculation

After analyzing the stratified charging decisions of different users in the above section, we can calculate the required charging time:
T c , u = f soc C k E t , k η c P u
where f soc is the charge-state value at the end of charging, following the normal distribution N ( 0.3 , 0.1 ) [23]; η c is the charging efficiency; and P u is the power of the charging post selected by the user in the charging station u.
The demand load of each charging node is:
P n , t = k = 1 N q t , k λ n , b , t P u
where P n , t is the charging power of the charging node n at the moment t; N is the number of charging posts contained in the charging node n; q t , k is the number of EVs at the charging station u, at the moment t; λ n , b , t is the charging status of the b-th vehicle at the charging node n, at the moment t, which is 1 when charging and 0 otherwise.
The overall spatial–temporal distribution of charging demand can be obtained by superimposing the charging demand of all EV users on the corresponding areas. The calculation process of charging demand is shown in Figure 6 below.
The specific steps for the simulation calculation are as follows:
(1)
Mine and fuse the GPS track data, analyze the characteristics of the trip chain, and simulate the spatiotemporal characteristics of users in different trips;
(2)
When a journey ends, update the status;
(3)
Simulate the user’s next trip, and calculate the user’s power demand in advance;
(4)
Classify users according to the satisfaction degree of travel power demand, and make charging decisions and judgments on charging modes for different users;
(5)
Determine the charging time distribution of electric-vehicle-charging demand in the current area, and superimpose the charging demand generated in different areas to obtain the temporal and spatial distribution of the overall charging demand.

2.6. V2G-Demand-Response Decision Model

2.6.1. V2G Penetration Threshold Model

In the initial development stage of a new thing, the public generally takes a wait-and-see attitude, until the thing penetrates the individual psychological threshold [24]. Due to the different social attributes of EV users, the bias towards new things shows a significant difference. According to the theory of innovation diffusion proposed in the literature [25], the social attributes of users are divided into four categories. This paper mainly discusses the issue of user participation in the initial stage of V2G-demand-response development. The psychological thresholds of different types of users are shown in Table A3 of Appendix A.

2.6.2. Expected Utility Model

Cost-effectiveness and battery performance are important factors that influence EV users’ participation in demand-response decisions. In addition, because of social influence and peer effects, the behavior of other users can also have an impact on the final decision. This paper comprehensively considers factors such as the individual, society, environment, and policies, and establishes an expected utility model for EV users to participate in demand response, which can be expressed as
U = β 1 U e c o + β 2 U s o + β 3 U e n v
where U e c o , Uso, U e n v are the user’s economic utility, social utility and environmental utility, respectively; β 1 , β 2 , β3 are the weight coefficients of the user’s economic utility, social utility, and environmental utility, respectively; and β 1 + β 2 + β 3 = 1 .
(1) User economic utility. The economic benefit is measured using the difference between the user’s discharge revenue IV2G and the electricity cost LV2G. The cost of electricity consists of a fixed cost and variable cost, as shown in Equation (20).
L V 2 G = ( α p EV , k τ + p ch η c η d ) E dis + ε E dis 2
where α is the ratio of the battery cost to the unit price of the whole vehicle, which is taken as 45%; p EV , k is the unit price of the k-th category EV, which is given using Appendix A, Table A3; τ is the number of cycles for which an EV battery can be charged and discharged; pch is the electric-energy-charging tariff; η d is the discharge efficiency; E dis is the amount of electricity involved in the demand response; ε is the opportunity cost coefficient of EV users; ε E dis 2 indicates the variable cost of travel convenience lost by participating in demand response.
The discharge gain of EV users participating in demand response can be calculated based on the demand response tariff compensation standard in the “Rules for Implementation of Guangzhou Virtual Power Plant” (hereafter referred to as “Rules”), as shown in Equation (21).
I V 2 G = E dis p c o m σ
where p c o m is the compensation standard unit price; σ is the response coefficient.
In this paper, the user’s economic benefit is defined as
U eco = 1 P E V p ch I V 2 G L V 2 G
where P E V is the total amount of electricity required by EV users for daily travel.
(2) Social utility. According to the principle of sociology, the behavior of users is not only affected by their own economic interests such as price and income, but it is also affected by the people around them, that is, the “group effect”. The economic levels of different EV users are distinguished according to the price difference of models, and a small-world network is randomly generated according to the literature [25] to describe the connection relationship between users of the same economic level, and the social utility is defined as
U s o = θ 1 q = 1 N M p q m q A p + θ 2 I V 2 G L V 2 G p a d
where A p is the total number of users in the social network with a similar economic level as EV user p; M p q is the element of the connection matrix between EV users, for example M p q is 1 if p is connected to q and 0 otherwise; m q is the sign of the EV user q’s participation in demand response, 1 if participation and 0 otherwise; p ad is the average daily usage cost of an EV, whose value depends on the EV purchase unit price of the corresponding user; θ 1 , θ 2 are the weight coefficient indicating the social influence of social clusters in the subjective and objective, respectively.
(3) Environmental utility. The environmental utility of EV users is defined based on the CO2 emission reduction that can be achieved with V2G response:
U eri = ( 1 R c l e a n ) ω c E dis η d ω c E dis = 1 R c l e a n η d
where R c l e a n is the proportion of clean energy power generation in the region; ω c is the carbon emission factor of coal burning.

2.6.3. Selection Probability Model for EV Users

The power satisfaction utility r is a decisive factor in whether a user participates in V2G response or not. It depends on factors such as the amount of EV discharge power involved in the demand response, the amount of EV power remaining in this segment, and the amount of power required for the next segment of the trip.
r = { 0 E t , k E dis E t + 1 , k 1 E dis E t , k E t + 1 , k E t , k E dis > E t + 1 , k
Finally, based on the improved discrete choice Logit model, the probabilistic choice model for EV users to choose to participate in V2G-demand response is obtained by considering the above utility values together:
P V 2 G = r e U r e U + e
The process of EV users participating in a V2G-demand-response selection model is shown in Figure 7 below.
The specific simulation steps are as follows:
(1)
Based on the trip chain obtained through matching, parameters such as vehicle price and psychological threshold of EV users are randomly selected and generated.
(2)
The aggregators in the study area judge the EV users’ decision to participate in V2G according to the probabilistic selection model, including three stages: charging demand confirmation, scheme evaluation, and participation decision. Firstly, it judges whether it can satisfy the next trip based on the remaining battery power, and collects information that affects the user’s participation decision, including car price, battery capacity and loss, social behavior, etc.; then, if both the charge state and the psychological threshold do not meet the requirements, the user abandons their participation in V2G, otherwise the utility value of the user’s participation in V2G and its selection probability are calculated according to the expected utility model; and finally, we use the discrete choice model to obtain their decision results, and the participation results are disseminated through social networks.
(3)
Count the number of EVs participating in V2G-demand response in the study area, determine whether traversal is completed for all EV users, and if traversal is completed, terminate the procedure and save the obtained number of EV-user participants for response scheduling in subsequent sections.

3. V2G-Demand-Response Scheduling Model

As a distributed response resource, EV has good schedulability. Through reasonable planning and layout, renewable energy can be absorbed to the maximum extent under the premise of meeting the needs of users, and improve the safety, stability and economy of power grid operation. Therefore, through the unified regulation and management of EV aggregators, EV users who are willing to participate in the discharge-demand response are included in the scheduling range in order to maximize the optimization effect of the EV cluster.

3.1. Response Capacity and Response Time of EV Users

The capacity and time for EV customers to participate in demand response are determined according to the rules. In principle, the real-time demand response of a single EV user is limited to four times per month, and each time is limited to 2 h. Therefore, the average daily demand-response time is expressed in the form of expectation, i.e., E = 0.4 h (considering weekday time only). In addition, according to the charging facility standard of an EV conductive charging interface, the discharge-demand response involved in this paper is carried out on the slow-charging pile. The average daily discharging volume of users is
E d i s = η d E P u

3.2. Objective Function

The EV users participate in the scheduling of V2G-demand response mainly to reduce the system load fluctuation [26] and increase the user’s revenue, and the optimization variables are the charging and discharging power of EVs during the scheduling period.
(1)
Minimization of grid load fluctuations. In this paper, the daily load mean squared difference is introduced to characterize the system load volatility:
f 1 = t = 1 96 ( P L , t + a = 1 n P a , t + P b a t , t P P V , t D a , t D b a t , t P a v r ) 2
P a v r = t = 1 96 P L , t + P b a t , t + a = 1 n P a , t 96
where f 1 is the mean square difference of system load; P L , t is the conventional load; P a , t is the charging power of EV at time t; P b a t , t is the charging power of energy storage at time t; P P V , t is the PV output; D a , t is the discharging power of EVA at time t; D b a t , t is the discharging power of energy storage at time t; P a v r is the daily average load of the region; and the dispatching period set in the paper is one day, divided into 96 dispatching periods.
(2)
Minimal cost of electricity for customers.
min f 2 = t = 1 96 i = 1 N ( C i , t , c h + z i , t L V 2 G , i , t C i , t , d i s c h )
C i , t , c h = P i , t p c h , t u i , t Δ t η c
C i , t , d i s c h = D i , t p c o m , t z i , t Δ t η d
where Ci,t,ch, Ci,t,disch are the charging cost and discharging benefit of EV users, respectively; u i , t denotes the EV-charging state at moment t, 1 for charging and 0 for not charging; zi,t denotes the EV-discharging state at moment t, 1 for discharging and 0 for not discharging.

3.3. Constraints

(1)
Power balance constraint
P P V , t + D a , t η d + D b a t , t η b a t , d = P a , t η c + P b a t , t η b a t , c + P L , t
where P P V , t is photovoltaic output; D a , t is the discharge power of EVA at time t; η d is the discharge efficiency; η c is the charging efficiency; D b a t , t is the energy storage discharge power at time t; pbat,t is the energy storage charging power at time t; η b a t , c is the energy storage charging efficiency; η b a t , d is the energy storage discharge efficiency; and P L , t is the base load.
(2)
PV-output constraint
0 P P V , t P P V max
where P P V max is the upper limit of PV output in the time period t.
(3)
EVA discharge power constraint
According to the rules, the single EV user is only allowed to participate in one response on that day, the discharge power of EVA can be controlled using Equations (35) and (36).
0 < D a , t N V 2 G , t E d i s
(4)
Battery state-of-charge constraint
S O C min S O C t S O C max
where S O C max , S O C min indicates the upper and lower limits of the battery-charging state, with values of 0.9 and 0.2, respectively.
(5)
Charging and discharging mutual exclusion constraint
In order to prevent the mutually exclusive state of charging and discharging of energy storage in the scheduling process, state constraints are introduced.
B c h a , t { 0 , 1 } , B d i s , t { 0 , 1 }
u i , t + v i , t 1
where B c h a , t denotes the storage charging state at moment t; B d i s , t denotes the storage discharging state at moment t. Both are binary variables.

3.4. Solution Method

In this paper, the lpopt optimizer is used to solve linear programming problems on the matlab platform. It is used together with YALMIP to convert linear programming problems into a YALMIP format and to solve them using the lpopt function. In this paper, the weighted method is used to convert multiple targets into single targets for solving. At the same time, the PV consumption can be added to the penalty term of light abandonment.

4. Case Study

4.1. Parameter Analysis

4.1.1. Regional EV Data

The EV ownership and vehicle types in the study area are derived from the “No.1 Electric Network” (https://www.d1ev.com/, accessed on 1 July 2023), as shown in Table 1, and the top 10 vehicles with the ownership are taken as the research objects. According to the unit price of less than 100,000, 100,000~200,000, and more than 200,000, it is divided into low, medium and high, three grades, which provides a reference for the heterogeneity of EV users’ participation in V2G-demand response.

4.1.2. Charging Power and Efficiency

According to the research on the existing charging power in the market, the slow-charging power is set to 7 kW, the fast-charging power is set to 30 kW, the charging process is considered constant power charging, and the charging and discharging efficiency is taken as 0.9.

4.1.3. POI Data Analysis

In order to better simulate the charging demand of different locations, the API interface provided by the Autonavi open platform (https://jiaotong.amap.com, accessed on 1 June 2023) is used to climb the geographical POI data of charging pile in the studied city. The dataset includes the longitudinal and latitudinal coordinates of charging stations, street addresses of charging stations, and the urban area to which they are located. At the same time, the POI data were cleaned, the POI information of charging stations in the study area was screened, and 62 POI points in the study area were obtained.

4.2. Result Analysis

4.2.1. Zoning of Charging Stations

The k-mean clustering algorithm was used to cluster the latitudinal and longitudinal coordinates of charging stations in the study area, and the optimal number of clusters k = 8 was determined by evaluating the clustering model based on the contour coefficients and SSE (sum of squares of errors) coefficients using Python’s scikit-learn machine learning algorithm package. The results of the regional division are shown in Figure 8, which is used as the basis for the division of charging demand on different geographic spaces.
The hollow points with different colors in Figure 8 represent the POI data results of the study area; the charging nodes obtained using the clustering algorithm are shown with solid points. The clustering algorithm is used to obtain charging nodes in eight different regions, among which the maximum number of charging stations contained in the charging nodes is 11, that is, the region of charging node eight in Figure 8. The minimum number of charging stations is four, which is the area of charging node five and charging node eight in Figure 8.

4.2.2. Comparison of Micro Dynamic Energy Consumption and Fixed Mileage Energy Consumption

The traditional energy consumption of electric vehicles is usually calculated using mileage and fixed energy consumption per unit mileage. The estimation method does not consider the running condition of electric vehicles on the actual road, which is somewhat deviated from the real situation. Therefore, based on micro driving parameters such as speed and acceleration, this paper established a micro energy consumption model of electric vehicles in polynomial form, and compared the energy consumption results of the dynamic energy consumption model and the fixed energy consumption model, as shown in Figure 9.
As can be seen from Figure 9, the average value of power consumption obtained from the dynamic energy consumption model is 1.4 times higher than that of the fixed energy consumption model, which is mainly due to the following reasons: it is influenced by the actual traffic conditions; EVs start and stop frequently during driving; and the dynamic energy consumption model takes into account the acceleration, constant speed, deceleration, and idling conditions when EVs are driving, resulting in large fluctuations in EV energy consumption changes.

4.2.3. Fuzzy Reasoning System Evaluation

The charging state and time-of-use tariff signals are input into the fuzzy logic controller, and the resulting charging probability distribution is shown in Figure 10.
From Figure 10, it can be seen that when EVs arrive at their destinations at a time of low electricity price, and the battery-charge state is less than about 20%, users are very willing to charge; on the contrary, if they are at a peak-hour electricity price and the battery-charge state is high, EV users are less likely to charge, considering the charging cost and mileage sensitivity.

4.2.4. Regional-Charging-Demand Estimation

Taking 0.5 h as the time interval, based on the proposed charging-demand model, the charging-demand loads of EV users on working days and rest days are, respectively, obtained, as shown in Figure 11.
As can be seen from Figure 11a, because the average daily charging times of private car users are less than or equal to one, and are influenced by factors such as the time-sharing tariff and charge status, charging demand is mainly concentrated in the period 42~48, and in the period 0~12, with a charging peak occurring at period 0, and its charging demand load is 4208 kW, while the period 14~18 is the main time period for users to travel and commute, the charging demand in each region is low at this time. In addition, comparing different regional sections, it can be seen that the charging demand in regions 1 and 8 is the largest, and the main reason for this phenomenon is that these two regions have the largest number of charging stations and are densely populated.
It can be seen from Figure 11b that, although the charging demand in most areas on rest days is relatively average, the highest charging demand is generally higher than that on working days. It can be seen from the cross-section charging load at different times that the peak charging demand occurs at period 39, at which the charging load is as high as 6381 kW. From a regional perspective, the charging demand in each region has not changed much, but relatively speaking, the charging demand of nodes 4, 5, and 7, which have a small number of charging stations, has declined. This further shows that the charging demand of EVs on rest days is more random regarding time and space.

4.2.5. EV Users Participate in V2G Decision-Making Behavior

The charging demand of electric vehicles and its temporal and spatial distribution have been discussed above. This section will further discuss the proportion of electric vehicles that can participate in the discharge-demand response and the economic benefits of V2G users participating. The quantity distribution of different vehicle types participating in V2G-demand response is shown in Figure 12.
As can be seen from Figure 12, there are significant differences in the participation of different types of EVs in V2G-demand response. Model 1, with its relatively large battery capacity and low-grade price, results in a high percentage of V2G participation of about 86% for this type of EV user. For models 5 and 9, which are also low-grade vehicles, they have high participation percentages of 75% and 84%, respectively. In addition, models 4, 8, and 10 have relatively low V2G participation ratios of 4.2%, 3.4%, and 3.9%, respectively. The main reason for their low participation ratios is that the battery capacity of these three types of EVs is less than or equal to 20 kWh (of which models 4 and 8 are hybrid models), and EV users’ participation in V2G discharge will generate significant mileage anxiety.
Through the analysis of different utility values of various EVs, it can be seen that although the battery capacity of model 3 is large, its participation in the discharge ratio is less than 50%, which may be affected by its high-end price and similar social groups. In addition, because the discharge cost of hybrid vehicles is relatively high, its participation is lower. It can be seen that factors such as battery capacity, price, and discharge cost will restrict the enthusiasm of different types of EVs to participate in V2G-demand response.
Next, the economic benefits of different EV users’ participation in V2G are analyzed, as shown in Figure 13.
It can be seen in Figure 13 that the left vertical coordinate indicates the cost effectiveness of different types of EVs participating in V2G-demand response, and its value depends on the ratio of response compensation unit price to the unit discharge cost of each EV, and the right vertical coordinate indicates the economic benefit compensation value obtained with different types of EVs participating in the response. From the figure, it can be seen that the economic-compensation benefit of models 4, 8, and 10 is low, which is mainly due to the limitation of battery capacity. Meanwhile, the remaining EVs of each type can obtain certain benefits.

4.2.6. Analysis of Optimization-Scheduling Results

According to the optimization model proposed in Section 3 above, based on the MATLAB R2018b platform, the adjustment effect of EV participation in demand response in the study area is analyzed by selecting different scenarios with a scheduling cycle of one day and a step size of 15 min.
Scenario 1: Electric vehicles are charged in an orderly manner, and only the V2G discharge response of electric vehicles is considered.
As can be seen from Figure 14, the actual effect of EV users’ participation in V2G-demand response in this region is not obvious. It can be calculated that the period of EV users’ participation in peak load response is from 11:00 to 12:00, and the total response in this period is only 5.05 MW·h. At the same time, the analysis shows that the poor adjustment effect is mainly limited by the following factors:
(1)
The discharge compensation rules adopted in this paper limit the time and number of EV users participating in V2G response, resulting in a low total EV response;
(2)
Considering factors such as electric vehicle discharge safety and the idle proportion of slow pile filling during the day, this paper assumes that electric vehicles participate in the V2G-discharge process using slow-power filling, resulting in a low discharge power in this process;
(3)
Due to the low EV permeability in the study area, the EV-charging demand accounts for a low proportion of the load demand in the region, resulting in a small number of EVs that can participate in the demand response.
Scenario 2: Orderly charging of electric vehicles, while considering their synergy with PV and energy storage.
On the basis of scenario 1, the impact of V2G-discharge response and the impact of the synergistic operation of a photovoltaic storage system on the regional grid is further analyzed. The load curve and the output of PV and energy storage systems after dispatch are shown in Figure 15 and Figure 16.
It can be seen from Figure 15 that during the period from 4 to 28, the electricity price of the grid is the lowest throughout the day, and at this time dispatched electric vehicles actively participate in charging. From period 28 to 40, the electricity price of the grid is moderate, and electric vehicles continue to charge, and at this time photovoltaics begin to generate power, and the total power is the electric vehicle charging power and load power minus the photovoltaic output. During the period from 40 to 48 and the period 56 to 84, the electricity price of the grid is the highest, and electric vehicles start to discharge to provide power for the load, and at the same time, the energy storage will also be discharged to the grid after period 20. In general, the coordinated scheduling of V2G and solar storage has played a good role in peak shaving and valley filling.
As can be seen from Figure 16, the PV storage participates in peak shaving and valley filling with obvious effect. The grid mainly prioritizes the consumption of new energy output, and the PV consumption rate reaches 87.59%, of which 92.86% is used for peak shaving and valley filling, and 7.14% is stored in the storage system. The synergy between the photovoltaic storage system and electric vehicles eases the pressure of traditional unit peaking and improves the economic and environmental benefits of the grid.
Then, the results of each objective function in the two scenarios are compared, as shown in Table 2.
It can be seen from Table 2 that in terms of load fluctuations, the orderly charging and discharging of electric vehicles and the coordinated scheduling of energy storage reduce the load variance by 36.8%, reduces the system load volatility, and avoids the phenomenon of “peak on top of peak”. In terms of user benefits, the access to new energy sources reduces the cost of power grid purchases, which in turn lowers the price of EV-charging electricity, and reduces user electricity costs by 55.1%.
This shows that V2G and photovoltaic coordinated dispatching provide power to the grid, balance load needs, reduce load fluctuation, improve system stability, and protect the interests of users.

5. Conclusions

Firstly, GPS data of EVs in the study area, charging station data, and EV parameters are processed, and then a charging probability model based on GPS trajectory data is proposed to derive the charging-demand distribution of EVs across time and space; secondly, based on utility theory, a decision model of EV users’ participation in V2G-demand response is established to obtain the probability of EVs’ participation in discharge response; Finally, a V2G-demand-response scheduling model is established and the regulation effect of EV charging and discharging on the grid is analyzed. The following conclusions are reached:
(1)
The EV-charging-demand load obtained using GPS trajectory data is more consistent with the actual charging situation of domestic EV, which not only improves the accuracy of charging demand estimation at different periods, but also obtains the spatiotemporal distribution of charging demand.
(2)
The charging and discharging behavior of EV users is very random, and the charging probability generated using the fuzzy reasoning system is the most important factor affecting the charging state. In the probabilistic choice model of V2G-demand response, the enthusiasm of EV users to participate in the response is mainly affected by the EV battery capacity and cost benefit.
(3)
The adjustment effect of V2G on the power grid is very small, and the cooperation of EV charging and discharging with the output of other new energy units in the region can improve the consumption level of new energy and also play a good role in the stable regulation of the power grid. In addition, the potential of EV participation in V2G regulation is affected by many aspects, such as discharge compensation rules, discharge power size, EV price changes, etc., which can provide policy guidance for relevant departments in the region.
In the process of data mining, this paper is limited by the dimension and scale of open source data, and needs to explore massive open source data information. In addition, since the development of V2G-demand response is still in the experimental stage, the decision results in this paper are difficult to fit and revise with reference to the historical data. In the future, a machine learning classification algorithm or reinforcement learning method can be considered to build a more accurate EV-user decision model with the support of the relevant data. Finally, after the full analysis of the decision-making model of EV users’ participation in V2G, the influence of EV on the power quality of the distribution network can be further explored.

Author Contributions

Conceptualization, G.Z., T.X. and K.Z.; methodology, G.Z., T.X. and K.Z.; software, G.Z. and T.X.; validation, H.L. (Hong Liu) and T.X.; formal analysis, H.L. (Hong Liu), H.L. (Hua Li) and K.Z.; investigation, H.L. (Hong Liu), H.L. (Hua Li) and R.W.; resources, R.W.; data curation, H.L. (Hong Liu), H.L. (Hua Li) and R.W.; writing—original draft preparation, H.L. (Hong Liu); writing—review and editing, T.X. and K.Z.; visualization, H.L. (Hong Liu); supervision, K.Z.; project administration, G.Z., H.L. (Hua Li) and R.W.; funding acquisition, H.L. (Hua Li) and R.W. All authors have read and agreed to the published version of the manuscript.

Funding

The work described in this paper is funded by a research grant from the Shaanxi Provincial Natural Science Basic Research Program (Youth Project) (Grant Nos. 2022JQ-534) and the National Natural Science Foundation of China Joint Fund (Grant Nos. U1965202).

Data Availability Statement

The data presented in this study are available on request from the corresponding author. The data are not publicly available due to GPS-related data is the user’s personal privacy.

Conflicts of Interest

Authors Hua Li and Ruogu Wang were employed by the company State Grid Shaanxi Electric Power Co., Ltd., Electric Power Research Institute. The remaining authors declare that the research was conducted in the absence of any commercial or financial relationships that could be construed as a potential conflict of interest.

Appendix A

Table A1. Description of GPS trajectory data.
Desensitized Information for DriversDesensitized Information for OrdersTimestampLongitudeLatitude
7bb6f**********48f84de247**********3d97b1478504981104.0988630.65442
7bb6f**********48f84de247**********3d97b1478504984104.0989830.65462
7bb6f**********48f84de247**********3d97b1478504987104.0991730.65492
7bb6f**********48f84de247**********3d97b1478504990104.0993630.65523
The content of the * is either a number or a letter, which is set to protect the privacy of the user’s data.
Due to the duplication or inconsistency between the track and the order data in the data, and as the original data sample is too large, the original data need to be preprocessed:
(1)
The trajectory data are arranged in time series by order, and the single-day data are divided into several sets.
(2)
The range of selected research areas is 104.0081~104.1504, 30.6010~30.7212.
(3)
Delete orders with a travel time less than 300 s [27], and delete multiple duplicates within a short distance in the same order.
(4)
Delete the trajectory data whose instantaneous speed is greater than 120 km/h. The calculation formula of the instantaneous speed is as follows:
When the trajectory point p is the starting point of the trip:
v p = ( x p + 1 x p ) 2 + ( y p + 1 y p ) 2 t p + 1 t p
When the trajectory point p is the middle point of the trip:
v p = ( x p + 1 x p ) 2 + ( y p + 1 y p ) 2 t p + 1 t p + ( x p x p 1 ) 2 + ( y p y p 1 ) 2 t p t p 1 2
When the trajectory point p is the end of the trip:
v p = ( x p x p 1 ) 2 + ( y p y p 1 ) 2 t p t p 1
Table A2. Peak and valley electricity prices in different periods of the power grid.
Period of TimeElectricity Price/CNY (kWh)−1
Peak time period (11:00–12:00, 14:00–21:00)0.22
Normal time period (7:00–11:00, 12:00–14:00, 21:00–23:00)0.55
Low time period (23:00–23:45, 00:00–7:00 the next day)0.88
Table A3. EV-user-behavior-classification information.
TypeProportion/%Psychological Threshold
innovator2.500
early adopter13.50.05
early/late follower68.00.15
laggard16.00.35

References

  1. Zang, J.; Li, C. Adjustment and Interpretation of New Energy Automobile Industry Development Plan (2021–2035). Automot. Tech. 2021, Z1, 32–34. [Google Scholar]
  2. Chen, L.; Zhang, Y.; Figueiredo, A. Overview of charging and discharging load forcasting for electric vehicles. Autom. Electr. Power Syst. 2019, 43, 177–197. [Google Scholar]
  3. Zhang, M.; Cai, Y.; Yang, X.; Li, L. Analysis method of charging demand Distribution for household electric vehicles considering user charging differences. Electr. Power Autom. Equip. 2020, 40, 154–163. [Google Scholar]
  4. Huang, N.; Liu, D.; Cai, G.; Pan, X.; Zhang, L. Charging Load Interval Prediction for electric Vehicles Based on Multi-Correlated Daily Scenarios. Proc. CSEE 2021, 41, 7980–7990. [Google Scholar]
  5. Xing, Q.; Chen, Z.; Zhang, Z.; Huang, X.; Leng, Z.; Sun, K.; Chen, Y.; Wang, H. Charging Demand Forecasting Model for Electric Vehicles Based on Online Ride-Hailing Trip Data. IEEE Access 2019, 7, 137390–137409. [Google Scholar] [CrossRef]
  6. Zhang, Y.; Guo, L.; Liu, Y.; Li, X.; Yin, C. Numerical modeling method of charging load Probability Distribution for electric vehicles. Autom. Electr. Power Syst. 2021, 45, 61–70. [Google Scholar]
  7. Zhang, Q.; Wang, Z.; Tan, W.; Liu, H.; Li, C. Spatial-temporal Distribution Prediction of electric vehicle Charging load Based on MDP Random Path Simulation. Autom. Electr. Power Syst. 2018, 42, 59–66. [Google Scholar]
  8. Li, H.; Song, Y.; Li, S.; Zhu, Y.; Kang, Y.; Dong, H. Charging load forecasting method for electric vehicles based on ArcGIS network structure and traffic congestion analysis. Grid Technol. 2024, 1–14. [Google Scholar] [CrossRef]
  9. Shi, R.; Li, S.; Zhang, P.; Lee, K.Y. Integration of renewable energy sources and electric vehicles in V2G network with adjustable robust optimization. Renew. Energy 2020, 153, 1067–1080. [Google Scholar] [CrossRef]
  10. Shang, Y.; Shang, Y.; Yu, H.; Shao, Z.; Jian, L. Achieving efficient and adaptable dispatching for vehicle-to-grid using distributed edge computing and attention-based LSTM. IEEE Trans. Ind. Inform. 2021, 18, 6915–6926. [Google Scholar] [CrossRef]
  11. Gamil, M.M.; Senjyu, T.; Masrur, H.; Takahashi, H.; Lotfy, M.E. Controlled V2Gs and battery integration into residential microgrids: Economic and environmental impacts. Energy Convers. Manag. 2022, 253, 115171. [Google Scholar] [CrossRef]
  12. Kandpal, B.; Pareek, P.; Verma, A. A robust day-ahead scheduling strategy for EV charging stations in unbalanced distribution grid. Energy 2022, 249, 123737. [Google Scholar] [CrossRef]
  13. Liu, D.; Sun, Y.; Qu, Y.; Li, B.; Xu, Y. Analysis and accurate prediction of user’s response behavior in incentive-based demand response. IEEE Access 2018, 7, 3170–3180. [Google Scholar] [CrossRef]
  14. Jiang, J.; Kou, Y.; Bie, Z.; Li, G. Optimal real-time pricing of electricity based on demand response. Energy Procedia 2019, 159, 304–308. [Google Scholar] [CrossRef]
  15. Liu, X. Research on flexibility evaluation method of distribution system based on renewable energy and electric vehicles. IEEE Access 2020, 8, 109249–109265. [Google Scholar] [CrossRef]
  16. Wu, W.; Lin, B. Benefits of electric vehicles integrating into power grid. Energy 2021, 224, 120108. [Google Scholar] [CrossRef]
  17. Zhang, Q.; Tan, W.; Cai, J.; Wang, Z.; Li, C. Electric vehicle Discharge Price Negotiation Strategy based on Fuzzy Bayes Learning. Proc. CSEE 2018, 38, 61–71+343. [Google Scholar]
  18. Mu, Y.; Wu, J.; Jenkins, N.; Jia, H.; Wang, C. A Spatial–Temporal model for grid impact analysis of plug-in electric vehicles. Appl. Energy 2014, 114, 456–465. [Google Scholar] [CrossRef]
  19. Wen, J.; Tao, S.; Xiao, X.; Luo, C.; Liao, K. Electric Vehicle Charging Demand Analysis based on Stochastic Travel Chain Simulation. Power Grid Technol. 2015, 39, 1477–1484. [Google Scholar]
  20. Fiori, C.; Montanino, M.; Nielsen, S.; Seredynski, M.; Viti, F. Microscopic energy consumption modelling of electric buses: Model development, calibration, and validation. Transp. Res. Part D Transp. Environ. 2021, 98, 102978. [Google Scholar] [CrossRef]
  21. Huber, J.; Dann, D.; Weinhardt, C. Probabilistic forecasts of time and energy flexibility in battery electric vehicle charging. Appl. Energy 2020, 262, 114525. [Google Scholar] [CrossRef]
  22. Zhang, H.; Hu, Z.; Song, Y.; Xu, Z.; Jia, L. Electric vehicle charging load Forecasting Method considering Spatiotemporal Distribution. Autom. Electr. Power Syst. 2014, 38, 13–20. [Google Scholar]
  23. Arias, M.B.; Kim, M.; Bae, S. Prediction of electric vehicle charging-power demand in realistic urban traffic networks. Appl. Energy 2017, 195, 738–753. [Google Scholar] [CrossRef]
  24. Yang, W.; Xiang, Y.; Liu, J.; Gu, C. Electric vehicle scale evolution Model based on Multi-agent Technology. Power Grid Technol. 2017, 41, 2146–2154. [Google Scholar]
  25. Yang, W.; Xiang, Y.; Liu, J.; Gu, C. Agent-Based Modeling for Scale Evolution of Plug-In Electric Vehicles and Charging Demand. IEEE Trans. Power Syst. 2018, 33, 1915–1925. [Google Scholar] [CrossRef]
  26. Gong, S.; Cheng, V.H.S.; Ardeshiri, A.; Rashidi, T.H. Incentives and concerns on vehicle-to-grid technology expressed by Australian employees and employers. Transp. Res. Part D Transp. Environ. 2021, 98, 102986. [Google Scholar] [CrossRef]
  27. Zhou, C.; Xiang, Y.; Tong, H.; Rao, P.; Qing, Y.; Liu, Y. Estimation of electric vehicle charging demand and V2G adjustable capacity driven by trajectory data. Autom. Electr. Power Syst. 2022, 46, 46–55. [Google Scholar]
Figure 1. Overall framework diagram.
Energies 17 00812 g001
Figure 2. EV-user travel chain.
Energies 17 00812 g002
Figure 3. The input membership function of each variable, (a) SOC, (b) TOU.
Energies 17 00812 g003
Figure 4. Output membership function of fuzzy inference system.
Energies 17 00812 g004
Figure 5. Hierarchical charging-decision-making process.
Energies 17 00812 g005
Figure 6. Charging-demand-calculation flowchart.
Energies 17 00812 g006
Figure 7. Decision-making flowchart for EV users to participate in demand response.
Energies 17 00812 g007
Figure 8. POI clustering results of charging stations.
Energies 17 00812 g008
Figure 9. Comparison graph of energy consumption results.
Energies 17 00812 g009
Figure 10. Charging probability distribution based on fuzzy inference. (When the color of the figure transitions from a cool tone to a warm tone, the probability of charging increases accordingly).
Energies 17 00812 g010
Figure 11. EV-charging-demand load, (a) working days, (b) rest days.
Energies 17 00812 g011
Figure 12. Different types of EV users participate in V2G-demand response.
Energies 17 00812 g012
Figure 13. Economic benefits and cost performance of different EV users participating in V2G.
Energies 17 00812 g013
Figure 14. Economic benefits and cost performance of different EV users participating in V2G.
Energies 17 00812 g014
Figure 15. Scheduling results of scenario 2.
Energies 17 00812 g015
Figure 16. Scheduling results of photovoltaic storage system, (a) PV output, (b) energy storage output.
Energies 17 00812 g016
Table 1. EV distribution of the top 10 regions.
EV TypeInventory/VehicleBattery Capacity/(kW·h)Endurance Mileage/kmPrice Bracket
Geely-Emgrand609952500Low-grade
Mustang EC70435849304Mid-grade
Tesla modelX3467100605High-grade
BMW-520PHEV253418 (Hybrid)95High-grade
BYD-Yuan197150401Low-grade
Denza170370451Mid-grade
Dongfeng-Junfeng165031255Low-grade
BYD-Tang165618 (Hybrid)90Mid-grade
BAIC EU143145300Low-grade
Chery Q1138520200Low-grade
Table 2. Comparison of objective functions in different scenarios.
ScenariosLoad Variance/kW2Electricity Cost/CNY
Scenario 11,187,50029,878.30
Scenario 2750,63013,398.71
Disclaimer/Publisher’s Note: The statements, opinions and data contained in all publications are solely those of the individual author(s) and contributor(s) and not of MDPI and/or the editor(s). MDPI and/or the editor(s) disclaim responsibility for any injury to people or property resulting from any ideas, methods, instructions or products referred to in the content.

