Article

Multi-Fracture Propagation Considering Perforation Erosion with Respect to Multi-Stage Fracturing in Shale Reservoirs

1
College of Architecture and Environment, Sichuan University, Chengdu 610065, China
2
Institute of New Energy and Low-Carbon Technology, Sichuan University, Chengdu 610065, China
*
Author to whom correspondence should be addressed.
Energies 2024, 17(4), 828; https://doi.org/10.3390/en17040828
Submission received: 16 January 2024 / Revised: 6 February 2024 / Accepted: 7 February 2024 / Published: 9 February 2024

Abstract

:
Shale gas is considered a crucial global energy source. Hydraulic fracturing with multiple fractures in horizontal wells has been a crucial method for stimulating shale gas. During multi-stage fracturing, the fracture propagation is non-uniform, and fractures cannot be induced in some clusters due to the influence of stress shadow. To improve the multi-fracture propagation performance, technologies such as limited-entry fracturing are employed. However, perforation erosion limits the effect of the application of these technologies. In this paper, a two-dimensional numerical model that considers perforation erosion is established based on the finite element method. Then, the multi-fracture propagation, taking into account the impact of perforation erosion, is studied under different parameters. The results suggest that perforation erosion leads to a reduction in the perforation friction and exacerbates the uneven propagation of the fractures. The effects of erosion on multi-fracture propagation are heightened with a small perforation diameter and perforation number. However, reducing the perforation number and perforation diameter remains an effective method for promoting uniform fracture propagation. As the cluster spacing is increased, the effects of erosion on multi-fracture propagation are aggravated because of the weakened stress shadow effect. Furthermore, for a given volume of fracturing fluid, although a higher injection rate is associated with a shorter injection time, the effects of erosion on the multi-fracture propagation are more severe at a high injection rate.

1. Introduction

As conventional oil and gas production declines and energy demand increases, shale gas is regarded as an essential global energy source [1]. According to the evaluation results of the Energy Information Administration (EIA), the worldwide recoverable shale gas resources constitute approximately 206.68 × 10 12   m 3 , which have great potential for exploitation [2]. And as a low-carbon energy and clean source, increasing the use of shale gas contributes to reducing greenhouse gas emissions and air pollution [3,4]. However, due to the low permeability and porosity of shale reservoirs, the recovery of shale gas remains challenging [5,6]. Recently, multi-stage fracturing in horizontal wells has emerged as the most effective method for stimulating shale reservoirs [7,8,9]. During multi-stage fracturing, multiple fractures are created simultaneously to increase the volume stimulated in the reservoir [10,11,12]. Nevertheless, Miller et al. [13] analyzed the production logging data on a good deal of shale horizontal wells and concluded that approximately 33% of the perforation clusters were the main source of production in certain basins, while nearly another 33% of the perforation clusters produced nothing. According to optical fiber diagnosis, Ugueto C. et al. [14] found that the efficiency of perforation clusters was only 50~70%. The studies mentioned above suggest that fractures are not propagated uniformly in multi-stage fracturing, which is not conducive to reservoir stimulation [15,16]. Therefore, deeply comprehending the multi-fracture propagation mechanism is important for enhancing the recovery of shale gas.
During multi-stage fracturing, the morphology of the fractures is dominated by the stress shadow effect and the flow distribution between fractures. The flow distribution between fractures is determined by the resistance to fracture propagation, the perforation friction, and the pressure loss in the wellbore [17]. Nevertheless, the stress shadow between fractures leads to an increase in the propagation resistance of the interior fractures [18]. As fluid invariably flows through the path of least resistance, more fluid is distributed to the exterior fractures. Therefore, the effect of stress shadow should be weakened, or the increased resistance caused by stress shadow should be balanced, to promote a uniform flow distribution between fractures. Quite a few technologies have been proposed to promote uniform fracture propagation, such as limited-entry fracturing, temporary plugging fracturing, and fracture optimization [19,20,21]. Wu et al. [22] investigated multi-fracture propagation and found that reducing the perforation number and adjusting non-uniform cluster spacing could effectively improve the unevenness of the fracture propagation using the displacement discontinuity method (DDM). Peirce and Bunger [23] proposed a parallel planar 3D model and demonstrated that the stress shadow between fractures could result in uneven fracture propagation. Chen et al. [24] analyzed the flow distribution between fractures and performed sensitivity analysis using a semi-analytical model. Zhang et al. [25] studied extreme limited-entry fracturing (XLE) and optimized the controlling parameters influencing the cluster effectiveness. Li et al. [26] considered the impact of the perforation friction by establishing a fluid pipe element and analyzed the three-dimensional multi-fracture propagation. Their research noted that the number of fractures has a significant effect on multi-fracture propagation.
As stated above, reasonable optimization of the perforation parameters can effectively unify the fracture propagation. However, even when limited-entry fracturing has been applied in practical applications, the fractures can only temporarily maintain uniform fracture propagation, and severe non-uniform fracture propagation ultimately occurs [27,28]. Perforation erosion is one of the significant factors leading to this phenomenon [29,30]. Roberts et al. [31] used downhole photographic equipment to observe and record the size and shape of perforations after perforation erosion and found that the erosion of some perforations occurred faster than that of others. Cramer et al. [32] found that the perforation erosion in fractures in the heel of the wells was more severe compared with the fractures in the toe of the wells based on video imaging. The studies above suggest that perforation erosion is common during the process of hydraulic fracturing. Crump and Conway [30] proposed that abrasive damage to perforations consists of two mechanisms based on their experiments: one is an increase in the perforation diameter and another is the smoothing of the perforations. The smoothing of the perforations and an increase in the perforation diameter results in a reduction in the perforation friction, which results in a redistribution of fluid between the fractures and exerts a significant impact on the fracture propagation. Hence, understanding multi-fracture propagation under the effect of perforation erosion is of great importance to the effective design of multi-stage fracturing. However, perforation erosion is seldom considered in studies on multi-fracture propagation, yet perforation friction is generally considered a constant.
In this study, a numerical model considering perforation erosion is established. Multi-fracture propagation, taking into account the effect of perforation erosion under different conditions, is discussed in detail, including the perforation diameter, perforation number, cluster spacing, and injection rate. The key factors influencing the performance of multi-fracture propagation are summarized. This study can help us to understand the mechanisms of perforation erosion affecting multi-fracture propagation and provide recommendations for multi-stage fracturing design.

2. Numerical Model

In this section, a smeared crack model based on the finite element method (FEM) is developed. Currently, the numerical methods for simulating hydraulic fracturing can be divided into continuum approaches and discontinuum approaches. The cohesive zone model (CZM) is an intuitive discontinuum method, which simulates the failure and damage of material by specifying the traction–separation law [33]. However, the paths of the HFs and NFs must be defined in advance. The discrete element method (DEM) can directly simulate the interaction between fractures, but this method cannot be applied at the engineering scale due to its high computational cost. In addition to discontinuum methods, continuum approaches are another way to simulate hydraulic fracturing [34]. To solve the problem of the remeshing, the extended finite element method (XFEM) simulates fracture propagation by introducing an appropriate enrichment function [35]. Nevertheless, it is difficult to solve the multi-fracture problem, and the calculation efficiency is not high [36]. The smeared crack model based on the FEM is easy to use for simulating multi-fracture propagation, and the fractures are simplified as damage elements [37]. The method has an adequate efficiency in simulating the multi-fracture propagation in reservoirs. The model is described as follows:

2.1. Rock Deformation and Fluid Flow

The rock deformation equation can be expressed as [38]:
¯ σ + γ b g v ρ d 2 u d t 2 = f
where g v is the gravity vector; ¯ is the matrix differentiation operator; γ b is the bulk weight; σ is the total Cauchy stress; f is the force; ρ is the density; and u is the displacement.
The fluid inside the fractures satisfies the mass conservation law [38]:
T q + 1 Q   d p w d t + α d ε v d t = s
where p w is the pore pressure; is the gradient operator; Q is the compressibility parameter; q is the flow flux vector; s is the flow source; and ε v is the rock volumetric strain.
Darcy’s law is applied to describe the relationship between the flow flux and pore pressure [39]:
q = K γ f p + γ f g v
where γ f is the bulk weight and K is the second-order permeability tensor.

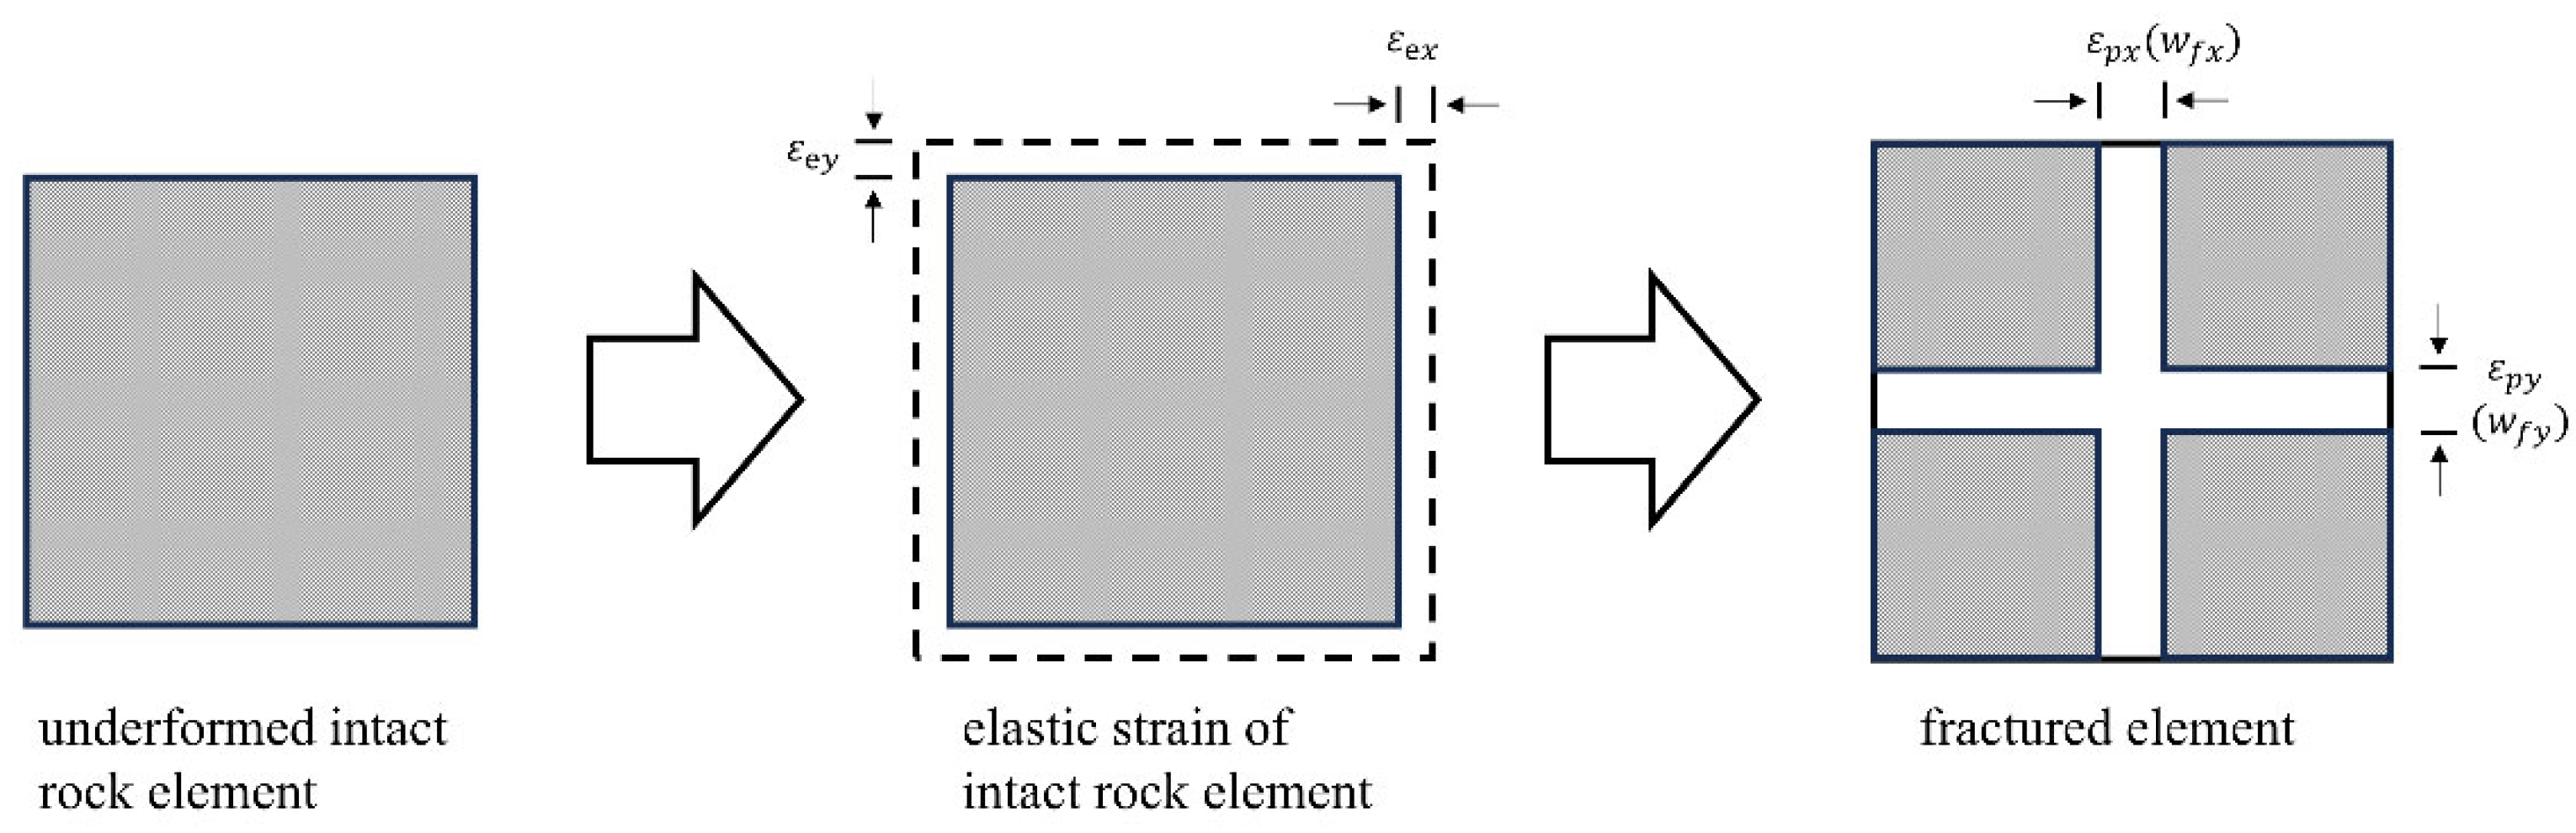
2.2. Fracture Propagation

There are two propagation modes during the process of fracture propagation: one is toughness-dominated, in which rock fracture is the primary mechanism of energy dissipation, and another is viscosity-dominated, in which fluid viscosity dissipation is the primary mechanism of energy dissipation [39,40]. In large-scale hydraulic fracturing, the fracture propagation is considered to be viscosity-dominated. In this paper, since we are focusing on large-scale fracture propagation, the propagation of the fractures is determined by the maximum tensile stress criterion. Fractures are generated when the minimum effective principal stress equals the tensile strength:
σ n = T
where T is the tensile strength and σ n is the effective normal stress.
In this model, the fracture is represented by damage zones with enhanced permeability. The strain of a damaged element is composed of intact rock strain and fracture strain based on the continuum equivalent method. And the fracture strain and intact rock strain are approximated as the plastic strain and elastic strain of the elements, respectively, as shown in Figure 1. Hence, the plastic strain of the elements is used to calculate the equivalent fracture width:
w f = L e · ε p δ i j n i n j
where ε p is the plastic strain tensor and L e is the element size.
The permeability of a damaged element is composed of matrix permeability and fracture permeability. In general, the deformation of intact rock has less effect on the matrix permeability [41]. Hence, the permeability of the matrix is considered to be constant, and the increase in the damaged element’s permeability is completely due to the fracture propagation. The fracture permeability can be calculated according to the cubic law:
k f = ρ g L e   w f 3 12 u
where u is the fluid viscosity and ρ is the fluid density.
The permeability of a damaged element can be written as:
k = k m + k f
where k m is the matrix permeability.

2.3. Fluid Flow within the Wellbore

During multi-stage fracturing, stress shadow can result in differences in the injection rates between fractures. Hence, the dynamic flow distribution between the fractures should be considered. Because the horizontal wellbores and perforations are not smooth, frictional resistance is generated as fluid flows through the horizontal wellbores and perforations. Generally, the friction resistance generated by the wellbores is small and can be ignored [42]. According to the pressure balance conditions, the relationship between the pressure at the horizontal well heel, the pressure at the fracture entrance, and the perforation friction pressure drop can be expressed as:
p b , 1 = = p b , i = = p b , m
p b , 1 = p p , 1 + p f , 1 p b , i = p p , i + p f , i p b , m = p p , m + p f , m
where p b , i , p f , i , and p p , i are the pressure at the horizontal well heel, the pressure at the entrance of the ith fracture, and the perforation friction pressure drop, respectively.
The perforation friction pressure drop can be expressed as [43]:
p p = α f q p 2
α f = 8 ρ π 2 C d 2 n p 2 d p 4
where α f is the perforation friction coefficient; n p is the perforation number; ρ is the slurry density; d p is the perforation diameter; q p is the flow rate; and C d is the discharge coefficient.
Based on volume conservation, the total injection rate equals the injection rate of each fracture:
Q = i = 1 m q i

2.4. Perforation Erosion

Abrasive damage to the perforations occurs when the proppant is pumped at a high injection rate. Crump and Conway [30] found that perforation erosion is mainly caused by two mechanisms: one is the rounding and smoothing of perforations, and another is an increase in the perforation diameter, as shown in Figure 2. Based on the experimental data, Long et al. [44] established a semi-empirical perforation erosion model:
δ d p δ t = α ¯ C e v 2
δ C d δ t = β ¯ C e v 2 1 C d C d m a x
where d p   i s   t h e   p e r f o r a t i o n   d i a m e t e r ; v is the mean velocity at the perforations; C e is the proppant concentration; C d m a x is the maximum discharge coefficient (the range of C d is 0.6–0.9); and α ¯ and β ¯ are empirical coefficients based on laboratory experiments.
The mean velocity at the perforation can be expressed as:
v = 4 q p n p π d p

3. Model Verification and Model Establishment

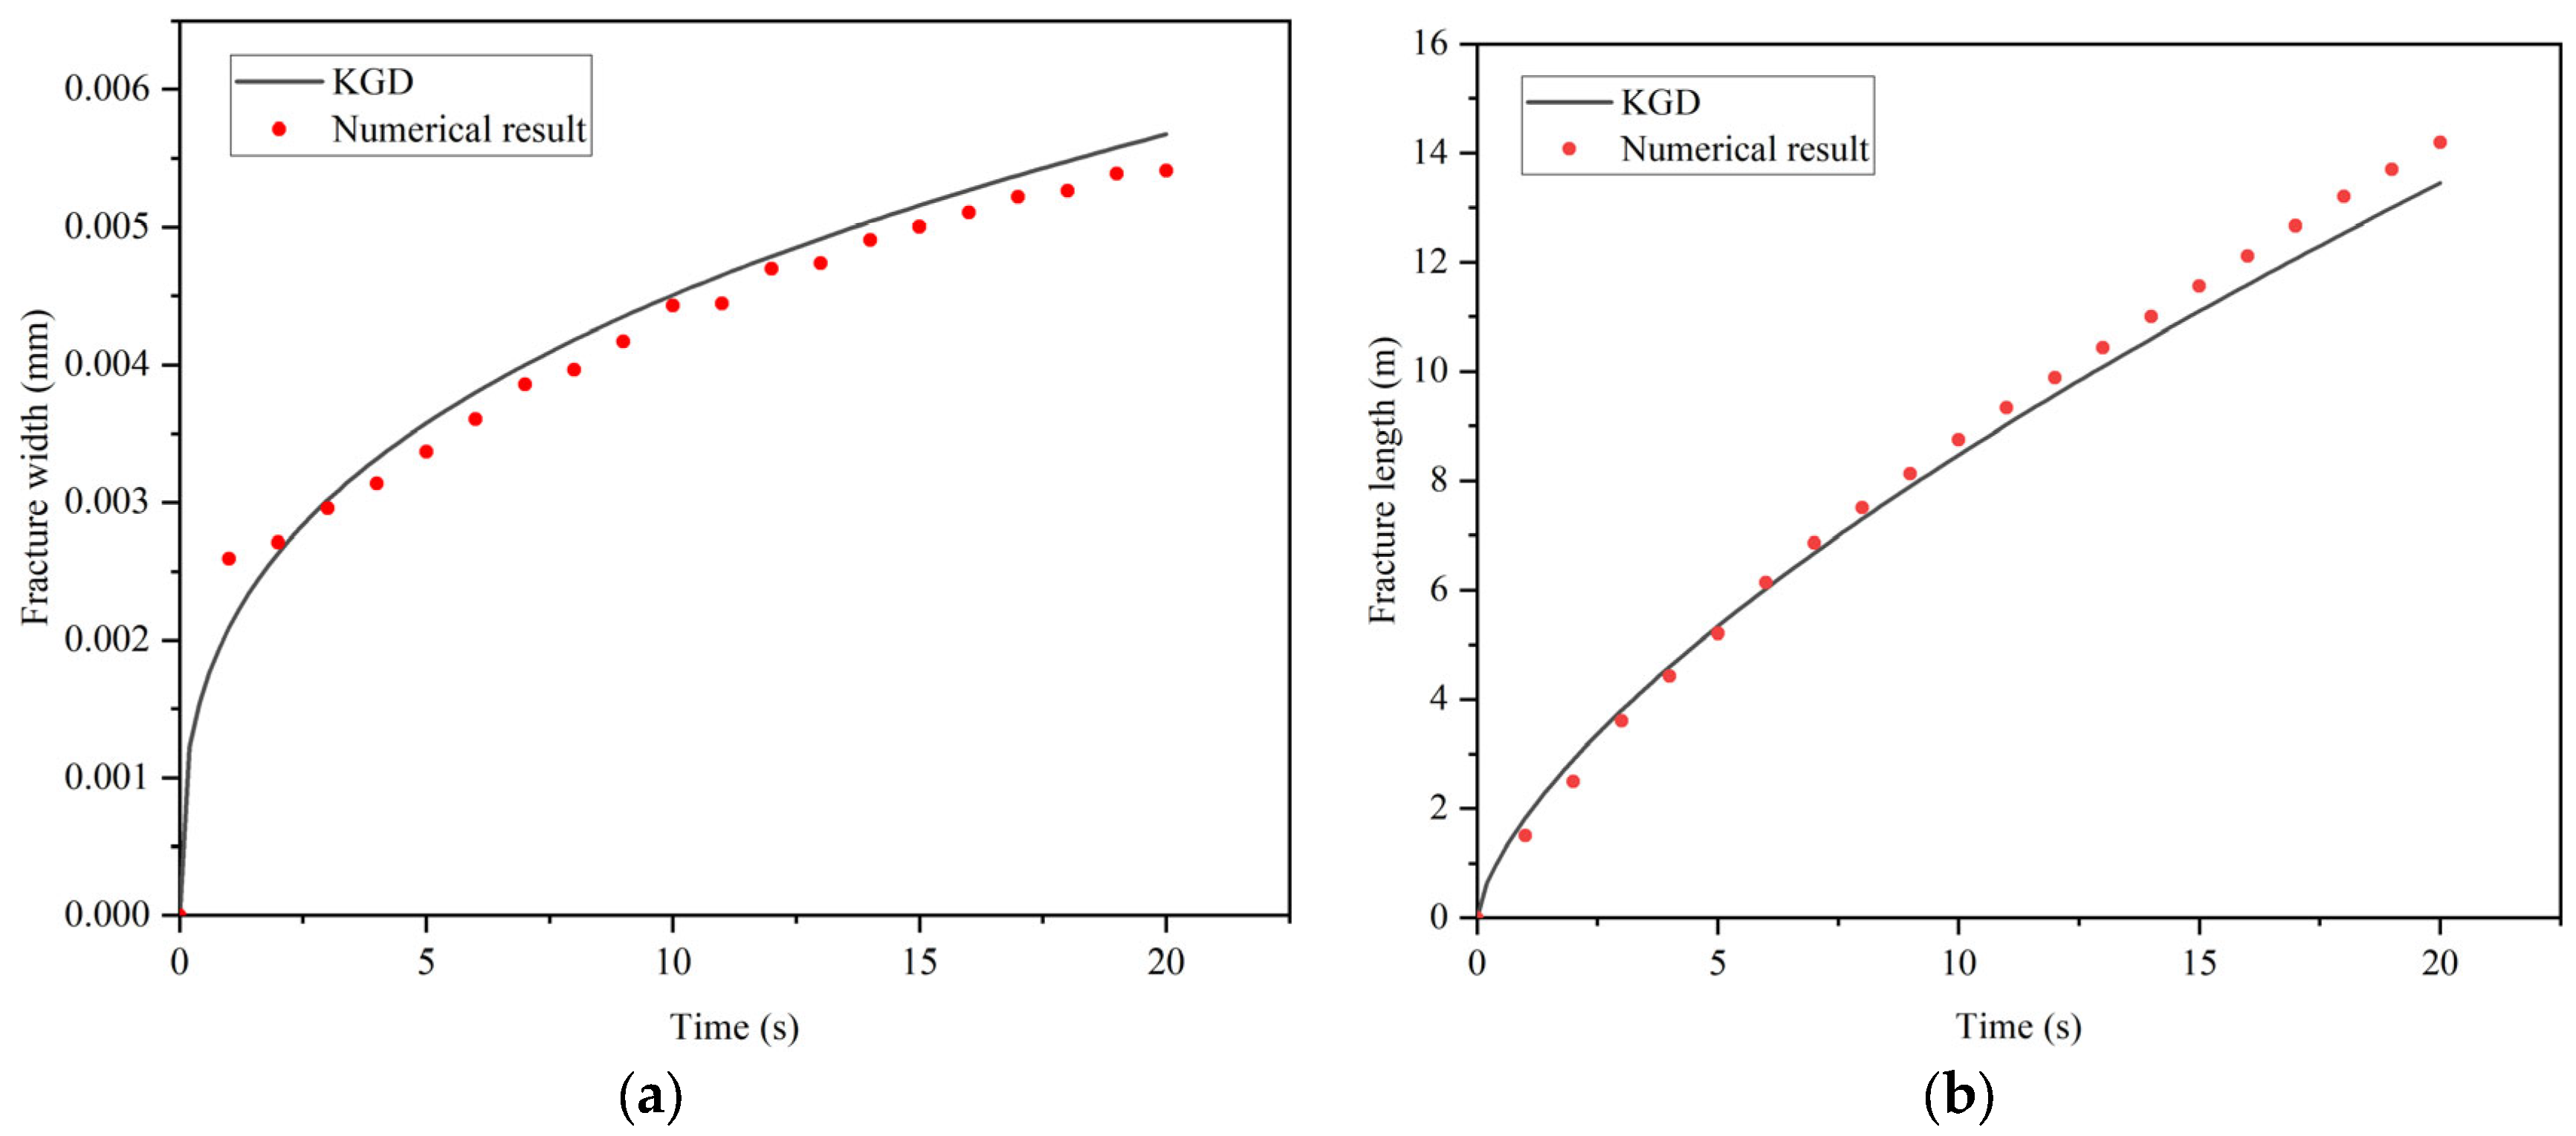
3.1. Comparison with the Classical KGD Model

In this section, the classical KGD model is applied to verify the fracture propagation in the numerical model. The fracture width and length in the KGD model can be expressed as [45]:
L = 0.539 Q 3 E 4 1 v 2 μ H 3 1 6 t 2 3
w = 2.36 4 1 v 2 μ Q 3 E H 3 1 6 t 1 3
where Q is the injection rate; v is Poisson’s ratio; E is Young’s modulus; t is the injection time; H is the fracture height; and μ is the fluid viscosity. Table 1 shows the parameters utilized in the validation. And Figure 3 illustrates a comparison between the KGD model and the numerical model. The numerical results and the theoretical results were in great agreement.

3.2. Comparison with a Lab-Scale Experiment

In this section, the numerical model is verified by comparing it with the experimental results of Xing et al. [46]. Their experiment monitored the propagation of a hydraulic fracture, as shown in Figure 4a. The size of the specimen was 152.4 mm × 152.4 mm × 114.3 mm, and the specimen consisted of six transparent polyurethane blocks, with three layers included. The specimen was loaded under true tri-axial conditions, and a higher stress was applied to the barrier layers to restrict the propagation of the fracture in the height direction. The fluid was injected at a constant injection rate throughout the experiment, and the propagation of fractures was monitored using a video camera. The photometric method was used to obtain the fracture aperture, and thus the fracture opening along the fracture length was obtained. Table 2 lists the parameters used in the experiment. Figure 4b shows a comparison of the numerical model and the experimental results. The numerical model is in great agreement with the experimental results.

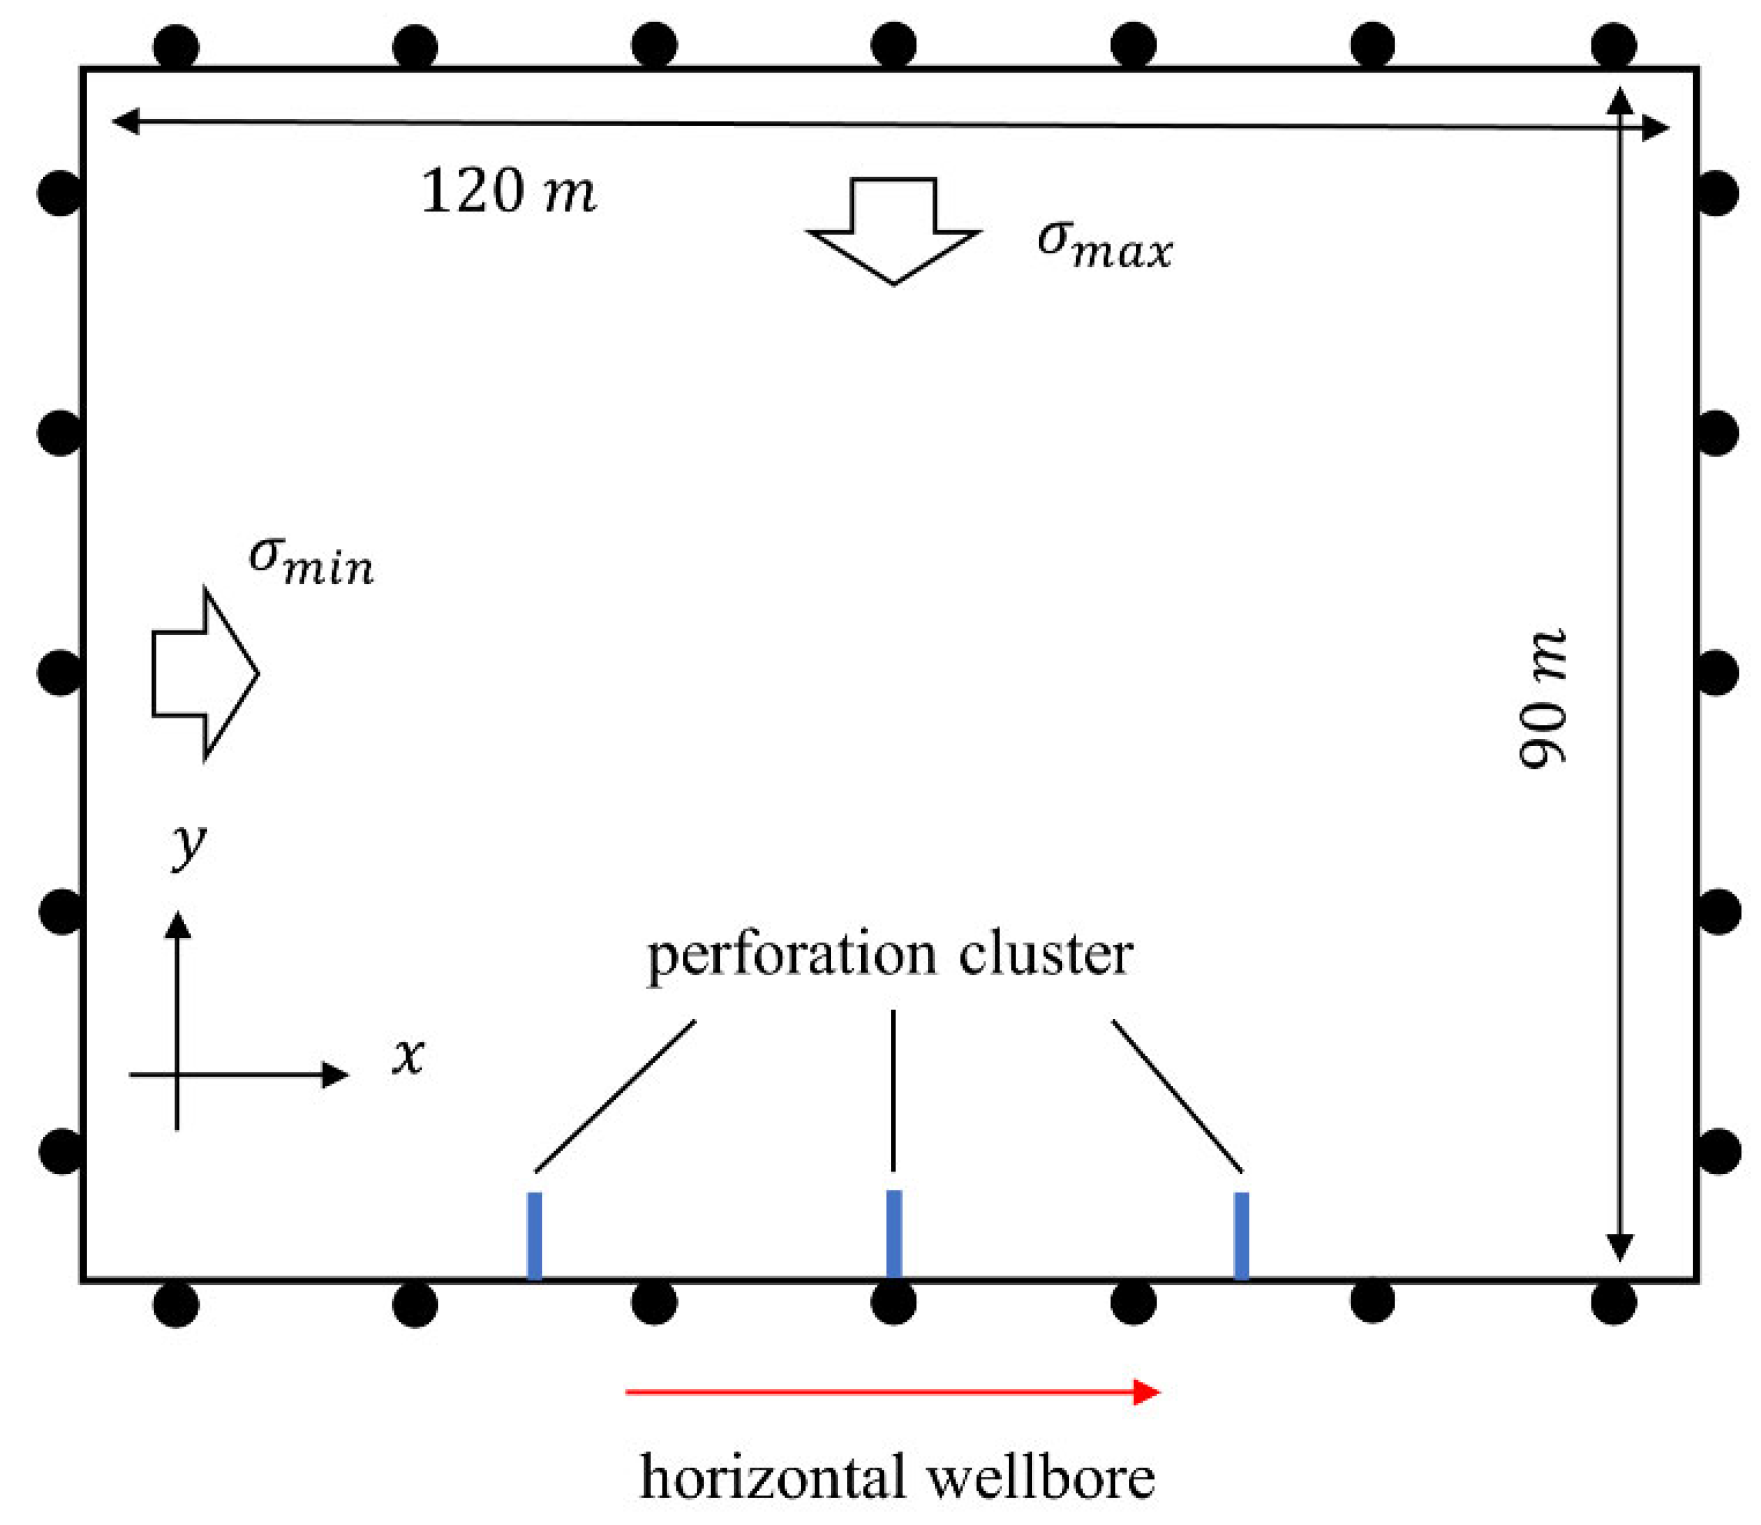
3.3. Model Establishment

To investigate multi-fracture propagation, a 120 × 90   m two-dimensional model for multi-fracture propagation is established. Three clusters are considered in the model, and the horizontal wellbore is oriented in the direction of the minimum horizontal principal stress. The model contains a total of 10,800 elements. The displacement boundary conditions in the model are illustrated in Figure 5. The constraints for displacement in the x-direction are applied to the left and right boundaries, while the constraints for displacement in the y-direction are applied to the upper and lower boundaries.

4. Results and Discussion

In this section, multi-fracture propagation considering the perforation erosion is compared with that without considering the perforation erosion to illustrate the impact of perforation erosion with respect to competitive multi-fracture propagation under different parameters, including injection rate, perforation number, perforation diameter, and cluster spacing. Table 3 presents the basic parameters in the model.

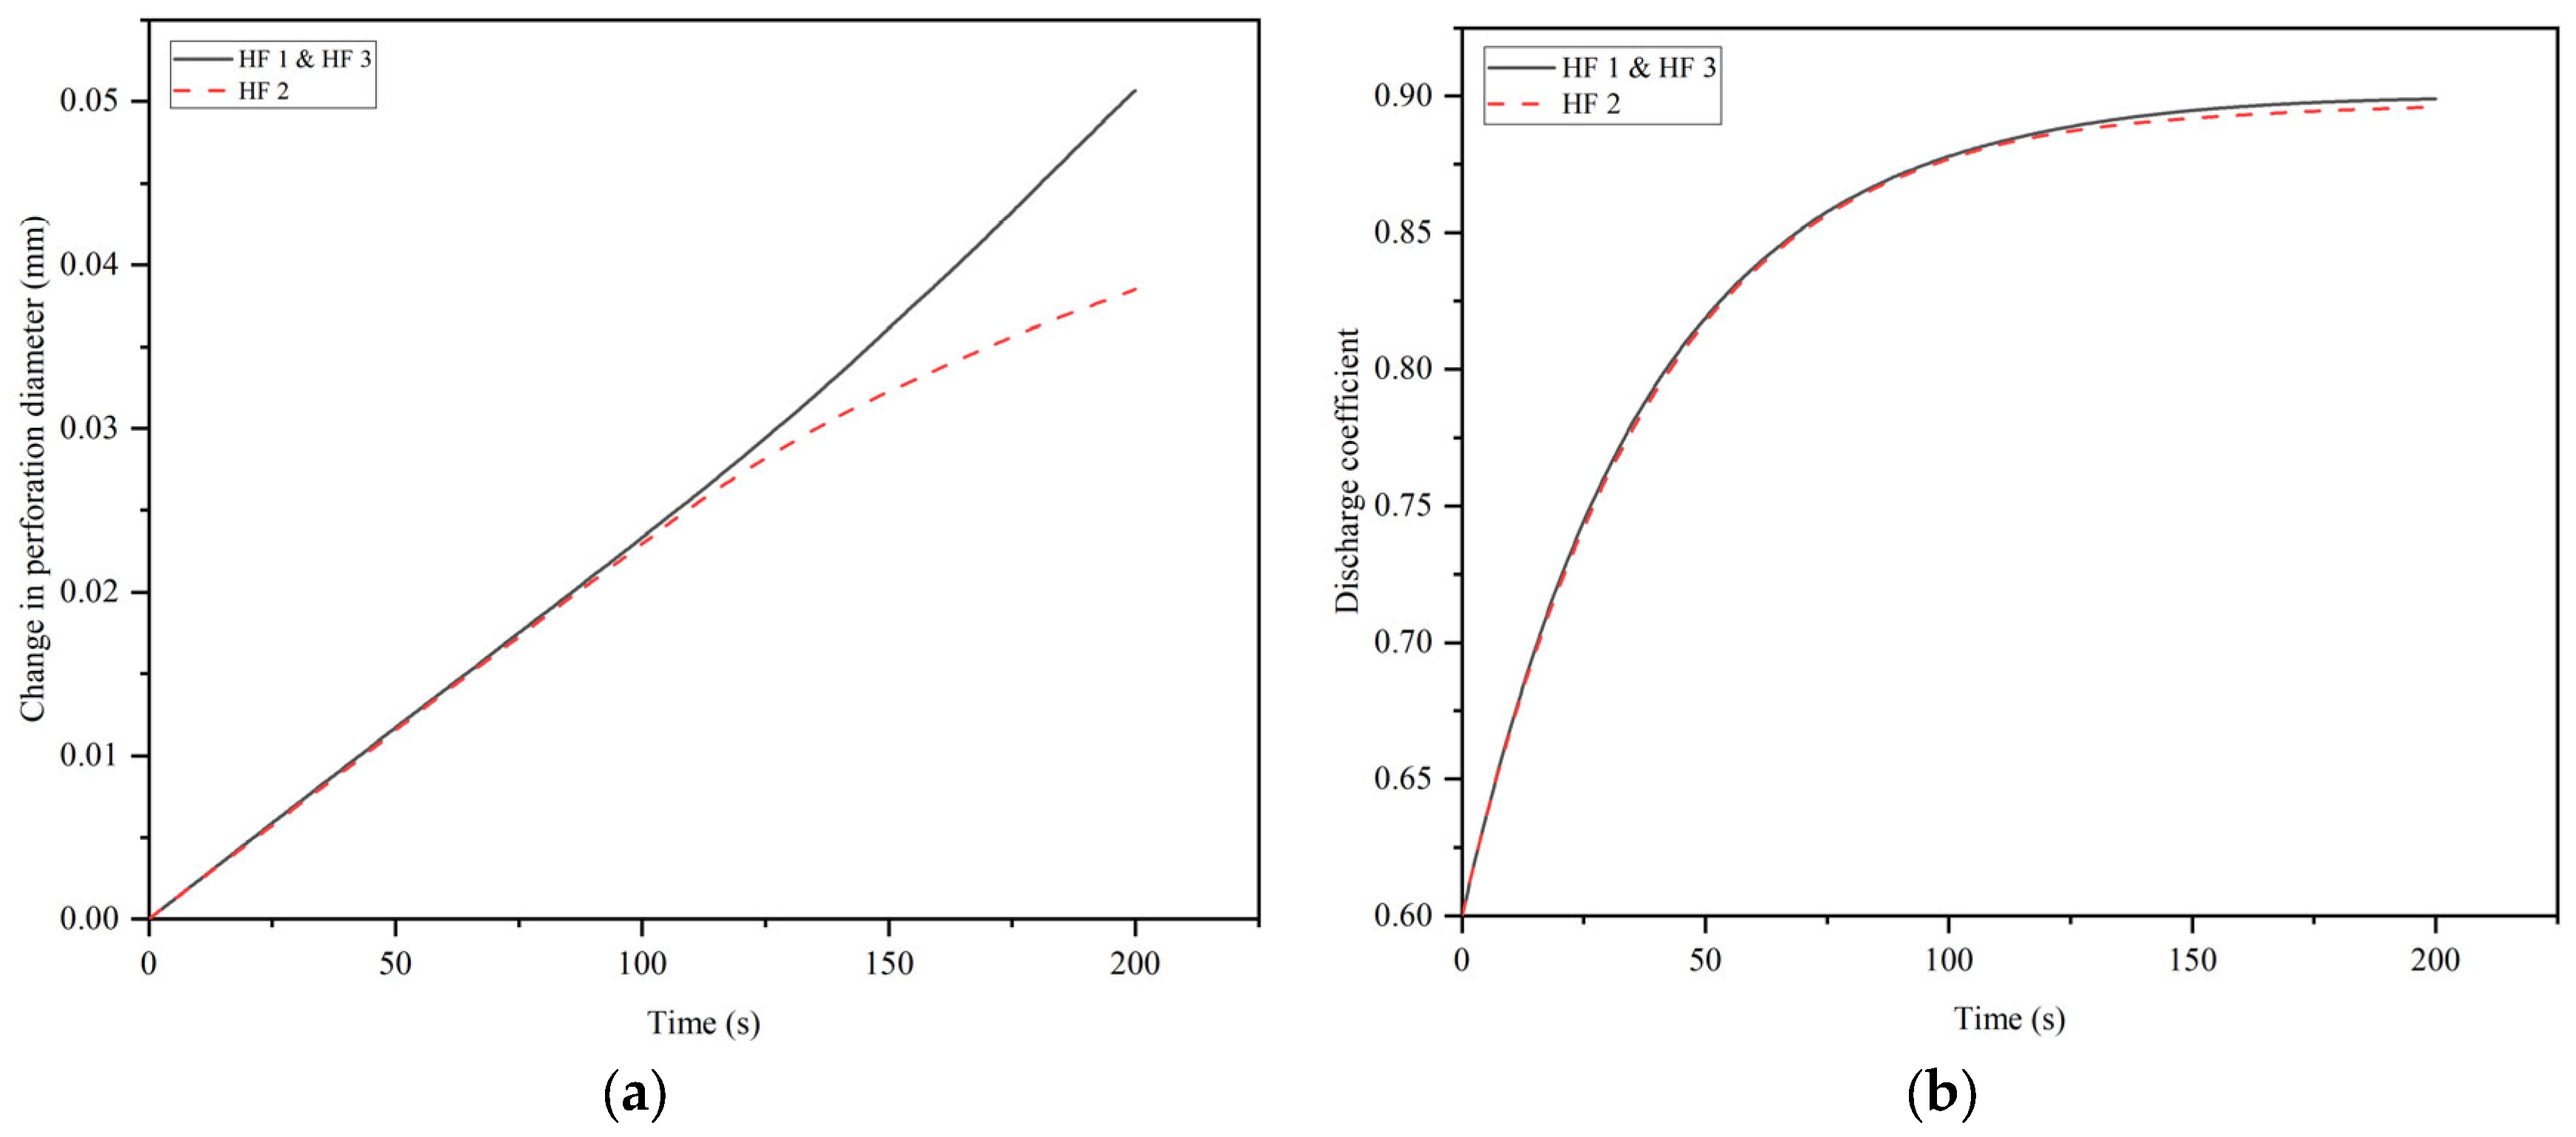
4.1. The Impact of Perforation Erosion on Multi-Fracture Propagation

In this section, the effect of perforation erosion in relation to competitive multi-fracture propagation is studied. The cluster spacing is set at 35 m, and the perforation diameter is set at 8 mm; the additional parameters are detailed in Table 2.
A comparison of the fracture propagation morphology between the cases with consideration of the perforation erosion and the cases without consideration of the perforation erosion is shown in Figure 6. The unevenness of the fracture propagation is intensified when considering perforation erosion. This is because perforation erosion gives rise to an increase in the perforation diameter ( D ) and discharge coefficient ( C d ) , as shown in Figure 7. According to Equation (10), the increase in the discharge coefficient and perforation diameter can lead to a reduction in the perforation friction, which aggravates an uneven flow distribution between fractures and uneven fracture propagation.
The variation in the perforation friction coefficient in the process of perforation erosion is depicted in Figure 8. The perforation friction coefficient decreases rapidly at first and then decreases slowly. This is because the discharge coefficient increases rapidly from the initial value of 0.6 to 0.9 during the initial stage of perforation erosion, which causes the perforation friction coefficient to decrease rapidly in a short time. And then the discharge coefficient tends to remain stable, while the perforation diameter increases at a slow rate, which results in a slow decline in the perforation friction coefficient during the later stage. Hence, the rapid increase in the discharge coefficient is the main factor that aggravates non-uniform fracture propagation during the initial stage, while the increase in the perforation diameter becomes the main factor that aggravates non-uniform fracture propagation during the later stage.
In summary, perforation erosion increases the perforation diameter and discharge coefficient, which reduces the frictional resistance generated by perforation and aggravates uneven fracture propagation. And the increases in the perforation diameter and discharge coefficient are the primary factors aggravating uneven fracture propagation during the initial and later stage, respectively.

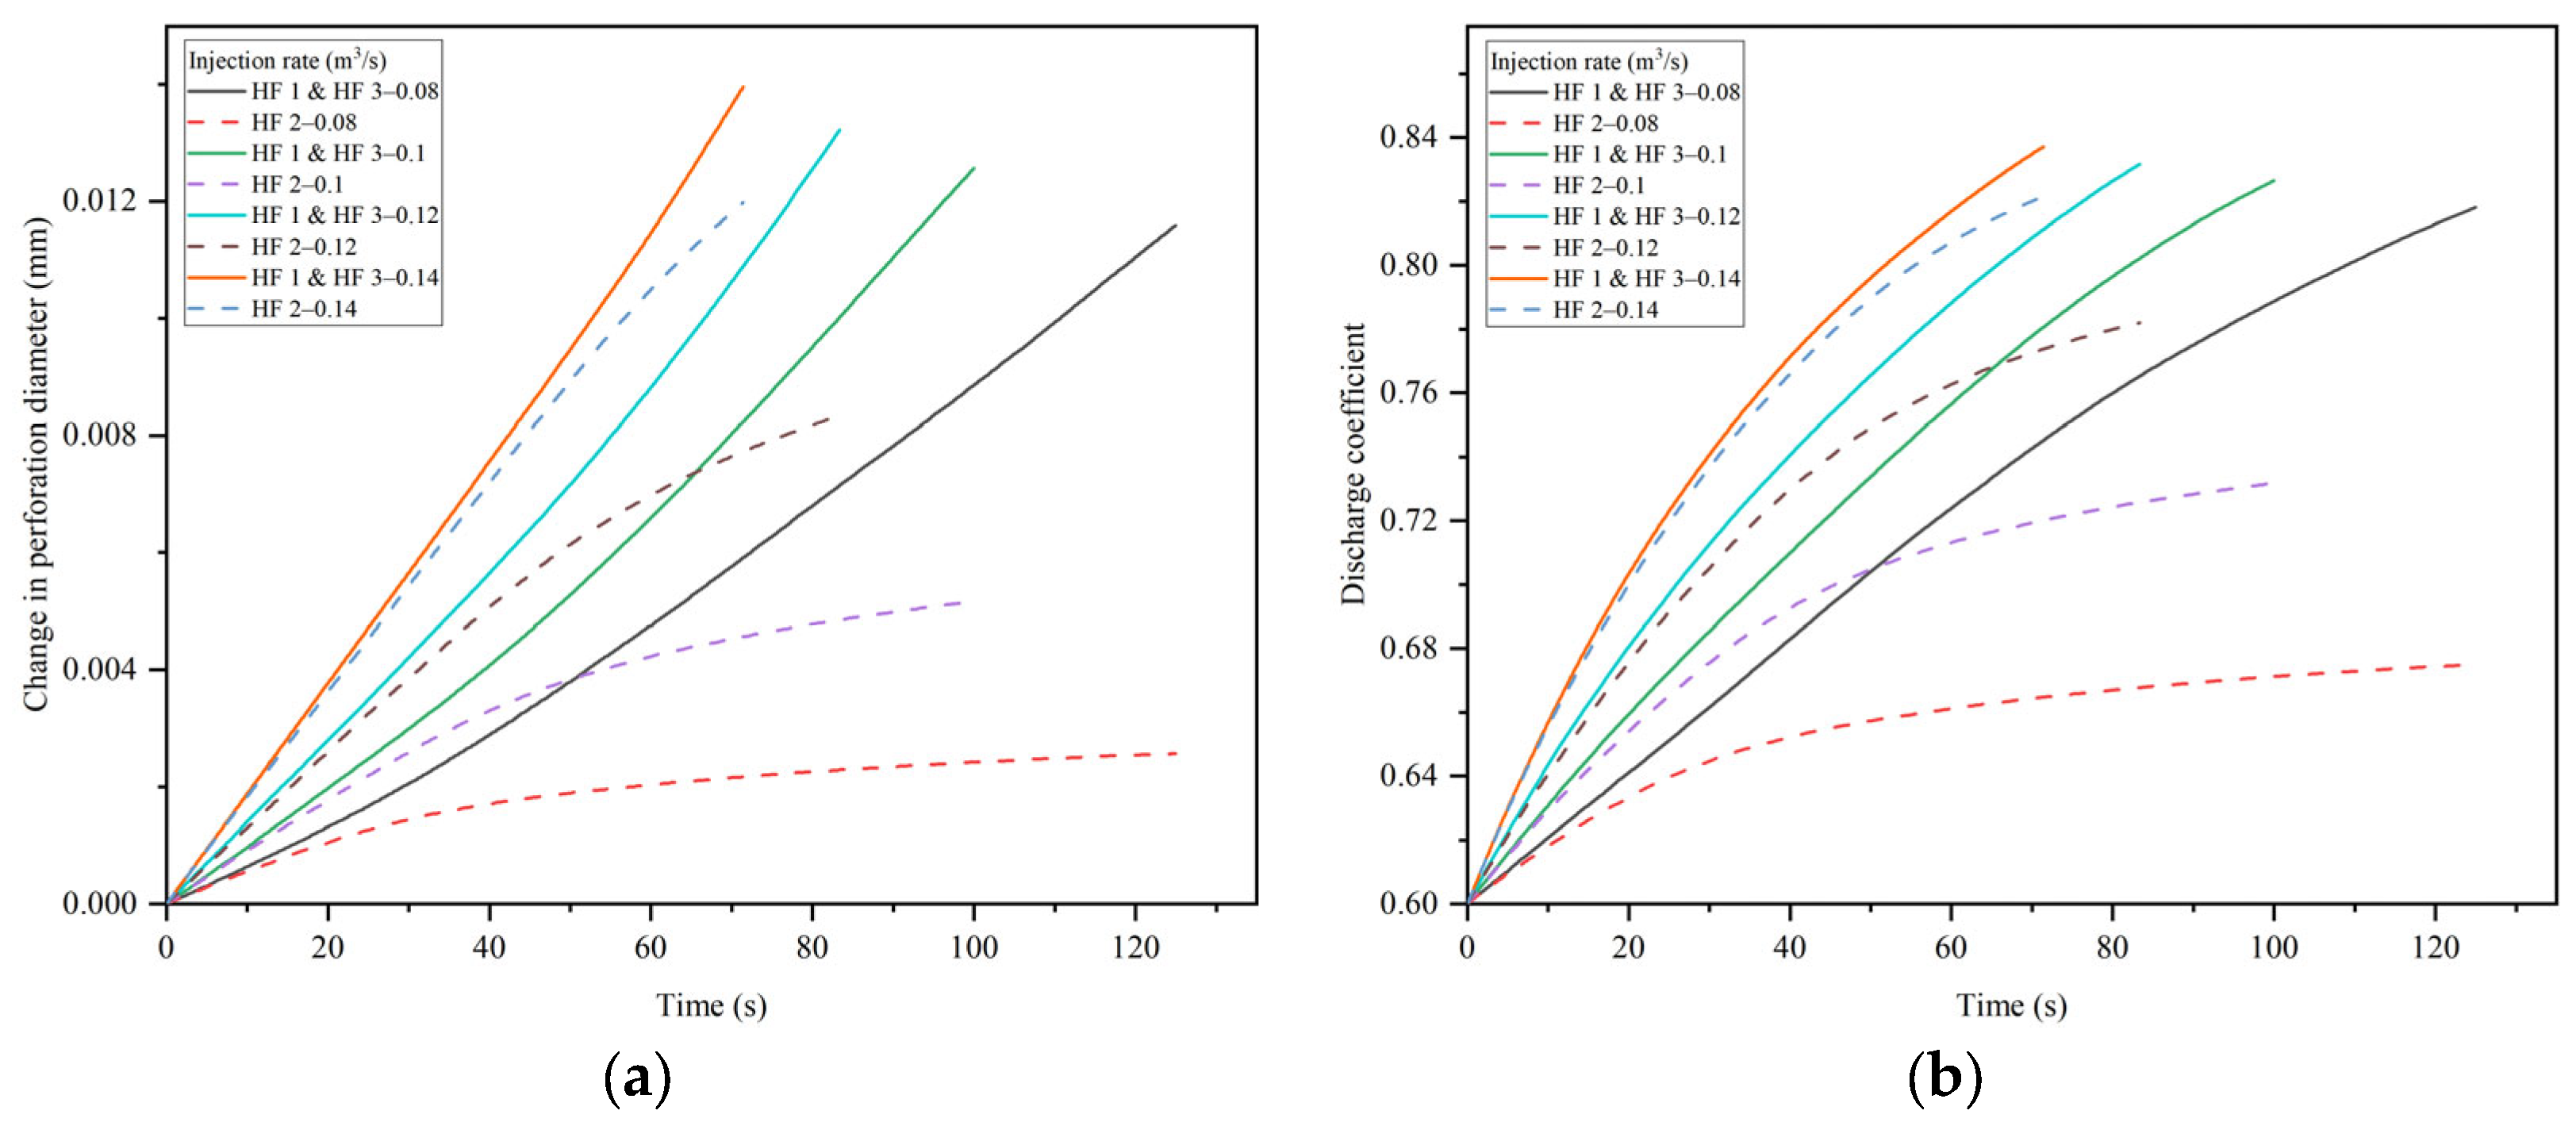
4.2. The Effects of the Injection Rate

The injection rate is one of the crucial operation parameters that influences fracture propagation. When the proppant is pumped at a high speed, the effect of perforation erosion is unneglectable [47]. To study multi-fracture propagation under different injection rates, four cases are included ( 0.08   m 3 / s , 0.1   m 3 / s , 0.12   m 3 / s , and 0.14   m 3 / s ). The injection volume remains consistent in all cases.
Figure 9 illustrates the fracture morphology at four different injection rates. As the injection rate increases, the uneven fracture propagation is improved. However, the length of the central fracture continues to increase, while the length of the side fractures changes slightly as the injection rate increases, as shown in Figure 10. This is because the fracturing fluid volume injected into the fractures remains constant, but the injection time is shorter at a higher injection rate. Figure 11 illustrates that the total injection volume distributed to the fractures on both sides decreases at an increasing injection rate, which tends to cause a reduction in the length of the side fractures. Nevertheless, a decrease in the injection time causes the injection rate into the fractures on both sides to increase. A higher injection rate contributes to an increase in the fracture length [48,49]. Hence, the length of the side fractures changed slightly.
Figure 12 shows the variation in the perforation diameter and discharge coefficient under different injection rates. The variation in the diameter and discharge coefficient of the perforations is greater as the injection rate increases within the same time. According to Equation (14), the mean velocity at the perforation increases as the injection rate increases, which results in a greater variation in the diameter and discharge coefficient of the perforations. Consequently, the perforation erosion is heightened at an increasing injection rate. Furthermore, the volume of fracturing fluid remains constant, although the injection time is longer at a lower injection rate, the perforation erosion becomes more severe at a higher injection rate, as illustrated in Figure 12. And due to this, Figure 10 shows that the difference in the central fracture length between the cases considering perforation erosion and the cases without considering perforation erosion is greater when the injection rate increases, which suggests that the effects of erosion on multi-fracture propagation are more severe at a higher injection rate.
In addition, the variation in the discharge coefficient and perforation diameter in the fractures on both sides is larger than that in the central fracture; the perforation erosion in the side fractures is thus more severe, as shown in Figure 12. This is because the amount of fluid distributed to each fracture is different. The injection rate into the fractures on both sides is larger and the injection rate into the central fracture is smaller because of the influence of stress shadow, as shown in Figure 11. A higher injection rate results in more significant perforation erosion in the side fractures. And the difference in the perforation erosion between the side fractures and the central fracture decreases as the injection rate increases. Figure 11 illustrates that the difference in the injection rate between the side fractures and the central fracture decreases as the total injection rate increases, which minimizes the difference in the perforation erosion between the side fractures and the central fracture.
Generally, for a given volume of fracturing fluid, the effects of erosion on multi-fracture propagation are more severe at a higher injection rate. And a decrease in the injection rate can mitigate the perforation erosion. However, increasing the injection rate can still contribute to uniform fracture propagation even though the effects of erosion on multi-fracture propagation are aggravated at an increasing injection rate. Therefore, a higher injection rate is recommended to promote uniform fracture propagation.

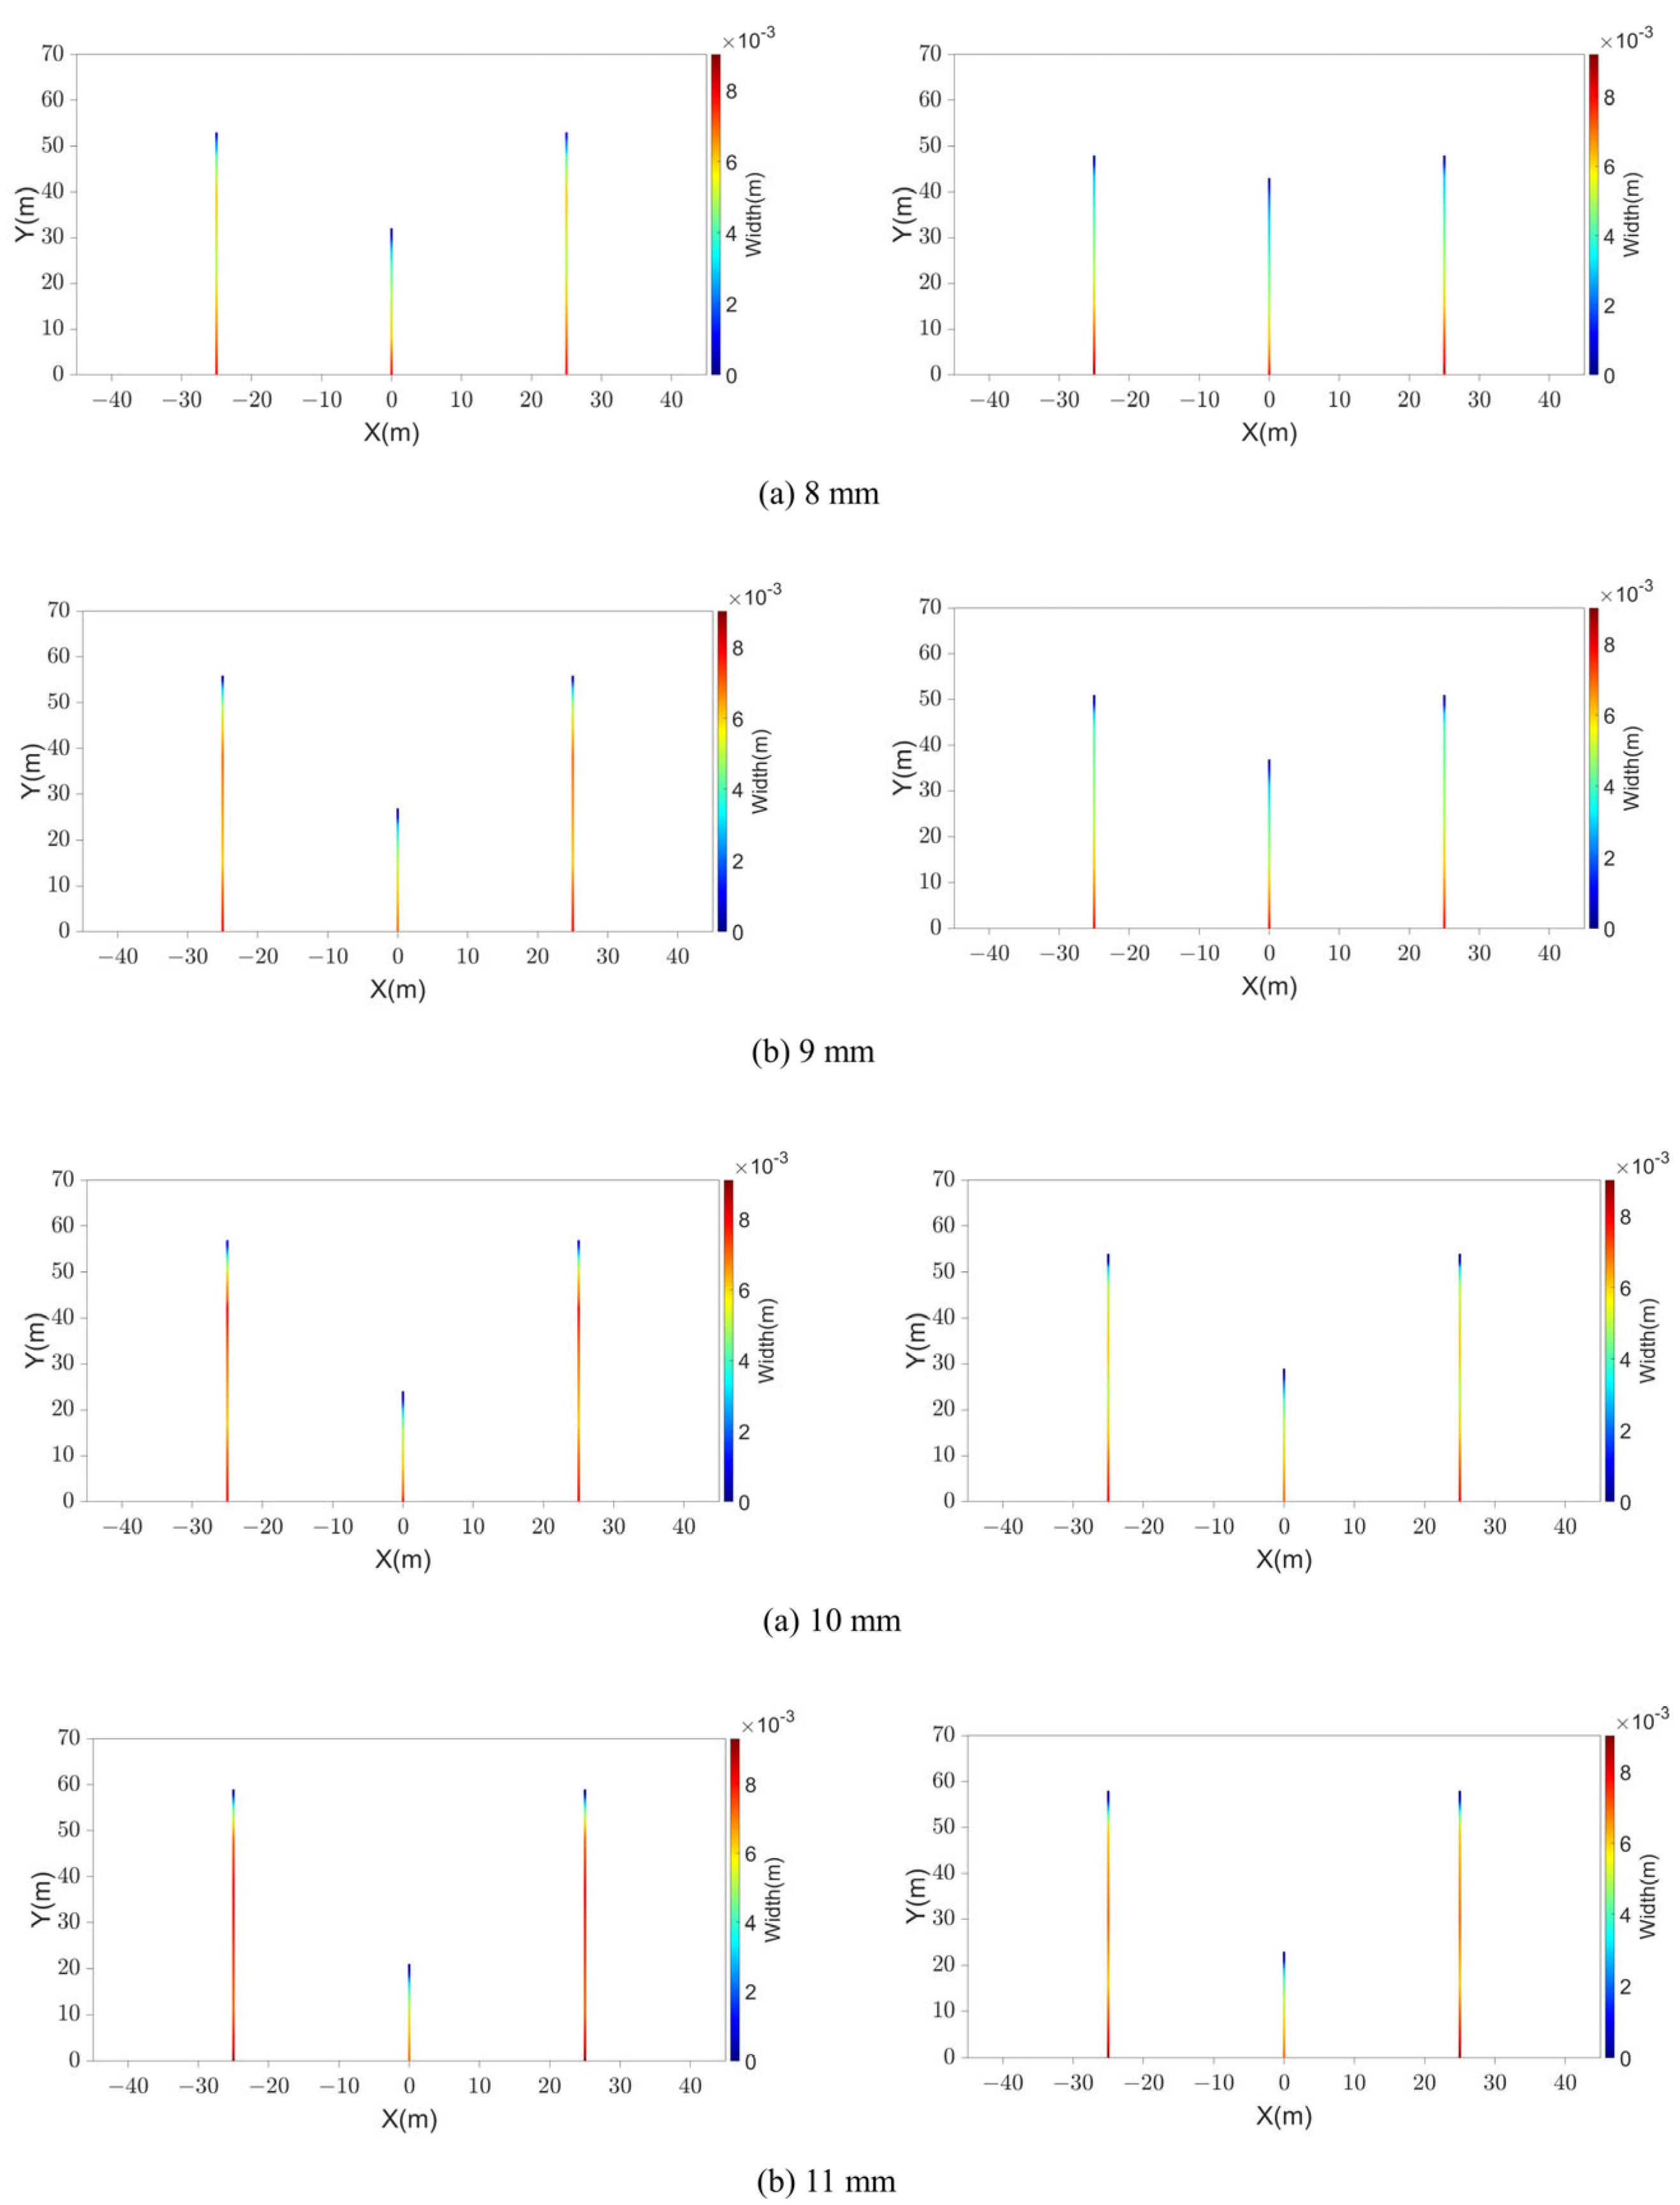
4.3. The Effects of the Perforation Diameter

The perforation diameter is a key factor influencing multi-fracture propagation. To investigate multi-fracture propagation under different perforation diameters, four cases are set in the model (8 mm, 9 mm, 10 mm, and 11 mm).
Figure 13 shows the fracture propagation at different perforation diameters. As the perforation diameter decreases, the length of the fractures on both sides continues to decrease, while the central fracture length continues to increase. And Figure 14 shows that the uneven flow distribution between the fractures is improved as the perforation diameter decreases. A reduction in the perforation diameter contributes to improving non-uniform fracture propagation. Nevertheless, as the perforation diameter decreases, Figure 15 shows that the difference in the fracture propagation between the cases considering perforation erosion and the cases without regard to perforation erosion increases. The difference in the central fracture length is 11 m between the two cases when the perforation diameter is 8 mm, while the difference decreases to 1 m when the perforation diameter is 11 mm, which indicates that perforation erosion has a more pronounced impact when the perforation diameter is small. This is because the mean velocity at the perforation increases when the perforation diameter decreases, which results in greater variation in the diameter and discharge coefficient of the perforations. Figure 16 illustrates that the discharge coefficient of the perforations changes the most when their diameter is 8 mm. Therefore, the effects of erosion on multi-fracture propagation are enhanced as the perforation diameter decreases because the perforation erosion is more severe when the perforation diameter is small.
As discussed above, the effects of erosion on multi-fracture propagation are enhanced as the perforation diameter decreases. Although the effects of erosion on multi-fracture propagation can be mitigated by increasing the perforation diameter, the increase in the perforation diameter decreases the perforation friction and aggravates uneven fracture propagation. Thus, to overcome the effect of the perforation erosion, a smaller perforation diameter is recommended to ensure the initial perforation friction is much higher than the perforation friction after perforation erosion.

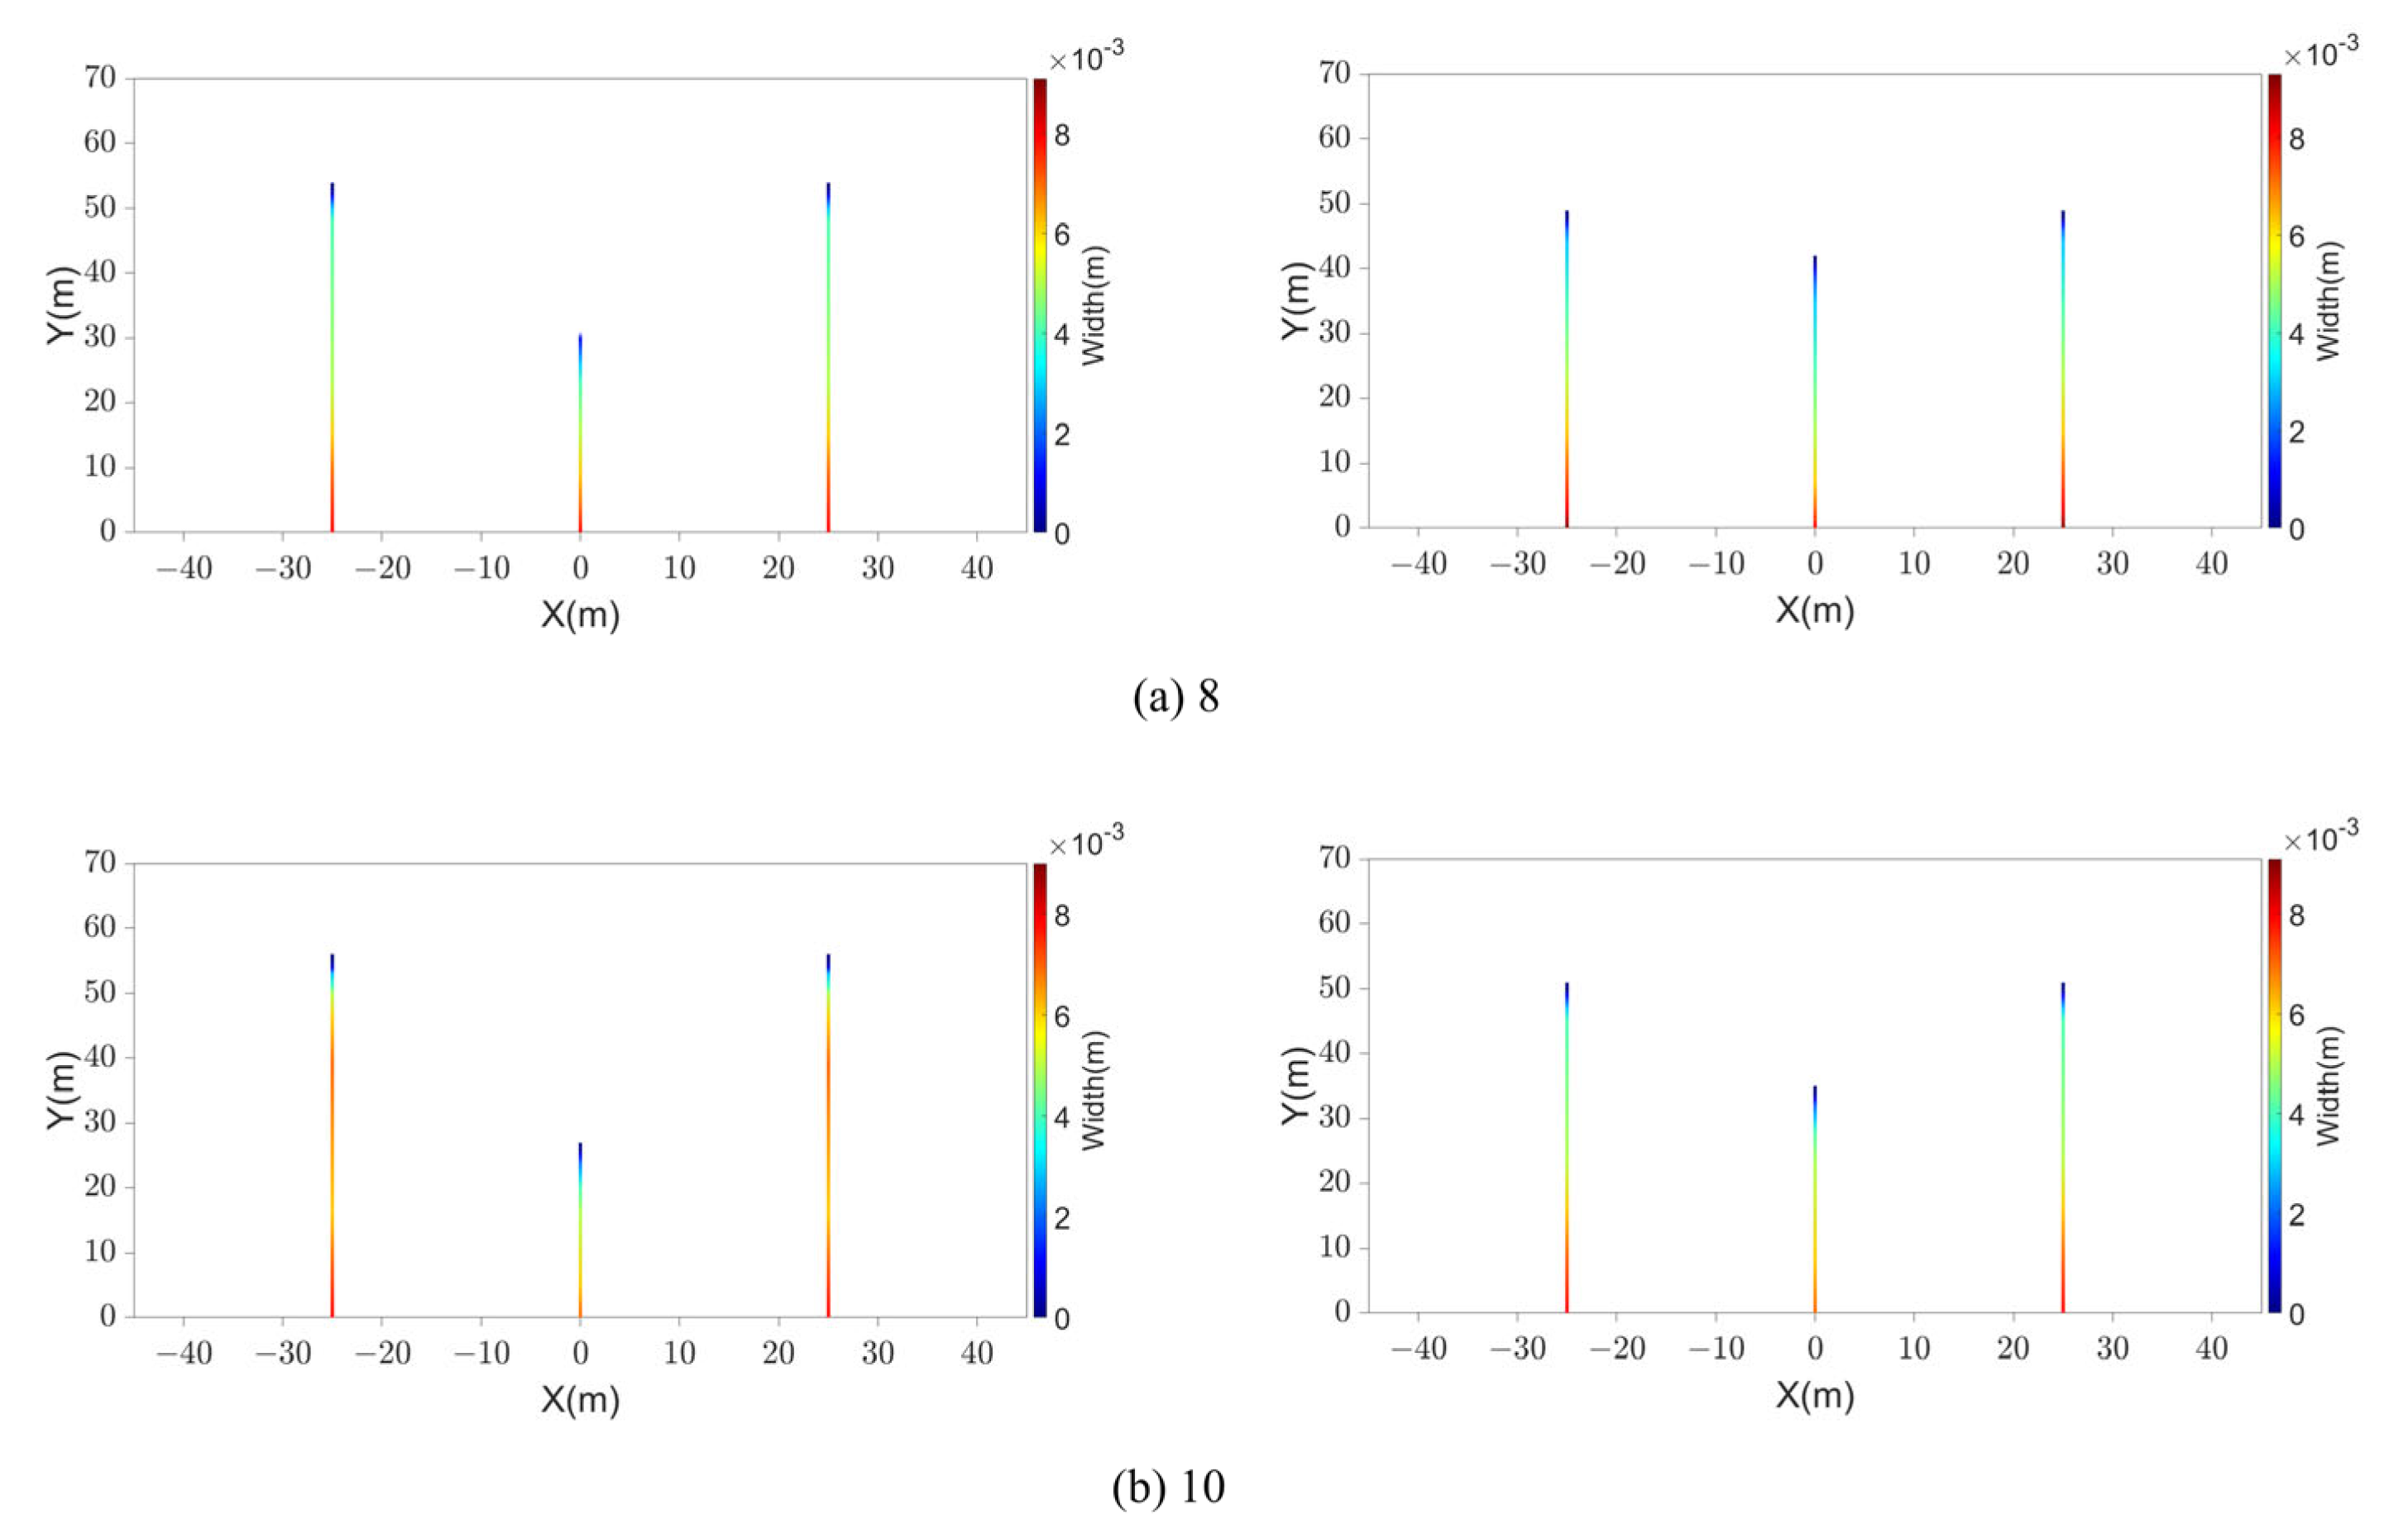
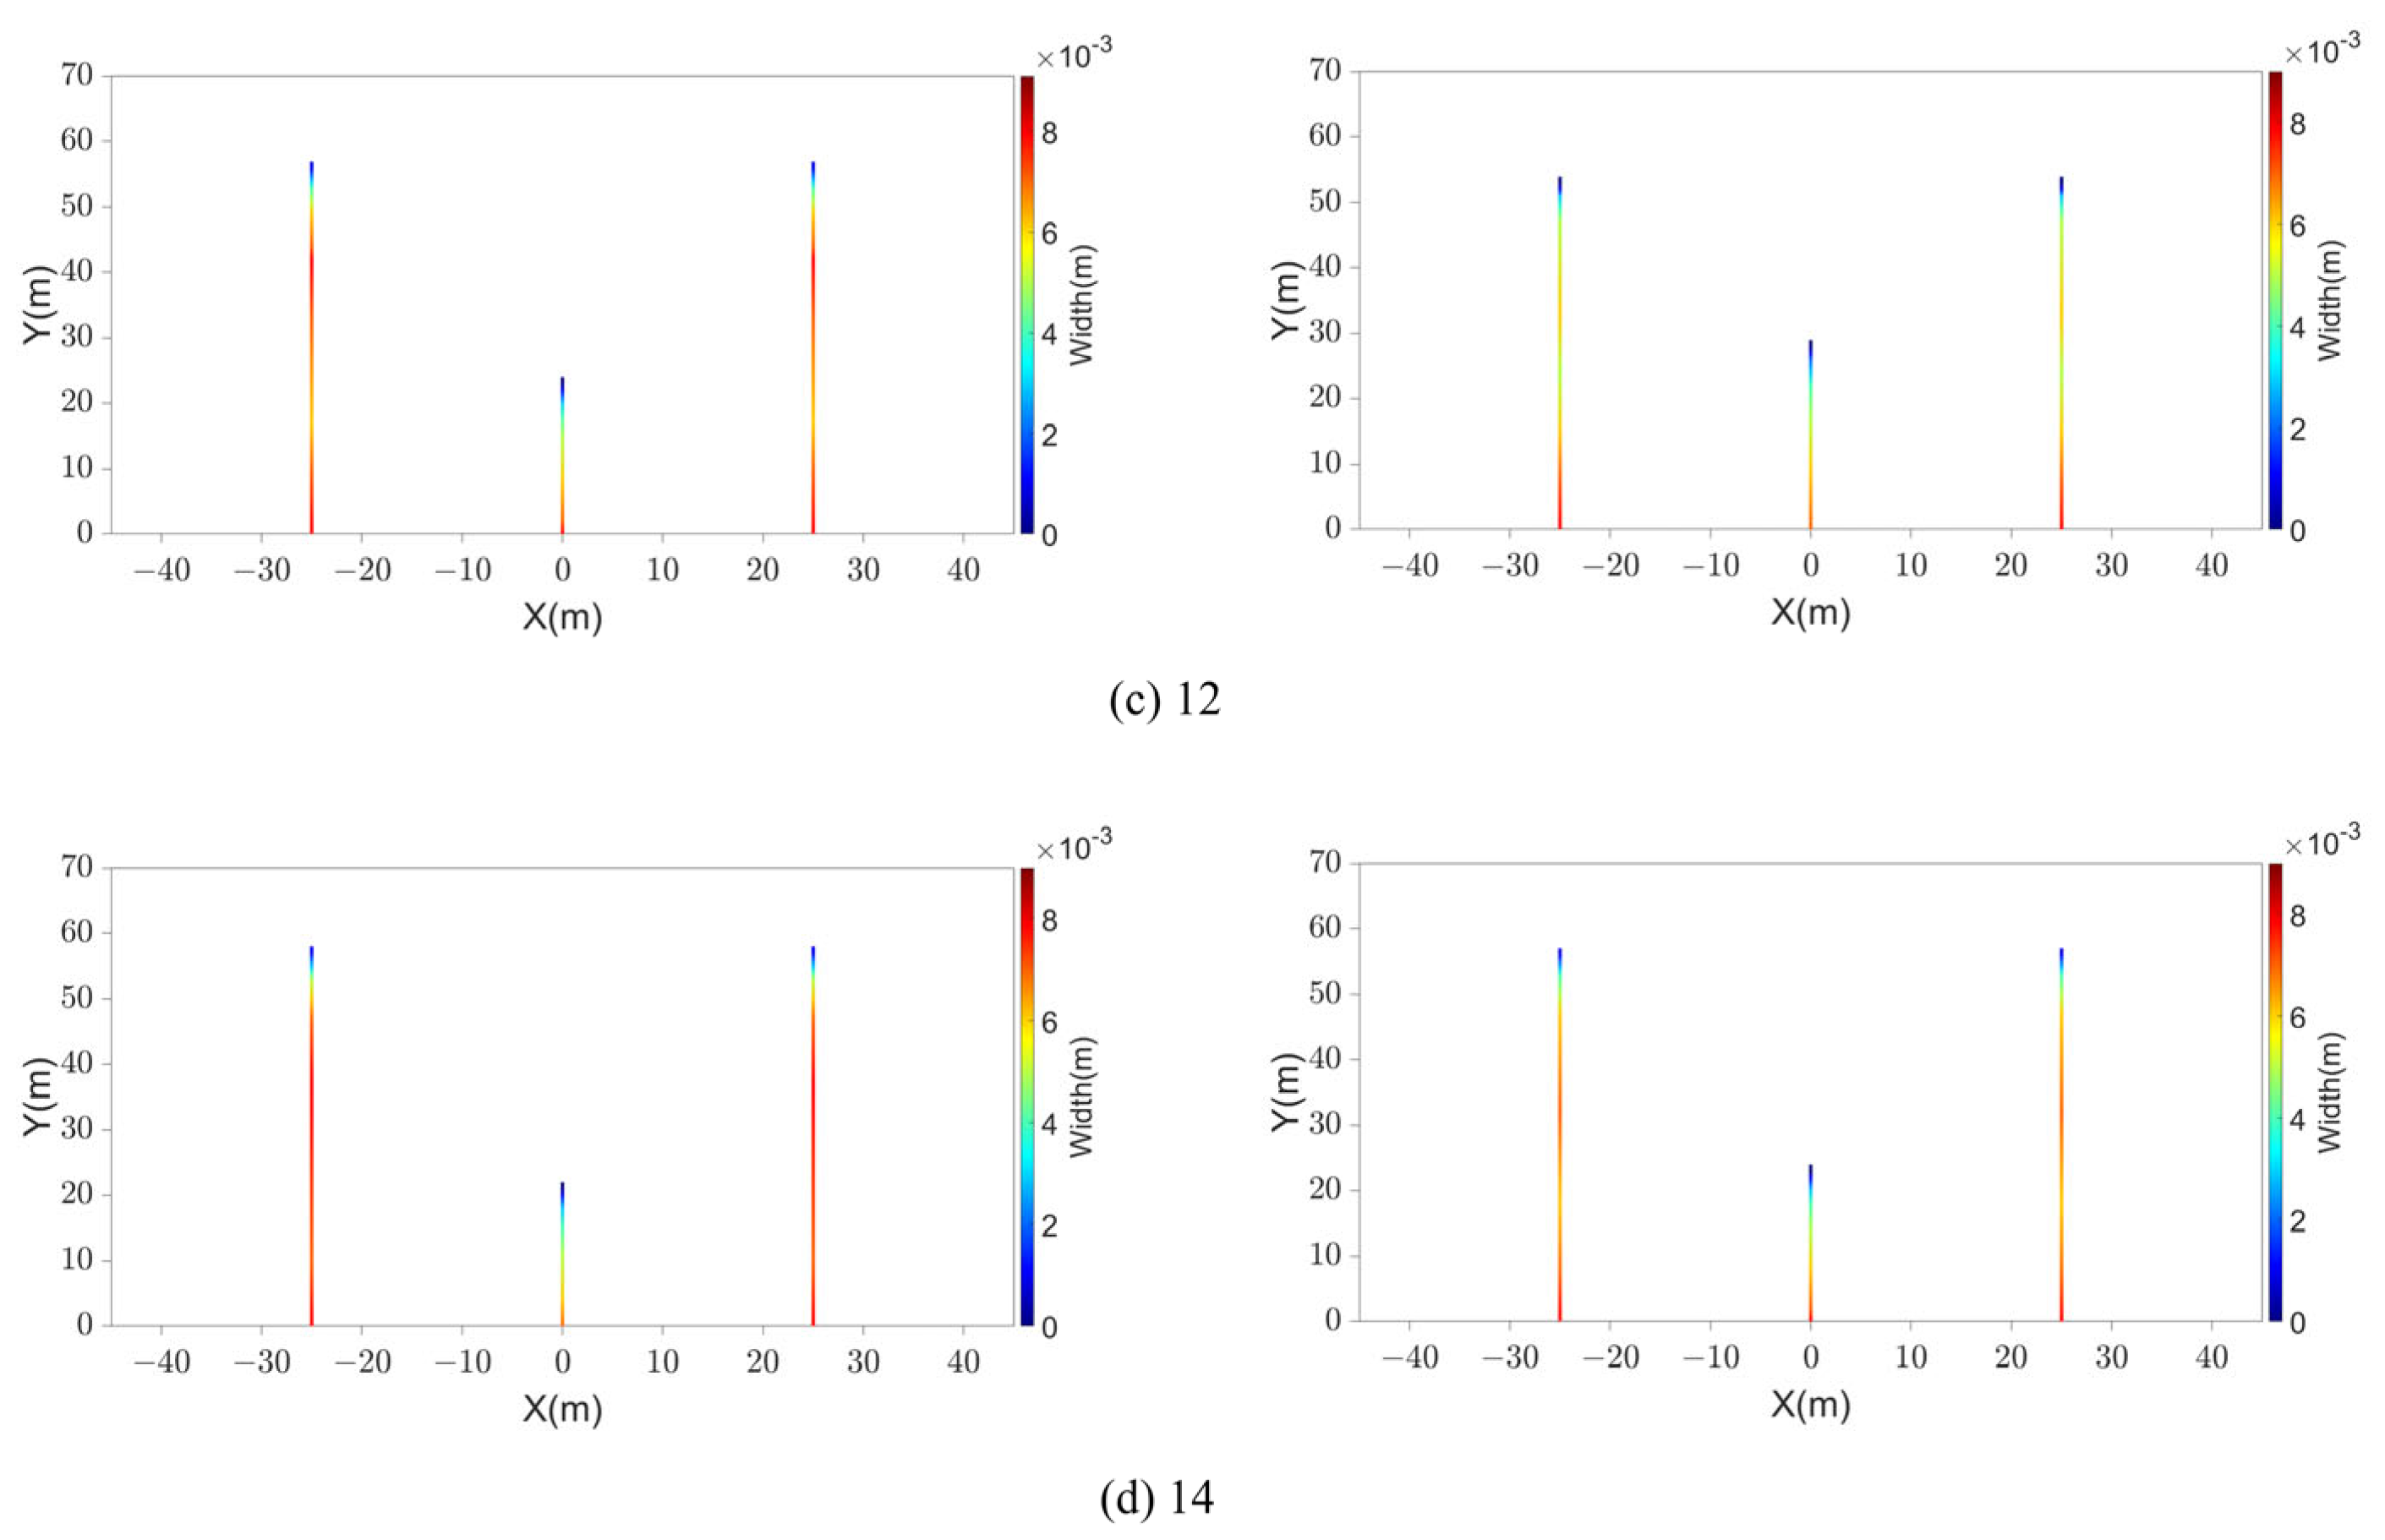
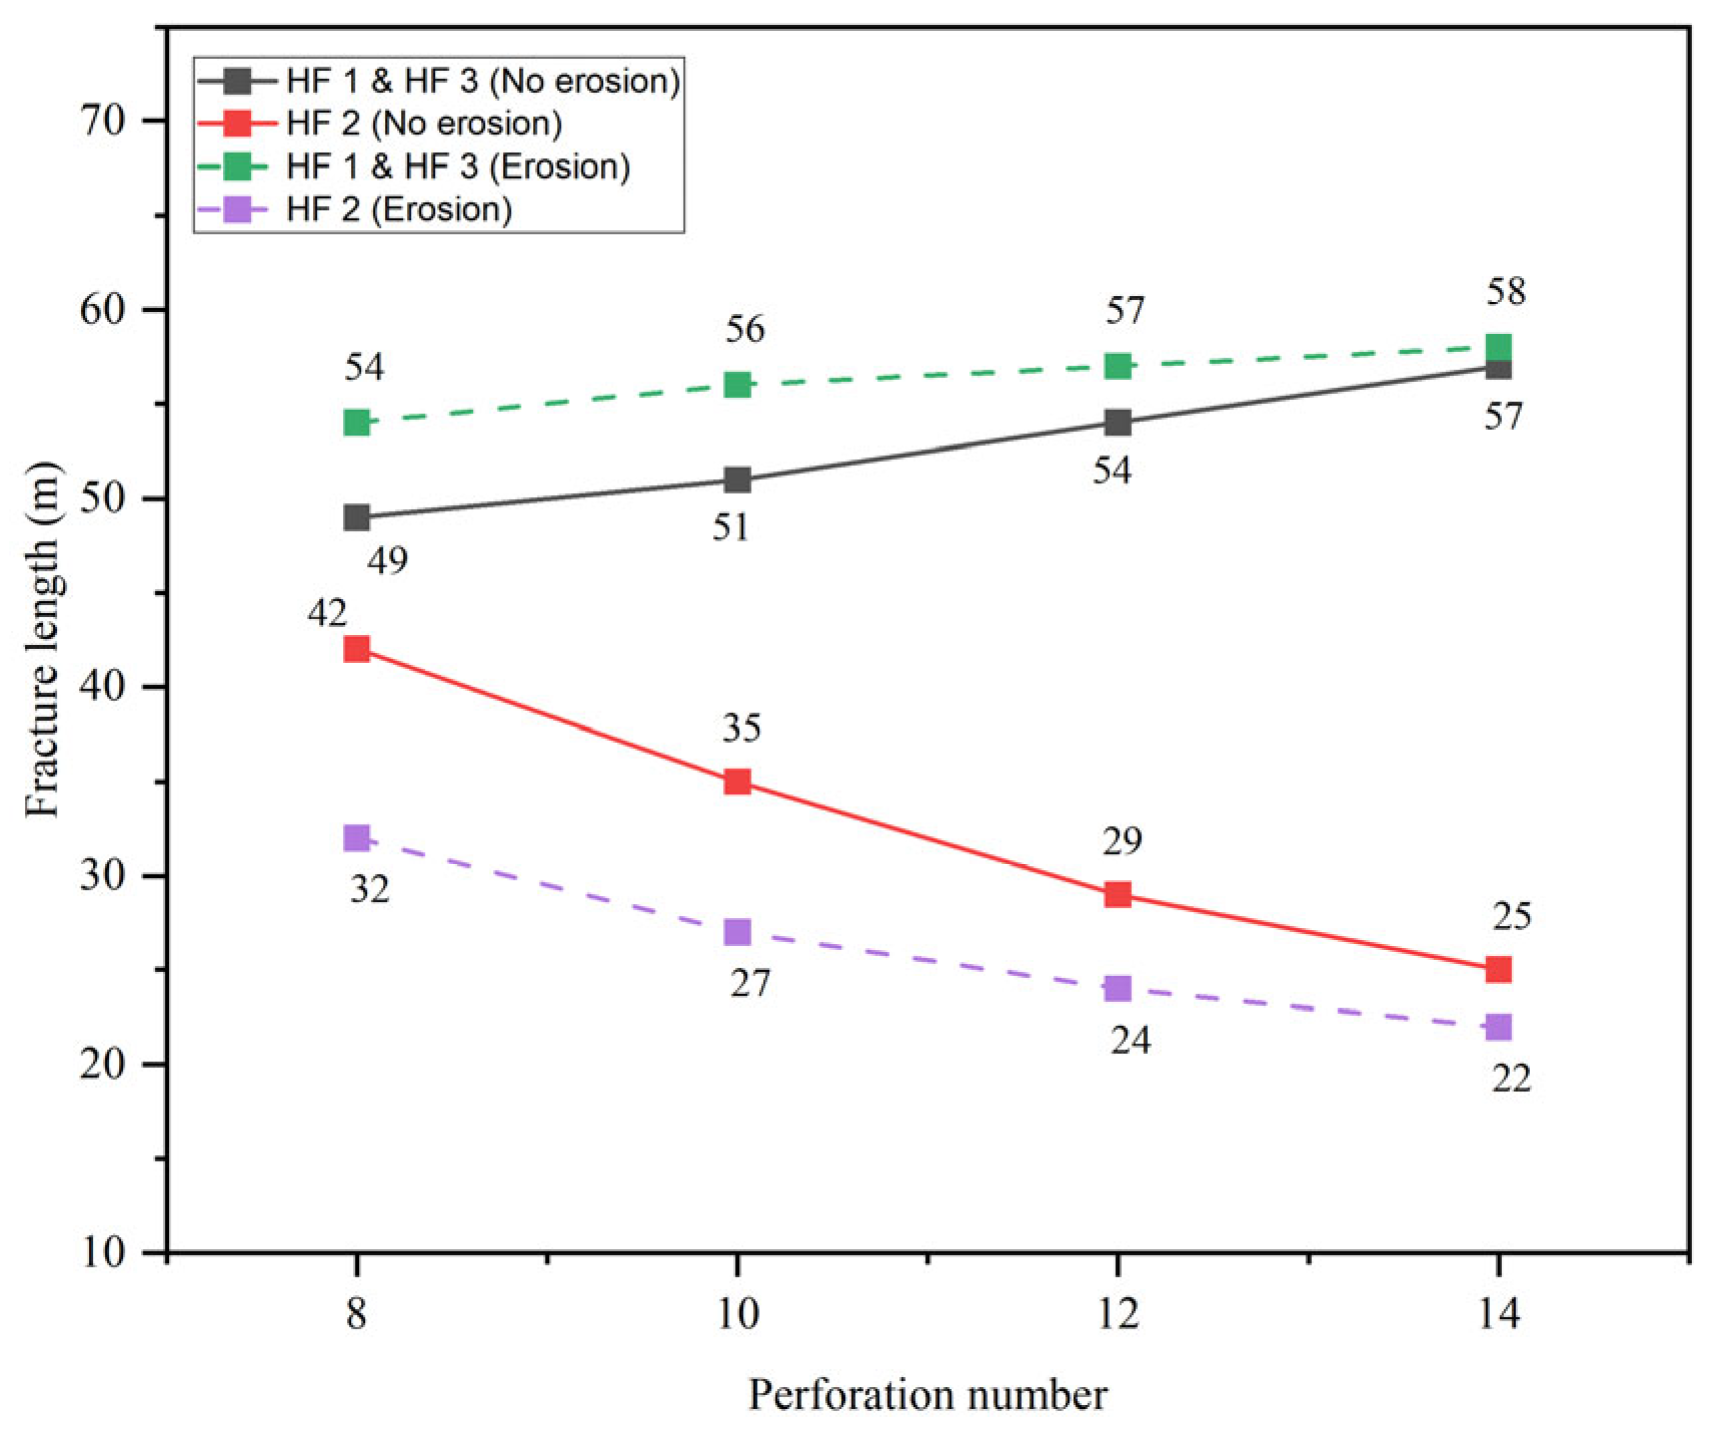
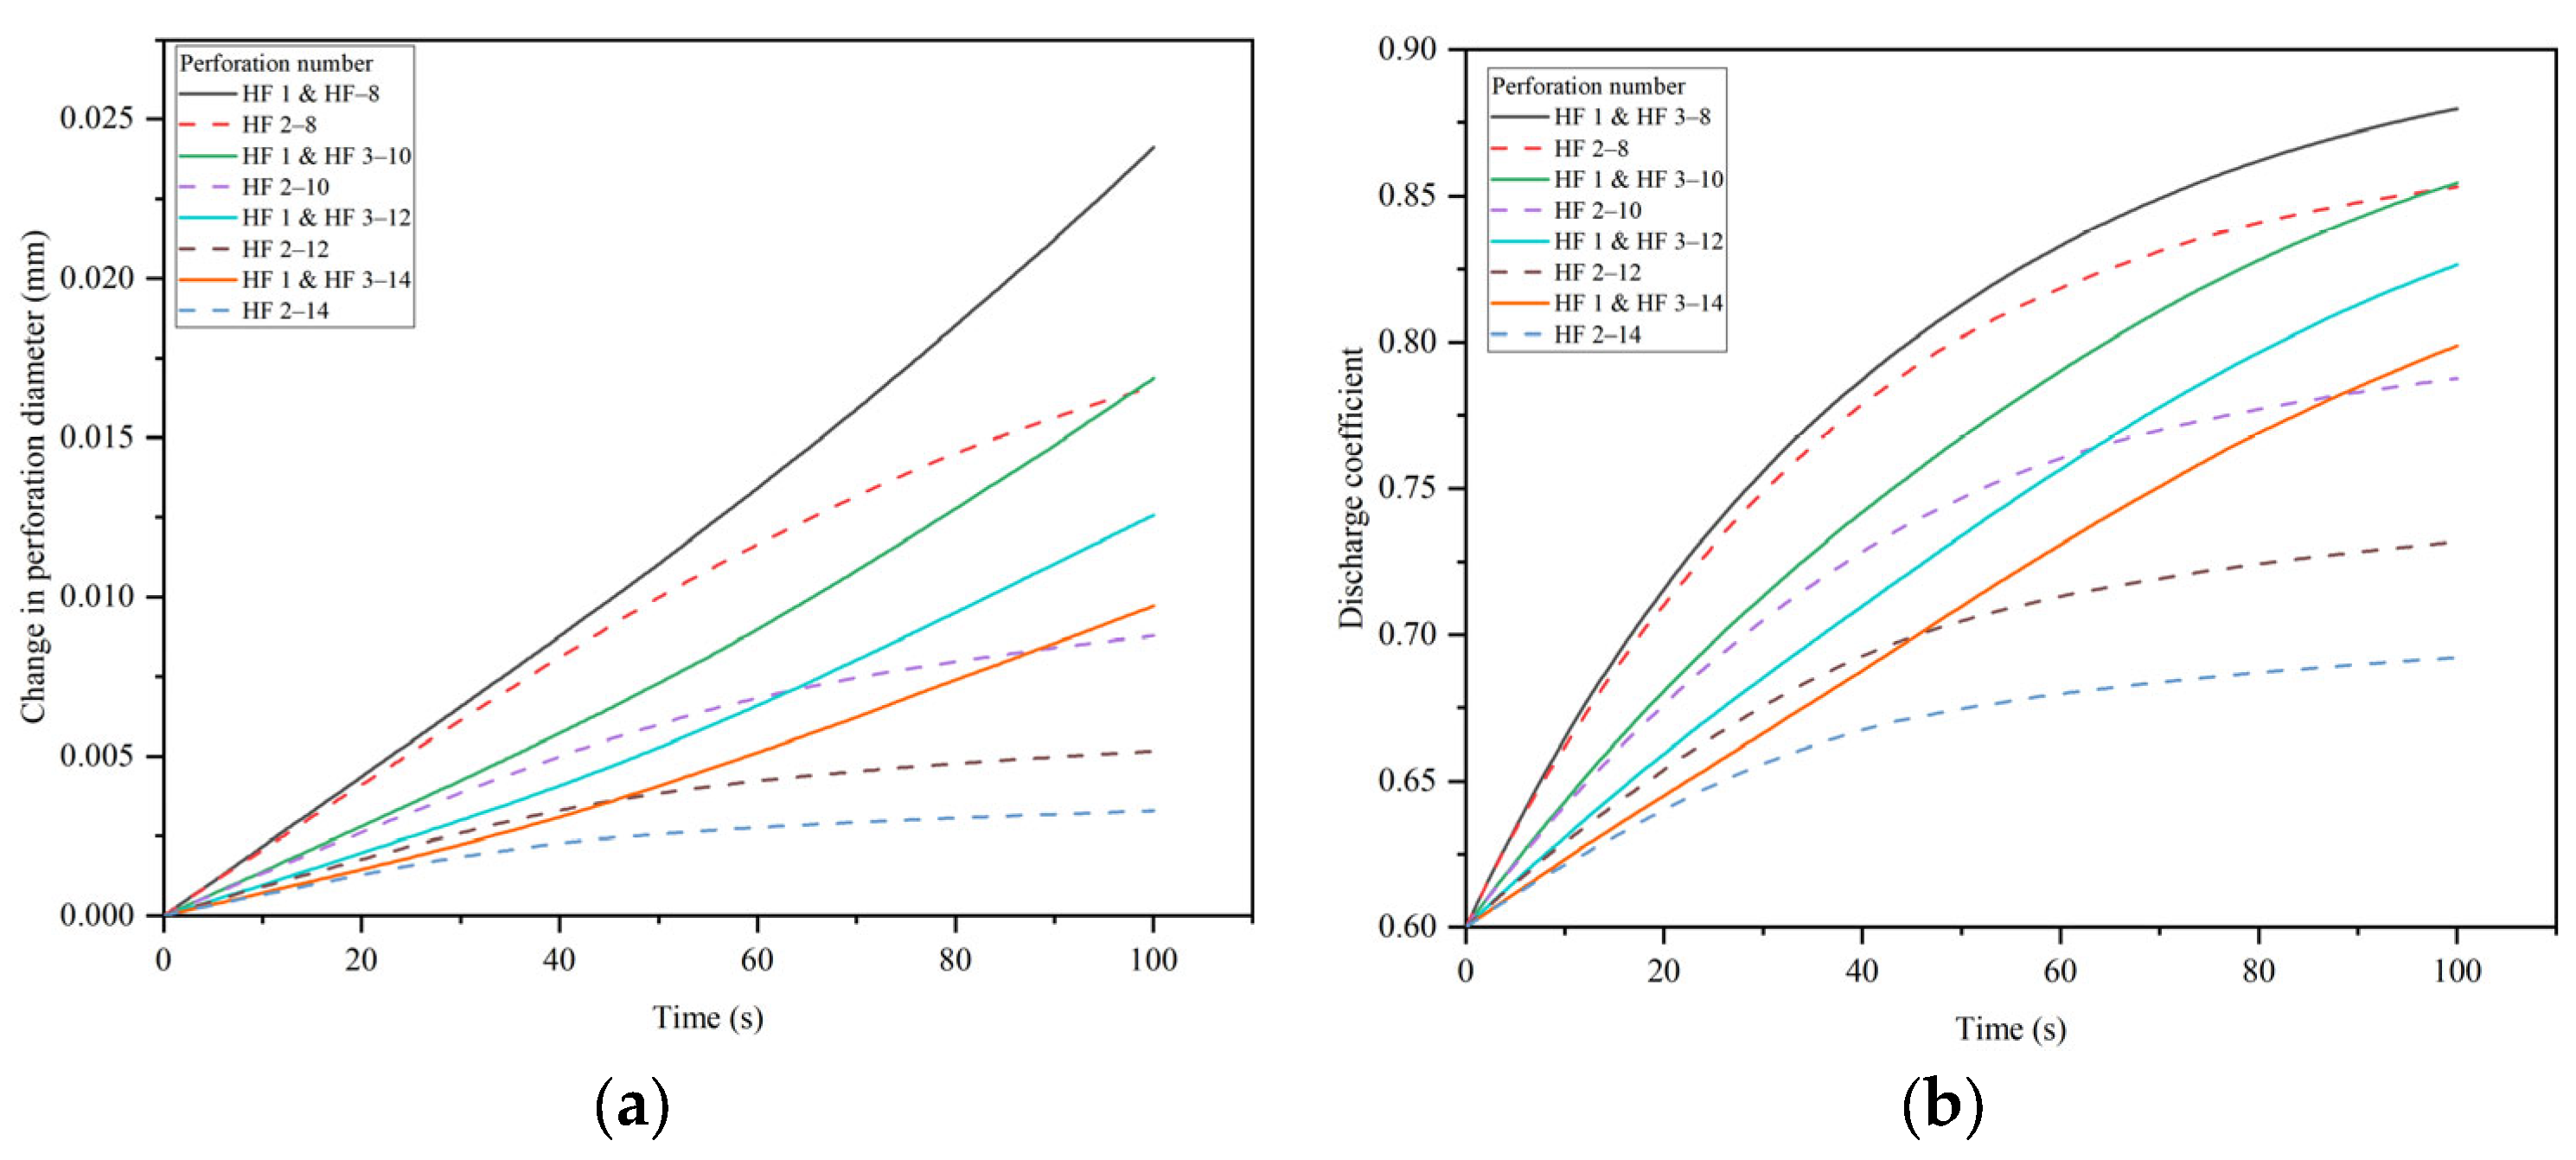
4.4. The Effects of the Perforation Number

The perforation number is one of the crucial parameters in the optimization of multi-cluster fracturing design. Limited-entry fracturing is achieved by adjusting the perforation number and perforation diameter. In this section, four cases are set to investigate the multi-fracture propagation under different perforation numbers (8, 10, 12, and 14).
Figure 17 illustrates the morphology of the fractures under different perforation numbers. It can be found that reducing the perforation number is beneficial for promoting uniform fracture propagation. And Figure 18 shows the flow distribution between the fractures becomes uniform as the perforation number decreases, which is beneficial for promoting uniform fracture propagation. Nevertheless, perforation erosion diminishes the capacity of the perforation number to facilitate uniform propagation of the fractures. When taking into account perforation erosion, it is observed that the length of the side fracture is longer and the length of central fracture is shorter, which increases the non-uniformity of the fracture propagation, and the erosion effects become more pronounced as the perforation number decreases. Figure 19 illustrates a 3 m disparity in the central fracture length between the cases accounting for perforation erosion and those disregarding it with a perforation number of 14, and the difference increases to 10 m when the perforation number is 8. This is because the perforation erosion is more severe with a smaller perforation number, which aggravates uneven propagation of the fractures. Figure 20 illustrates the variation in the diameter and discharge coefficient of the perforations under different perforation numbers. When the perforation number is 14, the variation in the diameter and discharge coefficient of the perforations is small. And when the perforation number is 8, the diameter and the discharge coefficient of the perforations change the most, which suggests that a smaller perforation number corresponds to more severe perforation erosion.
In conclusion, the effects of erosion on multi-fracture propagation are aggravated as the perforation number decreases. And when the perforation number increases, the erosion of the perforations is mitigated. Nevertheless, although the effects of erosion on multi-fracture propagation are more severe when the perforation number decreases, reducing the perforation number is still conductive to promoting uniform fracture propagation. Thus, a smaller perforation number can be considered to overcome the effect of perforation erosion and ensure uniform fracture propagation.

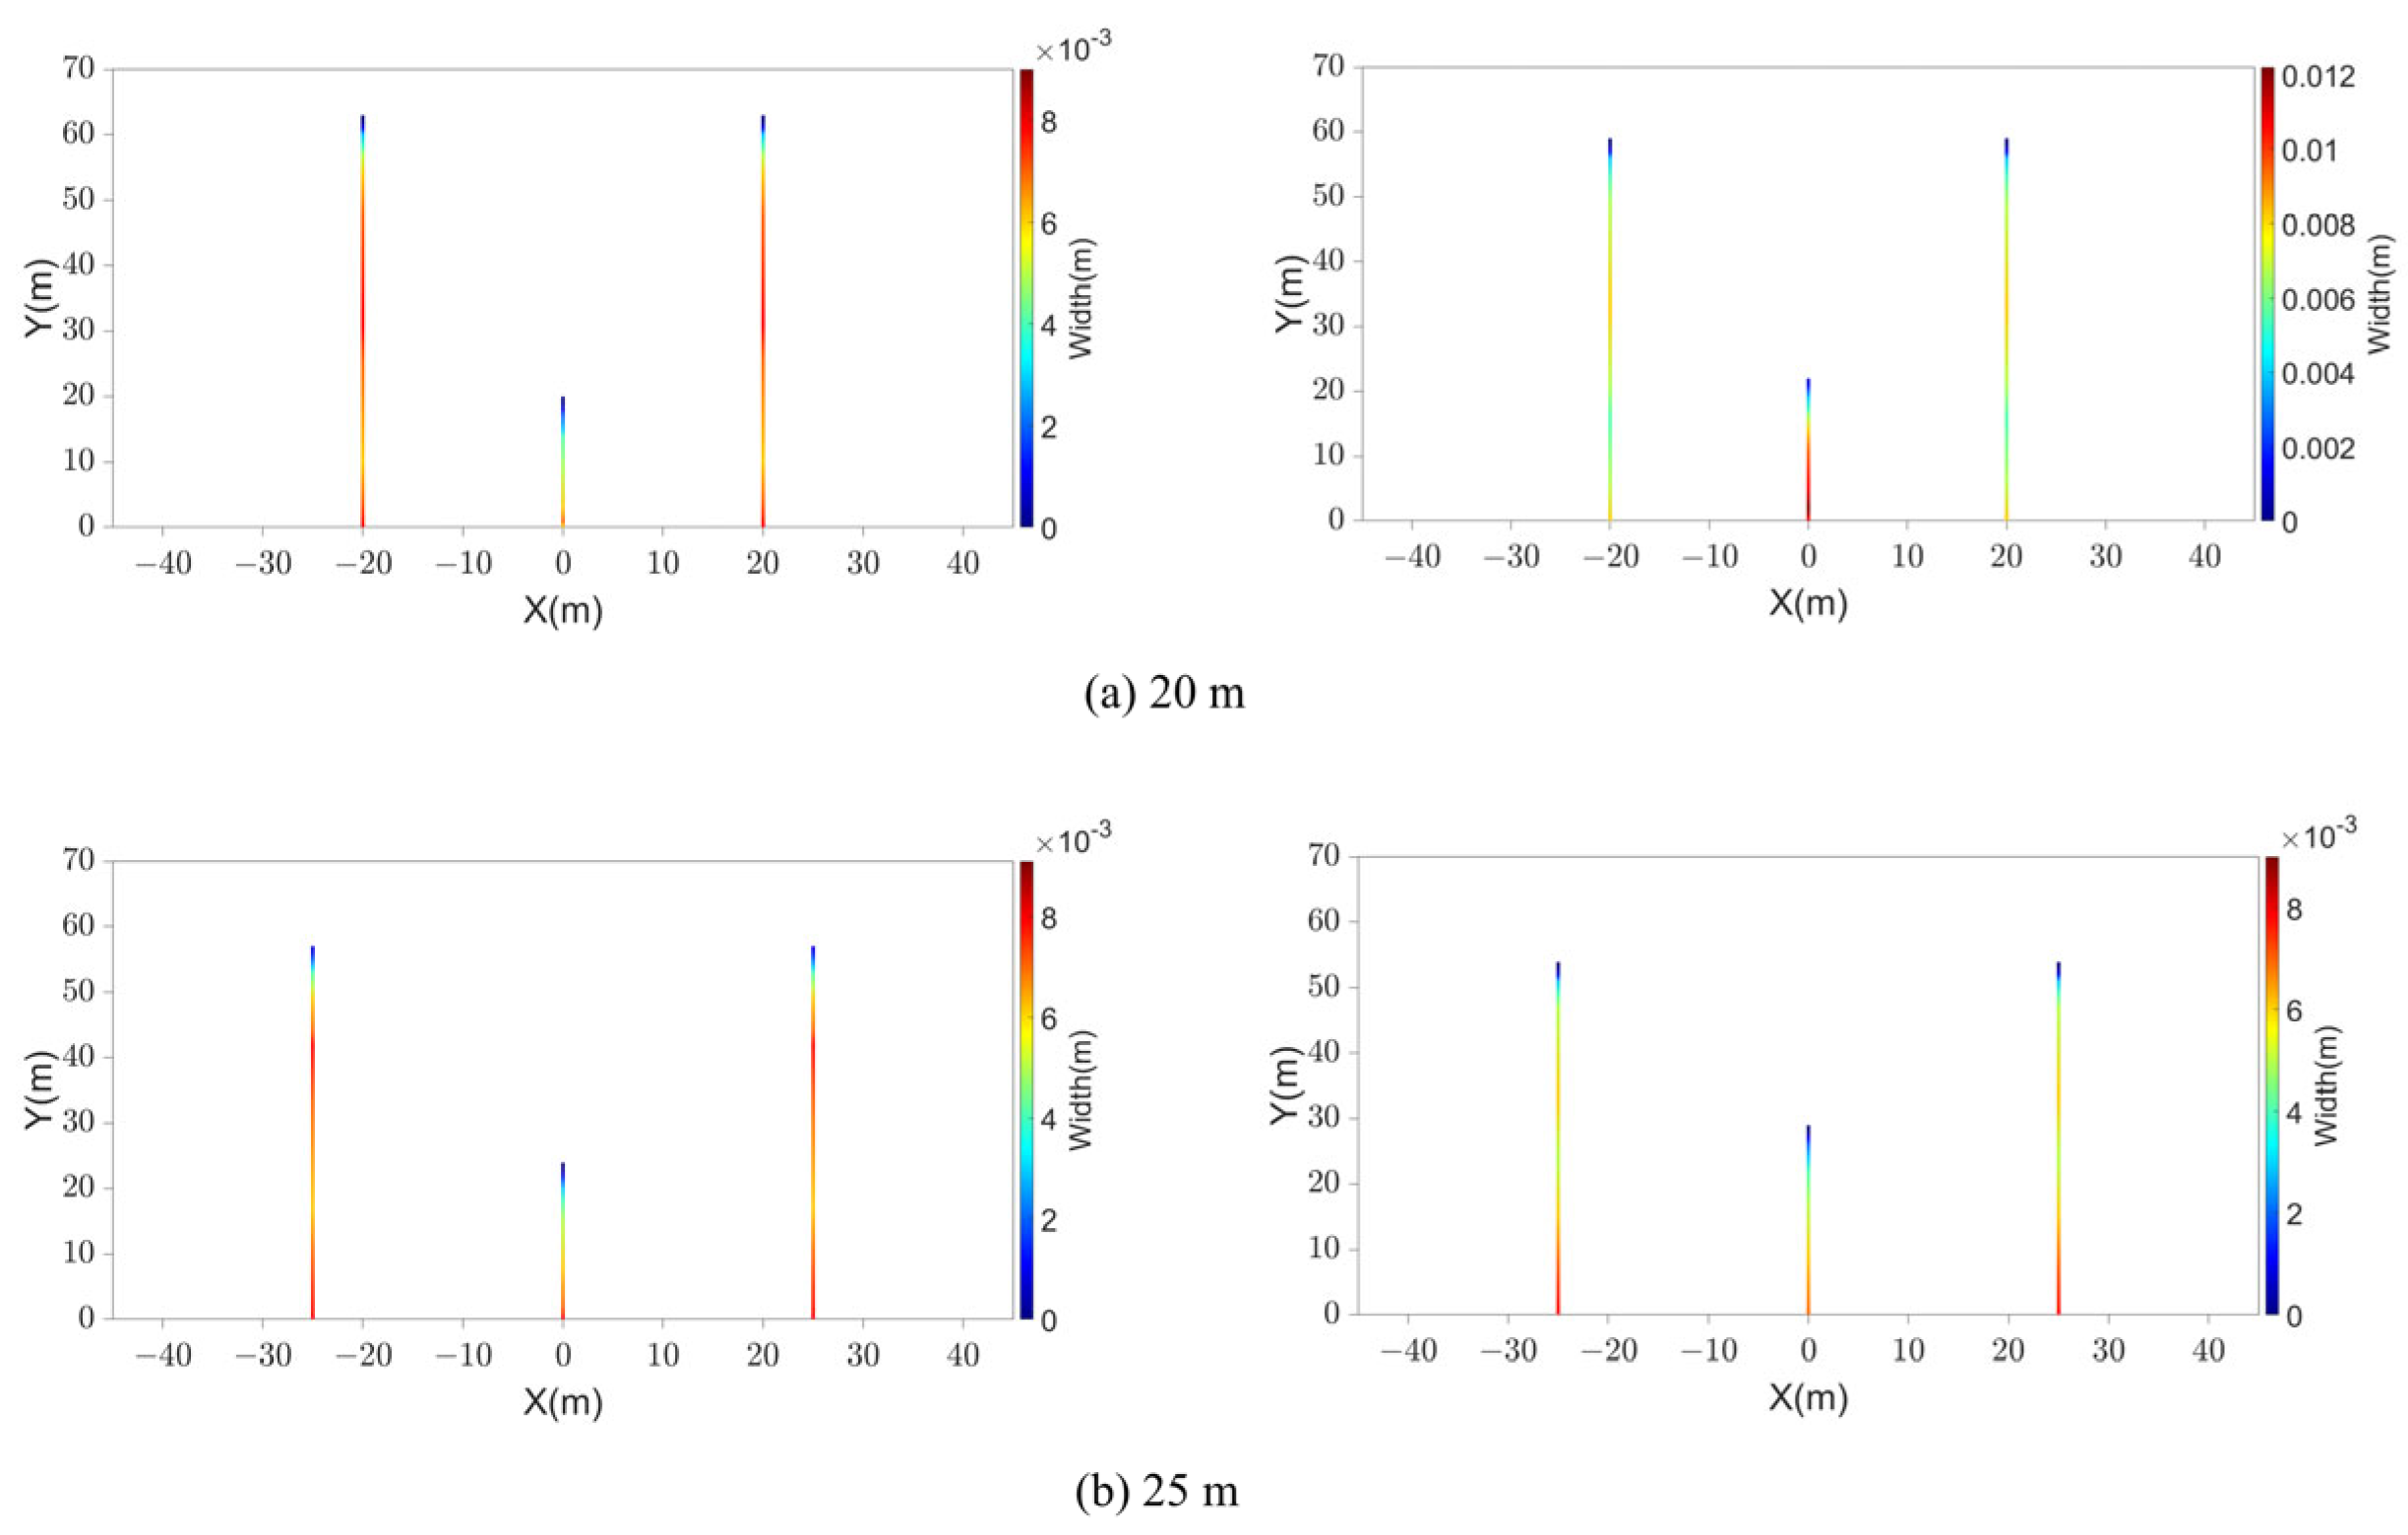
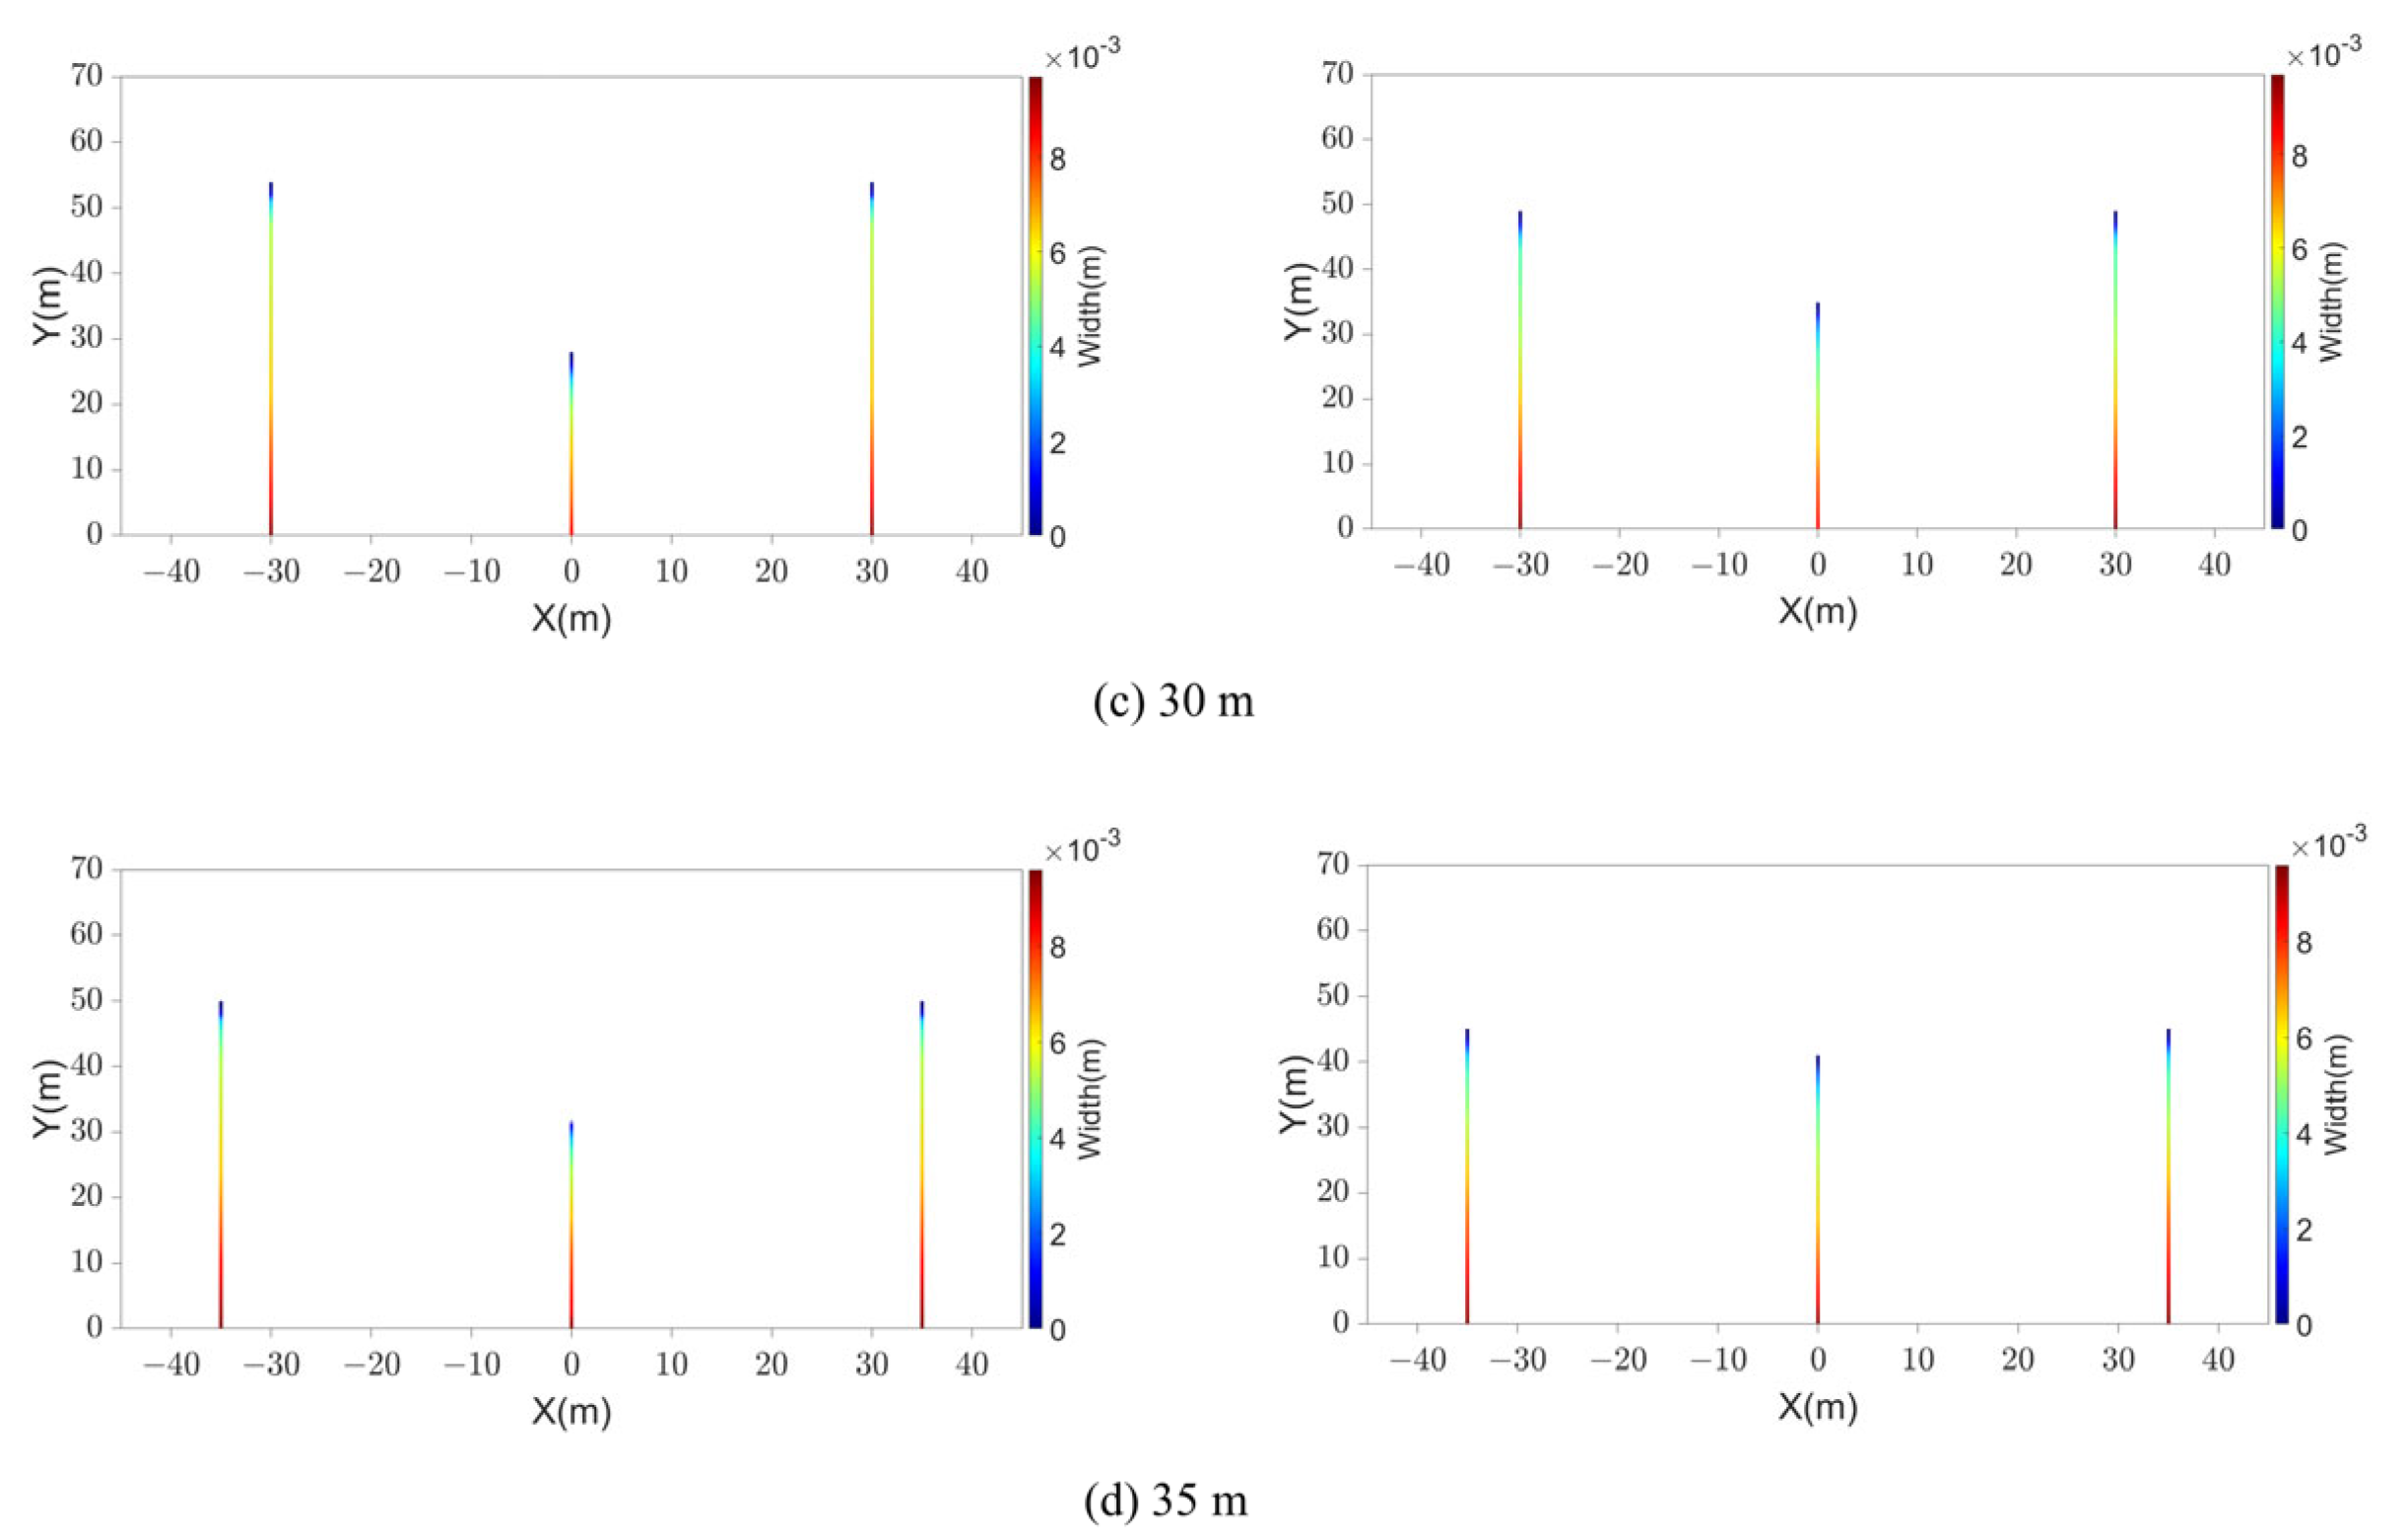
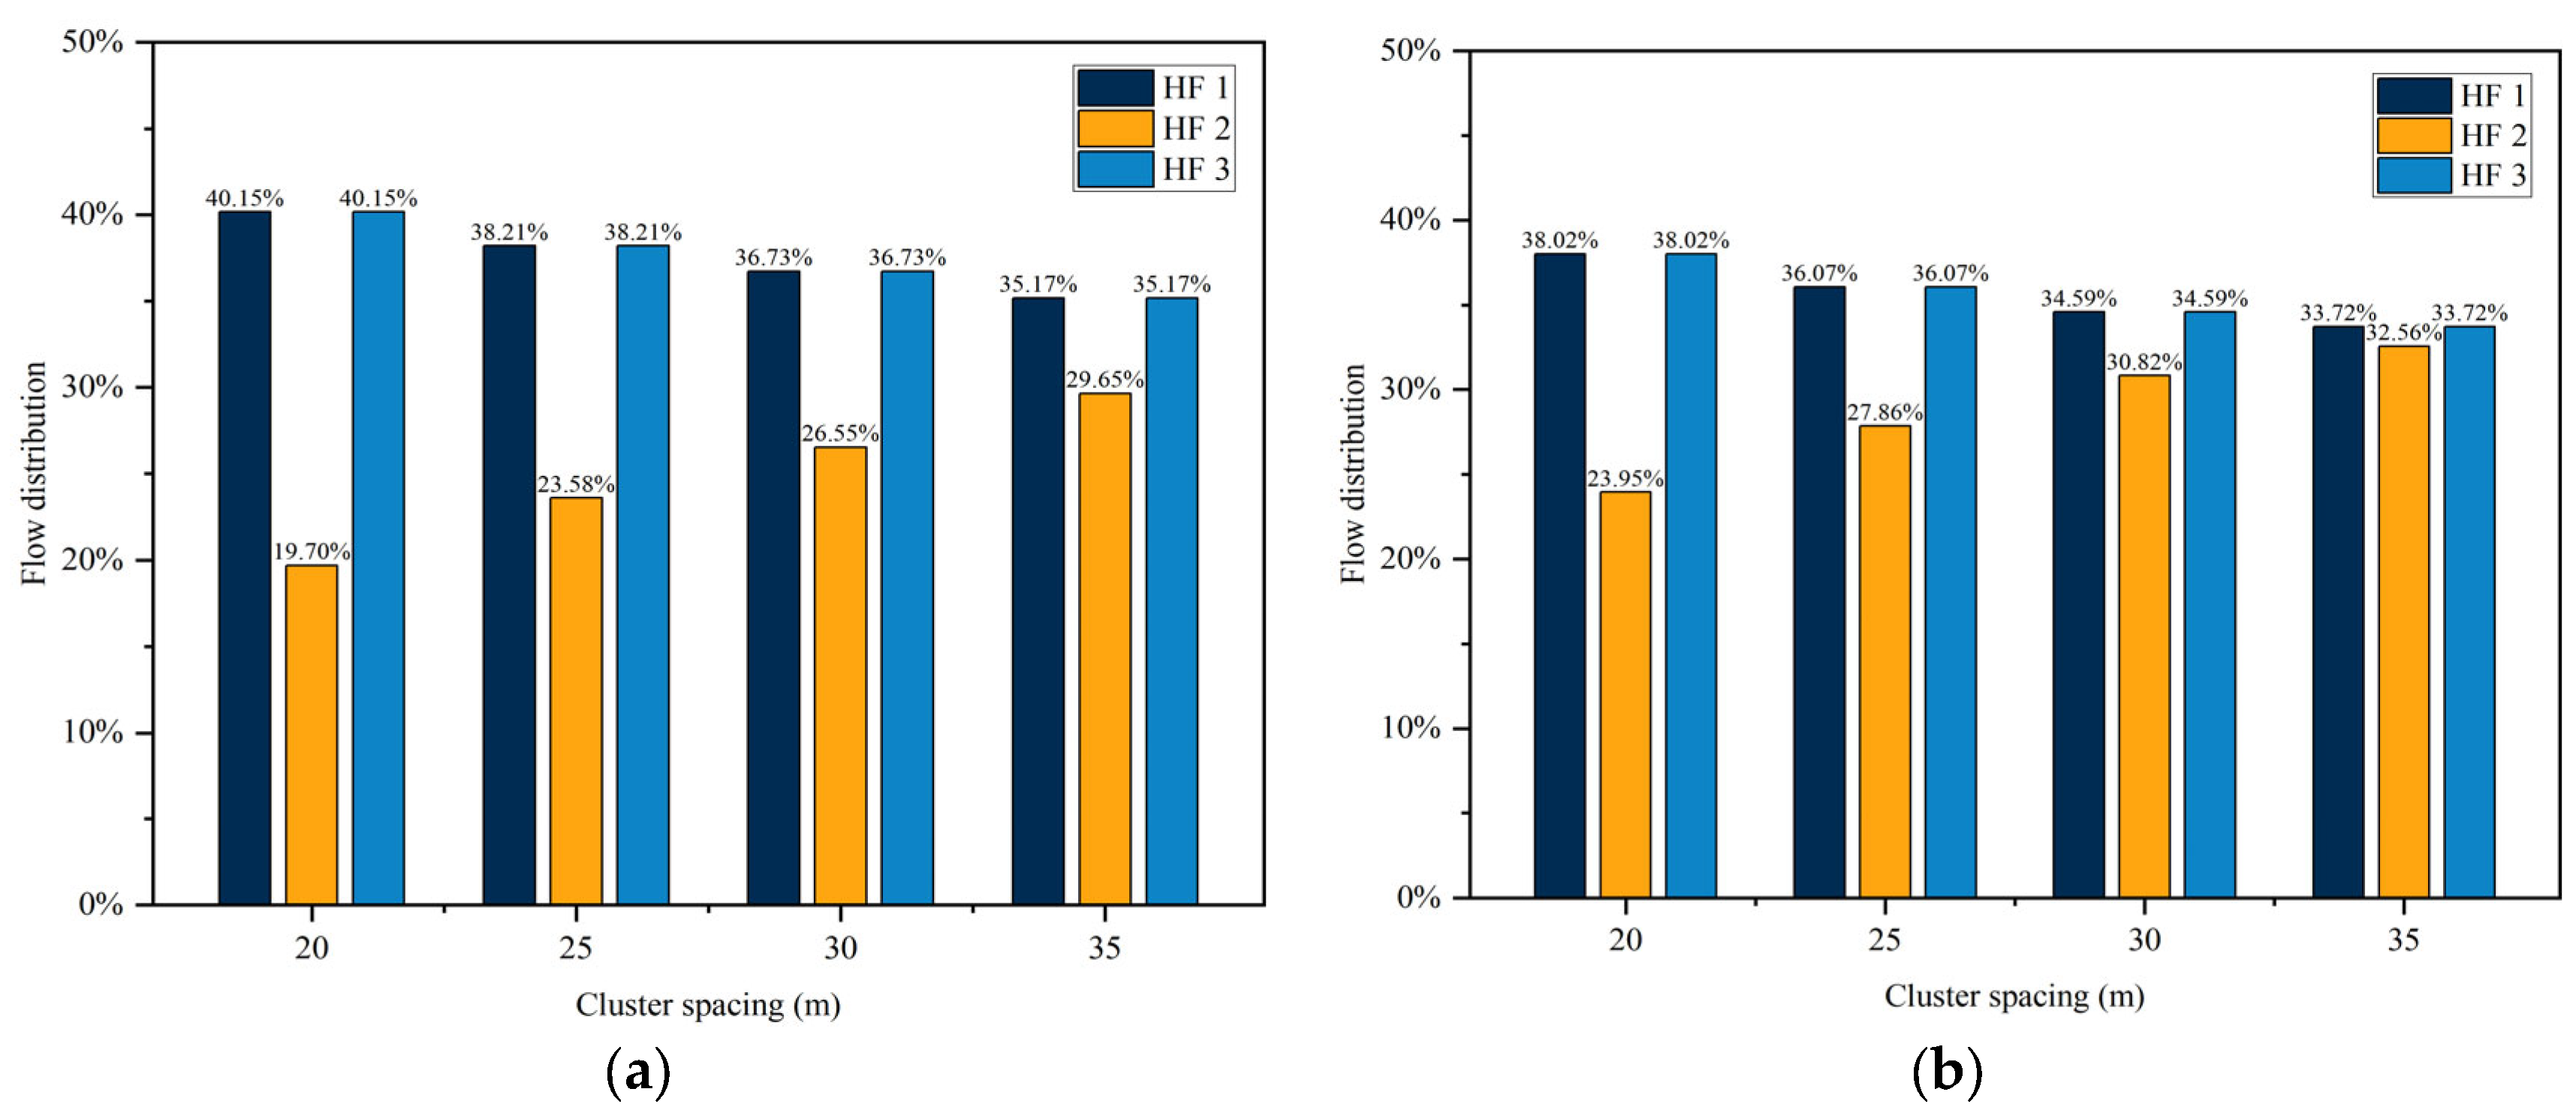
4.5. The Effects of Cluster Spacing

The cluster spacing is closely associated with the stress interference between fractures and has a significant influence on multi-fracture propagation. In this section, four cases are considered to study the multi-fracture propagation under different cluster spacings (20 m, 25 m, 30 m, and 35 m).
Figure 21 shows the fracture morphology with four different cluster spacings. The impact of stress shadow decreases as the cluster spacing increases. Hence, the uniformity of the fracture propagation increases as the cluster spacing increases. However, an increase in the cluster spacing enhances the impact of perforation erosion. Figure 22 shows that the difference in the length of the central fracture between the cases considering perforation erosion and those disregarding perforation erosion is 2 m when the cluster spacing is 20 m, and the difference increases to 11 m when it is 35 m. This is because the stress shadow effect is strong with a smaller cluster spacing, and a higher perforation friction is needed to ensure uniform fracture propagation. Despite the perforation erosion resulting in a reduction in the perforation friction, the multi-fracture propagation is less affected. As the cluster spacing increases, the effect of stress shadow is weakened, and the decrease in the perforation friction can significantly affect the multi-fracture propagation. Hence, although Figure 23 shows that the difference in the perforation erosion under different cluster spacings is small, the effect of the perforation erosion is enhanced as the cluster spacing increases.
Furthermore, the increase in the cluster spacing reduces the difference in the perforation erosion between the central fractures and the side fractures, as shown in Figure 23. The increase in the cluster spacing contributes to a more uniform flow distribution. As depicted in Figure 24, the fluid distributed to the central fracture increases while the fluid distributed to the side fractures decreases as the cluster spacing increases, which suggests that the injection rate in the side fractures decreases while the injection rate in the central fracture increases. As discussed in Section 4.2, the erosion of the perforations is more severe at an increasing injection rate. Therefore, the erosion of the side fractures is reduced while the erosion of the perforations in the central fracture is intensified, and the difference in the perforation erosion between the central fractures and the side fractures is reduced as the cluster spacing increases.
In conclusion, the cluster spacing has less influence on the perforation erosion. However, the stress shadow effect between fractures can diminish the effect of perforation erosion. The effects of erosion on multi-fracture propagation become more pronounced as the cluster spacing is increased. Nevertheless, increasing the cluster spacing can still contribute to uniform fracture propagation. Thus, larger cluster spacing can be considered to promote uniform fracture propagation.

5. Conclusions

In this study, a 2D hydraulic fracturing model is developed to study the multi-fracture propagation considering perforation erosion under different parameters. The study can provide recommendations for the optimization of multi-stage fracturing design and is helpful for enhancing shale reservoir stimulation. The following conclusions are obtained:
  • Perforation erosion increases the discharge coefficient and perforation diameter, which results in a reduction in the perforation friction and aggravates uneven fracture propagation.
  • For a certain volume of fracturing fluid, although the injection time is longer at a lower injection rate, the effects of erosion on multi-fracture propagation are more severe at a high injection rate. Nevertheless, an increasing injection rate is still beneficial for promoting uniform fracture propagation, and a higher injection rate is recommended.
  • When the perforation number and perforation diameter decrease, the erosion of the perforations is aggravated, which leads to a sharp decrease in the perforation friction and aggravates the effects of erosion on the multi-fracture propagation. To overcome the effect of perforation erosion, a smaller perforation diameter and perforation number are recommended to ensure the initial perforation friction is much higher than the perforation friction after perforation erosion.
  • The cluster spacing has less effect on perforation erosion. And stress shadow can diminish the effects of erosion on multi-fracture propagation, which indicates that the effects of erosion on multi-fracture propagation are enhanced as the cluster spacing is increased. Nevertheless, increasing the cluster spacing is still conducive to promoting uniform fracture propagation, and larger cluster spacing can be considered to promote uniform fracture propagation.

Author Contributions

Methodology: L.X.; software: L.T.; data curation: L.T.; writing—original draft preparation, review and editing: B.H. and Y.Z. All authors have read and agreed to the published version of the manuscript.

Funding

This work was financially supported by the National Natural Science Foundation (No. 11872258).

Data Availability Statement

The data presented in this study are available on request from the corresponding author. The data are not publicly available due to future research.

Conflicts of Interest

The authors declare that they have no known competing financial interests or personal relationships that could have appeared to influence the work reported in this paper.

References

  1. Yuan, J.; Luo, D.; Feng, L. A review of the technical and economic evaluation techniques for shale gas development. Appl. Energy 2015, 148, 49–65. [Google Scholar] [CrossRef]
  2. U.S. EIA. Technically Recoverable Shale Oil and Shale Gas Resources: An Assessment of 137 Shale Formation: 41 Countries outside the United States; U.S. EIA: Washington, DC, USA, 2013.
  3. Niu, W.; Lu, J.; Sun, Y.; Liu, H.; Cao, X.; Zhan, H.; Zhang, J. A review of the application of data-driven technology in shale gas production evaluation. Energy Rep. 2023, 10, 213–227. [Google Scholar] [CrossRef]
  4. Li, H. Coordinated development of shale gas benefit exploitation and ecological environmental conservation in China: A mini review. Front. Ecol. Evol. 2023, 11. [Google Scholar] [CrossRef]
  5. Liu, J.; Bai, X.; Elsworth, D. Evolution of pore systems in low-maturity oil shales during thermal upgrading—Quantified by dynamic SEM and machine learning. Pet. Sci. 2023, in press. [Google Scholar] [CrossRef]
  6. Xu, Y.; Lun, Z.; Pan, Z.; Wang, H.; Zhou, X.; Zhao, C.; Zhang, D. Occurrence space and state of shale oil: A review. J. Pet. Sci. Eng. 2022, 211, 110183. [Google Scholar] [CrossRef]
  7. Tang, H.; Winterfeld, P.H.; Wu, Y.-S.; Huang, Z.-q.; Di, Y.; Pan, Z.; Zhang, J. Integrated simulation of multi-stage hydraulic fracturing in unconventional reservoirs. J. Nat. Gas Sci. Eng. 2016, 36, 875–892. [Google Scholar] [CrossRef]
  8. Sobhaniaragh, B.; Mansur, W.J.; Peters, F.C. Three-dimensional investigation of multiple stage hydraulic fracturing in unconventional reservoirs. J. Pet. Sci. Eng. 2016, 146, 1063–1078. [Google Scholar] [CrossRef]
  9. Zhao, J.; Zhao, J.; Hu, Y.; Zhang, S.; Huang, T.; Liu, X. Numerical simulation of multistage fracturing optimization and application in coalbed methane horizontal wells. Eng. Fract. Mech. 2020, 223, 106738. [Google Scholar] [CrossRef]
  10. Modeland, N.; Buller, D.; Chong, K.K. Statistical Analysis of the Effect of Completion Methodology on Production in the Haynesville Shale. In Proceedings of the North American Unconventional Gas Conference and Exhibition, The Woodlands, TX, USA, 12–16 June 2011; p. SPE-144120-MS. [Google Scholar]
  11. Cheng, Y. Impacts of the Number of Perforation Clusters and Cluster Spacing on Production Performance of Horizontal Shale-Gas Wells. SPE Reserv. Eval. Eng. 2012, 15, 31–40. [Google Scholar] [CrossRef]
  12. Wu, Q.; Xu, Y.; Wang, X.; Wang, T.; Zhang, S. Volume fracturing technology of unconventional reservoirs: Connotation, design optimization and implementation. Pet. Explor. Dev. 2012, 39, 377–384. [Google Scholar] [CrossRef]
  13. Miller, C.; Waters, G.; Rylander, E. Evaluation of Production Log Data from Horizontal Wells Drilled in Organic Shales. In Proceedings of the North American Unconventional Gas Conference and Exhibition, The Woodlands, TX, USA, 12–16 June 2011. [Google Scholar]
  14. Ugueto, C.G.A.; Huckabee, P.T.; Molenaar, M.M.; Wyker, B.; Somanchi, K. Perforation Cluster Efficiency of Cemented Plug and Perf Limited Entry Completions; Insights from Fiber Optics Diagnostics. In Proceedings of the SPE Hydraulic Fracturing Technology Conference, The Woodlands, TX, USA, 9–11 February 2016. [Google Scholar]
  15. Rainbolt, M.F.; Esco, J. Frac Hit Induced Production Losses: Evaluating Root Causes, Damage Location, Possible Prevention Methods and Success of Remediation Treatments, Part II. In Proceedings of the SPE Hydraulic Fracturing Technology Conference and Exhibition, Muscat, Oman, 16–18 October 2018; p. D021S006R004. [Google Scholar]
  16. Li, Y.; Deng, J.; Liu, W.; Yan, W.; Feng, Y.; Cao, W.; Wang, P.; Hou, Y. Numerical simulation of limited-entry multi-cluster fracturing in horizontal well. J. Pet. Sci. Eng. 2017, 152, 443–455. [Google Scholar] [CrossRef]
  17. Zeng, Q.; Liu, Z.; Wang, T.; Gao, Y.; Zhuang, Z. Fully coupled simulation of multiple hydraulic fractures to propagate simultaneously from a perforated horizontal wellbore. Comput. Mech. 2018, 61, 137–155. [Google Scholar] [CrossRef]
  18. Zheng, P.; Xia, Y.; Yao, T.; Jiang, X.; Xiao, P.; He, Z.; Zhou, D. Formation mechanisms of hydraulic fracture network based on fracture interaction. Energy 2022, 243, 123057. [Google Scholar] [CrossRef]
  19. ElGibaly, A.; Abdalla Osman, M. Perforation friction modeling in limited entry fracturing using artificial neural network. Egypt. J. Pet. 2019, 28, 297–305. [Google Scholar] [CrossRef]
  20. Zhou, T.; Chen, M.; Zhang, S.; Li, Y.; Li, F.; Zhang, C. Simulation of fracture propagation and optimization of ball-sealer in-stage diversion under the effect of heterogeneous stress field. Nat. Gas Ind. B 2020, 7, 523–532. [Google Scholar] [CrossRef]
  21. Lim, P.; Goddard, P.; Sink, J.; Abou-Sayed, I. Hydraulic Fracturing: A Marcellus Case Study of an Engineered Staging Completion Based on Rock Properties. In Proceedings of the SPE/CSUR Unconventional Resources Conference—Canada, Calgary, AB, Canada, 30 September–2 October 2014; p. D011S003R006. [Google Scholar]
  22. Wu, K.; Olson, J.; Balhoff, M.T.; Yu, W. Numerical Analysis for Promoting Uniform Development of Simultaneous Multiple-Fracture Propagation in Horizontal Wells. SPE Prod. Oper. 2016, 32, 41–50. [Google Scholar]
  23. Peirce, A.P.P.; Bunger, A.P.P. Interference Fracturing: Nonuniform Distributions of Perforation Clusters That Promote Simultaneous Growth of Multiple Hydraulic Fractures. SPE J. 2014, 20, 384–395. [Google Scholar] [CrossRef]
  24. Chen, M.; Zhang, S.; Ma, X.; Zhou, T.; Zou, Y. A semi-analytical model for predicting fluid partitioning among multiple hydraulic fractures from a horizontal well. J. Pet. Sci. Eng. 2018, 171, 1041–1051. [Google Scholar] [CrossRef]
  25. Zhang, F.; Wang, X.; Tang, M.; Du, X.; Xu, C.; Tang, J.; Damjanac, B. Numerical Investigation on Hydraulic Fracturing of Extreme Limited Entry Perforating in Plug-and-Perforation Completion of Shale Oil Reservoir in Changqing Oilfield, China. Rock Mech. Rock Eng. 2021, 54, 2925–2941. [Google Scholar] [CrossRef]
  26. Li, M.; Lv, W.; Liu, J.; Sun, Z.; Zhou, F.; Wang, B. Effect of perforation friction on 3D In-stage multiple fracture propagation: A numerical study. Eng. Fract. Mech. 2022, 267, 108415. [Google Scholar] [CrossRef]
  27. Lecampion, B.; Desroches, J.; Weng, X.; Burghardt, J.; Brown, J.E.E. Can We Engineer Better Multistage Horizontal Completions? Evidence of the Importance of Near-wellbore Fracture Geometry from Theory, Lab and Field Experiments. In Proceedings of the SPE Hydraulic Fracturing Technology Conference, The Woodlands, TX, USA, 3–5 February 2015; p. D021S003R001. [Google Scholar]
  28. Somanchi, K.; O’Brien, C.; Huckabee, P.; Ugueto, G. Insights and Observations into Limited Entry Perforation Dynamics from Fiber-Optic Diagnostics. In Proceedings of the SPE/AAPG/SEG Unconventional Resources Technology Conference, San Antonio, TX, USA, 1–3 August 2016; p. URTEC-2458389-MS. [Google Scholar]
  29. Roberts, G.; Whittaker, J.; McDonald, J.; Paxson, T. Proppant Distribution Observations from 20,000+ Perforation Erosion Measurements. In Proceedings of the SPE Hydraulic Fracturing Technology Conference and Exhibition, The Woodlands, TX, USA, 4–6 February 2020; p. D011S002R002. [Google Scholar]
  30. Crump, J.B.; Conway, M.W. Effects of Perforation-Entry Friction on Bottomhole Treating Analysis. J. Pet. Technol. 1988, 40, 1041–1048. [Google Scholar] [CrossRef]
  31. Roberts, G.; Lilly, T.B.; Tymons, T.R. Improved Well Stimulation through the Application of Downhole Video Analytics. In Proceedings of the SPE Hydraulic Fracturing Technology Conference and Exhibition, The Woodlands, TX, USA, 23–25 January 2018; p. D011S001R005. [Google Scholar]
  32. Cramer, D.; Friehauf, K.; Roberts, G.; Whittaker, J. Integrating Distributed Acoustic Sensing, Treatment-Pressure Analysis, and Video-Based Perforation Imaging to Evaluate Limited-Entry-Treatment Effectiveness. SPE Prod. Oper. 2020, 35, 0730–0755. [Google Scholar] [CrossRef]
  33. Guo, J.; Zhao, X.; Zhu, H.; Zhang, X.; Pan, R. Numerical simulation of interaction of hydraulic fracture and natural fracture based on the cohesive zone finite element method. J. Nat. Gas Sci. Eng. 2015, 25, 180–188. [Google Scholar] [CrossRef]
  34. Zhao, P.; Xie, L.; Ge, Q.; Zhang, Y.; Liu, J.; He, B. Numerical study of the effect of natural fractures on shale hydraulic fracturing based on the continuum approach. J. Pet. Sci. Eng. 2020, 189, 107038. [Google Scholar] [CrossRef]
  35. Dong, Y.; Tian, W.; Li, P.; Zeng, B.; Lu, D. Numerical investigation of complex hydraulic fracture network in naturally fractured reservoirs based on the XFEM. J. Nat. Gas Sci. Eng. 2021, 96, 104272. [Google Scholar] [CrossRef]
  36. Li, Z.-Q.; Li, X.-L.; Yu, J.-B.; Cao, W.-D.; Liu, Z.-F.; Wang, M.; Liu, Z.-F.; Wang, X.-H. Influence of existing natural fractures and beddings on the formation of fracture network during hydraulic fracturing based on the extended finite element method. Geomech. Geophys. Geo-Energy Geo-Resour. 2020, 6, 58. [Google Scholar] [CrossRef]
  37. Bažant, Z.P.; Oh, B.H. Crack band theory for fracture of concrete. Matériaux Et Constr. 1983, 16, 155–177. [Google Scholar] [CrossRef]
  38. Zienkiewicz, O.C.; Shiomi, T. Dynamic behaviour of saturated porous media; The generalized Biot formulation and its numerical solution. Int. J. Numer. Anal. Methods Geomech. 1984, 8, 71–96. [Google Scholar] [CrossRef]
  39. Li, S.; Li, X.; Zhang, D. A fully coupled thermo-hydro-mechanical, three-dimensional model for hydraulic stimulation treatments. J. Nat. Gas Sci. Eng. 2016, 34, 64–84. [Google Scholar] [CrossRef]
  40. Zhou, L.; Hou, M.Z. A new numerical 3D-model for simulation of hydraulic fracturing in consideration of hydro-mechanical coupling effects. Int. J. Rock Mech. Min. Sci. 2013, 60, 370–380. [Google Scholar] [CrossRef]
  41. Roostaei, M.; Taghipoor, S.; Nouri, A.; Fattahpour, V.; Chan, D. Smeared modeling of hydraulic fracture using partially coupled reservoir and geomechanics simulators. Int. J. Rock Mech. Min. Sci. 2019, 113, 99–111. [Google Scholar] [CrossRef]
  42. Chen, X.; Zhao, J.; Li, Y.; Yan, W.; Zhang, X. Numerical Simulation of Simultaneous Hydraulic Fracture Growth within a Rock Layer: Implications for Stimulation of Low-Permeability Reservoirs. J. Geophys. Res.-Solid Earth 2019, 124, 13227–13249. [Google Scholar] [CrossRef]
  43. Lecampion, B.; Desroches, J. Simultaneous initiation and growth of multiple radial hydraulic fractures from a horizontal wellbore. J. Mech. Phys. Solids 2015, 82, 235–258. [Google Scholar] [CrossRef]
  44. Long, G.; Liu, S.; Xu, G.; Wong, S.-W. Modeling of Perforation Erosion for Hydraulic Fracturing Applications. In Proceedings of the SPE Annual Technical Conference and Exhibition, Houston, TX, USA, 28–30 September 2015; p. D021S015R008. [Google Scholar]
  45. Valko, P.P.; Economides, M.J. Hydraulic Fracture Mechanics; Wiley: Chichester, UK, 1995. [Google Scholar]
  46. Xing, P.; Yoshioka, K.; Adachi, J.; El-Fayoumi, A.; Bunger, A.P. Laboratory measurement of tip and global behavior for zero-toughness hydraulic fractures with circular and blade-shaped (PKN) geometry. J. Mech. Phys. Solids 2017, 104, 172–186. [Google Scholar] [CrossRef]
  47. Harris, P.C.; Pippin, P.M. High-Rate Foam Fracturing: Fluid Friction and Perforation Erosion. SPE Prod. Facil. 2000, 15, 27–32. [Google Scholar] [CrossRef]
  48. Shin, D.H.; Sharma, M.M. Factors Controlling the Simultaneous Propagation of Multiple Competing Fractures in a Horizontal Well. In Proceedings of the SPE Hydraulic Fracturing Technology Conference, The Woodlands, TX, USA, 4–6 February 2014; p. SPE-168599-MS. [Google Scholar]
  49. Yang, C.-X.; Yi, L.-P.; Yang, Z.-Z.; Li, X.-G. Numerical investigation of the fracture network morphology in multi-cluster hydraulic fracturing of horizontal wells: A DDM-FVM study. J. Pet. Sci. Eng. 2022, 215, 110723. [Google Scholar] [CrossRef]
Figure 1. Schematic illustration of deformation of a rock element.
Energies 17 00828 g001
Figure 2. Schematic of perforation abrasion.
Energies 17 00828 g002
Figure 3. Comparison of numerical results and KGD model: (a) comparison of fracture width; (b) comparison of fracture length.
Energies 17 00828 g003
Figure 4. (a) Sketch of experiments; (b) comparison between numerical results and experimental results.
Energies 17 00828 g004
Figure 5. Schematic of simulation model.
Energies 17 00828 g005
Figure 6. Fracture propagation under the two cases: (a) erosion; (b) no erosion.
Energies 17 00828 g006
Figure 7. The change in the perforation diameter and discharge coefficient: (a) perforation diameter; (b) discharge coefficient.
Energies 17 00828 g007
Figure 8. The change in perforation friction coefficient.
Energies 17 00828 g008
Figure 9. Fracture propagation under different injection rates (left: erosion; right: no erosion).
Energies 17 00828 g009
Figure 10. The length of each fracture under different injection rates.
Energies 17 00828 g010
Figure 11. The flow distribution between fractures under different injection rates: (a) erosion; (b) no erosion.
Energies 17 00828 g011
Figure 12. The change in perforation diameter and discharge coefficient under different injection rates: (a) perforation diameter; (b) discharge coefficient.
Energies 17 00828 g012
Figure 13. Fracture propagation under different perforation diameters (left: erosion; right: no erosion).
Energies 17 00828 g013
Figure 14. The flow distribution between fractures under different perforation diameters: (a) erosion; (b) no erosion.
Energies 17 00828 g014
Figure 15. The length of each fracture under different perforation diameters.
Energies 17 00828 g015
Figure 16. The change in perforation diameter and discharge coefficient under different perforation diameters: (a) perforation diameter; (b) discharge coefficient.
Energies 17 00828 g016
Figure 17. Fracture propagation under different perforation numbers (left: erosion; right: no erosion).
Energies 17 00828 g017aEnergies 17 00828 g017b
Figure 18. The flow distribution between fractures under different perforation numbers: (a) erosion; (b) no erosion.
Energies 17 00828 g018
Figure 19. The length of each fracture under different perforation numbers.
Energies 17 00828 g019
Figure 20. The change in perforation diameter and discharge coefficient under different perforation numbers: (a) perforation diameter; (b) discharge coefficient.
Energies 17 00828 g020
Figure 21. Fracture propagation with different cluster spacings (left: erosion; right: no erosion).
Energies 17 00828 g021aEnergies 17 00828 g021b
Figure 22. The length of each fracture under different cluster spacings.
Energies 17 00828 g022
Figure 23. The change in perforation diameter and discharge coefficient under different cluster spacings: (a) perforation diameter; (b) discharge coefficient.
Energies 17 00828 g023
Figure 24. The flow distribution between fractures with different cluster spacings: (a) erosion; (b) no erosion.
Energies 17 00828 g024
Table 1. Basic parameters for the model validation.
ParameterValue
Young’s modulus20 GPa
Poisson’s ratio0.2
Tensile strength6 MPa
Injection rate 0.001   m 3 / s
Viscosity70 cP
Pay thickness1 m
Minimum horizontal stress7 MPa
Table 2. Basic parameters for the model validation.
ParameterValue
Young’s modulus0.1 GPa
Poisson’s ratio0.48
Injection rate8 mL/min
Viscosity300 cP
Minimum horizontal stress0.31 MPa
Table 3. Basic parameters for the simulation.
ParameterValue
Young’s modulus15 GPa
Poisson’s ratio0.2
Density2400   k g / m 3
Tensile strength6 MPa
Biot coefficient0.7
Injection rate 0.1   m 3 / s
Viscosity1 cP
Maximum horizontal stress71 MPa
Minimum horizontal stress63 MPa
Perforation diameter10 mm
Perforation number12
Cluster spacing25 m
Initial discharge coefficient0.6
Maximum discharge coefficient0.9
Sand concentration720   k g / m 3
Disclaimer/Publisher’s Note: The statements, opinions and data contained in all publications are solely those of the individual author(s) and contributor(s) and not of MDPI and/or the editor(s). MDPI and/or the editor(s) disclaim responsibility for any injury to people or property resulting from any ideas, methods, instructions or products referred to in the content.

