Article

Study of the Thermal and Hydraulic Performance of Porous Block versus Gyroid Structure: Experimental and Numerical Approaches

1
Department of Mechanical and Industrial Engineering, Faculty of Engineering and Architecture Science, Toronto Metropolitan University, Toronto, ON M5B 2K3, Canada
2
New York University in Abu Dhabi, Abu Dhabi M5B 2K3, United Arab Emirates
*
Author to whom correspondence should be addressed.
Energies 2024, 17(4), 861; https://doi.org/10.3390/en17040861
Submission received: 26 December 2023 / Revised: 8 February 2024 / Accepted: 8 February 2024 / Published: 12 February 2024
(This article belongs to the Section J: Thermal Management)

Abstract

:
Various researchers in the field of engineering have used porous media for many years. The present paper studies heat enhancement using two different types of porous media. In the first type, porous metal foam media was used experimentally and numerically for heat extraction. The porous medium was replaced with a porous structure using the Gyroid model and the triply periodic minimum surfaces technique in the second type. The Darcy–Brinkman model combined with the energy equation was used for the first type, whereas Navier–Stokes equations with the energy equation were implemented for the second type. The uniqueness of this approach was that it treated the Gyroid as a solid structure in the model. The two types were tested for different heat fluxes and different flow rates. A comparison between the experimental measurements and the numerical solution provided a good agreement. By comparing the performance of the two types of structure, the Gyroid structure outperformed the metal foam for heat extraction and uniformity of the temperature distribution. Despite an 18% increase in the pressure drop in the presence of the Gyroid structure, the performance evaluation criteria for the Gyroid are more significant when compared to metal foam.

1. Introduction

Porous media has been used in engineering applications for many years. The advantage of such material is its lightweight and efficient cooling process. Metal foam is one class of porous material and is produced by industry. Thus, the user is limited by the available porosity, permeability, and design. Designing a new class of material using triply periodic minimal surfaces has been available for a long time. This mathematical formulation is currently used to create different structures suitable for the thermo-fluids discipline, material discipline, and biomedical field.
Triply periodic minimal surfaces (TPMSs) are mathematical surfaces that have received substantial interest in several disciplines, including the study of materials and different engineering fields. The recurring nature and small surface area of TPMS makes them unique structures with intriguing geometrical characteristics. A continuous network of curves that produce an endlessly repeating pattern throughout space are what make TPMS unique. In addition, TPMS is a type of periodic implicit surface which contains a zero-mean curvature; it has proven to be an effective tool for porous structures. There are different kinds of TPMS; the most common is the Gyroid structure. These surfaces are attractive in various domains because of their distinctive geometric features, which include steady mean curvature and zero Gaussian curvature. These 3D surfaces replicate themselves without intersecting or overlapping, dividing space into identical units.
A very significant and essential use of TPMS is in the thermo-fluids discipline. Furthermore, thermal control is another possible use for TPMS structures. Their complex network of linked pores enables effective heat transmission and fluid transport. Such arrangements may increase heat transfer and thermal efficiency in heat exchangers, thermal energy storage systems, and fluid devices. TPMS structures have been investigated for their construction of scaffolds in tissue engineering because of their unique features. These scaffolds are designed to imitate the natural extracellular matrix and to create an environment conducive to cell development and tissue regeneration. The high porosity-linked pore networks and mechanical robustness of TPMS-based scaffolds allow them to be perfect and practical for cell attachment, nutrition delivery, and waste elimination.
Bayomy [1] investigated the use of metal foam in heat sink applications. He conducted experimental work and numerical modelling and demonstrated the usefulness of using such structure in the thermo-fluid discipline. In this application, a metallic channel filled with porous material was one of the applications for cooling the small, heated surfaces. However, the limitation is the material type, porosity, and permeability as it is available. Al Ketan et al. [2] used 3D printing and constructed this Gyroid structure using TPMS, metals such as aluminum and silver, and other materials like copper. The advantage of 3D printing is that one can design the structure to their need and application and then print it. Recently, Saghir et al. [3] conducted a preliminary experiment using the Gyroid model and developed a numerical model using COMSOL software version 6 [4]. Their analysis demonstrated that this newly printed structure, modelled as a structure in the system, can provide better heat enhancement and that more investigation is needed.
Selo et al. [5] measured the thermal properties of the AlSi10Mg material used to manufacture the TPMS used in the current modelling. Later, Piedra et al. [6] investigated the fluid behaviour in TPMS structures.
Chen et al. [7] presented other cellular materials that depend on microstructures. Self-repeated representative volume elements construct these cellular materials. With 3D printing becoming cheaper, printing these cellular materials for thermo-fluid applications is vital to replace the traditional foam metal structure. The reason for replacing traditional foam metal structures, is that TPMS gives the engineer flexibility in designing their system to meet their need. The user controls the porosity, and there is no need to determine the permeability. The reason permeability does not requiring determining from the user, is that in the numerical modelling aspect, this structure is treated like a solid, and the Navier–Stokes equation is used. There is no need for the Darcy model, Darcy–Forchheimer, or Darcy–Brinkman formulation. Al-Ketan and Abu Al-Rub [2] developed software for generating uniform and graded lattices based on TPMS. The MsLattice software version pro can generate different types of lattices for engineering applications.
Catchpole-Smith et al. [8] examined the thermal conductivity of lattice structures built utilising laser powder bed fusion in additive manufacturing, based on triply periodic minimum surfaces. The main objective of the research is to comprehend how the density and lattice geometry affect the thermal conductivity of TPMS structures. The investigation uses numerical models and experimental measurements to assess thermal qualities. Using the obtained data, they proposed a set of design guidelines that control the link between thermal conductivity and the lattice parameters of volume fraction, unit cell type, and unit cell size. Employing 1D and 2D mathematical functions, various demonstration models with a required variance in conductivity might be produced using these design criteria. They summarized the primary outcomes of the study as follows: Firstly, the thermal conductivity for the examined lattice structures was principally determined by the volume fraction, or the proportion of solid material to free space, inside the lattice. Secondly, thermal conductivity was found to have an inverse relationship to the surface area to volume ratio, indicating that unit cell types with a greater minimum wall thickness have an improved thermal conductivity over those with a smaller minimum wall thickness at an identical volume fraction.
Attarzadeh et al. [9] study aims to determine thermal efficacy, heat transfer coefficient, and pressure drop inside the channel depending on the TPMS structure. It develops a computational design and analysis of heat and mass transfer within a heat exchanger. The combined impact of heat and mass transfer was visualized and explained along with the complicated flow shapes, such as eccentric flow and helical motions. An alternative automated workflow based on the MOGA (multi-objective genetic algorithm optimisation) was suggested for the multi-objective optimisation procedure. The best options for creating an efficient low-temperature waste heat recovery system were found using the elitism idea, which was applied to the numerical model as the assessment model for the optimisation procedure. Minimising the number of sampling points and effectively creating a response surface with 273 design points were accomplished by employing the central composite design of the experiment. The authors had several outcomes and findings; between the heat source and the fluid in a TPMS-filled channel, the pressure drop penalty was insignificant compared to the quantity of heat transported through TPMS.
Different types of porous architectures can be used for heat exchangers; triply periodic minimal surfaces have generated interest among the various types. TPMS are suitable porous media for developing volumetric solar energy receivers; such a design requires assessing their heat transfer capabilities in the mixed conductive/radiative mode. Vignoles et al. [10] proposed a theoretical assessment of the TPMS’s conduct-radiative effective heat conductivity for the first time considering opaque/transparent media. The goal of the study, as suggested by the authors, was to establish a relationship between the thermal behaviour of these families of porous media and their geometrical characteristics, as well as to systematically estimate how thermal conductivity would change with temperature for every structure of the TPMS family. The authors experimented with a hybrid random walk numerical technique while considering opaque/transparent media. Vignoles et al. [10] highlighted that the results matched the earlier findings on open-cell foams, such as Kelvin cell structures. The authors summarized the results: Firstly, the Rosseland approximation applies for small temperature gradients, and the total of conductive and radiative contributions defines the effective thermal conductivity. Secondly, both the conductive contribution and the relative density are proportional. Thirdly, at low temperatures, the radiative contribution varies affinely with the surface emissivity, and it shares a directly proportional relation with the radiation/conduction ratio. Fourthly, a transition from a low-temperature environment to a high-temperature environment occurs, during which the emissivity-dependent portion of the radiative contribution vanishes. Lastly, contrary to open-cell lattices, where it scales as the solid/void ratio itself, the crucial ratio for this transition corresponds to approximately twice that ratio. This final characteristic was most likely due to using walls rather than struts or beams in TPMS structures.
For different engineering and industrial applications, it is essential to understand the thermal transport mechanism in porous media. It is known that the structure of porous structures and the effective heat conductivity of porous media are linked. However, current effective medium strategies frequently fail to consider the impacts of the structure. Lately, machine learning methods have been successful in estimating effective thermal conductivity. However, the physical insights are also limited by the lack of adjectives. In the paper by Wei et al. [11], they experimented with the structural characteristics that significantly affect heat transfer in porous media. Overall, five physics-based descriptors are identified to describe the structural elements: shape factor, bottleneck, channel factor, perpendicular nonuniformity, and dominant pathways. The authors describe the method used, which entails creating a large set of thermal conductivity values from simulations and experimental measurements. Using this dataset, they train and test machine learning models using various strategies, such as random forests or support vector machines. From the experimental results, the authors stated that the results of this study show that using machine learning approaches in conjunction with physics-based descriptors improves estimates of thermal conductivity in porous mediums.
As explored before, TPMS are geometrically unique mathematical surfaces that can be utilized to build porous structures with specific properties. Porous media are often employed in technological (e.g., heat sinks for electrical devices and transpiration cooling) and biological (e.g., bone tissue) applications. For performance optimisation, a shift from passive selection to actively designing the topology of the porous medium is required. Cheng et al. [12] examine how these unique porous materials perform regarding strength and heat transport. Furthermore, the relationships between the feature parameters in the TPMS equations in terms of porosity (uniform and smoothly graded), pore density, and equivalent pore diameter were found, presenting a simple method for changing the topology of TPMS porous structures. They performed heat transfer experiments to determine the materials’ thermal conductivity and convective heat transfer coefficients.
Daish et al. [13] presented an efficient and accurate method for calculating the permeability of periodic porous materials in the field of numerical approaches in engineering. Porous structure refers to materials containing pores. In the article “Numerical calculation of permeability of periodic porous materials: Application to periodic arrays of spheres and 3D scaffold microstructures” by Daish et al. [13], the authors focus on a numerical method of anisotropic permeability in porous materials using a periodic microstructure. The authors discuss in the paper how this approach uses pore-scale fluid dynamic simulations with a static volume of a fluid system.
In their paper, Tang et al. [14] examined the performance of triply periodic minimal surface structures, notably the Diamond, Gyroid, and Iwp structures, and examined the convective heat transmission mechanism. TPMS structures can provide improved heat dissipation solutions for high-heat-releasing devices, although more research is required to understand their convective heat transfer characteristics. The authors of this paper investigated and compared the convective heat transfer performance of different TPMS structures compared to the fins structure. A test was also conducted to verify the precision of the numerical simulation. The study had several outcomes; firstly, when the inlet flow ranged from 0.288 to 2.016 m3/h, the convective performance among the Diamond, Gyroid, and Iwp TPMS models showed the highest, while Iwp showed the lowest. These models exceeded the convective heat transfer coefficients of the fins model by an average of 85–207%, 55–137%, and 16–55%, respectively; they also showed higher flow resistance. Secondly, the Gyroid and Iwp (I-graph and wrapped package graph) TPMS versions differ from Diamond in that they have “through-holes” in the plan views, which results in significantly different flow patterns that affect convective heat transfer. The investigation showed that the flow pattern inside TPMS structures without “through-holes” favours convective heat transfer. Thirdly, the Diamond model displays an average convective heat transfer coefficient of 19.5–37.2% higher than the Gyroid model. The former model has a heat transfer area that is only 22% larger than the latter. This difference can be attributed to the diamond model’s improved flow pattern and the additional improvement brought on by the larger heat exchange area. The authors concluded the paper by stating that further research is to be conducted with a higher Re, more precisely, to evaluate the convective heat transfer characteristics of more significant numbers of TPMSs and derive the convective heat transfer experimental correlations of various TPMSs.
Porous structures are vital components of many thermal management and energy conversion systems due to the critical role that their morphology plays in controlling fluid flow, heat/mass movement, and strength performance. Because of the limited fabrication methods, one cannot directly customize porous materials with well-controlled pore characteristics and functionally graded pore morphology. For the sake of the research, the authors tested the morphology of porous media. They enabled their creation through additive manufacturing, permitting the management of pore properties, a technique created based on TPMS. Using a mathematical-based I-graph and a wrapped package-graph surface (Iwp), primitive surface, Diamond surface, and Gyroid surface, a porous structure was constructed. Cheng et al. [15] conducted a morphological examination before running flow and heat transfer simulations to investigate the relationships between the geometrical parameters and the functionality of the porous structure, including flow resistance, heat transfer, and strength.
Recently, much attention has been given to the design of heat exchanges. Niknam et al. [16] reviewed the application of TPMS in heat exchangers. The advantage of using TPMS in such applications is its efficient heat extraction [17,18] and light weight [19,20,21].
Based on the literature review, the lack of experimental work using TPMS is apparent. Conducting experimental measurements is very important to test the accuracy of the model.
In the present paper, an attempt is made to investigate the performance of metal foam and Gyroid structure experimentally and numerically. Then, the performance of the two structure types will be compared under the same physical and initial conditions. Section 2 presents the experimental part. Section 3 will focus on the numerical approach, and Section 4 will show the results and the discussion. Conclusions are in Section 5.

2. Experimental Measurements

This paper studies a porous block’s thermal and hydraulic performance and a Gyroid porous structure as a heat sink. The porous structure manufactured in industry has a porosity of 0.91 and a permeability of 10 PPI. The Gyroid structure has a porosity of 0.7, 0.8, and 0.9, respectively, designed by the authors using the Gyroid structure [2] and printed using advanced manufacturing. Experiments conducted using these two structures allowed us to measure the temperature distribution and the heat enhancement performance for different applied heat flux and flow rates. Water was used as the circulating fluid. The results obtained experimentally were compared to the numerical model using COMSOL software [4], leading to an excellent calibration of the model. Measurements taken experimentally were repeated three times for accuracy. Data are collected only when a steady state regime has been reached. Both structures are made of Aluminum. However, the 3D-printed structure has additional components in the mixture, such as Silicate and Magnesium. The physical properties of the fluid and the metal can be found in reference [1]. The permeabilities of the Gyroid structure were determined numerically. Then, a comprehensive study on the best performance between the Gyroid structure and the porous metal block is presented.

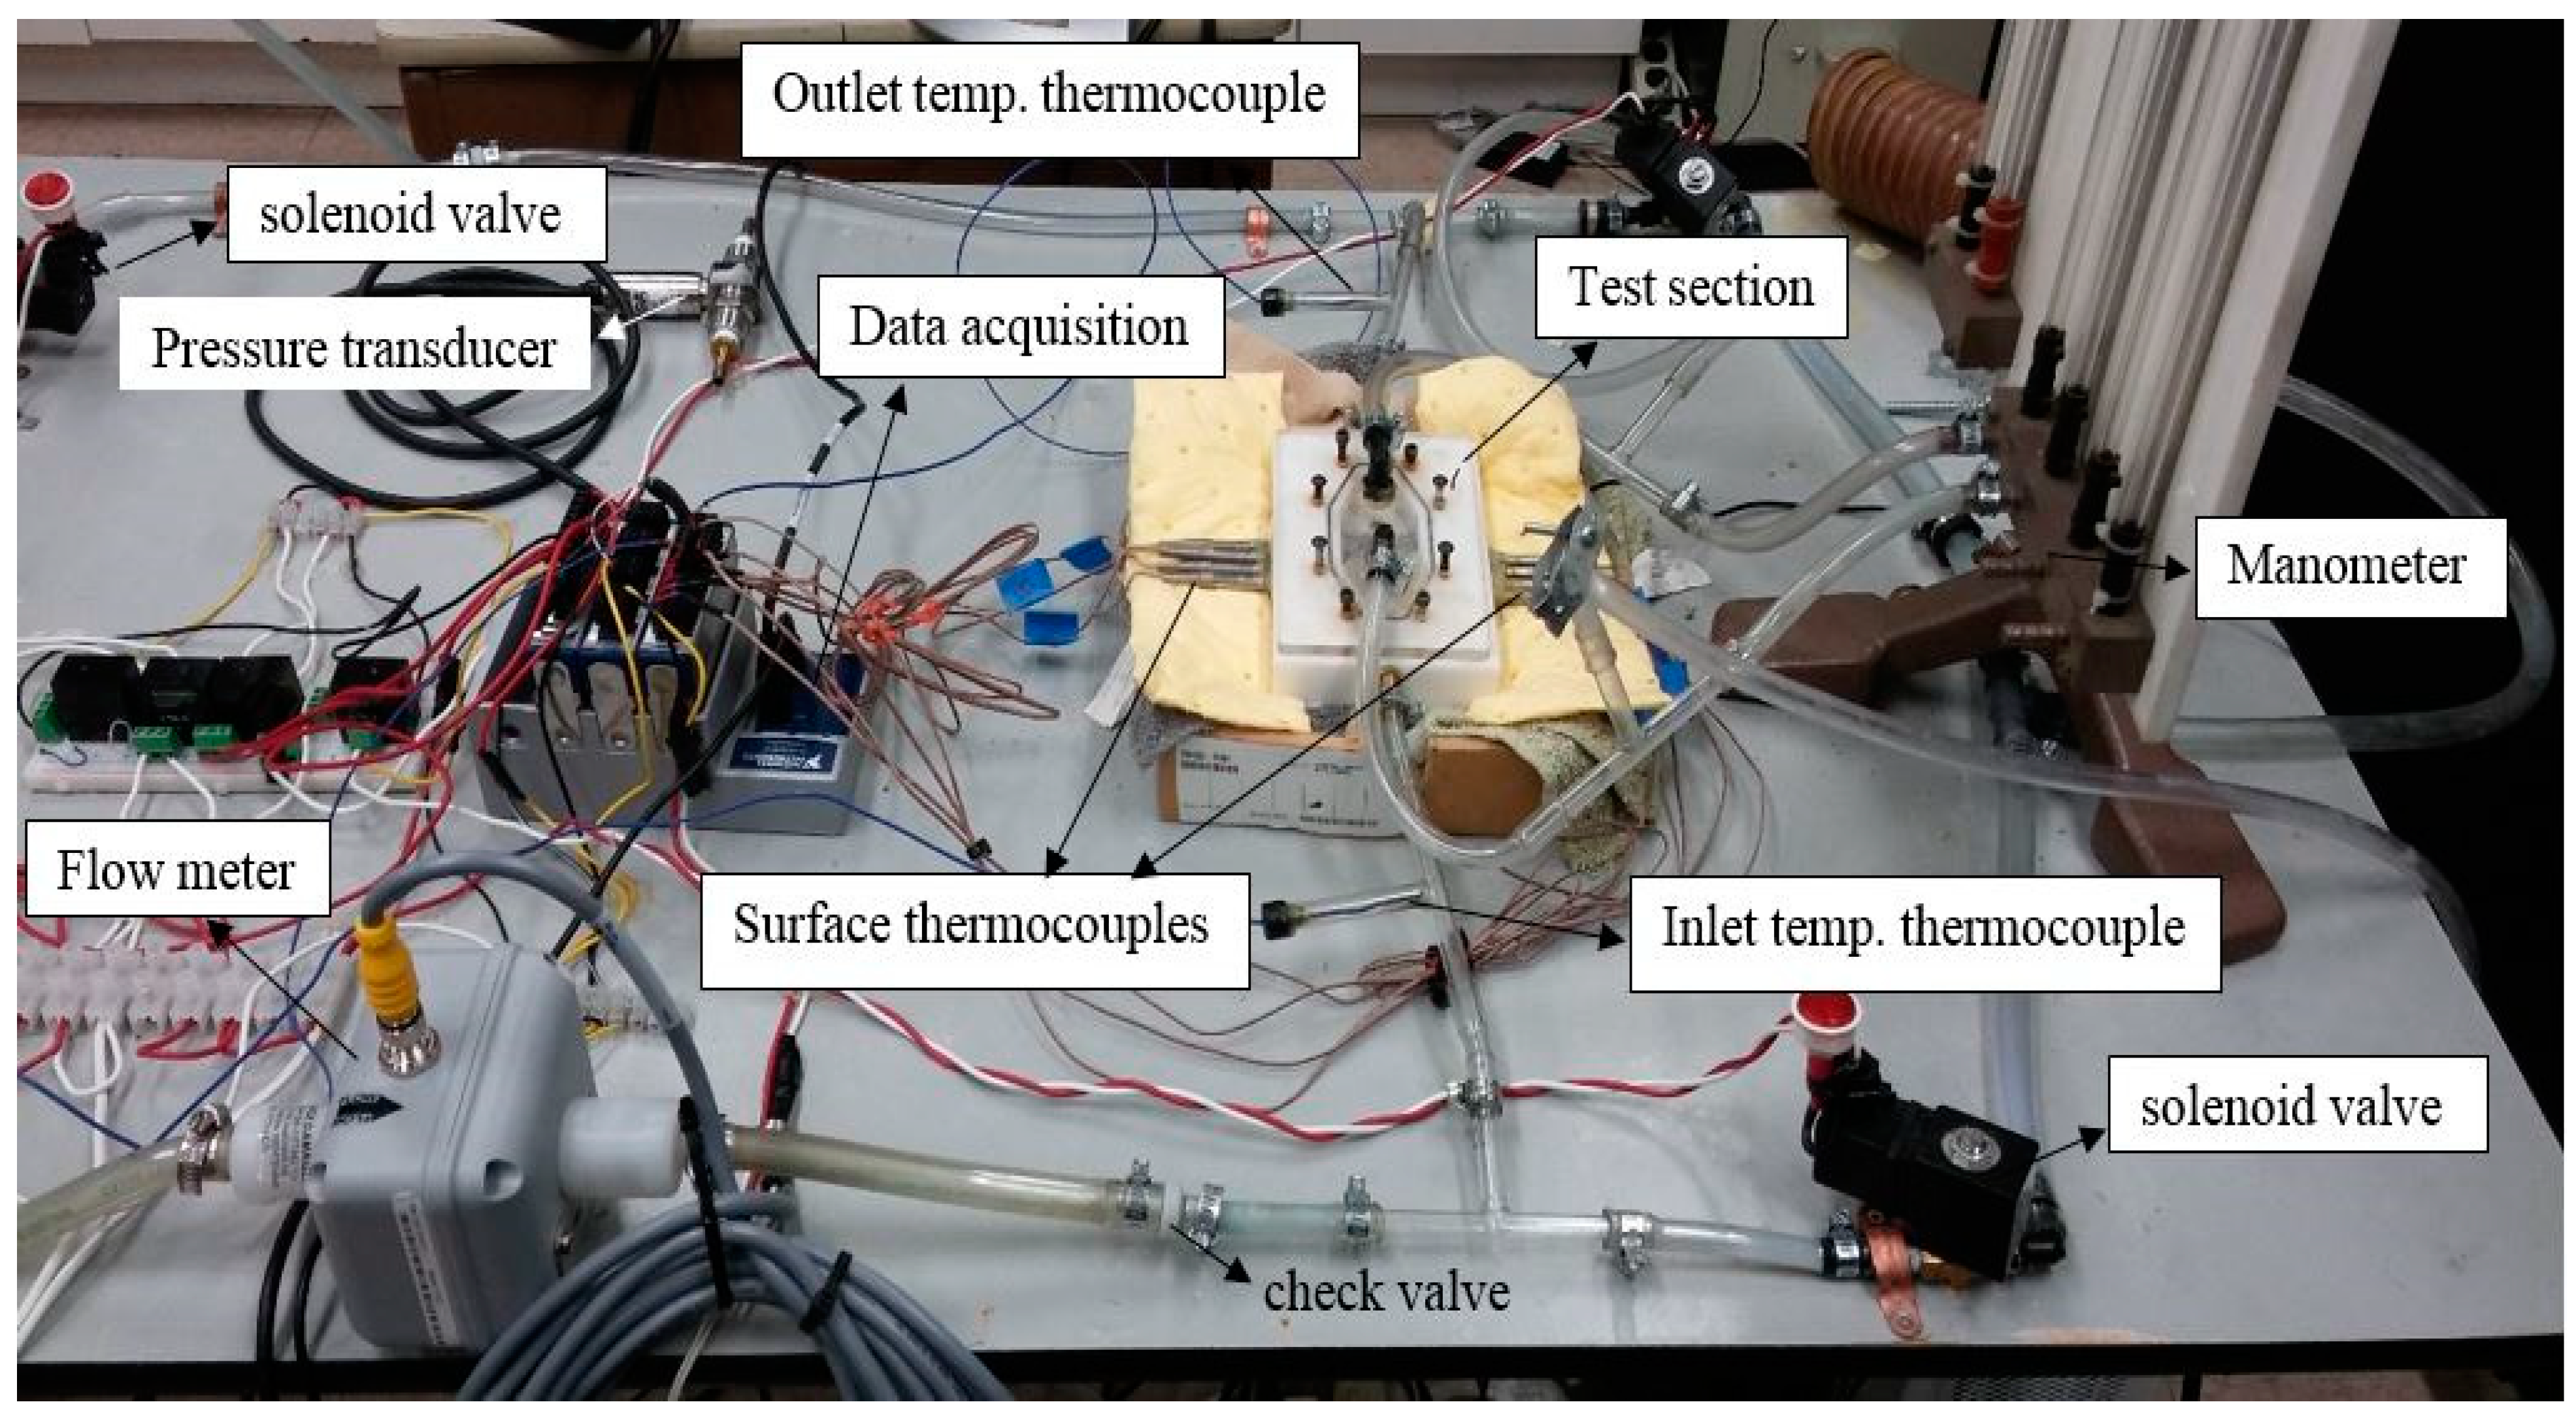
2.1. General Description of the Experiment

Figure 1 presents the experimental setup and the test section. A pump is used to conduct a forced flow through the test section. A voltmeter and ammeter measure the heating block’s inward heat flux, power, and other measures [1]. In the present study, the heat flux applied at the bottom of the test section varies between 3.0 W/cm2 and 6.0 W/cm2. A total of seven thermocouples inserted 1 mm below the test section in the heated block are used to measure the temperature distribution in the block. In total, two additional thermocouples measure the temperature at the inlet and outlet flow. For more information on the experimental setup, the reader is referred to reference [1]. The test section has the dimensions of an Intel Core i7 computer processor. The base is square 37.5 mm long, and the height is 12.7 mm. Thus, in our setup, whether numerically or experimentally, the porous block and the Gyroid structure are the same size as the test section.
Figure 2 presents the test section in detail. The flow enters from the inlet, mixes in the mixing chamber and then converges to the test section to exit from the opposite side.
Figure 2a–c show that the Gyroid structure was designed using software developed by Al-Ketan et al. [2], printed in Al-Ketan’s laboratory, and used in the experiment. Figure 2d–f presents the identical model in STL format in the numerical model. Thus, an accurate comparison is obtained. These structures were designed for 0.7, 0.8, and 0.9 porosity, having a surface area of 8.4 × 103 cm2, 4.9 × 103 cm2, and 4.0 × 103 cm2, respectively. Figure 2a–c show that the Gyroid was installed in the test section. Different sets of flow rates ranging from 3.74 cm3/s to 19.85 cm3/s were used. Figure 3 presents the porous structure of the metal foam, which has a porosity of 0.91 and a permeability of 10 PPI, inside the test section. For the numerical modelling of the metal foam, the Darcy–Brinkman model is used with identical porosity and permeability of the experimental metal foam. For the metal foam, the flow rates used in the analysis varied from 6.31 cm3/s to 13.88 cm3/s. For this case, three different heat fluxes were applied, which consist of 8.3 W/cm2, 10.3 W/cm2 and 12.96 W/cm2, respectively. The dimension of the porous structure is identical to the Gyroid to fit the test section. Thermo-paste is applied at the bottom of the structure to have good contact with the heated block. More information about the experimental setup can be found in reference [1].

2.2. Uncertainty Analysis of the Measurement

Uncertainty analysis has been conducted for the apparatus. The source of error could come from the temperature measurement, the flow rate measurement, or the heat flux measurement. Calibration has been conducted, and the flow meter measurement is 0.44%, the thermocouples are 0.75%, and there is a similar error for the heat flux measurement. The latter one is due to some voltage and amp fluctuation. For example, the uncertainty for the Nusselt number is obtained using the following formulation.
δ Nu = Nu x x · δ x 2 + + Nu x y · δ y 2 + + Nu x z · δ z 2
The maximum value of the uncertainty for the local Nusselt number is found to be around 4.6%. For further details, reference [1] could be consulted.

3. Numerical Modelling

Numerical modelling is becoming an efficient tool to predict the heat enhancement and the hydraulic effect in a system. In the present paper, COMSOL software has proven to be an effective finite element tool for engineering. However, it is necessary to calibrate your model by comparing the numerical data with the available experimental measurements. In this context, two significant cases will be investigated numerically and compared with the experimental data measured in the lab. In the first case, the numerical modelling will solve the Darcy–Brinkman model combined with the energy equation for the porous flow and the Navier–Stokes equations for the non-porous domain. The Navier–Stokes and energy equations will be solved in the second case because the Gyroid’s solid structure has a void channel. Different solution techniques will be used since the flow is more complex in the presence of a Gyroid structure. However, by maintaining a low-flow rate, the flow remains in the laminar regime. Since water is the cooling liquid, the flow is Newtonian, and a steady-state condition is adopted.

3.1. Flow Formulation in Porous Media

In the current case, the Darcy–Brinkman model is adopted since the porous block has a porosity of 0.91 and a permeability of 10 PPI, which translates to a permeability κ   = 9 .54788 × 10−7 m2. The problem is three-dimensional. Thus, the formulation for the flow in the presence of porous media is as follows.

3.1.1. Darcy–Brinkman in the x Direction

1 κ u = p x + μ f 2 u x 2 + 2 u y 2 + 2 u z 2
In the formulation shown in Equation (2), the velocity in the x direction is u and expressed in m/s; the permeability is κ having a unit of m2 and x, y, and z are the coordinates in m. The pressure is denoted by p and expressed in N/m2, and the fluid’s dynamic viscosity μ f is expressed in kg/m.s.

3.1.2. Darcy–Brinkman in the y Direction

1 κ v = p y + μ f 2 v x 2 + 2 v y 2 + 2 v z 2
Here, v is the velocity in the y direction.

3.1.3. Darcy–Brinkman in the z Direction

1 κ w = p z + μ f 2 w x 2 + 2 w y 2 + 2 w z 2 + ρ f g T To
The velocity in the z direction is w and expressed in m/s, g is the gravitational acceleration expressed in m/s2, and the temperature is T in degrees Celsius. The flow density is ρ f expressed in kg/m3, and To is the reference temperature.

3.1.4. The Energy Equation

ρ f Cp u T x + v T y + w T z = k eff 2 T x 2 + 2 T y 2 + 2 T z 2
Here, the fluid’s specific heat is Cp, expressed in J/kg.K, and the effective conductivity is k eff , expressed in W/m.K. The expression for the effective conductivity is as follows:
k eff =   φ k s + 1 φ k f
In Equation (6), the conductivity of the metal foam structure is ks, and the conductivity of the fluid is kf. The porosity in the metal foam is known as φ .
There has been a lot of discussion about which model is best to use for effective conductivity. According to Bayomy [1], the manufacturer measures the effective conductivity used experimentally. More details about these equations are found in reference [1]. Finally, the steady-state heat conduction equation represented by Equation (7) is solved numerically for the solid-heated block. This equation is as follows:
k s 2 T x 2 + 2 T y 2 + 2 T z 2 = 0

3.2. Flow Formulation for Gyroid Structure

Gyroid is a unique structure with a porous structure made of Aluminum. This structure is designed for different porosities. The current analysis sets the porosity to 0.7, 0.8, and 0.9, respectively. In the current model, this structure is solid, with a certain void to let the fluid flow through it. For that case, the following formulations are used.

3.2.1. Navier–Stokes Formulation in the x Direction

ρ f u u x + v u y + w u z   = p x +   μ f 2 u x 2 + 2 u y 2 + 2 u z 2  

3.2.2. Navier–Stokes Formulation in the y Direction

ρ f u v x + v v y + w v z   = p y +   μ f 2 v x 2 + 2 v y 2 + 2 v z 2  

3.2.3. Navier–Stokes Formulation in the z Direction

ρ f u w x + v w y + w w z   = p z +   μ f 2 w x 2 + 2 w y 2 + 2 w z 2     ρ f g T To

3.2.4. Energy Formulation

ρ f Cp u T x + v T y + w T z   =   k f 2 T x 2 + 2 T y 2 + 2 T z 2  
Equations (8)–(11) are solved for the Gyroid model case, and for the porous block combined with the Darcy–Brinkman formulation, Equations (2)–(6) were used. For the solid part of the model, which consists of the Gyroid structure itself and the heated block, the steady-state heat transfer in Equation (7) is solved.

3.3. Boundary Conditions of the System

In this context, all physical properties of the fluid are assumed to be constant. It has been known that water’s physical properties may vary with temperature. This variation is minimal; therefore, all physical properties of the water are assumed to be constant.
In addition, the Dirichlet boundary condition is applied for the flow, and for the heat transfer, Newman boundary conditions are applied. Figure 4 displays the boundary condition of the porous block and the Gyroid structure. As shown, identical types of boundary conditions are used. In particular:
(i)
The velocity u = uin in the x direction is applied at the inlet;
(ii)
At the inlet, the temperature of the fluid enters the test section at T = Tin;
(iii)
At the outlet, an open boundary is applied where the stresses are equal to zero;
(iv)
The bottom surface of the Aluminum block is heated with a heat flux q″ shown in red;
(v)
All external surfaces are assumed adiabatic, T Surface n = 0 , and for the flow, no-slip boundary conditions are applied.

3.4. Non-Dimensional Parameters

Different non-dimensional parameters will be used to assess the performance of the porous block and the Gyroid porous structure. Amongst them is the friction factor, which evaluates the system’s hydraulic performance. A pressure drop between the inlet and outlet flow is the main contributor, besides the flow rate. Thus, the friction factor is defined as:
f = 0.5 pD ρ Lu in 2
The definition of variables can be found in the nomenclature section. Amongst them the pressure drop Δp is the difference between the inlet pressure and the outlet pressure. An additional non-dimensional parameter is the combination of the hydraulic contribution with the thermal contribution and is defined as:
PEC = local   Nu f 1 3
Both parameters will be used in addition to the Nusselt and Reynolds numbers to determine the best performance system.

3.5. Solution Technique and Convergence Criteria

As stated earlier, COMSOL Multiphysics software will be used to predict the temperature distribution and the heat enhancement in the system. The finite element method is used, combined with the segregated method. As mentioned in reference [3], when the residue of all variables, such as the pressure, temperature, and the three velocities, is less than 10−6, the solution is said to converge. More detailed information about the convergence can be easily found in the COMSOL manual [4].

4. Results and Discussion

This manuscript aimed to determine the best porous material structure for cooling small-area surfaces like I7 processors. Overall, two structures were investigated: a commercial metal foam with a porosity of 0.91 and a permeability of 10 PPI and a designed Gyroid structure using triply periodic minimal surfaces (TPMS). The porosity of the TPMS is designed to be 0.7, 0.8, and 0.9, respectively. As indicated earlier, a Darcy–Brinkman model was used for the metal foam, and the results were compared with the experimental measurements. For the TPMS structure, the model solves the traditional Navier–Stokes formulation with the energy equation. The TPMS structure includes the model as a solid porous medium, allowing the fluid to circulate between complex voids. The numerical results were also compared to the experimental data measured in our laboratory. A comparison between experimental data and numerical models for the two structures sheds light on some critical findings. Later, the permeability of the Gyroid was estimated, and COMSOL software was used to compare the performance of a porous block versus a Gyroid structure for identical conditions to determine the best structure for heat enhancement.

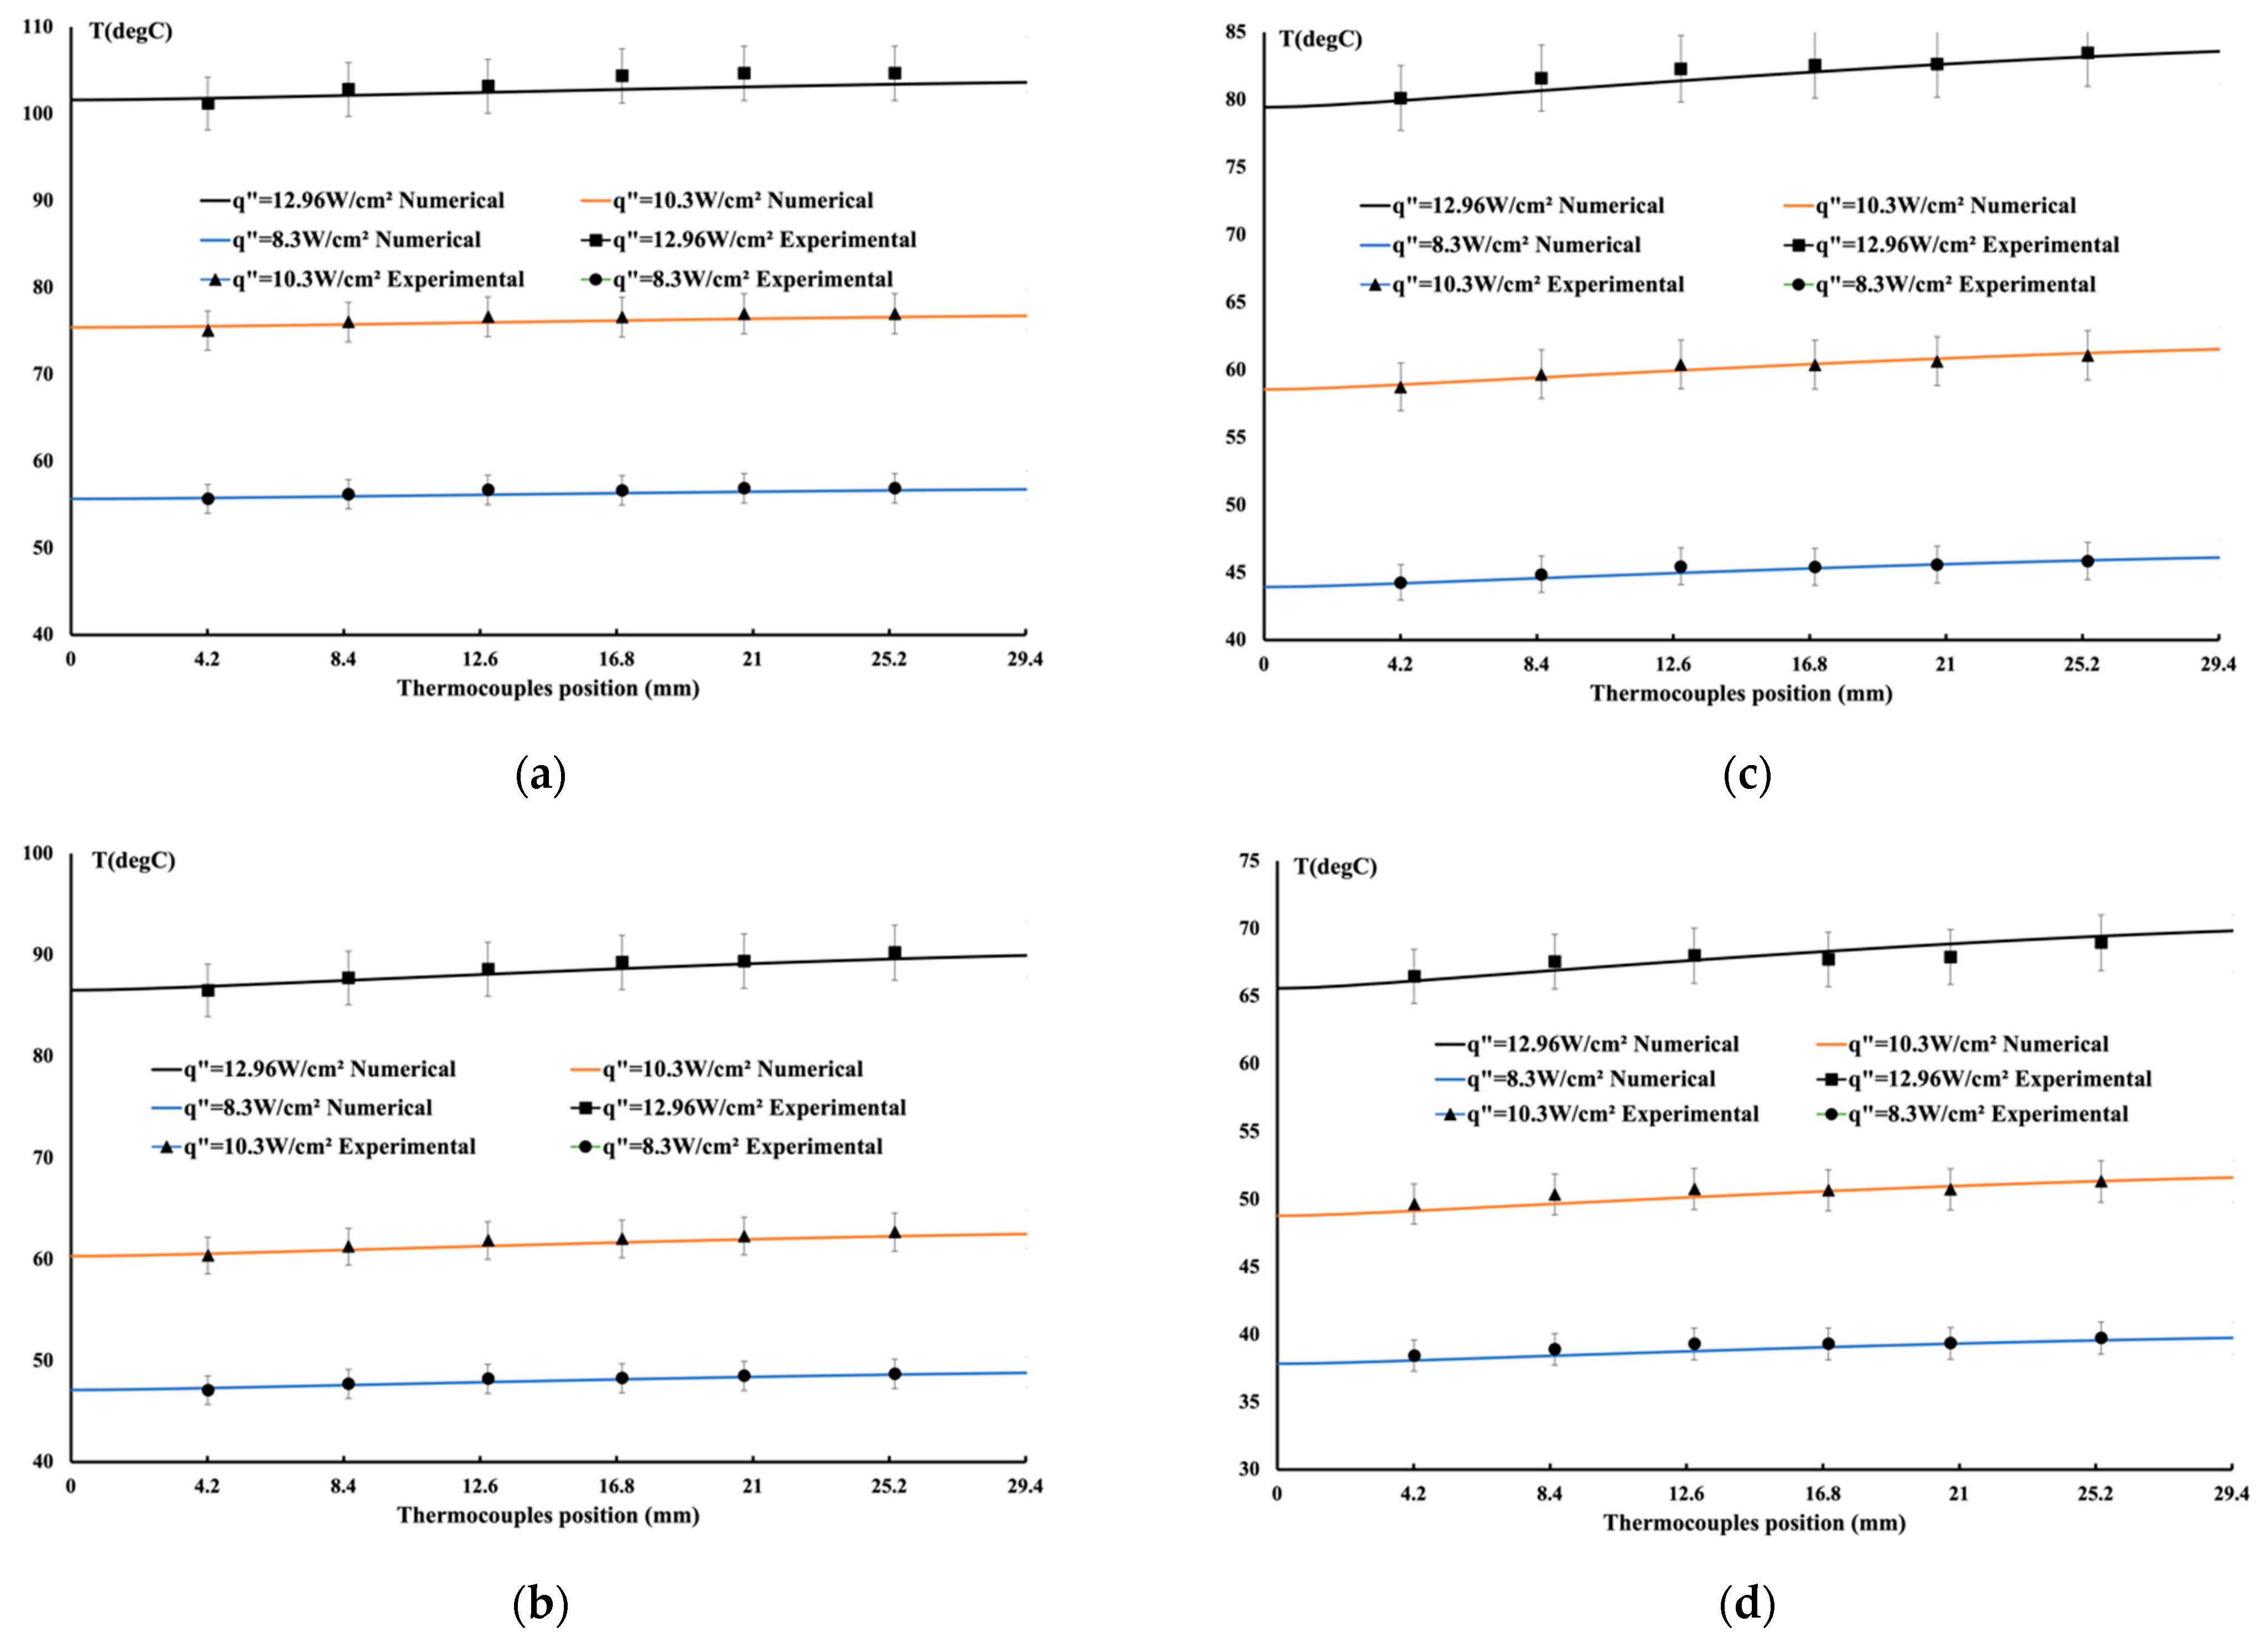
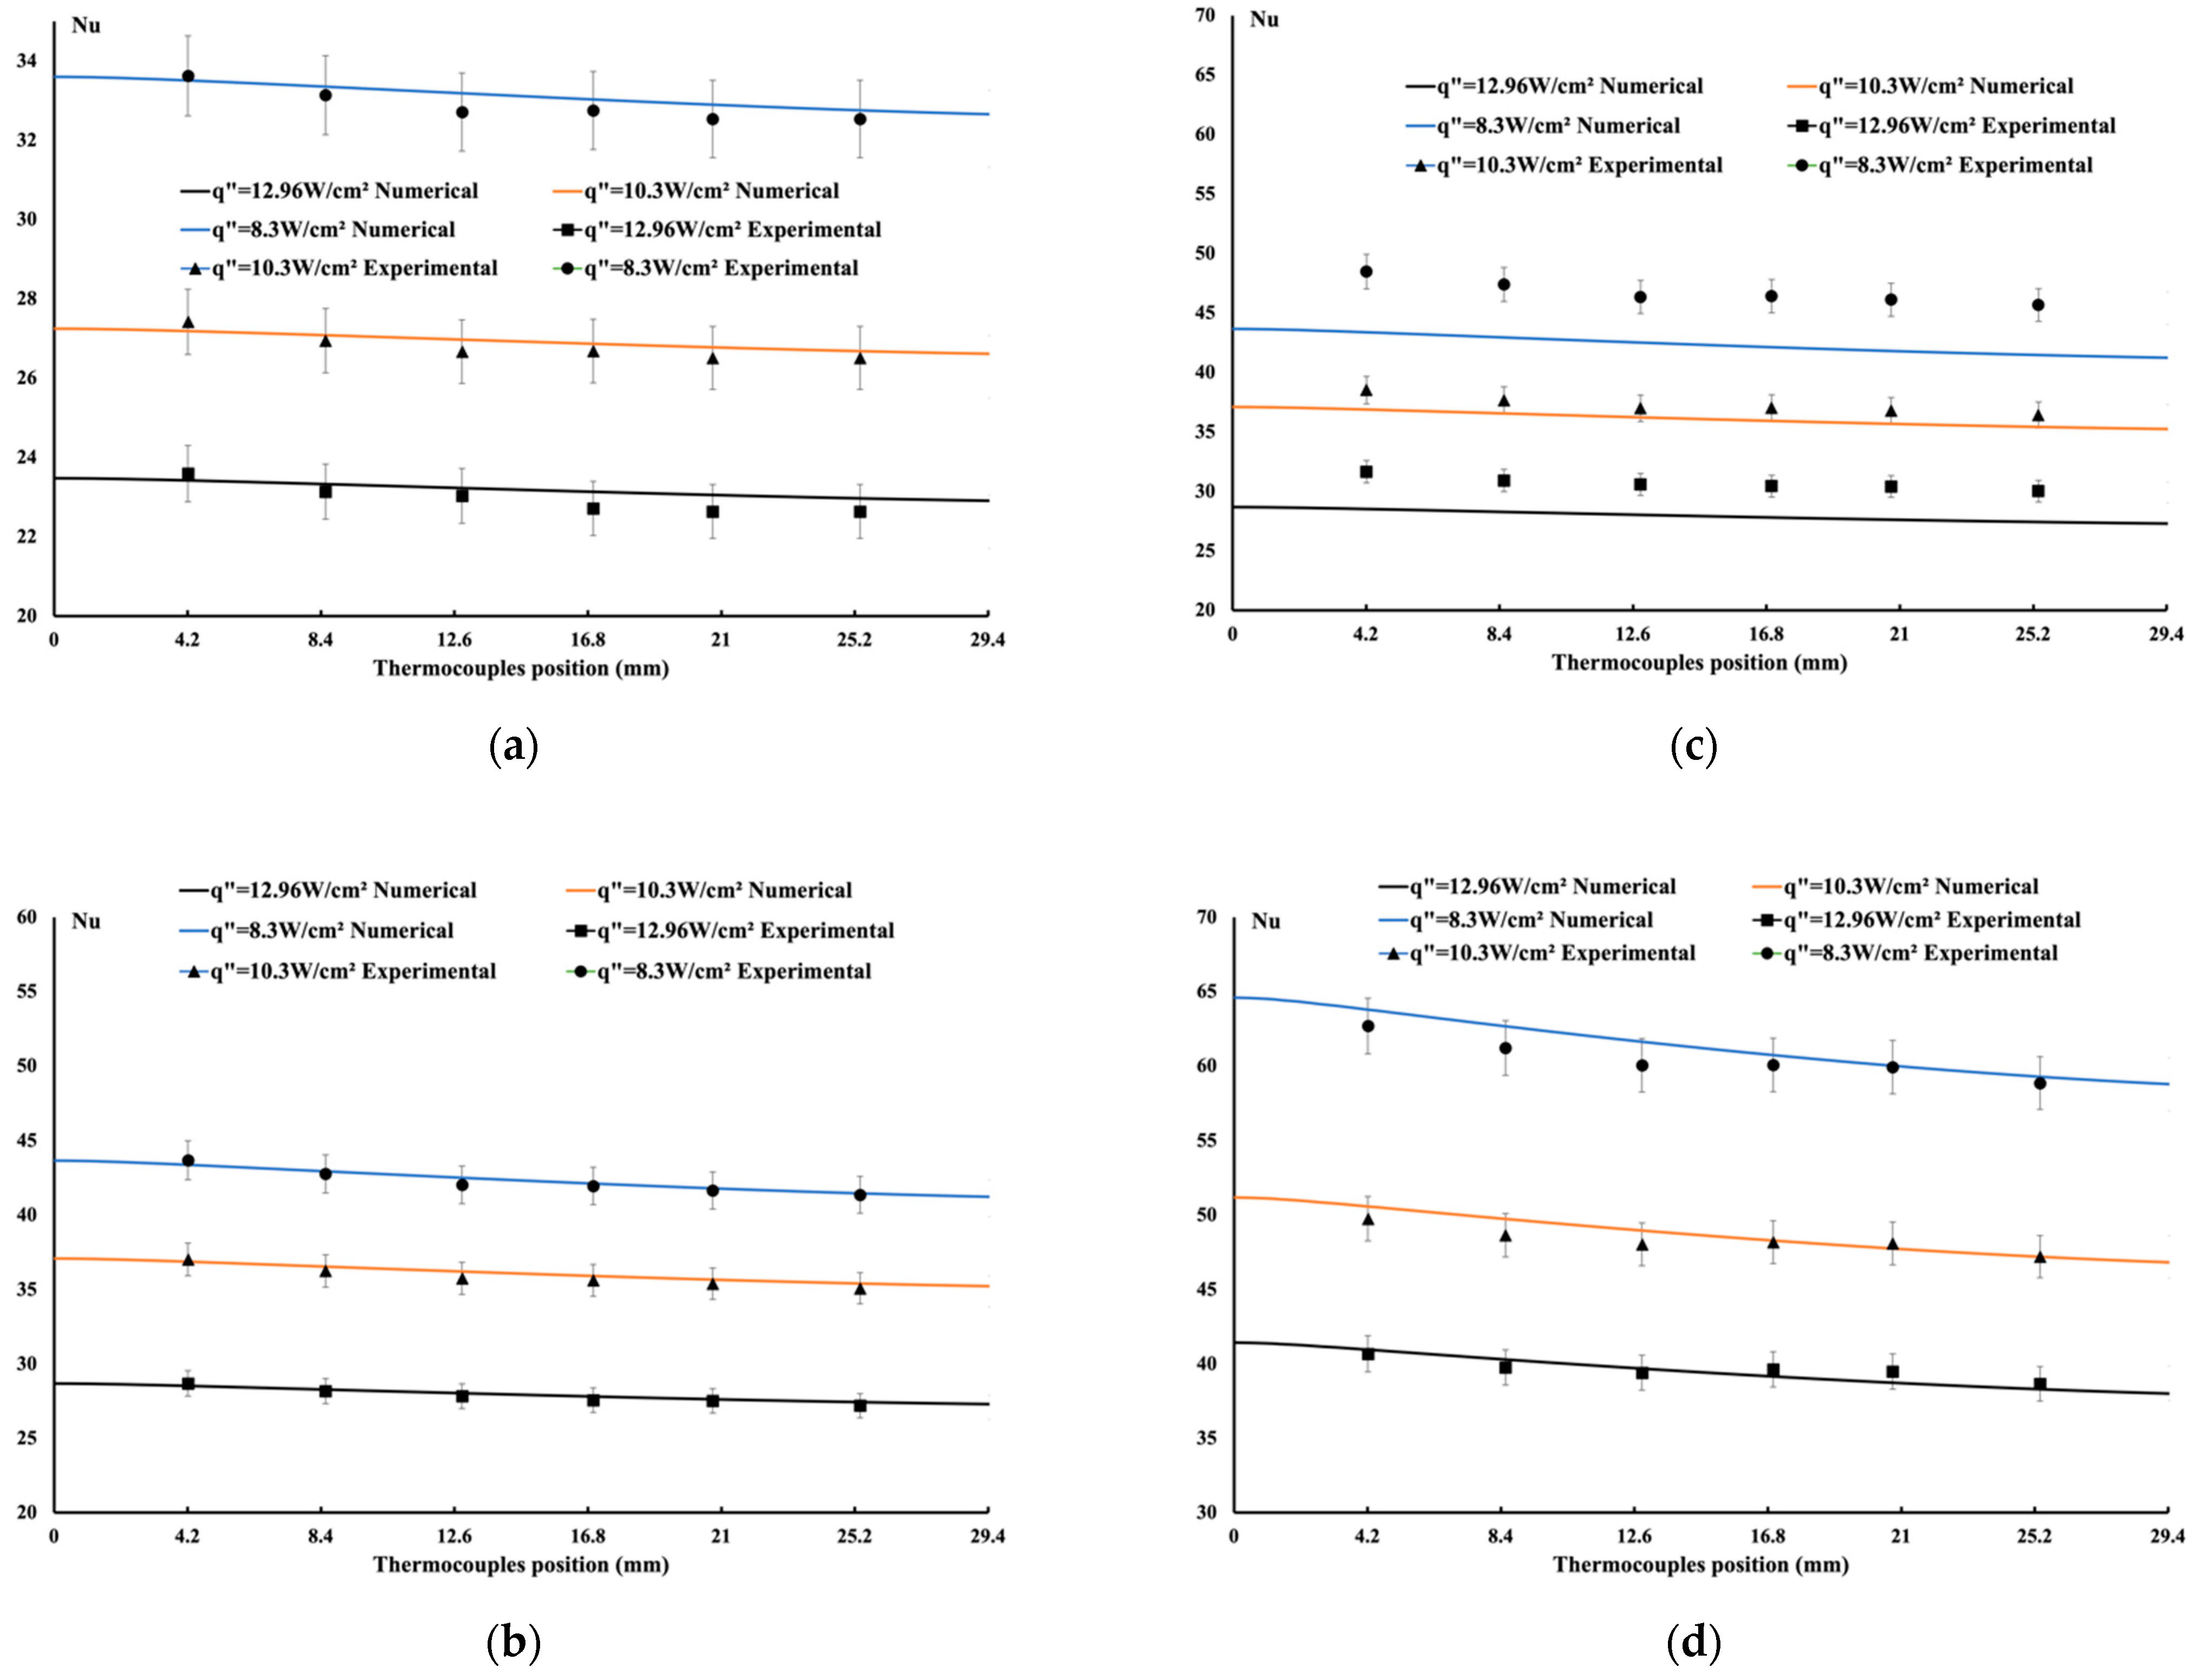
4.1. Comparison between Experimental Data and Numerical Results for the Porous Block

Figure 5 presents the metal foam used in the experimental measurements as shown in Figure 3. As indicated earlier, the porosity equals 0.91, and the permeability is designed to be 10 PPI, equivalent to 9.54788 × 10⁻⁷ m2. In total, three different heat fluxes and three different flow rates were applied. Additional measurements are made for the inlet and outlet temperature. It is essential to mention that measurements were taken three times for each case to ensure the accuracy of the experimental results. For this system, 3 h is detected to reach a steady state, after which the measurements are made. On the numerical side, a steady-state solution is obtained, and for each case, the inlet temperature and the applied heat fluxes were taken from the experimental measurements. Specific observations included a fluctuation in the amp and voltage during the experiment, and some heat losses to the environment, which were expected to happen. This was taken into consideration in the numerical modelling.
Figure 5 presents the temperature distribution measured 1 mm below the interface along the flow path. In total, seven thermocouples were used to measure the temperature along the flow pass with two thermocouples; one to measure inlet temperature and the other to measure outlet flow temperature. Water was used as the circulating fluid. As shown, at a low flow rate, the maximum temperature reached around 100 degrees Celsius, increasing until the fluid exits the metal foam. The fluid has a specific capacity to absorb heat, after which cooling becomes unachievable. Also, what is interesting to observe is the positive slope of the temperature, which indicates the development of a thermal boundary layer.
A similar observation is detected numerically and in good agreement with the experimental measurements. As observed, the higher the flow rate, the more cooling is observed, leading to lower measured and computed temperatures. Also, the lower heating flux led to a lower measured temperature. The inlet temperature varies between 17.5 °C and 18.5 °C during the experiment. Figure 6 shows the variation in the local Nusselt number along the flow direction. As noticed, a good agreement between the experimental measurements and the numerically calculated values is obtained. A decrease in the Nusselt number along the flow is detected due to the development of the thermal boundary layer. Thus, this demonstrates that the numerical model is reliable for predicting the experimental findings.
Table 1 and Table 2 show the percentage difference between the experimental data and the numerical results. Equation (14) shows the formulation used for the calculation represented in Table 1 and Table 2:
Difference = Absolute   of   T exp T num T   exp 100
As seen in Table 1, the maximum difference between the two datasets is around 1.49%. Table 2 presents a similar calculation for the Nusselt number. Again, the good agreement shown in Figure 6 is detected in Table 2. The maximum difference is found to be 2.49%. The experimental measurement and the numerical model comparison are accurate based on the above data.

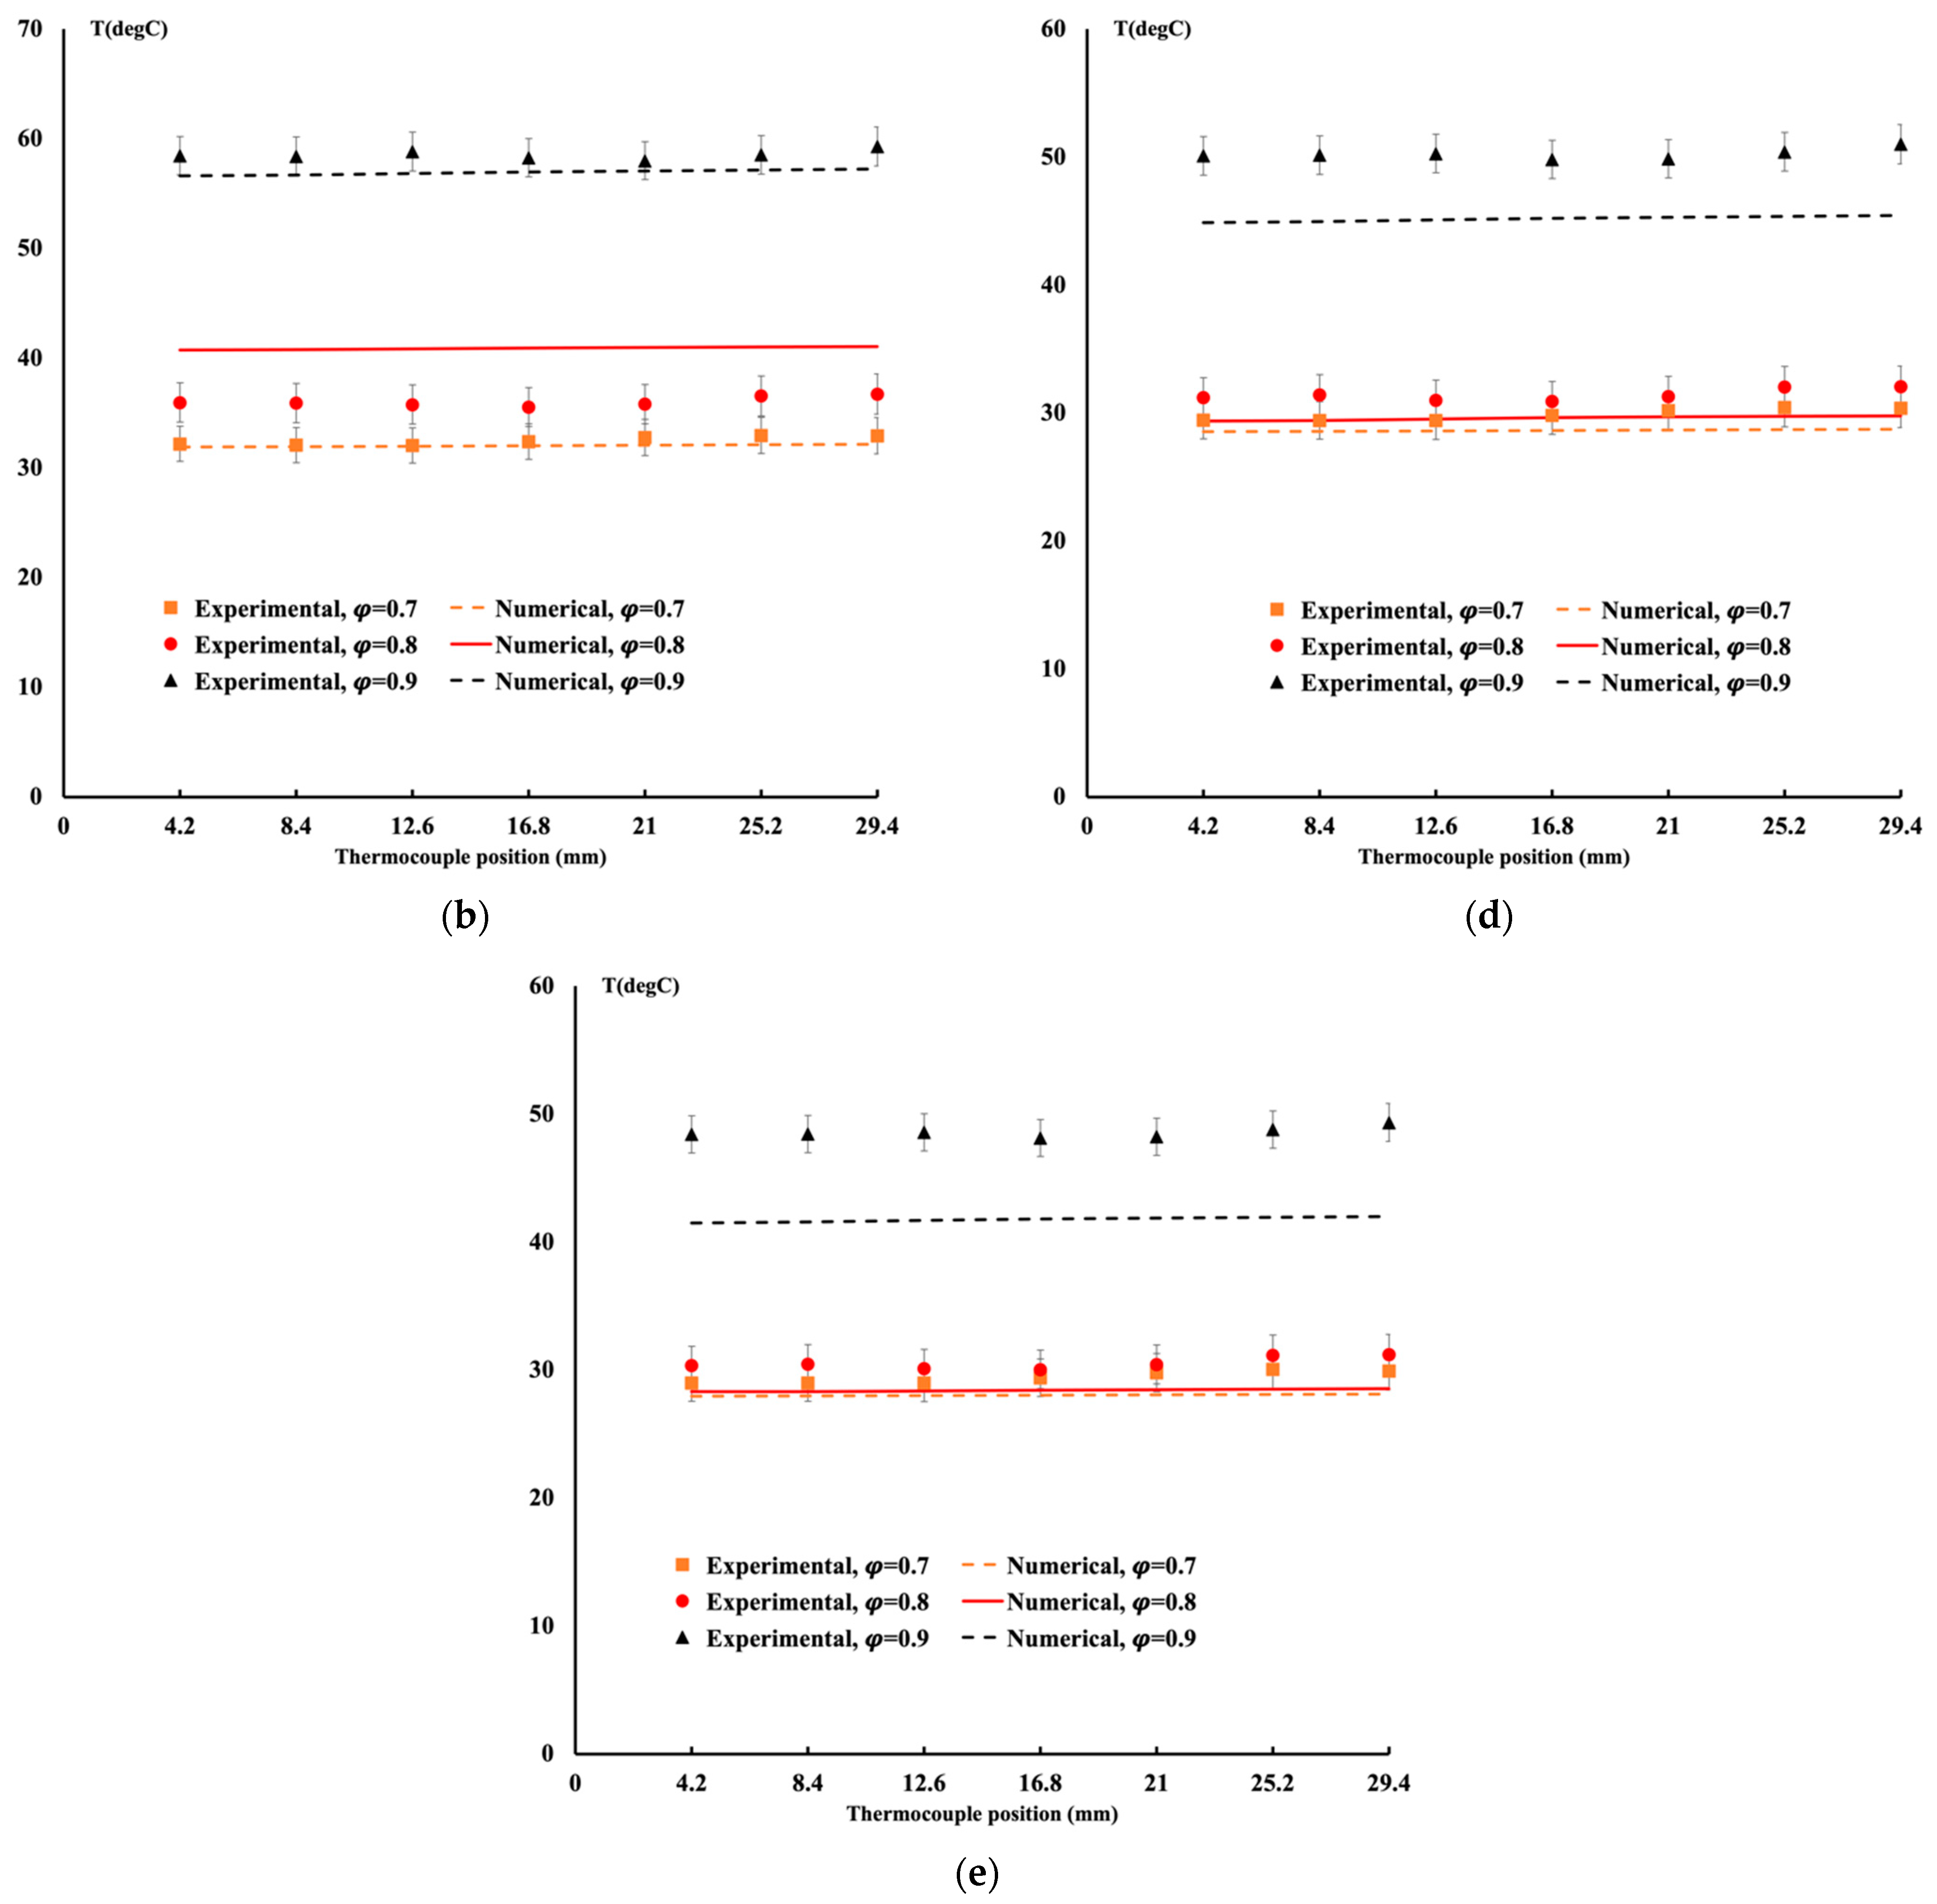
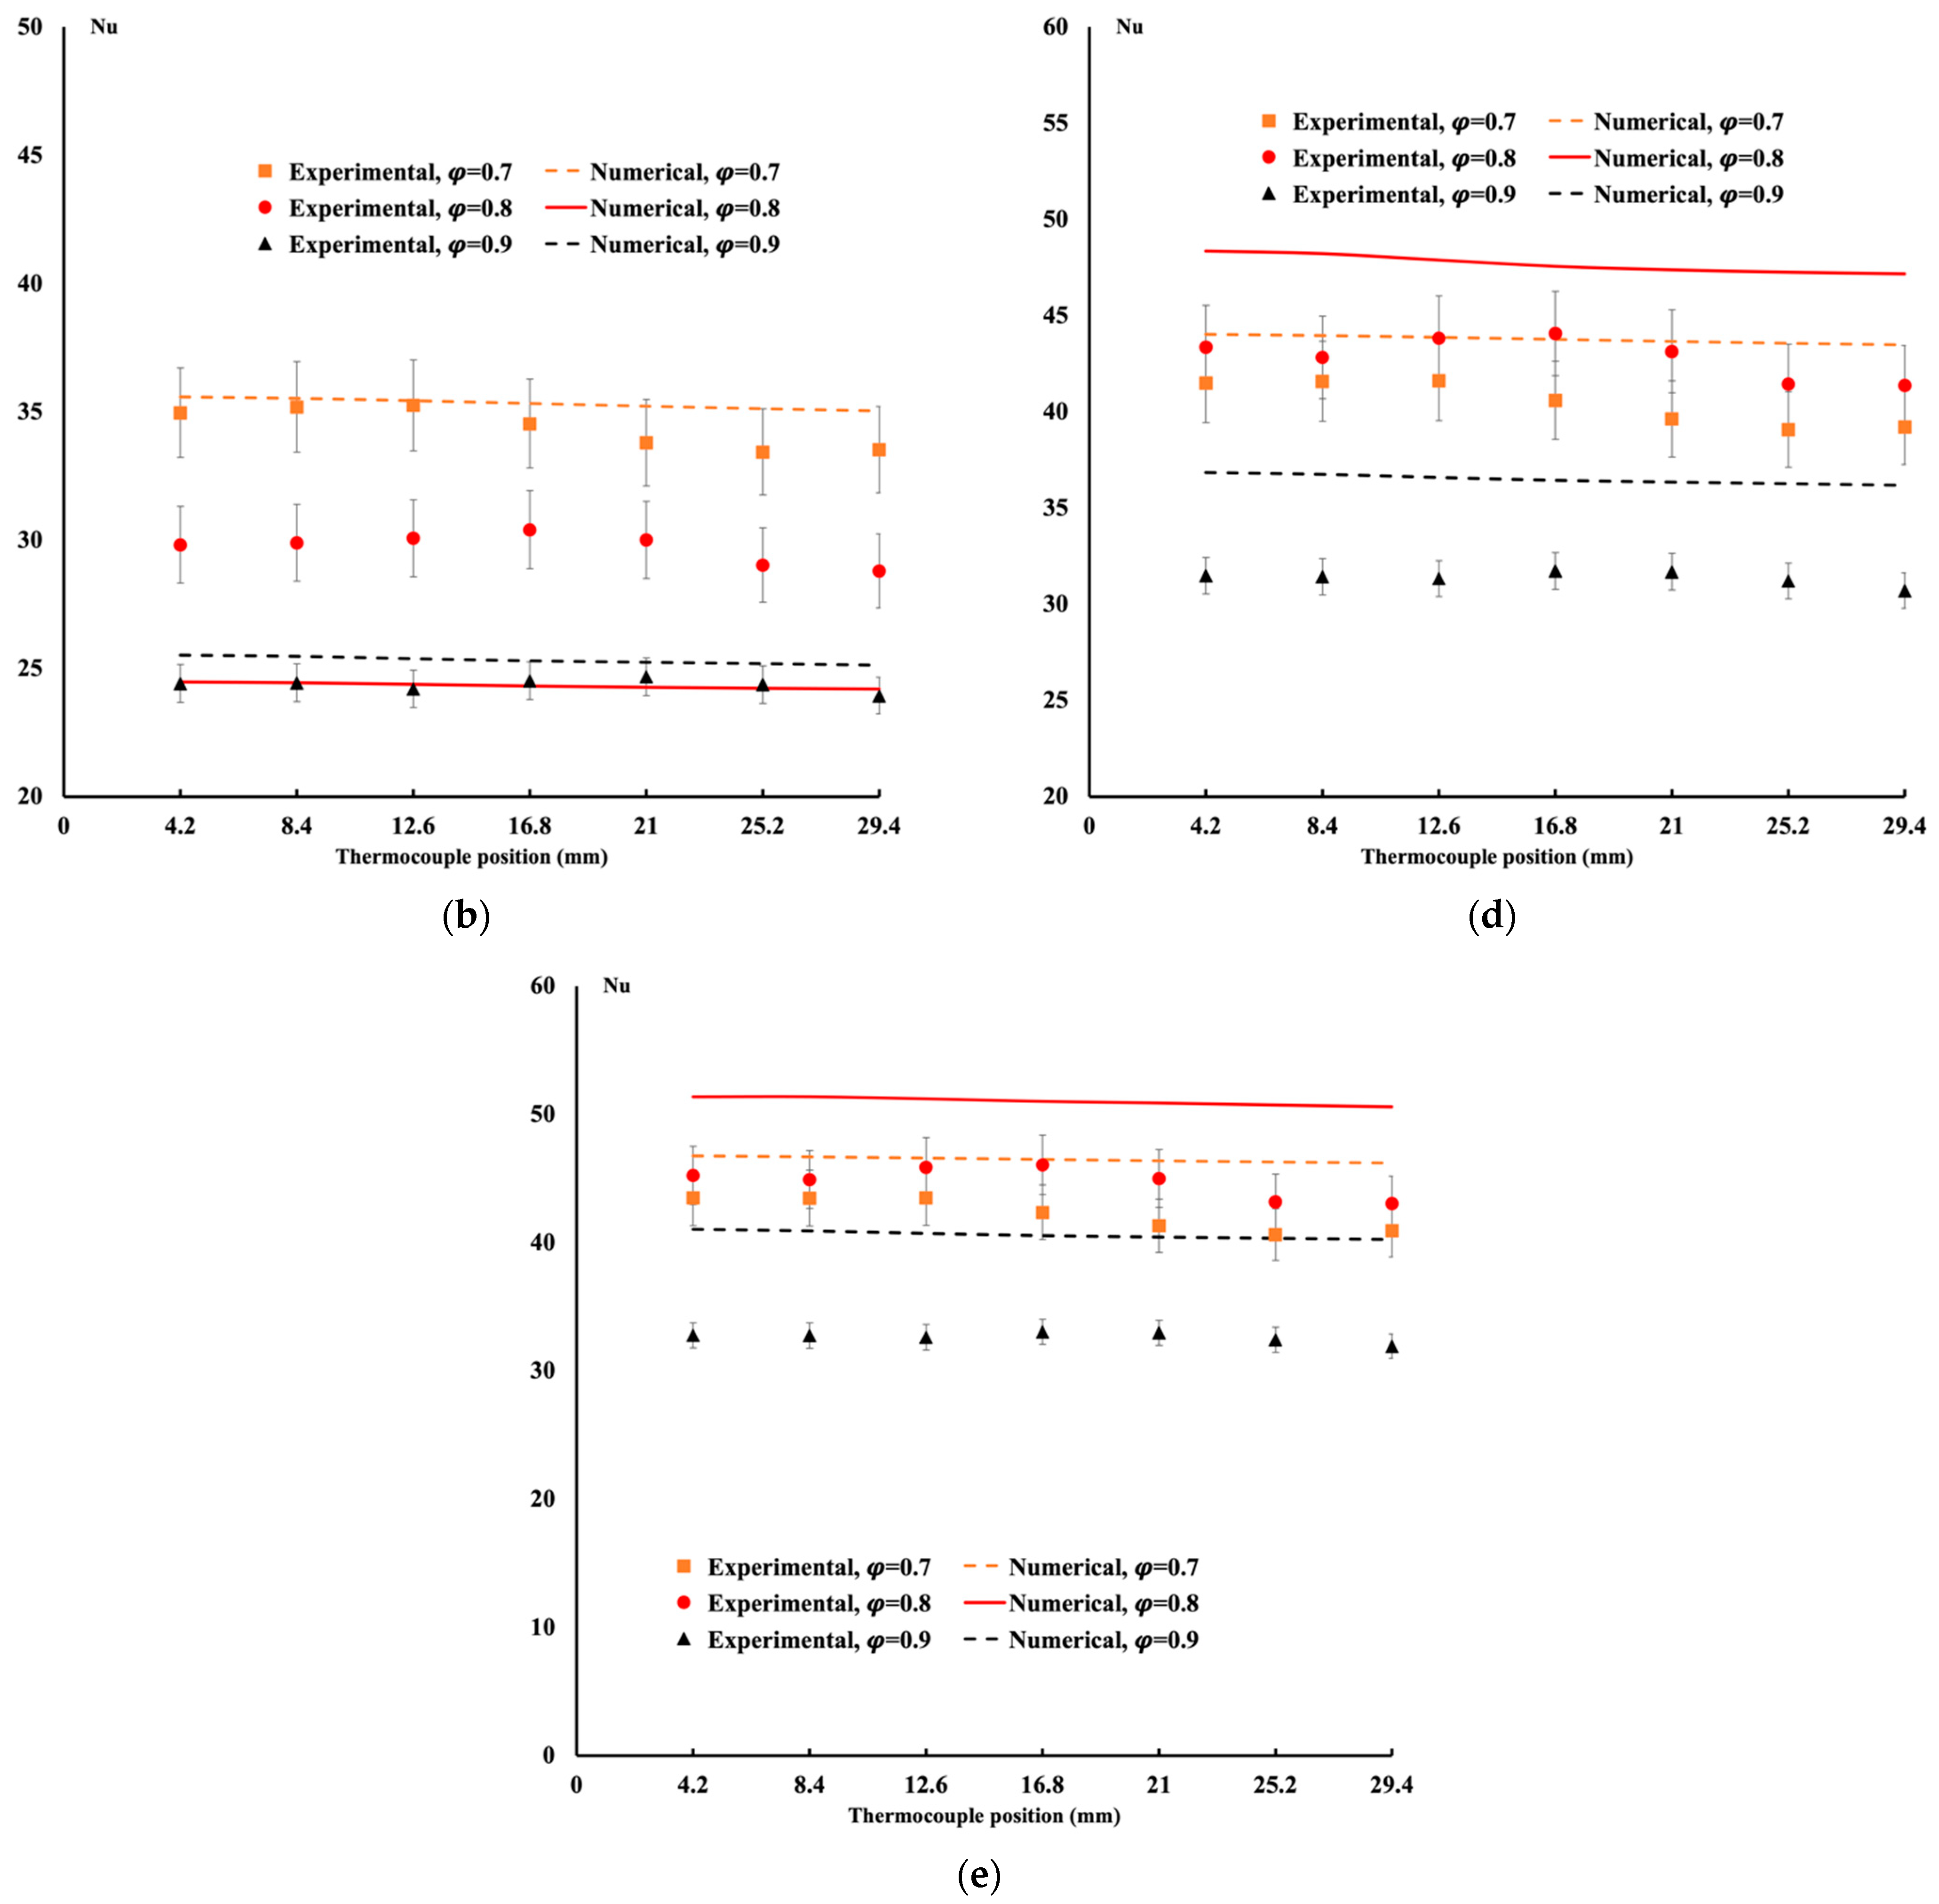
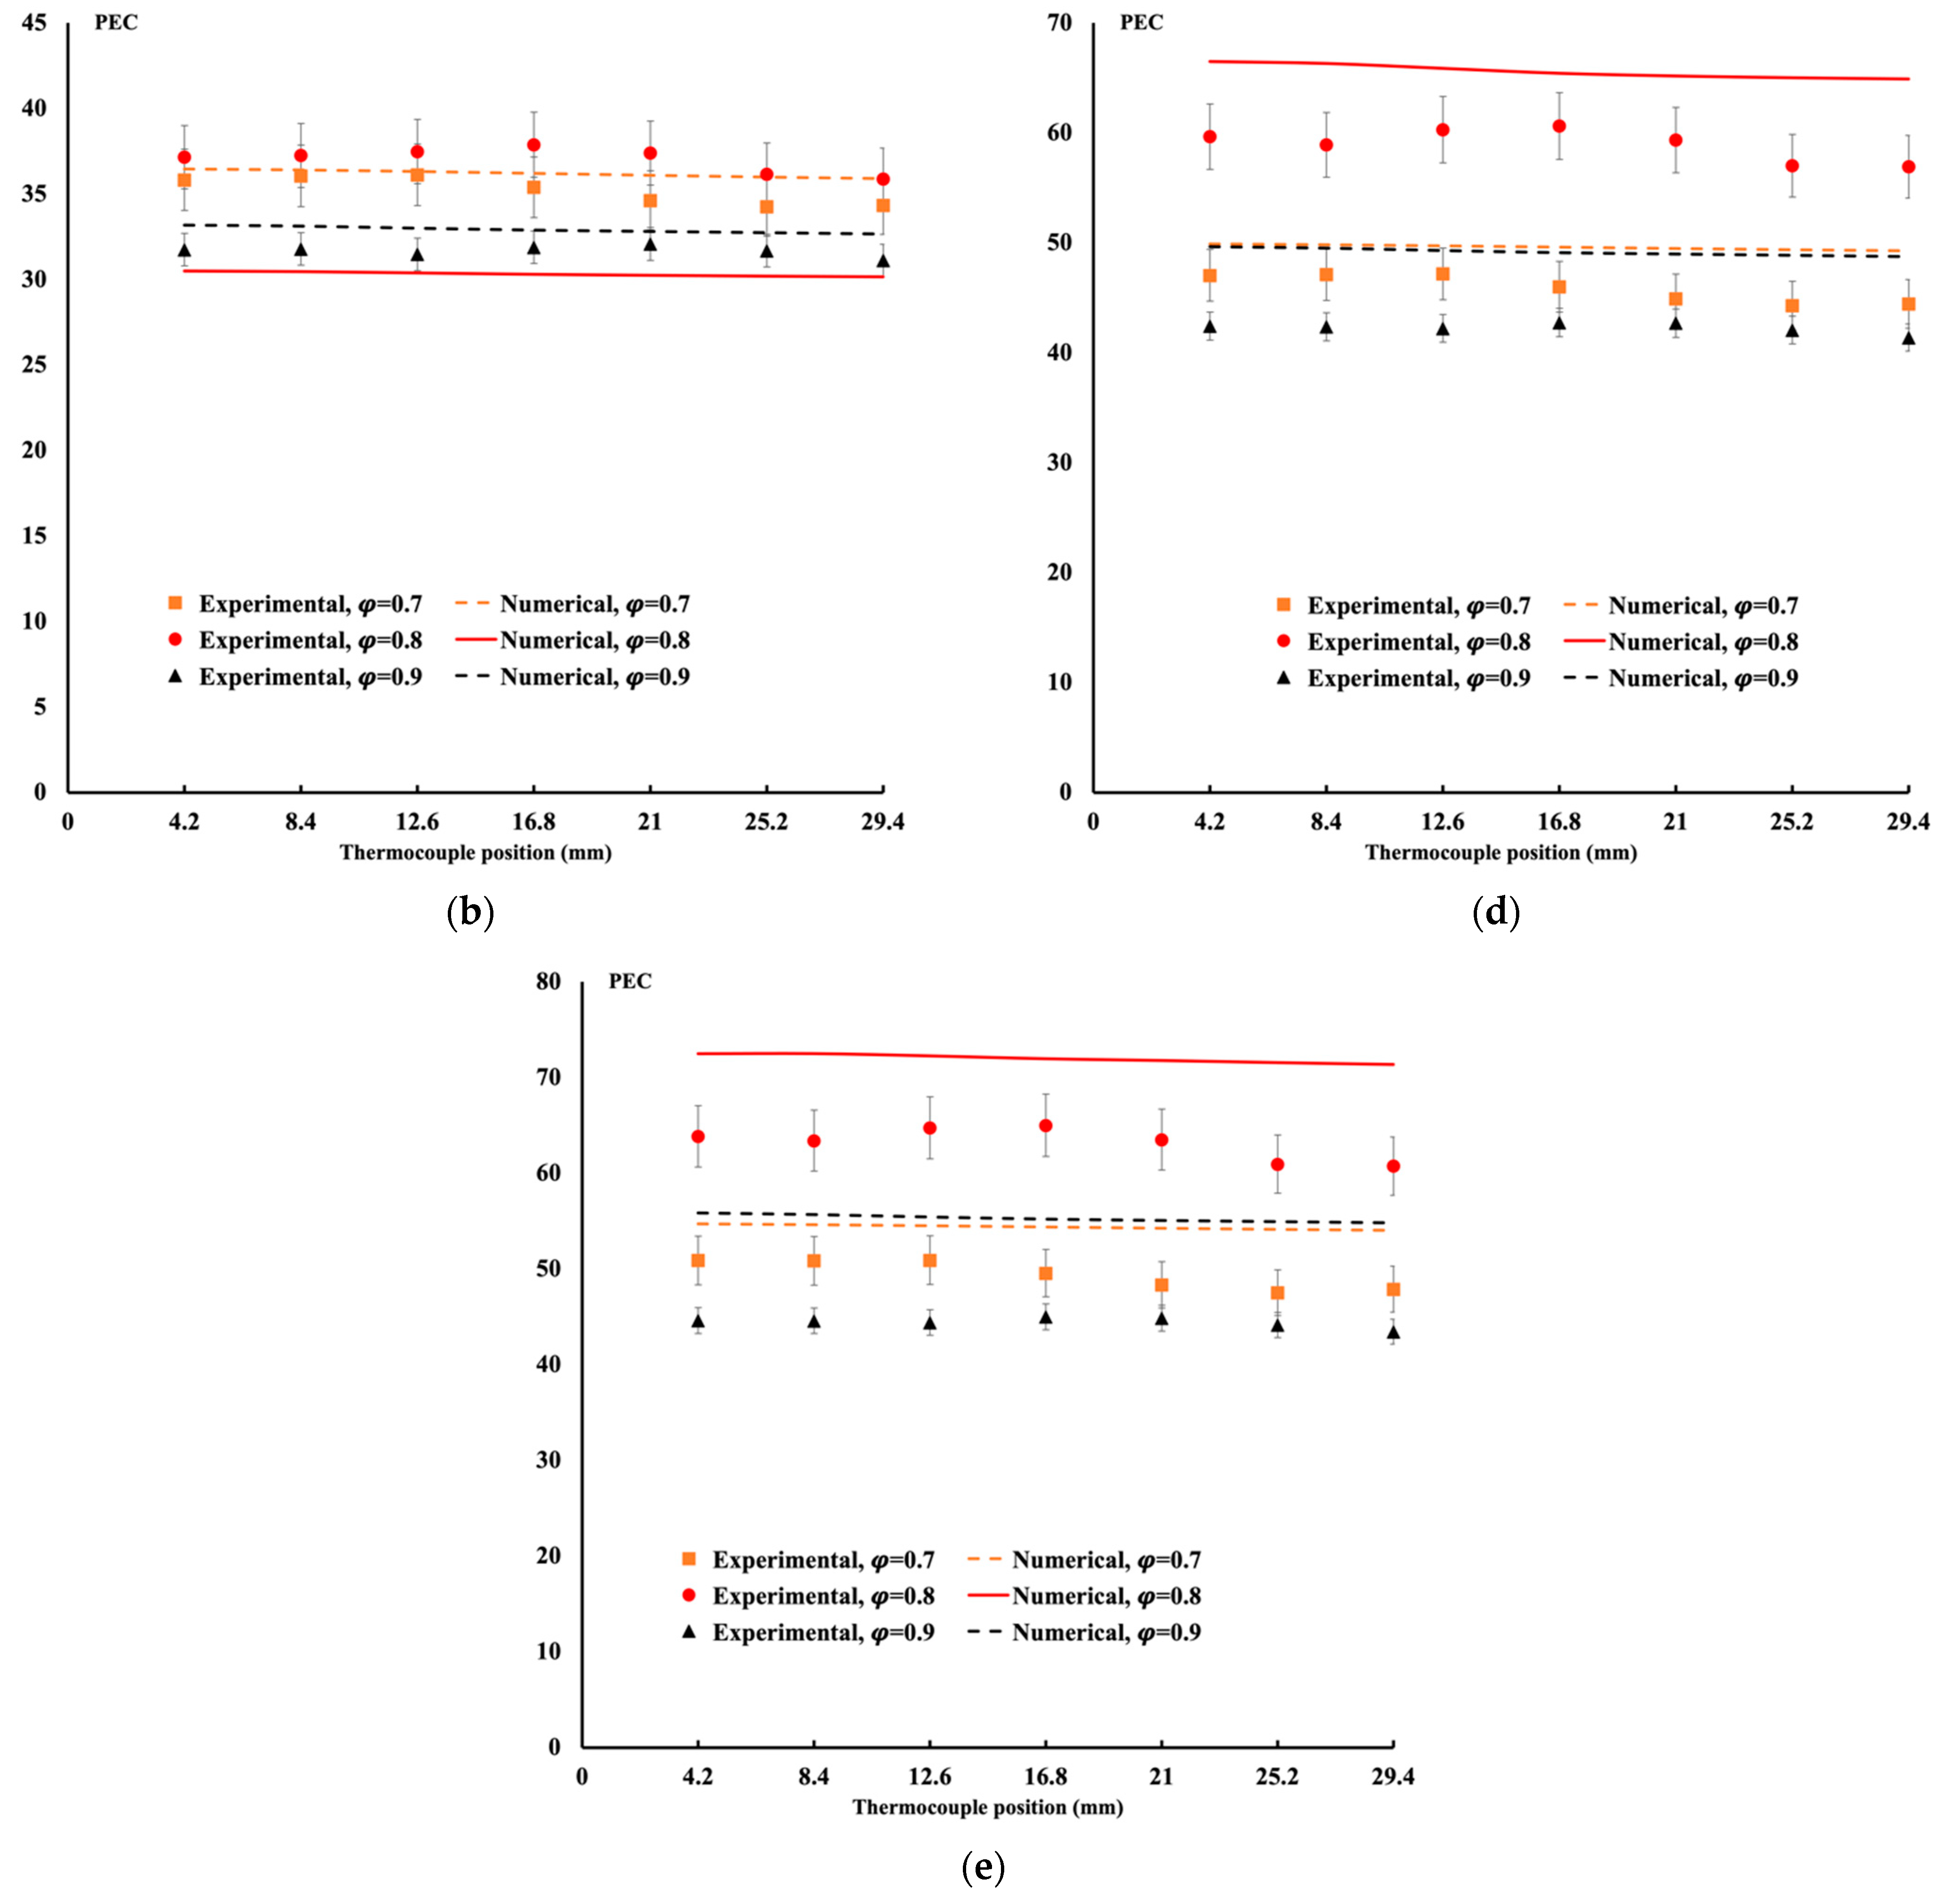
4.2. Comparison between Experimental Data and Numerical Results for the Gyroid Structure Case

Metal foam porous media is an essential structure that engineers use for heat extraction and cooling. Triply periodic minimal surfaces, or TPMS, are mathematical surfaces that have received substantial attention in several disciplines, including the study of materials and different engineering fields. The recurring nature and small surface area of TPMSs make them unique structures with intriguing geometrical characteristics. Continuous networks of curves that produce an endlessly repeating pattern throughout space are what make up TPMS. In addition, TPMS is a type of periodic, implicit surface which contains a zero-mean curvature; it has proven to be an effective tool for porous material. It contains different kinds of TPMS; the most well-known is the Gyroid structure. These surfaces are attractive in various domains because of their distinctive geometric features, which include steady mean curvature and zero Gaussian curvature. These 3D surfaces replicate themselves without intersecting or overlapping, dividing space into identical units. The triply periodic minimum surfaces technique is an old theory aimed at developing a porous structure for heat extraction and cooling. Gyroid consists of using a cosine function to generate such a system. The advantage of this approach is that engineers can design the structure to fit their needs. With 3D printing becoming affordable and available for metal, TPMS become an excellent development approach. What is more attractive is that one can design this structure and can control both the weight of it and the pressure drop. Such approaches are welcomed by engineers, mainly in the aerospace and space industries.
In our current paper, we have designed this structure using MS lattices software developed by Al Ketan and Abu Al-Rub [2]. Gyroid is known to be common among TPMS users. The designed Gyroid has a 0.7, 0.8, and 0.9 porosity, respectively. Figure 2 shows the three Gyroid used in the experiment and the model. It is worth noting that these Gyroid are made of AlSi10Mg, and the conductivity of this material is less than that of Aluminum. Selo et al. [5] measured the thermal conductivity of this Gyroid material and found it to be between 119 ± 5 W·m−1·K−1 and 103 ± 5 W·m−1·K−1, if the material did not go through thermal treatment. In the current case, the Gyroid did not go through heat treatment.
The experiment was conducted for five different flow rates of 3.74 cm3/s, 7.86 cm3/s, 11.8 cm3/s, 15.73 cm3/s, and 19.85 cm3/s, respectively, and three different porosities. The heat flux was set equal to 3 W/cm2. The inlet temperature varied between each case but was always maintained around 16 °C. Results for the three porosities are shown in Figure 7 (see Figure 2). In the case of a flow rate of 7.86 cm3/s (Figure 7b) and 11.8 cm3/s (Figure 7c), excellent agreement is obtained between the experimental measurements and the numerical simulation. Also, excellent agreement was obtained for all porosities for a flow rate of 15.73 cm3/s (Figure 7d) and 19.85 cm3/s (Figure 7e). By examining Figure 7a, the numerical results for the case of porosity equal to 0.8 are higher in magnitude. Similar observation for the porosity of 0.8, when the flow rates increase to 7.86 cm3/s. The general reason for these differences is mainly in instrument reading errors. It was observed that the voltage and the amp in our current faced some oscillation due to the electrical network. Although the experiment was repeated three times, the fluctuation remained. However, as shown in Table 3 and Table 4, the differences are insignificant and within the acceptable range.
The local Nusselt number was measured experimentally and calculated numerically for all cases. Figure 8 presents the variation along the flow path. For all flow rates, flat variation was detected. Again, a good agreement was achieved. The experiment was repeated experimentally and numerically for the same condition for the case of porosity of 0.8, shown in Figure 7 for the temperature and Figure 8 for the local Nusselt number. Similarly, the temperature variation and the local Nusselt number variation for a porosity of 0.9 are shown in Figure 7 and Figure 8. Similar observation to the case of porosity of 0.7 is reported.
It is essential to indicate that for the case of Gyroid, numerical modelling is more challenging for this type of flow rate. It is worth mentioning that a laminar regime is always maintained for such a complicated structure. For instance, to solve this problem numerically, one first must solve the flow around the structure using the Navier–Stokes equations only. When the solution is converged, it is used as the initial condition for solving the energy equation and the Navier–Stokes equations, simultaneously. Using COMSOL, one cannot reach a steady-state solution without this approach. Table 3 and Table 4 show the maximum percentage difference between the experimental measurement and the numerical data.
The differences are within the accepted range, which includes measurement errors by the instruments.
One can study the effect of both hydraulic and thermal performance. The pressure drops or the friction coefficient is an integral part of this investigation, aimed at a structure that enhances heat removal and, on the other hand, reduces the pressure drop. As defined in Equation (13), the performance evaluation criterion combines both effects. The higher the PEC, the better the system is for heat enhancement. The PEC is calculated for the Gyroid case because we were able to evaluate numerically the pressure drop between the inlet and the outlet. To this end, Figure 9 presents the performance evaluation criterion for the experimental measurements and the numerical calculation for different porosity at different flow rates. For the experimental measurements, the pressure drop was calculated numerically. In addition, this figure combines all flow rates applied and for all system porosity. As shown in Figure 9a, the Gyroid model with a porosity of 0.7 or 0.8 provides the highest PEC. If we continue our comparison with Figure 9b for a flow rate of 7.86 cm3/s, it is evident that a Gyroid with a porosity of 0.9 is not a favourable design. This observation is also apparent in Figure 9d, for a flow rate of 15.73 cm3/s and 19.85 cm3/s. It is strongly believed that with the Gyroid having a porosity of 0.7 or 0.8, more mass is available, allowing the fluid to circulate a longer path toward the flow exit.

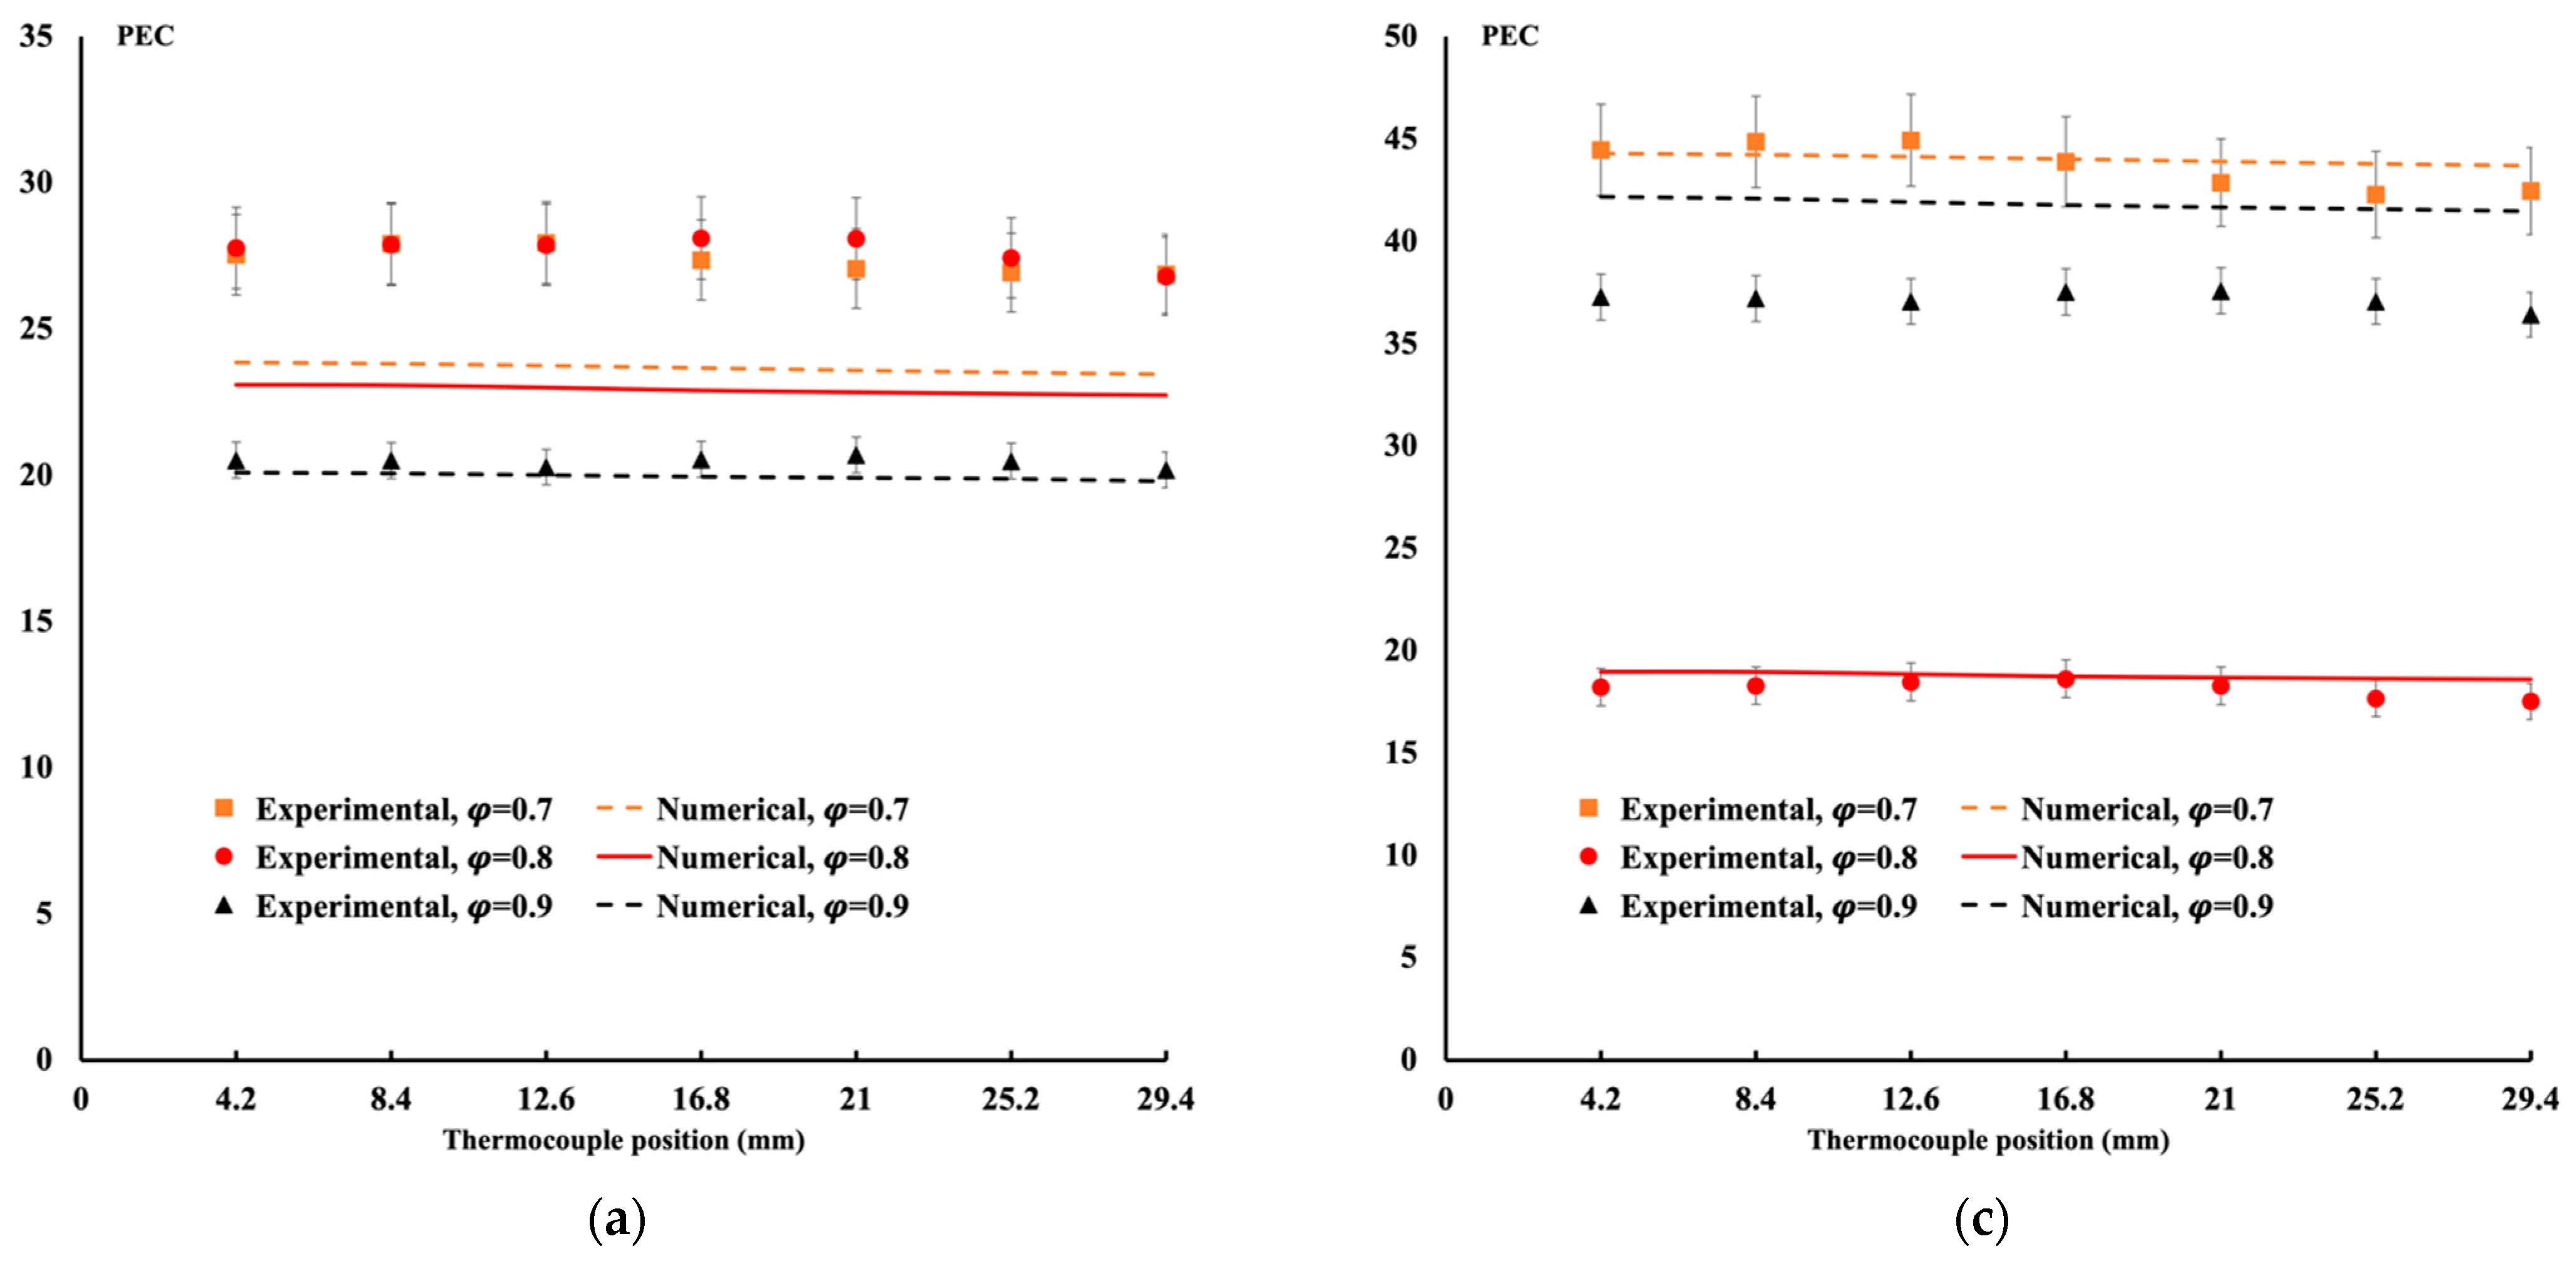
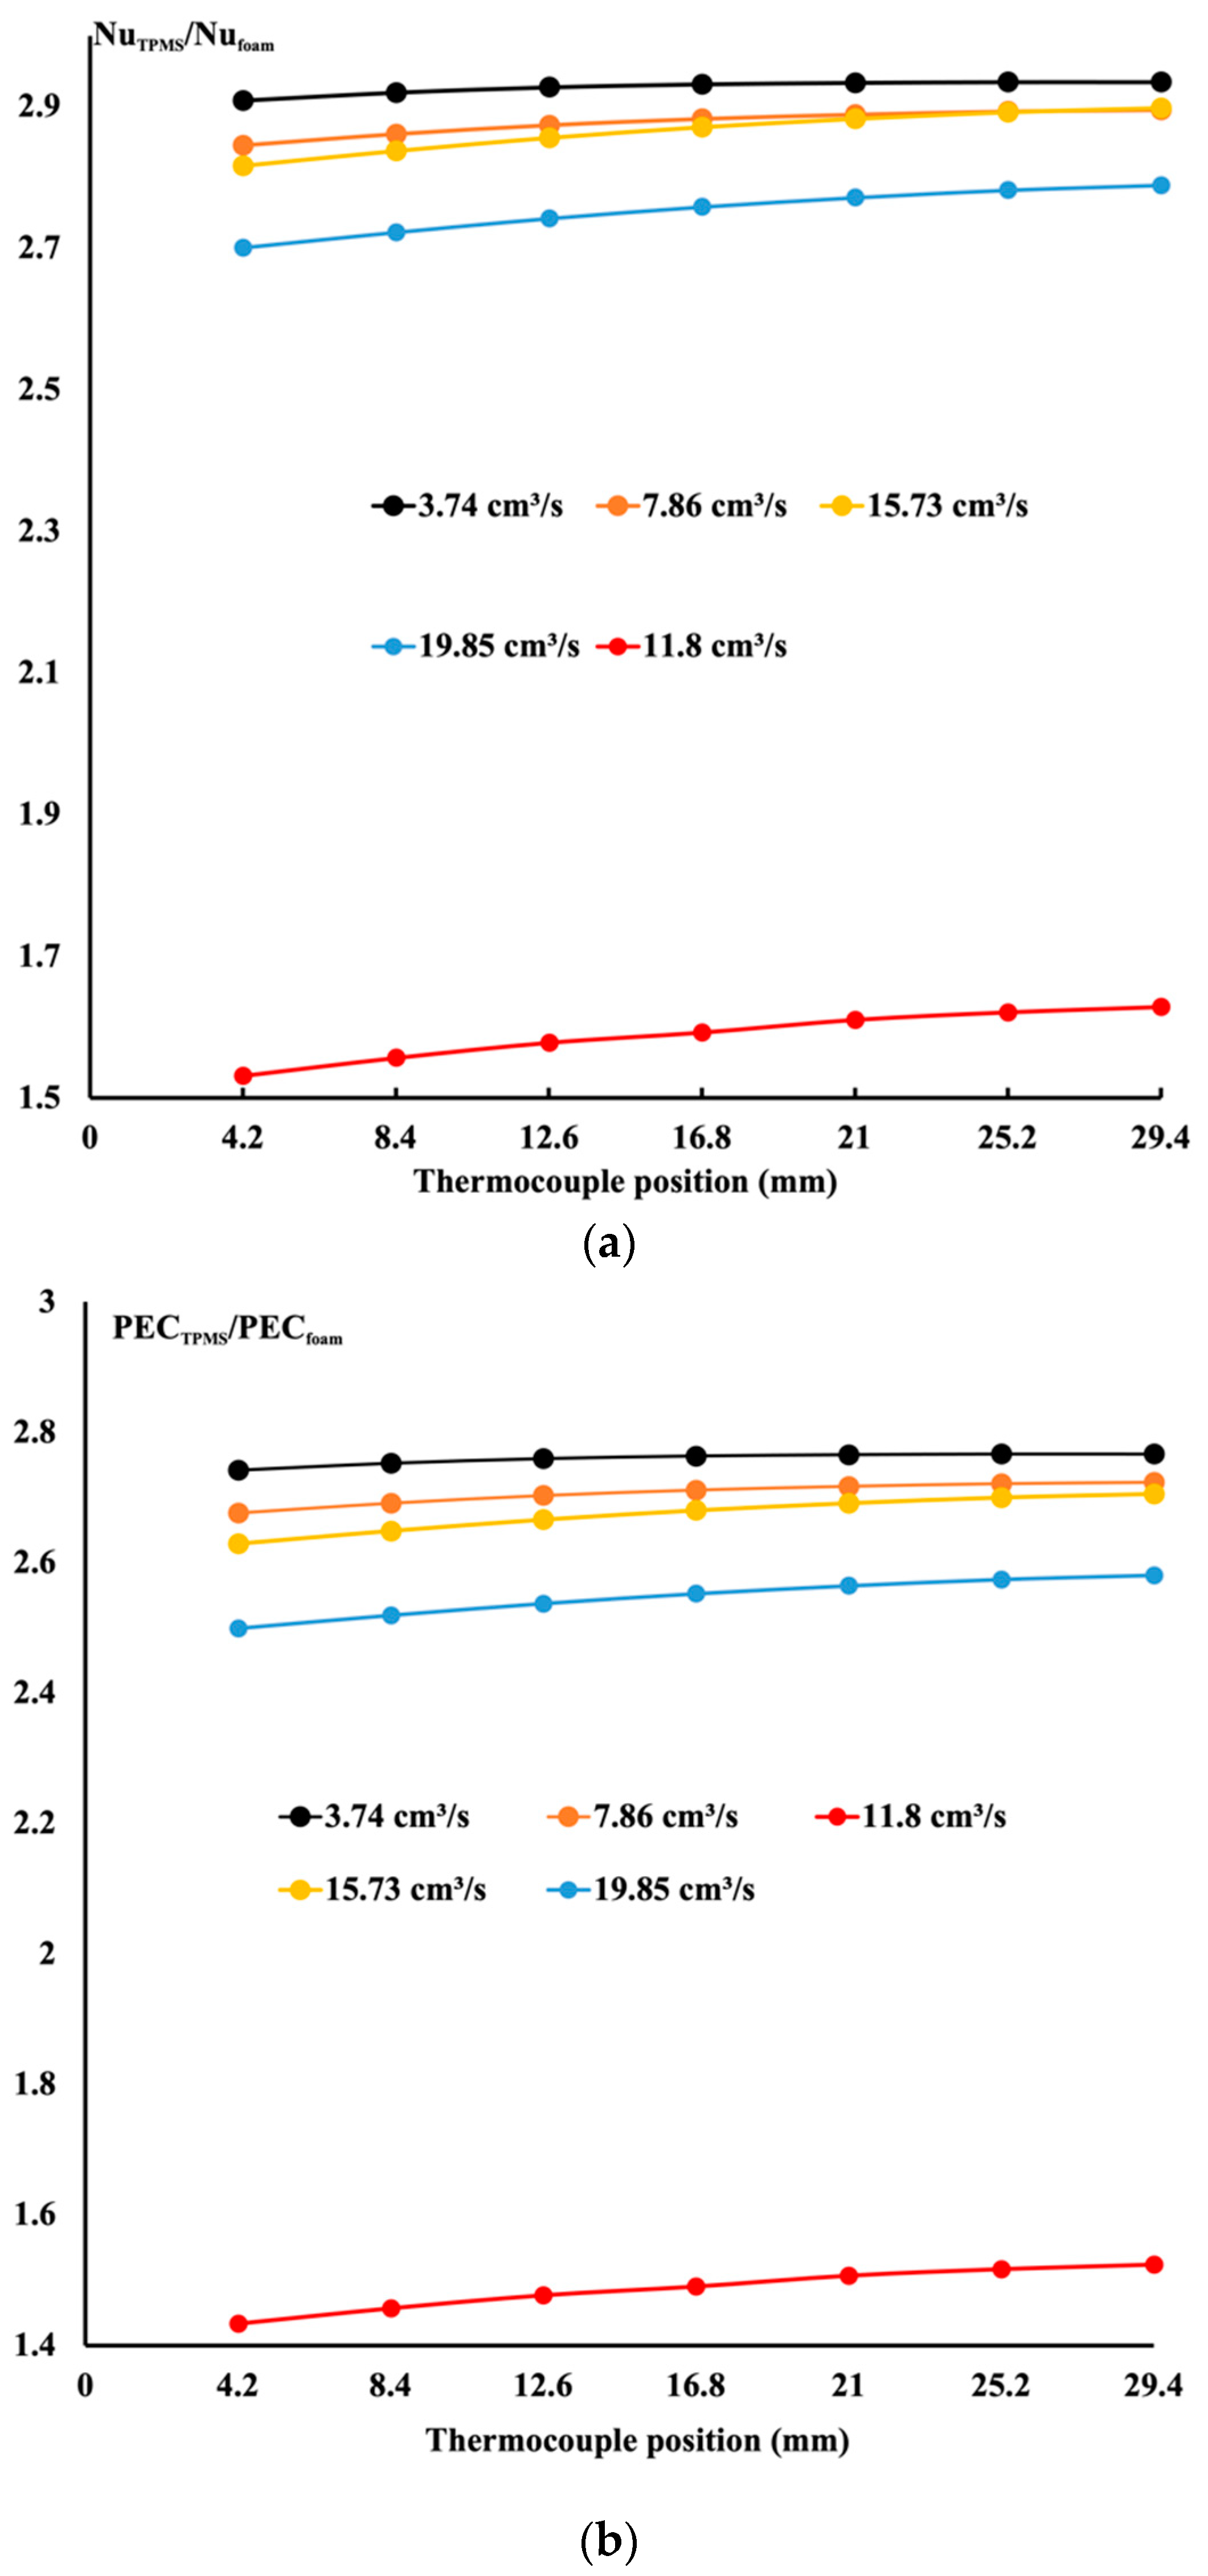
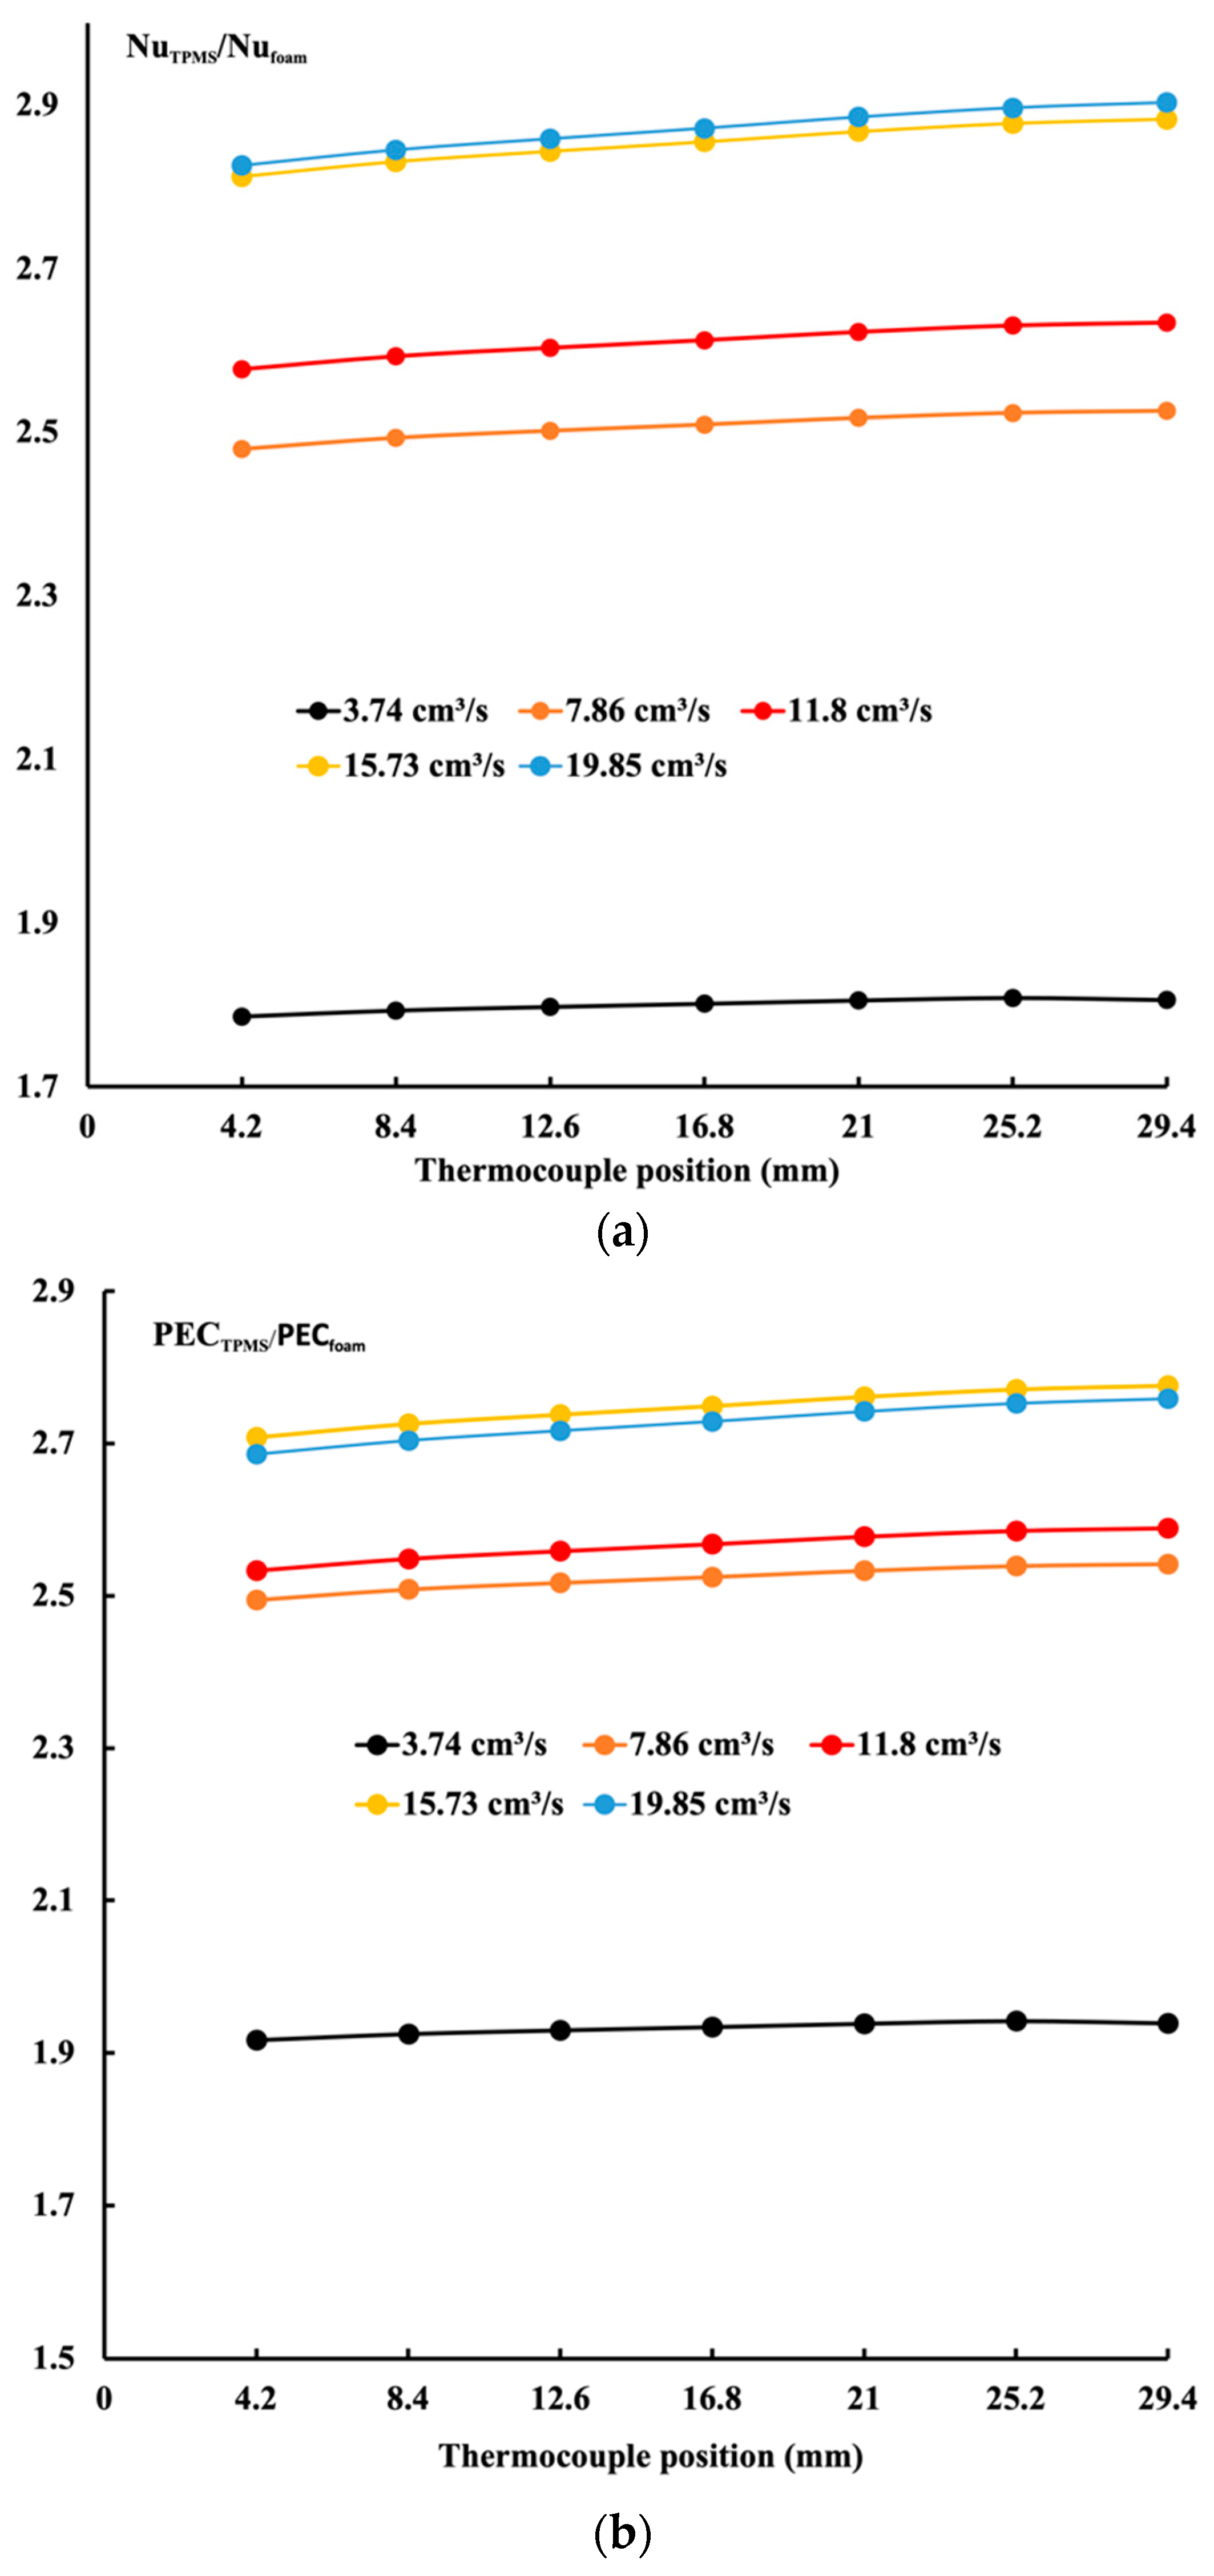
4.3. Comparison of Performance between Porous Block and Gyroid Structure for Different Permeabilities and Porosities

In the previous section, detailed experiments were achieved, and measured data were compared with the numerical results. The numerical model demonstrates its accuracy, thus indicating the need to explore further study. In this section, interest is in comparing the heat enhancement and the thermo-hydraulic effects between a porous block and a Gyroid structure when both have the same porosity, permeability, flow and heating conditions. To do so, it is straightforward for the porous block to run the code by specifying different porosities and permeabilities. However, we do not know the permeability of the Gyroid in advance. Based on the numerical code used for the Gyroid, when compared to the experimental measurements using the Darcy formulation, an attempt is made to measure the permeability of the Gyroid system. Knowing the pressure drop for each case studied and the flow rate, we could evaluate the permeability using the Darcy formulation. Table 5 shows three different Gyroid calculated permeability and flow rates.
As shown in Table 5, the permeability has been evaluated for different flow rates for each Gyroid with a specific porosity. On average, one may notice that for a porosity of 0.7, the Gyroid had a lower permeability when compared to the Gyroid structure with a porosity of 0.9. This is very trivial. Therefore, for each case, the models of porous blocks with identical porosity and permeability will be studied, as well as the Gyroid case.
Figure 10a displays the ratio of the local Nusselt number of the Gyroid structure case and the porous block. As seen, this study is conducted for all flow rates and a porosity of 0.7. Based on these data, the Gyroid model outperformed the metal foam porous block. When the flow rates are at their lowest, the ratio is the highest, and the lowest ratio is found for a flow rate of 11.8 cm3/s. Similar behaviour is found for the ratio of the performance evaluation criterion. The reason for this behaviour at a flow rate of 11.8 cm3/s is that both structures had very close heat enhancement compared to the other flow rates. Both models had very close pressure drop and temperature variations compared to the other cases. Nevertheless, the Gyroid outperforms the porous block.
The model is repeated for the case of porosity equal to 0.8, as shown in Figure 11 and 0.9 in Figure 12. In both cases, the Gyroid structure outperforms the porous block, regardless of the porosity. An increase in the ratio toward the flow path shows a continued heat enhancement. It was detected experimentally and proved numerically that the Gyroid provided a uniform constant-heat distribution compared to the porous block. It may be how the structure is created; it helps destroy the development of the thermal boundary layer. However, the pressure drop is more significant for this Gyroid design than the porous block case. Further experimental studies will be worth conducting.

5. Conclusions

The objective of the present paper is twofold. First, an experiment using a metal foam porous block and Gyroid structure to enhance heat removal on small surfaces was performed. Secondly, we compared the performance of the metal foam versus the Gyroid structure and identified the best structure for heat removal and less pressure drops. Experiments and numerical modelling were conducted for the two proposed structures. To this end, the metal foam Darcy–Brinkman model is numerically combined with the energy equation for porous media. Only the Navier–Stokes’ formulation is used with the energy equation for the Gyroid structure. The experimental measurements and the numerical model have reached a good agreement.
Further study involved numerically solving the Gyroid structure and metal foam cases for identical conditions. Because the permeability of the Gyroid is unknown, it was determined numerically and used in the porous block. In this comparison, porosity equals 0.7, 0.8, and 0.9, respectively, and the permeability varies for each flow rate applied. The novelty of this work is a comparison between experimental and numerical performance. Additionally, a comparison between porous media performance and TMPS is highlighted. The following findings could be summarized:
1. For the metal foam, it is found that the temperature distribution along the flow is increasing toward a non-uniform cooling.
2. For the metal foam, a thermal boundary is developed along the flow, and means of breaking this thermal boundary layer must be addressed
3. Uniform temperature distribution is achieved experimentally and numerically for the Gyroid structure. The structure design allowed the break of the thermal boundary layer.
4. The pressure drop in the metal foam appears to be less than the pressure drop in the Gyroid by an average of 18%
5. Comparing the performance of the two structures for identical conditions shows that the Nusselt number is higher for the Gyroid structure. This led to the belief that lower temperatures were achieved and a better cooling process was needed.
6. The performance evaluation criteria for both systems for any flow rates and porosity demonstrate a higher value for the Gyroid when compared to metal foam.
7. Triply periodic minimum surfaces have demonstrated an excellent cooling mechanism.

Author Contributions

Conceptualisation, M.Z.S. and H.R.; methodology, M.Z.S.; software, M.Z.S. and O.A.-K.; validation, C.W., E.D.K. and M.H.; supervision, M.Z.S.; project administration, M.Z.S.; funding acquisition, M.Z.S. All authors have read and agreed to the published version of the manuscript.

Funding

The authors acknowledge the financial support of NSERC grant number RGPIN-2020-07021.

Data Availability Statement

Data are contained within the article.

Acknowledgments

The authors acknowledge the support of the Faculty of Engineering at Toronto Metropolitan University and the University of New York in Abu Dhabi.

Conflicts of Interest

The authors declare no conflicts of interest.

Nomenclature

Variables μ f Fluid dynamic viscosity in kg/m.s
pFluid pressure in Pa ρ f Fluid density in kg/m3
u,v,wFluid velocity in m/s κ Permeability in metal foam in m2
x,y,zCoordinate system in m κ Permeability in TPMS in m2
gGravity acceleration in m/s2 φ Porosity of TPMS
q″Heat Flux in W/m2 φ Porosity of metal foam [1]
TTemperature in degrees CSubscript
kThermal conductivity in W/m.KinInlet
CpHeat Capacity in J/kg.KoutOutlet
Non-dimensional fFluid
ReReynolds numbersSolid
MOGAMulti-objective genetic algorithm optimizationoReference
NuNusselt numbereffeffective
fFriction coefficientTPMSTriply periodic minimum surfaces
PECPerformance Evaluation CriterionFoamMetal foam porous media
Greek letter IwpI-graph and wrapped package graph

References

  1. Bayomy, A.M. Electronic Cooling Using ERG Aluminum Foam Subjected to Steady/Pulsating Water and γ-Al2O3–Water Nanofluid Flows: Experimental and Numerical Approach. Ph.D. Thesis, Ryerson University, Toronto, Canada, 2017. [Google Scholar]
  2. Al-Ketan, O.; Abu Al-Rub, R.K. MSLattice: A free software for generating uniform and graded lattices based on triply periodic minimal surfaces. Mater. Des. Process. Commun. 2021, 3, e205. [Google Scholar] [CrossRef]
  3. Saghir, M.Z.; So, J.; Rasheed, H.; Ilesaliev, D. Forced Convection in Porous Medium Using Triply Periodical Minimum Surfaces. Fluids 2023, 8, 311. [Google Scholar] [CrossRef]
  4. COMSOL Manual; COMSOL Inc.: Burlington, MA, USA, 2023.
  5. Sélo, R.R.; Catchpole-Smith, S.; Maskery, I.; Ashcroft, I.; Tuck, C. The thermal conductivity of AlSi10Mg and lattice structures made by laser powder bed fusion. Addit. Manuf. 2020, 34, 101214. [Google Scholar] [CrossRef]
  6. Piedra, S.; Gómez-Ortega, A.; Pérez-Barrera, J. Prediction of Flow Properties of Porous Triply Periodic Minimal Surface (TPMS) Structures. Fluids 2023, 8, 312. [Google Scholar] [CrossRef]
  7. Chen, Z.; Xie, Y.M.; Wu, X.; Wang, Z.; Li, Q.; Zhou, S. On hybrid cellular materials based on triply periodic minimal surfaces with extreme mechanical properties. Mater. Des. 2019, 183, 108109. [Google Scholar] [CrossRef]
  8. Catchpole-Smith, S.; Sélo, R.R.J.; Davis, A.W.; Ashcroft, I.A.; Tuck, C.J.; Clare, A. Thermal conductivity of TPMS lattice structures manufactured via laser powder bed fusion. Addit. Manuf. 2019, 30, 100846. [Google Scholar] [CrossRef]
  9. Attarzadeh, R.; Attarzadeh-Niaki, S.H.; Duwig, C. Multi-objective optimization of TPMS-based heat exchangers for low-temperature waste heat recovery. Appl. Therm. Eng. 2022, 212, 118448. [Google Scholar] [CrossRef]
  10. Vignoles, G.L.; Rochais, D.; Chupin, S. Computation of the conduct-radiative effective heat conductivity of porous media defined by Triply Periodic Minimal Surfaces. Int. J. Therm. Sci. 2021, 159, 106598. [Google Scholar] [CrossRef]
  11. Wei, H.; Bao, H.; Ruan, X. Machine learning prediction of thermal transport in porous media with physics-based descriptors. Int. J. Heat Mass Transf. 2020, 160, 120176. [Google Scholar] [CrossRef]
  12. Cheng, Z.; Li, X.; Xu, R.; Jiang, P. Investigations on porous media customized by triply periodic minimal surface: Heat transfer correlations and strength performance. Int. Commun. Heat Mass Transf. 2021, 129, 105713. [Google Scholar] [CrossRef]
  13. Daish, C.; Blanchard, R.; Pirogova, E.; Harvie, D.J.E.; Pivonka, P. Numerical calculation of permeability of periodic porous materials: Application to periodic arrays of spheres and 3D scaffold microstructures. Int. J. Numer. Methods Eng. 2019, 118, 783–803. [Google Scholar] [CrossRef]
  14. Tang, W.; Zhou, H.; Zeng, Y.; Yan, M.; Jiang, C.; Yang, P.; Li, Q.; Li, Z.; Fu, J.; Huang, Y.; et al. Analysis of the convective heat transfer process and performance evaluation of Triply Periodic Minimal Surface (TPMS) based on Diamond, Gyroid and Iwp. Int. J. Heat Mass Transf. 2023, 201, 123642. [Google Scholar] [CrossRef]
  15. Cheng, Z.; Xu, R.; Jiang, P.X. Morphology, flow and heat transfer in triply periodic minimal surface-based porous structures. Int. J. Heat Mass Transf. 2021, 170, 120902. [Google Scholar] [CrossRef]
  16. Niknam, S.A.; Mortazavi, M.; Li, D. Additively manufactured heat exchangers: A review on opportunities and challenges. Int. J. Adv. Manuf. Technol. 2021, 112, 601–618. [Google Scholar] [CrossRef]
  17. Thompson, S.M.; Aspin, Z.S.; Shamsaei, N.; Elwany, A.; Bian, L. Additive manufacturing of heat exchangers: A case study on a multi-layered Ti–6Al–4V oscillating heat pipe. Addit. Manuf. 2015, 8, 163–174. [Google Scholar] [CrossRef]
  18. Arie, M.A.; Shooshtari, A.H.; Tiwari, R.; Dessiatoun, S.V.; Ohadi, M.M.; Pearce, J.M. Experimental characterization of heat transfer in an additively manufactured polymer heat exchanger. Appl. Therm. Eng. 2017, 113, 575–584. [Google Scholar] [CrossRef]
  19. Iyer, J.; Moore, T.; Nguyen, D.; Roy, P.; Stolaroff, J. Heat transfer and pressure drop characteristics of heat exchangers based on triply periodic minimal and periodic nodal surfaces. Appl. Therm. Eng. 2022, 209, 118192. [Google Scholar] [CrossRef]
  20. Attarzadeh, R.; Rovira, M.; Duwig, C. Design analysis of the “Schwartz D” based heat exchanger: A numerical study. Int. J. Heat Mass Transf. 2021, 177, 121415. [Google Scholar] [CrossRef]
  21. Reynolds, B.W.; Fee, C.J.; Morison, K.R.; Holland, D.J. Characterisation of Heat Transfer within 3D Printed TPMS Heat Exchangers. Int. J. Heat Mass Transf. 2023, 212, 124264. [Google Scholar] [CrossRef]
Figure 1. Experimental setup [1].
Energies 17 00861 g001
Figure 2. The test section with the Gyroid was used for the experiment and the modelling. (a) Printed Gyroid with a porosity = 0.7, (b) Printed Gyroid with a porosity = 0.8, (c) Printed Gyroid with a porosity = 0.9, (d) Model of Gyroid with a porosity of 0.7, (e) Model of Gyroid with a porosity of 0.8, (f) Model of Gyroid with a porosity of 0.9.
Energies 17 00861 g002aEnergies 17 00861 g002b
Figure 3. Metal foam porous material in the test section.
Energies 17 00861 g003
Figure 4. Boundary conditions for both cases. (a) porous block case, (b) Gyroid case.
Energies 17 00861 g004
Figure 5. Experimental measurements and numerical analysis of temperature variation for the metal foam porous block (permeability = 10 PPI). (a) flow rate = 6.31 cm3/s, (b) flow rate = 9.46 cm3/s, (c) flow rate = 11.35 cm3/s, (d) flow rate = 13.88 cm3/s.
Energies 17 00861 g005
Figure 6. Experimental measurements and numerical analysis of local Nusselt number variation for the porous block. (a) Flow rate = 6.31 cm3/s, (b) Flow rate = 9.46 cm3/s, (c) Flow rate = 11.35 cm3/s, (d) Flow rate = 13.88 cm3/s.
Energies 17 00861 g006
Figure 7. Experimental measurement and numerical analysis of temperature for the Gyroid structure for different porosities (a) flow rate = 3.74 cm3/s, (b) flow rate = 7.86 cm3/s, (c) flow rate = 11.8 cm3/s, (d) flow rate = 15.73 cm3/s, (e) flow rate = 19.85 cm3/s.
Energies 17 00861 g007aEnergies 17 00861 g007b
Figure 8. Experimental measurement and numerical analysis of local Nusselt number variation for the Gyroid structure for different porosities (a) flow rate = 3.74 cm3/s, (b) flow rate = 7.86 cm3/s, (c) flow rate = 11.8 cm3/s, (d) flow rate = 15.73 cm3/s, (e) flow rate = 19.85 cm3/s.
Energies 17 00861 g008aEnergies 17 00861 g008b
Figure 9. Experimental measurement and numerical analysis of the Performance Evaluation Criteria for the Gyroid structure for different porosities (a) flow rate = 3.74 cm3/s, (b) flow rate = 7.86 cm3/s, (c) flow rate = 11.8 cm3/s, (d) flow rate = 15.73 cm3/s, (e) flow rate = 19.85 cm3/s.
Energies 17 00861 g009aEnergies 17 00861 g009b
Figure 10. Ratio of Nusselt number using TPMS and the metal foam for porosity of 0.7 (a) Nusselt number ratio, (b) PEC ratio.
Energies 17 00861 g010
Figure 11. Ratio of Nusselt number using TPMS and the metal foam for porosity of 0.8 (a) Nusselt number ratio, (b) PEC ratio.
Energies 17 00861 g011
Figure 12. Ratio of Nusselt number using TPMS and the metal foam for the porosity of 0.9 (a) Nusselt number ratio, (b) PEC ratio.
Energies 17 00861 g012
Table 1. Percentage difference between experimental measurements and numerical calculations for the temperature using metal foam.
Maximum Difference Temperature (%)
Flow rate = 11.35 cm3/s
q″ = 8.3 W/cm2
1.11
Flow rate = 11.35 cm3/s
q″ = 10.3 W/cm2
0.77
Flow rate = 11.35 cm3/s
q″ = 12.96 W/cm2
1.17
Flow rate = 13.88 cm3/s
q″ = 8.3 W/cm2
1.4
Flow rate = 13.88 cm3/s
q″ = 10.3 W/cm2
1.42
Flow rate = 13.88 cm3/s
q″ = 12.96 W/cm2
1.49
Table 2. Percentage difference between experimental measurements and numerical calculations for Nusselt number using metal foam.
Maximum Difference in %Nusselt Number (%)
Flow rate = 6.31 cm3/s
q″ = 8.3 W/cm2
1.5
Flow rate = 6.31 cm3/s
q″ = 10.3 W/cm2
1.31
Flow rate = 6.31 cm3/s
q″ = 12.96 W/cm2
2.49
Flow rate = 9.46 cm3/s
q″ = 8.3 W/cm2
1.16
Flow rate = 9.46 cm3/s
q″ = 10.3 W/cm2
1.34
Flow rate = 9.46 cm3/s
q″ = 12.96 W/cm2
0.93
Table 3. Percentage difference between experimental measurements and numerical calculations for the temperature using TPMS.
Maximum Difference Temperature (%)
Flow rate = 7.86 cm3/s
Porosity = 0.7
2.58
Flow rate = 11.8 cm3/s
Porosity = 0.7
1.84
Flow rate = 11.8 cm3/s
Porosity = 0.8
3.42
Flow rate = 15.73 cm3/s
Porosity = 0.8
7.17
Flow rate = 7.86 cm3/s
Porosity = 0.9
3.46
Flow rate = 11.8 cm3/s
Porosity = 0.9
8.84
Table 4. Percentage difference between experimental measurements and numerical calculations for the local Nusselt number using TPMS.
Maximum Difference in %Nusselt Number (%)
Flow rate = 7.86 cm3/s
Porosity = 0.7
5.03
Flow rate = 11.8 cm3/s
Porosity = 0.7
3.52
Flow rate = 11.8 cm3/s
Porosity = 0.8
5.5
Flow rate = 15.73 cm3/s
Porosity = 0.8
7.17
Flow rate = 7.86 cm3/s
Porosity = 0.9
4.85
Flow rate = 11.8 cm3/s
Porosity = 0.9
13.9
Table 5. Calculated permeability for the Gyroid structure.
Flow Rate κ , φ = 0.7 κ , φ = 0.8 κ , φ = 0.9
3.74 cm3/s1.4019 × 10−7 m22.4696 × 10−7 m23.517 × 10−7 m2
7.86 cm3/s9.61798 × 10−8 m21.7305 × 10−7 m21.9663 × 10−7 m2
11.8 cm3/s7.69154 × 10−8 m25.7362 × 10−9 m21.3928 × 10−7 m2
15.73 cm3/s6.50458 × 10−8 m21.1638 × 10−7 m21.0933 × 10−7 m2
19.85 cm3/s5.66955 × 10−8 m29.955 × 10−8 m28.9289 × 10−8 m2
Average8.7 × 10−8 m21.2834 × 10−7 m21.772 × 10−7 m2
Disclaimer/Publisher’s Note: The statements, opinions and data contained in all publications are solely those of the individual author(s) and contributor(s) and not of MDPI and/or the editor(s). MDPI and/or the editor(s) disclaim responsibility for any injury to people or property resulting from any ideas, methods, instructions or products referred to in the content.

