Article

Study on Numerical Simulation of Gas–Water Two-Phase Micro-Seepage Considering Fluid–Solid Coupling in the Cleats of Coal Rocks

1
College of Energy, Chengdu University of Technology, Chengdu 610059, China
2
Sichuan Institute of Energetical and Geological Survey, Chengdu 610072, China
*
Author to whom correspondence should be addressed.
Energies 2024, 17(4), 928; https://doi.org/10.3390/en17040928
Submission received: 3 December 2023 / Revised: 9 February 2024 / Accepted: 11 February 2024 / Published: 16 February 2024

Abstract

:
The increasing demand for natural gas energy will promote unconventional natural gas, such as coal seam gas and shale gas, to play a key role in future energy development. The mechanical properties of coal seams are weaker compared with conventional natural gas reservoirs. The fluid–solid coupling phenomenon exists widely at the pore scale and macro scale of coal seams, and runs through the whole process of coalbed gas exploitation. The objective of this study is to establish a microscale gas–water flow model for coalbed methane considering fluid structure coupling. Frist, this study used scanning electron microscopy (SEM) to obtain microscopic pore images of coal rocks. Then, we constructed a numerical model to simulate the movement of coalbed methane and water within the scale of coal cleats based on the Navier–Stokes equation, phase field method, and solid mechanics theory. Finally, we analyzed the effects of injection pressure and wettability on the microscopic two-phase seepage characteristics and displacement efficiency of coal. Our research shows that when the injection pressure is increased from 60 kPa to 120 kPa, the displacement completion time is shortened from 1.3 × 10⁻⁴ s to 7 × 10⁻⁵ s, and the time is doubled, resulting in a final gas saturation of 98%. The contact angle increases from 45° to 120°, and the final gas saturation increases from 0.871 to 0.992, an increase of 12.2%.

1. Introduction

In an original coal reservoir, water and free gas occupy the coal cleat network space, and are mainly composed of formation water [1,2]. The cleats of a coal seam are mainly caused by the change in the coal material structure in the process of coalification. Cleats are massively developed as natural fractures, and are usually present in two sets that are perpendicular to the bedding and also mutually perpendicular. In terms of their size, cleats are meso-fractures [3]. In the process of CBM development, according to the production of gas and water, the extraction process can be divided into three stages: the drainage stage, stable production stage, and decreasing stage [4,5]. Based on the type of fluid, the mining process can be divided into the single-phase water stage, gas–water two-phase flow stage, and single-phase gas stage [6,7]. It can be seen that the gas–water two-phase flow stage corresponds to the gas production increase stage. At this time, the bottomhole flow pressure fluctuates violently, and is prone to reservoir damage [8]. It is the key to controlling the gas–water two-phase flow stage for gas production [9]. Therefore, it is very important for the efficient development of coalbed methane wells to model the two-phase fluid flow and analyze the flow law of the two-phase fluid.
In the two-phase flow stage, the water in the coal fracture network continues to be produced, and the water saturation decreases continuously until there is only bound water left, that is, it enters the single-phase gas stage [8,10]. A large number of scholars have conducted experimental and numerical simulation studies on the gas–water two-phase flow law in CBM development. A core pore scale numerical model of oil–water two-phase considering thermal fluid–solid coupling has been established. The simulation results indicate that a low surface tension coefficient can improve water flooding efficiency and may also cause water breakthrough [11]. Li established a model that comprehensively considered the effects of coal deformation, gas–water two-phase seepage, and heat transfer, and the simulation results showed that the effect of temperature on the production of coalbed methane could not be ignored. CBM production decreases with an increase in the reservoir temperature, initial water saturation, and Langmuir strain constant, and increases with an increase in the Klinkenberg effect [12]. Sun et al. proposed a coalbed methane two-phase flow production model considering the pressure gradient and saturation gradient, and used a commercial numerical simulator (CMG) to simulate it. Their results indicate that the production capacity of coalbed methane wells is greatly affected by stress sensitivity, followed by adsorption desorption effects [13]. Yang established a fully coupled model of two-phase seepage and coal deformation based on gas dynamic diffusion [14], and concluded that simplifying coalbed methane extraction as a single-phase flow process will overestimate gas production in the early stage. Zeguai and Mao used experimental and numerical simulation methods to study the flow characteristics of a two-phase mixture of gas and water in a vertical pipeline [15,16]. The macroscopical multi-physical coupling seepage model established by the above scholars has a certain guiding role in the prediction of coalbed methane productivity, but the research on the microscopic seepage mechanism of coalbed methane is not sufficient. Traditional porous media seepage studies mainly focus on the phenomenological description and generalized simulation of macroscopic physical phenomena, and the study of its microscopic mechanism and physical nature is not perfect. The macroscopic model based on the continuum hypothesis ignores the characteristics of microscopic pore structures and generalizes the complex microscopic characteristics of porous media by setting macroscopic parameters, which makes it difficult to reflect the phenomena of multiphase seepage, pointing effect, and retarding at a microscopic scale.
Bai et al. established a gas–water two-phase numerical model with fluid–solid coupling in microscopic fractures of coal rock [17]. Based on the model, the potential regions where coal powder may be generated under different flow states were analyzed, and a criterion for the generation of coal powder was proposed. Their research shows that coal powder is easily generated in the two-phase flow stage, and most of the coal powder is accompanied by residual water distribution. Ma et al. considered the influence of effective stress and fracture deformation caused by desorption shrinkage on two-phase fluid flow [18], established a fully coupled two-phase flow model for coalbed methane wells, and used COMSOL Multiphysics 6.1 for numerical simulation to analyze the mechanical properties of coal, adsorption–desorption effects, and the influence of fracture deformation on coalbed methane well production. Zhu established a gas–water two-phase flow model for coal reservoirs [19], demonstrating the difference in stress sensitivity between hydraulic fracturing zones and original coal reservoirs on production. Dong studied the two-phase flow of coalbed methane reservoirs in multi-fracture horizontal wells [20] using the finite difference method and binary method to solve the mathematical model and verifying the solution of the semi-analytical model. The above research indicates that geomechanical effects and two-phase seepage mechanism have an important influence on CBM flow [21,22]. Xu et al. built a multi-scale dynamic transparent diffusion percolation model. The conversion relationship between the dynamic apparent diffusion coefficient and the apparent dynamic permeability was obtained according to the principle of mass conservation, which is useful for studying the intrinsic permeability of coal [23].
Two-phase flow and coal matrix deformation exist throughout the entire process of coalbed methane extraction [12,14]. At present, research on the two-phase flow of coal rock and fluid–solid coupling mainly focuses on the macro scale, and there is relatively little research on the micro-scale, making it difficult to intuitively describe the gas–water two-phase flow process and residual water distribution characteristics in real coal cleats [24]. How to accurately simulate the fluid–structure coupling behavior of coalbed methane reservoirs at the micro-scale is a key scientific problem that needs to be solved urgently.
Therefore, this article will analyze the distribution and flow path of gas–water two-phase flow at the microscopic scale by constructing a coal cleat-scale fluid–solid coupling two-phase flow model. The model is solved numerically by COMSOL Multiphysics software. This software is based on the finite element method, which can simulate the real physical scene by solving partial differential equations (single field) or partial differential equations (multi-field). The model can be used to study the micro-scale gas–water two-phase flow laws and influencing factors of coalbed methane under fluid–solid coupling. This is necessary for improving the micro-scale multi-field coupling flow theory of coal rocks.

2. Governing Equations

2.1. Assumptions

Based on the microscopic pore images obtained by scanning electron microscopy (SEM), a pore-scale physical model of coal cleat is reconstructed. Based on Navier–Stokes (N-S equation), the phase field method, and solid mechanics theory, a two-phase porous flow model of coal rock under the fluid–solid coupling effect is established. The model simulates the fluid–solid coupling gas–water two-phase flow in coal cleats, tracks the two-phase interface and seepage path, and discusses the characteristics of micro-two-phase seepage and the factors affecting displacement.
The micro-seepage, solid deformation, and fluid–structure interaction of coal are defined and described based on the Navier–Stokes (N-S) equation, phase field method, and solid mechanics theory. A mathematical model for microscopic gas–water two-phase flow is established considering the fluid–structure interaction. The establishment of this model is based on the following basic assumptions:
(1)
Both the gas and water phases are incompressible fluids (Cphi = 0), and there is no material exchange between them [25].
(2)
The isothermal condition means that gas properties such as viscosity and density do not change with the system temperature (T = constant) [4,11].
(3)
The two-dimensional model has no height difference in the vertical direction. Fluid flow in the cleat follows the Navier–Stokes equation, ignoring the influence of gravity [26].
(4)
The fluid is continuous and has no voids inside, such as no dissolved bubbles, aggregation without foggy particles, etc.
(5)
COMSOL Multiphysics software simulates real physical phenomena by solving partial differential equations. Therefore, all fields involved in the model are differentiable, such as pressure field, saturation field, stress field, etc. [11].

2.2. Fluid Flow

The Navier–Stokes (N-S) equation is used to describe the momentum conservation of viscous fluids based on the assumption of continuous media, which can be regarded as Newton’s second law of fluid flow. Considering the effect of surface tension, the fluid flow in the cleat is described in the following equation [27]:
ρ u t + ρ u · u = p + · τ + F
where ρ is the density of the fluid, t is time, u is the velocity, τ is the shear stress, p is the pressure of the fluid, and F is the surface tension of the two phases.
The N-S equation consists of an inertia term, a pressure term, a viscosity term, and an external force term acting on the fluid, where the viscosity term can be expressed as
τ = μ u + u T 2 3 μ · u I
where μ is the viscosity.
For immiscible incompressible Newtonian fluid, the governing equation for describing fluid flow in the cleat is
ρ u t + ρ u · u = p + · μ u + u T + F

2.3. Phase Field Method

There are significant differences in density and viscosity between coalbed methane and formation water. In this paper, the N-S/Cahn–Hilliard equations are used to trace the interface movement of two-phase flow. In the phase field method, the phase field variable ( φ ) represents the physical state of the system under space–time evolution [28]. Ignoring the temperature, the following equation describes the density model of the mixture of free energy for the interface of two-phase flow in the cleat:
F = v f 0 φ + 1 2 β φ 2 d V
where V is the flow area, f 0 φ is the volumetric energy density, and β is the mixing energy density.
f 0 φ = β 4 ε 2 ( φ 2 1 ) 2
In Equation (5), ε is the e capillary width that scales with the interface thickness.
The relationship among surface tension coefficient, mixed tensor density, and interface thickness is expressed as
σ = 2 2 β 3 ε
The diffusion volume flow rate in the interface region is the product of fluidity and the chemical potential gradient. According to the fluid volume conservation, the Cahn–Hilliard equation can be expressed as
φ t + u · φ = · γ G
The standard Galerkin finite element method is used to solve the above equation, which can be expressed as
φ t + u · φ = · γ β ε 2 ψ
ψ = · ε 2 φ + φ φ 2 1 + ε 2 β f e x t φ
where ψ is the phase field help variable, γ is the mobility, and f e x t is the external free energy density.
In the phase field model, the relationship between the surface tension and two-phase diffusion interface is expressed as
F = G ϕ
where ϕ is the phase field variable.
The surface tension of the phase field can be calculated through phase field variables and auxiliary phase field variables.
G = β 2 ϕ + ϕ ϕ 2 1 ε 2 = β ε 2 ψ
The volume fractions of gas and water phases in the phase field model of coal cleats can be expressed as
V f n = 1 + ( 1 ) n ϕ 2 n = 1 , 2
where n = 1 is the gas phase, and n = 2 is the water phase.
The physical properties of the fluid are expressed as
ρ = ρ g + ρ w ρ g V f 2 μ = μ g + μ w μ g V f 2
where ρ g is the density of gas, ρ w is the density of water, μ g is the viscosity of gas, and μ w is the viscosity of water.

2.4. Solid Mechanics

The constitutive equation of the coal matrix is given by
σ i j = p δ i j + D i j k l V k l
where σ i j is the stress tensor load exerted on the cleat surfaces by the fluid flow, D i j k l is the viscosity coefficient tensor, and δ i j is the Kronecker tensor.
The viscosity coefficient in the above equation is a fourth-order isotropic tensor with symmetry and can be represented by two independent elastic constants:
D i j k l = λ δ i j δ k l + μ δ i k δ j l + δ i l δ j k
where λ , μ is the Lamé constant.
The tensor form of the constitutive equation of coal matrix can be expressed as
σ = p I + 2 μ V + μ 2 3 μ · u I
The divergence of velocity is zero for incompressible fluids; the above equation can be simplified as
σ = p I + 2 μ V
V = 1 2 u + u T
where V is the strain rate tensor.

3. Numerical Model of Microscopic Two-Phase Flow in Coal and Rock

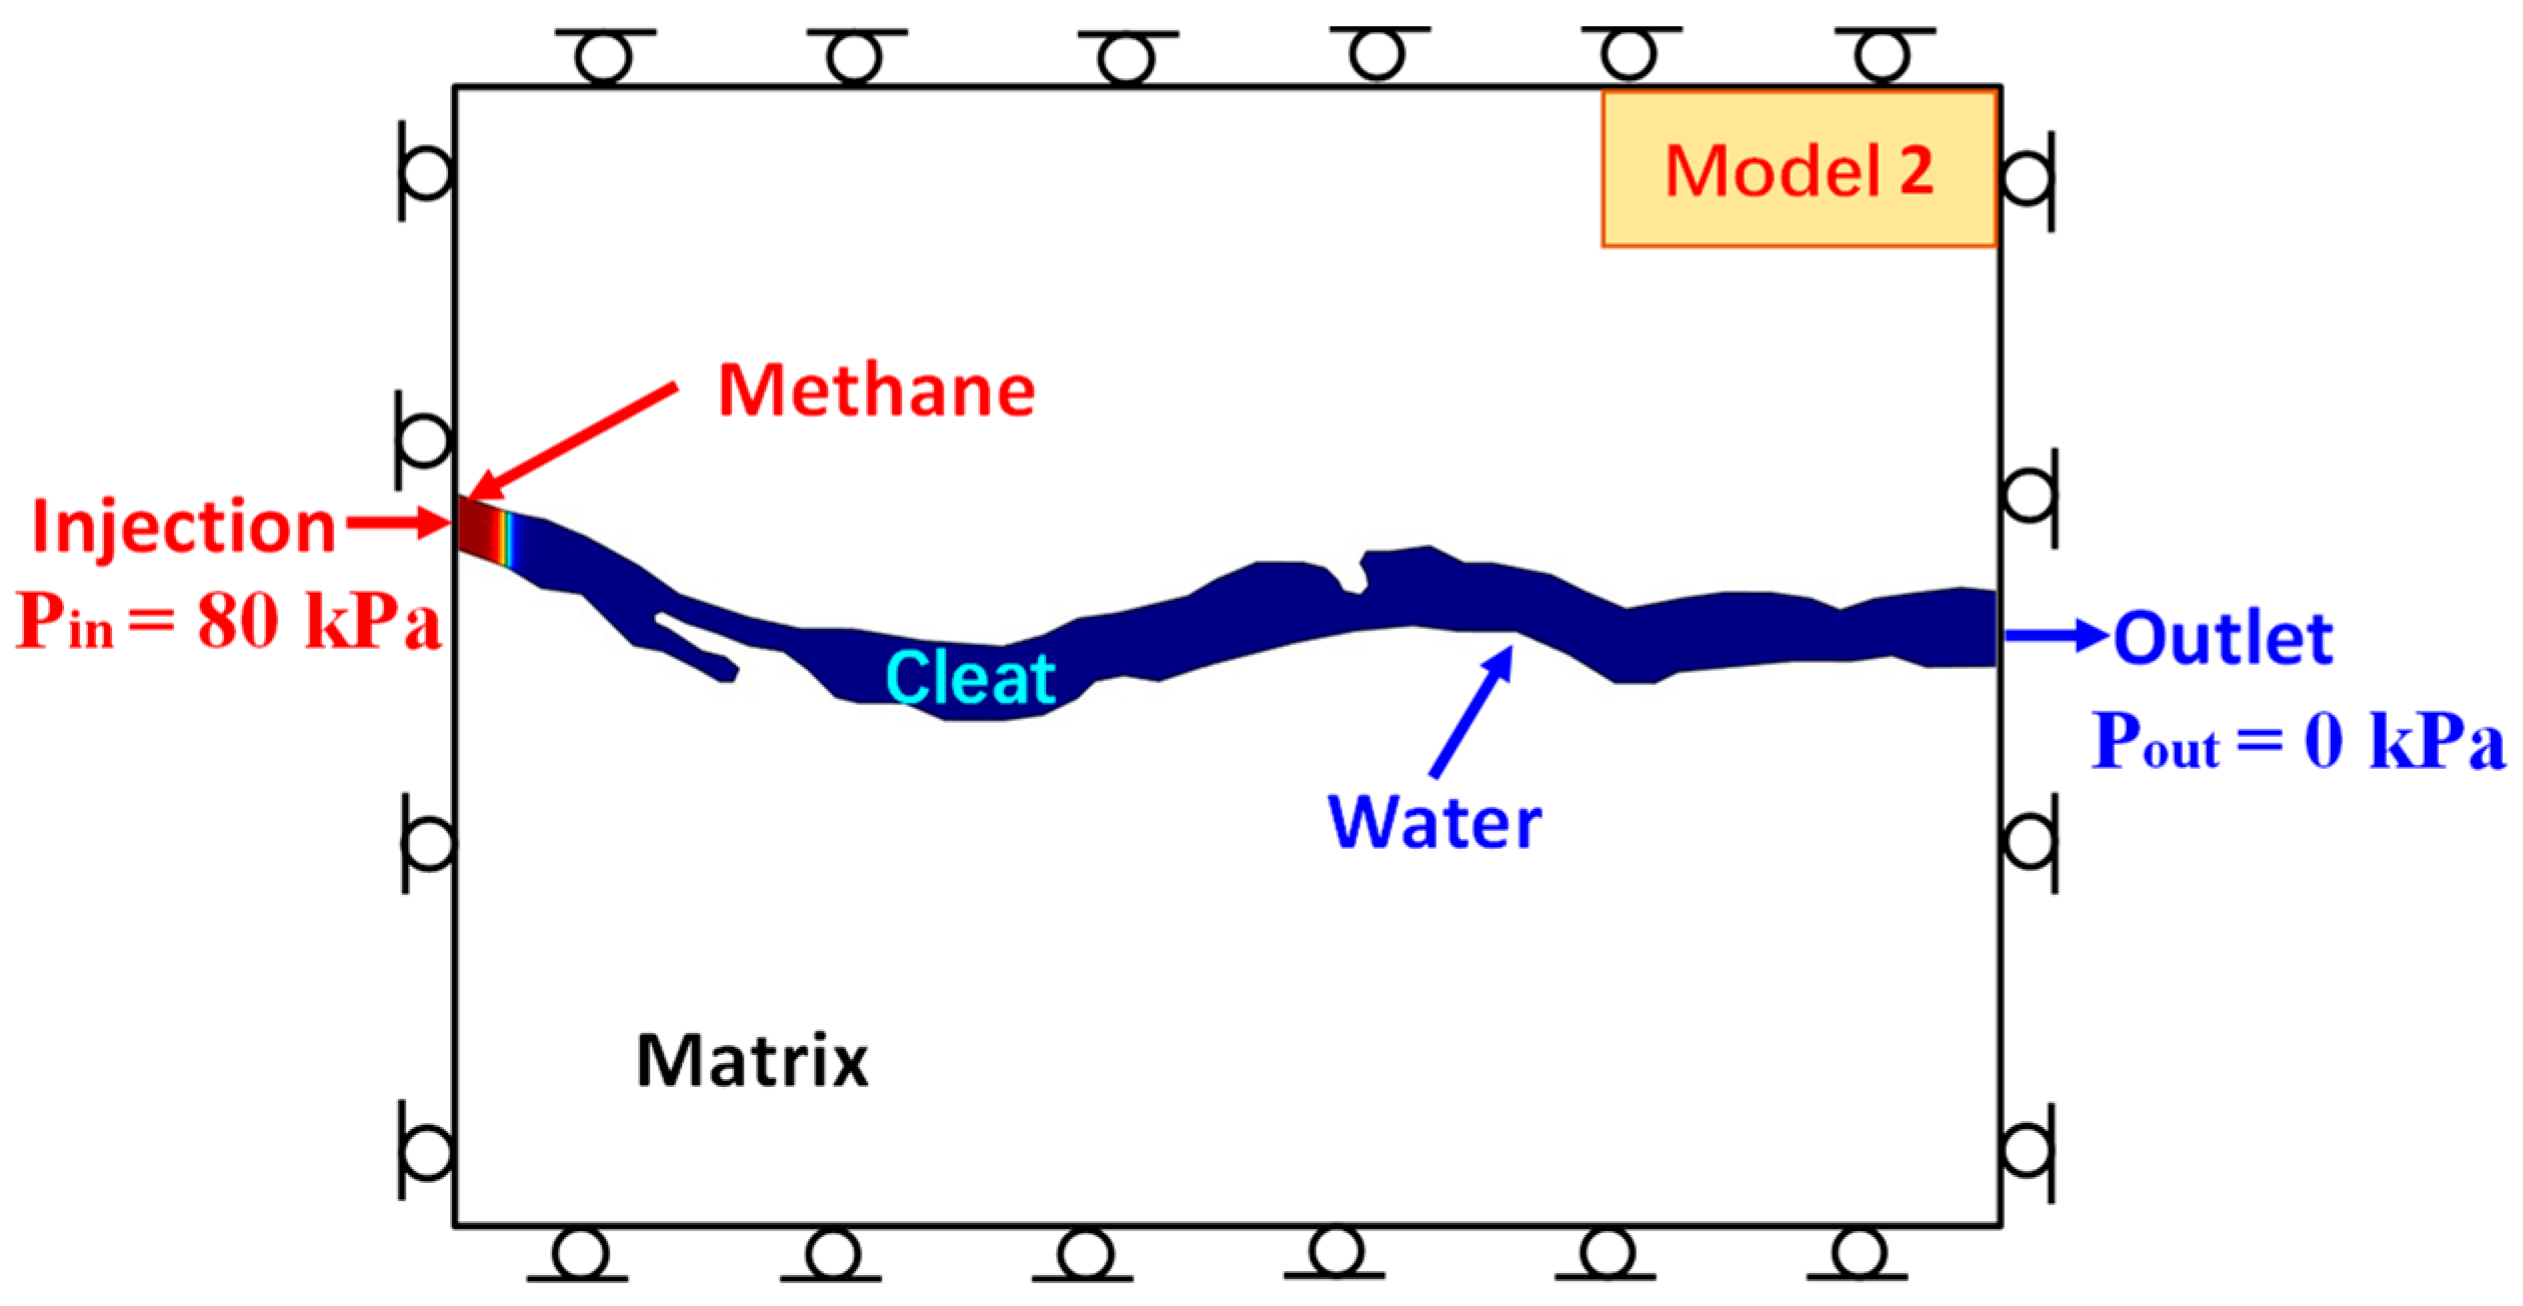
3.1. Geometric Model

In this paper, there are two research models that selected from the core of Qinshui Basin, the true coal cleat contours of which were obtained using SEM. The SEM images were then manipulated by image recognition technology to achieve the real geometries of the cleats that could be implemented in COMSOL Multiphysics, as shown in Figure 1. This geometric model is the numerical simulation calculation area for the micro-two-phase flow of coal, the size of which is 31.25 μm × 41.67 μm for every model.

3.2. Boundary Conditions

In their initial state, the coal cleats are saturated by the water phase. On the left is the injection port, injecting single-phase methane gas with a pressure of 80 kPa, and on the right is the outlet port with a pressure of 0 kPa, as shown in Figure 2. According to the Young Laplace equation, the displacement pressure is sufficient to overcome the capillary force inside the coal cleat and drive the two-phase flow. In the geometric model, the blue area represents the coal cleat, and outside of the blue area represents the coal matrix.
The initial state equations for the injection and outlet ends are expressed as
n · μ u + u T = 0     p = p 0 n · μ u + u T = 0     p = p 1
The boundary condition of coal cleat surface when intermediate wettability is expressed as
u · n wall = 0

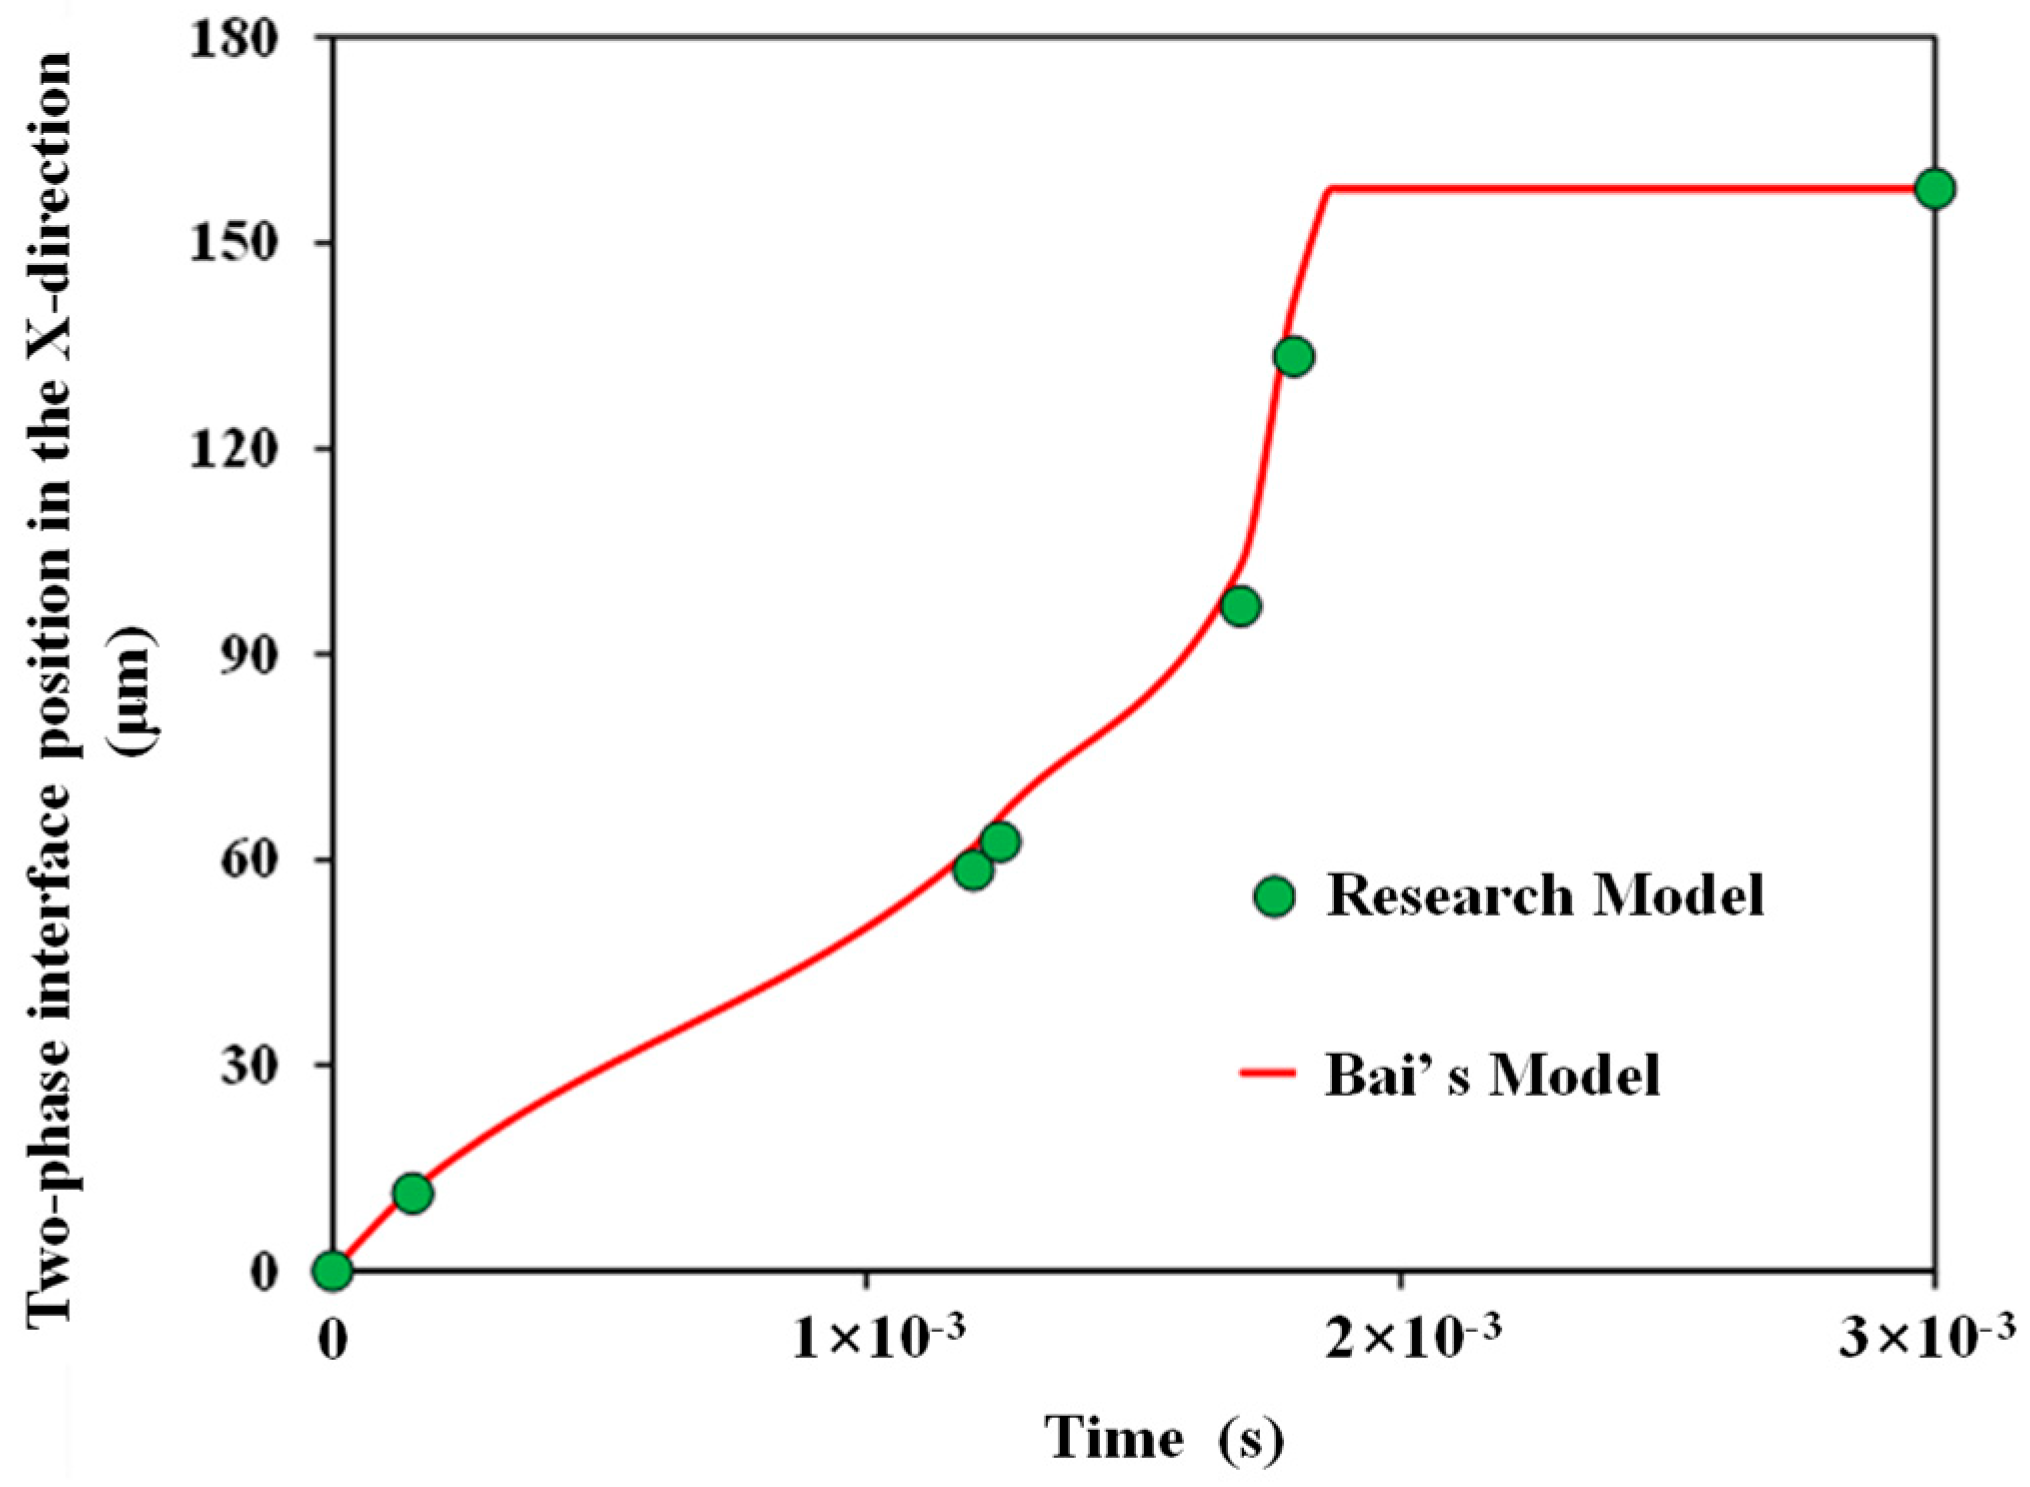
3.3. Validation of Simulation Method

The research model that was established in this paper was compared with Bai’s model regarding the two-phase interface position along the x-direction at different displacement times through two-phase flow in the same coal cleat to verify the simulation method [17]. The comparison of the positions along the x-direction of the two-phase interface position between our research model and Bai’s model at different displacement times (t = 1.5 × 10⁻⁴ s, 1.2 × 10⁻³ s, 1.25 × 10⁻³ s, 1.7 × 10⁻³ s, 1.8 × 10⁻³ s, and 3.0 × 10⁻³ s) is presented Figure 3. The calculation results of the research model and Bai’s model are in good agreement, with a maximum relative error of 6.19% between the two models. Therefore, we can confirm the accuracy of the two-phase flow simulation model with liquid–solid coupling.

4. Results and Discussion

Details of the input parameters of the model can be found in Table 1, which are derived from the relevant literature and indoor experimental data. The solution of the model includes the calculation of both the pressure field and saturation field. This paper focuses on the gas–water two-phase flow behavior in microscopic coal cleats. When the gas phase saturation reaches a constant state, it is considered to enter a stable state, and the simulation solution time ends.

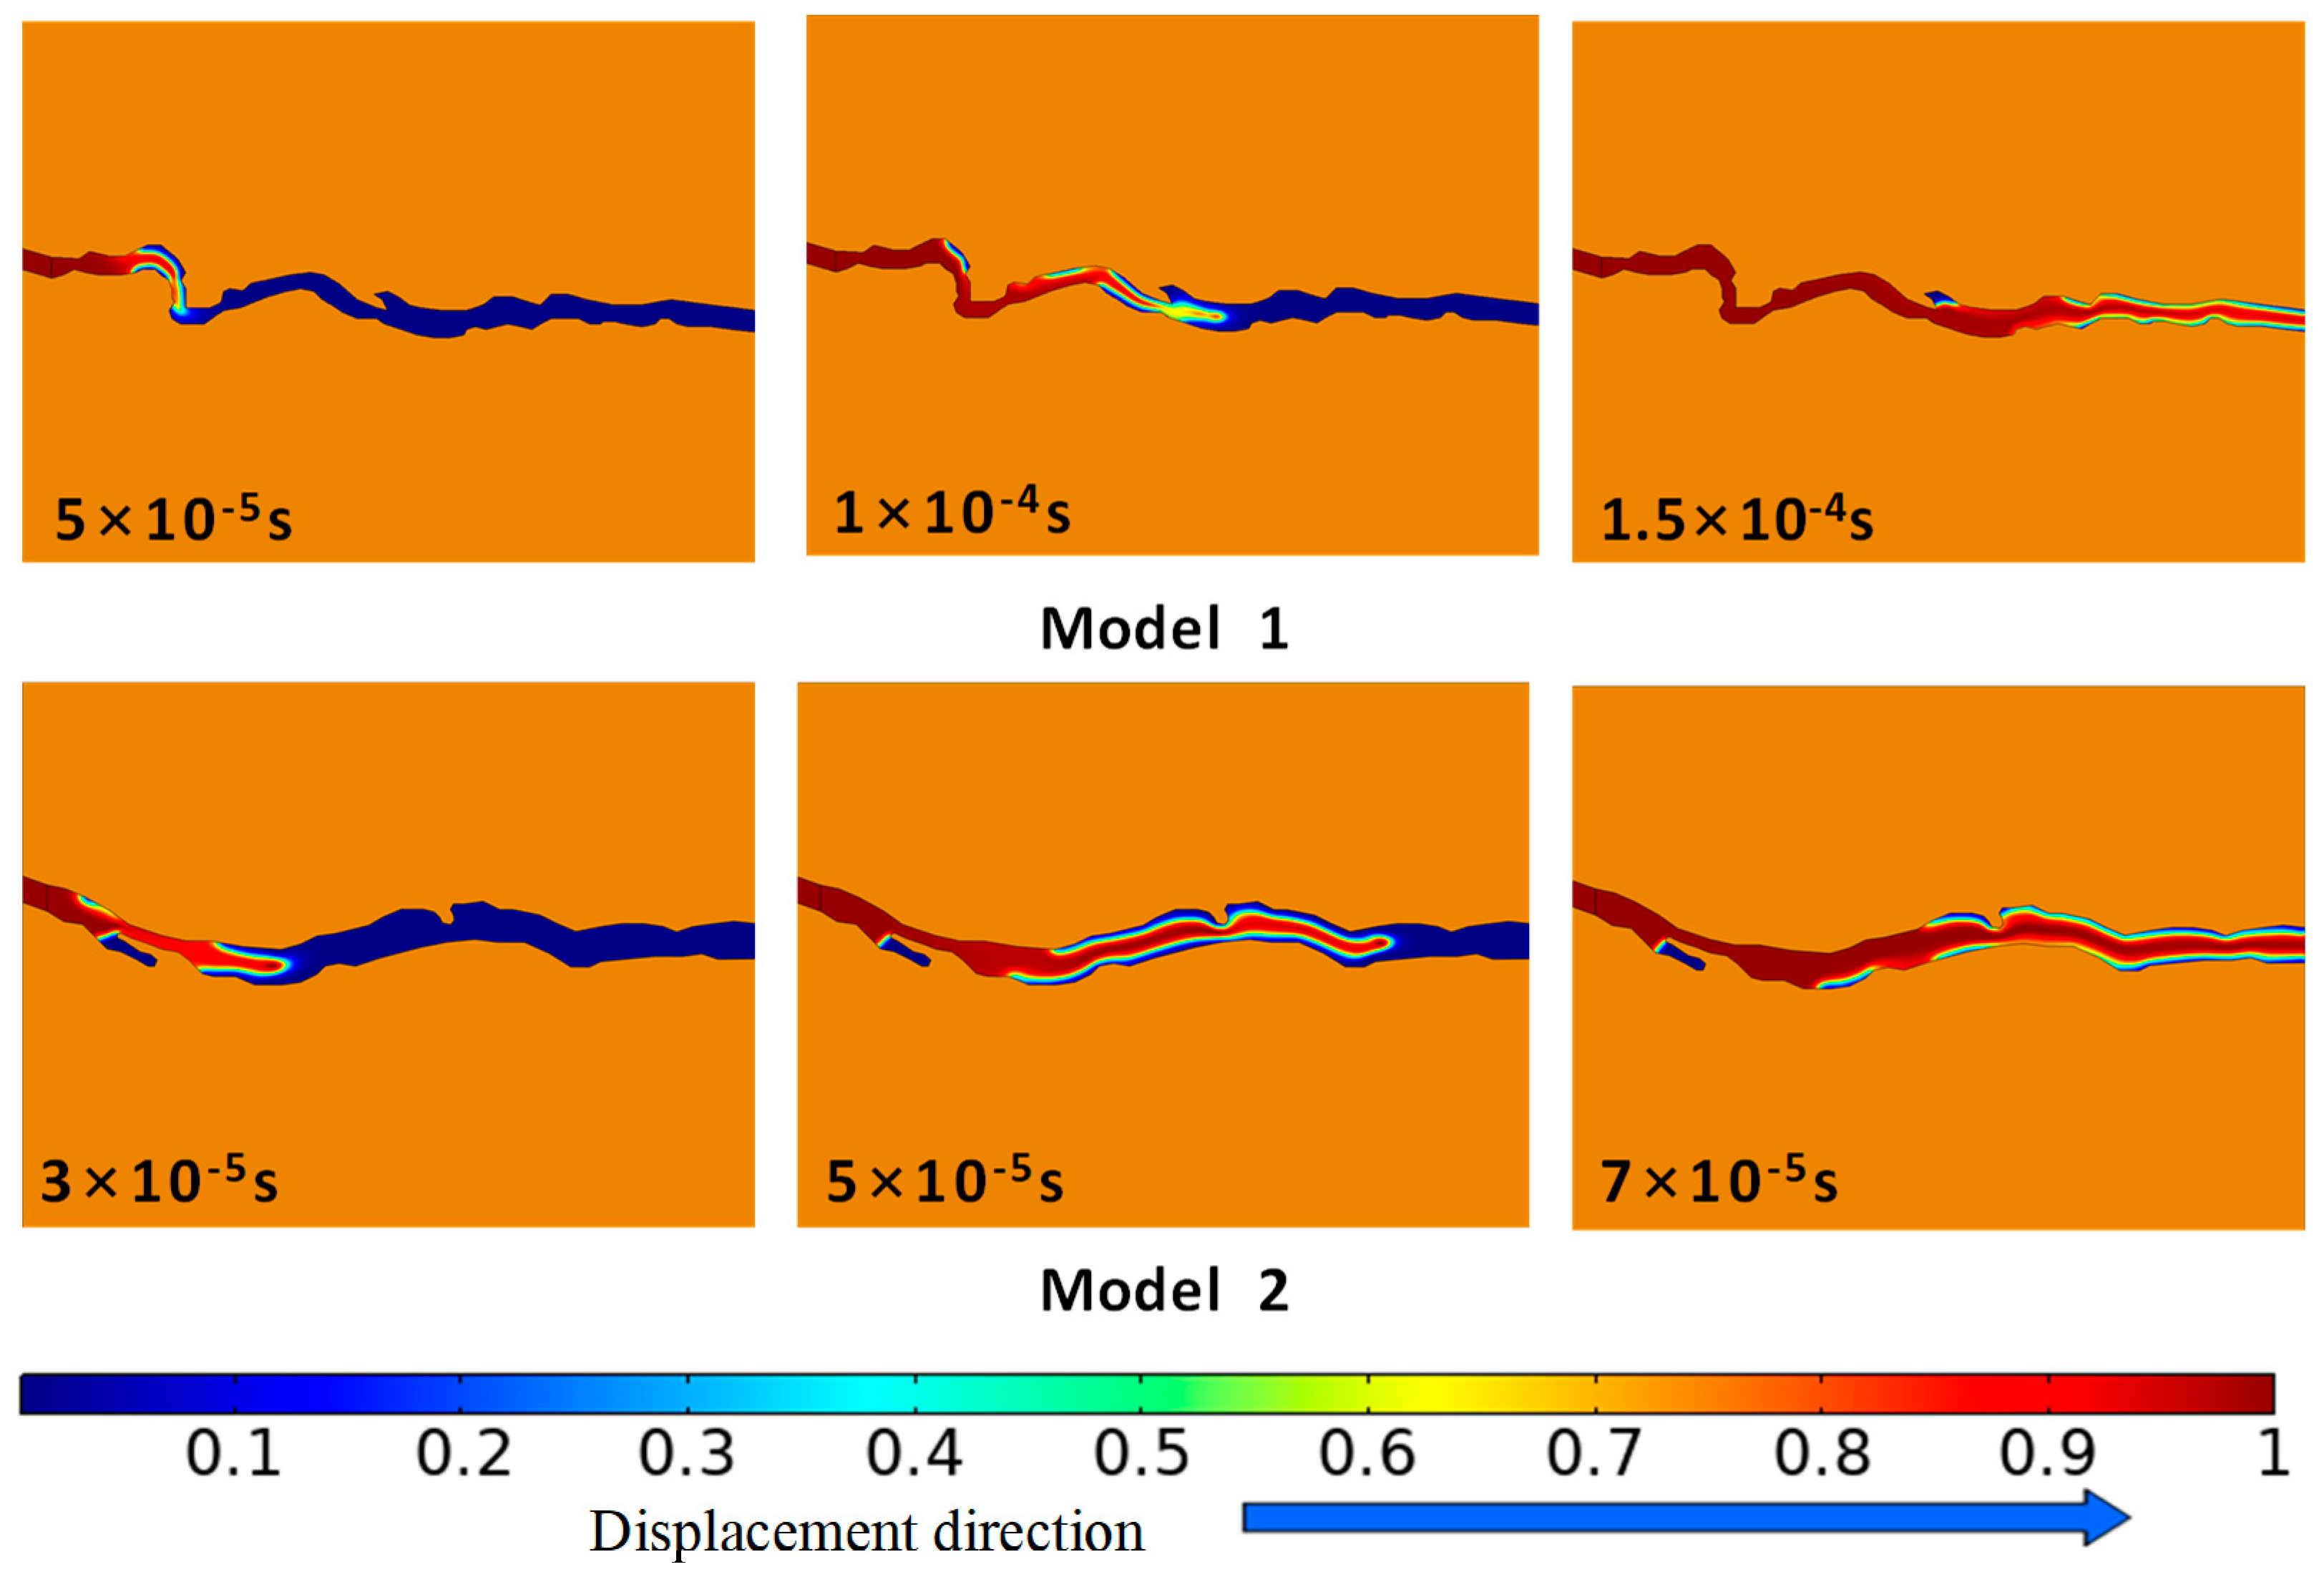
4.1. Analysis of Two-Phase Flow Interface

Single-phase water flow occurs during the initial stage of displacement, and the two-phases flow appears during the displacement process, while single-phase gas flow takes place after late production stage. Due to the large difference in the viscosity between gas and water, a viscous fingering phenomenon appears at the displacement front.
The average openings of the coal cleat of Model 1 and Model 2 are 1.24 µm and 1.84 µm, respectively, indicating that the displacement efficiency of the two models is also different. In Figure 4, the time taken for the gas phase displacement front to reach the outlet is 1.5 × 10⁻⁴ s for Model 1, while the gas phase displacement front of Model 2 arrives at 7 × 10⁻⁵ s. Compared with Model 2, Model 1 has a smaller average coal cleat opening and a more complex flow path, resulting in lower displacement efficiency. At the same time, both Model 1 and Model 2 have dead end, resulting in the formation water at that location still being difficult to displace and forming bound water until the displacement is completed.

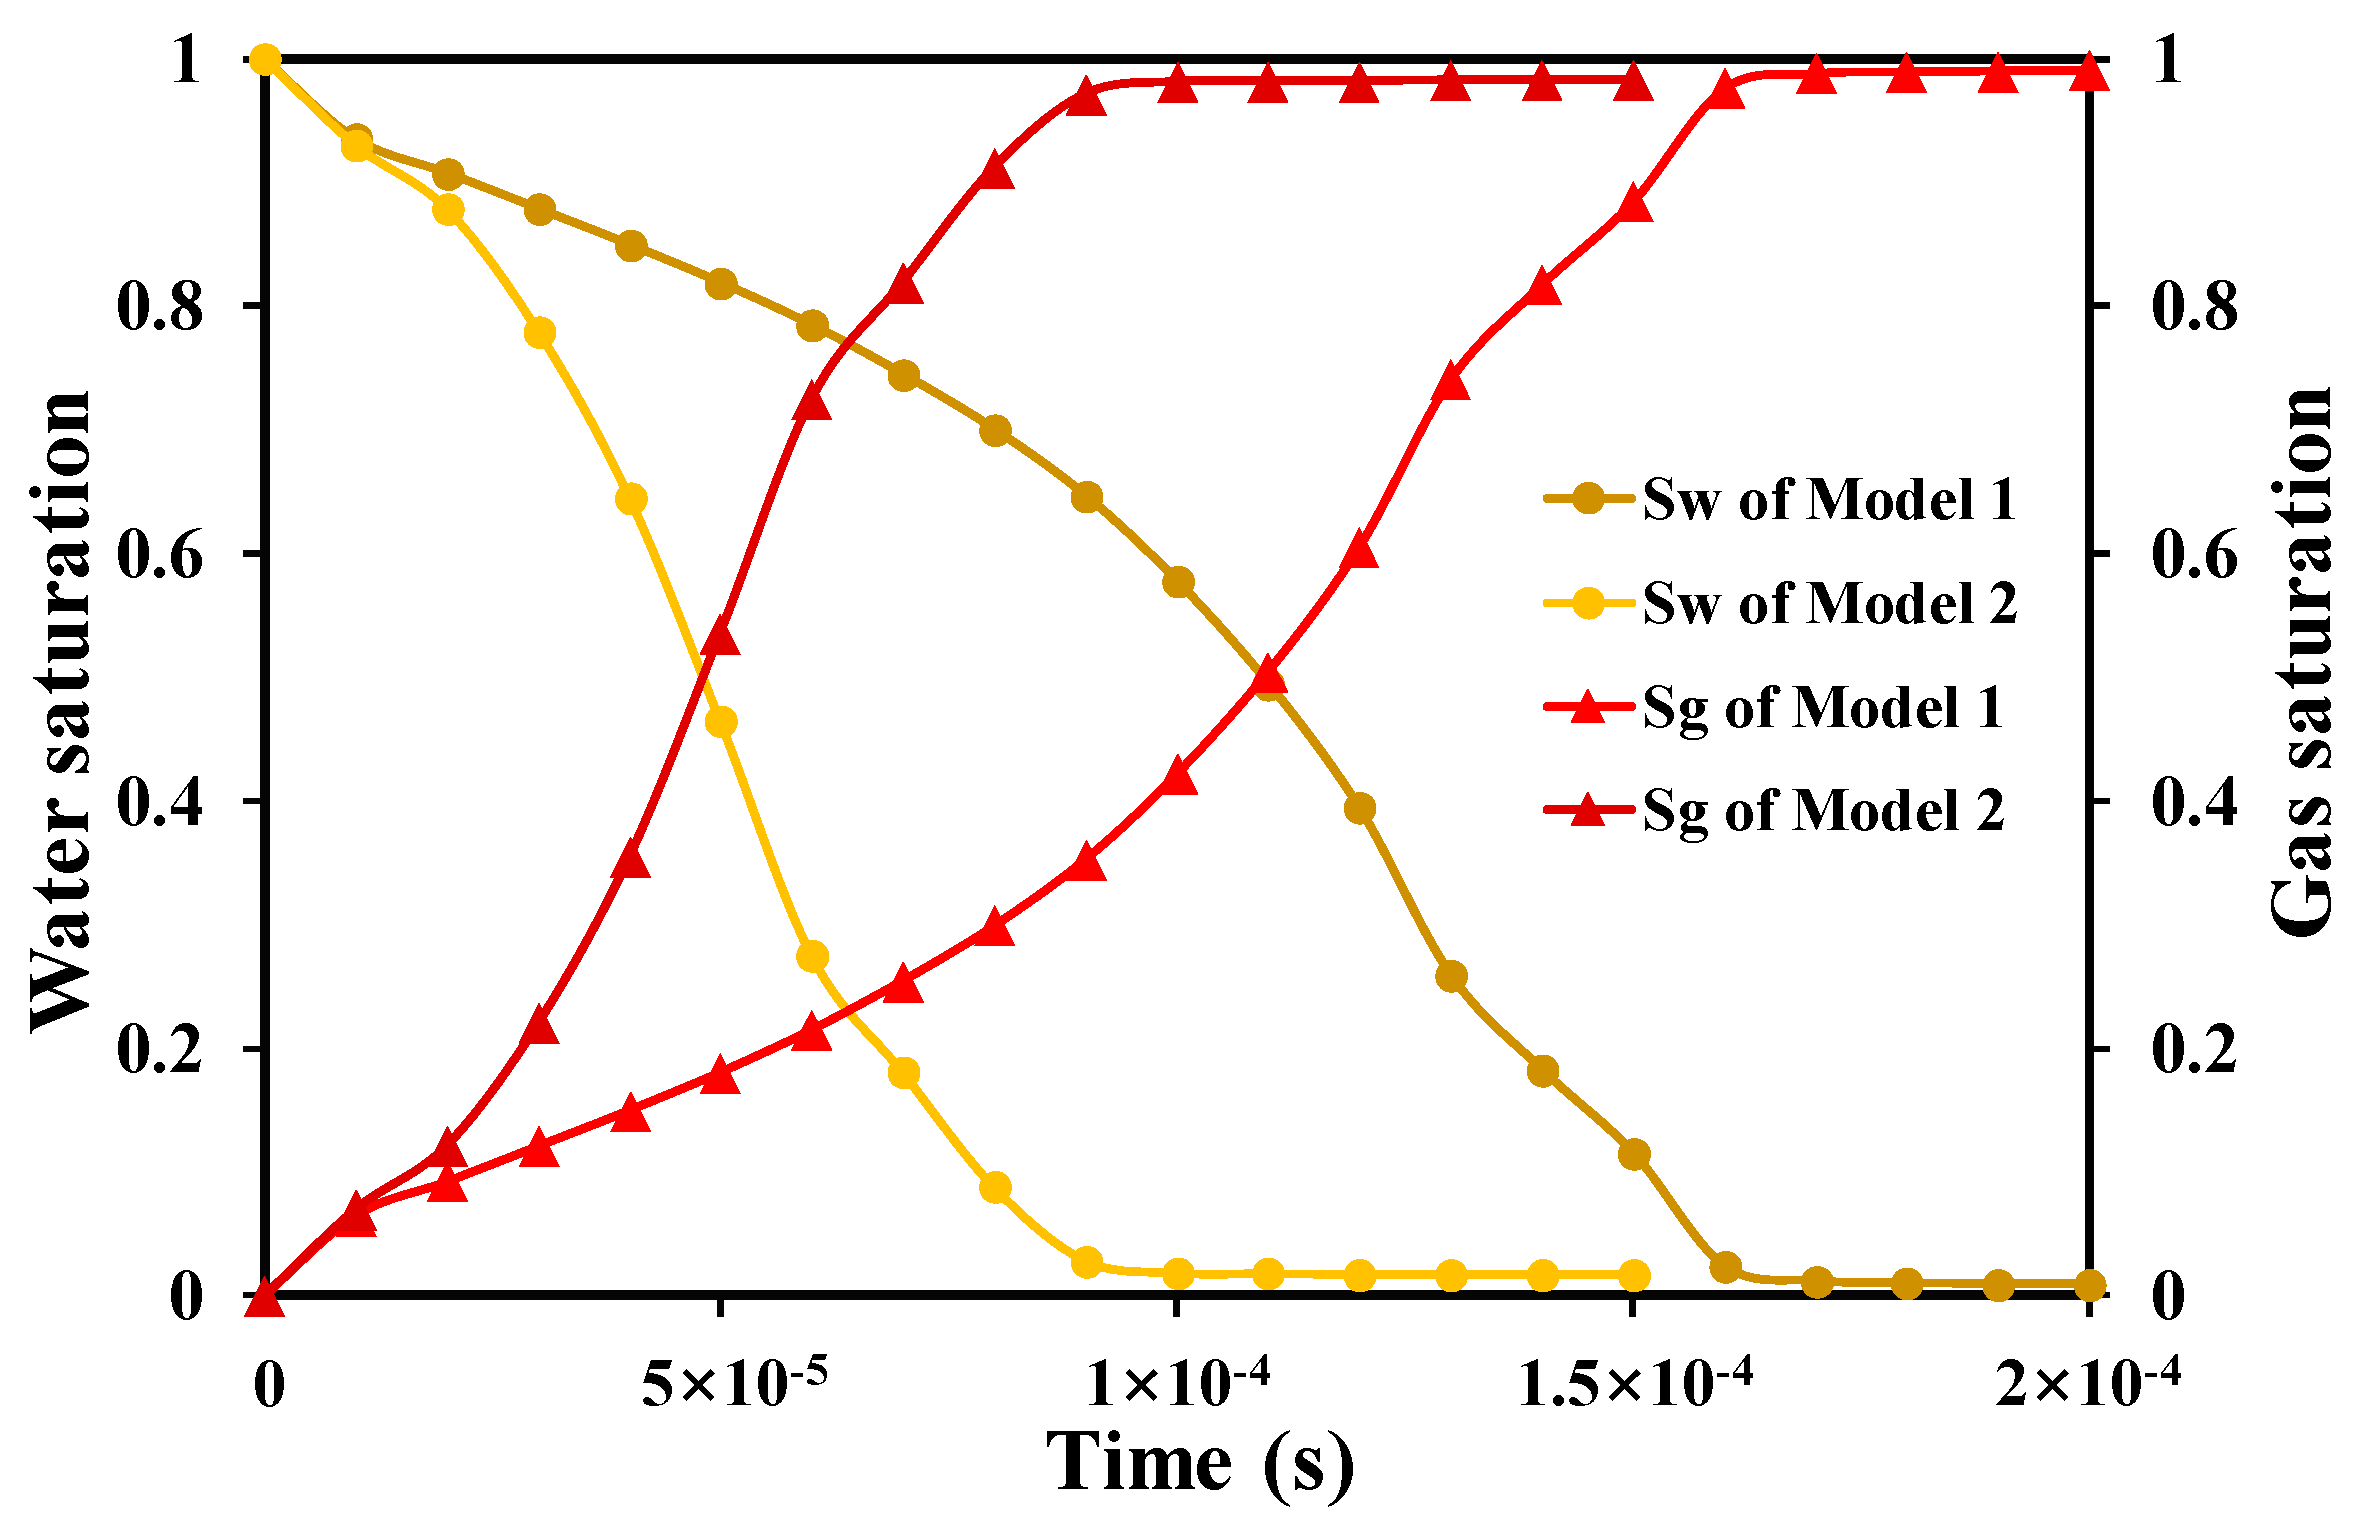
4.2. Contrast of Two-Phase Saturation

With the injection of the gas phase, the gas saturation gradually increases and the water saturation gradually decreases. Combined with Figure 4 and Figure 5, the entire displacement process can be divided into three time periods. (1) The formation stage of the two-phase displacement path, during which the gas-phase displacement front has not yet reached the outlet end. In the coal cleat zones, the gas phase rapidly occupies the main flow space, which means that the water saturation decreases rapidly, while the gas saturation increases rapidly. (2) The displacement stage of the cleat wall water, where the front edge of gas phase displacement reaches the outlet end. In the displacement zone, the gas phase occupies more than 98% of the flow space, leaving only a small amount of bound water in the coal cleat walls or dead ends that has not been displaced. (3) The stable production stage of single-phase fluid, during which the gas saturation does not rise any more. The final water saturation values for Model 1 and Model 2 are 0.009 and 0.017, respectively.

4.3. Analysis of Sensitivity

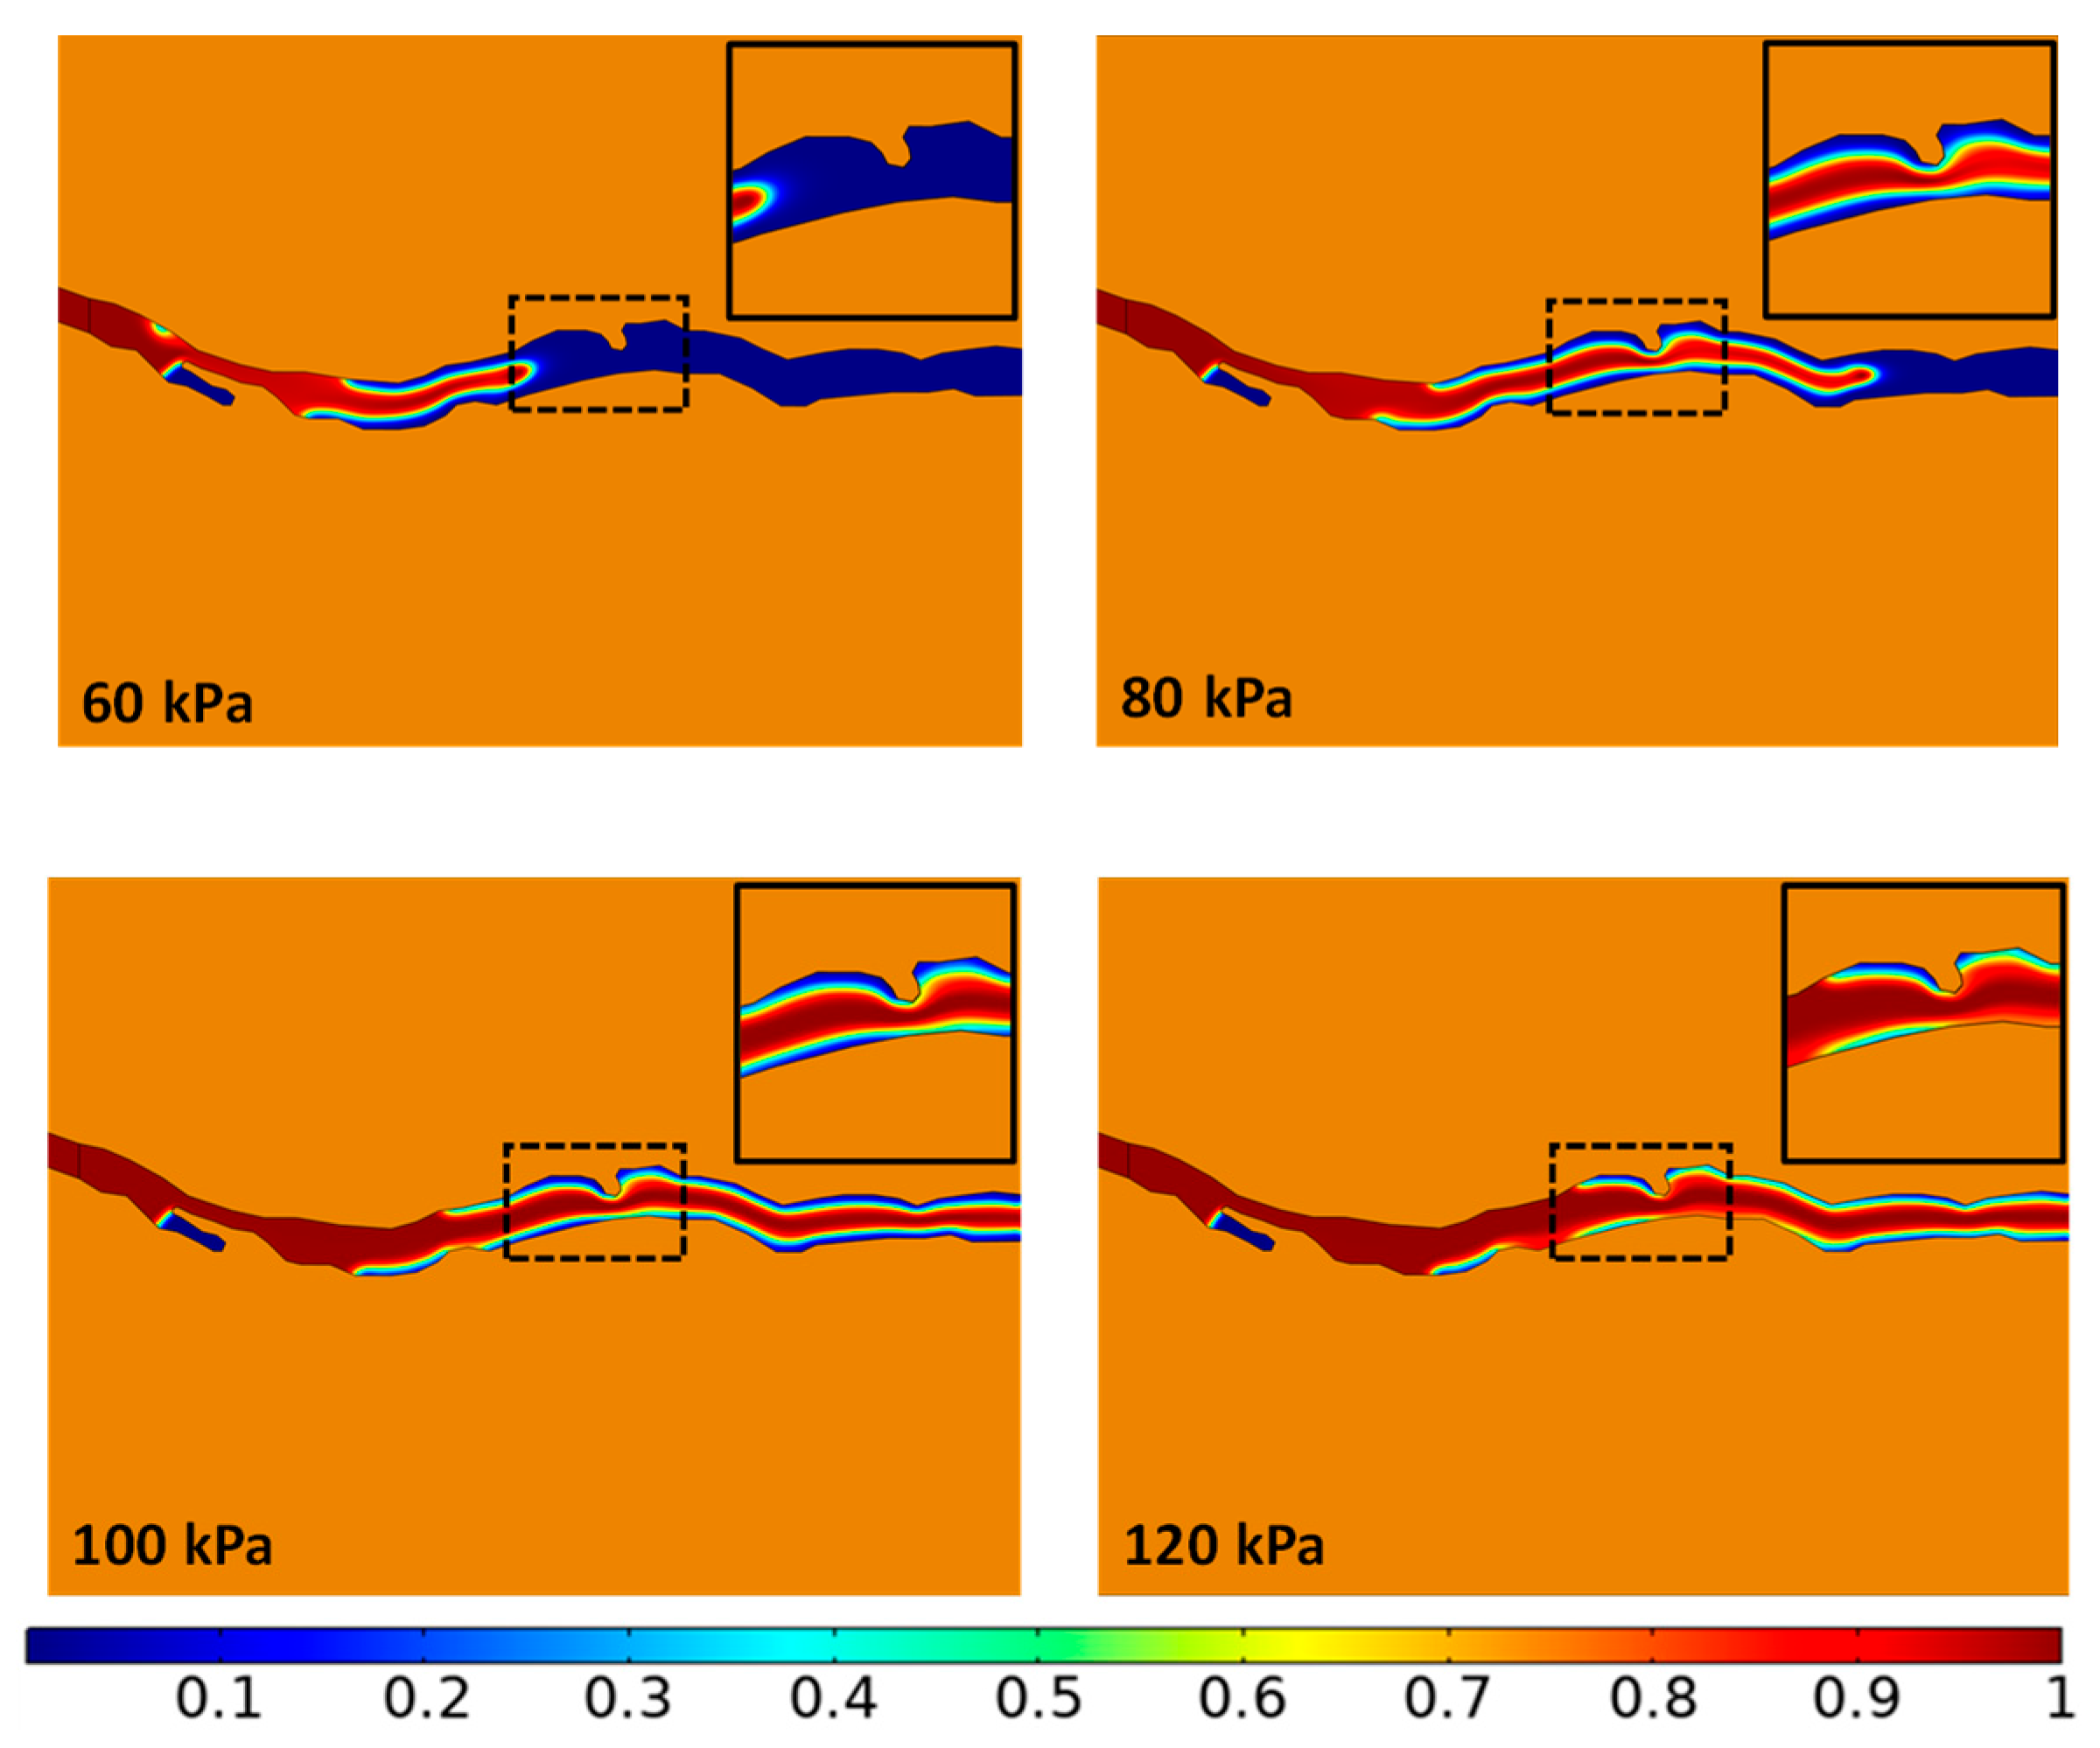
4.3.1. Injection Pressure
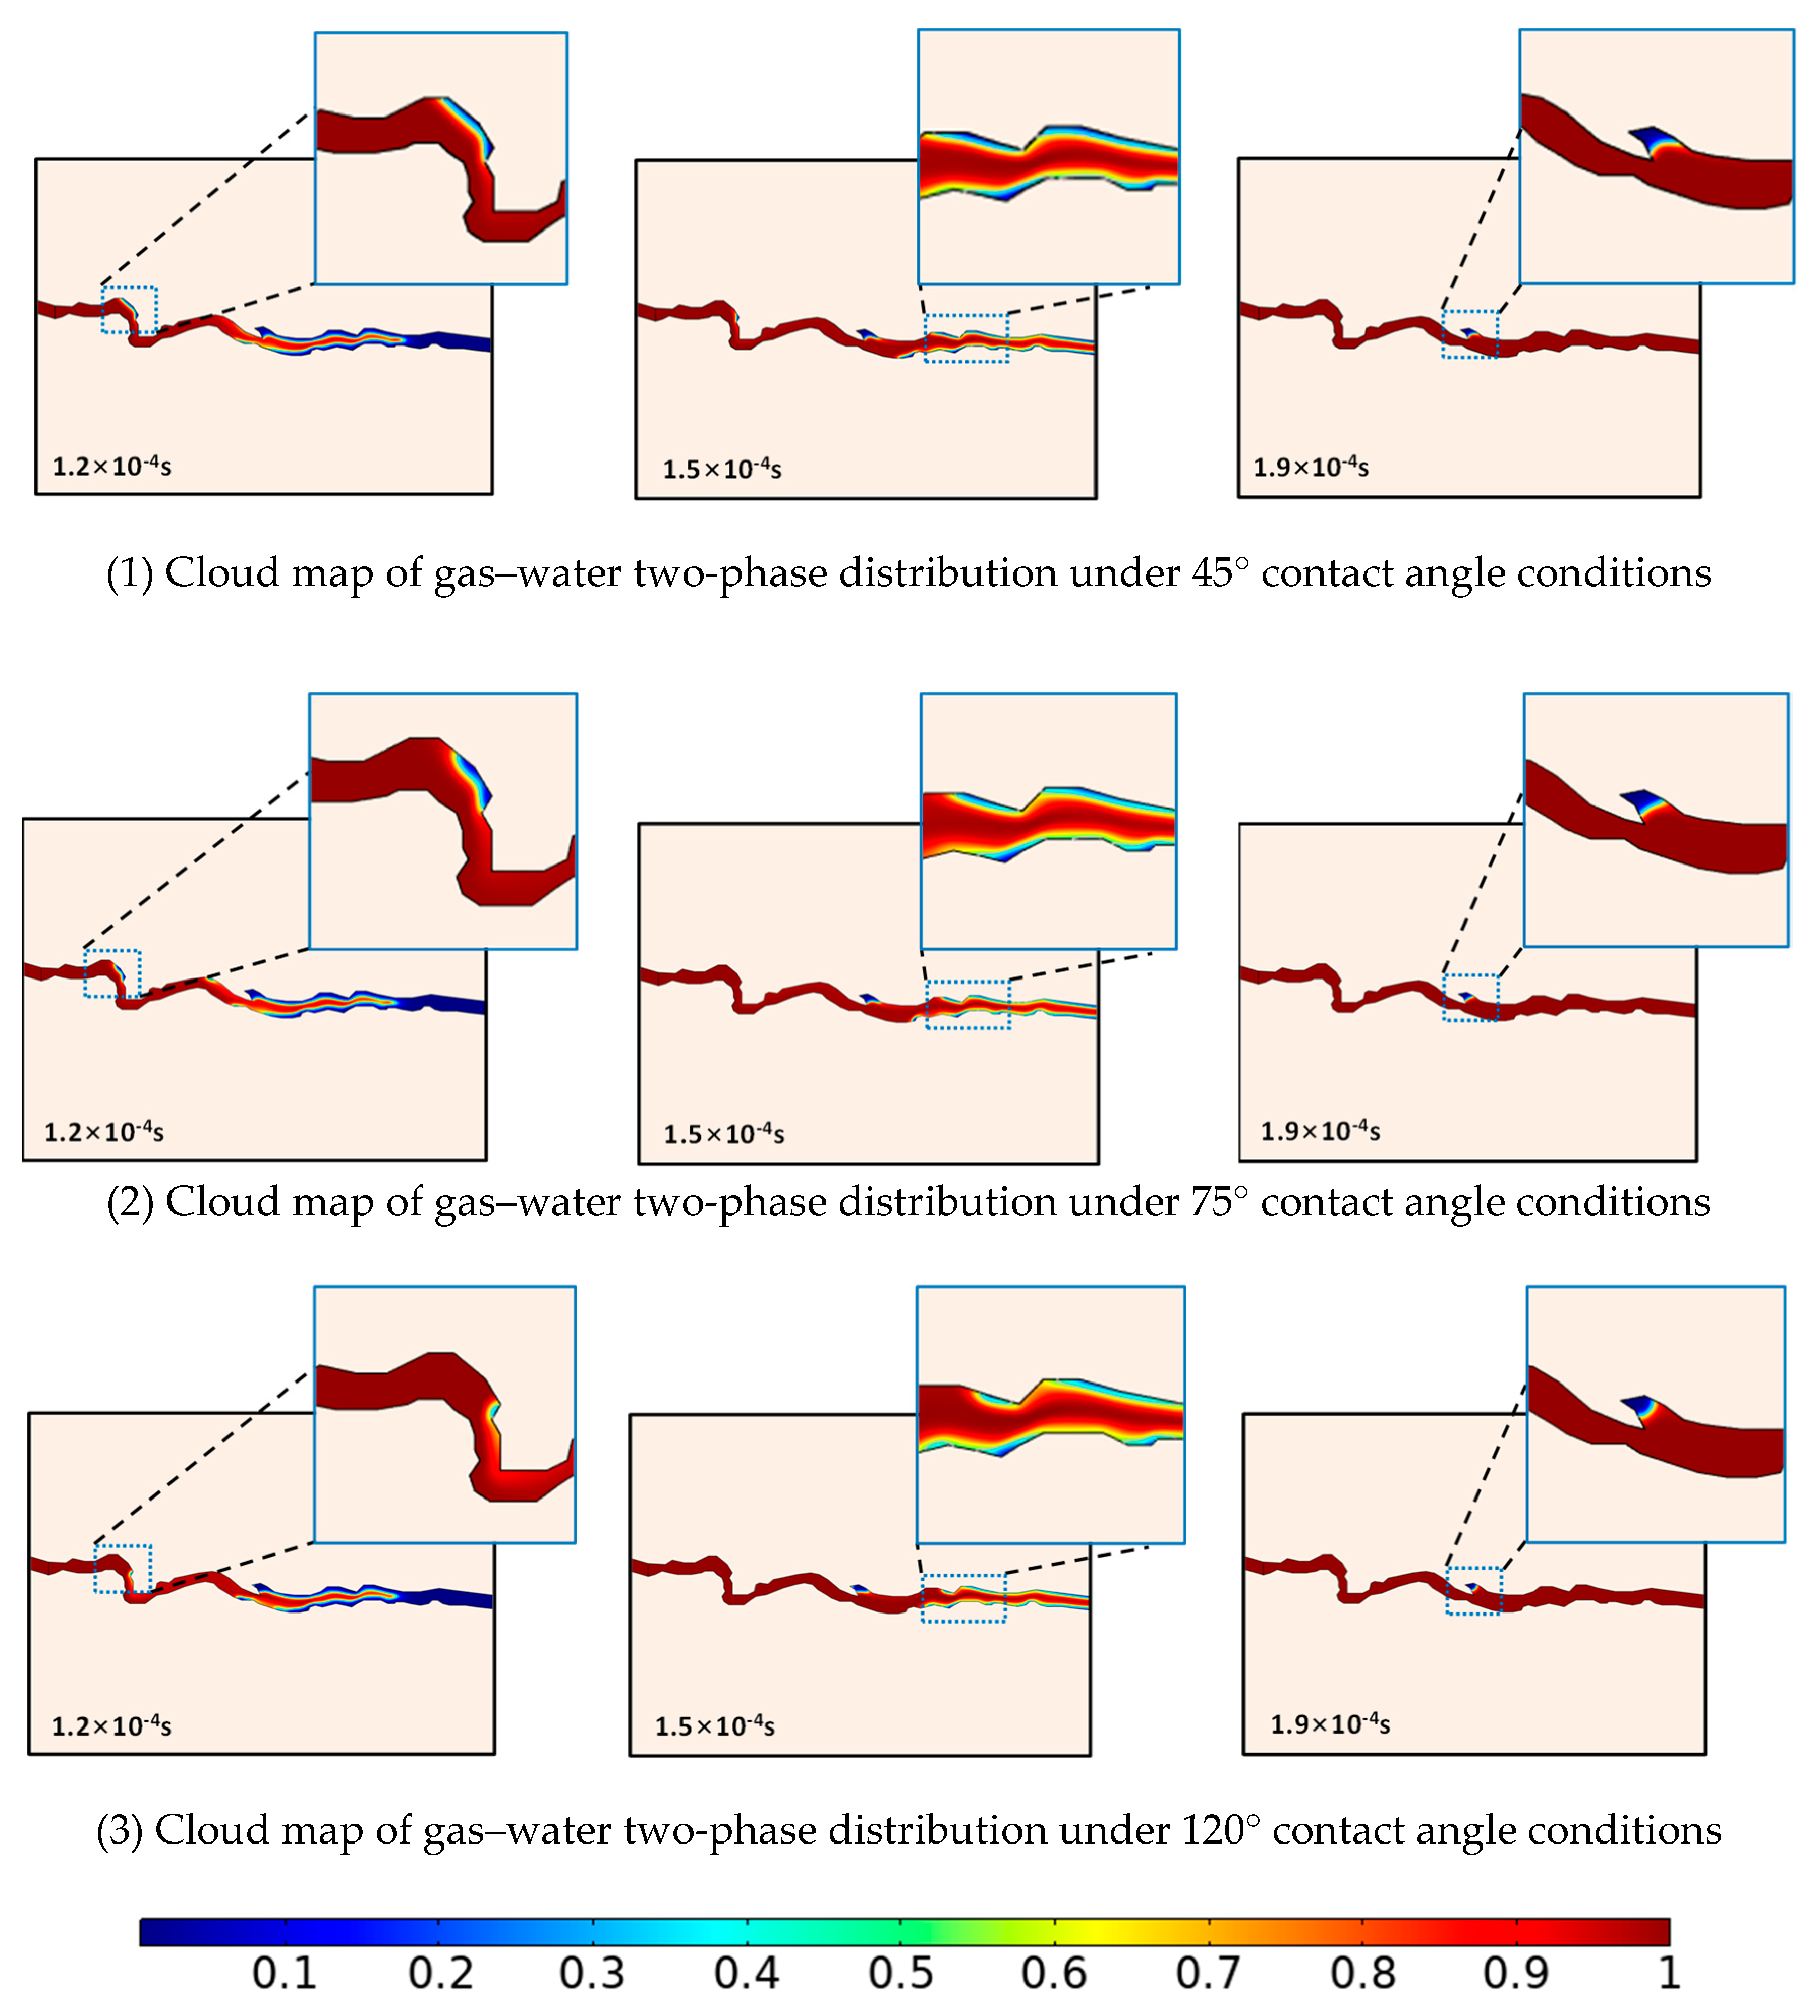
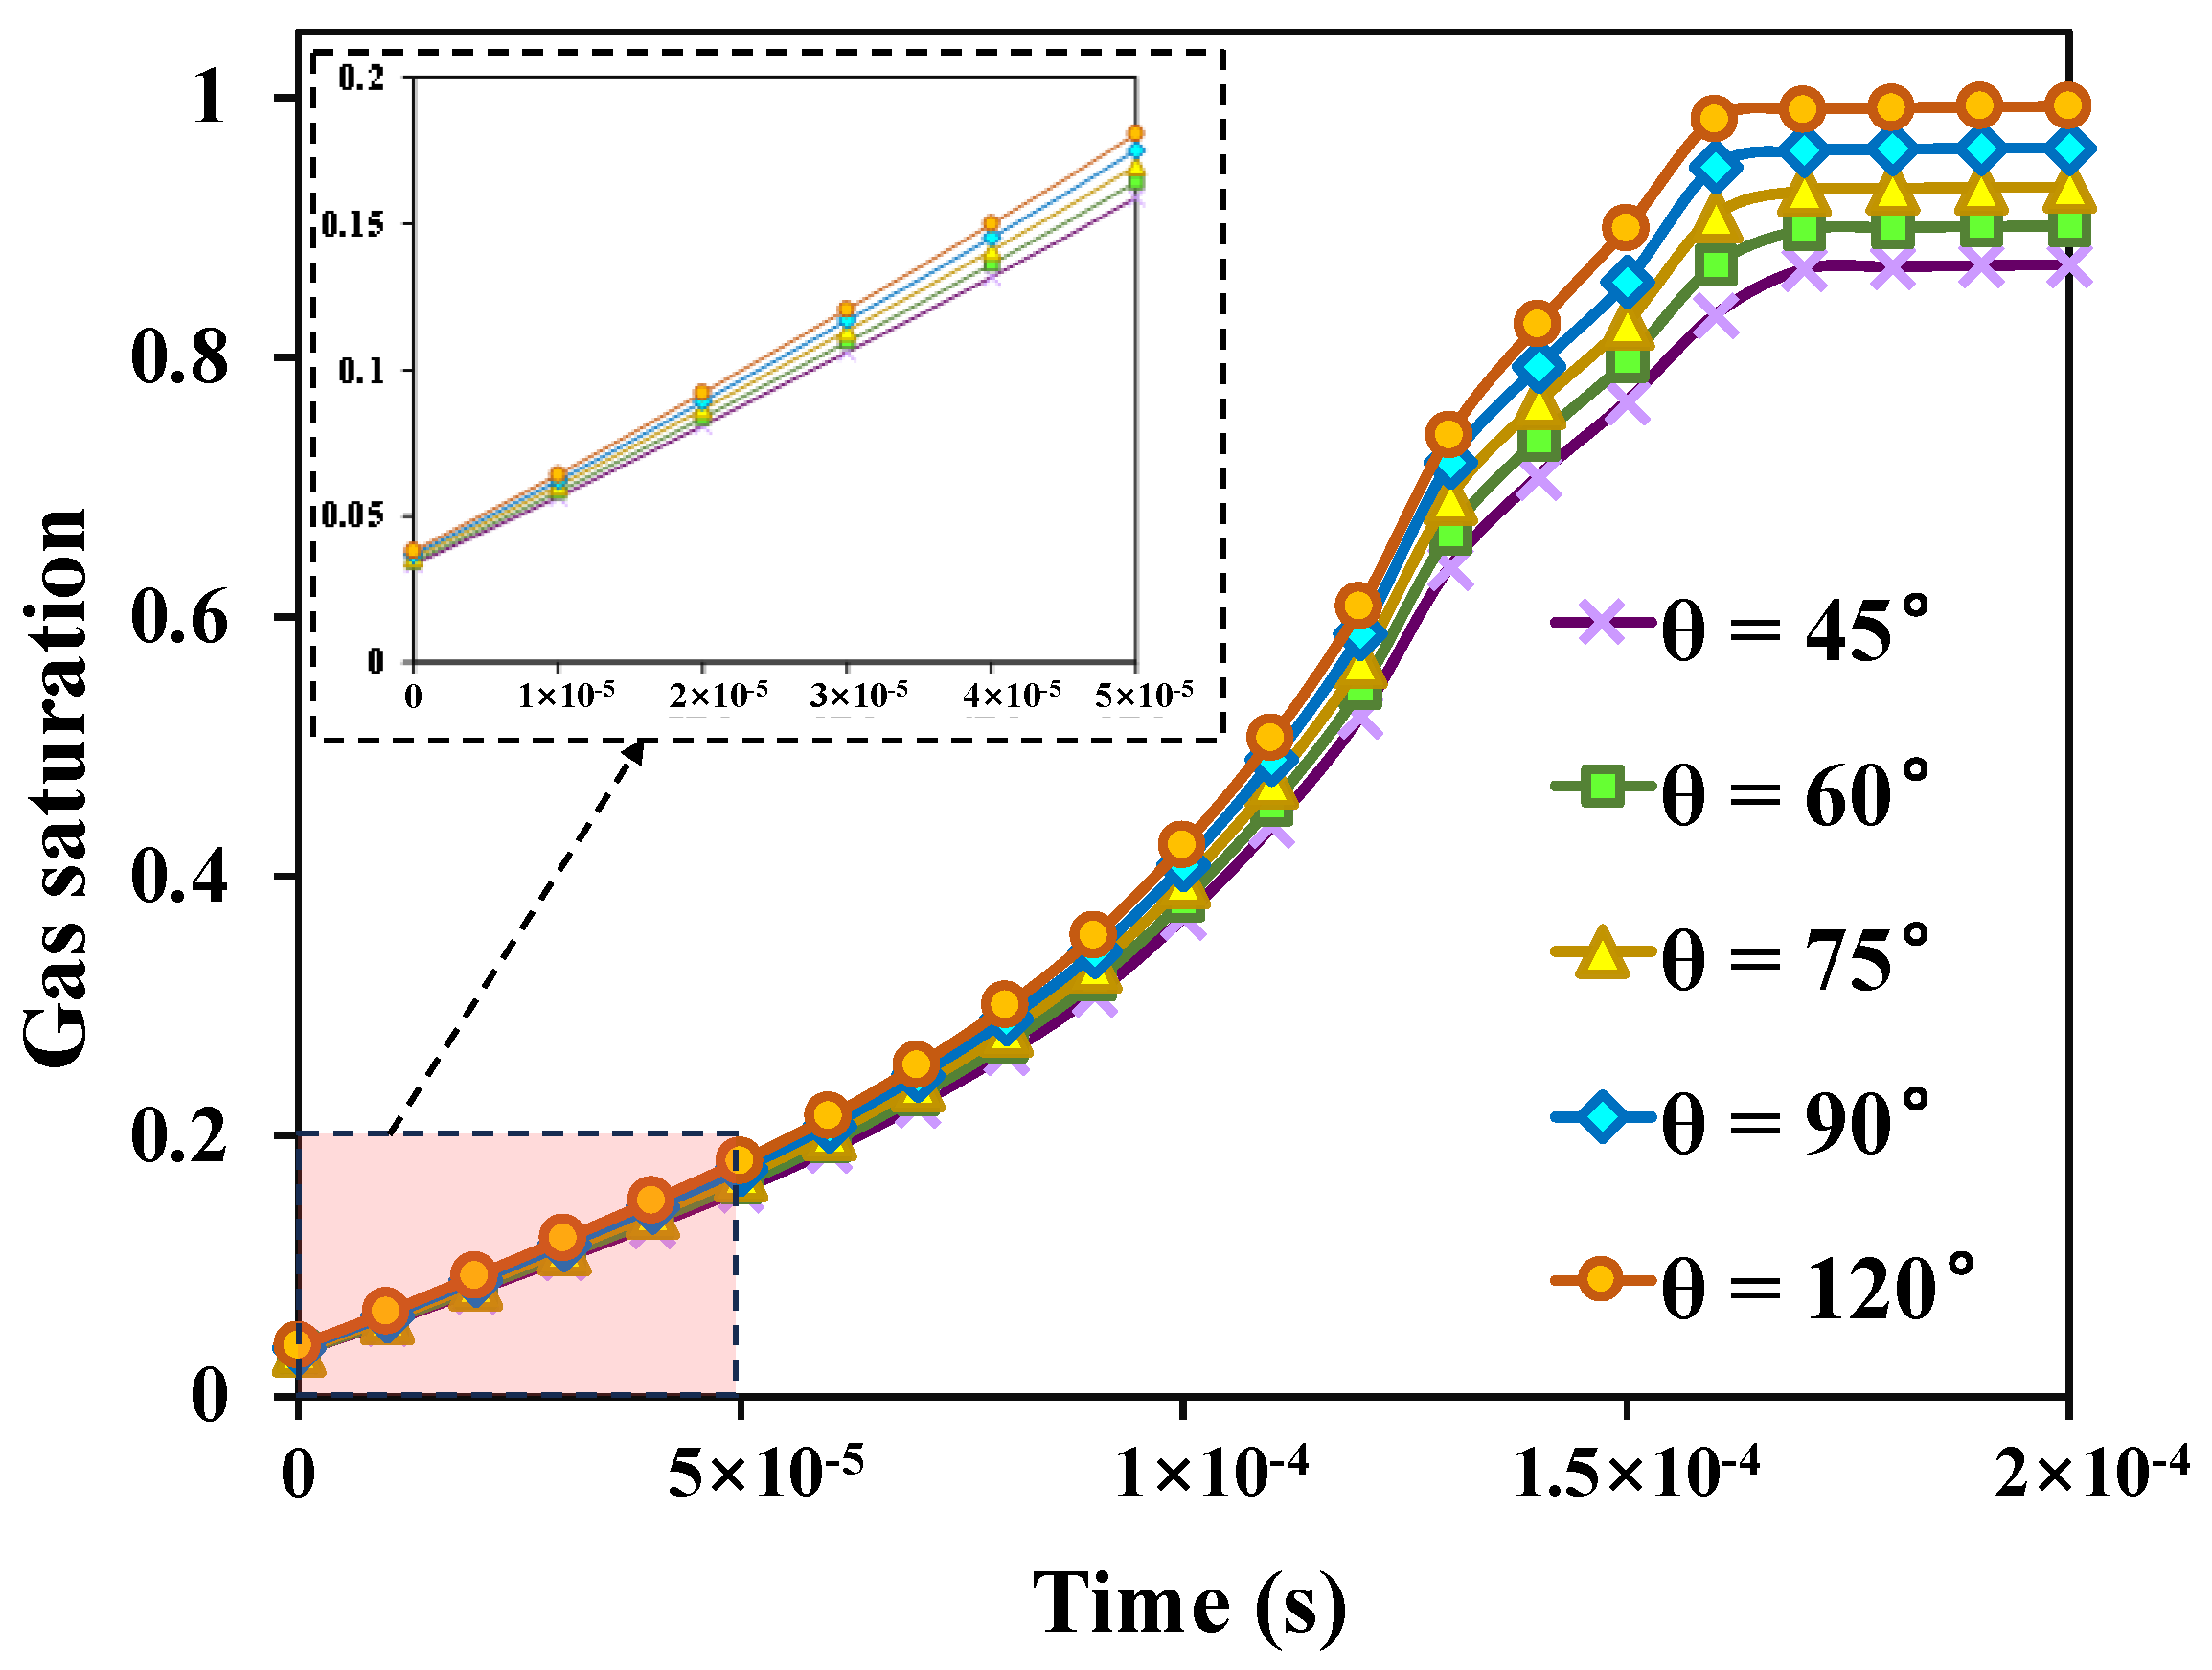
Taking Model 2 as an example, the injection pressures are set to 60 kPa, 80 kPa, 100 kPa, and 120 kPa, respectively, and the simulation time is 1.5 × 10⁻⁴ s. In this paper, the influence of injection pressure on the displacement process is analyzed from two aspects: gas phase saturation and fluid flow rate.
The higher the injection pressure, the better the gas phase can overcome the capillary force and surface tension, and the faster the corresponding gas flow rate. There are two obvious turning points in the gas saturation curve under different injection pressure conditions, located at gas saturation of 18% and 72%, respectively, as shown in Figure 6. When the gas saturation reaches 18%, the gas phase front breaks through the narrow area (Time point A in Figure 6). At this point, the capillary force decreases and the gas flow rate increases. Afterwards, the gas saturation enters a rapid increase stage. When the gas saturation increases to 72%, the gas displacement front reaches the outlet end of the coal cleat (Time point B in Figure 6), and the gas forms continuous flow in the flow section. Until the end of displacement, the gas saturation no longer increases.
Our analysis suggests that increasing injection pressure is beneficial for the gas phase to quickly break through narrow areas in coal cleat. However, the final displacement efficiency still depends on the micro-pore structure of coal rock.
Under the same time but different injection pressure conditions, the distribution of the gas phase and water phase in the coal cleat is completely different. The higher the pressure, the more coal cleat space is occupied by the gas phase. When the displacement time is the same, the two-phase interface only reaches the middle of the coal cleat when the injection pressure is 60 kPa, while the two-phase displacement process is basically completed when the injection pressure increases to 120 kPa. From Figure 7, it can be seen that residual water at the dead end cannot be effectively discharged under different injection pressure conditions. This analysis suggests that the dead end of the coal cleat does not have a pressure transmission outlet, and simply increasing the injection pressure is ineffective in displacing residual water at the blind end.
The Von-Mises equivalent stress can be used to judge the mechanical stability of the reservoir, and when the Von-Mises equivalent stress reaches a certain value, the mechanical property of the reservoir in this region can be judged to be unstable [17]. Under different injection pressure conditions, the Von-Mises equivalent stress of the coal matrix shows a trend of first increasing, and then, decreasing, and then, maintaining stability. At the same time, the higher the injection pressure, the higher the Von Mises equivalent stress. When the time is 1.5 × 10⁻⁴ s, the Von-Mises equivalent stresses corresponding to injection pressures of 60 kPa, 80 kPa, 100 kPa, and 120 kPa are 11.58 kPa, 15.81 kPa, 19.76 kPa, and 23.73 kPa, respectively. The interaction between the two-phase fluid and coal matrix is stronger in the two-phase flow stage. When the injection pressure is 60 kPa, the Von-Mises equivalent stress of the coal matrix difference between the two-phase flow stage and the single-phase gas stage is only 9.36 kPa, and the variation in Von-Mises equivalent stress is not significant. When the injection pressure is increased to 120 kPa, the difference is 18.01 kPa, and a clear “peak” can be seen in Figure 8.
In the initial stage of displacement, the Von-Mises equivalent stress in the coal matrix increases rapidly until the gas phase front reaches the coal cleat outlet. Upon increasing injection pressure at this stage, on the one hand, the average fluid pressure in the coal cleats will be increased and the rate of fluid flow will be accelerated. On the other hand, the interaction between the fluid and the cleat wall will be strengthened. The cleat wall is subjected to strong stress disturbance, exhibiting a strong micro-fluid–solid coupling phenomenon, which can easily cause coal powder to fall off. It can be seen that in the development process of coalbed methane reservoirs, especially in the drainage stage and two-phase flow stage, attention should be paid to controlling the production pressure difference to avoid the generation of large amounts of coal powder due to unstable coal matrix stress, which can block the flow path and damage mining equipment, and reduce the recovery rate of coalbed methane.

4.3.2. Wettability

This paper studies the influence of wettability on the microscopic two-phase flow of coal cleat by changing the contact angle of coal cleat walls. In the phase field model, the control equation of the contact angle is expressed as
n · γ β ε 2 ψ = 0
n · ε 2 ϕ = ε 2 cos θ w ϕ
where n is the normal vector.
Taking Model 1 as an example, according to the wettability classification criteria [16], the contact angles of the research model were set to 45°, 75°, and 120°, respectively, to simulate the super hydrophilic, slightly water-wet, and gas wetting states.
Under different wettability conditions, a micro-viscous fingering phenomenon occurs during the displacement process. As the contact angle increases, the advancing speed of the two-phase interface accelerates, and the distribution range of residual water decreases. It can be observed from the enlarged local image in Figure 9 that the larger the contact angle, the less residual water in the coal cleats. Under gas wetting conditions, formation water in areas such as dead ends, coal cleat walls, and narrow areas is more easily displaced. The contact angle increases from small to large, and the wettability of the coal cleat wall changes from water-wet to gas wetting, and the shape of the displacement front changes from convex to concave. As the wettability changes, the role of capillary force in the displacement process is also changing. In the water-wet model, the capillary force is positive; in the gas wetting model, the capillary force changes to a negative value, which promotes gas flow; in the neutral wetting model, gas flow is mainly controlled by the displacement pressure difference. Related studies have shown that the hydrophilicity of coal rock gradually weakens from low-rank coal to high-rank coal. According to the numerical simulation results, it is also believed that compared with low-rank coal, high-rank coal has a shorter time of gas–water two-phase flow stages, less residual water in coal rocks, faster gas phase flow velocity, and higher coalbed methane production.
With the increase in the contact angle, the increase rate of gas phase saturation is accelerated, and the displacement efficiency is also continuously improved, as shown in Figure 10. The contact angle increases from 45° to 120°, that is, the model wettability changes from a strong hydrophilic state to a gas wetting state, and the gas phase saturation increases from 0.871 to 0.992 at the end of displacement. At the same time, it can also be observed that in the early stage of displacement, there is a trend of higher gas saturation with a larger contact angle. However, the impact of contact angle on gas saturation is mainly reflected in the middle and later stages of displacement. This is mainly due to the fact that when the displacement pressure difference is enough to overcome the capillary force and viscous force in the coal cleats, the influence of wettability on the displacement efficiency is mainly reflected in the displacement of gas relative to residual water. When the coal rock is in the gas-wetted state, it is conducive to the gas phase displacement of formation water in the fracture, so as to improve the displacement efficiency. It can be seen that the recovery rate of coalbed methane can be improved by changing the wettability state of coal rock.
It is worth noting that when the capillary force changes from resistance to power, the gas flow velocity accelerates and the interaction with the rough cleat wall becomes more intense. At this time, it is more likely to cause local damage to the coal cleat wall and produce a large amount of coal powder. Therefore, when formulating coalbed methane development technology policies, a balance between recovery rate and extraction period should be comprehensively considered to avoid producing coal powder due to an excessive flow rate, reducing the coalbed methane recovery rate, and damaging the extraction equipment.

5. Conclusions

This article reconstructs a real coal cleat physical model based on the microscopic pore images obtained from scanning electron microscopy experiments. A numerical model of two-phase flow in coal rock considering fluid–solid coupling was established based on COMSOL software by coupling Navier–Stokes equations, the phase field method, and solid mechanics theory. Based on the numerical simulation results, the movement law of the two-phase interface was qualitatively described, and the two-phase distribution characteristics within coal cleats were quantitatively characterized. Finally, based on the established numerical model, a comprehensive analysis was conducted on the effects of injection pressure and wettability on the microscopic two-phase flow and displacement of coal rock. This study showed the following:
(1)
The displacement process can be divided into two stages: the gas phase front reaches the outlet along the preponderance seepage path, and the gas phase continues to drive residual water on the coal cleat wall until the flow reaches a stable state. The displacement process has an obvious viscous fingering phenomenon and residual water characteristics.
(2)
Increasing injection pressure is beneficial for the gas phase to break through narrow areas; however, residual water at dead corners of coal cleats is difficult to displace. The final gas saturation depends on the pore structure of the coal rock. The injection pressure was increased from 60 kPa to 120 kPa, the displacement completion time was reduced from 1.3 × 10⁻⁴ s to 7 × 10⁻⁵ s, and the final gas saturation was 98%.
(3)
The larger the contact angle, the faster the two-phase interface advance speed, and the lower the residual water distribution range. The gas-wet state contributes to enhanced oil recovery. The contact angle increased from 45° to 120°, resulting in a significant enhancement of the final gas phase saturation from 0.871 to 0.992, representing an increase of 12.2%.

Author Contributions

Conceptualization, C.Q.; writing—original draft preparation and software, Y.X.; methodology, X.Z.; review and editing, R.Z.; supervision, B.M. All authors have read and agreed to the published version of the manuscript.

Funding

This work was funded by Research on Key Technologies of Efficient Fracturing of Coalbed Methane in Sichuan Province (No. SCIGS-CZDXM-2023004) and Research on CBM Selected Area Evaluation Method—An Example from Southern Sichuan (No. SDDY-Z2022022).

Data Availability Statement

The data are available from the corresponding author on reasonable request.

Conflicts of Interest

The authors declare no conflicts of interest.

References

  1. Han, F.; Busch, A.; van Wageningen, N.; Yang, J.; Liu, Z.; Krooss, B.M. Experimental study of gas and water transport processes in the inter-cleat (matrix) system of coal: Anthracite from Qinshui Basin, China. Int. J. Coal Geol. 2010, 81, 128–138. [Google Scholar] [CrossRef]
  2. Gao, C.; Liu, D.; Li, Z.; Cai, Y.; Fang, Y. Fluid performance in coal reservoirs: A comprehensive review. Geofluids 2021, 2021, 6611075. [Google Scholar] [CrossRef]
  3. Du, Z.; Tao, Y.; Zhang, X.; Ding, W.; Huang, Q. CBM exploration: Permeability of coal owing to cleat and connected fracture. Energy Explor. Exploit. 2022, 40, 38–56. [Google Scholar] [CrossRef]
  4. Gilman, A.; Beckie, R. Flow of coal-bed methane to a gallery. Transp. Porous Media 2000, 41, 1–16. [Google Scholar] [CrossRef]
  5. Zhu, Q.; Yang, Y.; Zuo, Y.; Song, Y.; Guo, W.; Tang, F.; Ren, J.; Wang, G. On the scientific exploitation of high-rank CBM resources. Nat. Gas Ind. B 2020, 7, 403–409. [Google Scholar] [CrossRef]
  6. Chen, Y.; Xu, J.; Chu, T.; Peng, S.; Zhang, C.; Wang, M. The evolution of parameters during CBM drainage in different regions. Transp. Porous Media 2017, 120, 83–100. [Google Scholar] [CrossRef]
  7. Geng, J.; Zeng, G.; Liu, C.; Li, X.; Zhang, D. Development and application of triaxial seepage test system for gas-water two-phase in coal rock. Energy 2023, 277, 127439. [Google Scholar] [CrossRef]
  8. Wang, Q.; Su, X.; Feng, Y.; Wang, H.; Song, J. Experimental study of gas-water two-phase flow patterns in fracture: Implication for enhancing coalbed methane production. J. Pet. Sci. Eng. 2021, 207, 109168. [Google Scholar] [CrossRef]
  9. Su, X.; Liu, Y.; Cui, Z.; Zhang, J.; Yu, L.; Wang, K. Influence of depressurization rate on gas production capacity of high-rank coal in the south of Qinshui Basin, China. Pet. Explor. Dev. 2019, 46, 613–620. [Google Scholar] [CrossRef]
  10. Shao, P.; Wang, X.; Song, Y.; Li, Y. Study on the characteristics of matrix compressibility and its influence factors for different rank coals. J. Nat. Gas Sci. Eng. 2018, 56, 93–106. [Google Scholar] [CrossRef]
  11. Song, R. Research on the Mesoscopic Mechanism of Thermal Fluid Solid Coupling in Rock Based on Microscale Reconstruction Model. Ph.D. Thesis, Southwest Petroleum University, Chengdu, China, 2016. [Google Scholar]
  12. Li, S.; Fan, C.; Han, J.; Luo, M.; Yang, Z.; Bi, H. A fully coupled thermal-hydraulic-mechanical model with two-phase flow for coalbed methane extraction. J. Nat. Gas Sci. Eng. 2016, 33, 324–336. [Google Scholar] [CrossRef]
  13. Sun, Z.; Shi, J.; Wu, K.; Miao, Y.; Zhang, T.; Feng, D.; Xiao, Z.; Wu, N.; Lin, W.; Li, X. A fully-coupled gas-water two phase productivity equations for low-permeability CBM wells. J. Pet. Sci. Eng. 2018, 166, 611–620. [Google Scholar] [CrossRef]
  14. Yang, R.; Ma, T.; Xu, H.; Liu, W.; Hu, Y.; Sang, S. A model of fully coupled two-phase flow and coal deformation under dynamic diffusion for coalbed methane extraction. J. Nat. Gas Sci. Eng. 2019, 72, 103010. [Google Scholar] [CrossRef]
  15. Zeguai, S.; Chikh, S.; Tadrist, L. Experimental study of air-water two-phase flow pattern evolution in a mini tube: Influence of tube orientation with respect to gravity. Int. J. Multiph. Flow 2020, 132, 103413. [Google Scholar] [CrossRef]
  16. Mao, N.; Kang, C.; Ding, K.; Cao, Q. Gas-liquid two-phase flow patterns in the wake of a submerged nozzle under co-flow condition. Int. J. Multiph. Flow 2021, 138, 103604. [Google Scholar] [CrossRef]
  17. Bai, T.; Chen, Z.; Aminossadati, S.M.; Pan, Z.; Liu, J.; Li, L. Characterization of coal fines generation: A micro-scale investigation. J. Nat. Gas Sci. Eng. 2015, 27, 862–875. [Google Scholar] [CrossRef]
  18. Ma, T.; Rutqvist, J.; Oldenburg, C.M.; Liu, W.; Chen, J. Fully coupled two-phase flow and poromechanics modeling of coalbed methane recovery: Impact of geomechanics on production rate. J. Nat. Gas Sci. Eng. 2017, 45, 474–486. [Google Scholar] [CrossRef]
  19. Zhu, J.; Tang, J.; Hou, C.; Shao, T.; Zhao, Y.; Wang, J.; Lin, L.; Liu, J.; Jiang, Y. Two-Phase Flow Model of Coalbed Methane Extraction with Different Permeability Evolutions for Hydraulic Fractures and Coal Reservoirs. Energy Fuels 2021, 35, 9278–9293. [Google Scholar] [CrossRef]
  20. Dong, W.; Wang, J.; Wang, J. Two-phase flow in coalbed methane reservoirs with multiple-fractured horizontal well. J. Pet. Sci. Eng. 2022, 208, 109510. [Google Scholar] [CrossRef]
  21. Sun, Z.; Shi, J.; Wang, K.; Miao, Y.; Zhang, T.; Feng, D.; Sun, F.; Wang, S.; Han, S.; Li, X. The gas-water two phase flow behavior in low-permeability CBM reservoirs with multiple mechanisms coupling. J. Nat. Gas Sci. Eng. 2018, 52, 82–93. [Google Scholar] [CrossRef]
  22. Shu, Y.; Sang, S.; Zhou, X.; Zhao, F. A Coupled Hydraulic–Mechanical Model with Two-Phase Flow for Fracturing Development of Undersaturated Coalbed Methane Reservoirs Considering Permeability Velocity-Sensitive Damage. Nat. Resour. Res. 2023, 32, 2053–2076. [Google Scholar] [CrossRef]
  23. Xu, Y.; Chen, X.; Yu, J.Y. Experimental study of the radial multi-scale dynamic diffusion model for gas-bearing coal. Min. Miner. Depos. 2022, 16, 80–86. [Google Scholar] [CrossRef]
  24. Li, H.; Huang, B.; Zheng, W.; Zhao, X.; Tannant, D. Effect of proppant distribution in hydraulic fractures on coalbed methane extraction. Results Eng. 2023, 20, 101550. [Google Scholar] [CrossRef]
  25. Gawin, D.; Baggio, P.; Schrefler, B.A. Coupled heat, water and gas flow in deformable porous media. Int. J. Numer. Methods Fluids 1995, 20, 969–987. [Google Scholar] [CrossRef]
  26. Bertrand, F.; Buzzi, O.; Collin, F. Cleat-scale modelling of the coal permeability evolution due to sorption-induced strain. Int. J. Coal Geol. 2019, 216, 103320. [Google Scholar] [CrossRef]
  27. Bai, T.; Chen, Z.; Aminossadati, S.M.; Li, L.; Liu, J.; Lu, H. Dimensional analysis and prediction of coal fines generation under two-phase flow conditions. Fuel 2017, 194, 460–479. [Google Scholar] [CrossRef]
  28. Sun, Y.; Bao, C.; Jiang, Z.; Zhang, X.; Gao, T. A two-dimensional numerical study of liquid water breakthrough in gas diffusion layer based on phase field method. J. Power Sources 2020, 448, 227352. [Google Scholar] [CrossRef]
Figure 1. Geometric model: Model 1 and Model 2.
Energies 17 00928 g001
Figure 2. Model diagram.
Energies 17 00928 g002
Figure 3. Comparison chart of two-phase interface position along the x-direction at different displacement times for research model and Bai’s model.
Energies 17 00928 g003
Figure 4. Evolution of two-phase interface of Model 1 and Model 2 (the color blue indicates the presence of formation water, while red indicates the presence of coal bed methane. The legend corresponds to gas saturation).
Energies 17 00928 g004
Figure 5. Gas and water saturation of Model 1 and Model 2.
Energies 17 00928 g005
Figure 6. Gas saturation under different injection pressure conditions.
Energies 17 00928 g006
Figure 7. Cloud map of gas–water two-phase distribution under different displacement pressures at the same time (t = 5 × 10⁻⁵ s). (The color blue indicates the presence of formation water, while red indicates the presence of coal bed methane. The legend corresponds to gas saturation.)
Energies 17 00928 g007
Figure 8. Variation curve of the Von-Mises equivalent stress in coal matrix under different injection pressure conditions.
Energies 17 00928 g008
Figure 9. Cloud map of gas–water two-phase distribution under different contact angle conditions. (The color blue indicates the presence of formation water, while red indicates the presence of coal bed methane. The legend corresponds to gas saturation.)
Energies 17 00928 g009
Figure 10. Variation curve of gas saturation under different wettability conditions.
Energies 17 00928 g010
Table 1. Data of properties for simulation [7].
PropertyValueUnit
Density of water phase1000kg/m3
Viscosity of water phase0.001Pa·s
Density of gas phase0.66kg/m3
Viscosity of gas phase7.4 × 10−6Pa·s
Contact angle60°
Young’s modulus5.8GPa
Poisson’s ratio0.36/
Density of coal rocks1300kg/m3
Injection pressure80kPa
Disclaimer/Publisher’s Note: The statements, opinions and data contained in all publications are solely those of the individual author(s) and contributor(s) and not of MDPI and/or the editor(s). MDPI and/or the editor(s) disclaim responsibility for any injury to people or property resulting from any ideas, methods, instructions or products referred to in the content.

