Co-Pyrolysis of Woody Biomass and Oil Shale—A Kinetics and Modelling Study
Abstract
:1. Introduction
2. Materials and Methods
2.1. Materials
2.2. Experiment Set-Up
2.3. Kinetic Studies
2.4. Process Modelling
2.4.1. Oil Shale
- weight fraction of atom in OS sample (daf);
- atomic weight fraction of atom ;
- fixed carbon weight fraction in OS sample (daf);
- number of atoms in species ;
- moles of species s;
- weight of OS (on daf basis);
- molecular weight of species .
2.4.2. Biomass
3. Results and Discussion
3.1. Fuel Characterisation
3.2. TGA Behaviour
3.3. Interactions in Co-Pyrolysis
3.4. Kinetic Studies
3.5. Process Modelling
4. Conclusions
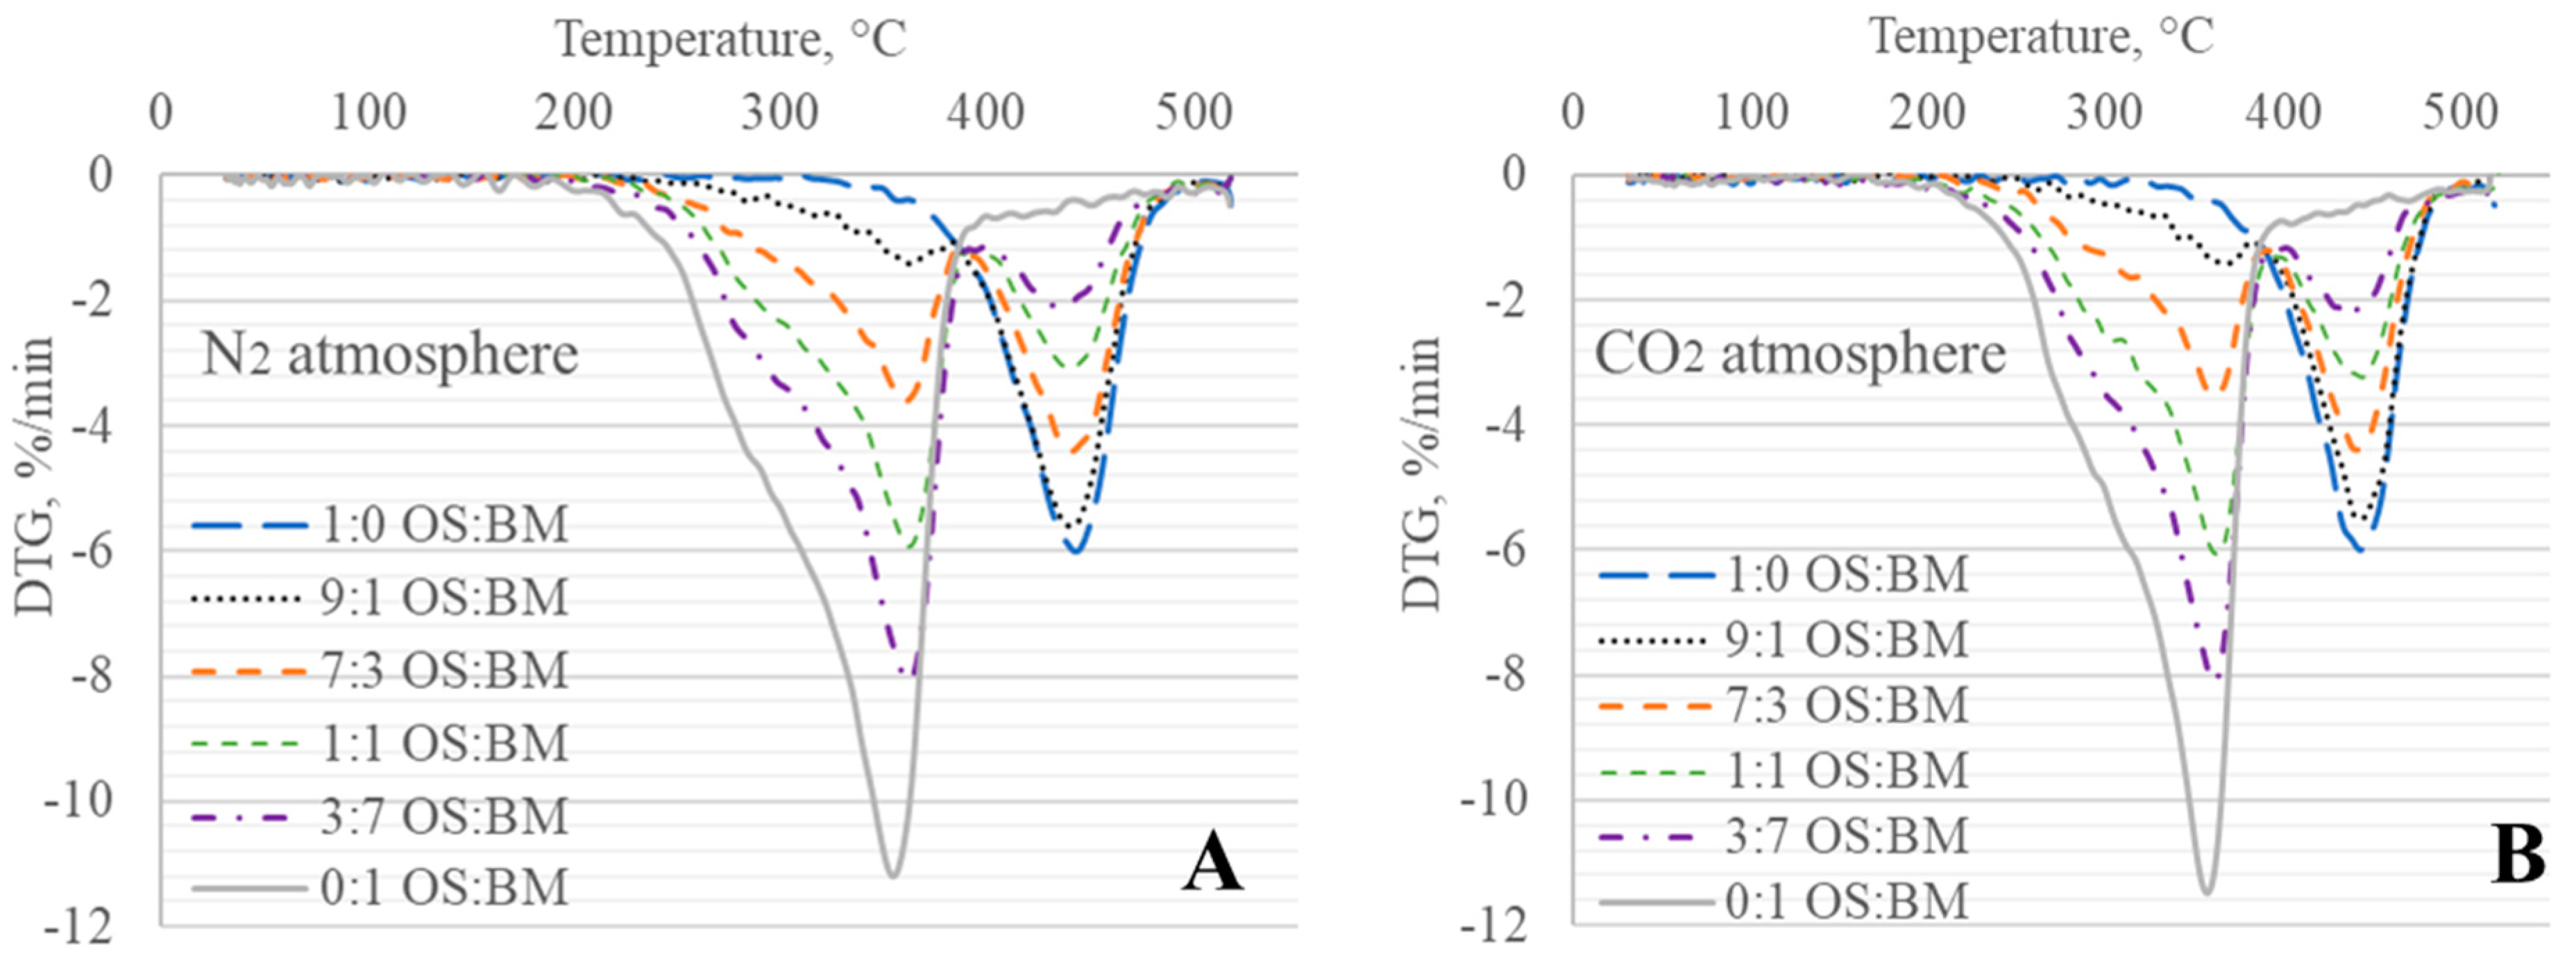
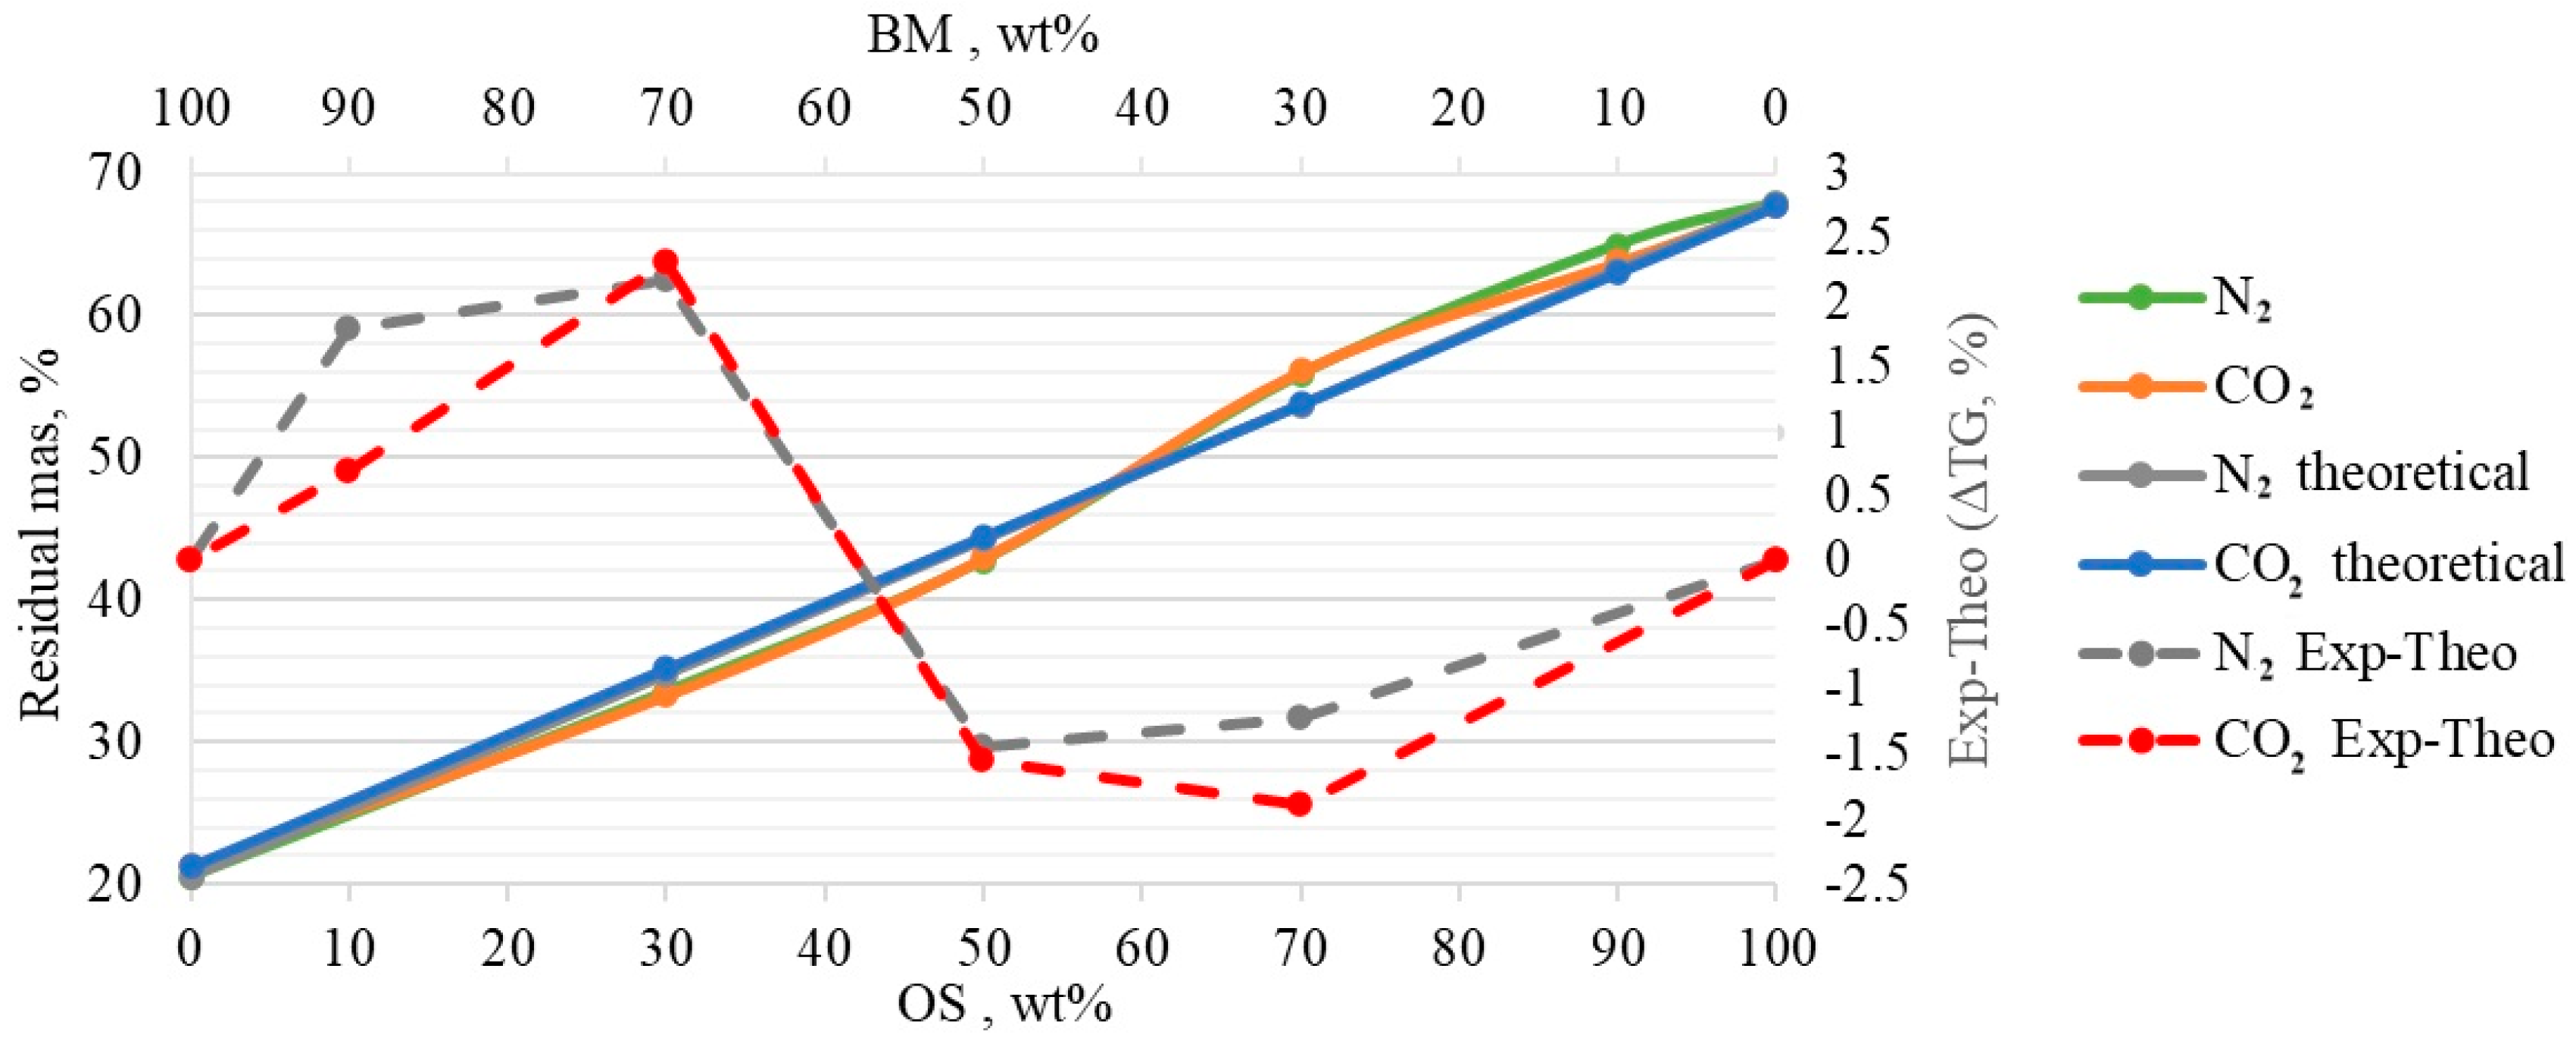
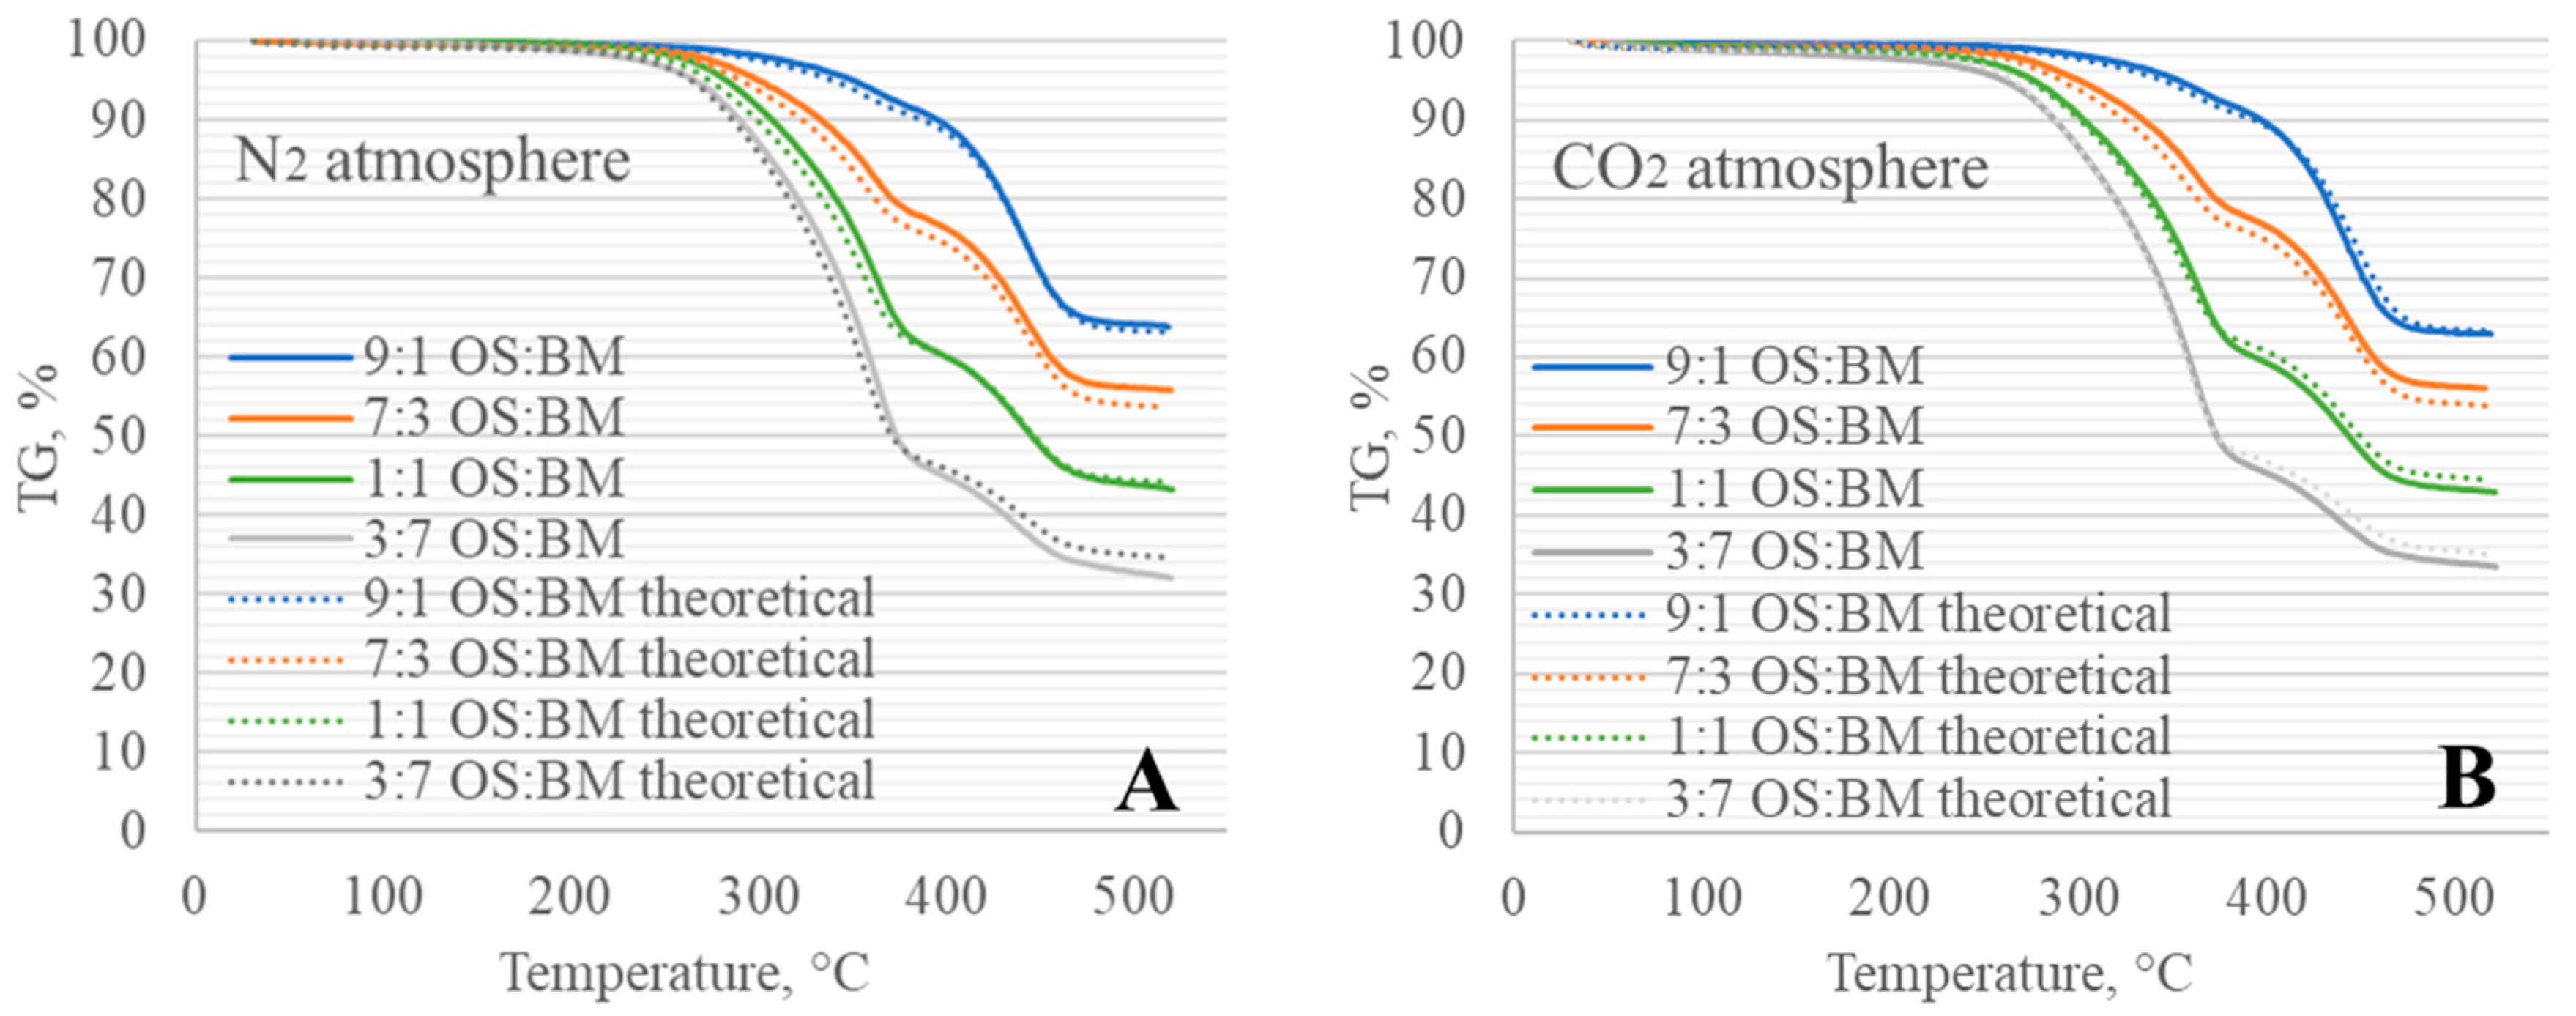
- The obtained TGA and DTG curves for OS:BM blends demonstrated an improved pyrolysis process, as the TGA curves were shifted from up to 10 °C to a lower temperature when the BM ratio increased. The addition of BM could enhance the pyrolysis of OS by increasing the mass loss and reducing the decomposition temperature. There was a linear relationship between the mass loss and the ratio of BM.
- The different two gas atmospheres resulted in an almost identical pyrolytic behaviour for all OS and BM blends. Nonetheless, the use of a CO2 atmosphere resulted in the pyrolysis of OS and BM blends comparable to the N2 atmosphere, showing its potential use in pyrolysis and co-pyrolysis as an alternative gas atmosphere obtained from CCUS technologies.
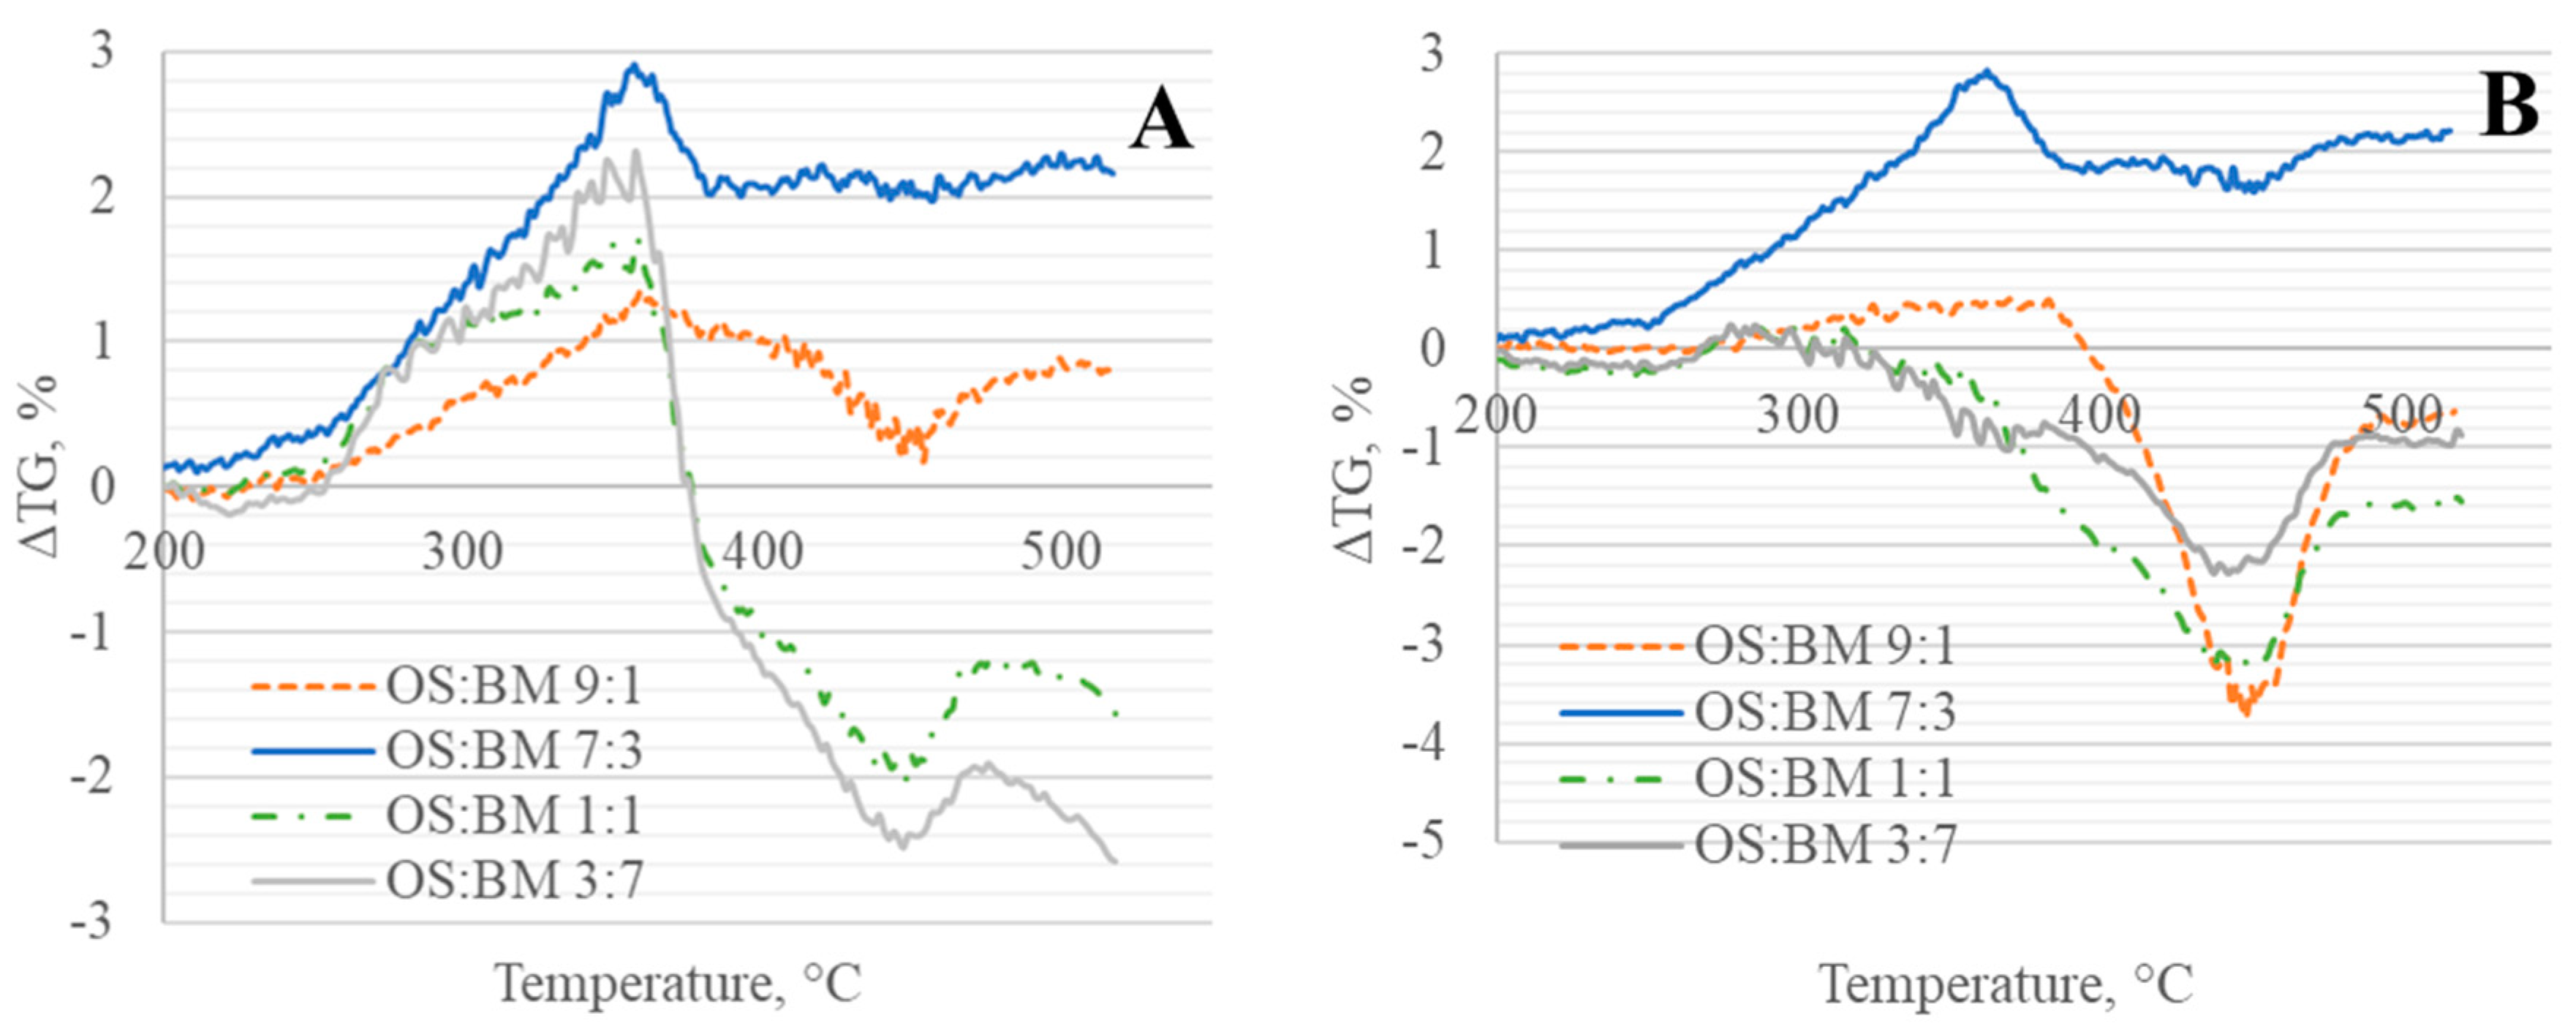
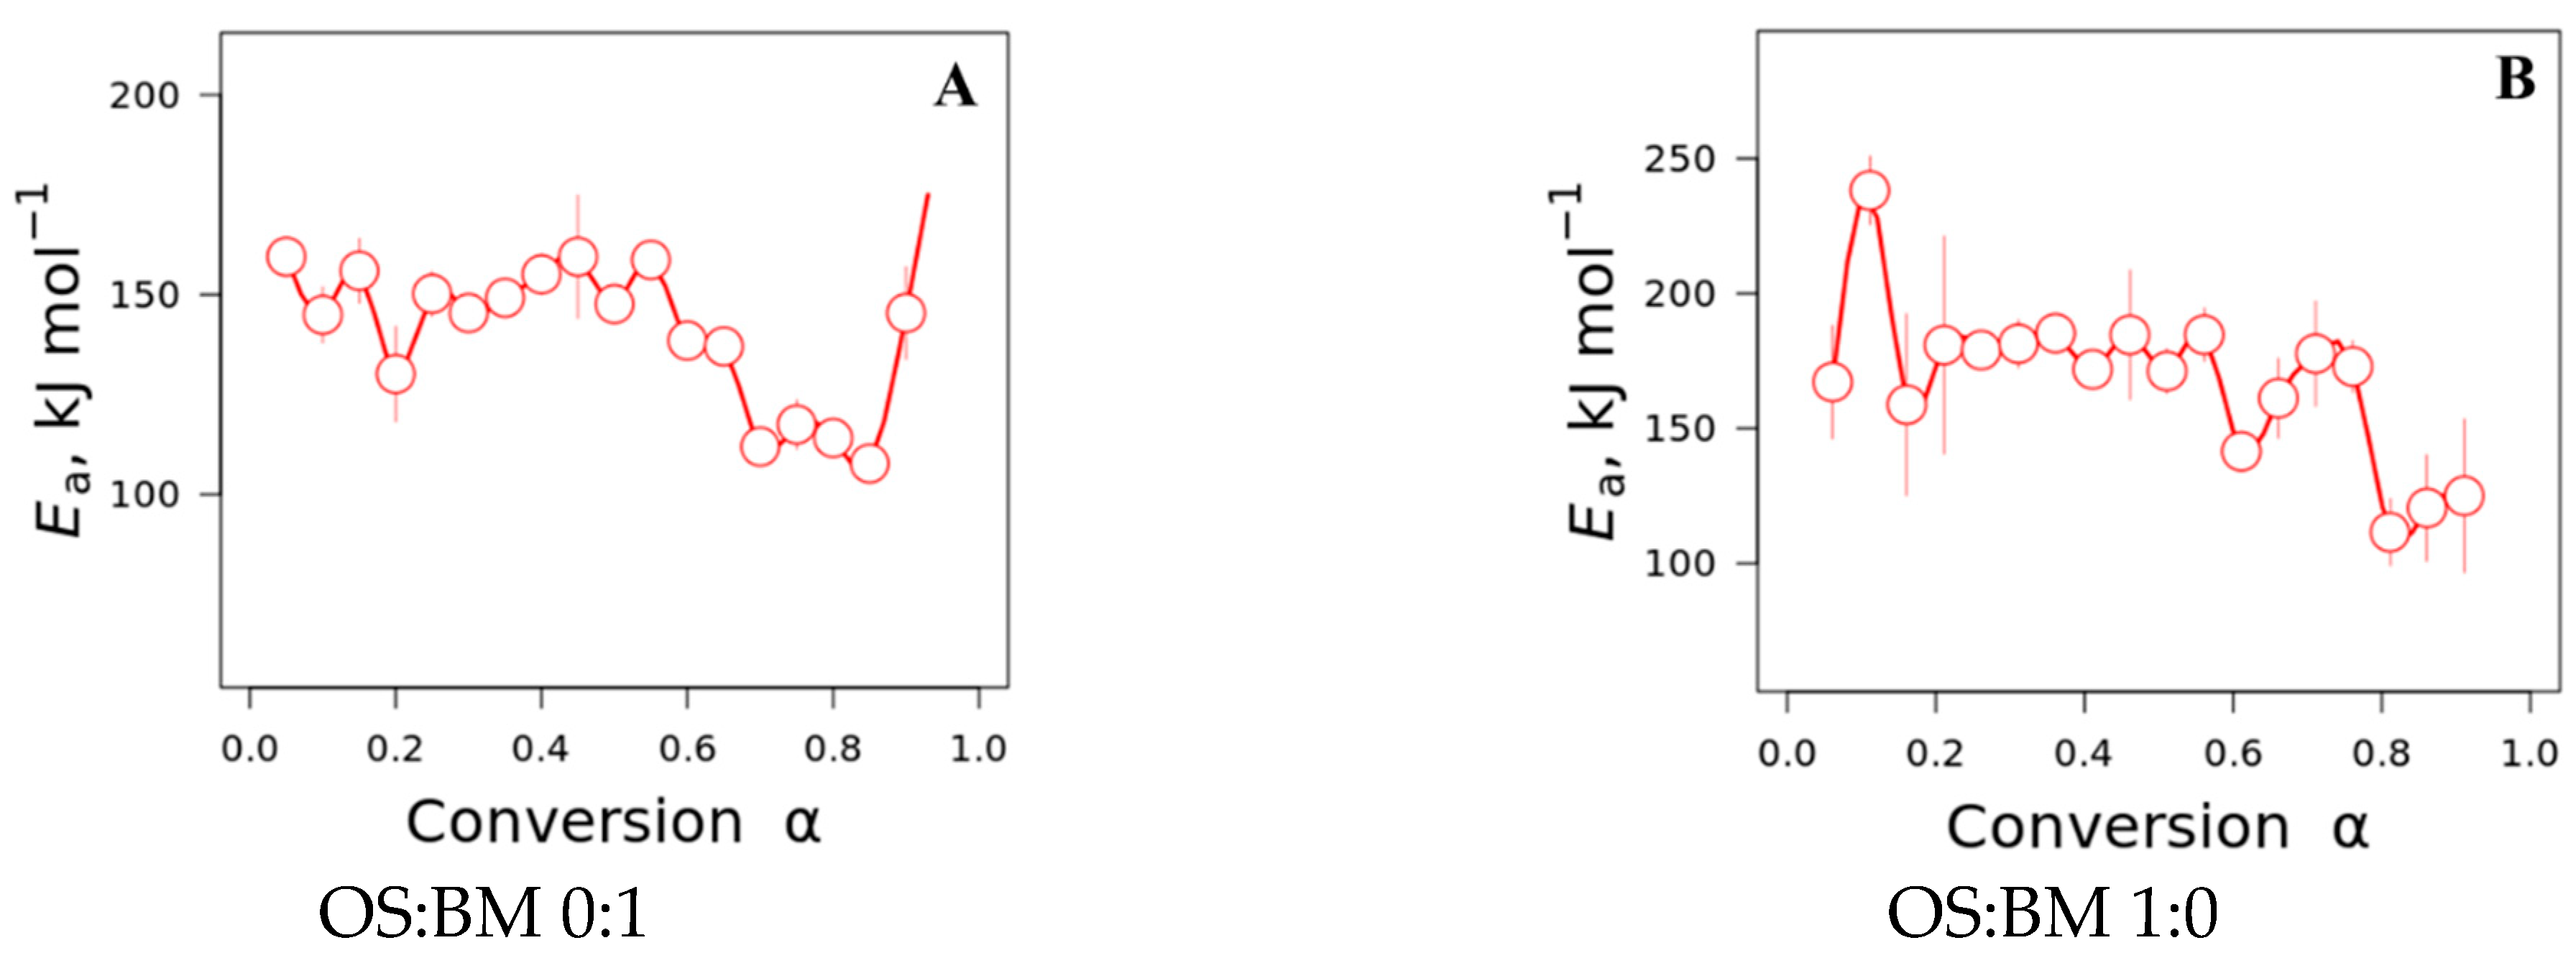
- The interactions between BM and OS were mostly negligible, particularly at low temperatures (<250 °C), while some slight interactions were observed at 350–370 °C and >500 °C, resulting in additive co-pyrolytic behaviour of OS:BM blends, which was further confirmed with the two-stage decomposition observed in the apparent activation energies at different stages of conversion.
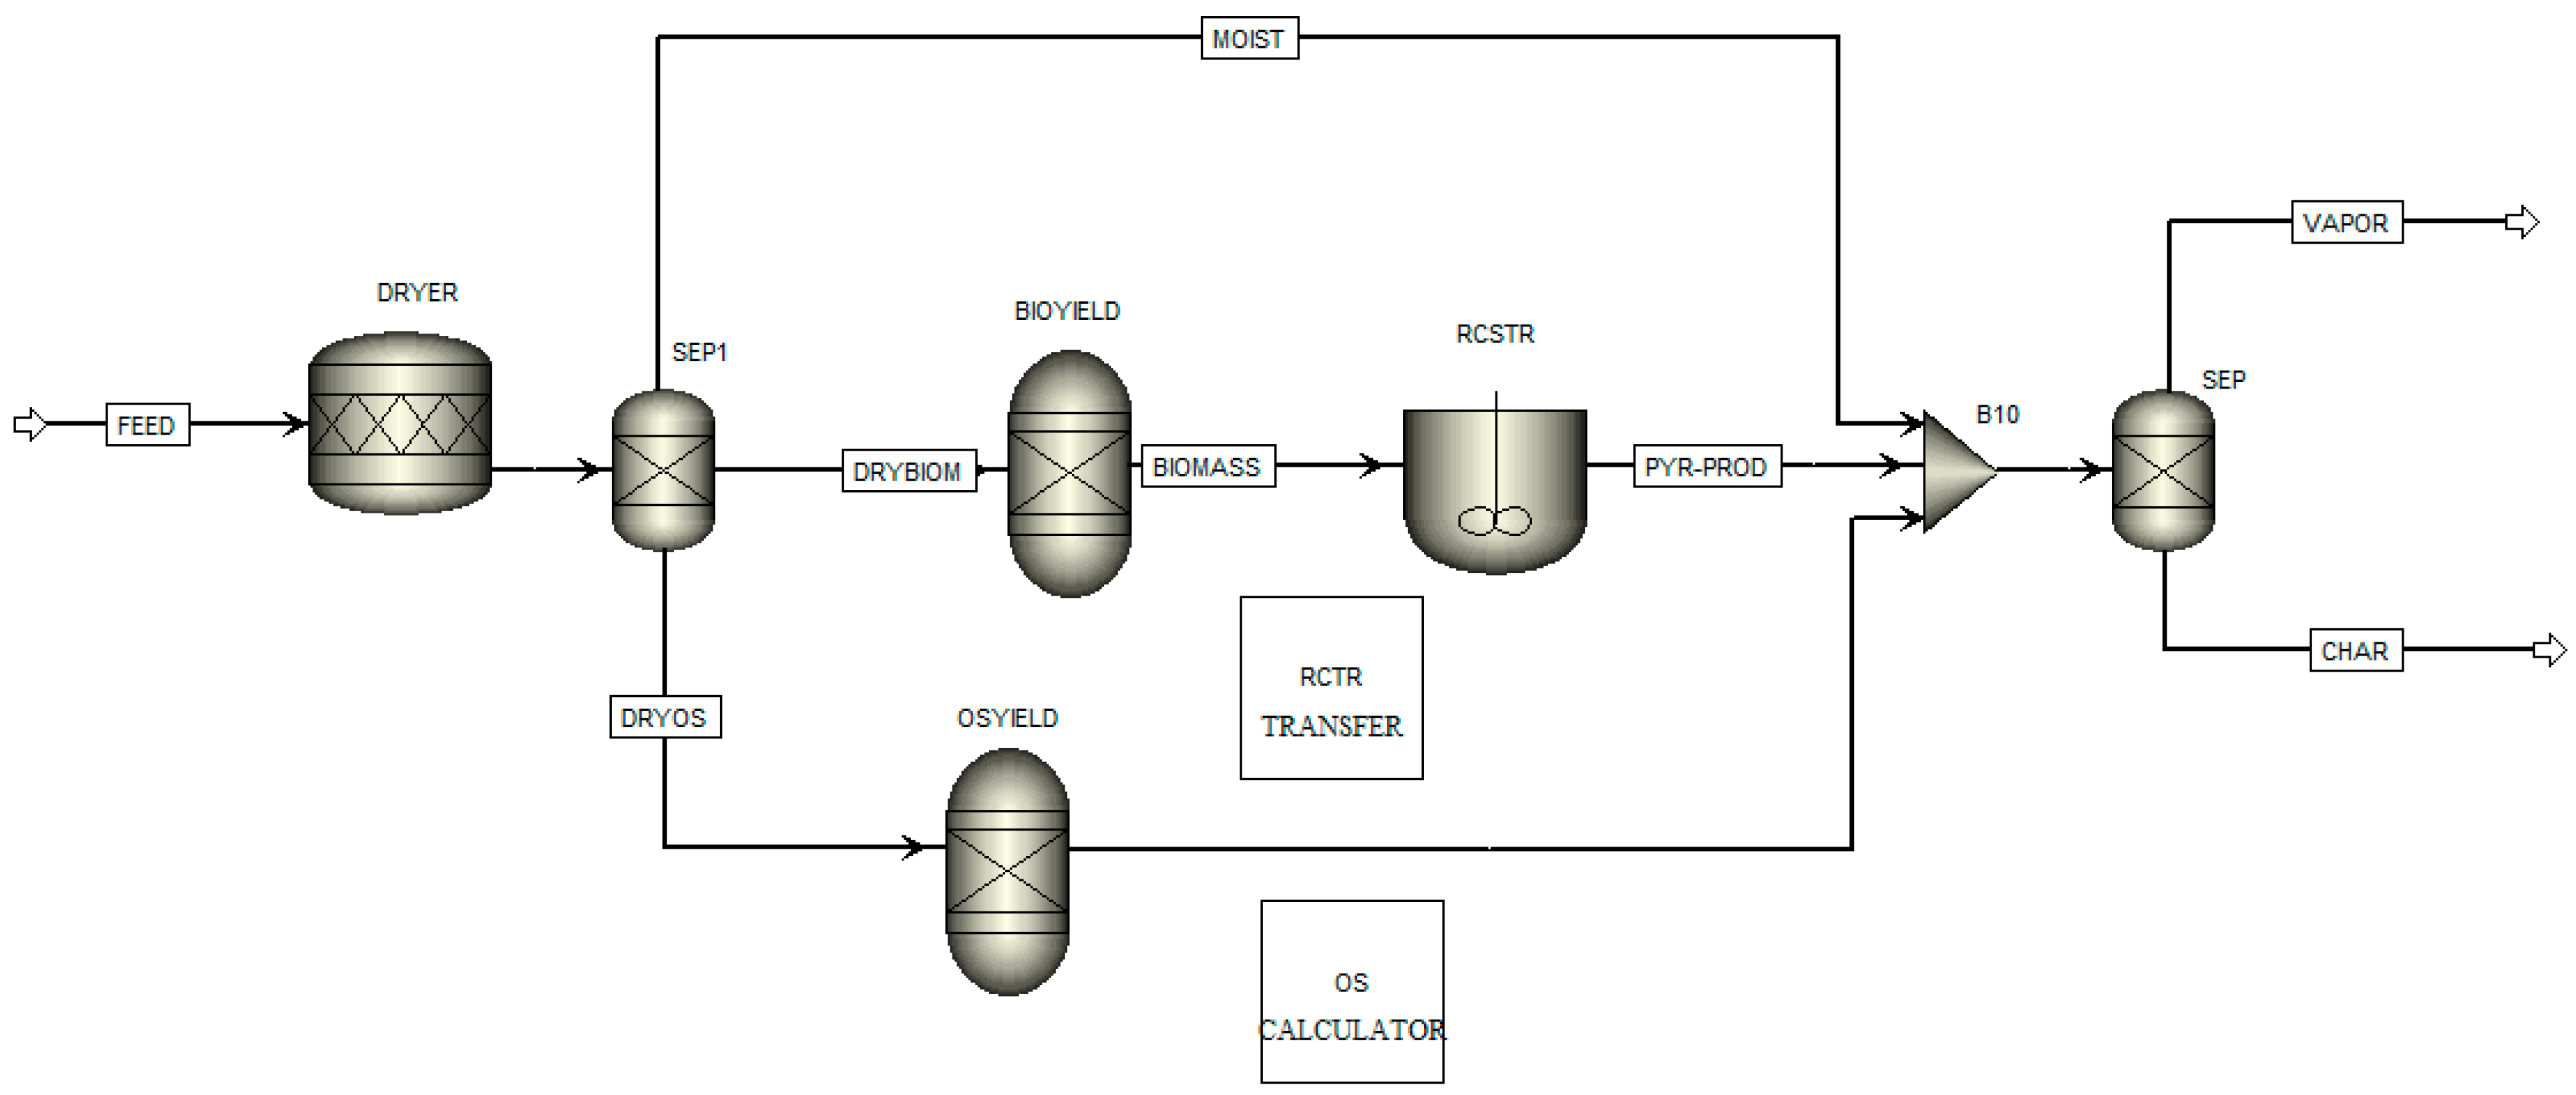
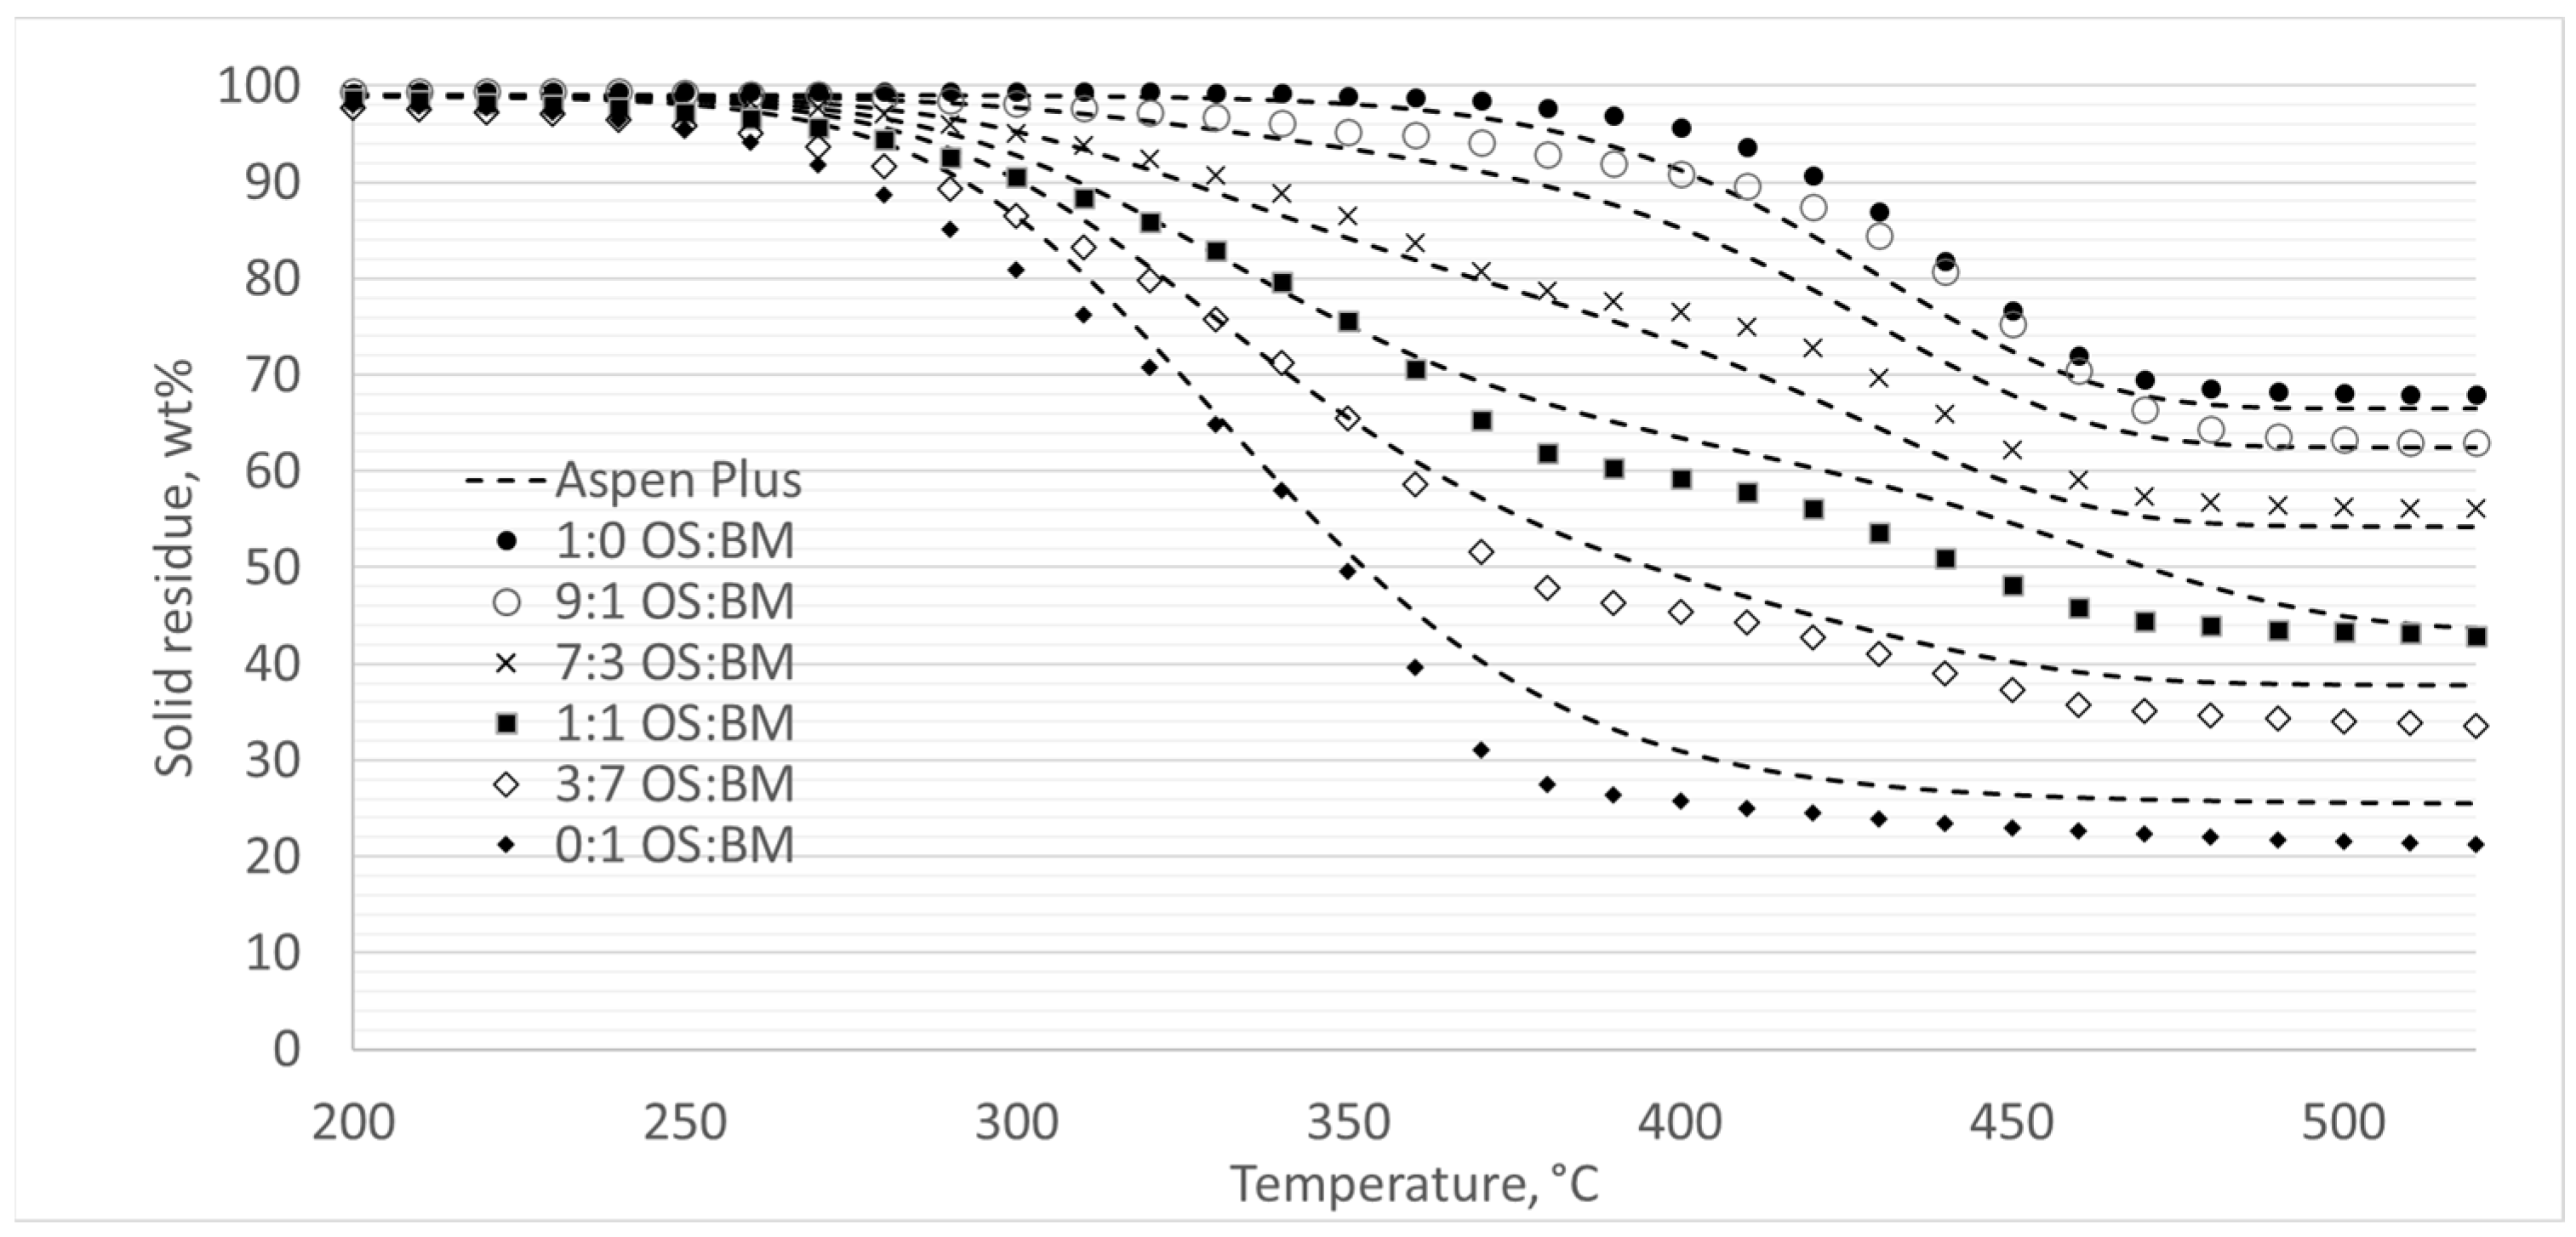
- The Aspen Plus® model can be useful in optimising the TGA pyrolysis experiments, and further studies involving a comparison with experimental data from larger-scaled fixed-bed reactors would unlock the opportunity to directly apply TGA kinetic data in the reactor design.
- Experiments in larger-scale equipment, such as fixed beds or fluidized bed reactors, are proposed as a follow-up path to study the co-pyrolytic behaviour of OS and BM, possible interactions, and the effect of CO2 as a gas atmosphere.
Author Contributions
Funding
Data Availability Statement
Conflicts of Interest
References
- Rogelj, J.; Den Elzen, M.; Höhne, N.; Fransen, T.; Fekete, H.; Winkler, H.; Schaeffer, R.; Sha, F.; Riahi, K.; Meinshausen, M. Paris Agreement climate proposals need a boost to keep warming well below 2 °C. Nature 2016, 534, 631–639. [Google Scholar] [CrossRef]
- Uddin, M.N.; Techato, K.; Taweekun, J.; Rahman, M.M.; Rasul, M.G.; Mahlia, T.M.I.; Ashrafur, S.M. An overview of recent developments in biomass pyrolysis technologies. Energies 2018, 11, 3115. [Google Scholar] [CrossRef]
- Akhtar, A.; Krepl, V.; Ivanova, T. A Combined Overview of Combustion, Pyrolysis, and Gasification of Biomass. Energy Fuels 2018, 32, 7294–7318. [Google Scholar] [CrossRef]
- Han, X.; Kulaots, I.; Jiang, X.; Suuberg, E.M. Review of oil shale semicoke and its combustion utilization. Fuel 2014, 126, 143–161. [Google Scholar] [CrossRef]
- Knaus, E.; Killen, J.; Biglarbigi, K.; Crawford, P. An overview of oil shale resources. ACS Symp. Ser. 2010, 1032, 3–20. [Google Scholar] [CrossRef]
- Wang, Q.; Li, X.; Wang, K.; Zhu, Y. Commercialization and Challenges for the Next Generation of Biofuels: Biomass Fast Pyrolysis. In Proceedings of the 2010 Asia-Pacific Power and Energy Engineering Conference, Chengdu, China, 28–31 March 2010; IEEE: Piscataway, NJ, USA, 2010; pp. 1–4. [Google Scholar]
- Pihu, T.; Konist, A.; Puura, E.; Liira, M.; Kirsimäe, K. Properties and environmental impact of oil shale ash landfills. Oil Shale 2019, 36, 257–270. [Google Scholar] [CrossRef]
- Lees, H.; Järvik, O.; Konist, A.; Siirde, A.; Maaten, B. Comparison of the ecotoxic properties of oil shale industry by-products to those of coal ash. Oil Shale 2022, 39, 1–19. [Google Scholar] [CrossRef]
- Baird, Z.S.; Oja, V.; Järvik, O. The composition of kukersite shale oil. Oil Shale 2023, 40, 25–43. [Google Scholar] [CrossRef]
- Haykiri-Acma, H.; Yaman, S. Interaction between biomass and different rank coals during co-pyrolysis. Renew. Energy 2010, 35, 288–292. [Google Scholar] [CrossRef]
- Quan, C.; Xu, S.; An, Y.; Liu, X. Co-pyrolysis of biomass and coal blend by TG and in a free fall reactor. J. Therm. Anal. Calorim. 2014, 117, 817–823. [Google Scholar] [CrossRef]
- Lan, W.; Chen, G.; Zhu, X.; Wang, X.; Xu, B. Progress in techniques of biomass conversion into syngas. J. Energy Inst. 2015, 88, 151–156. [Google Scholar] [CrossRef]
- Chen, B.; Han, X.; Tong, J.; Mu, M.; Jiang, X.; Wang, S.; Shen, J.; Ye, X. Studies of fast co-pyrolysis of oil shale and wood in a bubbling fluidized bed. Energy Convers. Manag. 2020, 205, 112356. [Google Scholar] [CrossRef]
- Bai, F.; Sun, Y.; Liu, Y.; Li, Q.; Guo, M. Thermal and kinetic characteristics of pyrolysis and combustion of three oil shales. Energy Convers. Manag. 2015, 97, 374–381. [Google Scholar] [CrossRef]
- Yanik, J.; Seçim, P.; Karakaya, S.; Tiikma, L.; Luik, H.; Krasulina, J.; Raik, P.; Palu, V. Low-temperature pyrolysis and co-pyrolysis of Göynük oil shale and terebinth berries (Turkey) in an autoclave. Oil Shale 2011, 28, 469–486. [Google Scholar] [CrossRef]
- Jiang, H.; Deng, S.; Chen, J.; Zhang, L.; Zhang, M.; Li, J.; Li, S.; Li, J. Preliminary Study on Copyrolysis of Spent Mushroom Substrate as Biomass and Huadian Oil Shale. Energy Fuels 2016, 30, 6342–6349. [Google Scholar] [CrossRef]
- Lee, J.; Yang, X.; Cho, S.H.; Kim, J.K.; Lee, S.S.; Tsang, D.C.W.; Ok, Y.S.; Kwon, E.E. Pyrolysis process of agricultural waste using CO2 for waste management, energy recovery, and biochar fabrication. Appl. Energy 2017, 185, 214–222. [Google Scholar] [CrossRef]
- Lee, J.; Oh, J.I.; Ok, Y.S.; Kwon, E.E. Study on susceptibility of CO2-assisted pyrolysis of various biomass to CO2. Energy 2017, 137, 510–517. [Google Scholar] [CrossRef]
- Tang, L.; Yan, Y.; Meng, Y.; Wang, J.; Jiang, P.; Pang, C.H.; Wu, T. CO2 gasification and pyrolysis reactivity evaluation of oil shale. Energy Procedia 2019, 158, 1694–1699. [Google Scholar] [CrossRef]
- Chen, B.; Han, X.; Mu, M.; Jiang, X. Studies of the Co-pyrolysis of Oil Shale and Wheat Straw. Energy Fuels 2017, 31, 6941–6950. [Google Scholar] [CrossRef]
- ISO 16948:2015; Solid Biofuels—Determination of Total Content of Carbon, Hydrogen, and Nitrogen. International Organization for Standardization: Geneva, Switzerland, 2015.
- ISO 16994:2016; Solid Biofuels—Determination of Total Content of Sulfur and Chlorine. International Organization for Standardization: Geneva, Switzerland, 2016.
- ISO 18134-2:2017; Solid Biofuels—Determination of Moisture Content—Oven Dry Method—Part 2: Total Moisture—Simplified Method. International Organization for Standardization: Geneva, Switzerland, 2017.
- ISO 18122:2022; Solid Biofuels—Determination of Ash Content. International Organization for Standardization: Geneva, Switzerland, 2022.
- ISO 18125:2017; Solid Biofuels—Determination of Calorific Value. International Organization for Standardization: Geneva, Switzerland, 2017.
- Sulg, M.; Konist, A.; Järvik, O. Characterization of different wood species as potential feedstocks for gasification. Agron. Res. 2021, 19, 2021. [Google Scholar] [CrossRef]
- ISO 14780:2017; Solid Biofuels—Sample Preparation. International Organization for Standardization: Geneva, Switzerland, 2017.
- ISO 29541:2010; Solid Mineral Fuels—Determination of Total Carbon, Hydrogen, and Nitrogen Content—Instrumental Method. International Organization for Standardization: Geneva, Switzerland, 2010.
- ISO 1928:2020; Coal and Coke—Determination of Gross Calorific Value. International Organization for Standardization: Geneva, Switzerland, 2020.
- EVS 669:2022; Oil Shale. Determination of Ash Content. Estonian Centre for Standardisation (EVS): Tallinn, Estonia, 2022.
- Li, J.; Dou, B.; Zhang, H.; Zhang, H.; Chen, H.; Xu, Y.; Wu, C. Pyrolysis characteristics and non-isothermal kinetics of waste wood biomass. Energy 2021, 226, 120358. [Google Scholar] [CrossRef]
- Wahab, A.; Sattar, H.; Ashraf, A.; Hussain, S.N.; Saleem, M.; Munir, S. Thermochemical, kinetic and ash characteristics behaviour of Thar Lignite, agricultural residues and synthetic polymer waste (EVA). Fuel 2020, 266, 117151. [Google Scholar] [CrossRef]
- Ebrahimi-Kahrizsangi, R.; Abbasi, M.H. Evaluation of reliability of Coats-Redfern method for kinetic analysis of non-isothermal TGA. Trans. Nonferrous Met. Soc. China 2008, 18, 217–221. [Google Scholar] [CrossRef]
- Muravyev, N.V.; Pivkina, A.N.; Koga, N. Critical appraisal of kinetic calculation methods applied to overlapping multistep reactions. Molecules 2019, 24, 2298. [Google Scholar] [CrossRef]
- Friedman, H. Kinetics of Thermal Degradation of Char-Forming Plastics from Thermogravimetry. Appl. Phenolic Plastic. J. Polym. Sci. Part. C Polym. Symp. 2007, 6, 183–195. [Google Scholar] [CrossRef]
- Vyazovkin, S. Modification of the Integral Isoconversional Method to Account for Variation in Activation Energy. J. Comput. Chem. 2001, 22, 178–183. [Google Scholar] [CrossRef]
- Kissinger, H.E. Reaction Kinetics in Differential Thermal Analysis. Anal. Chem. 1957, 29, 1702–1706. [Google Scholar] [CrossRef]
- Baliban, R.C.; Elia, J.A.; Floudas, C.A. Toward novel hybrid biomass, coal, and natural gas processes for satisfying current transportation fuel demands, 1: Process alternatives, gasification modeling, process simulation, and economic analysis. Ind. Eng. Chem. Res. 2010, 49, 7343–7370. [Google Scholar] [CrossRef]
- Mozaffari, S.; Järvik, O.; Baird, Z.S. Composition of gas from pyrolysis of Estonian oil shale with various sweep gases. Oil Shale 2021, 38, 215–227. [Google Scholar] [CrossRef]
- Ranzi, E.; Cuoci, A.; Faravelli, T.; Frassoldati, A.; Migliavacca, G.; Pierucci, S.; Sommariva, S. Chemical kinetics of biomass pyrolysis. Energy Fuels 2008, 22, 4292–4300. [Google Scholar] [CrossRef]
- Han, X.X.; Jiang, X.M.; Cui, Z.G. Studies of the effect of retorting factors on the yield of shale oil for a new comprehensive utilization technology of oil shale. Appl. Energy 2009, 86, 2381–2385. [Google Scholar] [CrossRef]
- Hu, Z.; Ma, X.; Li, L. The synergistic effect of co-pyrolysis of oil shale and microalgae to produce syngas. J. Energy Inst. 2016, 89, 447–455. [Google Scholar] [CrossRef]
- Wang, S.; Luo, Z. Pyrolysis of Biomass; GREEN—Alternative Energy Resources; Walter de Gruyter GmbH: Berlin, Germany, 2017; p. 268. [Google Scholar] [CrossRef]
- Garcia-Perez, M.; Wang, X.S.; Shen, J.; Rhodes, M.J.; Tian, F.; Lee, W.J.; Wu, H.; Li, C.Z. Fast pyrolysis of oil mallee woody biomass: Effect of temperature on the yield and quality of pyrolysis products. Ind. Eng. Chem. Res. 2008, 47, 1846–1854. [Google Scholar] [CrossRef]
- Wang, Q.; Sun, B.; Hu, A.; Bai, J.; Li, S. Pyrolysis characteristics of Huadian oil shales. Oil Shale 2007, 24, 147–157. [Google Scholar]
- Tiwari, P.; Deo, M. Compositional and kinetic analysis of oil shale pyrolysis using TGA-MS. Fuel 2012, 94, 333–341. [Google Scholar] [CrossRef]
- Liu, Q.Q.; Han, X.X.; Li, Q.Y.; Huang, Y.R.; Jiang, X.M. TG-DSC analysis of pyrolysis process of two Chinese oil shales. J. Therm. Anal. Calorim. 2014, 116, 511–517. [Google Scholar] [CrossRef]
- Lyons Cerón, A.; Konist, A. Co-Pyrolysis of Woody Biomass and Oil Shale in a Batch Reactor in CO2, CO2-H2O, and Ar Atmospheres. Energies 2023, 16, 3145. [Google Scholar] [CrossRef]
- Li, S.; Chen, X.; Liu, A.; Wang, L.; Yu, G. Co-pyrolysis characteristic of biomass and bituminous coal. Bioresour. Technol. 2015, 179, 414–420. [Google Scholar] [CrossRef]
- Özsin, G.; Pütün, A.E. TGA/MS/FT-IR study for kinetic evaluation and evolved gas analysis of a biomass/PVC co-pyrolysis process. Energy Convers. Manag. 2019, 182, 143–153. [Google Scholar] [CrossRef]
- Dai, M.; Yu, Z.; Fang, S.; Ma, X. Behaviors, product characteristics and kinetics of catalytic co-pyrolysis spirulina and oil shale. Energy Convers. Manag. 2019, 192, 1–10. [Google Scholar] [CrossRef]
- Bai, J.; Chen, X.; Shao, J.; Jia, C.; Wang, Q. Study of breakage of main covalent bonds during co-pyrolysis of oil shale and alkaline lignin by TG-FTIR integrated analysis. J. Energy Inst. 2019, 92, 512–522. [Google Scholar] [CrossRef]
- Kiliç, M.; Pütün, A.E.; Uzun, B.B.; Pütün, E. Converting of oil shale and biomass into liquid hydrocarbons via pyrolysis. Energy Convers. Manag. 2014, 78, 461–467. [Google Scholar] [CrossRef]
- Ye, J.; Xiao, J.; Huo, X.; Gao, Y.; Hao, J.; Song, M. Effect of CO2 atmosphere on biomass pyrolysis and in-line catalytic reforming. Int. J. Energy Res. 2020, 44, 8936–8950. [Google Scholar] [CrossRef]
- Farrow, T.S.; Sun, C.; Snape, C.E. Impact of CO2 on biomass pyrolysis, nitrogen partitioning, and char combustion in a drop tube furnace. J. Anal. Appl. Pyrolysis 2015, 113, 323–331. [Google Scholar] [CrossRef]
- Cheng, C.-Y.; Kuo, C.-C.; Yang, M.-W.; Zhuang, Z.-Y.; Lin, P.-W.; Chen, Y.-F.; Yang, H.-S.; Chou, C.-T. CO2 Capture from Flue Gas of a Coal-Fired Power Plant Using Three-Bed PSA Process. Energies 2021, 14, 3582. [Google Scholar] [CrossRef]
- Johannes, I.; Tiikma, L.; Luik, H. Synergy in co-pyrolysis of oil shale and pine sawdust in autoclaves. J. Anal. Appl. Pyrolysis 2013, 104, 341–352. [Google Scholar] [CrossRef]
- Van de Velden, M.; Baeyens, J.; Brems, A.; Janssens, B.; Dewil, R. Fundamentals, kinetics and endothermicity of the biomass pyrolysis reaction. Renew. Energy 2010, 35, 232–242. [Google Scholar] [CrossRef]
- Johannes, I.; Kruusement, K.; Veski, R. Evaluation of oil potential and pyrolysis kinetics of renewable fuel and shale samples by Rock-Eval analyzer. J. Anal. Appl. Pyrolysis 2007, 79, 183–190. [Google Scholar] [CrossRef]
- Syed, S.; Qudaih, R.; Talab, I.; Janajreh, I. Kinetics of pyrolysis and combustion of oil shale sample from thermogravimetric data. Fuel 2011, 90, 1631–1637. [Google Scholar] [CrossRef]
- Baqain, M.; Neshumayev, D.; Konist, A. TG-MS analysis and kinetic study of co-combustion of ca-rich oil shale with biomass in air and oxy-like conditions. Carbon. Capture Sci. Technol. 2024, 10, 100162. [Google Scholar] [CrossRef]
- Ochieng, R.; Cerón, A.L.; Konist, A.; Sarker, S. A combined analysis of the drying and decomposition kinetics of wood pyrolysis using non-isothermal thermogravimetric methods. Energy Convers. Manag. X 2023, 20, 100424. [Google Scholar] [CrossRef]
- Maaten, B.; Loo, L.; Konist, A.; Nešumajev, D.; Pihu, T.; Külaots, I. Decomposition kinetics of American, Chinese and Estonian oil shales kerogen. Oil Shale 2016, 33, 167–183. [Google Scholar] [CrossRef]
- Gorensek, M.B.; Shukre, R.; Chen, C.C. Development of a Thermophysical Properties Model for Flowsheet Simulation of Biomass Pyrolysis Processes. ACS Sustain. Chem. Eng. 2019, 7, 9017–9027. [Google Scholar] [CrossRef]
- Debiagi, P.E.A.; Pecchi, C.; Gentile, G.; Frassoldati, A.; Cuoci, A.; Faravelli, T.; Ranzi, E. Extractives Extend the Applicability of Multistep Kinetic Scheme of Biomass Pyrolysis. Energy Fuels 2015, 29, 6544–6555. [Google Scholar] [CrossRef]


| Composition | Woody Biomass [26] | Oil Shale | ||||
|---|---|---|---|---|---|---|
| Norway Spruce | Grey Alder | Scots Pine | Silver Birch | |||
| Elemental analysis [wt%] | C | 50.3 | 49.9 | 50.1 | 49.3 | 27.2 |
| H | 6.6 | 6.6 | 6.6 | 6.6 | 2.8 | |
| N | 0.1 | 0.2 | 0.2 | 0.1 | <0.1 | |
| S | n.d. | n.d. | n.d. | n.d. | 2.0 | |
| O * | 42.7 | 43.0 | 43.1 | 44.0 | 15.4 | |
| Molar ratio | H/C | 1.6 | 1.6 | 1.6 | 1.6 | 1.3 |
| O/C | 0.6 | 0.6 | 0.6 | 0.7 | 0.4 | |
| Proximate analysis [wt%] | Ash content | 0.3 | 0.3 | 0.3 | 0.3 | 52.4 |
| Moisture ** | 6.9 | 7.6 | 8.5 | 7.7 | 0.9 | |
| Fixed carbon | 14.2 | 14.0 | 14.5 | 12.8 | 1.5 | |
| Volatile matter | 85.5 | 85.7 | 85.2 | 86.9 | 46.1 | |
| Calorific value [MJ/kg] | LHV | 18.6 | 18.5 | 18.4 | 18.0 | 8.7 |
| HHV | 20.0 | 19.9 | 19.8 | 18.1 | 9.7 | |
| Heating Rate, °C/min | ||||||
|---|---|---|---|---|---|---|
| 10 | 20 | 30 | ||||
| Blend OS:BM | Mass Loss, wt% | Mass Loss, wt% | Mass Loss, wt% | |||
| exp. | th. | exp. | th. | exp. | th. | |
| 0:1 | 78.8 | - | 79.7 | - | 80.9 | - |
| 3:7 | 66.7 | 64.8 | 65.4 | 66.0 | 62.3 | 66.9 |
| 1:1 | 57.1 | 55.5 | 58.7 | 56.9 | 54.9 | 57.1 |
| 7:3 | 43.9 | 46.2 | 48.2 | 47.8 | 46.9 | 47.3 |
| 9:1 | 36.2 | 36.9 | 39.3 | 38.7 | 37.7 | 37.5 |
| 1:0 | 32.3 | - | 34.1 | - | 32.6 | - |
| OS:BM | E, kJ/mol | RSD, % | R2 | n |
|---|---|---|---|---|
| 0:1 | 96.73 | 1.82 | 0.9926 | 1.7–1.8 |
| 3:7 | 85.33 | 1.26 | 0.9945 | 1.6-1.7 |
| 1:1 | 77.44 | 1.47 | 0.9901 | 1.4–1.5 |
| 7:3 | 69.90 | 0.48 | 0.9878 | 1.0–1.2 |
| 9:1 | 66.13 | 2.50 | 0.9854 | 0.3–1.0 |
| 1:0 | 58.89 | 7.80 | 0.9388 | 0.1 |
| OS:BM | Coats–Redfern | Kissinger | Friedman | Vyazovkin | |||||
|---|---|---|---|---|---|---|---|---|---|
| E, kJ/mol | R2 | E, kJ/mol | R2 | E, kJ/mol | R2 | A, min−1 | E, kJ/mol | Ω | |
| 0:1 | 96.7 | 0.9926 | 147.4 | 0.984 | 139.3 | 0.99101 | 2.95 × 10⁹ | 140.4 | 30.0138 |
| 3:7 | 85.3 | 0.9945 | 179.4 | 0.997 | 154.7 | 0.97557 | 5.95 × 10⁹ | 156.8 | 30.2506 |
| 1:1 | 77.4 | 0.9901 | 152.9 | 0.997 | 164.3 | 0.97786 | 5.25 × 10¹¹ | 163.1 | 30.1756 |
| 7:3 | 69.9 | 0.9878 | 145.9 | 0.947 | 197.3 | 0.89704 | 7.39 × 10¹¹ | 193.0 | 30.9744 |
| 9:1 | 66.1 | 0.9854 | 172.9 | 0.988 | 153.6 | 0.80934 | 2.94 × 10⁸ | 153.4 | 21.1926 |
| 1:0 | 58.9 | 0.9388 | 160.2 | 0.979 | 167.4 | 0.95007 | 2.34 × 10⁹ | 171.5 | 30.1077 |
| Blend OS:BM | Feedstock | Conversion, α | Friedman |
|---|---|---|---|
| Ea [kJ/mol] | |||
| 3:7 | BM | 0.05–0.8 | 146.6 |
| OS | 0.8–0.95 | 192.6 | |
| 1:1 | BM | 0.05–0.7 | 150.1 |
| OS | 0.7–0.95 | 198.1 | |
| 7:3 | BM | 0.05–0.45 | 200.9 |
| OS | 0.45–0.95 | 194.1 | |
| 9:1 | BM | 0.05–0.25 | 114.0 |
| OS | 0.8–0.95 | 170.1 |
| Biomass | A (s−1) | E (kJ/mol) | |
| Hemicellulose | 2.41 × 10⁸ | 141 | |
| Cellulose | 2.42 × 10⁹ | 147 | |
| Lignin | 3.90 × 10⁸ | 157 | |
| Oil shale | - | 2.03 × 10⁹ | 161 |
Disclaimer/Publisher’s Note: The statements, opinions and data contained in all publications are solely those of the individual author(s) and contributor(s) and not of MDPI and/or the editor(s). MDPI and/or the editor(s) disclaim responsibility for any injury to people or property resulting from any ideas, methods, instructions or products referred to in the content. |
© 2024 by the authors. Licensee MDPI, Basel, Switzerland. This article is an open access article distributed under the terms and conditions of the Creative Commons Attribution (CC BY) license (https://creativecommons.org/licenses/by/4.0/).
Share and Cite
Lyons Ceron, A.; Ochieng, R.; Sarker, S.; Järvik, O.; Konist, A. Co-Pyrolysis of Woody Biomass and Oil Shale—A Kinetics and Modelling Study. Energies 2024, 17, 1055. https://doi.org/10.3390/en17051055
Lyons Ceron A, Ochieng R, Sarker S, Järvik O, Konist A. Co-Pyrolysis of Woody Biomass and Oil Shale—A Kinetics and Modelling Study. Energies. 2024; 17(5):1055. https://doi.org/10.3390/en17051055
Chicago/Turabian StyleLyons Ceron, Alejandro, Richard Ochieng, Shiplu Sarker, Oliver Järvik, and Alar Konist. 2024. "Co-Pyrolysis of Woody Biomass and Oil Shale—A Kinetics and Modelling Study" Energies 17, no. 5: 1055. https://doi.org/10.3390/en17051055
APA StyleLyons Ceron, A., Ochieng, R., Sarker, S., Järvik, O., & Konist, A. (2024). Co-Pyrolysis of Woody Biomass and Oil Shale—A Kinetics and Modelling Study. Energies, 17(5), 1055. https://doi.org/10.3390/en17051055


