Abstract
In recent years, there has been a growing emphasis on the efficient utilization of natural resources across various facets of life. One such area of focus is transportation, particularly electric mobility in conjunction with the deployment of renewable energy sources. To fully realize this objective, it is crucial to quantify the probability of achieving the desired state—production exceeding consumption. This article deals with the computation of the probability that the energy required to charge an electric vehicle will originate from a renewable source at a specific time and for a predetermined charging duration. The base of the model lies in artificial neural networks, which serve as an ancillary tool for the actual probability assessment. Neural networks are used to forecast the values of energy production and consumption. Following the processing of these data, the probability of energy availability for a given day and month is determined. A total of seven scenarios are calculated, representing individual days of the week. These findings can help users in their decision-making process regarding when and for how long to connect their electric vehicle to a charging station to receive assured clean energy from a local photovoltaic source.
1. Introduction
The European Union is currently embarking on a significant endeavor to comprehensively implement and integrate electromobility. However, the utilization of electromobility is also intricately intertwined with other technological and energy chains. The most critical factor for the efficient deployment of electric vehicles is the development of a high-quality and dependable charging infrastructure [1].
To enhance the energy efficiency of the charging process, several prerequisites must be met. Firstly, charging points must be compatible with the specific type of vehicle being charged and must exhibit exceptional efficiency in converting grid energy into vehicle energy. Secondly, charging points must be conveniently accessible to users in a reasonable timeframe and location.
The final and most crucial stage in the energy chain is the power supply to the charging station. The overall efficiency and effectiveness of the charging process are intrinsically linked to the type of energy source utilized. In general, the greater the distance between the energy source and the charging station, the lower the process’s efficiency [2,3].
One approach to enhancing the charging process’s efficiency is to utilize a localized energy source. A photovoltaic (PV) source, if appropriately designed, can supply sufficient energy for charging while incurring minimal transmission losses. This is due to the minimized transmission distance, which is typically only a few meters in the instance of a PV system situated at the charging station. Local energy generation can substantially boost the charging process’s efficiency, leading to a reduction in overall charging costs [3].
It is noteworthy that photovoltaic (PV) sources are weather-dependent and consequently more variable than conventional energy sources. However, to a certain extent, this variability can be anticipated. It is possible to calculate, with a high degree of precision, the probability of when energy from a PV source will be available in an adequate quantity to satisfy the demands of a charging station. In an ideal situation, the PV source can even produce more energy than is immediately required to charge an electric vehicle [4].
To calculate the probability that a photovoltaic (PV) source can fulfill charging demands, it is necessary to develop models capable of forecasting electrical energy production and consumption. A crucial aspect of the probability calculation is the necessity to understand charging station users’ usage patterns over time. These insights are essential for determining the probability that the charging station consumption demand will be met [4,5].
The models can be developed using a variety of techniques, including statistical analysis, machine learning and artificial intelligence. The models must take into account a variety of factors, including the location of the charging station, meteorological conditions, and the driving habits of the users.
Once the models have been developed, they can be used to calculate the probability of a PV source meeting the charging requirements for a given location and time period. This knowledge can be used to help charging station operators make informed decisions about the size and type of the PV system to install.
It is important to consider scenarios where the output of a PV system is insufficient to meet the charging demand. In these cases, the energy required for charging will have to come from the primary distribution grid. The probability of this occurring can be calculated using the models discussed above. These data can be used by grid operators to strategize their operations and ensure adequate energy availability to meet demands. In addition to planning, grid operators can also use the insights from the models to synchronize the operation of their equipment. This can help to improve grid efficiency and minimize energy waste [4,5,6,7].
The main impetus of this article is to determine the probability that the energy required to charge an electric vehicle at a particular charging station will be sourced from a local supplier. This information can enable users to make informed decisions about the timing of their vehicle charging sessions. For example, individuals who prioritize the environmental impact of their charging practices may choose to charge their vehicles at times when it is more probable that energy will be supplied by a local source. This approach can help to reduce the overall carbon footprint associated with electric vehicle charging. The probability of the local energy supply can be calculated using models that take into account a variety of factors, including the location of the charging station, meteorological conditions, and the driving patterns of the users.
The introduction to the article provides an overview of the current state of research on calculating the probability of the use of electric vehicle charging stations. The authors consider two main perspectives from which to approach this challenge:
- The first perspective involves predicting the amount of energy that will be available at a specific time and location. It can be used to determine the probability of a charging station meeting the demand for charging.
- The second perspective focuses on understanding user behavior in terms of when and where they choose to charge their electric vehicles. This information can be used to calculate the probability of a charging station being used at a specific time and location.
Section 2 discusses the methodology and approach used by the authors to calculate the probability of utilizing charging stations from both perspectives. Statistical models and machine learning techniques, including neural networks, were combined to forecast energy production and consumption. Furthermore, the authors conducted a survey of electric vehicle users to collect data about user behavior. Section 3 presents the authors’ investigation outcomes. It was found, with the usage of the methodologies outlined in this article, the probability of using a charging station can be predicted with high precision. Section 8 investigates the implications of the authors’ findings. The authors assert that their approach can enhance the efficiency and sustainability of electric vehicle charging.
2. Prediction of Power Production and Consumption—A Literature Overview
The prediction of energy production from a photovoltaic power plant and the prediction of occupancy and demand for power to charge electric vehicles are both well-researched topics. However, they are often studied independently, which may not be the optimal solution in all scenarios.
2.1. Charging Station Occupancy
The occupancy of charging stations is a crucial metric for evaluating the usage of electric vehicle (EV) charging infrastructure. It measures the percentage of time that a charging station is occupied and provides valuable insights into the demand for EV charging services. By analyzing occupancy patterns, stakeholders can make informed decisions about the placement, maintenance, and pricing of charging stations.
Ref. [8] explores the availability of data on electric vehicle (EV) charging stations and their energy consumption. The authors highlight the importance of these data in enabling further analysis, such as probabilistic impact assessments of EVs. The study analyzes data from various sources, including surveys of EV users, data from charging station operators, and meteorological data. The authors found that the utilization of charging stations can be modeled through the usage of various probability distributions, depending on the type and location of the station.
Ref. [9], the authors introduce a mathematical simulation technique to investigate the operational state of charging stations, taking into account multiple factors. The simulation technique is used to generate data on the harmonic currents produced by charging stations. The data are used to calculate the probabilistic harmonic power flow, which serves as an index of the impact of charging stations on the power grid.
Ref. [10], the authors used big data and machine learning techniques to evaluate real-time data from electric vehicle charging stations. They presented an architecture that can handle data streams from the charging infrastructure to predict the availability of an electric charging station after a designated time interval.
Ref. [11], the authors developed a machine-learning-based procedure to predict the occupancy status of electric vehicle charging infrastructure for the following day. The study employed two classifiers, namely a gradient boosting classifier and a random forest classifier. The authors found that the proposed procedure can accurately predict the occupancy status of the charging infrastructure. The procedure can improve the efficiency and reliability of the charging infrastructure.
Ref. [12], the authors proposed a novel hybrid neural network that uses long-term and short-term memory to predict the discrete charging occupancy state in multiple steps. The LSTM network captures long-term trends, while the STM network captures short-term fluctuations. The two networks are combined to predict the occupancy state at a given time. The authors compared the performance of the proposed network to existing LSTM networks and found that it achieved superior accuracy based on various metrics. The proposed network is a promising approach to improve the accuracy of multi-step occupancy state prediction.
Ref. [13] explores the factors that affect the charging load of electric vehicles (EVs) and derives the load curve for various charging modes. The constructed model enables the calculation of diverse charging frequencies of EVs, taking into account the starting point for the state of charge (SOC) daily mileage.
In ref. [14], the authors use data from the Adaptive Charging Network to examine public and workplace charging. Their aim is to forecast the occupancy of individual charging stations, as well as the overall occupancy of the location. The authors frame the prediction of the occupancy of individual charging points as a classification problem, while predicting the overall occupancy is cast as a regression problem. The study suggests that models trained on data from all charging points in the location generally perform slightly better at the median than models trained on individual charging points.
In ref. [15], the authors introduce a data-driven approach to examine the overloading of PEV charging stations. It utilizes a data-driven PEV charging station scheduling model and queuing theory to model and analyze the overloading phenomenon in the scheduling outcomes. The paper proposes a novel framework for comprehending and mitigating overloading in the PEV charging infrastructure.
In work [16], the authors present a probabilistic approach for the optimal charging of electric vehicles in distribution systems. The paper proposes an approach that uses Monte Carlo simulation (MCS) to assess the stochastic nature of the problem in the secondary (low-voltage) distribution network.
The ref. [17] presents a large-scale PEV charging station that is equipped with onsite storage. To address the probabilistic nature of customer demand, the authors propose an architecture modeled based on a Markov-modulated Poisson process. They also develop an algorithm based on matrix geometry to solve the associated capacity planning challenge. Table 1 presents a summary of the literature review on charging station occupancy.

Table 1.
Summary of the literature review on charging station occupancy.
The data on electric vehicle (EV) charging stations are crucial for understanding and optimizing the EV charging infrastructure. This information is valuable for predicting charging station occupancy, designing efficient charging schedules, and avoiding potential overloading concerns. Machine learning techniques are highly effective in analyzing EV charging station data, as they can capture complex relationships between various factors and accurately predict future patterns.
The reviewed studies emphasize the importance of EV charging station data and the potential of machine learning techniques to extract valuable insights from it. The availability and integrity of EV charging station data will become increasingly important for managing and optimizing the EV charging infrastructure as the number of EVs increases. It is crucial to maintain objectivity and avoid biased language when discussing this topic.
2.2. Power Consumption of Charging Station
Understanding power consumption at electric vehicle (EV) charging stations is crucial for comprehending the overall energy demand of the EV charging infrastructure. This metric represents the amount of electricity consumed by EVs at a charging station, which influences the station’s capacity, operational costs, and environmental footprint.
Ref. [18] introduces an optimization framework for EV charging planning in a vehicular ad hoc network (VANET) topology. The authors present the fractional feedback tree algorithm (FFTA) as a solution for the charging scheduling in EV networks. FFTA integrates the artificial feedback tree algorithm (FAT) and fractional counting (FC) to achieve optimal charging outcomes.
In ref. [19], the authors propose a novel model for estimating the duration of charging events in real-time, which enables the prediction of user wait times at fully occupied charging stations. The model is based on a random forest regressor (RF) that is enhanced through automatic data augmentation.
In ref. [20], the authors compare the performance of four deep learning models in predicting charging demand: artificial neural networks (ANNs), recurrent neural networks (RNNs), long short-term memory (LSTM), and gated recurrent units (GRUs). The authors used a dataset of historical charging data to train the models and evaluated their performance based on real-world charging data. The results show that the GRU regression approach goes one better than the other three methods in estimating the need for charging energy. Notably, the GRU regression model exhibits a root mean squared error (RMSE) and mean absolute percentage error (MAPE) of 1.39% and 0.50% in the training phase and 2.90% and 0.76% in the testing phase.
In ref. [21], the authors address the issue of planning charging stations for electric vehicles (EVs) based on dynamic charging demand. They introduce a technique for predicting the dynamic EV charging demand by analyzing the travel patterns of EV users through the trip chain approach. The proposed method was evaluated on the IEEE-33 test network.
In ref. [22], the authors present a multi-objective model for quantitatively forecasting and allocating resources for electric vehicle charging stations in the U.S. context. The model was validated and found to be applicable to countries with diverse demographic distributions. In another paper [23], the authors propose a methodology for planning electric vehicle (EV) charging stations, which relies on a backpropagation (BP) the neural network.
Ref. [24] proposes a methodology for constructing an algorithm to estimate the occupancy of an electric vehicle (EV) charging station by cascading two machine learning models. The algorithm consists of two submodels. The first submodel predicts the probability of the charging station being occupied by users, trained on a dataset of historical EV charging data. The second submodel anticipates the probability of new users arriving at the charging station. The submodel used to generate these forecasts was trained on a dataset of historical traffic data. This article outlines daily probabilistic forecasts of the availability and speed of charging at plug-in electric vehicle charging stations. Generalized linear models with logistic link functions were employed. The findings suggest that the efficiency of predictive models is largely conditional or depends on the charging station’s characteristics. Table 2 presents a summary of the literature review on the power consumption of charging stations.
Table 2.
Summary of the literature review of power consumption of charging stations.
The planning and management of EV charging stations passes through dynamic advancements due to the surge in demand for EVs. Recent papers have been examined, each offering novel methodologies for optimizing the EV charging infrastructure. The findings highlight the pivotal role of machine learning and deep learning techniques in enhancing the efficiency and effectiveness of EV charging systems.
The investigations demonstrate that the machine learning-driven approaches can accurately forecast charging demand, devise optimal charging station locations, and allocate charging station resources with precision. These methods have the potential to enhance the efficiency and utilization of the EV charging infrastructure, which is crucial for facilitating the widespread adoption of EVs.
2.3. Photovoltaic Power Plant Power Prediction
Accurately predicting the power output of photovoltaic (PV) power plants is crucial for managing and optimizing their integration into the grid. This enables grid operators to balance supply and demand, reduce curtailment, and improve overall system efficiency.
The SolarPredictor model, introduced in [25], effectively addresses the limitations of publicly available prediction models. To achieve high prediction accuracy, the authors trained the model on authentic weather forecasts, including errors and miscalculations. They also created a SolarDB data set that contains one year of energy production data for 16 power plants to supplement the incomplete data. The dataset includes hourly weather forecasts and seven days of historical data, allowing the model to predict errors in meteorological attributes.
Ref. [26] deals with the challenge of forecasting photovoltaic (PV) energy by using new hybrid data-driven models. The proposed models combine Support Vector Regression (SVR) and an Artificial neural network (ANN) with various metaheuristic optimization algorithms, including Social Spider Optimization, Particle Swarm Optimization, Cuckoo Search Optimization, and the Neural Network Algorithm. The paper [27] addresses the PV power prediction problem by presenting a unified methodology for hourly average daily PV power prediction with improved accuracy, based on data-driven machine learning techniques and statistical post-processing. Based on the results, it was found, that the neural network-based prediction with a priori improved the accuracy of power prediction by correcting the metrological data.
Study [28] provides a comprehensive and systematic review of recent developments in solar photovoltaic (PV) power prediction methods, with a particular focus on data-driven approaches. It critically evaluates recent research on solar PV power forecasting, highlighting both the strengths and limitations of the techniques or models used.
Ref. [29] presents a daily forecasting method for photovoltaic (PV) power plants based on numerical weather prediction (NWP) models from open weather maps and power plant specifications. The model’s output, which is the forecasted PV plant output, is integrated into an optimal PV control strategy that utilizes battery storage.
The research in [30] focuses on predicting PV output using BP neural networks. The simulation results demonstrate that the GA-BP and PSO-BP grid prediction models achieve remarkable prediction accuracy. This suggests that the GA and PSO methods can effectively reduce prediction errors compared to the original BP model. In particular, PSO demonstrates superior applicability over GA and also diminishes PV power prediction model errors.
The aim of the work [31] is to establish a dependable short-term power generation forecast for PV solar power systems. The study focuses on using a deep learning approach that relies on long-term short-term memory (LSTM) to predict power generation in PV systems. The findings suggest that this approach shows promise in predicting production outcomes.
In [32], the authors investigate the prediction of PV plant operation based on short-term forecasts and propose a multi-level hierarchical system for solar power plant production planning. The study reveals a comparison between naive persistent, autoregressive, and autoregressive moving average models with modifications to the corresponding parameters.
In ref. [33], the authors deal with the prediction of PV power generation using Long Short-Term Memory Recurrent Neural Network (LSTM-RNN) models. They assess the accuracy of two forecasting strategies: recursive strategy and non-recursive multiple-input and multiple-output.
Table 3 reviews the literature and highlights advancements in photovoltaic power plant power prediction. The studies reviewed demonstrate the various methods and techniques employed to predict PV power generation.
Table 3.
Summary of the literature review of photovoltaic power plant power prediction.
The prediction of power in photovoltaic (PV) power plants is crucial for optimizing grid operations, maximizing energy production, and improving the overall efficiency of renewable energy integration. Various methods have been developed for PV power prediction, ranging from physical models to machine learning-based approaches. The choice of the appropriate prediction method depends on factors, such as data availability, prediction accuracy requirements, and computational resources.
Recent research has focused on developing more precise and reliable methods for predicting PV power. To capture intricate relationships between input data and power output, this approach involves integrating cutting-edge machine learning techniques, such as deep learning.
Additionally, researchers are investigating the usage of hybrid models that combine aspects of physical, statistical, and machine learning approaches to determine the limitations of individual methods.
Research gaps
In the field of electric vehicle (EV) charging infrastructure, a significant amount of research has been conducted. A major research challenge, as highlighted in recent studies, is the difficulty in obtaining relevant input data. The success of any charging model is closely connected to the availability of a significant amount of relevant input data. This literature review covers models for individual concepts separately. It is necessary to integrate individual models and approaches to optimize the entire chain (from generation to consumption) in the context of electric vehicle charging. Based on a literature review, the most viable option is to use artificial neural networks. These networks have the remarkable ability to articulate the interdependencies among various independent variables throughout the charging network with high precision.
2.4. Comparison with State-of-the-Art Concepts
The article aims to determine the probability of using PV energy for electric vehicle charging by utilizing two independent artificial neural network models.
The paper uses a novel fusion of two neural networks to assess the probability of using electricity from a local photovoltaic source to power a charging station or charge an electric vehicle. The research concept is based on the integration of two neural networks. The two neural networks predict the consumption of charging stations and the output of photovoltaic power plants. Based on these predictions, the probability of using the energy for electric vehicle charging is calculated. This approach enables informed decision-making for individual electric vehicle users, customized to their charging preferences.
In contrast to previous studies, the proposed concept is based on using two independent input datasets to construct neural networks. These networks calculate the probability of energy usage from a photovoltaic power plant to charge electric vehicles.
There are various models in the literature and most of them are focused on a specific domain, such as PV source production. The article proposes the amalgamation of models to estimate the probability of energy usage from a photovoltaic power plant to charge electric vehicles. The model combines the strengths of individual approaches to provide valuable outputs for electric vehicle users’ decision-making processes. This will lead to an improvement in energy distribution, modify user behavior, and ultimately enhance the utilization of local energy sources, thereby augmenting the overall energy efficiency of the entire process.
A comparison with the state-of-the-art analysis is presented in three sections, each of which analyzes a specific domain. Within each section, a table summarizes the methodologies employed, primary focus, prominent strengths, and notable weaknesses. In conclusion, potential synergies arising from the combined use of these individual approaches are described.
- Comparison with charging station occupancy models
Table 4 presents a comparison between article methodology and charging station occupancy models.
Table 4.
Comparison with charging station occupancy models.
Article:
This presents a user-centric model using neural networks to estimate the probability of charging an electric vehicle with renewable energy at a given time and duration. This approach directly addresses user decision making but is limited to localized photovoltaic sources and requires accurate predictions.
Papers [8,9,10,11,12,13,14,15,16,17]:
These offer a broader range of data-driven approaches that include charging station data analysis, probabilistic modeling, machine learning, and optimization algorithms. These studies provide valuable insights into charging station utilization, harmonic effects, occupancy prediction, charging load modeling, and optimal charging strategies. However, they may not directly address renewable energy integration.
Potential synergies:
While both approaches have distinct strengths, there is significant potential for synergy by combining them:
- Leveraging user-centricity with data-driven insights, user decision making informed by real-time occupancy prediction (Papers [11,12,14]) could enhance the user-centric model of the Article. In addition, incorporating insights into harmonic impacts (Paper [9]) could inform grid-integration strategies.
- Widening the scope with the integration of renewables, integrating the data-driven approaches of Papers [8,9,10,11,12,13,14,15,16,17] with the renewable energy focus of the Article could lead to more comprehensive solutions. For example, probabilistic charging optimization (Paper [16]) could be adapted to take into account renewable energy availability.
- 2.
- Comparison with power consumption of charging station models
Table 5 presents a comparison between article methodology and the power consumption of charging station models.
Table 5.
Comparison with power consumption of charging station models.
Article:
This approach focuses on enabling users to make informed decisions about maximizing their reliance on renewable energy sources when charging their EVs. It uses neural networks to predict the likelihood of charging an EV from local, predictable renewable sources, such as photovoltaic panels, at specific times and durations. This offers the following:
Papers [18,19,20,21,22,23,24]:
The approach uses various data-driven strategies for more comprehensive EV charging management, including scheduling, demand forecasting, and infrastructure planning. Methods include optimization algorithms, machine learning, travel pattern analysis, and neural networks.
Potential synergies:
By combining these approaches, significant progress can be made in developing user-friendly and comprehensive EV charging solutions:
- Improved user decision making: The integration of real-time predictions from Papers [19,20,24] into the user-centric approach can inform users of optimal charging times based on renewable availability, waiting times, and station occupancy.
- Integration of renewable energy: The use of optimization algorithms (Paper [18]) and demand forecasting (Papers [20,22]) within the user-centric approach can maximize the use of clean energy while meeting user needs.
- Data-driven optimization with user-centricity: Combining optimization with predictive models (Papers [21,22]) can improve efficiency and resource allocation, while travel pattern analysis (Paper [21]) can inform charging station planning in consideration of user needs and future demand.
- 3.
- Comparison with photovoltaic power plant power prediction models
Table 6 presents a comparison between article methodology and photovoltaic power plant power prediction models.
Table 6.
Comparison with photovoltaic power plant power prediction models.
Article:
This approach focuses on providing users with information to maximize their reliance on renewable energy when charging their electric vehicles. It uses neural networks to estimate the probability of charging with locally generated solar power at specific times and durations.
Papers [33,34,35]:
The data-driven approach uses different strategies to comprehensively predict PV power, including improved data handling, hybrid models with optimization algorithms, and advanced neural networks. This offers broader applicability, deeper insights, and real-time potential for efficient energy management.
Potential synergies:
By combining these approaches, significant advances in PV power prediction and utilization can be achieved:
- User-centric optimization: Integrating real-time predictions from data-driven methods into the user-centric approach can inform users of optimal charging times based on both solar availability and grid conditions, enabling informed decision-making.
- Improved resource management: Leveraging data-driven forecasting within energy management systems can optimize energy use across multiple sources, including renewables and grid connections, improving efficiency and sustainability.
- Data-driven personalization: By combining user data with predictive models, recommendations can be personalized and informed decisions can be made based on individual energy needs and preferences.
3. The Backpropagation Neural Network
The backpropagation neural network (BPNN) is a multilayer feedforward neural network that uses error backpropagation for training. It is capable of learning arbitrary nonlinear mappings from inputs to outputs and has demonstrated remarkable self-organizing learning abilities. The backpropagation (BP) network prediction model implements the training process by forwarding input data and propagating error values backward, allowing for the parallel processing of large datasets. Additionally, BPNNs exhibit a level of resilience and fault tolerance [34,35,36,37,38,39,40,41,42,43,44,45,46,47]. Figure 1 illustrates the fundamental structure of a BPNN.

Figure 1.
Basic structure of the BP neural network [30].
The backpropagation neural network is composed of an input layer, one or more hidden layers, and an output layer. Each layer contains multiple interconnected neuron nodes, which serve as learning units. The output value of a neuron node is determined by its input values, weights, thresholds, and activation functions [34,35,36,37,38,39,40,41,42,43,44,45,46,47]. A neuron node can be mathematically modeled using the simplified equation shown in Equation (1) [47].
where
- -
- Yj represents the output value of the neuron node,
- -
- wi presents the weight associated with input Xi,
- -
- Xi represents the input value to the neuron node,
- -
- θ represents the threshold value of the neuron node,
- -
- f denotes the activation function.
The training process of the BP neural network comprises two primary phases: forward propagation of information and backpropagation of error.
Forward Propagation
- Initialization: The weights connecting the nodes of each layer are randomly initialized within the range [–1, 1].
- Input Processing: The input layer receives the information provided by the training samples.
- Layer-wise Computation: Based on the network’s weights and the transfer function between the layers, the information is processed through forward propagation, layer by layer.
- Output Calculation: The final computation provides the output value, completing a forward propagation cycle.
Backpropagation of Error
- Error Calculation: When the actual output of the neural network deviates from the expected output, the backpropagation phase commences.
- Error Propagation: The error is propagated backward from the output layer, layer by layer, using an optimization algorithm.
- Weight Adjustment: The weights connecting the nodes of each layer are adjusted to minimize the overall error.
The weight update rule is given by Equation (2) [30]:
where
- -
- W(k + 1) and W(k) represent the weight/threshold values in the (k + 1)th and kth iterations, respectively,
- -
- α denotes the learning rate, controlling the magnitude of weight updates,
- -
- D(k) represents the negative gradient of the network error with respect to the weights and thresholds, indicating the direction of fastest error reduction.
- Iteration: The training process continues until the network’s output error reaches a predefined threshold or a specified number of iterations is completed.
4. Probability
Probability is a quantitative measure of the likelihood of an event occurring. It is a cornerstone of mathematics and statistics and has a pervasive influence across various scientific disciplines, including physics, engineering, economics, and social sciences. Probability theory provides a reliable framework for dealing with uncertainty, enabling us to make informed decisions in situations of risk and limited knowledge [47,48,49,50,51,52,53].
The fundamental concept of probability is the sample space, which includes all possible outcomes resulting from an experiment or random process. When flipping a coin, there are two possible outcomes: heads or tails. Events are subsets of the sample space and represent specific occurrences of interest. For example, the event of obtaining heads when flipping a coin is represented by the subset {heads}.
The probability of an event, denoted by p(A), measures the likelihood of its occurrence. This numerical measure ranges from 0 to 1, with 0 signifying an impossible event and 1 signifying a certainty. Mutually exclusive events cannot coexist simultaneously, such as getting heads and tails when flipping a coin. Independent events, on the other hand, remain unaffected by the occurrence of one another. Flipping a coin twice is an example of independent events. Probability is a measure of the likelihood of an event occurring. It is a number between 0 and 1, where 0 indicates that the event is impossible and 1 indicates that the event is certain.
There are two main ways to calculate probability:
- Theoretical probability. Theoretical probability is calculated based on the known properties of an event.
- Empirical probability. Empirical probability is calculated based on the results of repeated trials of an experiment.
Equation (3) [53] for calculating probability
Let a random experiment satisfy the following assumptions:
- -
- The number of all possible outcomes is finite.
- -
- All outcomes are equally likely.
- -
- No two outcomes can occur simultaneously.
The probability of event A (Equation (3)) is the number, where n is the number of all possible outcomes of a random experiment and m is the number of all favorable outcomes, i.e., outcomes in which event A occurs.
It holds that 0 ≤ p(A) ≤ 1;
Probability of an impossible event: p(A) = 0;
Probability of a certain event: p(A) = 1.
5. Methodology
The probabilistic model for using photovoltaic (PV) systems to power an EV charging station employs artificial neural networks as predictors to determine the probability of utilizing PV-derived energy to charge electric vehicles (EVs) at the station.
The methodology involves the following steps:
- Charging Modeling:
First, a charging model is developed to estimate charging station consumption based on the charging time and day. The output data are important reference values that indicate the energy demand that the PV system needs to meet.
- PV System Production Modeling:
The second step entails constructing a model to predict PV system energy production. The output of this model is compared against the data from the charging model.
- Probability Calculation:
The final step involves creating and calculating the probability of utilizing energy generated from the PV system to power EVs at the charging station. This probability reflects the probability of the PV system meeting the charging demand.
The simple flowchart of fundamental steps of the methodology is presented in Figure 2.

Figure 2.
Simple flowchart of the model.
Procedure for Creating a Charging Model
The development of an accurate charging model necessitates a methodical approach to analyzing and modeling charging behavior. This process consist of data preprocessing, neural network modeling, and thorough model evaluation.
- Data Preprocessing
Data Analysis: The input data, encompassing charging time and energy consumption, undergo a comprehensive analysis. The data are meticulously segregated based on individual days of the week to identify potential patterns, trends, and variations in charging behavior. This granular examination provides valuable insights into the temporal dynamics of charging patterns.
Data Cleaning: The dataset undergoes meticulous scrutiny to identify and eliminate any missing or erroneous values that may have been introduced during data acquisition or processing. This data cleaning step ensures the integrity and reliability of the dataset for subsequent analysis.
- Neural Network Modeling
Data Import: The preprocessed data are seamlessly integrated into the MATLAB R2020b environment, a robust numerical computing platform, providing an ideal setting for neural network modeling.
Data Partitioning: The dataset is judiciously divided into three distinct subsets: training data (70%), test data (15%), and validation data (15%). This partitioning strategy ensures that the model receives adequate training, undergoes rigorous testing, and undergoes thorough validation to assess its generalization capabilities.
Neural Network Architecture: An artificial neural network (ANN) is meticulously constructed to capture the intricate relationship between the charging time and energy consumption. The ANN architecture is carefully designed, taking into account the complexity of the data and the desired level of accuracy. This thoughtful design ensures that the model effectively captures the underlying patterns and trends in the data, enabling accurate predictions of energy consumption based on the charging time.
Creating an ANN:
This process includes the following steps:
- Training of the network: The ANN is trained using the training data, allowing it to learn the underlying patterns and relationships within the data. The training process involves optimizing the network’s parameters to minimize the error between the predicted and actual energy consumption values.
- Validation of the network: The trained ANN is evaluated based on the test and validation data. The evaluation metrics, such as the mean squared error and mean absolute error, assess the model’s ability to accurately predict charging energy consumption for unseen data.
- Model Saving
Parameter Saving: After a sufficient performance evaluation, the parameters that define the trained ANN are saved. These parameters encapsulate the model’s learned knowledge and enable its application for future predictions of charging energy.
Procedure for Creating a Photovoltaic Power Plant Model
The development of an accurate photovoltaic power plant (PV) model necessitates a systematic approach to analyzing PV plant behavior. This process consists of data preprocessing, neural network modeling, and comprehensive model evaluation.
- Data Preprocessing
Data Categorization: The input data, encompassing various PV plant parameters, are meticulously categorized into 12 distinct groups representing individual months. This categorization enables the identification of potential patterns and variations in PV production across different seasons.
Data Cleaning: The dataset undergoes rigorous scrutiny to identify and eliminate any missing or erroneous values that may have been introduced during data acquisition or processing. This data cleansing step ensures the integrity and reliability of the dataset for subsequent analysis.
- Neural Network Modeling
Data Import: The preprocessed data are seamlessly integrated into the MATLAB R2020b environment, a robust numerical computing platform, providing a suitable setting for neural network modeling.
Data Partitioning: The dataset is judiciously divided into three distinct subsets: training data (70%), test data (15%), and validation data (15%). This partitioning strategy ensures that the model receives adequate training, undergoes rigorous testing, and undergoes comprehensive validation to assess its generalization capabilities.
Neural Network Architecture: An artificial neural network (ANN) is meticulously constructed to capture the intricacies of PV production behavior, considering various parameters, such as solar irradiance, temperature, and time of day. The ANN architecture is carefully designed, taking into account the complexity of the data and the desired level of accuracy. This thoughtful design ensures that the model effectively captures the underlying patterns and trends in the data, enabling accurate predictions of PV production.
Creating an ANN:
This process includes the following steps:
- Training of the network: The ANN is trained using the training data, allowing it to learn the underlying patterns and relationships within the data. The training process involves optimizing the network’s parameters to minimize the error between the predicted and actual energy consumption values.
- Validation of the network: The trained ANN is evaluated using the test and validation data. The evaluation metrics, such as mean squared error and mean absolute error, assess the model’s ability to accurately predict charging energy consumption for unseen data.
- Model Saving
Following a thorough performance evaluation, the parameters that define the trained ANN are carefully saved. These parameters encapsulate the model’s accumulated knowledge and enable its utilization for future charging energy predictions.
Procedure for Creating Probability Model for Photovoltaic (PV) System and Electric Vehicle (EV) Charging
To assess the feasibility of utilizing PV-generated electricity for EV charging, a probability model was developed. The model evaluates the likelihood of meeting the EV charging demand solely from PV-generated electricity under various charging scenarios.
- Model Methodology
Energy Ratio Calculation: The ratio between the energy generated by the PV system and the energy required to charge an EV was calculated for different charging times, ranging from 1 to 12 h. This resulted in 12 iterations.
Data Processing and Storage: The calculated energy ratios were stored and subsequently exported to an MS Excel 2016 spreadsheet for further analysis.
Probability Calculation: Utilizing the energy ratios, probabilities were calculated for each charging time scenario using Equation (3).
Graphical Interpretation: The calculated probabilities were graphically interpreted to visualize the probability of meeting the EV charging demand with PV-generated electricity for different charging durations.
The probability model demonstrated that meeting the EV charging demand entirely from PV-generated electricity is feasible under certain conditions. For shorter charging durations (1–6 h), the probabilities were consistently high, indicating a strong likelihood of satisfying EV charging needs using solely PV-generated power. As charging durations increased (7–12 h), the probabilities decreased, reflecting the dependency on PV generation patterns and potential variations in energy production.
5.1. Data Processing
Data processing is crucial in developing accurate and efficient models for managing the electric vehicle (EV) charging infrastructure. Two primary datasets are used in this context: data from the charging station and data from a photovoltaic power plant. The input data were obtained from an EV charging station data network in Colorado, USA, and a local photovoltaic power plant.
- Data from charging station
The initial dataset comes from precise measurements of electric vehicle (EV) charging consumption in Colorado. It includes three key parameters: charging time, duration, and energy consumed. To ensure data integrity, a thorough cleansing procedure was implemented to correct any erroneous or missing values. The dataset was then divided into seven distinct groups, one for each day of the week. These carefully processed datasets are used as input for neural network models that can predict charging power based on the charging time and day.
- Data from photovoltaic power plant
The second dataset originates from precise measurements of a photovoltaic power plant (PV plant) that serves as a local energy source for the charging station. The data underwent aggregation and consolidation due to the extensive number of input variables, presenting the evolutionary trajectory of PV plant production over time. This format was intentionally chosen to facilitate the integration of two distinct neural network-based models. The dataset was divided into twelve sets, each corresponding to a month of the year. This is because PV plant production is affected by seasonal variations, with higher yields during the summer compared to winter.
The data were initially processed in MS Excel 2016 and then imported into the MATLAB R2020b environment. The model solutions, which were based on artificial neural networks, were executed within this environment.
The model uses an artificial neural network to predict charging station consumption based on the charging time and day, while also predicting photovoltaic power plant production based on the time and month. The model takes into account seasonal variations in production throughout the year.
The probability of using the PV system as an energy source for the charging station is determined by comparing the outputs of the two models. This approach provides a clear understanding of the relationship between charging station demand and the varying capacity of the PV power plant.
5.2. Model of Charging Electric Vehicles
The charging model is based on seven neural networks that predict charging consumption across different time periods. A separate model is created for each day using MATLAB R2020b. The resulting models were validated using a randomly selected 15% subset of the data, which was generated independently of the dataset used to train the neural network. The accuracy of the established network was assessed by examining correlation coefficients.
Table 7 shows the correlation coefficients for each day. A careful examination of these coefficients reveals a significant achievement in accuracy, indicating a strong alignment between the input and predicted data streams of the neural network. Notably, the average correlation coefficient reached 0.93, indicating a strong association between input and output data. Precision verification was then conducted by calculating the root mean square error (RMSE), with detailed outcomes for individual runs displayed in Table 7. The results demonstrate a commendable level of precision that effectively aligns with the intrinsic characteristics of the input data, thereby fulfilling the precision requirements of the model.
Table 7.
Performance analysis of the charging model.
5.3. Model of Photovoltaic Power Plant Production
The model for the PV system, like the charging model, is based on an artificial neural network (ANN) that predicts production as a function of the time and month. The network models were validated based on a randomly selected 15% dataset, as in the previous case. The corresponding parameters of the obtained data are presented in Table 8. The correlation coefficients are lower in this instance due to the wider range of input parameters, which reduces the resulting accuracy. However, despite these negative factors, the obtained accuracy, as shown by a correlation coefficient of 0.82, indicates a significant correlation between the input data and the data calculated using the ANN. The corresponding error values are presented in Table 8.
Table 8.
Performance analysis of the photovoltaic model.
5.4. Model of Probability
The probabilities were calculated using a structured and systematic approach. The emphasis was on determining the charging duration based on the output dataset, which showed a maximum charging period of 12 h. To improve accuracy, data points exceeding 12 h, which accounted for only 1.3% of the input data, were selectively removed.
The calculation addressed the temporal dimension incrementally, at hourly intervals, over 12 iterations, from 1 h to the maximum charging duration of 12 h. For each increment, the corresponding PV production value was computed.
The second phase involved a precise calculation of the energy generated by the PV system. To achieve greater precision, the computational framework used a 1 min time interval, which was then converted to kWh for standardized measurements. The calculation of PV production covered a temporal range from 0 to 1440 min, corresponding to the minimum operational timeframe required for daily production. The production intervals were strategically selected, ranging from 12 to 24 h, to effectively capture the intricate dynamics of production in relation to the charging duration.
The percentage efficiency was then calculated as the ratio of production to consumption. A higher ratio value indicates a greater excess of production over consumption. Any ratio value greater than or equal to 1 indicates that production exceeded consumption.
The penultimate stage aimed to determine the probability of PV production being available for utilization within a specified temporal window of the charging period. The input data for this analysis were computed as the percentage ratio between production and consumption. Each data point was paired with a corresponding magnitude representing the percentage level. A function was used to calculate the distribution of individual percentage levels across the charging period. The resulting probability was calculated as the ratio between the desired parameter, values corresponding to or exceeding 100%, and the aggregate of all other observed values.
The ratios were calculated for each month and day and presented in graphical form to provide a more detailed visualization of the data. The following sections provide detailed descriptions of the resulting states for each scenario.
This section explains the outcomes of the simulations and models described in Section 3, Section 4 and Section 5. Seven scenarios were systematically executed, each corresponding to a specific day of the week. Probabilities were computed for the provision of the desired energy from PV on a daily basis, spanning each month throughout the year. It is worth noting that charging patterns show increased frequency and power consumption during workdays compared to weekends, indicating nuanced preferences in electric vehicle charging practices among users.
6. Results
The charging power was calculated using the model described earlier. The resulting Table 9 presents the charging power values for individual days and charging durations.
Table 9.
Calculated charging energy for the week days.
A linear increase in charging power was observed between 1 and 11 h every day of the week, as shown by the charging power trends in the Table 9 and Figure 3. However, on Thursdays and Sundays, the demand for charging power showed a diminishing trend after exceeding 11 h of charging. In contrast, the other days showed a consistent linear growth pattern (see Figure 3). The demand for power varies depending on user preferences and the need to charge electric vehicles on specific days.

Figure 3.
Dependence of power curve of charging time.
Two distinct peaks in the demand for charging power were observed, one during weekdays and the other on weekends. This indicates that users have a pattern of repeating their charging requests. The demand for charging power is influenced by both the day of the week and the charging time.
Table 9 shows the power values for different charging durations and weekdays. These values were calculated using neural network models explained in the previous chapter. The average charging energy for the specified weekdays is approximately 33 kWh.
6.1. Monday
The first scenario centered on electric vehicle charging on Monday. Graphical representations display the computed probabilities for each month.
The computed probability outcomes reveal a distinct declining trend. This trend suggests that, on average, the probability of using electricity generated from PV for charging decreases during the early stages of charging. This pattern was observed during most of the months (see Figure 4). However, an intriguing anomaly occurred in April, where the probability started at zero during the initial hour of charging, but a significant surge was noted as the charging duration progressed. This trend is counterintuitive, as it deviates from the prevailing pattern observed in most months. A similar observation was noted in the scenario for October, although the onset of probability elevation occurred later, at a charging duration of 5 h. It is worth noting that the winter scenario reveals a probability of charging approaching zero, which mirrors the influence of geographical latitude on energy production during specific months.

Figure 4.
Visualizing the calculated probability for Monday.
6.2. Tuesday
The second scenario consistently focused on the computation of probabilities for Tuesdays, specifically investigating the probability of charging station consumption enabled by a photovoltaic source of electrical energy.
A gradual reduction in probability was observed during most months, as shown in Figure 5. However, an anomaly emerged in October, with calculated probabilities exhibiting an ascending tendency, defying the typical monthly patterns. It is worth noting that after the completion of the 12 h charging period, the probability abruptly dropped to almost zero for almost all months. The cause of this phenomenon is the increased demand for electrical energy during the specified charging duration and day. Table 9 provides a quantitative representation of this.
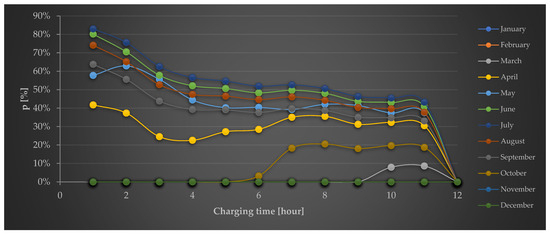
Figure 5.
Visualizing the calculated probability for Tuesday.
6.3. Wednesday
The third scenario consistently focused on the calculation of probabilities for Wednesday, specifically investigating the probability dynamics of charging station consumption powered by PV energy.
The probability of using PV electricity for charging decreases as the charging duration increases, as shown by the consistent downward trend in most cases. However, in October, there was an interesting deviation from this trend, with an upward trend observed in the probability curve (Figure 6). The sudden drop in probability to zero for all months during a 12 h charging duration is worth noting. As Wednesday falls in the middle of the week, there may be increased demand for charging on this day. This hypothesis is supported by the charging power data for individual days and durations presented in Table 9.
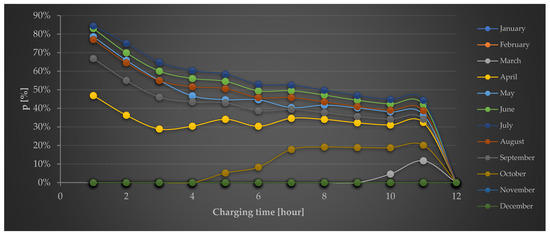
Figure 6.
Visualizing the calculated probability for Wednesday.
6.4. Thursday
The fourth scenario consistently involved the computation of probabilities for Thursday, specifically investigating the probability dynamics of charging station consumption powered by PV energy.
Figure 7 shows that the probability trends are predominantly downward in most scenarios. However, there is a notable anomaly in October, where there is an upward trend in probability relative to the charging duration. In April, there was an initial escalation of the probability, followed by a decline and then another increase. The subsequent trends reflect those observed in parallel months. The completion of the 12 h charging period consistently results in a higher probability of decreased demand for charging on that specific day. This matches with the trend of increased demand for charging on the preceding day, contributing to the reduced need to charge electric vehicles on Thursday.

Figure 7.
Visualizing the calculated probability for Thursday.
6.5. Friday
The fifth scenario meticulously focused on the computation of probabilities for Fridays, specifically examining the depicted probability dynamics of charging station consumption powered by PV energy.
The data show a consistent linear decrease in probability over the five months, with notable exceptions in April, October, and March where the increasing trend in probability coincides with an extended charging duration (see Figure 8). The probability remains persistently zero during the remaining months, indicating reduced energy production during the winter season, which is insufficient to meet the demand for charging stations. The probability is reduced to zero during a 12 h charging duration, indicating that users tend to charge their electric vehicles with greater power every other day.

Figure 8.
Visualizing the calculated probability for Friday.
6.6. Saturday
The subsequent scenario consistently investigated the probability dynamics for Saturday, representing the first weekend day and, consequently, displaying a distinct pattern in demand distribution compared to weekdays. The illustrated progression is carefully presented in Figure 9.

Figure 9.
Visualizing the calculated probability for Saturday.
The results reveal a subtle change in user preferences. During the months with non-zero values, there is an initial increase in usage at the beginning of the 2 h charging period, followed by a gradual decrease, ultimately reaching probabilities of 0–5% for a 12 h charging period.
Notably, there are significant deviations from these patterns in March, April, October, and December, where the opposite trend is observed. During these months, there is a growing trend of longer charging durations. This trend is attributed to the insufficient capacity of PV production to cover the entire charging station consumption during the spring or winter months.
The results for a 12 h charging time are largely consistent with initial estimates, with one exception: an increased demand for charging before the second weekend day. Some users prefer to charge their vehicles on the first day of the weekend, using strategic energy storage to ensure sufficient battery power for the final day of the week. This is due to the fact that they want to make sure their vehicle has enough power to last the entire week.
6.7. Sunday
The final scenario focused on Sunday, a day marked by unique characteristics, primarily driven by users free time and charging requirements.
In contrast to weekdays, the probability dynamics for Sundays show subtle deviations, reflecting the unique nature of this day of the week. There is an initial surge in probability within the first 1–2 h of charging, followed by a subsequent decrease (see Figure 10). In October, a clear increase in probability is observed from 5 h of the charging duration.

Figure 10.
Visualizing the calculated probability for Sunday.
Consistently, across all months, there is a universal increase in charging efficiency during a 12 h charging duration, resulting in a reduced demand for charging power. This phenomenon can be attributed to the distinctive activities undertaken on Sundays, where users tend to prioritize minimizing their time spent at the charging station.
Notably, during the summer months, the probability trends within the 2–11 h charging interval exhibit a linear decreasing characteristic.
6.8. Evaluation for All Days
Figure 11 displays the average values for all days, revealing a recurring pattern of a decreasing probability curve. Notably, the early spring and autumn months exhibit an atypical trend of first increasing and then decreasing. In the winter months, a shift occurred for the 12 h charge state, resulting in a probability of 5–10% after calculating the average values, compared to the previous states where it was almost zero.

Figure 11.
Visualizing the calculated probability for all days.
6.9. Testing of Probability Model
Model testing was performed using a test dataset of randomly generated input variables. The generation settings were adjusted to ensure that the generated values were within the range for which the model was built. If data outside of this range were used, the model could diverge and the outputs would be unusable. The second way to limit the generation of data was to restrict it to what could be expected in practice. The dataset contained various changes in input data, from sudden changes to gradual slow changes.
Model testing was conducted using a test dataset that included randomly generated input parameters. The generation parameters were carefully selected to ensure that the generated values fell within the model’s operational range. Using data beyond this range could cause the model to diverge and make the outputs unusable. Furthermore, data generation was limited to reflect realistic scenarios. The dataset included different types of input data alterations, ranging from sudden changes to gradual ones.
Model testing followed a similar methodology to the probability calculation process described in earlier sections, but with different input data. This evaluation confirmed the model’s integrity and its ability to handle diverse data while maintaining the necessary precision and functionality.
To ensure clarity of the outputs, three graphical interpretations were selected from the model testing due to the substantial volume of data generated. These cases describe the model’s behavior within a specific day–month combination, including working days in summer months and weekend days in spring months. The following section provides a more comprehensive description of these individual cases.
The three cases were selected carefully to represent a diverse range of conditions that the model might encounter in real-world applications. The first case, a working day in July, represents a typical workday during the summer. The second case, a weekend day in April, represents a typical weekend day during the spring. The third case, a working day in October, represents a typical workday during the autumn.
- Case
The following section presents a typical workday (Thursday) in July. It includes the probability distribution computed during the model’s original run, depicted in orange, which exhibits a decreasing trend. Additionally, the probability distribution yielded from the test run of the model is shown in blue and displays a consistent decreasing pattern. The discrepancies between the model’s individual runs are insignificant.
Figure 12 demonstrates that the model’s probability distribution decreases with the charging time. The model effectively forecasts the decreasing trend in the probability distribution in both the original and test runs. The minimal divergences between the two runs highlight the model’s successful training and its ability to be generalized to new data.

Figure 12.
Visualizing the calculated probability for Thursday in July.
- 2.
- Case
The second case study presents a typical weekend day, specifically Sunday in April. This day holds unique characteristics in terms of electric vehicle owners’ behavior. When comparing the results, deviations between the model’s original run and test run emerged on this particular day. This divergence is due to the inherently unstable nature of photovoltaic power plant energy production, as well as the variable behavior of users on this day. However, the courses shown in Figure 13 demonstrate a consistent trend, suggesting that the model accurately represents this scenario.

Figure 13.
Visualizing the calculated probability for Sunday in April.
- 3.
- Case
The following section presents a typical workday (Tuesday) in October. Due to the inherent variability in energy production during this season, larger deviations are expected for this scenario. The results show a subtle shift in the probability curve between the model’s original and test runs. However, the overall trend of the probability remains consistent with the original case. The model can predict the state for the given combination with necessary accuracy, although with slightly reduced precision compared to other cases.
Figure 14 shows a subtle rightward shift in the probability distribution of the model during the test run compared to the original run. This is likely due to the variability in energy production, which can cause occasional peaks in production.
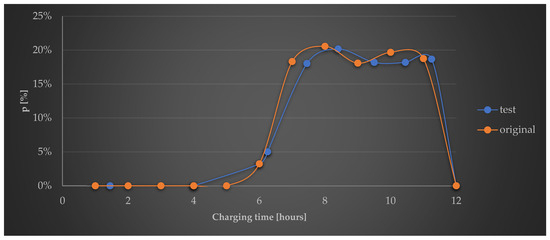
Figure 14.
Visualizing the calculated probability for Tuesday in October.
Table 10 below provides a thorough assessment of the probability distribution for each day and month. The observed errors do not exceed the threshold considered significant. The most significant differences occurred during the spring months, which can be attributed to the inherent variability in electricity generation from the local PV source. This variability, in turn, affects the overall accuracy of the model.
Table 10.
Comprehensive analysis of model performance.
The model’s average error is 14.6%, which is relatively low and suggests that the model is generally reliable. However, the error rate is higher in some instances. Specifically, during the spring months, the error jumps to 20%. This can be attributed to the fluctuating nature of electricity production from the local PV source, which experiences unexpected peaks due to the unpredictable weather patterns in the spring.
However, despite some inaccuracies between the original and test data, the model appears to be well-constructed and capable of adapting to various input variables. This is consistent with the model’s ability to adjust for unpredictable changes in input data.
7. Discussion
A thorough analysis of measurements and computed values allowed for a reasonably accurate assessment and comparison of user behavior at charging stations in terms of the distribution of the charging duration during a single day. In most cases, the ratio between photovoltaic production and charging power showed a decreasing trend, which was expected due to the linear relationship between the charging power and time.
During the winter months, which span a date from November to February, it is unlikely that the local photovoltaic source will be able to provide all the energy required for electric vehicle charging. These observations are in line with geographical considerations and assumptions about energy production patterns during the winter season. In contrast, some months showed an increase in probability, with the highest values occurring in the summer months for short charging demands. Therefore, to optimize the probability of obtaining energy directly from the local photovoltaic source for electric vehicle charging, it is advisable to connect during shorter charging intervals, taking into account the photovoltaic production curve.
The trend analysis of probability showed an interesting reversal during the 12 h charging period for two specific days. Variations in user habits on Thursdays and Sundays can be attributed to the phenomenon of shorter charging intervals. The reason behind the reversal on Thursday remains inconclusive, but it might stem from the assumption that, given battery capacities and the daily schedule, prolonged charging is unnecessary. Table 11 shows the probabilities of a customer accessing charging energy on a given day.
Table 11.
Comprehensive performance analysis of the probability model.
The initial column (p(A)) displays the probabilities linked to the possibility of having surplus energy available on a given day, indicating that production exceeds consumption, effectively meeting the charging power demand at the charging station. The average probability is 0.54, with Thursday having the highest probability. The analysis shows that Thursday (0.59) requires the lowest average charging power among the days of the week.
The second column (p(B)) displays the average probability of obtaining electrical energy from the photovoltaic source on specific days, conditional on the months. The mean probability is 0.22, with Thursday having the highest value at 0.24. Thursday has the highest probability of fulfilling the energy demand from the photovoltaic source for the charging station.
The final column (p(A ∪ B)) shows the conditional probability of energy being available on a specific day within a specific month and duration, meeting the entire energy demand for charging power. The column values indicate the probability of accessing energy from the photovoltaic system at a specific time, day, and month. The mean probability is 0.22, with the highest value occurring on Thursday at 0.25. This is due to the fact that Thursday has the lowest charging power demand, making it the most favorable day.
After evaluating the probabilities and occurrence of the desired event, we estimate that the availability of energy generated from PV to satisfy the demands of the charging station for a given day is approximately 0.22, or 22%.
Comprehensive Testing of Probability Model
Table 12 presents the probability calculation results for both the original model and its testing. The procedure for calculating the probability is explained in the previous chapter.
Table 12.
Results of probability model testing.
In conclusion, a thorough evaluation of the probability calculations for both the original model results and the test results was performed. The original and updated probability results are presented in Table 12. The maximum difference between the probability values was 0.05. Based on these findings, it can be asserted objectively that the given model exhibits a commendable structure and its behavior remains consistent even when input parameters are modified. Any alterations, whether abrupt or gradual, have only a minor influence on the computation of the overall probability. Consequently, the model proves to be resilient and capable of accurately predicting probability under any circumstance.
8. Conclusions
Various computational algorithms assist users in decision-making regarding the optimal timing of their arrival at charging stations. By optimizing arrival times and charging durations, the overall utilization of renewable energy sources can be enhanced.
The aim of the study was to evaluate the feasibility of meeting energy demands using only local renewable sources. While energy self-sufficiency is an attractive prospect, it faces constraints, such as financial limitations and the intermittent nature of photovoltaic systems.
A new approach uses two neural networks to determine the probability of using local photovoltaic energy to recharge an electric vehicle’s battery. This research uses two neural networks: one predicts charging station consumption and the other forecasts photovoltaic power plant output. By combining these predictions, the probability of using photovoltaic energy for EV charging is calculated. This approach enables EV owners to make informed charging decisions that agree with their preferences.
This article presents a methodology for processing data from charging stations and a local photovoltaic power plant, culminating in the calculation of probability. Two datasets were constructed for the proposed solution using two neural networks: one for predicting charging station consumption and the other for forecasting photovoltaic power plant output. Based on the output of the individual networks, the ratio between required consumption and production was then calculated. The data were processed into a final format, and the probability of each scenario was determined. This indicates the probability that the EV charging demand will be met using energy from a local source. The primary input parameters for the individual models are data from a local photovoltaic power plant and data describing the electrical energy consumption necessary for charging electric vehicles over time.
The study’s main findings focus on the probability of using photovoltaic energy (PV) to charge electric vehicles. These findings can be summarized into a few key points.
- The highest probability of meeting energy demand solely from local sources was observed on Thursdays (0.25).
- The lowest probability was observed on Saturdays (0.20).
- A linear decreasing trend was observed between probability and charging duration.
- Two anomalies were identified:
- An increase in probability on Thursdays and Sundays with a 12 h charging duration.
- An opposite trend in probability during the spring and fall months (October and March).
The study highlights the impact of the day of the week and charging duration on the fulfilment of energy demand from local sources. Furthermore, seasonal fluctuations in solar radiation can significantly affect the probability of meeting the energy demand locally.
The main limitations of the current model are due to the input data. With a larger dataset, the neural network models could be trained to make more precise predictions. This would improve the accuracy of the probability calculation because the models would be better able to handle the variability in the input data.
Further research in the field of prediction and probability calculation is essential to improve energy management strategies and optimize charging schedules. Efforts will continue to focus on improving prediction accuracy by incorporating a significant amount of historical data. In addition, the integration of multiple data sources and surveys will provide valuable insights into user behavior, enabling more accurate probabilistic modeling and maximizing the utilization of photovoltaic (PV) sources. The ultimate goal is to ensure a high probability of local energy accessibility for all users seeking renewable energy sources.
The main benefits of the described research can be summarized as follows:
- Improved Utilization of Electrical Energy from Local PV Sources:
The proposed method enables accurate predictions of energy availability and charging station occupancy, making it feasible to achieve a situation where electric vehicles are preferentially charged with renewable energy sources. This advancement holds significant value in enhancing the overall efficiency and sustainability of energy consumption practices.
- Enhanced Energy Management:
By analyzing and comprehending the variability in solar radiation and energy demand patterns, this research contributes to the development of more effective energy management strategies. Understanding these dynamic phenomena paves the way for reduced energy costs and a more sustainable energy infrastructure.
- Optimization of Electric Vehicle Charging Plans:
The optimization of charging processes allows users to maximize their utilization of local energy sources. This, in turn, translates into enhanced energy efficiency, lower charging costs, and a positive impact on the economic and environmental footprint of electric vehicle usage.
- Enhancement of User Experience:
Providing real-time information to electric vehicle users about the availability of energy from local sources allows them to make informed decisions about their charging schedules. This user-centric approach streamlines decision-making processes, leading to a more user-friendly and efficient electric vehicle ecosystem.
Author Contributions
P.B.: Conceptualization, Software, Data curation, Writing-original draft, Validation, Supervision, Funding acquisition. P.H.: Writing—review and editing, Investigation, Formal analysis, Validation. Z.F.: Methodology, Software, Project administration, Resources, Visualization, Supervision. All authors have read and agreed to the published version of the manuscript.
Funding
This research received no external funding.
Data Availability Statement
The data that support the findings of this study are available from the corresponding author, upon reasonable request.
Conflicts of Interest
The authors declare no conflicts of interest.
References
- Electric Vehicle. 2023. Available online: https://www.eea.europa.eu/en/topics/in-depth/electric-vehicles (accessed on 20 November 2023).
- Kieldsen, A.; Thingvad, A.; Martinenas, S.; Sørensen, T.M. Efficiency Test Method for Electric Vehicle Chargers. In Proceedings of the EVS29—International Battery, Hybrid and Fuel Cell Electric Vehicle Symposium, Montréal, QC, Canada, 19–22 June 2016. [Google Scholar]
- Mastoi, M.S.; Zhuang, S.; Munir, H.M.; Haris, M.; Hassan, M.; Usman, M.; Bukhari, S.S.H.; Ro, J.-S. An in-depth analysis of electric vehicle charging station infrastructure, policy implications, and future trends. Energy Rep. 2022, 8, 11504–11529. [Google Scholar] [CrossRef]
- Schaefer, J.C. Review of photovoltaic power plant performance and economics. IEEE Trans. Energy Convers. 1990, 5, 232–238. [Google Scholar] [CrossRef]
- Su, Y.; Pan, J.; Wu, H.; Sun, S.; Zou, Z.; Li, J.; Pan, B.; Zhu, H. Dynamic probability modeling of photovoltaic strings and its application in fault diagnosis. Energy Rep. 2022, 8, 6270–6279. [Google Scholar] [CrossRef]
- Ray, B.; Shah, R.; Islam, M.R.; Islam, S. A New Data Driven Long-Term Solar Yield Analysis Model of Photovoltaic Power Plants. IEEE Access 2020, 8, 136223–136233. [Google Scholar] [CrossRef]
- Bizzarri, F.; Bongiorno, M.; Brambilla, A.; Gruosso, G.; Gajani, G.S. Model of Photovoltaic Power Plants for Performance Analysis and Production Forecast. IEEE Trans. Sustain. Energy 2013, 4, 278–285. [Google Scholar] [CrossRef]
- Hasan, K.N.; Preece, R.; Milanović, J.V. Probabilistic Modelling of Electric Vehicle Charging Demand based on Charging Station Data. In Proceedings of the 17th International Conference on Probabilistic Methods Applied to Power Systems (PMAPS), Manchester, UK, 12–15 June 2022; pp. 1–6. [Google Scholar] [CrossRef]
- Wang, J.; Cui, Y.; Zhu, M. Probabilistic Harmonic Calculation in Distribution Networks with Electric Vehicle Charging Stations. J. Appl. Math. 2014, 2014, 167565. [Google Scholar] [CrossRef]
- Soldan, F.; Bionda, E.; Mauri, G.; Celaschi, S. Short-term forecast of EV charging stations occupancy probability using big data streaming analysis. arXiv 2021, arXiv:2104.12503. [Google Scholar] [CrossRef]
- Hecht, C.; Figgener, J.; Sauer, D.U. Predicting Electric Vehicle Charging Station Availability Using Ensemble Machine Learning. Energies 2021, 14, 7834. [Google Scholar] [CrossRef]
- Ma, T.-Y.; Faye, S. Multistep electric vehicle charging station occupancy prediction using hybrid LSTM neural networks. Energy 2022, 244, 123217. [Google Scholar] [CrossRef]
- Wang, H.J.; Wang, B.; Fang, C.; Li, W.; Huang, H.V. Charging Load Forecasting of Electric Vehicle Based on Charging Frequency. IOP Conf. Ser. Earth Environ. Sci. 2019, 237, 062008. [Google Scholar] [CrossRef]
- Ostermann, A.; Fabel, Y.; Ouan, K.; Koo, H. Forecasting Charging Point Occupancy Using Supervised Learning Algorithms. Energies 2022, 15, 3409. [Google Scholar] [CrossRef]
- Huimiao, C.; Hongcai, Z.; Zechun, H.; Yunyi, L.; Haocheng, L.; Yinhai, W. Plug-in Electric Vehicle Charging Congestion Analysis Using Taxi Travel Data in the Central Area of Beijing. arXiv 2017, arXiv:1712.07300. [Google Scholar]
- Arias, A.; Granada, M.; Castro, C.A. Optimal probabilistic charging of electric vehicles in distribution systems. IET Electr. Syst. Transp. 2017, 7, 246–251. [Google Scholar] [CrossRef]
- Bayram, I.S.; Galloway, S.; Burt, G. A probabilistic capacity planning methodology for plug-in electric vehicle charging lots with on-site energy storage systems. J. Energy Storage 2020, 32, 101730. [Google Scholar] [CrossRef]
- Balasubramaniam, S.; Syed, M.H.; More, N.S.; Polepally, V. Deep learning-based power prediction aware charge scheduling approach in cloud based electric vehicular network. Eng. Appl. Artif. Intell. 2023, 121, 105869. [Google Scholar] [CrossRef]
- Aghsaee, R.; Hecht, C.; Schwinger, F.; Figgener, J.; Jarke, M.; Sauer, D.U. Data-Driven, Short-Term Prediction of Charging Station Occupation. Electricity 2023, 4, 134–153. [Google Scholar] [CrossRef]
- Boulakhbar, M.; Farag, M.; Benabdelaziz, K.; Kousksou, T.; Zazi, M. A deep learning approach for prediction of electrical vehicle charging stations power demand in regulated electricity markets: The case of Morocco. Clean. Energy Syst. 2022, 3, 100039. [Google Scholar] [CrossRef]
- Bai, X.; Wang, Z.; Zou, L.; Liu, H.; Sun, Q.; Alsaadi, F.E. Electric vehicle charging station planning with dynamic prediction of elastic charging demand: A hybrid particle swarm optimization algorithm. Complex Intell. Syst. 2022, 8, 1035–1046. [Google Scholar] [CrossRef]
- Zuo, A. Prediction and distribution of Ev charging stations. AIP Conf. Proc. 2019, 2066, 020048. [Google Scholar] [CrossRef]
- Mariz, A.; Myungchin, K.; Sungwoo, B. Prediction of electric vehicle charging-power demand in realistic urban traffic networks. Appl. Energy 2017, 195, 738–753. [Google Scholar] [CrossRef]
- Hecht, C.; Aghsaee, R.; Schwinger, F.; Figgener, J.; Jarke, M.; Sauer, D.U. Short-term prediction of electric vehicle charging station availability using cascaded machine learning models. In Proceedings of the 6th E-Mobility Power System Integration Symposium (EMOB 2022), Hybrid Conference, Hague, The Netherlands, 10 October 2022; pp. 78–85. [Google Scholar] [CrossRef]
- Polasek, T.; Čadík, M. Predicting photovoltaic power production using high-uncertainty weather forecasts. Appl. Energy 2023, 339, 120989. [Google Scholar] [CrossRef]
- Alrashidi, M.; Rahman, S. Short-term photovoltaic power production forecasting based on novel hybrid data-driven models. J. Big Data 2023, 10, 26. [Google Scholar] [CrossRef]
- Theocharides, S.; Makrides, G.; Livera, A.; Theristis, M.; Kaimakis, P.; Georghiou, G.E. Day-ahead photovoltaic power production forecasting methodology based on machine learning and statistical post-processing. United States. Appl. Energy 2020, 268, 115023. [Google Scholar] [CrossRef]
- Iheanetu, K.J. Solar Photovoltaic Power Forecasting: A Review. Sustainability 2022, 14, 17005. [Google Scholar] [CrossRef]
- Poti, K.D.; Naidoo, R.M.; Mbungu, N.T.; Bansal, R.C. Intelligent solar photovoltaic power forecasting. Energy Rep. 2023, 9 (Suppl. S11), 343–352. [Google Scholar] [CrossRef]
- Yuanqi, L.; Lei, Z.; Peiqi, G.; Bo, Y.; Yiming, H.; Chang, L. Short-Term Power Generation Forecasting of a Photovoltaic Plant Based on PSO-BP and GA-BP Neural Networks. Front. Energy Res. 2022, 9, 824691. [Google Scholar] [CrossRef]
- Harrou, F.; Kadri, F.; Sun, Y. Forecasting of Photovoltaic Solar Power Production Using LSTM Approach; IntechOpen: London, UK, 2020. [Google Scholar] [CrossRef]
- Khalyasmaa, A.; Eroshenko, S.; Tran, D.C.; Denis, S. Photovoltaic power plant production operational forecast based on its short-term forecasting model. In Proceedings of the 2020 International Conference on Smart Technologies in Computing, Electrical and Electronics (ICSTCEE), Bengaluru, India, 9–10 October 2020; pp. 560–563. [Google Scholar] [CrossRef]
- Nelega, R.; Greu, D.I.; Jecan, E.; Rednic, V.; Zamfirescu, C.; Puschita, E.; Turcu, R.V.F. Prediction of Power Generation of a Photovoltaic Power Plant Based on Neural Networks. IEEE Access 2023, 11, 20713–20724. [Google Scholar] [CrossRef]
- Hecht-Nielsen, R., III. 3—Theory of the Backpropagation Neural Network. In Neural Networks for Perception; Academic Press: Cambridge, MA, USA, 1992; pp. 65–93. ISBN 9780127412528. [Google Scholar] [CrossRef]
- Law, R. Back-propagation learning in improving the accuracy of neural network-based tourism demand forecasting. Tour. Manag. 2000, 21, 331–340. [Google Scholar] [CrossRef]
- Nasr, G.E.; Badr, E.A.; Joun, C. Backpropagation neural networks for modeling gasoline consumption. Energy Convers. Manag. 2003, 44, 893–905. [Google Scholar] [CrossRef]
- Rojas, R. The Backpropagation Algorithm. In Neural Networks; Springer: Berlin/Heidelberg, Germany, 1996. [Google Scholar] [CrossRef]
- Barry, J. Wythoff, Backpropagation neural networks: A tutorial. Chemom. Intell. Lab. Syst. 1993, 18, 115–155. [Google Scholar] [CrossRef]
- Rojas, R. Neural Networks: A Systematic Introduction; Springer: Berlin/Heidelberg, Germany, 2013; ISBN 9783642610684. [Google Scholar]
- Saratchandran, P.; Foo, S.K.; Sundararajan, N. Parallel Implementations of Backpropagation Neural Networks on Transputers: A Study of Training Set Parallelism; World Scientific Publishing Company: Singapore, 1996; ISBN 9789814498999. [Google Scholar]
- Du, K.; Swamy, M.N.S. Neural Networks and Statistical Learning; Springer: Berlin/Heidelberg, Germany, 2019; ISBN 9781447174523. [Google Scholar]
- Wilde, P.D. Neural Network Models; Springer: Berlin/Heidelberg, Germany, 1997; ISBN 9783540761297. [Google Scholar]
- Huang, S.; Wu, Q.; Liao, W.; Wu, G.; Li, X.; Wei, J. Adaptive DroopBased Hierarchical Optimal Voltage Control Scheme for VSC-HVDC Connected Offshore Wind Farm. IEEE Trans. Ind. Inf. 2021, 17, 8165–8176. [Google Scholar] [CrossRef]
- Zhao, J.; Nguyen, H.; Nguyen-Thoi, T.; Asteris, P.G.; Zhou, J. Improved Levenberg-Marquardt Backpropagation Neural Network by Particle Swarm and Whale Optimization Algorithms to Predict the Deflection of RC Beams. Eng. Comput. 2021, 38 (Suppl. S5), 3847–3869. [Google Scholar] [CrossRef]
- Yan, E.; Song, J.; Liu, C.; Luan, J.; Hong, W. Comparison of Support Vector Machine, Back Propagation Neural Network and Extreme Learning Machine for Syndrome Element Differentiation. Artif. Intell. Rev. 2020, 53, 2453–2481. [Google Scholar] [CrossRef]
- Zhu, M.; Xu, C.; Dong, S.; Tang, K.; Gu, C. An Integrated Multi-Energy Flow Calculation Method for Electricity-Gas-thermal Integrated Energy Systems. Prot. Control Mod. Power Syst. 2021, 6, 65–76. [Google Scholar] [CrossRef]
- Xu, J.; Li, J.; Liao, X.; Song, C. A Prediction Method of Charging Station Planning Based on BP Neural Network. J. Comput. Commun. 2010, 7, 219–230. [Google Scholar] [CrossRef]
- Lange, K. Applied Probability; Springer: New York, NY, USA, 2008; ISBN 9780387227115. [Google Scholar]
- Lefebvre, M. Basic Probability Theory with Applications; Springer: New York, NY, USA, 2009; ISBN 9780387749952. [Google Scholar]
- Sharma, A.K. Text Book of Probability and Theoretical Distributions; Discovery Publishing House: New Delhi, India, 2005; ISBN 9788171419388. [Google Scholar]
- Anderson, D.F.; Seppäläinen, T.; Valkó, B. Introduction to Probability; Cambridge University Press: New York, NY, USA, 2017; ISBN 9781108246705. [Google Scholar]
- Zörnig, P. Probability Theory and Statistical Applications: A Profound Treatise for Self-Study; De Gruyter: Berlin, Germany, 2016; ISBN 9783110402711. [Google Scholar]
- Theory of Probability. 2023. Available online: https://mtfdca.szm.sk/subory/statistika.pdf (accessed on 25 November 2023).
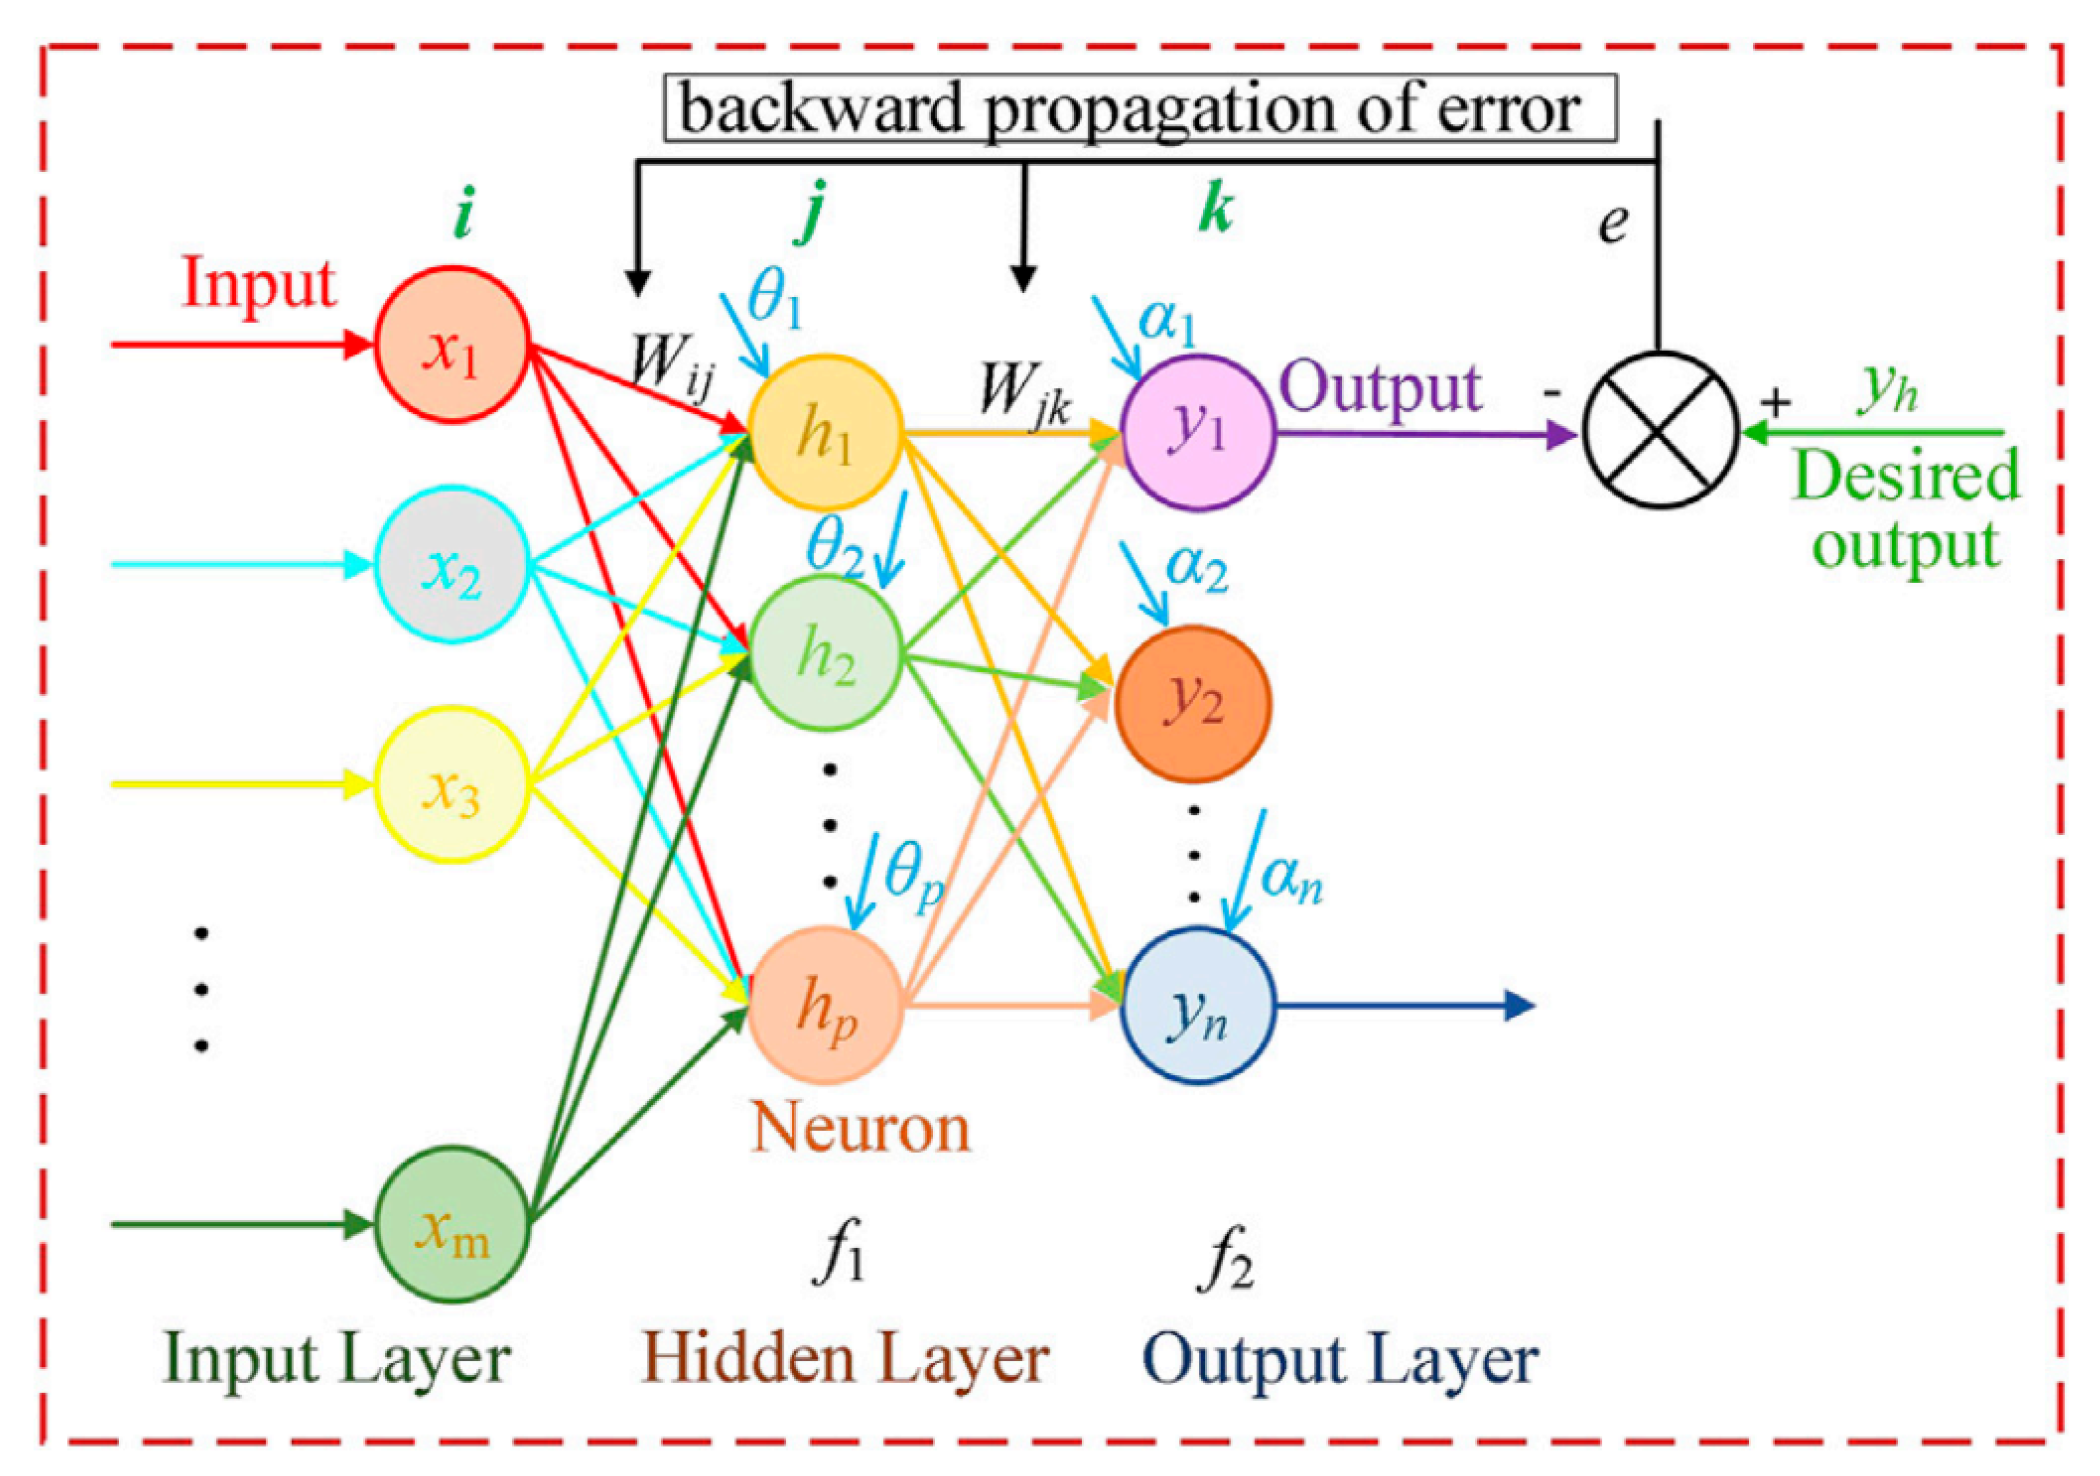
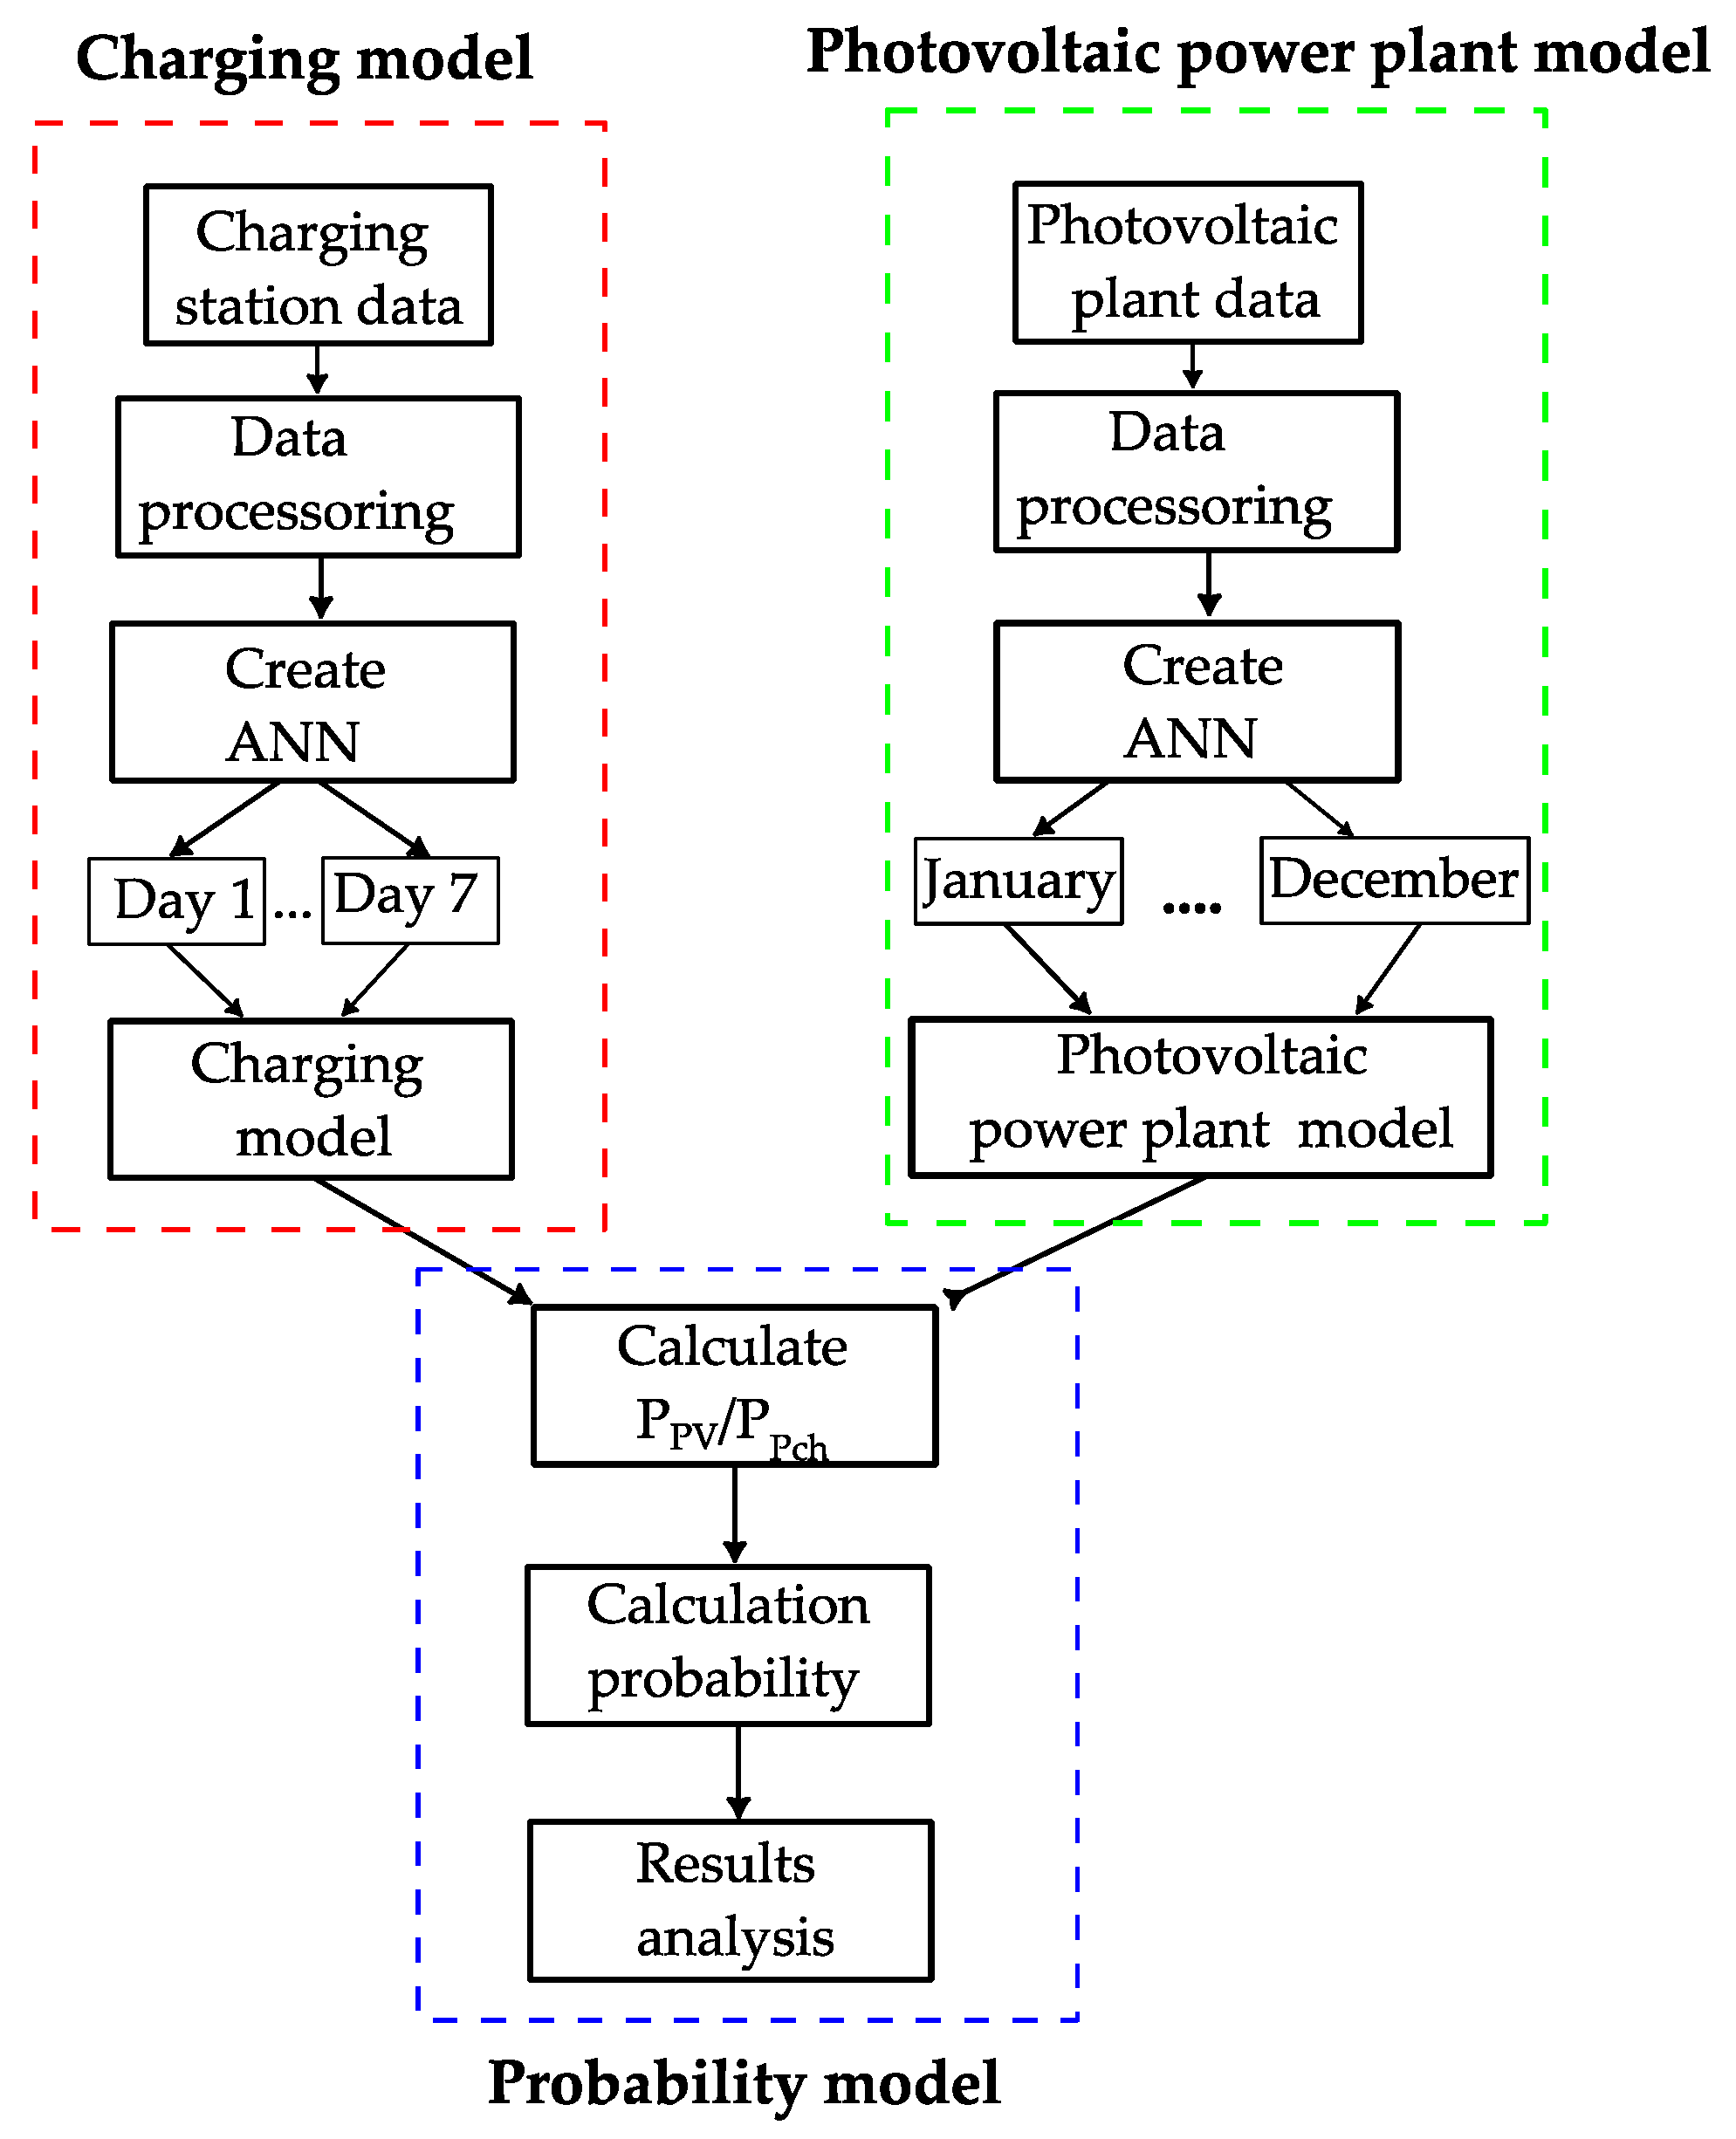
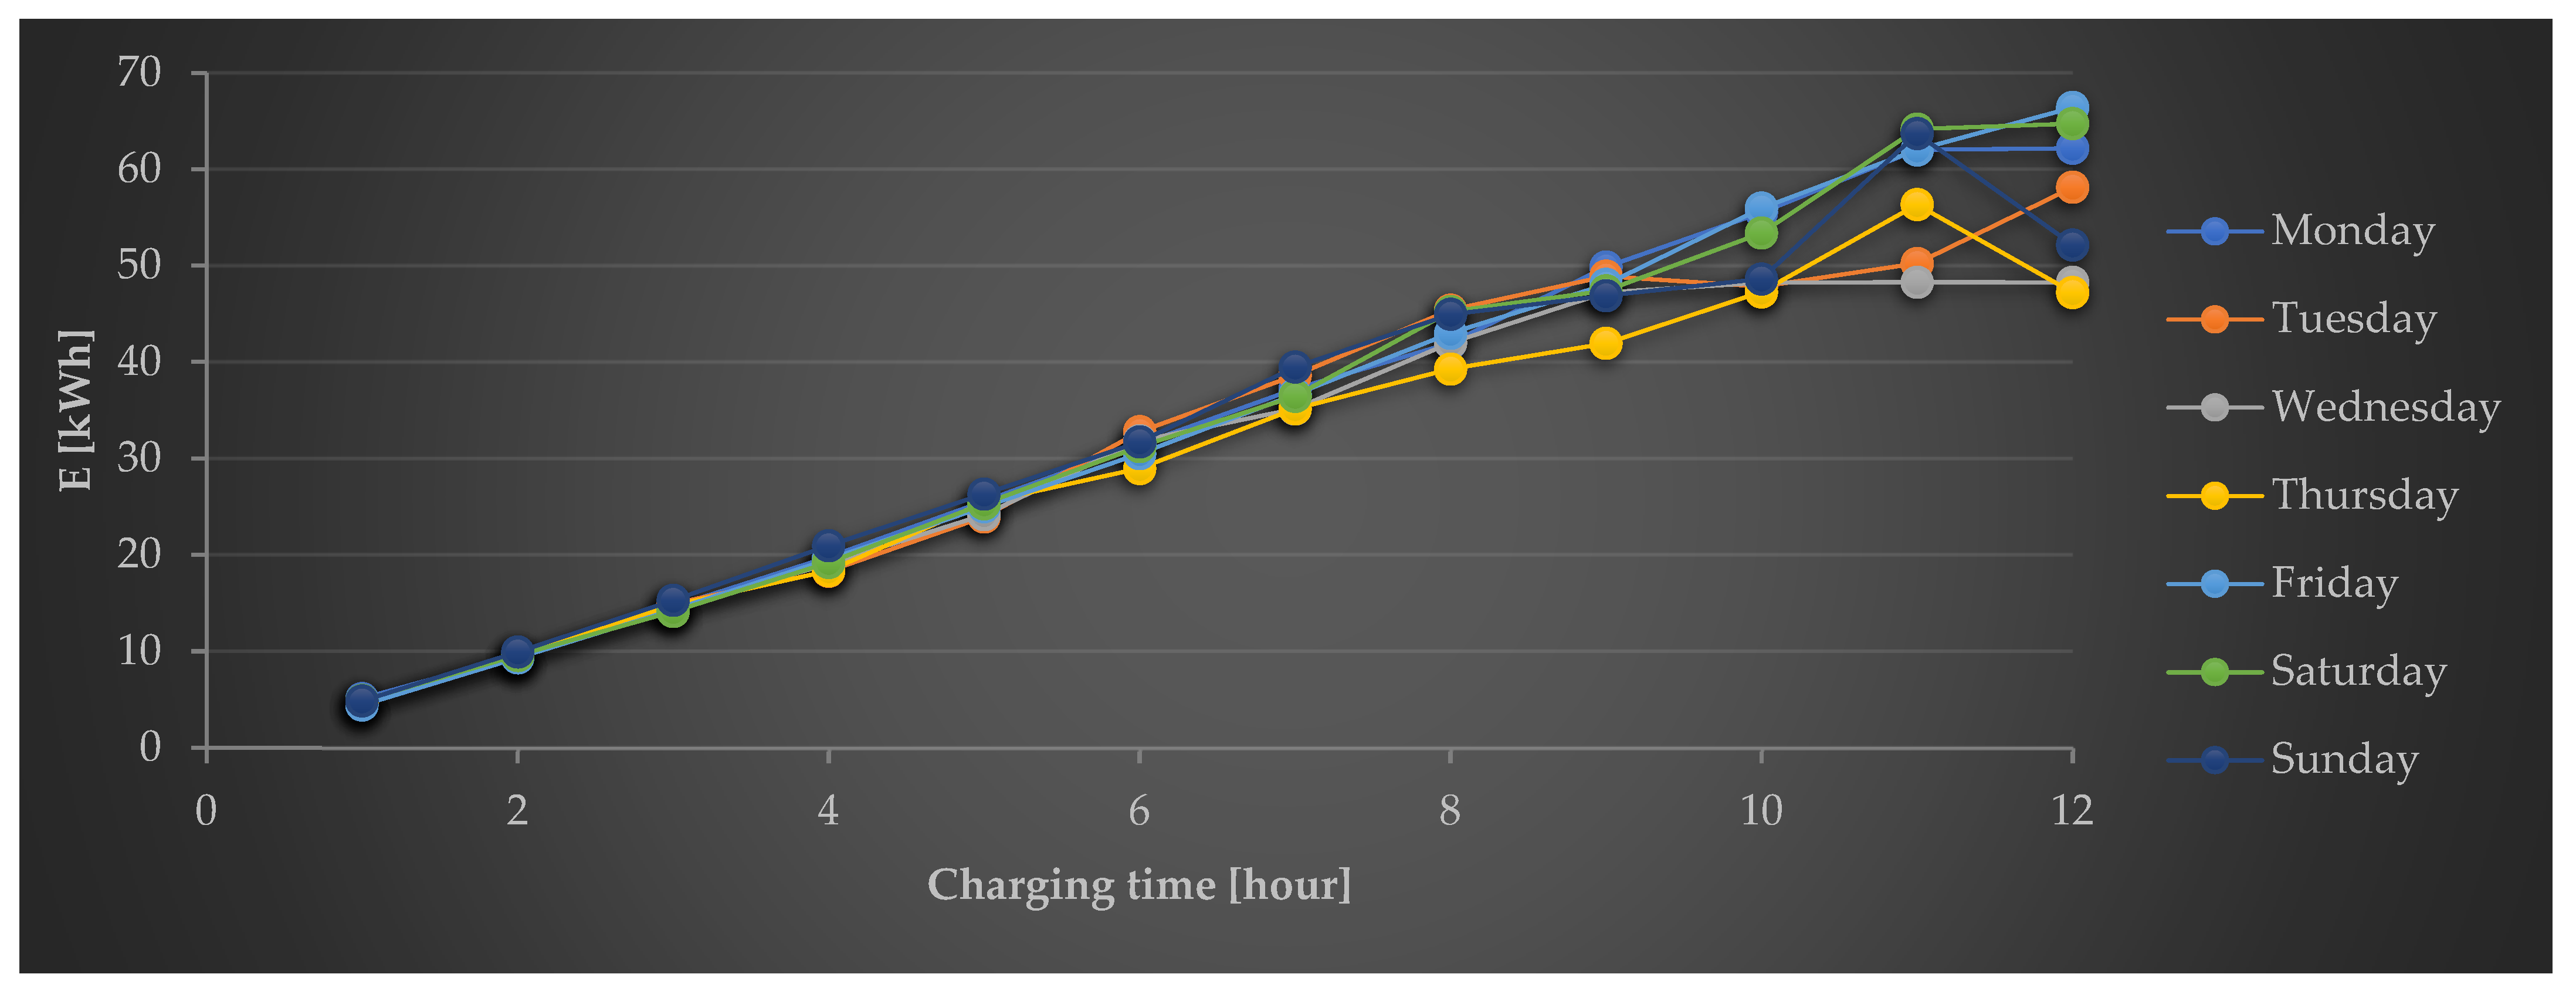
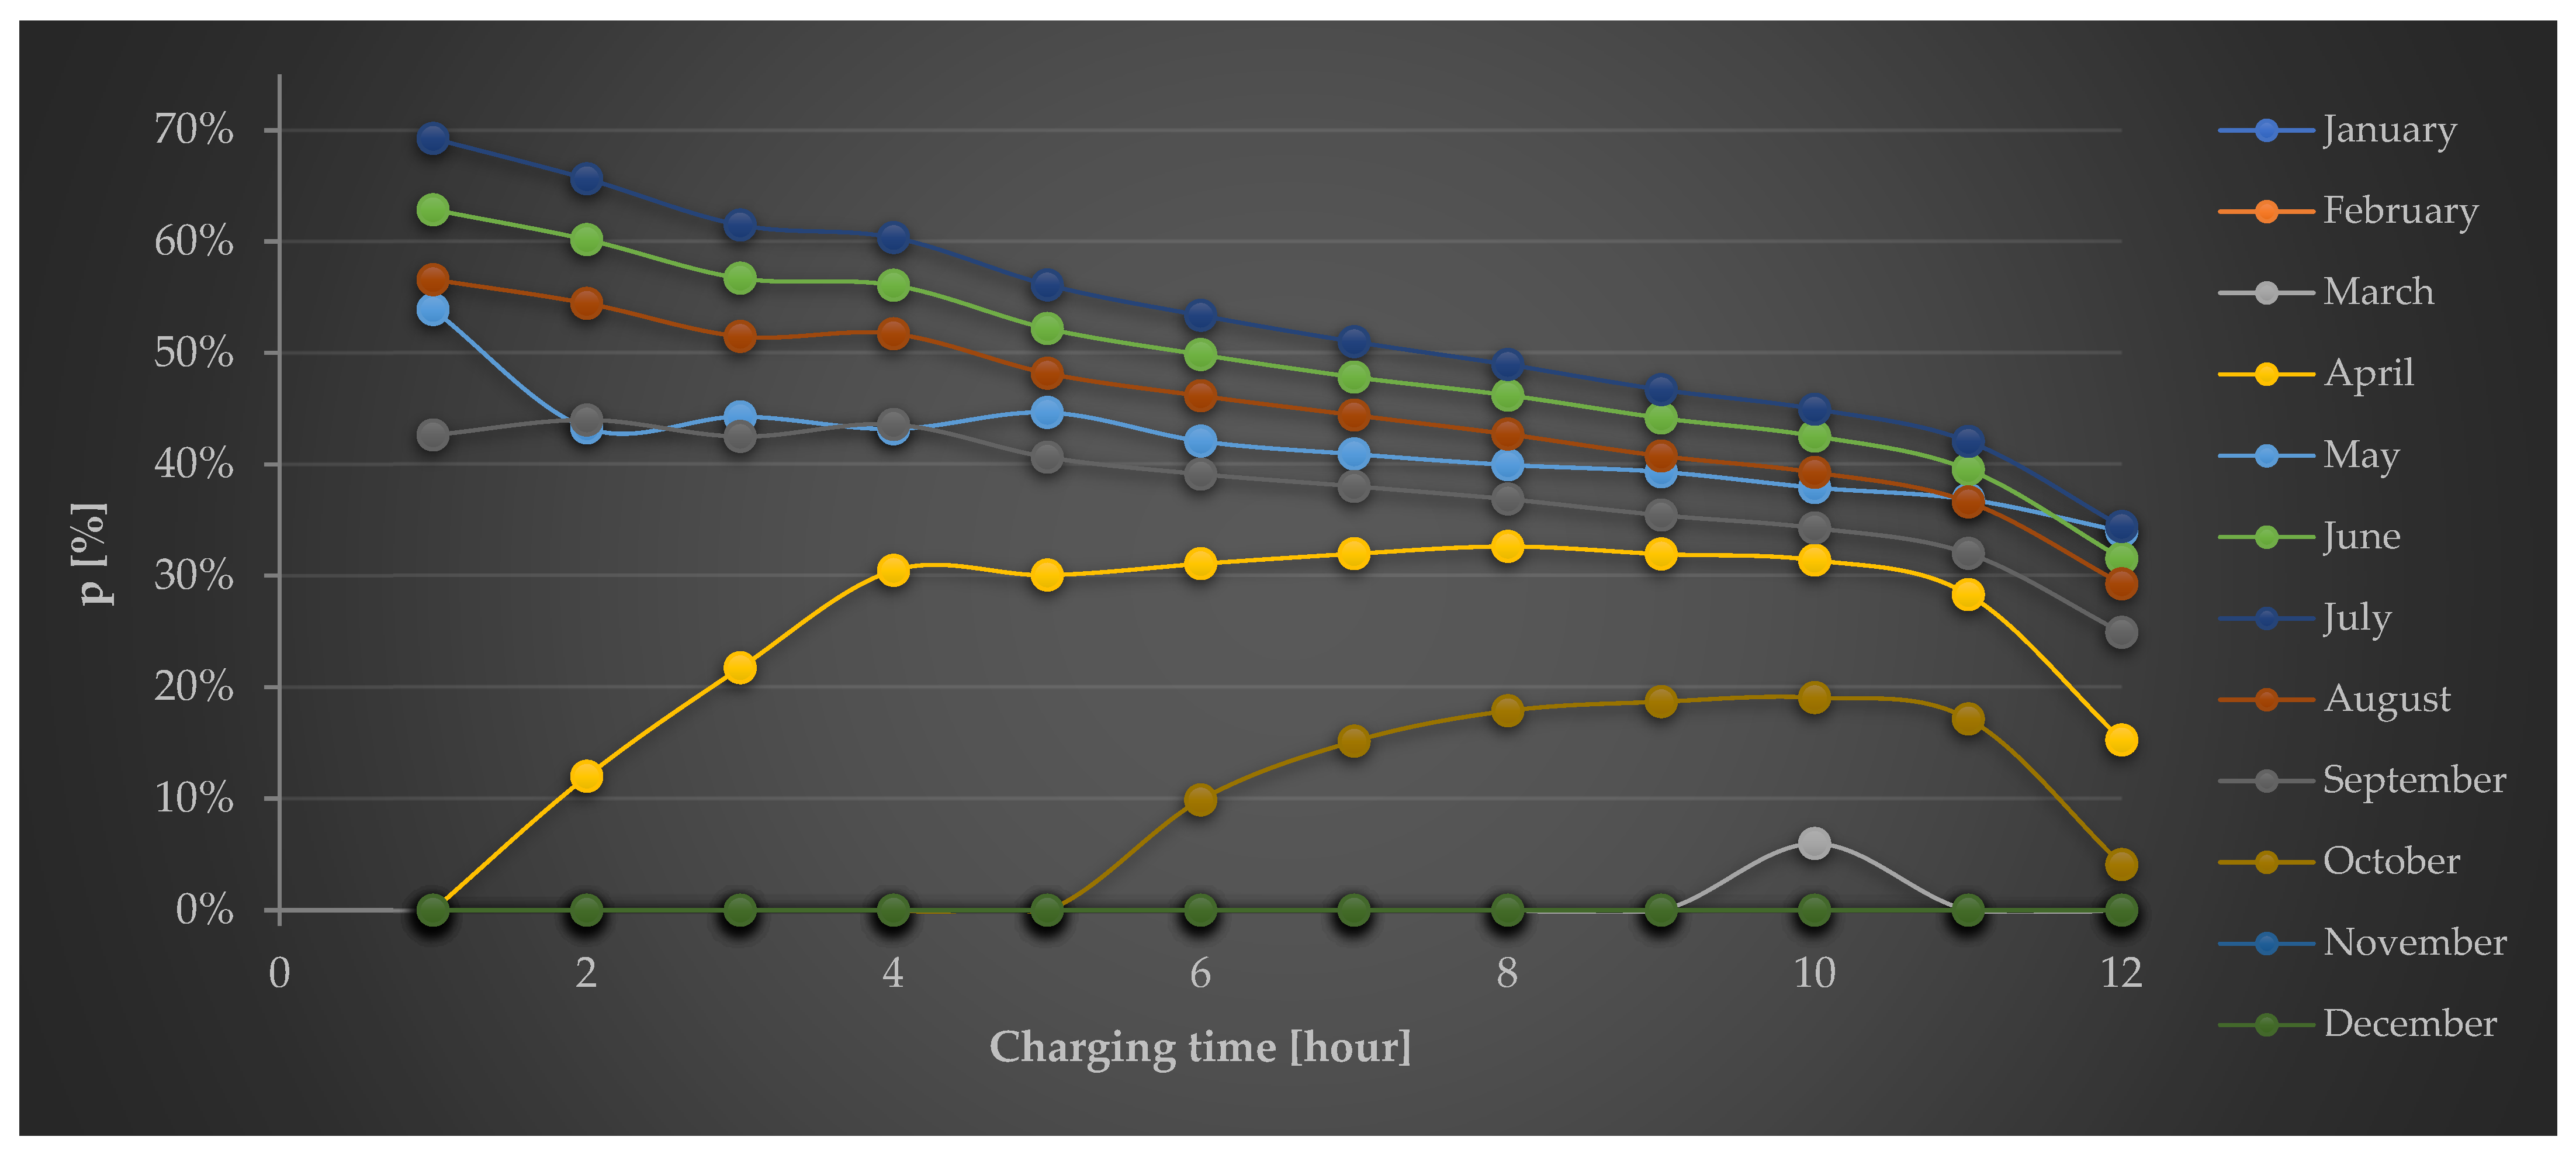
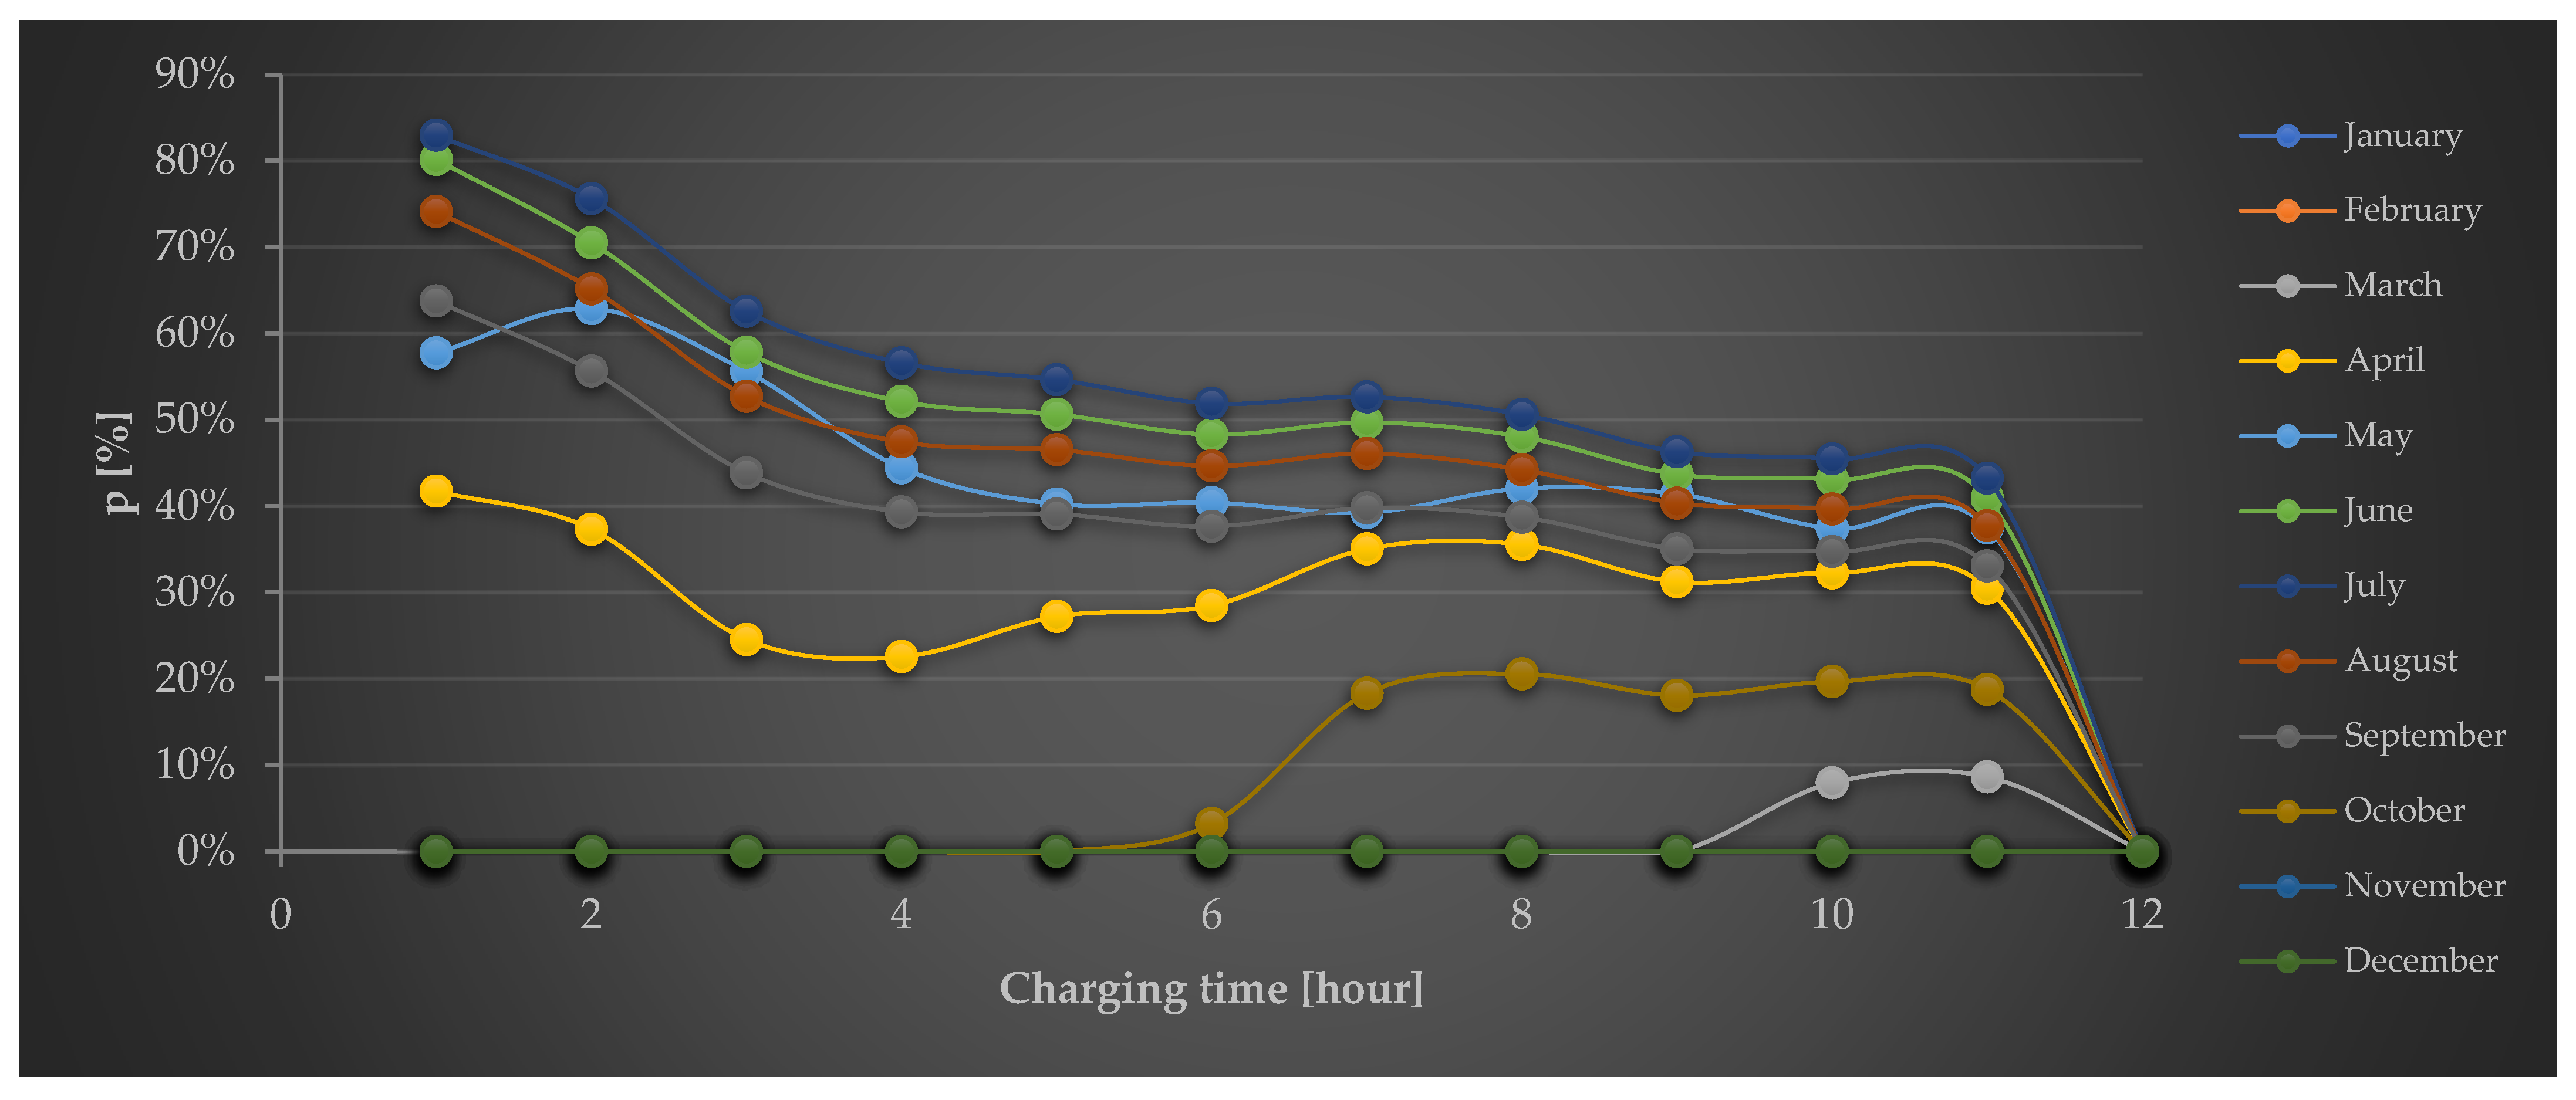
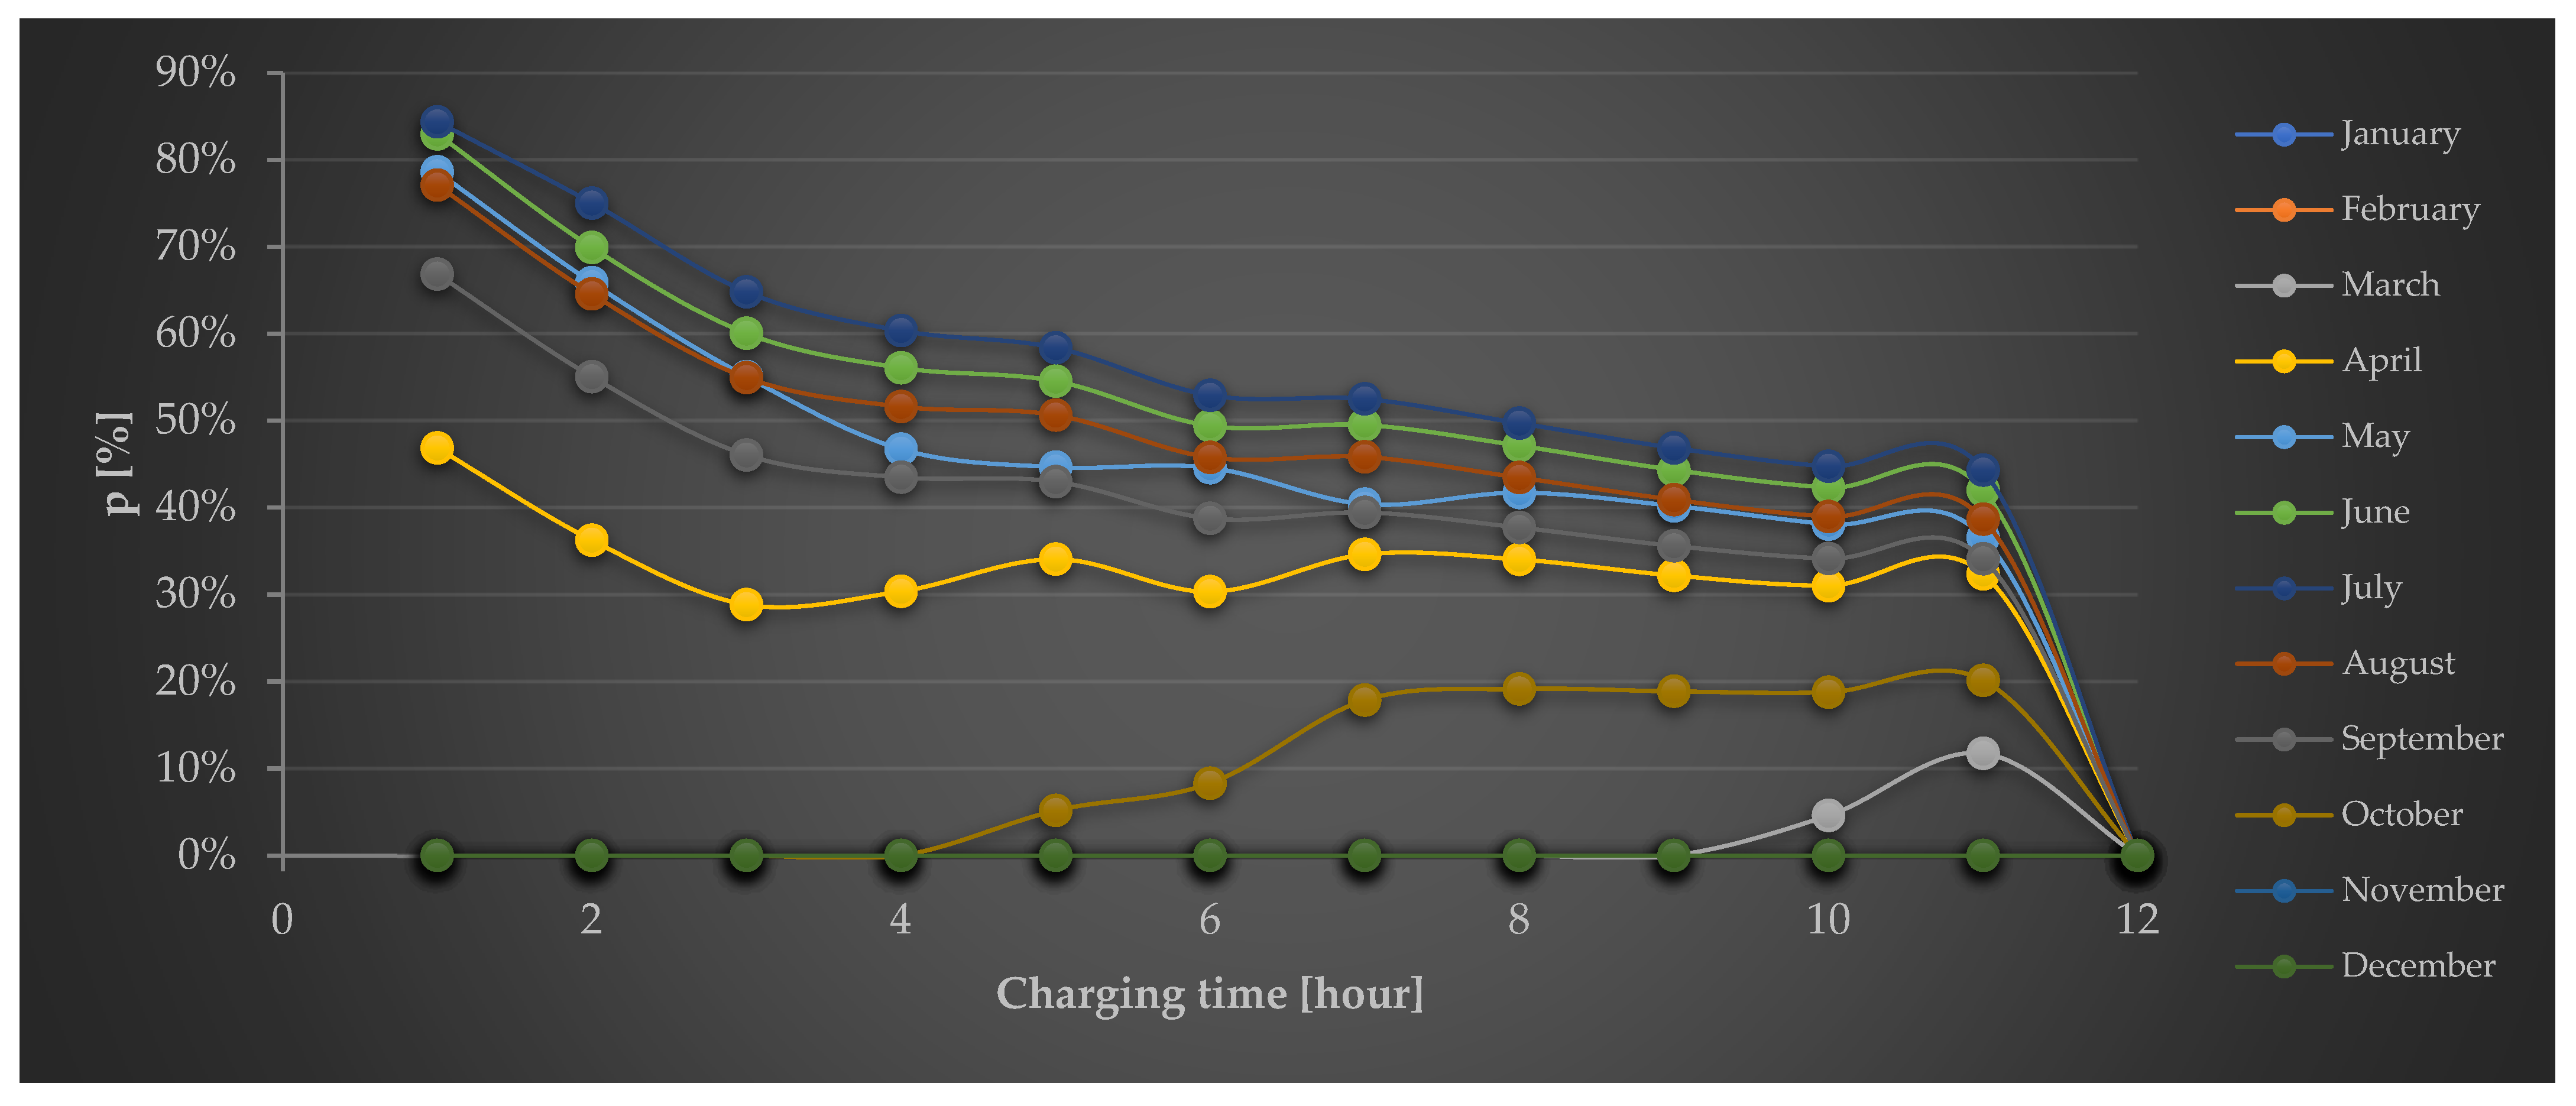
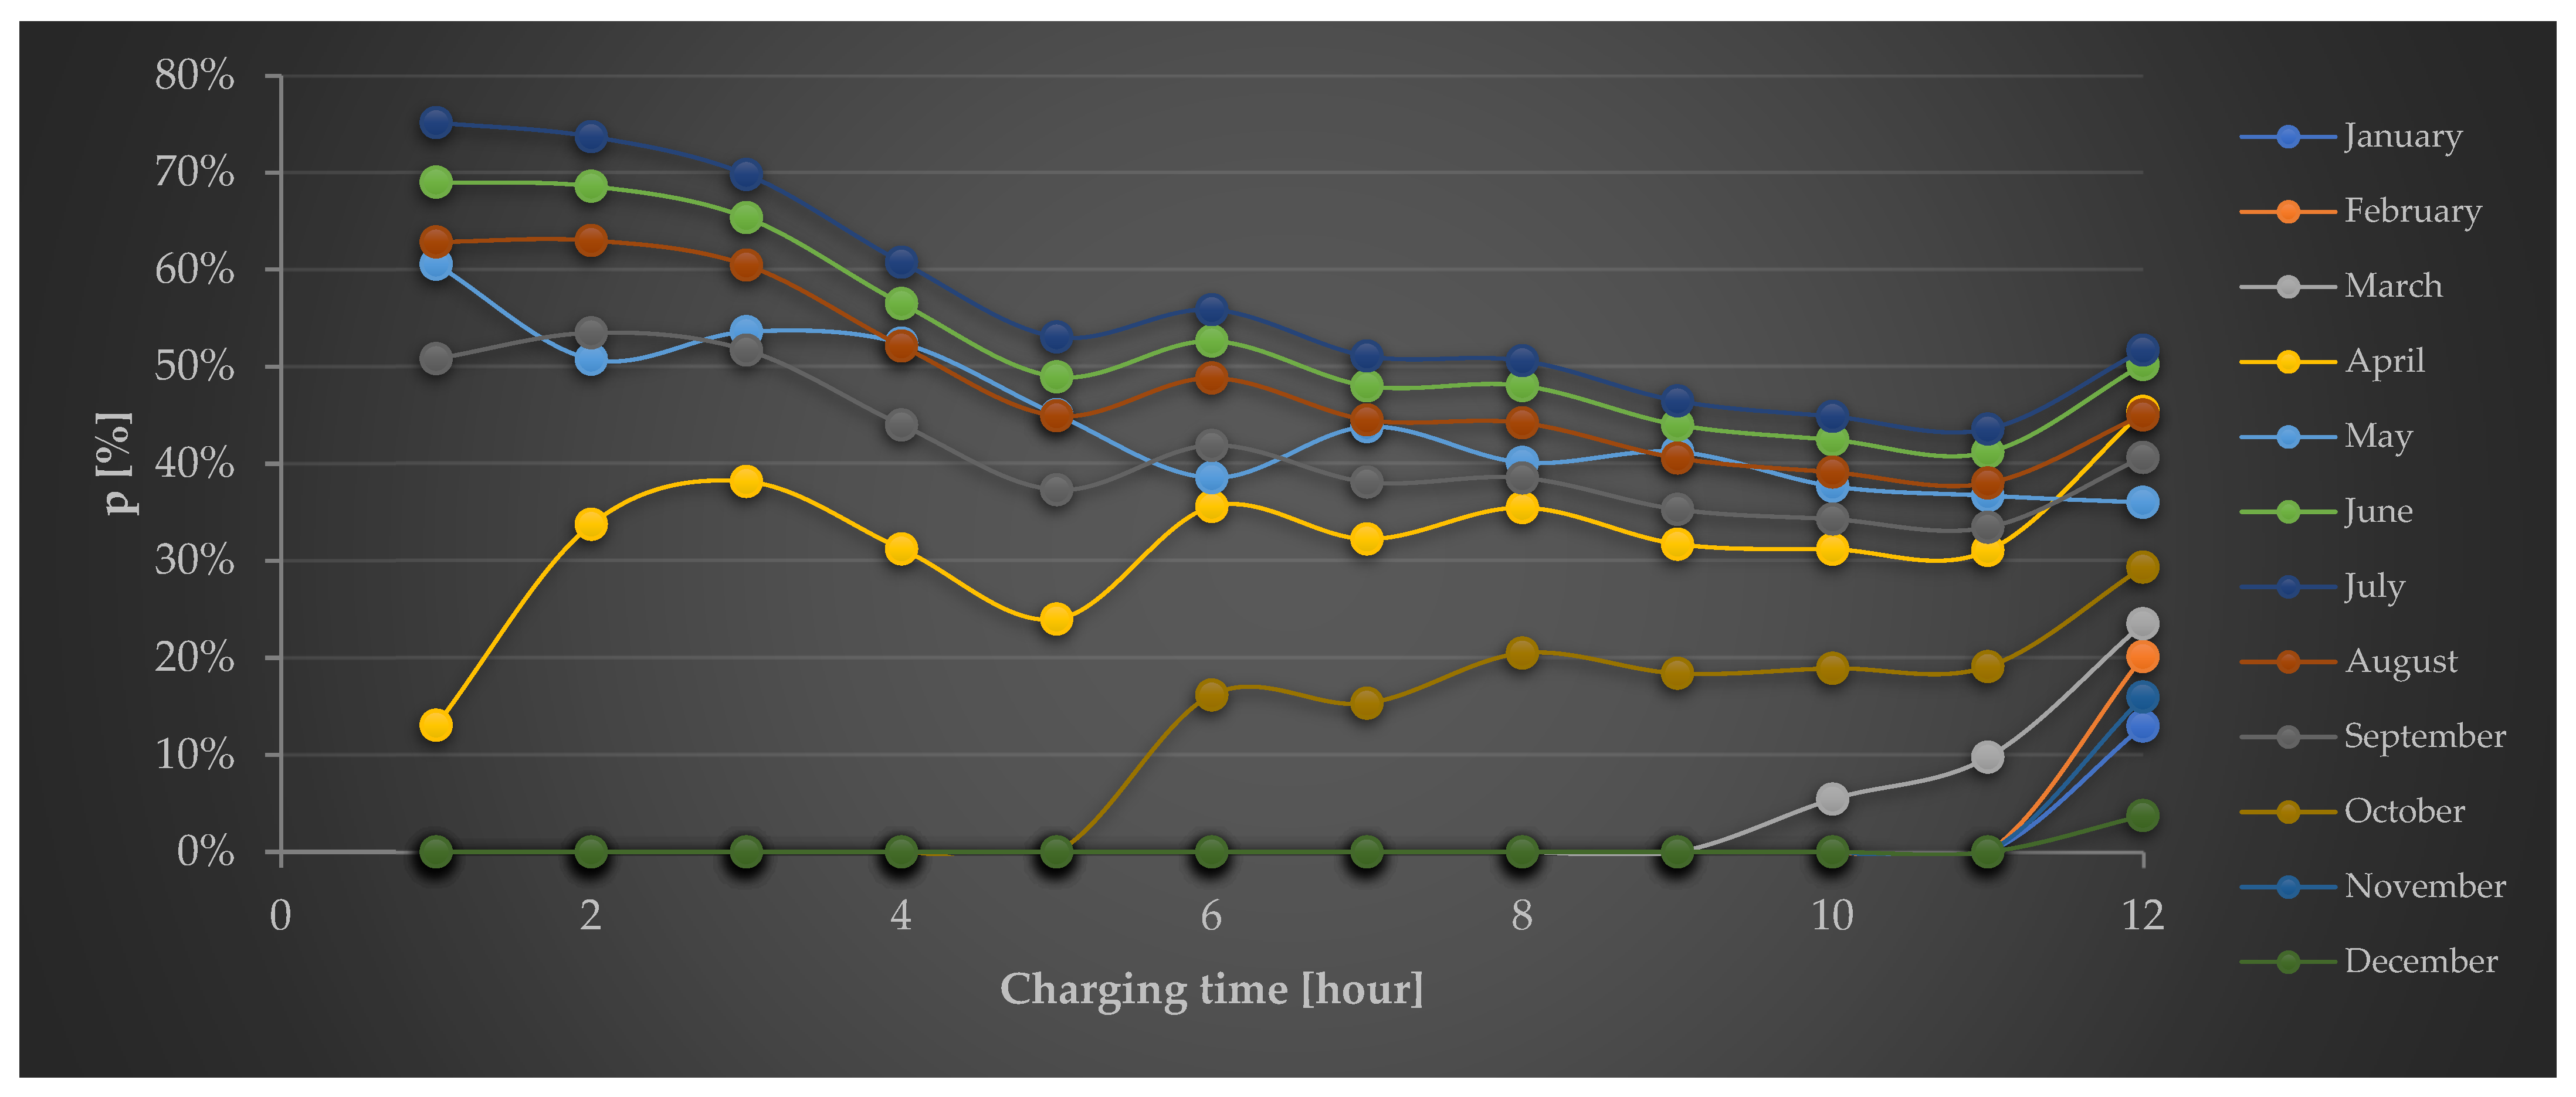
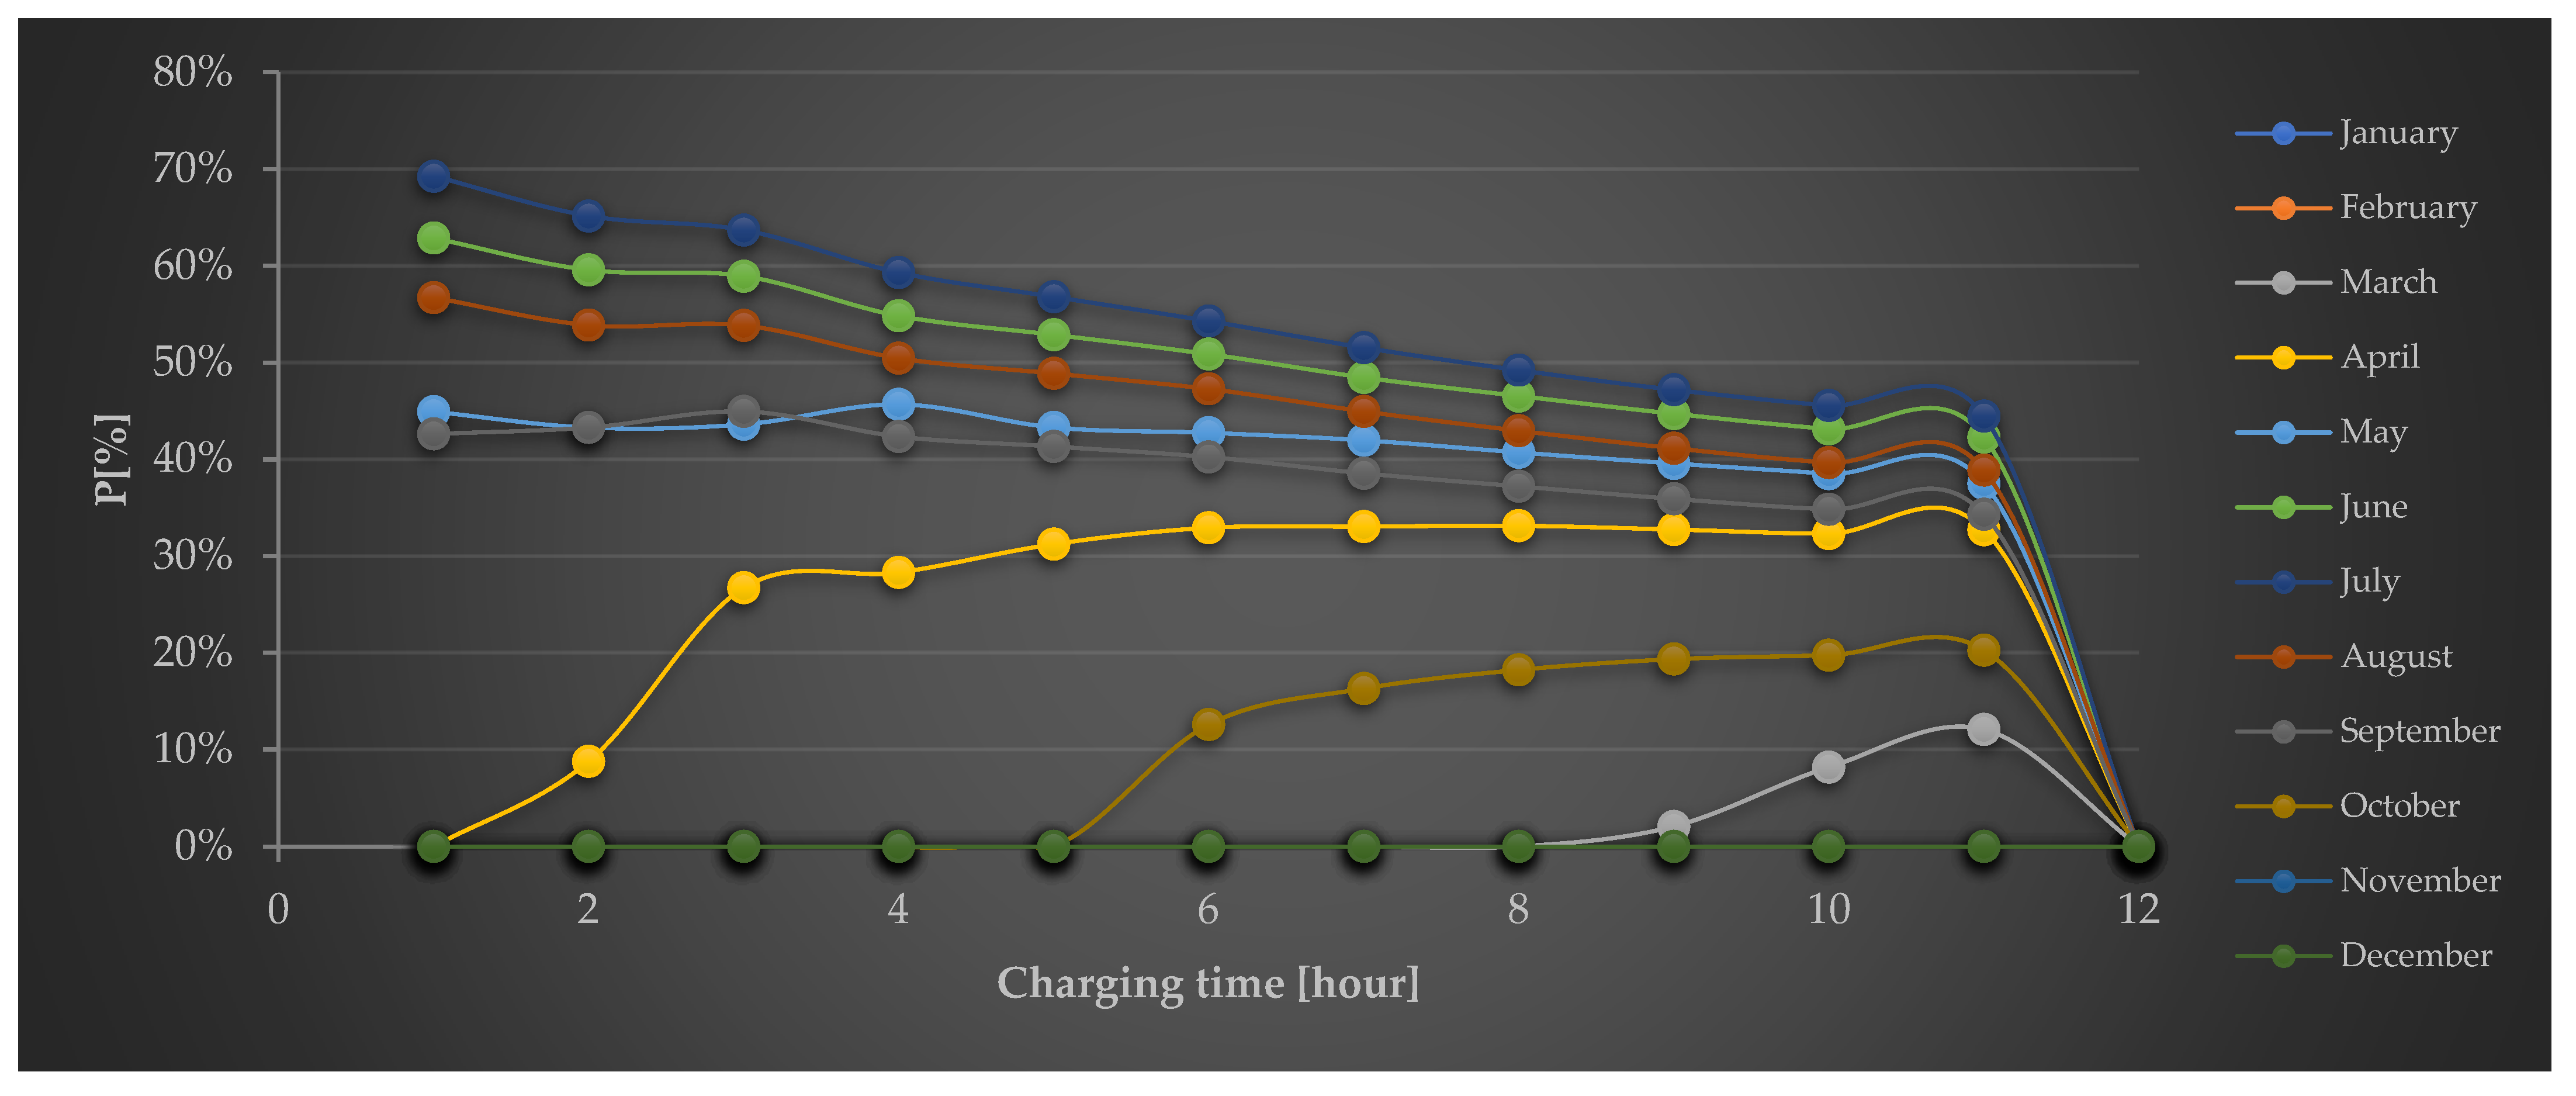
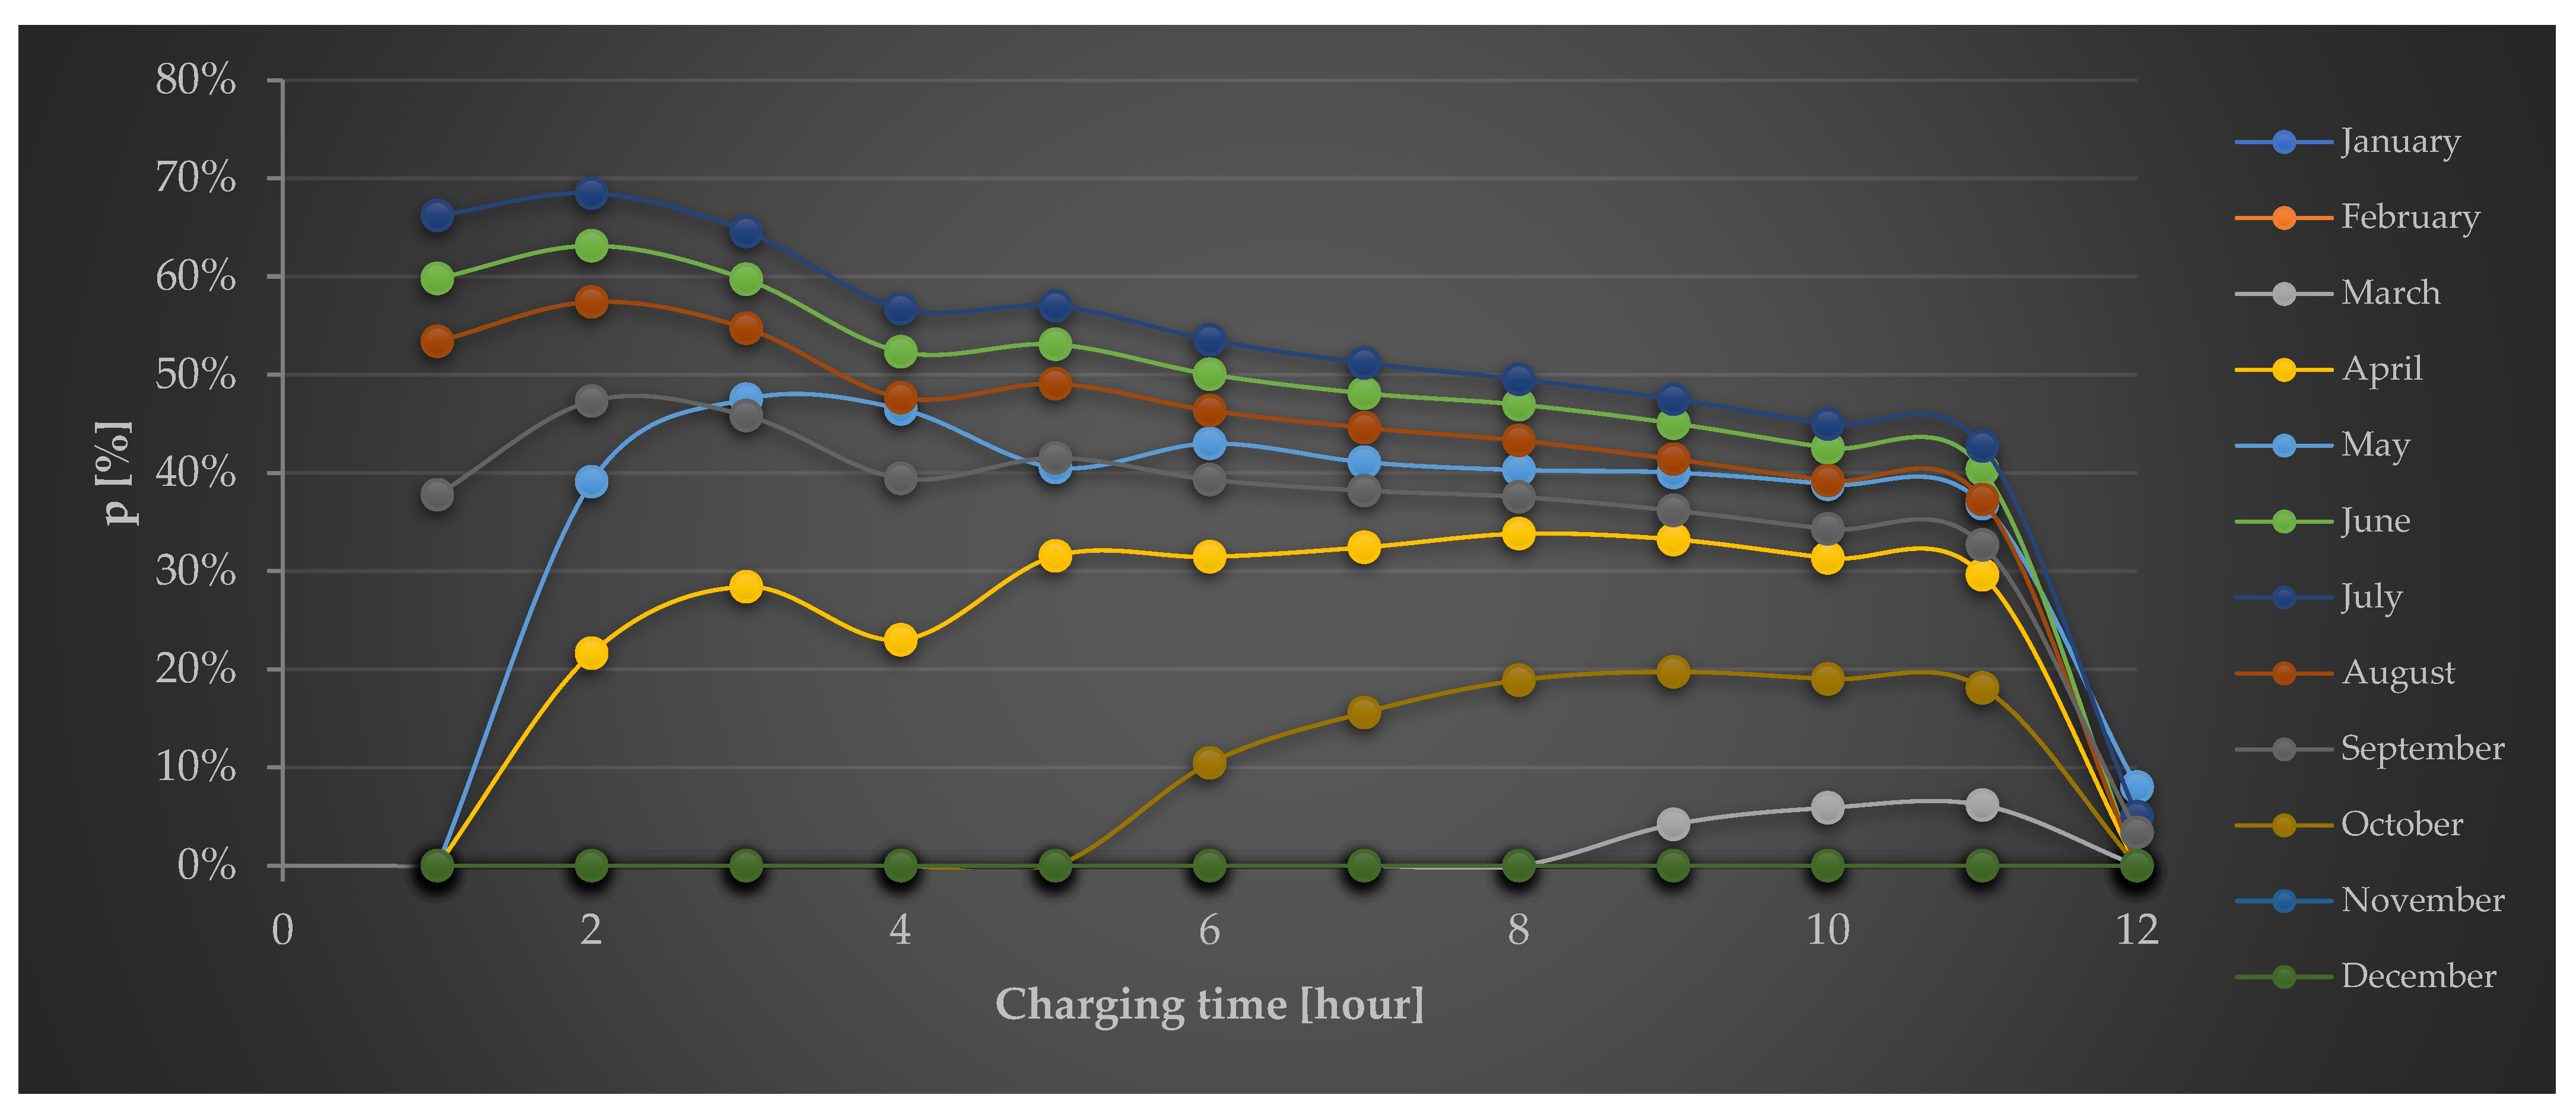
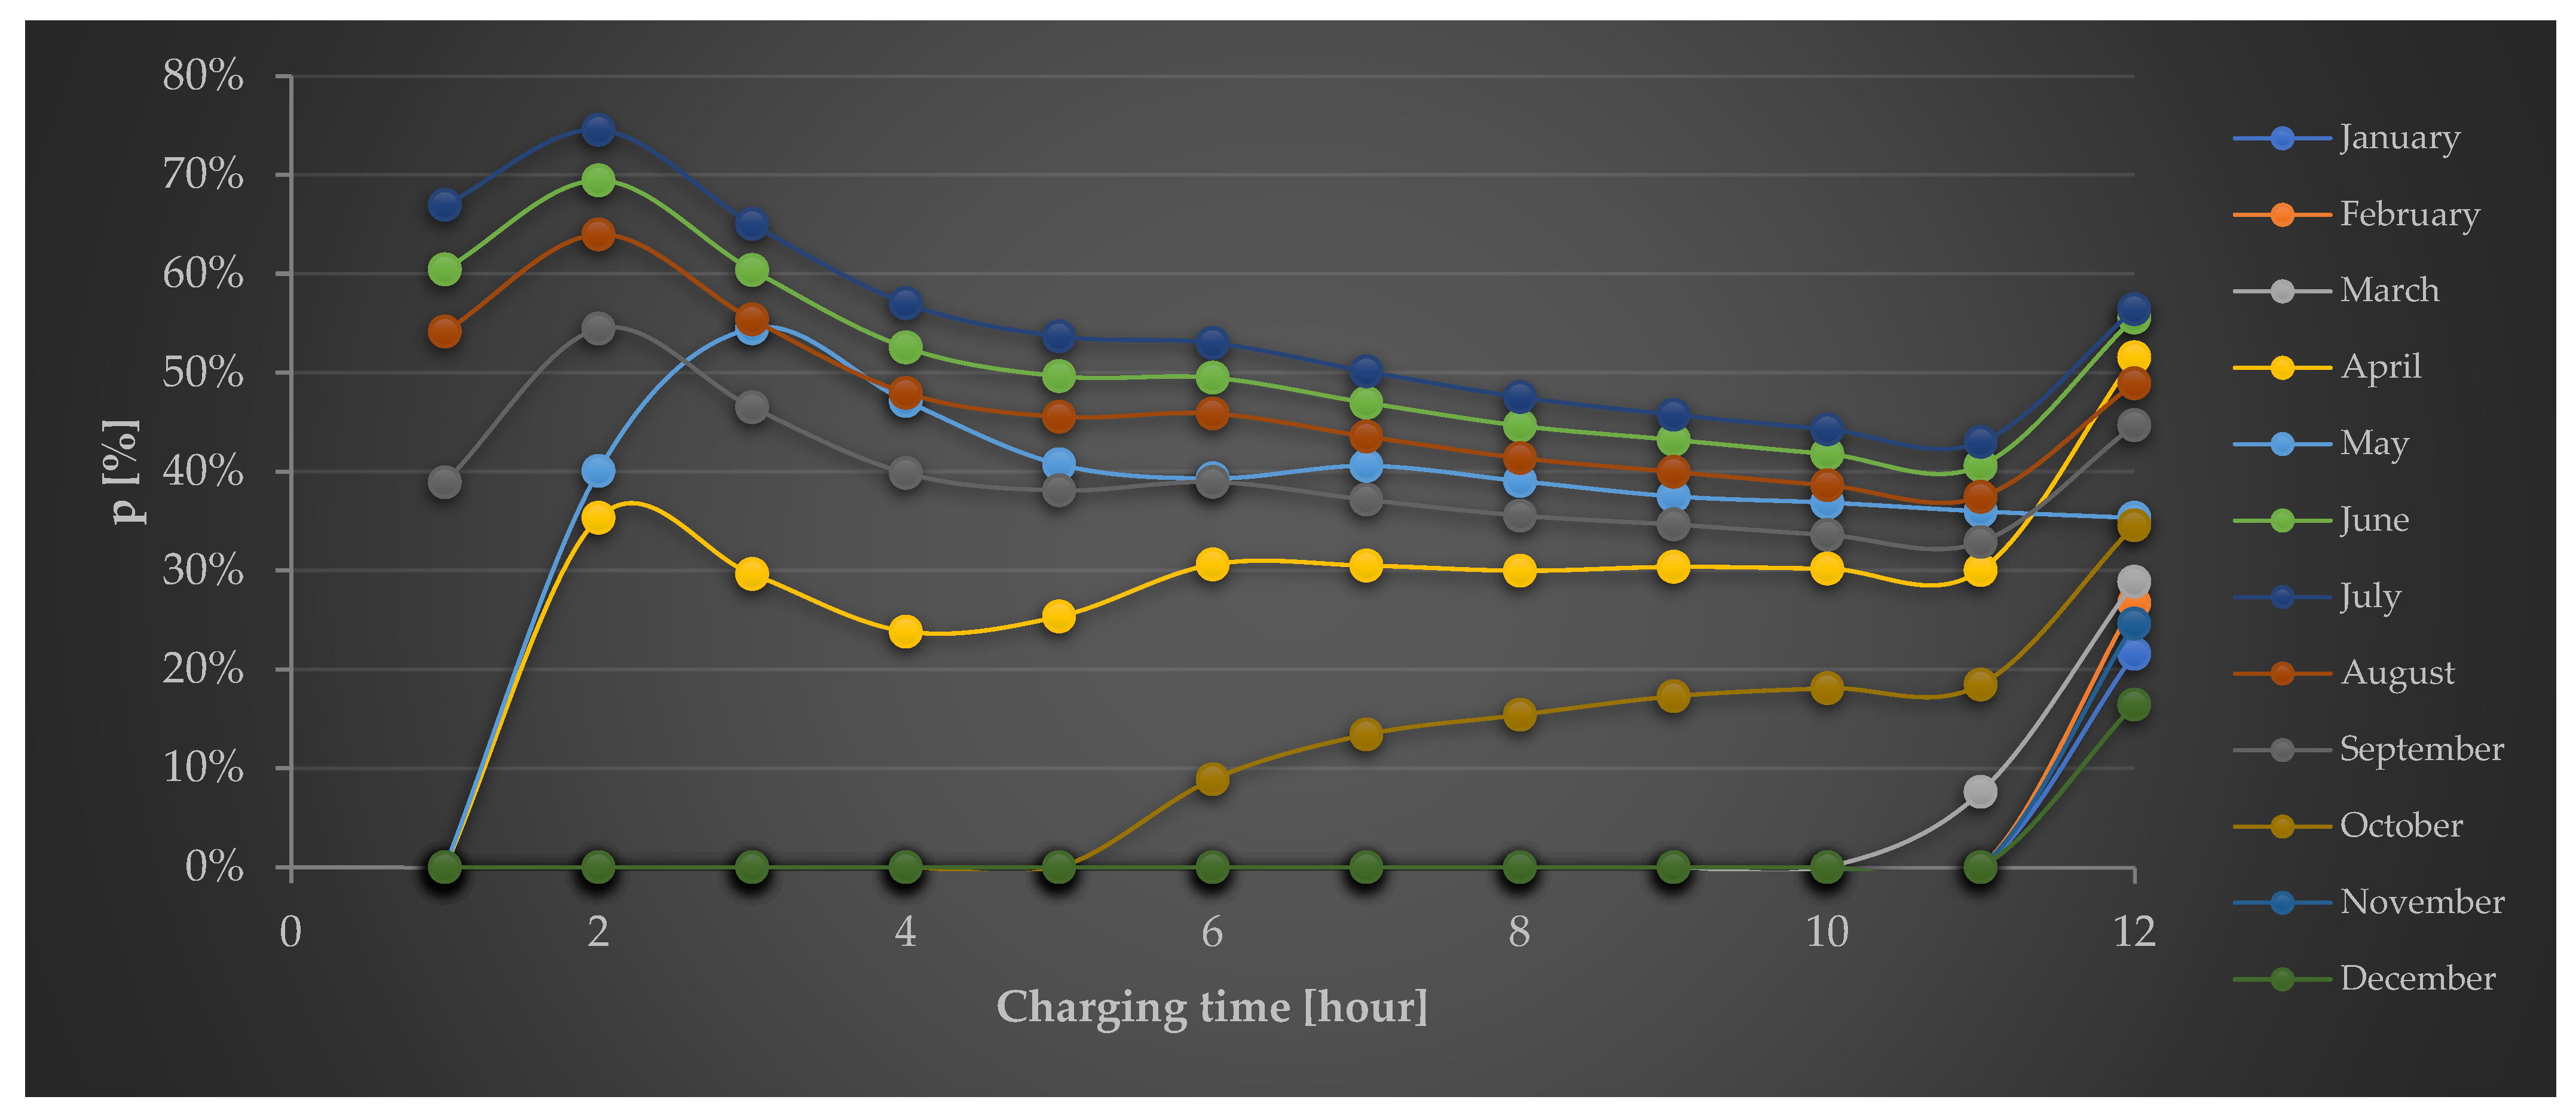
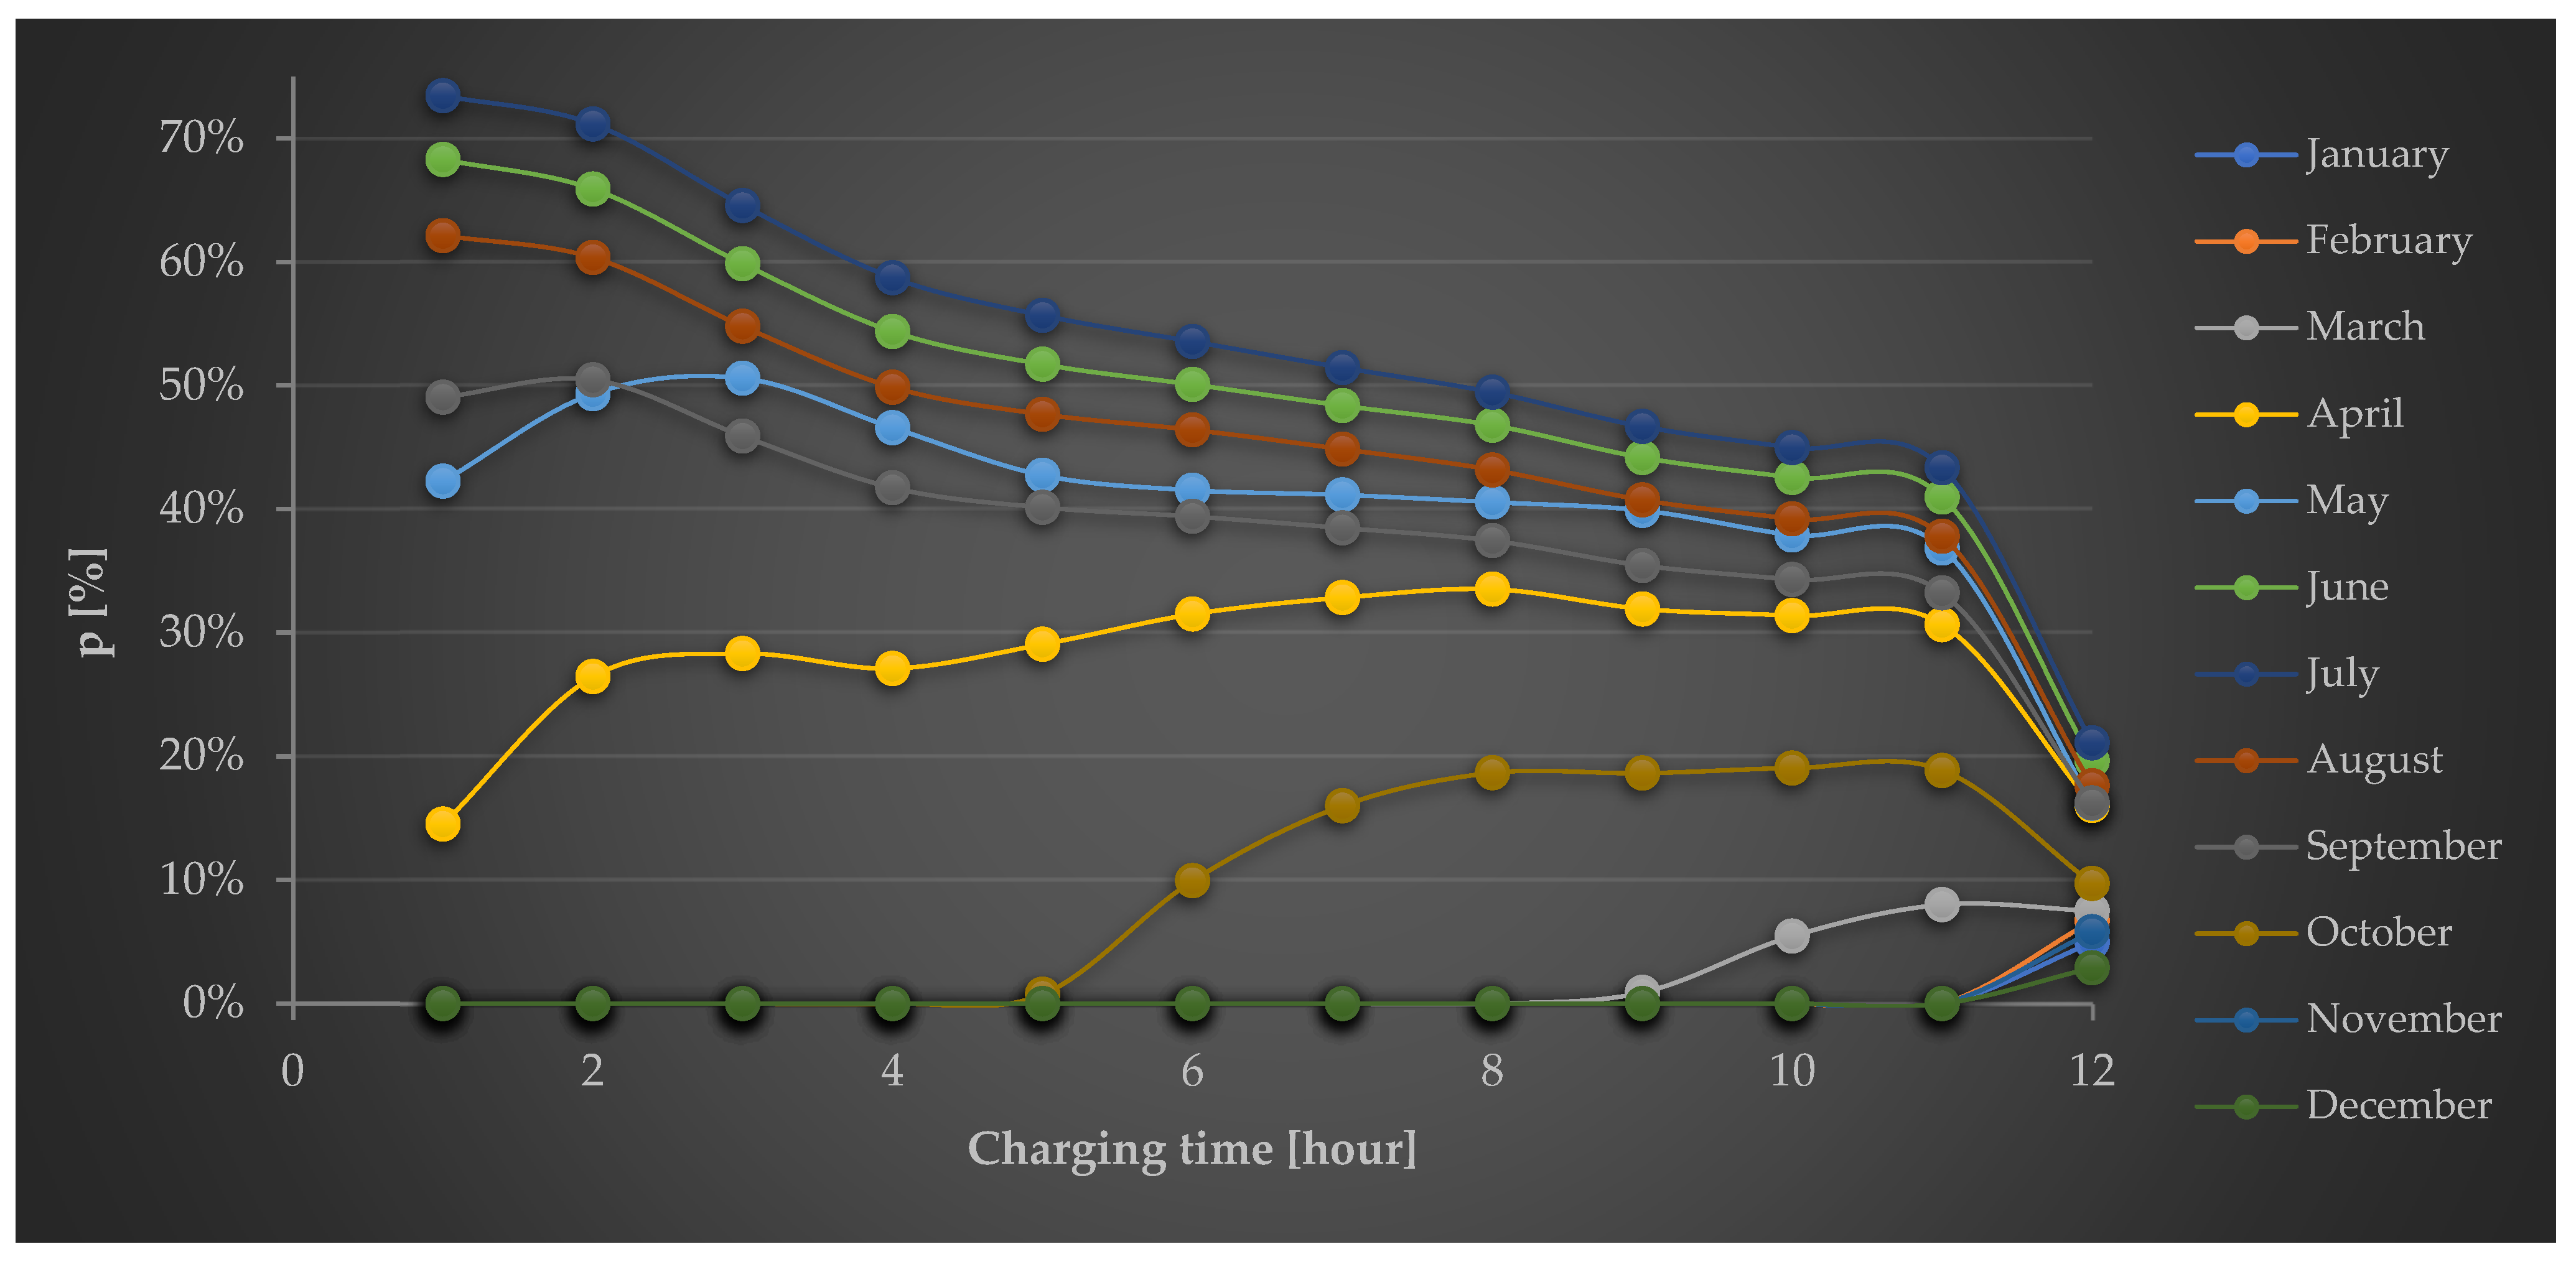
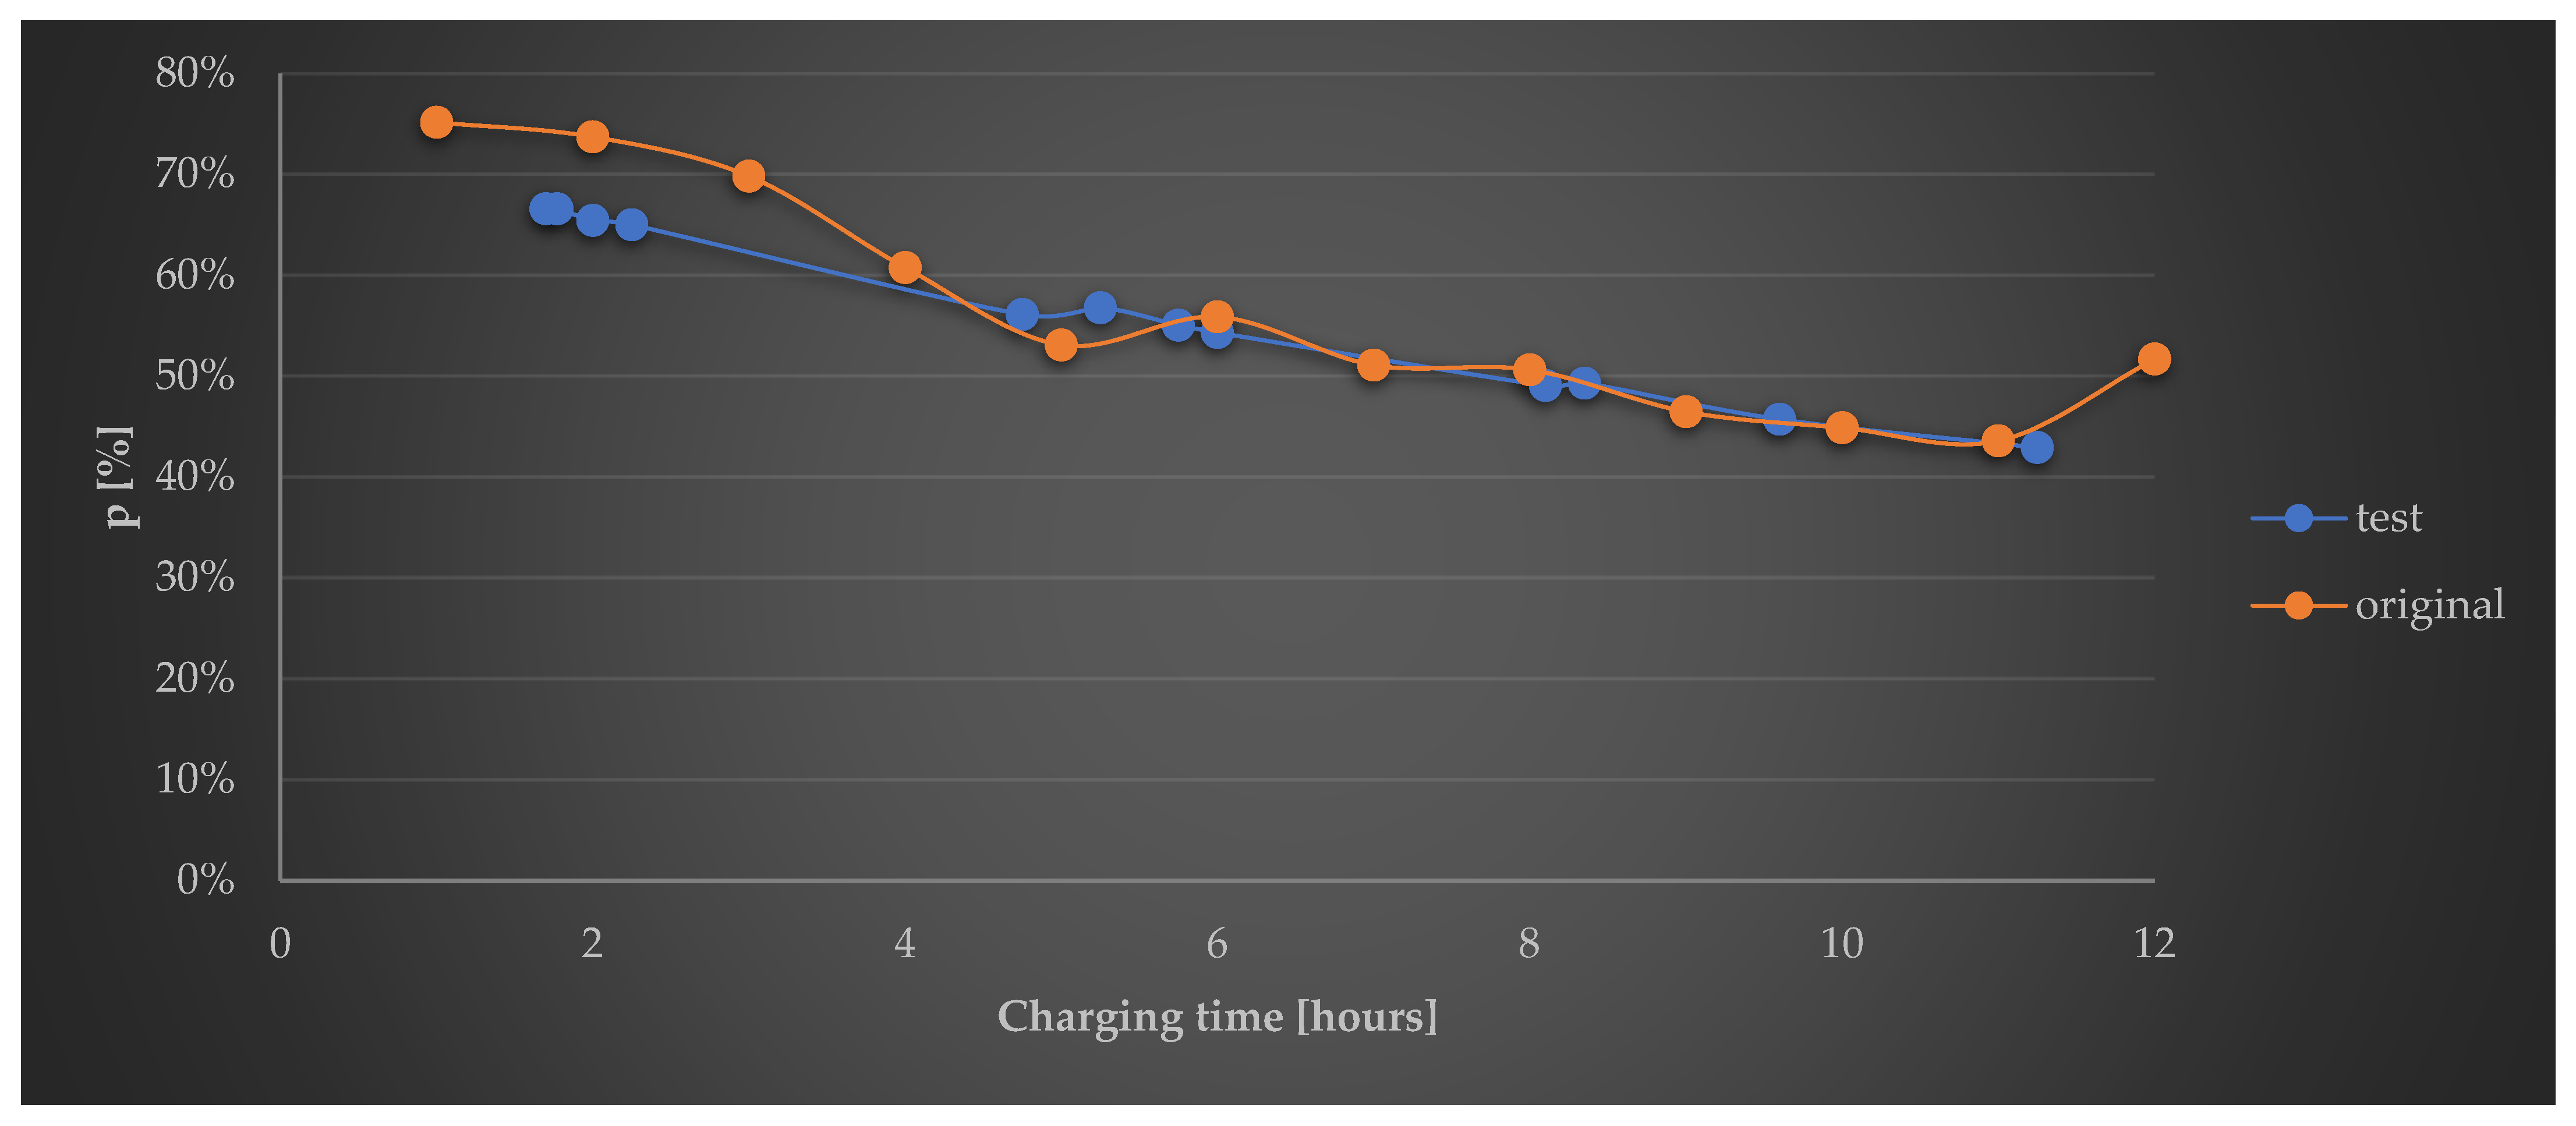
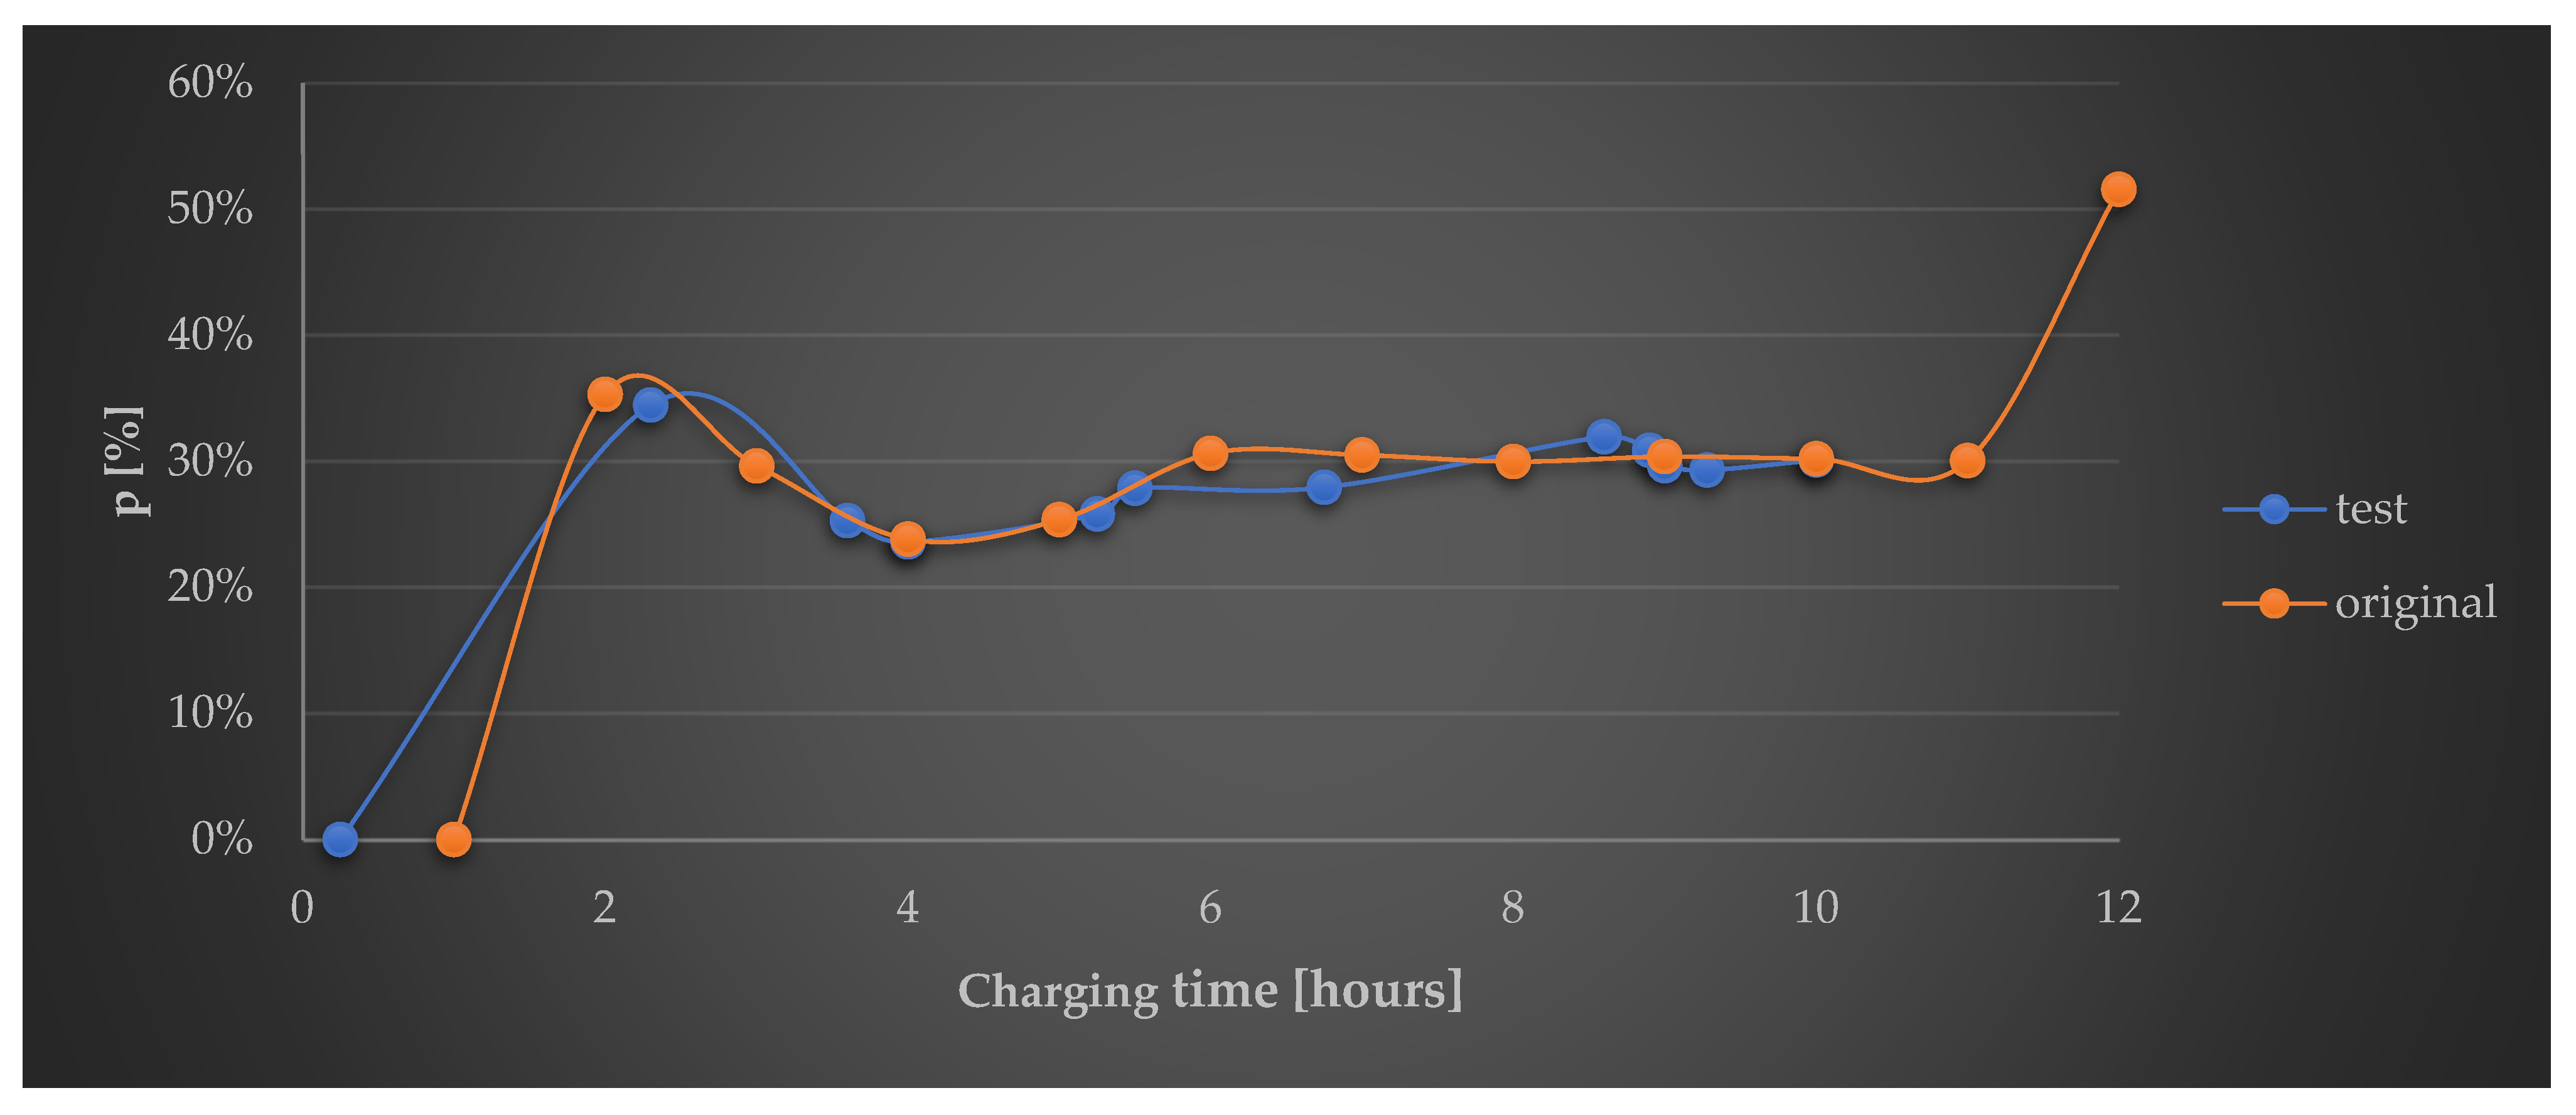
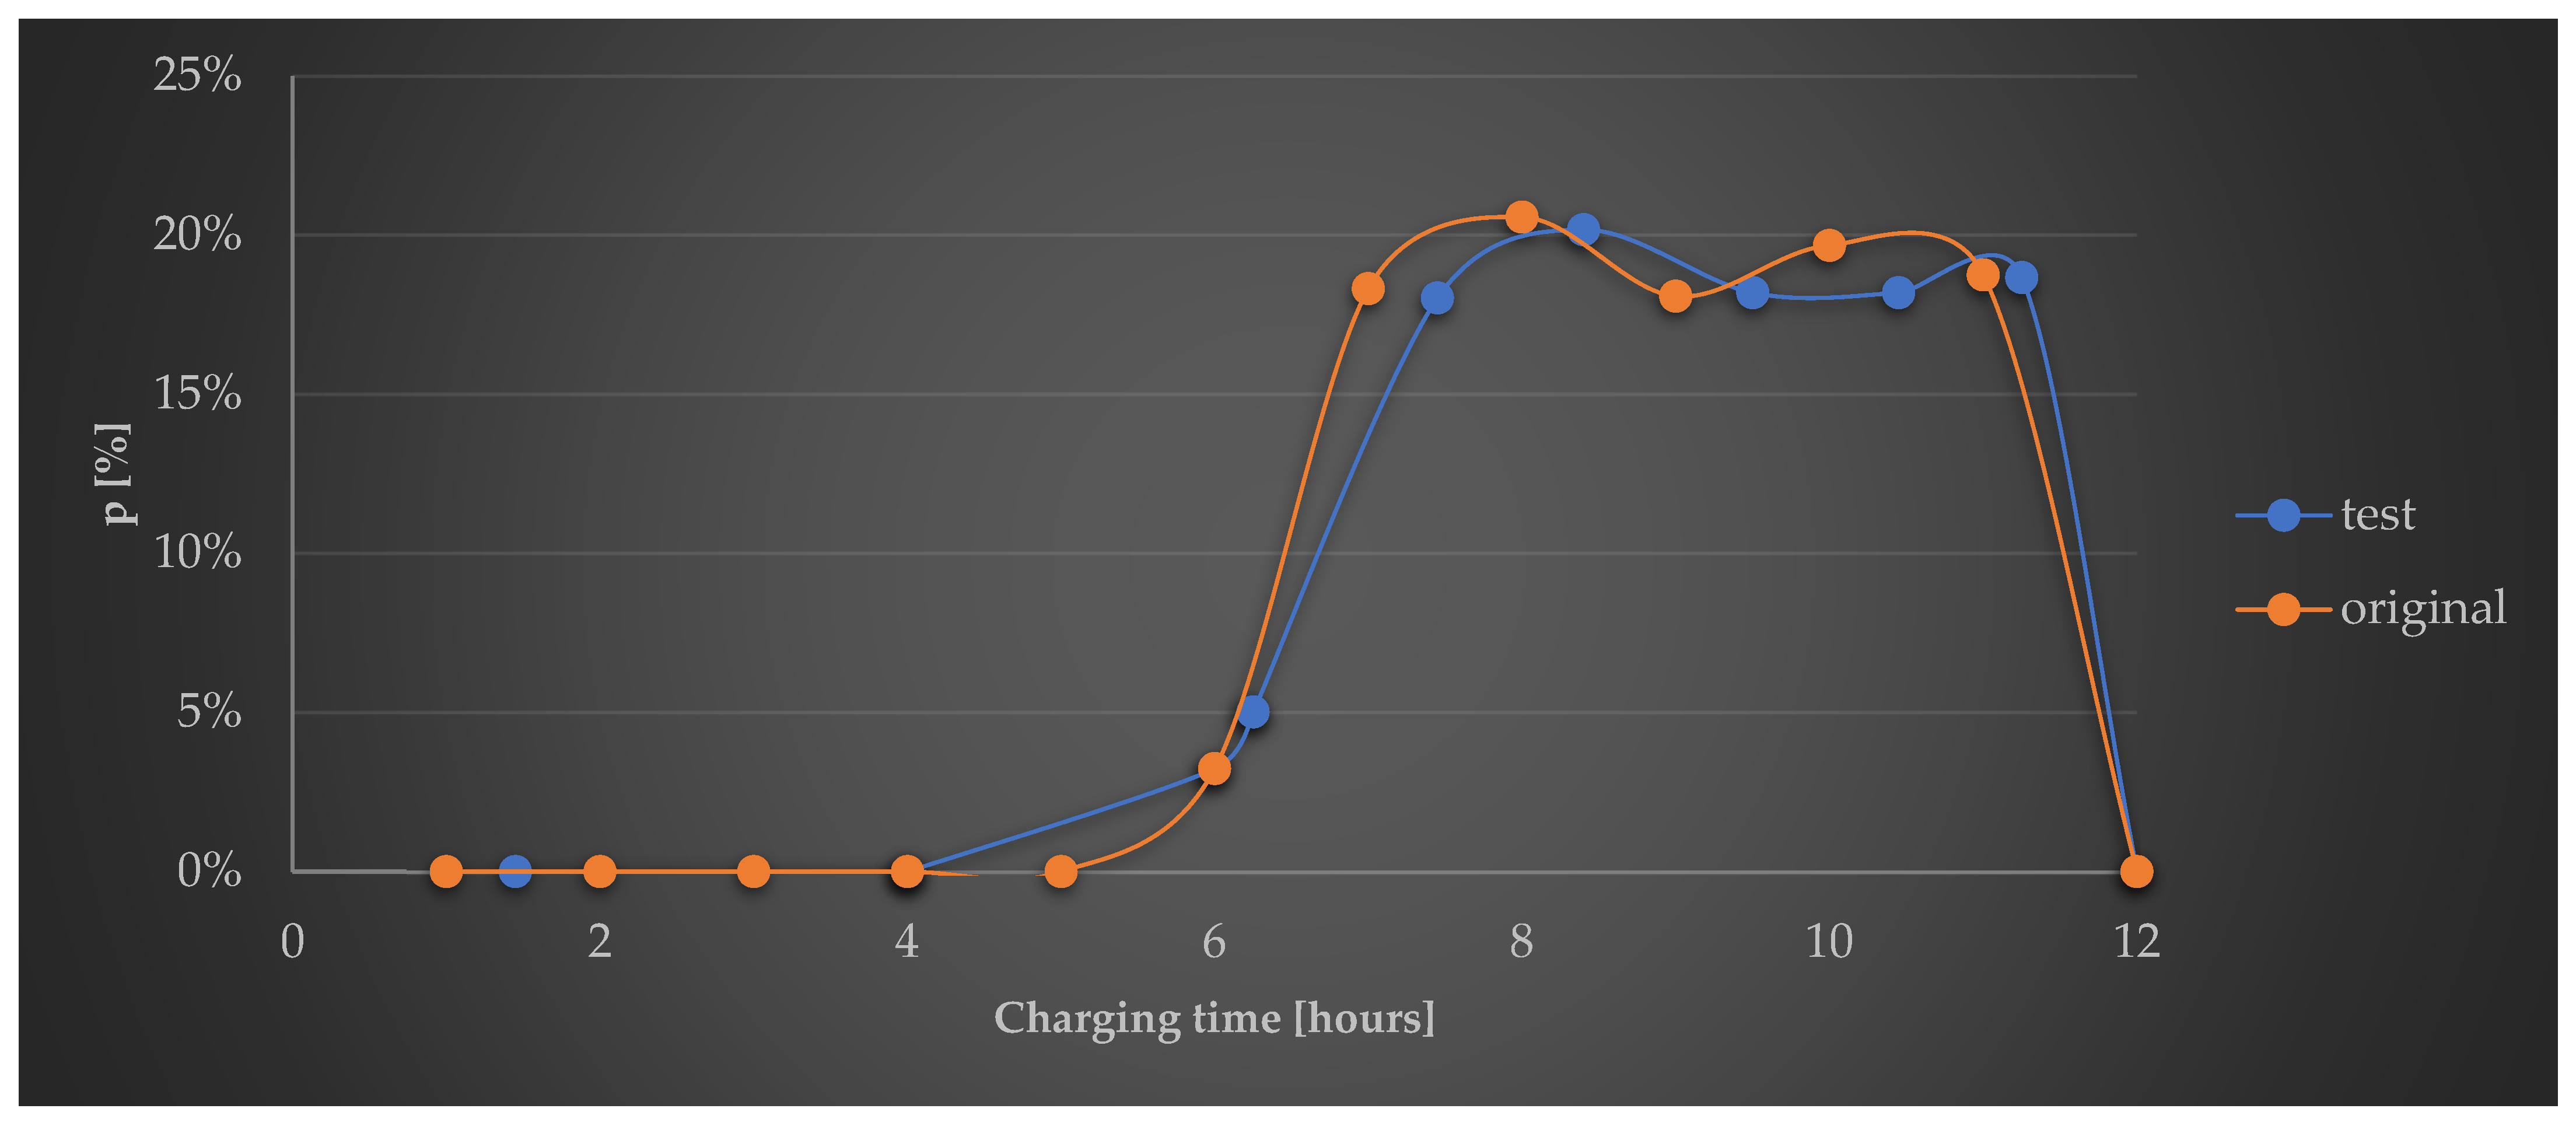
Disclaimer/Publisher’s Note: The statements, opinions and data contained in all publications are solely those of the individual author(s) and contributor(s) and not of MDPI and/or the editor(s). MDPI and/or the editor(s) disclaim responsibility for any injury to people or property resulting from any ideas, methods, instructions or products referred to in the content. |
© 2024 by the authors. Licensee MDPI, Basel, Switzerland. This article is an open access article distributed under the terms and conditions of the Creative Commons Attribution (CC BY) license (https://creativecommons.org/licenses/by/4.0/).