1. Introduction
Underground cabling is commonly used in medium-voltage (MV) distribution networks in European countries, especially in urban areas. Cabling is also growing in rural areas, while underground cables in cities are aging. Condition monitoring (CM) of such power system components has grown as an essential approach for preventing unexpected, long-term interruptions. Maintaining the power supply through alternate network configurations during fault identification and repair may be challenging, especially in rural networks. Consequently, it is critical to identify and track down early-generating (incipient) faults before they result in supply disruptions. Network companies have been compelled by legislative actions and regulatory measures to enhance proactive network monitoring in order to prevent unexpected and prolonged disruptions. Continuous online partial discharge (PD) monitoring is the most effective technique to identify early-generating faults in underground cable networks [
1]. One of the main causes of PD is the deterioration of MV cable insulation caused on by TEAM (thermal, electrical, ambient, and mechanical) stresses. If the PD is not properly mitigated, it could result in the failure of critical components, leading to power outages [
2].
During operation, if the electrical stress in a localized insulation region (especially across the voids, cracks, bubbles, or inclusions) increases to a certain level due to the non-uniform distribution of the electric field caused by the applied voltage, a localized dielectric breakdown process is initiated. During this localized breakdown process, discharges occur, which partially bridges the phase-to-ground or phase-to-phase insulation. This discharge activity results in the rapid movement of the electron within the defective portion of the insulation, resulting in high-frequency current pulses called PD pulses. These pulses can be detected or measured using a suitable sensor (discussed in the next section), which then provides the information on insulation degradation. Once the PD process is initiated, the insulating materials start to deteriorate gradually. This further causes cracking, ruptures, and electrical treeing in the surrounding insulation and eventually leads to the final breakdown of the insulation [
1,
2,
3].
In power cables or other power components, PDs are categorized into three types, i.e., surface discharges, internal discharges, and corona discharges, which do not pose an equally detrimental effect on the insulation system. When there is an increase in electrical stress greater than the partial discharge inception voltage (PDIV), ionization takes place in the voids inside the solid or liquid insulation, resulting in the production of internal PDs. PDs are activated through a cavity located within a cable’s solid insulation. Corona discharges are defined by small discharges, or the “spewing” of electrons from the sharp points on conductors into the air as a consequence of high-voltage stress. Corona discharges may originate from scratches, metallic edges, or the ends of a single cable strand. Corona is not typically regarded as a hazardous discharge. If the tangential electric field component at the surface of the electrical insulation is high enough, PDs may also occur along its surface. Surface discharges are caused by non-uniform contamination, moisture, or a high-conductivity path under high-voltage stress from the conductor to the insulation surface. An insulation system’s deterioration can be caused by any one of these PD types in various ways. Internal PDs are considered to be the most dangerous phenomena since they develop inside the insulation and, if not found quickly, can cause irreversible damage that could result in catastrophic failure [
3]. Due to equipment malfunction, these PD faults can result in huge costs. Consequently, in order to restore the regular power supply without any interruptions, PD faults need to be continuously monitored and mitigated. While performing PD diagnostics during routine or necessary inspections, it is important to analyze and interpret the PD data to make inferences regarding the number, type, and location of PD sources (the focus of this work is the type of PD source/s). This can sometimes be very challenging and usually requires assessment from a PD specialist. However, using manual observation, it is difficult to properly analyze and monitor the huge volume of PD data. To address these challenges, during recent years, an increasing interest has been observed in automating this analysis process. The development of computer-aided digital pattern recognition solutions would enable an initial assessment of PD activity and ascertain whether it indicates an acute problem [
4].
When performing different types of diagnostics, noise poses major challenges. Especially while carrying out sophisticated investigations based on algorithm-based processing of PD data with a lower signal-to-noise ratio, the noise can distort the waveshape and polarity recognition, and noise pulses can even sometimes be recognized as PD pulses. This can easily result in the wrong detection of PD activity, leading to missed maintenance or, on the contrary, unnecessary actions of maintenance. Therefore, effective noise elimination is becoming a necessity, especially nowadays when automated condition monitoring is becoming a favorable practice for electrical networks.
Accurate condition assessments and preventative maintenance of MV cables depend on the ability to distinguish PD from non-PD signals or noise. Extensive analysis and sophisticated signal processing methods are required for this separation. Frequency spectrum analysis, statistical techniques, waveform and pattern recognition, and time–frequency analysis are some of the techniques used. Accurately recognizing and monitoring PD signals facilitates asset management, preventative maintenance, failure prediction, and cable health assessment. Early PD identification reduces downtime, facilitates immediate action, and supports risk assessment. Precise distinction additionally helps in efficient asset management by allowing specific repairs or modifications, maximizing the distribution of resources, and extending the life of cables.
The key components of the pattern recognition of PD sources are signal processing-based feature extraction techniques and artificial intelligence (AI)-based classification techniques. In the literature, several techniques have been used for detecting and classifying PD sources [
5]. For the analysis to be more effective, the feature extraction stage provides relevant data (variables). The classification systems then use the feature extraction set as their input. Some features that are redundant are usually found during the feature extraction process, and these redundant features have an impact on the performance of the classifiers. Even with the latest developments in signal processing techniques, choosing the right feature extraction method remains a difficult task. Therefore, in order to keep the relevant features and eliminate the redundant features, these feature selection techniques have been discussed in this review paper.
Several published studies are available on the classification of PD sources using AI-based techniques. In a comprehensive review of PD classification, Raymond et al. [
6] introduced and summarized the techniques for feature extraction and classification. Another review, focusing on traditional machine learning (ML)-based PD recognition using an artificial neural network (ANN), was carried out by Mas’ud et al. in [
7]. However, the ML techniques used in these studies are restricted to conventional methods/techniques for classifying PD sources. In [
8], a survey was conducted on recent progress using deep learning (DL) methods for PD classification, but a direction for future research work was scarcely presented. Therefore, it is essential to conduct a comprehensively review of the latest research work focusing on detection, feature extraction, classification, and optimization techniques for the classification of PD sources.
The remainder of this paper is organized as follows: The condition monitoring and PD signals are briefly discussed in
Section 2. The sensors, feature extraction techniques, artificial intelligence-based classification techniques, and optimization techniques are presented in
Section 3,
Section 4,
Section 5 and
Section 6, respectively. Finally, a conclusion is presented in
Section 7.
2. Condition Monitoring and PD Signals
PD measurement is typically not carried out while the equipment is operating; instead, monitoring is only carried out during factory acceptance tests (FATs), on-site commissioning, and periodic maintenance for the purpose of estimating defects. It is standard procedure to perform an offline PD test to verify the integrity of the asset insulation. Online PD monitoring techniques have drawn a lot of attention from academia and industry in the past ten years. Online CM systems allow for the detection and recording of PDs, creating a comprehensive database that can be utilized for additional analysis [
9].
In MV equipment maintenance, CM has emerged as a crucial method that is gaining attention worldwide. Online monitoring is used in the CM system to track the condition of the equipment and predict failure by continuously monitoring its operating parameters. Online CM gives useful information about insulation degradation and equipment breakdown. When a defect is present, an alarm is generated so that further actions can be taken before a component fails. One of the primary benefits of online monitoring is the uninterrupted diagnostic process for measurements [
10]. To determine whether equipment health has deteriorated as a result of insulation degradation or overvoltage, online CM is carried out on cables [
11]. The four primary components of online CM systems (PD-monitoring systems) are sensors, data acquisition, fault detection, and diagnosis. Typically, the sensors translate a physical quantity into an electrical signal after detecting the fault. Data acquisition systems subsequently process the sensor data. Finally, the fault detection and diagnosis systems identify the type of fault and provide a clear maintenance indication [
12].
PD testing is extensively utilized in power equipment testing and diagnostics. Cables, transformers, and switchgear are examples of MV components where PD can damage the insulation materials. From gas-insulated to oil-insulated to solid-insulated equipment, PD can happen anywhere if there is an insulation defect or accelerated aging [
13]. The most critical components of the power system are the power cables, which need to be extremely reliable to prevent revenue losses from early failure. They are crucial parts of power systems, and power cable diagnostics depend heavily on PD detection and analysis [
14]. Power cable conditions can now be predicted and evaluated in advance with the use of PD detection and analysis [
15].
An insulating system that is deteriorated by TEAM stresses is typically monitored by electrical engineers through PD activities [
16]. PD can occur in gaseous, liquid, or solid forms and degrade the dielectric condition. The PD characteristics of different equipment can vary depending on its structure and insulation type [
14]. In order to understand the occurrence of PD activity and the characteristics of PD signals, the experimental setup and PD measurement scenario is presented further in this section. As the focus of this paper is PD source identification,
Figure 1 shows the developed PD defects/sources.
The experimental setup is shown in
Figure 2, while its electrical layout is shown in
Figure 3. The PD is measured using a high-voltage coupling capacitor of 1 nF with a voltage rating of 36 kV in accordance with the IEC 60270 standard [
3]. Every cable sample is powered by the power supply and linked in parallel to the coupling capacitor. Electrical stress is applied to the insulation across the two electrodes up to a few kilovolts. The applied voltage level can be altered using the variable voltage supply.
A high-frequency current transformer (HFCT) sensor with a bandwidth of 500 kHz to 80 MHz (−3 dB) and a transfer ratio of 1:10 is used to measure the PD signals. To record the PD activity, the HFCT is connected to the DSO via a 50 Ω coaxial cable and mounted as shown in
Figure 4. A sampling frequency of 0.5 giga samples per second (GS/s) is used to measure the PD data. Computational tools like MATLAB, which are covered in the next section, are used to carry out the analysis on a personal computer.
The nature of the PD source, the size of the cavities, the electrode shape, the type of insulation, the applied voltage magnitude, and the surrounding circumstances all affect the properties of the PD signals [
7]. While the behavior of the PD activity depends on the type of PD (internal, corona, or surface), the general PD mechanism is based on the ABC capacitive model. During operation, a PD event occurs when the cavity collapses quickly as the applied voltage becomes closer to the partial discharge inception voltage (PDIV). At this point, the discharge extinguishes and the voltage across the cavity between the electrodes drops to a tiny voltage. The next discharge is created when the voltage across the cavity rises once more and reaches the inception voltage. This results in recurring and continuous discharge events throughout the power cycle. In both the positive and negative half cycles, PD activity appears at various phase angles of the voltage. Rapid charge movement and a high-frequency and low-amplitude transient current pulse (PD pulse), with a duration in the nanosecond-to-microsecond range and amplitude in mA, are the results of PD events [
9]. These PD pulses’ polarity is determined by the applied voltage’s polarity [
17].
This can be observed in the PD activity captured during a power cycle of 20 ms at 10.5 kV shown in
Figure 4, where two measurements are presented, demonstrating the possible presence of the three types of the PD sources that are active simultaneously. Considering the very nature of the PD activity related to each PD source type, the part of the PD activity that seems to have a significant amount of corona PD is highlighted by the box in both measurements, while PD activity coming from the other two PD sources (internal and surface) is also present in these measurements and need to be separated efficiently. The ability to distinguish PDs from other signals regarded as non-PD or noise is also one of the most crucial elements in the interpretation of the measured data [
18]. Numerous PD signal parameters (key parameters) that show details regarding the severity of the PD and the insulation state of MV equipment can be used to evaluate PD characteristics. PD inception voltage, cumulative energy function, accumulated apparent charge, average discharge current, discharge power, signal frequency, and quadratic rate are considered as the key parameters [
13].
3. Partial Discharge Detection Techniques and Sensors
The measurement of PDs from a cable network requires efficient high-frequency sensors. Capacitive and inductive sensors are well known for PD studies. The location of the sensor determines the necessary sensor properties. For example, the closeness of the sensor to potential PD sources determines the frequency range in which it has to operate. The following criteria should be considered when choosing and designing sensors for the online CM of a power component, including laboratory measurements: cost effectiveness (including the number of sensors and input/output devices); compactness and ease of use; compatibility with the application; sensitivity and reliability; and the connectivity of the sensor to the supervisory control and data acquisition (SCADA) system [
19].
An effective PD sensor should have a high saturation current and bandwidth, as well as being compact, easy to mount, and sensitive to PD values in the tens of picocoulombs (pC). The sensor’s characteristics include a passband transfer impedance, which is the ratio of the secondary voltage to the primary current and the saturation current, and an appropriate frequency response for measuring fast pulses in PD without experiencing saturation. Higher transfer impedance guarantees greater sensitivity, but there is a trade-off between the sensor’s transfer impedance, saturation current, and frequency range [
1]. While performing PD diagnostics, using a suitable sensor is a key aspect. In addition to the key operational aspects of a potential sensor such as the sensitivity and bandwidth, considering practical aspects such as the non-intrusiveness and flexibility of installation of the sensor is critical, especially during online and on-site MV/HV environments. Considering capacitive and inductive sensor capability, inductive sensors, i.e., the HFCT or Rogowski coil, are preferred options in many cases.
A variety of observable phenomena, such as vibration and electromagnetic radiation emission, can be used to detect PD activity in an MV cable. Various detection techniques, such as electrical, electromagnetic, optical, and acoustic, can be employed to identify these phenomena. Electromagnetic waves, high-frequency voltage and current pulses, and other detectable quantities are produced when PD events occur in the insulation system. Each PD detection technique’s application is determined by the physical quantity and detection range [
13,
20]. Both conventional and non-conventional methods are used to measure the various physical quantities, including PD patterns. Electric detection, which measures the captured signal’s current, resistance, and frequency response, is the basis of the traditional PD detection method. The high-frequency current transformer (HFCT) method, pulse capacitive coupler method, and coupling capacitor method are some of the electric detection techniques. Standard PD detection methods may be less sensitive than laboratory measurements because of noise that exists during online PD measurement [
13]. PD events cause variations in the electrical field or current distribution, generating electromagnetic waves. These signals are then analyzed in terms of amplitude, frequency, and waveform characteristics to identify and classify PD events.
Acoustic emission (AE) is typically present throughout the discharge process, with emission measuring in the frequency range of 20 kHz to 1 MHz (audible to ultrasonic). The AE method detects and analyzes acoustic waves produced by PD events, which cause localized mechanical stress in insulation material, whereas the ultra-high-frequency (UHF) technique detects PD-emitted electromagnetic waves ranging from 300 MHz to 3 GHz. Capacitive, inductive, and resonant antennas are among the most common equipment used for detecting UHF signals. The charge acceleration and slowdown during the discharge of PD events results in UHF signals [
5]. Although the UHF technique offers strong detection sensitivity, the main problem of its utilization is the lack of a dependable calibration technique. A quantitative relationship between the UHF signal’s magnitude and the discharge severity must be developed through calibration. Implementing the UHF approach will also likely face challenges since processing and storing such large volumes of data would require a high sample rate in the measurement equipment and perhaps expensive hardware [
21,
22].
For on-site and online PD measurements, where external interferences significantly affect the measured signal, non-conventional PD measurement is significantly more appropriate. A few types of non-conventional PD sensors are described in this section, and
Table 1 and
Table 2 compare conventional and non-conventional PD detection techniques and sensors.
Sensing technology and data analytics are creating possibilities for the advancement of the auto-detection and classification of PDs through CM systems [
21]. The diagnosis of measured data (data analytics) is used to identify trends as well as specific degradation mechanisms. The final interpretation of the analyzed data can be seen as the most important part and is generally performed by a specialist [
22].
3.1. HFCT Sensor
In various electrical equipment, such as transformers, rotating machines, gas-insulated switchgear, and cables, an HFCT sensor has shown to be accurate and reliable. However, because low inductance and MV/HV insulation are needed, this sensor is highly expensive. A current transformer’s basic working principle is widely known. The magnetic flux generated around a current-carrying conductor is measured with this induction sensor. The primary current is determined using an integrator circuit because the magnetic flux is directly proportional to the current’s rate of change (di/dt) [
19]. For the purpose of locating and identifying PD sources, HFCT sensors are extensively utilized in PD detection applications. HFCT sensors can also be referred to as radio frequency current transducers (RFCTs). HFCT sensors are typically clamped into the earthing network’s grounding conductors when performing online PD measurements of MV installations. When coupling ground rods or cables, an HFCT is very helpful. Commercially available HFCT versions, either split-core or closed-core HFCTs, have a frequency range of several hundred MHz for PD detection [
27]. A wound toroidal ferromagnetic is used in HFCT sensors, which uses the magnetic field to detect PD pulses. A magnetic core may cause HFCT sensors to become saturated if they are positioned near a phase conductor with a high phase current, despite their good frequency bandwidth and sensitivity [
1,
5].
3.2. Rogowski Coil
Excellent for measuring PD pulses, HFCT sensors are composed of costly ferromagnetic materials that can handle flux lines up to 50 MHz on one side and become saturated when coupled to high-voltage wires on the other. Alternatively, an electrical device that has been used for measuring alternating and impulse currents for almost a century is the Rogowski coil (RC). Based on the same principle (Faraday’s law) as the HFCT sensor, an RC sensor senses the current pulses linked to the PD and generates a proportional output by measuring the time derivative of those pulses. Together with the mutual inductance between the coil and the conductor, this variable current generates a magnetic field that connects the coil’s secondary and results in a voltage that is directly proportional to changes in the conductor’s current [
5,
35]. The RC is an induction sensor with an air core. Two wire loops connected electrically in “opposite” directions are used to construct its winding. To measure transient pulses, the RC is placed around a current-carrying conductor (power phase or ground connection). It can be placed on ground terminals or live phases. A certain degree of accuracy in measuring high-frequency discharge pulses can be achieved by designing RCs. The three most important factors to consider when designing the coil are the sensitivity, bandwidth, and resonant frequency [
19]. Due to its air core, the RC does not saturate, but its sensitivity is lower than that of the HFCT sensor [
1]. The resonant frequency will drop as the number of turns in the RC increases because of the increase in inductance [
5,
36].
3.3. Acoustic Sensor
Acoustic monitoring is also commonly used for PD online monitoring, but its sensitivity and location can be affected by the propagation path and the distance between the source and sensor [
32]. Aerial ultrasonic sensors can be used to identify PD, but they face challenges in finding its precise location [
37]. When pressure waves are detected during PD activity, acoustic sensors produce electrical pulses with the appropriate frequency and amplitude [
38]. Nonetheless, the efficiency of the signal can be impacted by aspects such as refraction, reflections, signal energy loss, geometrical spreading, and its distance from the source [
39]. The distance from the source has a major impact on PD sensor effectiveness. With cable segments ranging from several hundred meters to several thousand meters, substation feeders for underground cables span tens of kilometers. The installation of PD sensors is therefore appropriate only at cable joints, terminations, or power tapping points [
40].
3.4. Ultra-High-Frequency Sensor
When PD occurs, the radio frequency (RF) method uses the appropriate sensing devices to identify and record the induced electromagnetic wave. This method can be classified as high frequency (HF), very-high frequency (VHF), or ultra-high frequency (UHF), depending on the frequency range of the RF signals. With an HFCT clamped over the ground terminal of the MV equipment, HF signals (in the 3–30 MHz band) can be measured. If on-site testing is required, this offers accessibility and adaptability for sensor installation. But the result is unable to pinpoint the precise location of the PD defects; it can only suggest their existence. The VHF method is not commonly used in practical applications due to the sensors’ large physical size and possible difficulty with internal installation [
30]. The UHF technique exhibits a high signal-to-noise ratio due to its measurement frequency range of 300 MHz to 3 GHz [
31], surpassing the electromagnetic interference caused by the nearby corona discharge [
32]. The frequency range of PD pulses moving through cables is 10 kHz–1 GHz. Depending on the cable structure, frequencies over 100 MHz are attenuated after a short period of propagation in a cable of only a few meters. It is possible to install UHF sensor components very close to the potential partial discharge source. In the case of a cable system, these components could be cable terminations or joints. One benefit of using UHF measurements is that it is simple to distinguish between internal discharge pulses and externally interfering pulses because of the short propagation of PD pulses. Usually, UHF PD measurements are used to monitor the state of expensive high-voltage systems and equipment [
41].
3.5. Miscellaneous Sensors
3.5.1. Optical Sensor
Different processes of ionization, excitation, and recombination during PD result in the production of optical ultraviolet (UV) signals. A consequence of these phenomena is that all materials emit light at different wavelengths. The temperature, pressure, PD intensity, insulation type, and other variables all have a significant impact on the wavelength and intensity of these optical signals. UV, visible, and infrared (IR) wavelengths are where PD emissions are primarily found. At medium- and high-voltage levels, corona emits light in the range of about 280–405 nm at the cable terminations inside the switchgear. A powerful camera flash has a visible light spectrum of 400–700 nm. The light released is roughly correlated with the charge transferred due to the PD [
27]. The ability of the optical sensor to resist electromagnetic interference (EMI) is one of its features. It is mounted on a power apparatus. However, an important disadvantage of this technique is that internal equipment barriers, which cause light to be scattered, attenuated, and reflected, greatly affect its sensitivity. The high cost of this sensor is another issue [
32].
3.5.2. Coupling Capacitor Method
In this method, PD energy is transferred from a PD source to the measurement setup using coupling capacitors. This technology is occasionally utilized in proximity sensors to measure voltage or current. High-frequency PD signals from the cable to the measuring device are coupled using coupling capacitors to prevent the low-pass filter effect. The primary drawback of coupling capacitors is that their low inductance during production is necessary to ensure a suitable high-frequency response, and the capacitors must be made to withstand the equipment’s high-voltage levels of 50/60 Hz. When considering radio frequency current transformer (RFCT)/HFCT-type detectors, for example, their price is comparatively higher due to these two factors. However, because they can be positioned close to PD spots, they have the advantage of the pulse signals being typically strong. Furthermore, it is possible to determine the PD activity in each phase [
27].
3.6. Comparative Analysis of Sensors
Inductive sensing has been a reliable method for locating and detecting PD faults in cables for a long time [
40]. For the purpose of comparison, three inductive sensors were used in [
3]: an RC, an inductive loop sensor (ILS), and an HFCT. Corona, surface, and internal PD sources were chosen because they are common PD types. The chromatic technique was used to assess and compare the sensors’ abilities to separate PD sources and noise. In general, in controlled environments and test objects where noise sources were limited by shielding cages, the chromatic technique showed great potential for clustering and separating sources of PDs and electrical noise captured by the HFCT, ILS, and RC sensors. In realistic/industrial test environments with simultaneous PD sources, the signals produced by the ILS and RC sensors were more difficult to distinguish using the chromatic technique. According to the authors, both the SNR and the outcomes of the separation technique will be enhanced by bettering the design and construction of these sensors. The ILS sensor, for instance, might be shielded so that signals are only detected at the location of the sensor’s coupling. Better source characterization was possible in both controlled and real-world settings because the HFCT typically proved to be a more resilient sensor to outside disturbances. This implies that the signals captured by this type of inductive sensor can be examined using this method [
3].
For comparative purposes, the author of [
27] tested various sensors in a lab setting. In the lab environment, four non-commercial PD sensors were put to the test. According to the tests, RC-based sensors performed better than HFCTs because of their higher SNR. The design and performance characteristics of the RC and HFCT sensors were compared in [
26] in order to measure the PD signals that are released from PD defects. These sensors were chosen for their operational behavior, installation potential around the cable shielding, and non-intrusive sensing ability. When comparing the performance of the sensors, the RC displayed a larger bandwidth and the HFCT showed greater sensitivity. The measured signal from the HFCT, however, was noticeably stronger than the RC signal. The amplitude and frequency of the PD pulses were decreased during the propagation of the PD signals due to the considerable attenuation and dispersion caused by MV cables. Sensitivity became more of an issue in these situations. Thus, when it comes to PD monitoring in cables, the HFCT is a better measurement option than the RC based on the performance that has been observed.
3.7. Summary
Successful PD monitoring and diagnosis depend on sensor performance, measurement methods, and data interpretation. Different types of PD-measuring sensors exist, but component-specific sensors are limited. Acoustic antenna used for power transformer and induction sensors are common for cable PD monitoring, respectively. Electrical detection techniques are preferred for laboratory or offline measurements. Specific applications may benefit more from the use of different sensors. For example, UHF sensors are frequently employed to detect PD in cable accessories, while HFCTs and RCs are more frequently employed for cable insulation.
4. Feature Extraction Techniques
The most important part of pattern recognition is feature extraction. Selecting the discriminatory features to be extracted is a prerequisite for performing PD classification. Feature extraction aims to represent the PD pattern linked to a particular defect by extracting relevant information from the raw PD data. It can be challenging to find the right features, but a lot of research has been conducted in this area, allowing for the identification of a wide range of features [
42]. The consistency of the extracted features will have an impact on how well the classification algorithm performs. During the training phase, the classifier uses these extracted features as its input. Additionally, feature extraction helps in reducing the amount of raw PD data for easier and faster processing [
43]. Several methods for extracting features have been proposed, such as phase-resolved partial discharge (PRPD), time-resolved partial discharge (TRPD), and phase-resolved pulse sequence (PRPS). These techniques primarily involve Fourier transforms, wavelet transforms, S transforms, and fractional features. If certain discriminative features are taken out of the raw data, the PD patterns of defects can be found [
44].
For illustrating the characteristics of the PD defects, the detected PD signals from PD sensors can be displayed in both the time and phase domains. Phase domain-based methods (PRPD and PRPS) demonstrate the relationship between the discharge amplitude and cycle number in relation to the phase position, and provide a distinct pattern for various PD defects. Unfortunately, the primary limitation of PRPD and PRPS is their inability to discriminate between source types when there are multiple defect types present, and the performance of PD classification may be negatively impacted by overlapping of the phase domain information [
32]. The phase window method, which divides the 360° power cycle angle into smaller phase windows for feature generation, is the most widely used example of PRPD [
45]. Pulse sequence analysis, or PSA, is another pulse-based technique that works by examining the amplitude and sequence of the neighboring pulses in a pulsed dataset. Although phase synchronization is not necessary for PSA, measuring the external voltage is necessary in order to compute the electric field [
46].
Time-resolved PD (TRPD) is used to represent PD signals in the time domain, allowing for analysis of PD pulses in the time, frequency, and frequency–time domains [
13,
32]. The term TRPD represents the q-t waveform, where “q” is the same as the discharge amplitude of PRPD and “t” is the waveform’s time [
21]. Instead of focusing on PD magnitude, TRPD focuses on the timing of PD occurrence. When multiple sensors are positioned at various locations, time-resolved data can offer information about both PD detection and localization [
13]. There are some interesting advantages to time-resolved data patterns: they enable the detection of individual pulse shapes and offer aging information about the insulation system by showing a correlation between the shape of the PD signal and the type of insulation defect. When measuring time-resolved patterns, a less-expensive measurement system is usually needed than for phase-resolved measurements [
6].
When PD sources are associated with a particular degradation process and the electrical noise level is low in relation to the PD signal magnitudes, traditional PRPD patterns are typically utilized to identify the type of PD source. Each of the PD sources can display a distinct PRPD pattern that makes it easy to identify them; these patterns show the PD activity with the applied voltage. Unfortunately, it is very challenging to locate or capture a single type of source in practical applications, such as measurements taken in industrial environments or the field, so identification is not possible directly from the PRPD patterns obtained during the test. The reason for this is that the PRPD patterns are typically complex, resulting from the simultaneous action of multiple types of sources. In addition, the presence of high-amplitude pulses without phase correlation linked to electrical noise may hide or mask other sources. Consequently, under these conditions, it is nearly impossible for an operator or any intelligent identification system to identify PD sources using PRPD plots [
3].
The presence of noise during PD measurement is a crucial factor. High-level noise signals are still present, especially during online PD measurements, and can mask the true PD signal. As a result, it is challenging to evaluate the characteristics of a true PD signal from a detected signal for PD identification and defect classification. Understanding the characteristics of noise and removing it from the true PD signal will make it possible for the denoising process to be completed. White noise, pulse-type (repetitive or random) noise, and sinusoidal noise are the three types of noise that are commonly encountered during PD measurements. Several denoising techniques can effectively capture and reduce these noise signals [
13].
Several advanced techniques can be used to extract features, including statistical data analysis, signal processing, and image processing [
47]. Large PD datasets can be quickly and effectively identified through the use of statistical parameters in feature extraction. Noise and other variables, however, might have an impact on the outcomes. The features of PD signals can be precisely and accurately extracted using image processing and signal processing techniques. However, these techniques can be costly and time-consuming because they require large amounts of computational power and high-quality PD signals. Existing mathematical techniques are insufficient to adequately represent complex shapes and natural phenomena, but fractal features can. Fractal features are ideally suited because they are unaffected by signal shifting, rotation, and scaling. On the other hand, they are hard to tune and optimize for a particular application because they are sensitive to the choice of parameters [
13,
20]. The majority of feature extraction techniques are verified by skilled operators. These techniques aim to extract significant features from various signal types while taking into account various computational parameters, which is why they require a skilled operator. Challenges remain with feature extraction techniques in CM systems for researchers and industry experts [
48].
4.1. Time Domain-Based Feature Extraction
It is generally assumed that a set of discharges from a particular PD source approximate similar waveform shapes when PD source separation is performed using their generated time-domain signals. It is additionally believed that these waveforms are distinct from those obtained from other sources of PDs. PD waveforms have been subjected to various analyses in order to distinguish between multiple PD sources and to identify individual pulse sources. With the help of these PD waveform-based algorithms, corresponding PD sources can be more easily identified by analyzing PD pulses in the time and/or frequency domains, from which a smaller discriminative set of features can be extracted and projected in two or three dimensions [
48].
Features in the time domain that can be directly extracted from TRPD data or patterns include the peak-to-peak intervals, zero-crossings, mean, maximum, and minimum amplitudes, as well as the number of peaks. Furthermore, probabilistic moments such as variance, skewness, kurtosis, or root mean square can be used to analyze a signal and extract its representative features [
4]. Additional techniques include PCA, entropy, correlation, and autocorrelation [
49]. The average discharge current, the number of pulses, the repetition rate of the pulses, and the pulse charge magnitude (for both positive and negative peaks) comprise their general features. On the other hand, pulse-specific features include the pulse width, rising, and decay times. The existing research literature indicates that both kinds of feature extraction techniques are connected to the noise-impacted pulse peak value, and that using thresholding techniques results in less-precise classification results [
50]. The advantages and disadvantages of various techniques for obtaining features are shown in
Table 3.
4.2. Frequency Domain-Based Feature Extraction
The Fourier transform (FT) is the most commonly employed computation method for the steady-state analysis of stationary signals by obtaining spectrum at particular frequencies. A sum of the individual sinusoids at various frequencies can be used to represent the signal that needs to be analyzed. Without knowing the precise time at which a frequency component appears in a signal, the FT can only identify the presence of that frequency component. Consequently, when transforming the signal to the frequency domain, the time information is ignored [
54].
Frequency domain analysis can increase the accuracy of PD signal or PD source classification. Two methods are available for converting a time-domain signal into the frequency domain: Fourier analysis and fast Fourier transform (FFT). Fourier analysis has the drawback of losing all of the transient/temporal information that is necessary for PD signal analysis when transforming PD signals from the time domain to the frequency domain. Fourier analysis provides information about the frequency at which a given event occurs, but it does not reveal the exact time the event occurred. This issue can be resolved by using FFT [
50]. Unlike the Fourier series, the FFT employs a window technique, meaning that only a portion of the signal is taken into account during analysis. This approach’s drawback is its limited computational precision, which is based on the window’s size. Furthermore, after a time-domain signal is converted into the frequency domain using FFT, it can be difficult to identify the time localization of a specific portion of frequency. In conclusion, FFT works well with stationary signals and yields inaccurate results with time-varying signals [
55,
56].
The short-time Fourier transform (STFT) can be used to overcome the FFT’s drawbacks. Although the STFT has a fixed time–frequency window limitation, it has an advantage over FFT in that it uses a time–frequency window to locate transient pulses in a signal. To overcome the limitations of time- and frequency-domain signals, the wavelet transform is used. In comparison to frequency-domain signals (Fourier series, FFT) and time-domain signals, wavelet transforms have the advantage of processing longer-duration windows or intervals that contain low-frequency information and can provide high-frequency information about the transient behavior of the signal [
50].
4.3. Wavelet Transform-Based Feature Extraction
It is commonly known that the wavelet transform (WT) is a useful tool for analyzing signals in the frequency and time domains. The WT’s primary benefit is its variable time resolution, which results in longer effective time windows for slower processes at lower frequencies and shorter time windows for faster processes at higher frequencies [
9]. The WT is a small waveform with zero average magnitudes and a very short period, and is used to break down the signals. These signals are restricted to the time and frequency domains because they are time-domain signals represented as two-dimensional sets of coefficients. They are used to determine parameters like noise reduction and breakdown points [
21]. Wavelets frequently show irregularities and lack asymmetry. They are better at characterizing irregularities, pulses, and other intermittent events in the signal. Wavelets are available in different sizes and forms. The wavelet can be “matched” to the hidden event by stretching and shifting it (also known as “dilating and translating”), which reveals the frequency and temporal location of the event. Furthermore, a specific wavelet shape (when stretched and shifted appropriately) might match the event exceptionally well. The wavelet transform has the following benefits over the Fourier transform: simultaneous localization in both the frequency and time domains, the ability to extract extremely fine details from a noisy signal, and the ability to exhibit data features (such as trends, breakdown points, and discontinuities) that other signal analysis methods are unable to reveal [
57].
The WT has been used extensively in PD measurement as a tool for signal denoising. Additionally, it has been used to extract representative features from various PD patterns in order to classify insulation defects in MV equipment [
58]. When PD signals are matched by the wavelet function, the WT can reconstruct the PD signals. The wavelet coefficient of the PD signals is kept by thresholding, while the remaining ones are removed. Continuous wavelet transform (CWT) and discrete wavelet transform (DWT) are the two popular methods for wavelet transform preparation. In the former, the wavelet coefficient surface is obtained, whereas in the latter, the translation and scale are discretized [
21]. Many factors need to be taken into account, such as choosing the wavelet transform, the wavelet type, and signal decomposition into several levels. There are numerous wavelet types used to generate features for PD signals, the most common of which are Daubechies (dbN), Symlet (symN), and Coiflets (coifN). Due to their effectiveness (compactness, orthogonality, and asymmetry) in PD data analysis, these wavelet types are recommended. Depending on the data that are analyzed, the WT, wavelet type, and number of decomposition levels are selected iteratively [
50].
Denoising is required for precisely detecting and measuring PD signals because noise can be affected by both the measurement system and the environment around it. One of the primary tasks in wavelet-based PD signal denoising is the mother wavelet selection. A higher correlation between the chosen mother wavelet and the actual PD signals can lead to improved denoising performance. If not, the WT filters would not be able to correctly decompose the original noise-corrupted PD signals, which could result in weak denoising performance [
59]. The literature contains information on a number of denoising techniques for PD signals.
A denoising technique consisting of variational mode decomposition (VMD) and singular-value decomposition (SVD) that is capable of successfully eliminating noise from on-site PD signals was presented by Lin et al. [
60]. Yan et al. [
61] proposed a spectral decomposition method for measured PD signals using the STFT and SVD. Effective noise reduction of the PD signal was possible using this combined method. A denoising method that is based on WT and hard thresholding to eliminate remaining noise from the obtained PD signals was presented by Han et al. [
62]. Wang et al. [
63] suggested a denoising method based on wavelet threshold and VMD optimization with a genetic algorithm (GA) for mining cable PD signals. Additionally, thorough comparative analysis has been published in [
64,
65] to evaluate the effectiveness of WT, SVD, and VMD, the three denoising approaches, for acoustic signals produced by PD sources. The WT for PD signal denoising was originally applied by researchers Ma et al. and Zhou et al. [
52]. This method has undergone a number of improvements, such as thresholding strategies, decomposition level optimization, and optimal mother wavelet selection.
4.3.1. Continuous Wavelet Transform for Feature Extraction
To acquire the detailed time-varying information of a signal, a continuous wavelet transform (CWT) is typically employed. This is a measure of a signal’s similarity to a set of fast-decaying and oscillating functions known as wavelets. Each component wavelet in this set is made up of compression, dilation, and translation of an original function known as the mother wavelet [
51]. A time–frequency signal representation is provided by the CWT, enabling accurate signal denoising of PD. This facilitates the efficient extraction of PD features and precise recognition of PD signals in the presence of noise. PD signals with complex time-varying characteristics can be analyzed using the CWT due to its adaptability to different wavelet functions and scales. The CWT is a robust and efficient wavelet analysis method that breaks down a signal into its component elements for in-depth signal assessment. The CWT enables a time–frequency analysis using wavelet functions with varying scales, in contrast to the conventional Fourier transform, which offers a global frequency analysis of the entire signal. At each position, these wavelets capture local variations in frequency content and are translated across time. This makes the CWT especially helpful for analyzing non-stationary signals with changing characteristics over time, as it allows it to detect specific time-domain features and their associated frequency components [
66].
4.3.2. Discrete Wavelet Transform for Feature Extraction
Time-series signals can be analyzed or denoised using the discrete wavelet transform (DWT) technique. The DWT algorithm works by feeding the original signal to both a high-pass and a low-pass filter at the same time, using a downsampling algorithm. Both the low-frequency content (referred to as an approximation) and the high-frequency content (referred to as detail) of the signal are produced as a result. The process is carried out multiple times on the approximation coefficients until the required level of decomposition is reached [
52]. The decomposition process is shown in
Figure 5.
The DWT is a tool that splits data into different frequency components and then investigates each component with a resolution appropriate for its scale. At a given scale, the number of decomposition levels chosen should guarantee that the DWT decomposition has sufficient frequency resolution to identify PD-associated coefficients from the noise. If the PD signals are extracted using continuous and periodic base (sine and cosine) functions, their energy disperses throughout the entire band and combines with noise because they are transient and non-stationary in nature. Furthermore, achieving both high-frequency resolution and accurate time location is a challenge for traditional numerical algorithms like the FFT. Consequently, DWT techniques are more effective and practical in rejecting various types of interferences from noisy signal and extracting features [
67].
4.3.3. Wavelet Packet Transform and Stationary Wavelet Transform for Feature Extraction
The wavelet packet transform (WPT), which is an adaptation of the DWT, applies decomposition to the details on each level as well as the approximations, producing a complete binary tree. The WPT’s complete binary tree structure enables a more in-depth analysis while increasing the computation load. In contrast to wavelet decomposition, wavelet packet decomposition has the ability to break down both the high-frequency and low-frequency components. Consequently, wavelet packets have a higher frequency and can offer more-sophisticated decomposition techniques [
68]. In terms of the decomposition structure, the stationary wavelet transform (SWT) is the same as the DWT; the only difference is that there is no downsampling involved. In the DWT and WPT, downsampling is essential because it eliminates computation redundancy, enabling the implementation of quick algorithms. Time variance, however, is the price of downsampling. But maintaining the PD pulse’s wave form depends on this time invariance, which is only possible with the SWT [
68].
One major obstacle to PD measurement is noise. Noise can be effectively reduced using WPT, SWT, and DWT techniques. In practice, however, WPT and SWT methods are not applicable because of their high computing load, which makes them more demanding. The optimal balance between computing time and denoising effect is provided by the DWT method [
68].
4.4. Miscellaneous Feature Extraction Techniques
Numerous techniques have been investigated in the past to achieve PD pattern recognition, and different approaches are used to characterize PD. In [
51], statistical analyses of PD datasets, for example, pulse count vs. phase, are used to extract parameters such as the mean value, variance, skewness, kurtosis, and phase asymmetry. An additional method for PD analysis involves examining the characteristics of individual pulses as well as the pulse sequence, such as the voltage difference and time interval between pulses. This method, known as PSA, can offer helpful insight into the nature of the PD source in cases where there are few PD sources. Specific pulse characteristics consist of width, peak value, area-under-the-curve values, or rise and fall times. Separating PD sources can also be accomplished by examining how PD parameters change in response to small variations in energizing voltage [
69]. To characterize PD activity from various faults in terms of various PD pulse shapes and distribution parameters, PD feature extraction was used in [
70]. The investigation employed three distinct sets of features that span different time bases: PD features of individual pulses (in nanoseconds), cumulative data features over a single power cycle (20 ms), and cumulative data features over an extended period of time.
In order to classify PD sources and noise, spectral power ratios at various frequencies were computed for feature extraction in [
71]. Two power ratio values were obtained: one for high frequencies (5–15 MHz), referred to as power ratio high (PRH), and another for low frequencies (15–25 MHz), referred to as power ratio low (PRL). These parameters were used to confirm the identity of the pulse sources for the three common types of PD sources: internal, surface, and corona discharges. According to Raymond et al. [
72], the PRPD pattern can be described using two fractal features: fractal dimension and lacunarity, which are measured with the box-counting technique. Because fractal features specifically describe the PRPD pattern, they can be included into PD recognition algorithms for feature extraction.
Shannon wavelet singular entropy (SWSE) is another wavelet-based algorithm that can be used to analyze the PD signal on some level. Nevertheless, this PD feature extraction method’s accuracy and anti-interference ability are still insufficient. Renyi wavelet packet singular entropy (RWPSE) was developed and used for the PD feature extraction of power cables in [
73] in order to overcome the SWSE algorithm’s drawbacks. To create RWPSE, the authors combined the discrete wavelet packet transform (DWPT) and Renyi entropy. When it comes to high-frequency resolution, the DWPT was superior to the DWT. After comparing the outcomes of RWPSE and SWSE, the authors concluded that because RWPSE has more advantages in PD feature extraction and EMI suppression, it can be used for XLPE cable PD feature extraction. A novel wavelet analysis method for PD cable joint measurements in noisy conditions was introduced in [
74]. The suggested method used two opposite-polarity sensors and the cross wavelet transform (XWT) to distinguish PD signals from noise and external disturbances. After analyzing the XWT’s performance, it was found that the suggested method correctly separated 97% of the PD signals.
4.5. Summary
To identify individual PD sources, most feature extraction techniques used by researchers rely on phase-resolved PD data. However, the literature has also used DWT-based feature extraction techniques for the classification of multiple PD sources. Because PD signals are stochastic, it is difficult to determine the best feature extraction method; therefore, the hit-and-try approach is used exclusively. It is therefore crucial to have a strong reference library on feature extraction techniques. Furthermore, combining several feature extraction techniques into one hybrid technique could be the focus of future research.
5. Artificial Intelligence-Based Techniques for PD Classification
Artificial intelligence (AI) is a broad field dedicated to the development of intelligent machines. The main focus of AI research is on how the human brain makes decisions, learns new things, and solves problems. AI has a subfield called machine learning (ML) that identifies and learns various patterns in datasets. Neural networks, logistic regression, random forests, support vector machines, decision trees, and many more are common algorithms used in ML [
75]. The field of ML analyzes algorithms for creating data models using examples. In order to develop a PD-monitoring system or CM system, one of the primary challenges is obtaining a correctly labeled dataset that includes a representative number of samples from each of the classes involved. Additionally, on-site classifier training is necessary. For an automatic classifier to be trained, a significant number of samples from each of the classes specified in the problem definition are required. This means that a training set made up of a representative number of internal, surface, and corona discharges produced in the object under study should be available in advance for the PD classification problem. Furthermore, in order to ensure that the data provided to the training algorithm are coherent, an expert must determine the correct class for each of these training samples [
18].
Power grid operators and installation manufacturers have discussed the need for high levels of accuracy, sensitivity, and robustness in the development of PD-monitoring systems over the years. Conventional feature extraction techniques, such as statistical, fractal, time, frequency, and other features, are used to extract handcrafted features, which form the foundation of PD diagnostics. Following this, some sophisticated and potent features are extracted using advanced signal processing techniques like the DWT, and traditional ML techniques like artificial neural networks (ANNs), support vector machines (SVMs), and fuzzy inference systems are progressively used for classification tasks. As computing and information technology have progressed, deep learning (DL) has drawn more interest from academia and industry for intelligent PD diagnostics. Deeper structures allow DL models to extract hierarchical features from the input data and produce more precise and reliable results. Additionally, end-to-end methodologies based on DL techniques have been proposed to manage the increasing volume of data, freeing up human labor in feature engineering [
32]. This is greatly appreciated, particularly in complex systems where certain features may not be known for a particular dataset [
75].
Neural networks are a class of DL and ML methods that use ANNs with multiple hidden layers. ANNs, convolutional neural networks (CNN), and recurrent neural networks (RNNs) are just a few examples of the various implementations of neural networks that exist, each with some minor structural differences. In certain fields, such as autonomous driving and unmanned aerial vehicles, novel neural network approaches are preferred over ML because of their feature engineering and decision boundaries [
76]. When classifying PDs, neural networks are often used. In PD analysis, a three-layer fully connected neural network is frequently employed. The output of this type of network is one of the potential PD source classes, obtained from feature vectors extracted from the PD data. Similar techniques are used in other classification methods that are not neural network-based to determine an output class by utilizing feature vectors as inputs. Three-layer neural networks, however, are significantly less effective than other classifiers such as random forests or support vector machines. To train them effectively, they need a lot of data, and the process takes time [
77].
5.1. Artificial Neural Network-Based Classifiers
An artificial neural network (ANN) is a supervised learning network used for regression analysis and classification. It can be trained in a forward–backward manner. Binary classification and multi-class classification are two categories into which the classification problem can be divided. One output neuron is used in binary classification, while the output layer in multi-class classification is determined by the number of classes [
78]. An ANN can be very appealing for fault diagnosis and detection both offline and online. It may additionally reduce the need for experts to interpret faults, which reduces costs and requires less visual implementation work. All potential fault data can be used to train the ANN offline. The created/trained ANN can identify the fault in a matter of seconds after receiving the fault data. Through training and testing with known faults, the ANN can also track degradation levels and indicate the urgency of fault correction. However, there are certain restrictions with ANNs. These include overtraining and an inadequate number of real-world examples of PD faults, as well as the possibility of one error causing another in certain situations. Several simultaneous errors as well as issues related to various types of noise sources might also slow down the identification process [
7].
Neural networks provide the advantage of being able to learn from examples when compared to alternative classifier types [
79]. Studies on PD faults indicate that an ANN is appropriate for PD classification since it is insensitive to slight changes in the input data. However, accurate data must be supplied to the network in order to achieve the best ANN performance in PD recognition. ANNs are among the most popular methods for PD classification. Several well-known ANNs include radial basis function networks, ensemble neural networks, and multilayer perceptron (MLP) neural networks. When there are enough features to represent the data, simpler ANNs can successfully recognize PD patterns. However, the relationship between the samples becomes nonlinear when the number of features is limited; consequently, more-complex architectures with complex activation functions and a greater number of features are needed for ANNs to achieve a satisfactory classification accuracy. Overfitting and gradient vanishing can occur from this complexity, which may further extend the training period [
44]. ANNs can be trained with different PD patterns because of their faster generalization capability and capacity to estimate the nonlinear relationship between the input data and desired outputs. These are the benefits of using ANNs for PD pattern recognition and classification [
80].
In ANNs, feed-forward backpropagation (FFBP) is the most-often-utilized learning mode. The FFBP is trained in a forward–backward process that consists of three layers: the input layer, hidden layer, and output layer. It is classified as supervised learning [
72]. In [
81], the ANN-based classification method worked effectively for classifying signals from various PD sources in terms of efficiency and accuracy. It has been demonstrated that the FFBP neural technique was accurate in classifying PD signals produced by XLPE power cables. An MLP neural network based on the backpropagation algorithm was used in [
79]. Three layers comprised the MLP structure used in this work: an input layer, a hidden layer, and an output layer. Three neurons, each representing one of the three categories of PD patterns (internal, corona, and surface), comprised the output layer. The neural network was trained using PD fingerprints. The features set included 20 statistical features such as skewness, kurtosis, mean, number of peaks, cross-correlation, and so on. The DWT was employed to denoise the PD signals before the classification process. High recognition rates were obtained with the algorithm, according to experimental results.
Raymond et al. [
72] used 15 neurons in the hidden layer and a scaled conjugate gradient backpropagation training function to study a multilayer feed-forward artificial neural network in a noisy environment. The classifiers were trained using PCA, statistical, and fractal features in order to compare the training speed and accuracy as the feature size changed. Their findings demonstrated that the training speed of the ANN, which stayed constant as the size increased, had no effect on the increase in feature size. Nonetheless, for better classification outcomes in a high-noise-level environment, the PCA feature with the ANN was advised.
5.2. Support Vector Machine-Based Classifiers
The supervised ML algorithm called a support vector machine (SVM) can distinguish between two classes of data. This algorithm creates a decision boundary by dividing these two distinct classes of data with a hyperplane. The distance between the hyperplane and the closest data point for each class is referred to as the margin, and the SVM uses this distance to determine the best hyperplane between the two classes. The term “support vectors” refers to the data points that are closest to the hyperplane and on the margin. An approach known as a soft-margin SVM is used when the data points are not linearly separable. This allows for the misclassification of certain observations that fall into the incorrect margin. A kernel trick can be applied in addition to the soft-margin SVM to accurately classify nonlinearly separable data points without overfitting. Using this kernel trick, the best hyperplane is defined in this new space, making classification simpler [
82]. Since real-world measurements are used to build classifiers, noise is likely present in the data. Consequently, there are many advantages to using ML algorithms that incorporate a regularization process. The regularization mechanism incorporated into the SVM’s training algorithm helps to prevent overfitting and maximize generalization potential. The regularization parameter C in the SVM is known as a hyperparameter. The regularization process is managed by managing the trade-off between maximizing margins and reducing classification errors on the training data [
58].
An SVM is an automatic recognizer that classifies each input dataset according to PD pattern. Unlike NNs, SVMs do not require the preselection of layers or the quantity of neurons. The number of support vectors is automatically optimized in SVMs, which offers a number of advantages over NNs [
83]. A growing number of researchers have shown interest in using SVMs for PD classification. When compared to other classifiers (including neural networks), the results of PD classification using SVMs have generally produced better classification results [
84,
85,
86,
87]. In a noisy environment and across five distinct cable joint defects, Raymond et al. [
72] examined the performance of an SVM using three features: statistical, fractal, and PCA. Their investigations showed that the SVM performed better in noise-free conditions compared to noisy conditions. In [
88], under noisy PD measurement conditions, AI-based classifiers were used successfully to classify XLPE cable joint defects. A growing average charge amplitude was used to test PD classifiers against noise. The SVM was found to outperform the ANN in a noise-free environment. Additionally, it was found that under noisy conditions, the ANN was more suitable to adapt to noise with higher average charge magnitude, whereas the SVM was better at performing with a higher pulse count.
5.3. Deep Learning-Based Classifiers
Deep learning (DL), a subset of machine learning (ML), is also drawing more attention from academia and industry for intelligent PD diagnostics. DL models can extract hierarchical features from the input data and produce more accurate and dependable results when they have deeper structures [
32]. DL, like traditional ML, has three distinct paradigms: supervised, unsupervised, and reinforcement learning. A labeled dataset is necessary for the supervised setting. The output format can be discrete/categorical (used for classification) or continuous (used in regression problems). In unsupervised systems, unlabeled data are provided, and the goal is to either learn representations that can be utilized in supervised or unsupervised settings later on, or cluster the data based on their inherent attributes [
89]. The connection between AI, ML, and DL is shown in
Figure 6.
Historically, the user’s domain knowledge and judgment of which features are relevant for a given problem have been used to pre-process the input data for any ML algorithm. The use of deep artificial neural networks, which can take raw data as their input, made automatic feature extraction feasible by 2006. In order to diagnose PD, DL was first used in 2015 [
91]. The DL techniques that are frequently used are deep belief networks (DBNs), recurrent neural networks (RNNs), convolutional neural networks (CNNs), and stacked denoising auto-encoders (SDAEs). CNN-based DL algorithms have been successfully applied in a variety of fields, including speech and image recognition, and are expected to become increasingly important in the power industry [
92].
5.3.1. Convolutional Neural Networks
The convolutional neural network (CNN) represents a cutting-edge supervised DL algorithm designed for solving problems related to regression, object classification, and feature extraction. Due to the simultaneous performance of feature extraction and label classification tasks without the use of feature engineering tools, it is also referred to as a “black-box” model. A CNN uses the network’s layers to hierarchically identify the valuable features of the input datasets during the training phase [
93]. A CNN is made up of four major components: the convolutional layer, the activation function layer, the pooling layer, and the fully connected layer. The convolutional layer extracts features from the input data by using learnable linear filters, or kernels. In order to detect complex data with nonlinear features, the activation function layer adds nonlinearity to the input-to-output mapping. In order to cover a wider range of receptive fields while maintaining a constant filter kernel size, the pooling layer subsamples output feature maps. The fully connected layer, which connects each neuron in one layer to every other layer’s neuron, provides positional or shift invariance. Fully connected layers are added to the architecture to help with classification issues [
89,
92,
94]. CNN hyperparameters must be modified to improve the algorithm’s classification accuracy, and these are divided into two categories: the CNN architecture is associated with the first group, while the training option is associated with the second. The hyperparameters defining a CNN structure include the number of network layers and filters, the size of the kernel matrix, the types of activation functions, the pooling technique, etc. [
93].
The convolutional layer is made up of a bank of learnable linear 1D, 2D, or 3D filters (kernels). Typically, 1D and 2D CNNs are utilized in high-voltage applications. For instance, a 1D-CNN is utilized with time-series waveforms, while a 2D-CNN is employed in issues involving spectrograms or PRPD patterns. A 2D CNN has also been used by some researchers to analyze time-series waveforms; instead of using 1D data as the input, they used an image of the signal [
89]. A 1D CNN model with 33 distinct human-made feature inputs was utilized for a classification study of PD sources in a power cable in [
95]. A performance comparison was conducted and it was found that the CNN performed better (with accuracy 99.82%) than an RNN and deep neural network (DNN) for classifying PD signals based on ultrasonic sensors. Che et al. classified three PD sources in XLPE cables (internal, corona, and surface), in addition to noise, using a 2D CNN in [
94]. In [
92], a CNN-based deep learning approach for cable PD pattern recognition was introduced and assessed using 3500 datasets. Five different kinds of PD faults were used in the laboratory to generate the data. Two conventional ML techniques, SVM and BPNN, were compared with a CNN. The outcomes demonstrated that CNN-based PD pattern recognition performed better than that of the SVM and BPNN, particularly when it came to distinguishing between PD types with highly similar patterns.
5.3.2. Recurrent Neural Networks
Deep learning architectures called recurrent neural networks (RNNs) are used to process sequential data. Under the influence of all past inputs, they sequentially process data from each time point. Data from various time points are used to update a common set of weights that are shared by RNN cells. Nevertheless, RNNs suffer from vanishing gradients due to a long-term dependency issue. In order to solve this problem, Long Short-Term Memory (LSTM) architecture computes extra states [
89]. RNN-based feature selection techniques are likely to choose effective features from the original feature sets. Nevertheless, another disadvantage of RNNs is that they require large datasets for training due to the nature of black-box models, which makes them difficult to interpret [
96].
RNNs are a type of DL architecture that was first used by the authors of [
97] to classify PRPD patterns. To determine the ideal values for the number of layers and power cycles, trials were conducted. They achieved an accuracy of 96.62%, outperforming simple deep neural networks (93.01%) and traditional ML-based SVMs (88.63%). The authors in [
98] proposed a multilayer RNN model using LSTM cells to identify PD pulses from in-service cables. The model performed well in training and could generalize unseen data, indicating its success in identifying PD pulses of various voltage levels. The advantages and disadvantages of various classification techniques are shown in
Table 4.
5.4. Miscellaneous Classifiers
5.4.1. Fuzzy Logic-Based Classifiers
Fuzzy logic classification is based primarily on the idea that some parameters are difficult to quantify. Typically, these are shown as fuzzy values, sorted into large, small, and medium. Consequently, features are mapped, according to their respective domains, to the membership of another fuzzy set. Fuzzification of the input features, processing through an inference engine, and finally defuzzification of the output are the three primary phases of fuzzy logic. The output that has been defuzzified is used to identify the PD source. Each pattern can be assigned to multiple classes with corresponding degrees of membership using fuzzy logic, which allows for a nonexclusive method of classification. This is very helpful for cable fault monitoring, as it allows for the making of soft decisions based on the particular arrangement of the fuzzy classification result [
6].
5.4.2. Auto-Encoders
An auto-encoder (AE) works by training a neural network to learn a latent intrinsic representation of the original input. An auto-encoder is made up of an encoder–decoder architecture, in which the encoder converts the input data into a latent representation and the decoder converts the latent representation back into the original data. Together, the encoder and decoder learn how to minimize the reconstruction error between the network input and the decoder’s output [
89]. The performance of deep networks can be improved by artificial networks like AEs, which are unsupervised trained networks that can reduce the dimension of the input data [
100]. One advantage of AEs is that the classifier’s feature extraction stage can be pre-trained using unlabeled data. By identifying and eliminating the redundant input data and retaining only the most important elements of the data, the encoder extracts valuable features [
4].
A sparse auto-encoder (SAE) is capable of independently extracting meaningful features from input data. SAEs and other deep architectures have shown very good results in speech recognition, face recognition, and text classification [
101]. A method for identifying incipient faults in cables was suggested by the authors in [
102]. The incipient fault signals were simulated by these authors using PSCAD/EMTDC. In the architecture proposed by the authors, a deep belief network was positioned after the SAE. Their proposed model performed better than the SVM and K-nearest-neighbor (KNN) methods when the authors compared the classification accuracy of the suggested model (SAE and CNN) to that of an SVM and a CNN.
5.5. Summary
The classification of PD signals in MV cables may benefit from the use of all three methods (ANN, SVM, and DL), depending on the size of the dataset, the available computing power, and the required degree of accuracy. While ANN and DL techniques like CNNs may be more appropriate for larger datasets with complex features, SVMs may be more appropriate for smaller datasets with well-defined features. Finding the best approach requires experimenting with various techniques and architectures.
6. Feature Selection and Parameter Optimization Techniques for PD Classification
The classification of PD signals in MV cables can benefit from the application of AI and optimization approaches. This includes the ability to make decisions automatically, recognize patterns, optimize feature extraction, monitor in real time, and adjust to changing circumstances. Nevertheless, there are certain drawbacks, such as the requirement of professional knowledge, interpretability, overfitting, processing resources, and data dependency. Knowledge of electrical engineering and machine learning is needed for the integration of AI-based systems.
In non-stationary operations, CM of an asset relies heavily on classification accuracy, and overlapping feature vectors can degrade performance. To avoid misclassification, redundant features should be discarded in favor of the most important features [
103]. For classifiers, choosing relevant features is crucial for a number of reasons, including their generalization performance, computational efficiency, and the interpretability of features. Looking at every feature that is available can lead to overfitting and inaccurate predictions, but this is not feasible because many features are inter-correlated. Noise, redundant features, and irrelevant features make the selection process even more difficult. As a result, features are typically chosen using techniques from pattern recognition or heuristic optimization, or a combination of these techniques [
49]. Removing irrelevant features is simple with a relevant measure, which can be measured using information theory or statistical tests; irrelevant features are weakly correlated with target classes or distributions, not significantly different [
104].
Classification problems frequently assume that all input features are relevant; however, when dealing with large datasets, there may be no prior knowledge of the relationship between a feature and the target label. For this problem, filter and wrapper methods must be used to assess the relevance of a subset of features. Filter methods (open-loop techniques) use statistical functions such as mutual information, whereas wrapper methods (closed-loop techniques) use classification errors to determine the significance of a subset of features. Although open-loop techniques do not rely on the classification system, there might be a poor relationship between task importance and feature information. Direct feature score estimation is possible with closed-loop techniques, but they are more computationally expensive and depend heavily on the particular classification problem [
105]. Feature selection is a search problem with two main components: the search method and the evaluation criteria. Search strategies can be divided into four categories: weight-based searches, random searches, heuristic searches, and optimal searches. Evaluation criteria, which include distance-based, entropy-based, statistical, correlation-based, heuristic, accuracy-based, and relevance-based measures, quantify the “goodness” of features [
106,
107].
High-quality features that capture the characteristics of PD signals and have a strong discriminant power are necessary for an accurate and reliable diagnosis. The diagnosis of PD can be challenging due to stochastic processes and signal noise. Although a number of feature extraction techniques have been proposed in the literature, none of them have shown to be successful in all situations. The efficiency of features derived from different approaches varies greatly depending on the specific problem. For PD pattern recognition and PD-based condition monitoring of MV cables, the best possible feature selection is essential. Waveform, statistical, wavelet, frequency-domain, phase-resolved, and combination features are just a few of the many different kinds of PD features. The efficiency of recognition can be decreased and algorithm training limited by using all of these features as input parameters. One way to look into this relationship is to rank the features according to importance [
96]. Feature selection improves PD pattern recognition efficiency and can be used in visualization and interpretation for online CM systems or on-site testing experiments. Methods like Relief, genetic algorithms (GA), and random forests (RF) are used in data processing for feature selection, and their advantages and disadvantages are shown in
Table 5.
6.1. Relief-F
Relief is a pre-processing filter that removes irrelevant features by calculating feature weights using proxy statistics. The feature’s relevance to the target variable is indicated by its feature score, which runs from −1 to +1 [
115]. Nevertheless, it does not handle redundancy and is limited to two-class classification problems. In order to address the issues of missing data and multi-class problems, respectively, Relief-A and Relief-F were later proposed [
107,
116].
In [
111], a weighted fuzzy support vector machine based on the Relief-F feature was proposed as the basis for an XLPE cable health assessment algorithm. Each dimension feature’s significance was determined using the Relief-F algorithm. The XLPE cable’s weakly correlated feature quantity was removed in order to assess its overall health. For the purpose of classification, feature reduction and feature selection algorithms were compared in [
14]. It was found that when noise contamination was taken into account, the performance of the PCA-compressed input feature declined dramatically to unusable levels, but under noise-free conditions (0% noise overlap), it performed similarly to IndFeat and Relief-F. It was determined that feature selection (Relief-F) is a superior option over feature reduction techniques like PCA, as the latter is more likely to experience a decline in classification accuracy in the presence of noise contamination. In order to select a minimum set of features while maintaining the highest classification efficiency, Relief-F, stepwise fit, and fsrnca methods built in the MATLAB environment were chosen for all four defects (simulated) in [
112]. The MATLAB environment’s built-in functions (fsrnca, stepwise fit, and Relief-F) yielded satisfactory results.
6.2. Genetic Algorithm
A genetic algorithm (GA) is an optimization method that simulates the natural selection and evolution of organisms, involving selection, crossover, and mutation. It is an iterative process, ending inheritance after a specified number of generations. The algorithm involves six steps: encoding, initial population generation, fitness value evaluation, selection, crossover, and mutation [
63]. This feature selection method, the GA, is part of the wrapper approach [
117].
Researchers in a variety of domains, including MV cables, have employed this algorithm to enhance pattern recognition and boost the functionality of current systems. Rizzi et al. [
108] investigated an automatic method based on the GA’s ability to optimize a diagnostic system for recognizing and identifying PD pulse patterns in the terminations and joints of solid dielectric extruded power distribution cables. In order to reduce system’s complexity and improve diagnostic performance, this approach was used for PD source identification in cables and other electrical power equipment. It was demonstrated by the use of 300 measurement data points that GAs can attain 100% accuracy on these test sets [
44]. For XLPE cables, Duan et al. [
109] created a parameter-optimized SVM-based PD recognition method in which fractal features were taken out of the PRPD pattern and fed into the classifier. In order to optimize the SVM parameters, the GA was used in this investigation. When compared to the SVM without optimization, it dramatically increased the diagnosis accuracy by 4.7%.
6.3. Random Forests
An algorithm for classifying data based on classification trees is called Random Forest (RF). The method’s basic idea is to create a random forest by combining classification trees; in other words, classification trees are created and mapped through the randomization of variables and data. As long as the computation time is not greatly reduced, this approach can increase prediction accuracy. Furthermore, RFs can predict up to several thousand variables because they are robust against missing and imbalanced data and are not sensitive to multiple linear regressions [
113]. RF is a method that combines Breiman’s bagging sampling approach with random feature selection for ensemble learning. It is commonly used for classification and regression problems, constructing decision trees (DTs) using database replacement sampling. An RF offers good accuracy and faster performance than other methods, making it ideal for PD signal detection. While most other methods only provide the feature selection subsets, RF-based feature selection can provide feature ranking results for all the features. This sets it apart from other feature selection techniques [
114].
Researchers in [
96] used data on artificial defects from a high-voltage laboratory to present RF-based optimal feature selection for PD pattern recognition in cables. Two subsets of the data were created: out-of-bag (OOB) subsets and bootstrap training subsets. The bootstrap training subset was used to build a decision tree classification model, and the OOB subset was used to assess the classifier’s accuracy. The outcomes demonstrated the effectiveness of the RF approach for interference signal and PD feature selection, which makes it suitable for power-component PD feature selection.
6.4. Miscellaneous Optimized Feature Extraction Techniques
6.4.1. Particle Swarm Optimization
Particle swarm optimization (PSO) and its variations have been frequently adopted as search engines in wrapper-based feature selection approaches because of their rapid convergence speed and high discriminatory ability to search [
118]. The PSO algorithm, known for its simplicity, implementation ease, minimal parameters, and high performance, is ideal for complex optimization problems, being utilized in pattern recognition and data classification [
119]. The authors of [
120] proposed a PSO algorithm-based feature selection method for XLPE cable status diagnosis, which outperformed traditional feature selection methods in terms of the feature number and generalization ability.
6.4.2. Least Absolute Shrinkage and Selection Operator
LASSO, or Least Absolute Shrinkage and Selection Operator, is an effective tool for selecting regularization functions. An ML algorithm parameters’ absolute values are penalized by the LASSO approach. Features that remain in the model after the shrinkage step and have a coefficient greater than zero are kept in the feature selection process, while features that have a coefficient of exactly zero are removed. The regularization frequency is changed via a tuning parameter, also known as a regularization parameter. The use of LASSO has some advantages. It works well to minimize variance because the coefficients of the deceptive features are penalized and removed. Consequently, it helps avoid the overfitting problem, leading to improved generalization capacity. Moreover, LASSO is highly helpful in enhancing interpretability by eliminating redundant features. However, there are certain drawbacks to the LASSO method. For example, it only chooses one feature from each set and ignores the others [
116].
For investigating which is the best for PD feature selection, the LASSO method was used in [
113] in comparison to the RF method. Two PD pattern recognition techniques, logistic regression (LR) and RF, were used to assess the top six PD features chosen by the LASSO method and RF method. The same PD samples were used for the pattern recognition. The top six PD features chosen by the RF method exhibited higher accuracy than those selected by the LASSO method when LR-based pattern recognition was used. The top six PD features chosen by the LASSO method demonstrated higher accuracy than those chosen by the RF method when applied to RF-based PD pattern recognition. One of the drawbacks of the RF approach is that it does not take feature correlation into account. The RF method will choose both features if there are two that are fully related to one another. However, comparing the accuracy of two similar features to that of one feature alone does not yield an apparent enhancement in pattern recognition.
6.5. Summary
Relief-F can be regarded as a good option for identifying significant features in PD signals, whereas genetic algorithms may be a good option if optimizing hyperparameters and possibly changing the structure of the classification model are the main concerns. Among the best options is the random forest method, if the goal is to employ a strong classification model without the need for precise feature selection or hyperparameter adjustments. Future studies may benefit from a combination of these techniques as well. Relief-F, for instance, can be used to select features, genetic algorithms can be used to optimize hyperparameters, and random forests can be utilized as a classification model. To find the most efficient approach, it is crucial to test and assess how these techniques perform on your unique PD dataset.
7. Conclusions
From the perspective of studying different types of PD sources, this paper provides an in-depth understanding of detection, feature extraction, and artificial intelligence-based techniques for PD classification that can help in carrying out efficient diagnostics of possible insulation defects. Each subsection evaluates the merits and drawbacks of diverse methods. This review encompasses electrical, electromagnetic, and acoustic techniques for PD detection, exploring various sensor types. Additionally, it delves into feature extraction methods such as wavelet-based, frequency-domain, and time-domain features. Artificial intelligence techniques like neural networks, support vector machines, and deep learning are extensively scrutinized for classification. This paper also discusses techniques for feature selection, such as the random forest method, genetic algorithms, and Relief-F. The discussion section outlines future research prospects in PD classification. The review that has been presented here leads to the following conclusions:
Electromagnetic sensors, particularly the HFCT, are preferable for PD measurements in MV cables, although the ongoing HFCT vs. Rogowski coil debate persists. Despite both sensors showing promising performance in lab environments, commercially, HFCT sensors are more widely utilized and preferred.
The CNN classifier-based DL approach demonstrates noteworthy outcomes in automatic feature extraction, but concerns persist regarding the speed of DWT and PRPD-based methods. While some studies focus on faster processing times, researchers often prioritize accuracy as a key performance indicator in evaluating the effectiveness of feature extraction techniques.
While the CNN classifier based on DL has been extensively used for PD source classification, it is acknowledged that DL methods, including CNNs, tend to be less interpretable due to their black-box nature. Traditional ML techniques, such as SVMs, represent improvements in interpretability. Establishing a comprehensive database is crucial for storing and comparing developed techniques.
Classification results are susceptible to data quality issues (e.g., small, inconsistent, unlabeled, or imbalanced datasets) and model complexity. Overcoming these challenges requires the development of a robust system capable of handling diverse dataset difficulties in feature extraction and classification methods.


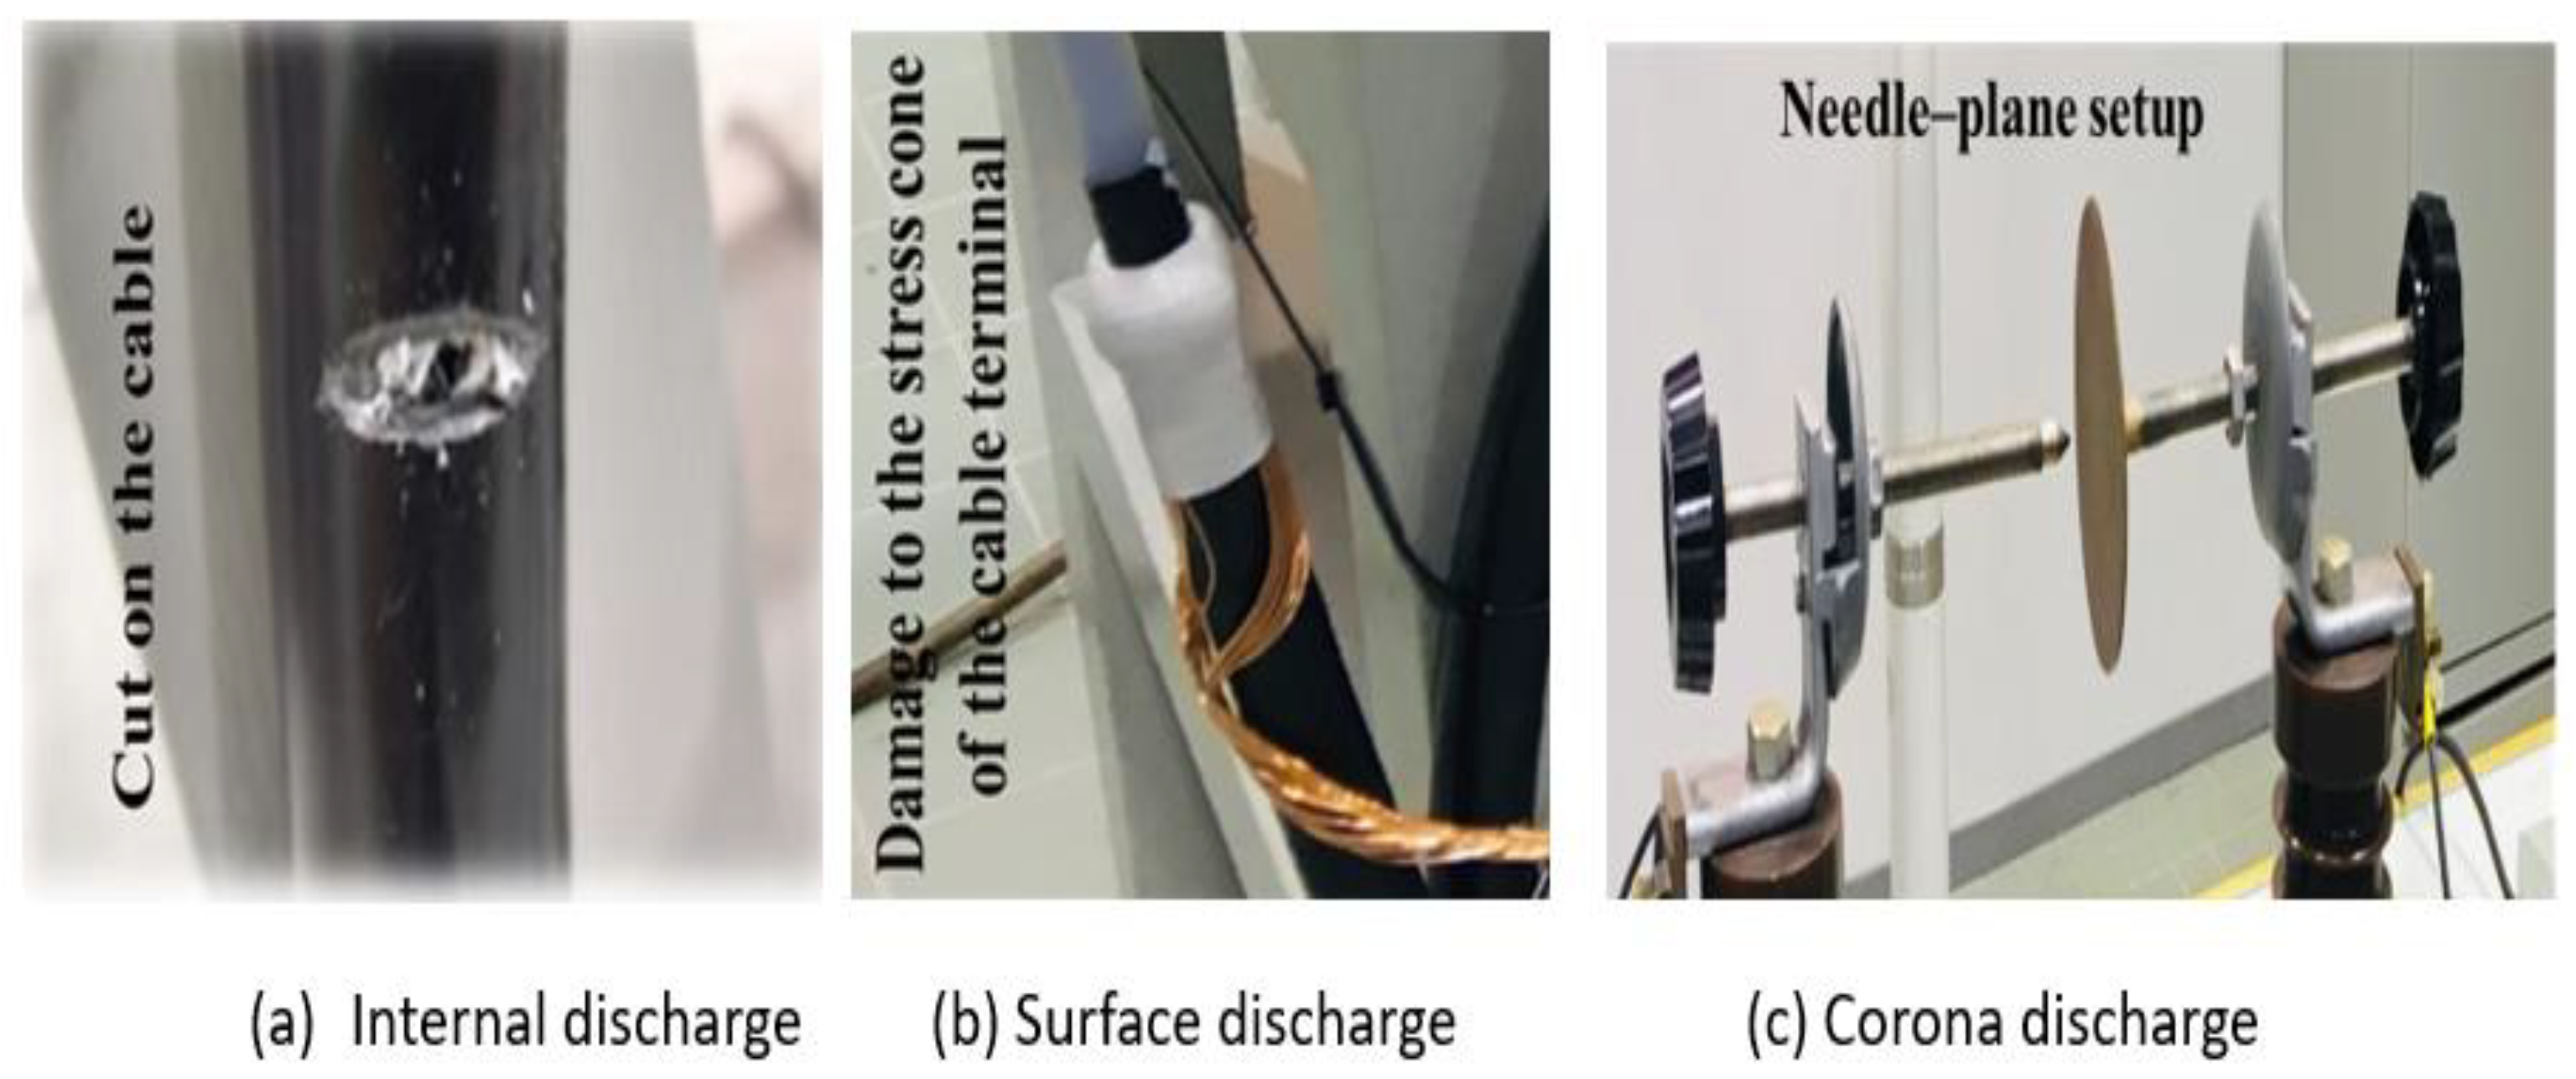


