Article

Insulation Resistance Characteristics of Dry DC Link Capacitors in the Presence of High Temperatures and Operating Voltages

1
Wuxi Power Filter Co., Ltd., Wuxi 214112, China
2
Department of Electrical Engineering, Tsinghua University, Beijing 100084, China
*
Author to whom correspondence should be addressed.
Energies 2024, 17(5), 1147; https://doi.org/10.3390/en17051147
Submission received: 18 January 2024 / Revised: 16 February 2024 / Accepted: 26 February 2024 / Published: 28 February 2024
(This article belongs to the Section F: Electrical Engineering)

Abstract

:
Insulation resistance is a vital factor in dry DC link capacitors (DCLCs), and crucially influences their voltage equalization and energy storage performance. However, at present, there is a lack of experimental observation on the insulation resistance characteristics of DCLCs in the presence of high temperatures and operating voltages. In the present study, the insulation resistance and conductivity of DCLCs are methodically analyzed. For this purpose, the corresponding test platform is appropriately fabricated, the insulation resistance measurement experiments are performed at various temperatures and operating voltages, and the factors affecting the insulation resistance and conductivity of the DCLC are carefully examined. The results reveal that the insulation resistance of the DCLC reduces exponentially with the growth in voltage and operating temperature. When the operating voltage becomes greater than 4480 V or the operating temperature reaches higher than 70 °C, the decline in insulation resistance slows down. The conductivity of metalized polypropylene film in the DCLC increases exponentially with increasing voltage and temperature. By increasing the operating voltage from 1960 V to 5600 V and the temperature from 20 °C to 90 °C, the DCLC’s insulation resistance exhibits a descending trend from 891.30 MΩ to 2.14 MΩ, while its conductivity grows from 3.49 × 10⁻¹⁶ S/m to 1.47 × 10⁻¹³ S/m. The results reveal that the key factors affecting the insulation resistance of the DCLC are the polypropylene film and the metal evaporated from the metal layer. This research is anticipated to provide a valuable reference for the further development of science and technology pertinent to the insulation resistance of DCLCs.

1. Introduction

Metalized polypropylene film capacitors (MPFCs) are commonly regarded as specific capacitors fabricated based on biaxially oriented polypropylene (BOPP) film with a vapor-deposited metal layer as the dielectric. MPFCs are advantageous for their high temperatures, high voltages, large ripple currents, and long lifetimes [1,2]. Dry DC link capacitors (DCLCs) employ metalized polypropylene films (MPFs) as the dielectric, which possess self-healing properties [3]. As one of the main converter devices, DCLCs perform voltage equalization, energy storage, and filtering [4]. Currently, DCLCs are extensively employed in smart grids, new energies, and rail transportation [5,6].
DCLCs have been implemented for voltage equalization and energy storage, in which they are exposed to DC field strengths exceeding 200 V/μm [7,8]. Such high field strengths are applied to DCLCs with high field-strength resistance, which exhibit a voltage drop phenomenon as a result of insulation resistance. Conductivity is one of the four insulation factors in engineering technology, and dielectric performance that can also be reflected by insulation resistance [9].
Until now, relatively few investigations have been devoted to the insulation resistance characteristics of DCLCs under high temperatures and voltages. Relevant research is mainly focused on the theory of BOPP conductivity [10], conductivity mechanisms [11,12], conductivity calculations [13], and methods to enhance the conductivity loss of polypropylene films [14,15,16,17]. The results obtained in a study conducted by Ieda et al. [18] indicate that the conductivity of BOPP remains constant at an operating field strength of no more than 10 V/μm, and that the conductivity rises with a growth in the operating field strength to no higher than 100 V/μm. Karanja and Nath [19] have revealed that the ionic conductivity of BOPP is dominant in the temperature range of 50 to 100 °C, and the bulk electronic conductivity also plays a crucial role at high temperatures. The results obtained by Li et al. [20] have indicated that the logarithm of BOPP conductivity exhibits approximate linearity with 1/T in the temperature range of 273 to 330 K. In another study, Li et al. [21] examined the leakage phenomenon in MPPFCs with a maximum operating field strength of 400 V/μm, and the obtained results revealed that the time constant (i.e., the so-called equivalent insulation resistance) was very sensitive to the electric field, exhibiting very little variation at electric fields lower than 10 V/μm. Michelazzi and Fabiani [22] have shown that the conductivity of BOPP films is in the range of 10−14–10−12 S/m when considering reference conditions of 105 °C and 250 V/μm.
These investigations have shown that with an increase in electric field strength, film leakage grows significantly and conductivity rises rapidly. Since MPFCs with a maximum operating field strength of 400 V/μm are utilized as energy storage devices in pulsed power systems, they possess less steady-state heat generation in the operating temperature range and their core temperature is low. On the other hand, DCLCs for rail transportation have an operating field strength of 240–250 V/μm and an ambient temperature of 70 °C. Due to the relatively large ripple current of DCLCs, their core temperature is also able to reach a maximum of 85 °C. This emphasizes the need for further investigations on the characteristics of DCLC insulation resistance at high temperatures.
The main purpose of this paper is to examine the insulation resistance characteristics of a dry DCLC in the presence of high temperatures and operating voltages. The insulation resistance and conductance of the DCLC dielectric are analyzed, and the leakage characteristics of the DCLC are examined by measuring the insulation resistance at various temperatures and operating voltages. The obtained results indicate that the DCLC’s insulation resistance lessens exponentially with increasing voltage and operating temperature. The test results indicate that the method adopted represents a feasible and effective approach in practical engineering and will be beneficial for analyzing and solving the insulation problem in dry DCLCs.

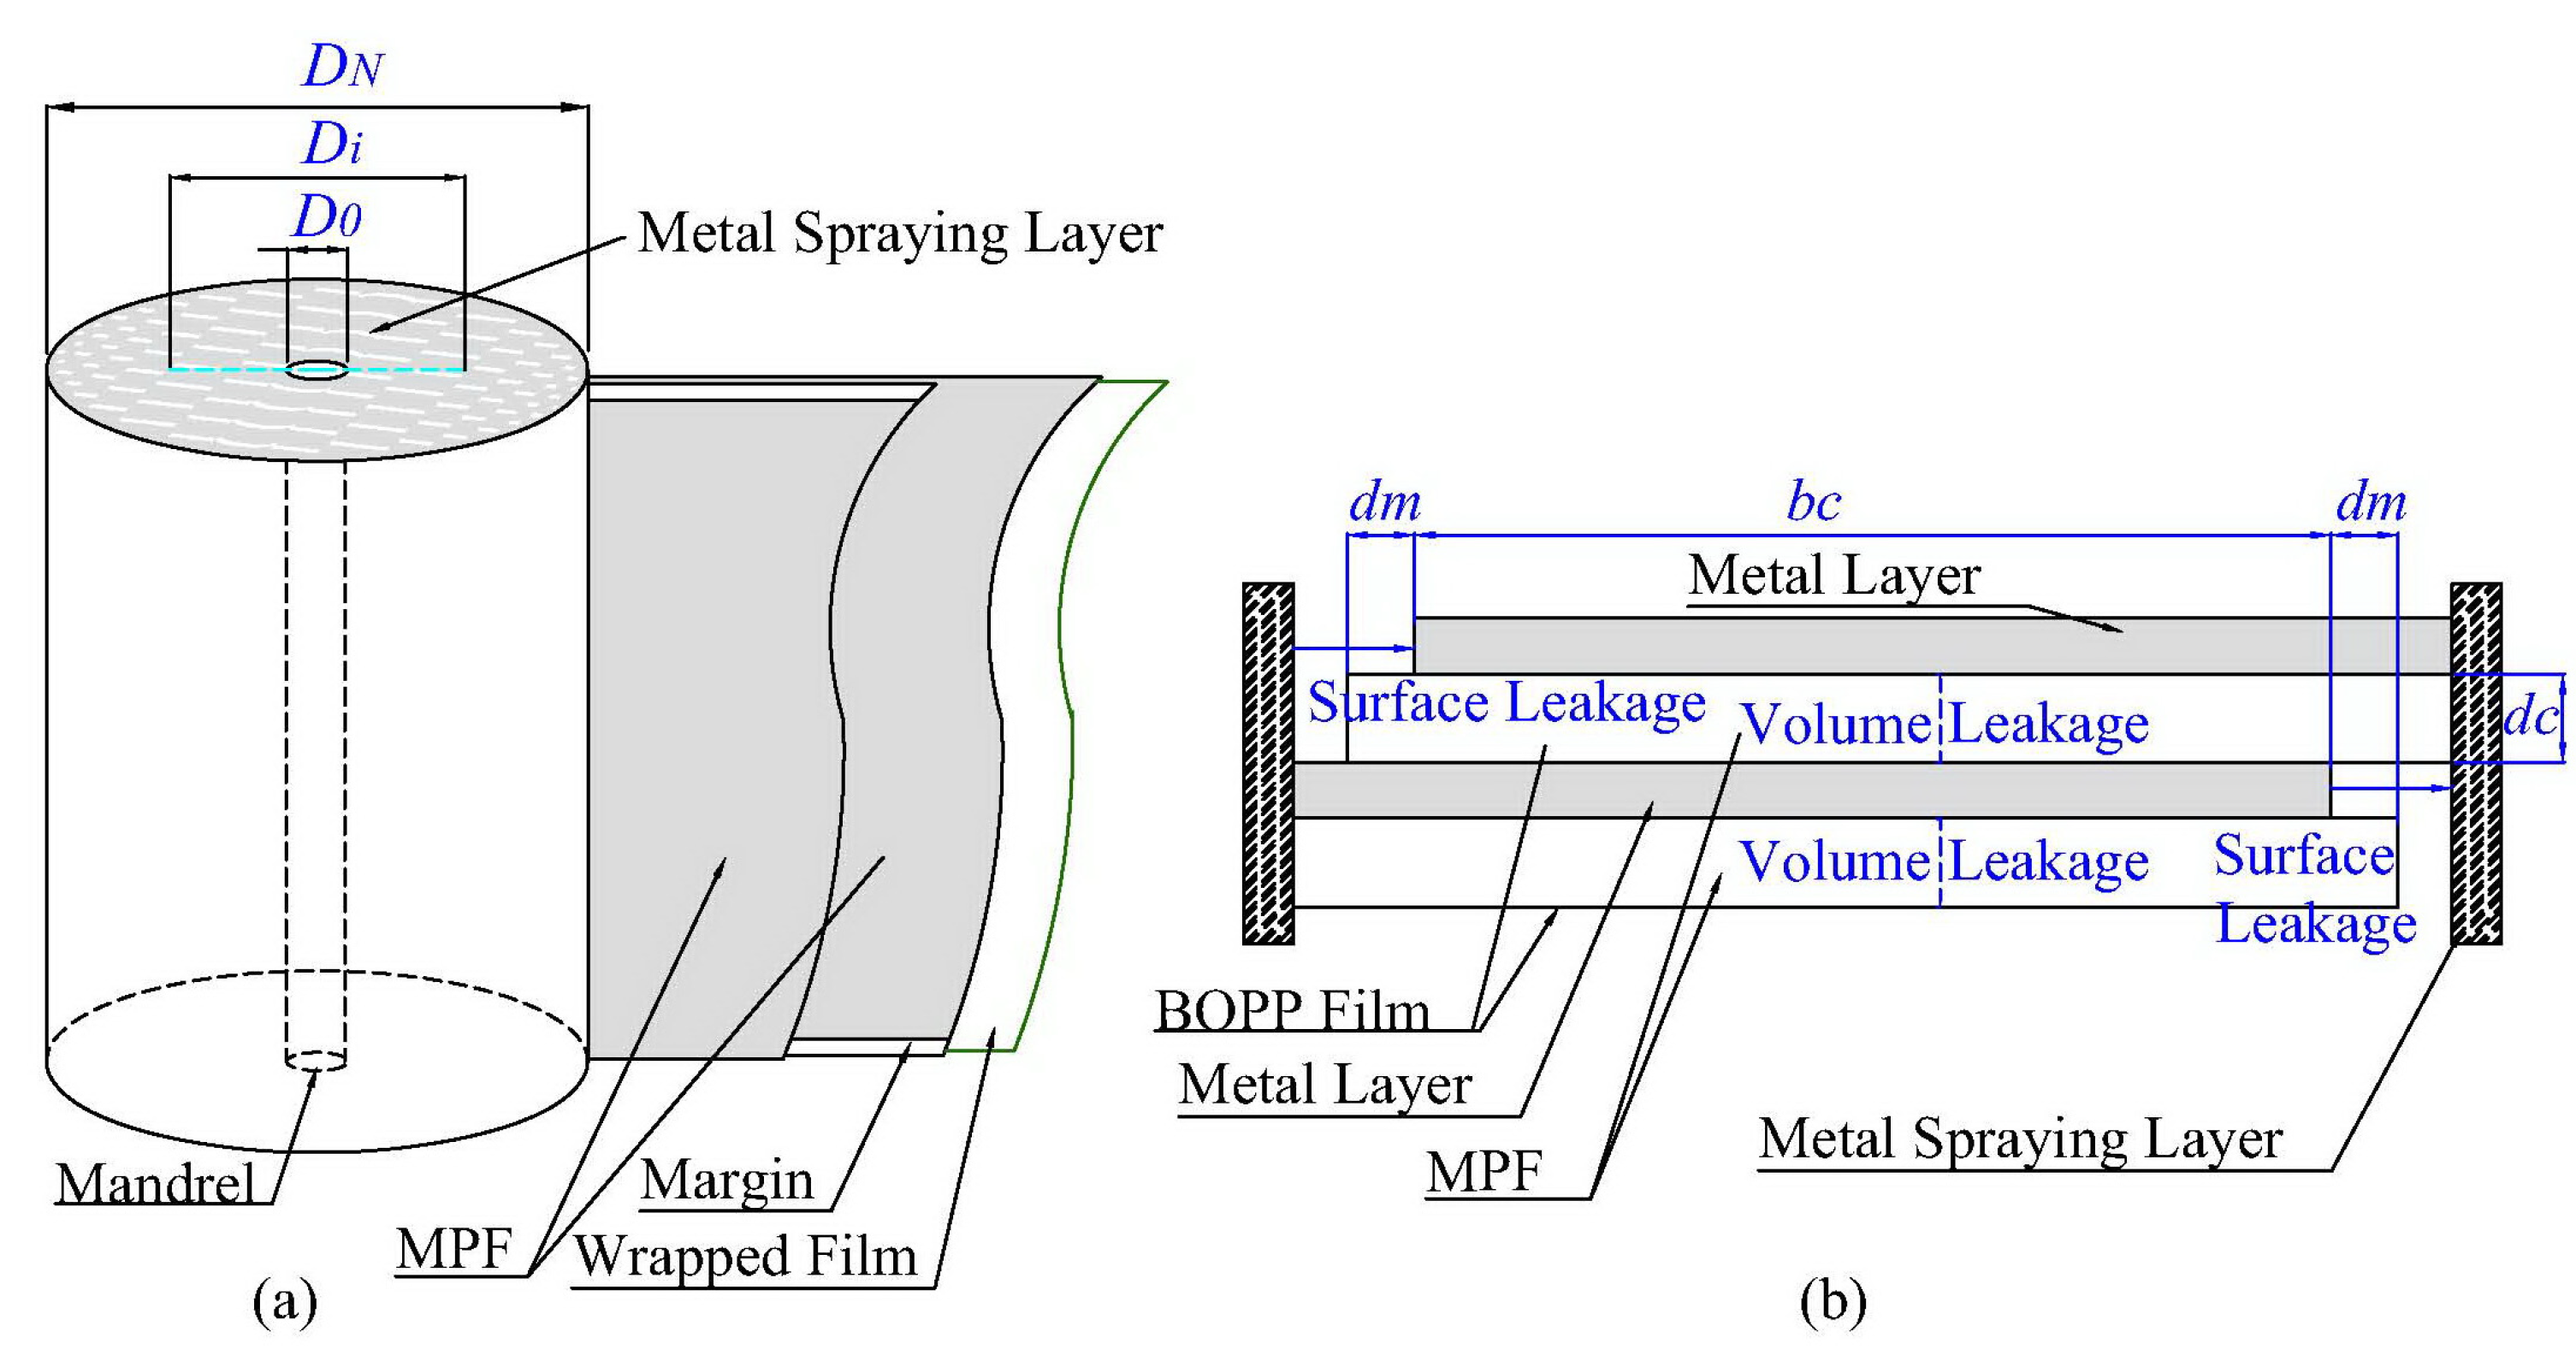
2. Insulation Resistance Characteristics of Metalized Polypropylene

2.1. Insulation Resistance

Insulation resistance (RP) affects the voltage equalization and energy storage performance of DCLCs. Usually, the RP value is calculated based on the leakage current value after voltage is applied to the DCLC for 1 min. When a DC voltage (U) is applied to the DCLC, the leakage current (Ig) is generated and the ratio of the two is called the DCLC insulation resistance (RP), as given by the following:
R P = U I g
Ions or electrons move through the medium to form a leakage current Ig, and the density, velocity, amount of charge, and the applied electric field of the charged particles affect the magnitude of Ig. Generally, Ig consists of two parts, as stated by Equation (2):
I g = I V + I S
where IV represents the current passing through the core of the DCLC, and IS denotes the current passing through the surface path of the outlet of the DCLC.
When only dielectric leakage is taken into account, the circuit of the DCLC can be rationally simplified to that schematically presented in Figure 1.
The time-dependent voltage across the DCLC can be expressed as follows [23]:
u ( t ) = U 0 e t / R P C
where C denotes the capacitance and U0 represents the initial voltage.
The insulation resistance expression of the DCLC(RP) can be stated by the following:
R P = 1 1 / R V + 1 / R S
where RV represents the volume resistance and RS denotes the surface resistance.
The surface insulation resistance value of dry and clean capacitors is large: up to TΩ [21]. The margin surface resistance of a DCLC is much larger than the volume resistance, and its effect on the volume resistance can be neglected [24]. Since surface resistance is significantly influenced by external conditions, it is not used to analyze the internal insulation of DCLCs in this study.
The DCLC designed in the present investigation is cylindrical; its structure is illustrated in Figure 2.
The capacitance of the DCLC (C) is calculated as follows:
C = 2 ε 0 ε r L b C d C
where ε0 represents the vacuum dielectric constant, εr denotes the relative dielectric constant of the MPF (its value is usually set to 2.2), bC is the effective width of the electrode (unit: mm), L is the effective length of the electrode (unit: mm), and dC is the thickness of the MPF (unit: mm).
The effective length L is calculated as follows:
L = i = 1 N π · D i = i = 1 N π · ( D 0 + i d C )
where N is the number of winding turns of the element, Di is the diameter of the i turn of the element (unit of mm), and D0 is the initial diameter of the mandrel (unit of mm).
The RV of the DCLC is calculated as follows:
R V = ρ V d C A = d C 2 σ V L b C
where ρV represents the volume resistivity of the MPF, A is the effective area of the electrode (unit:mm2), and σV denotes the volume conductivity of BOPP.
The RS of the DCLC is calculated as follows:
R S = ρ S d m 2 L = d m 2 σ S L
where ρS denotes the surface resistivity, dm is the margin width, and σS represents the surface conductivity.
By introducing Equations (7) and (8) to Equation (4), RP can be calculated in the following form:
R P = d m d C 2 L ( σ V b C d m + σ S d C )
Commonly, the self-discharge time constant (τ) is exploited to characterize the insulation performance [21]:
τ = R P C = ε 0 ε r b C d m σ V b C d m + σ S d C
in which the unit of τ is s.
If the surface insulation resistance is assumed to be infinite, the surface conductance can be reasonably considered to be zero. In such a special case, one can arrive at the following expression for τ:
τ = R P C = ε 0 ε r σ V
According to Equations (8)–(10), we can conclude the following:
(1)
The insulation resistance of the DCLC is related to the volume resistivity, the thickness and margin width of the MPF, the effective width and length of the electrode, and the surface conductivity.
(2)
The DCLC’s self-discharge time constant depends on the dielectric constant, the volume resistivity, the thickness and margin width of the MPF, and the surface conductivity.
(3)
Conductivity is the key parameter that affects the equivalent insulation resistance.

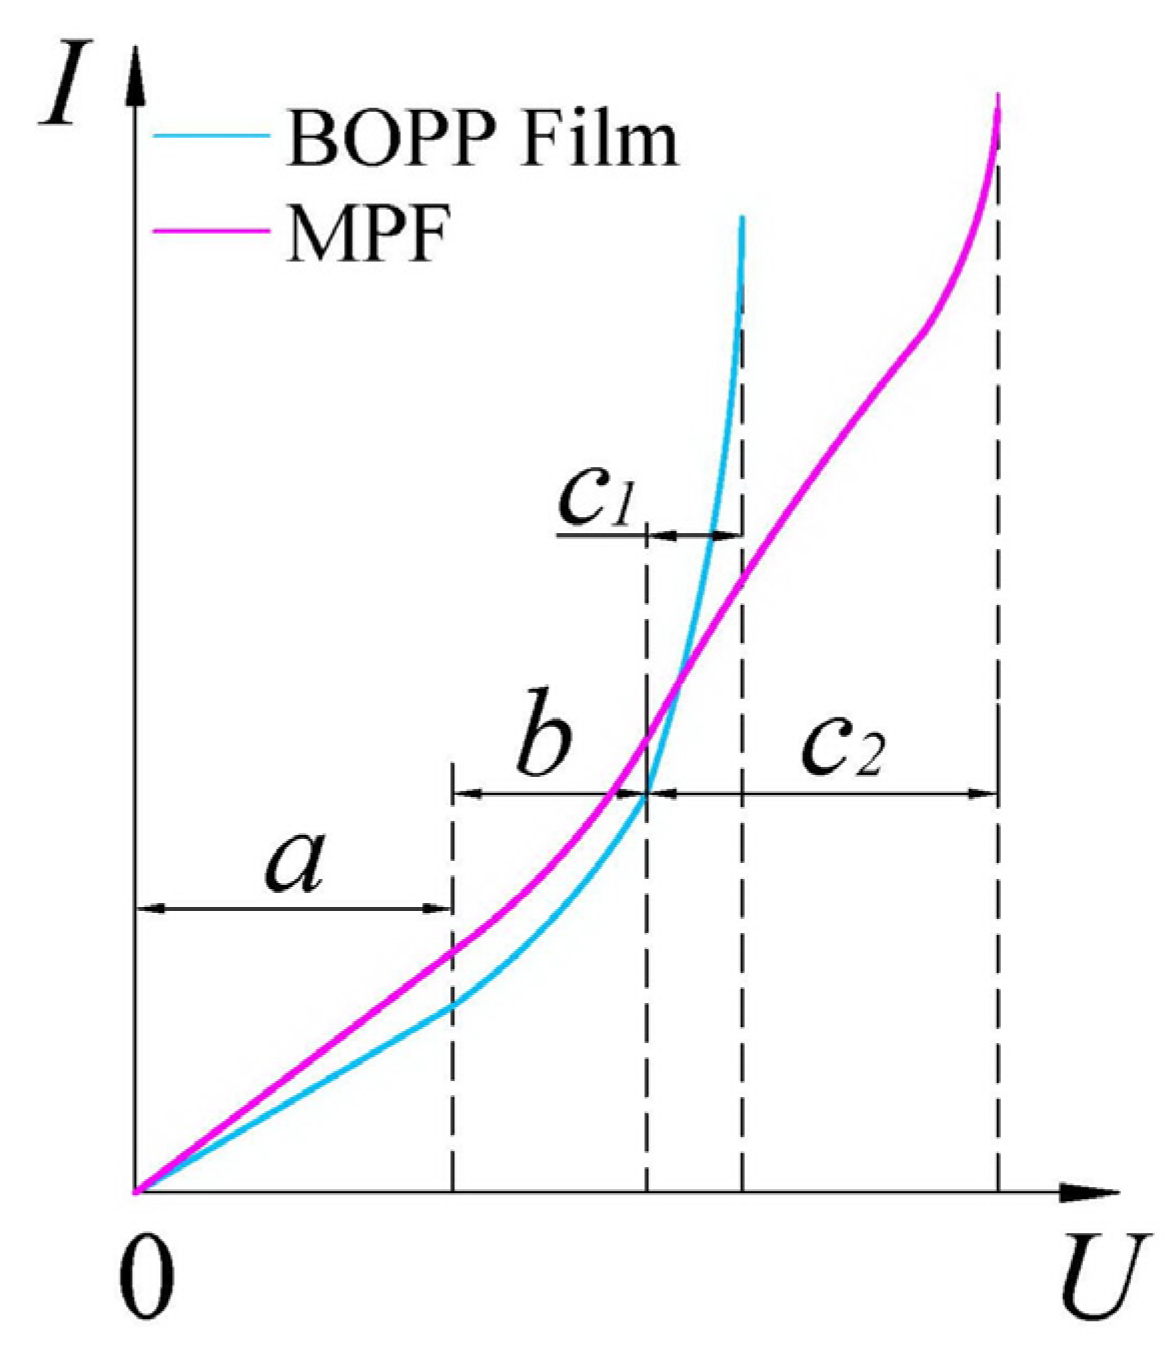
2.2. Dielectric Conductance

DCLCs exhibit self-healing characteristics. In the presence of high temperatures and high field strengths, the self-healing current is extinguished in a short time and the DCLC recovers its insulation performance. Therefore, the current–voltage MPF characteristics of DCLCs at high temperatures and field strengths are different from those of BOPP thin films.
Figure 3 illustrates the current–voltage characteristics of both MPF and BOPP films [25]. In branch a, RP is a constant value, and the relationship between U and I follows Ohm’s law. In the branch b, RP starts to decrease and I sharply rises with the increase in U, which is almost exponential. For BOPP films, after the increase in U, U reaches the critical voltage of the dielectric and I grows sharply, which leads to the breakdown of the BOPP films and the rapid decrease in RP, as illustrated through branch c1 in Figure 3. For MPFs, the decreasing trend of RP slows down. Due to its self-healing characteristics, when the MPF breaks down, the self-healing current is extinguished in a short time and the Insulation performance is restored as demonstrated in branch c2 in Figure 3. Branch a presents a low electric field conductance region, while branches b, c1, and c2 represent regions of high electric field conduction, which are clearly unsaturated.
The charged particles that form the current in BOPP films or MPFs are electrons escaping from the electrodes, ions generated in the medium, conduction electrons, holes, etc. If the charged particles are ions, it is called ionic conductance; if the charged particles are electrons and holes, it is called electronic conductance. The region of low electric field conductance is dominated by particle conductance, and the region of high electric field conductance is dominated by electron conductance [26]. In the low electric field conductance region, the current is proportional to the voltage if the ions have a certain concentration and mobility.
Since polymeric insulating materials such as BOPP are synthesized with catalysts, plasticizers, and fillers, impurities are bound to exist. Impurities cause an increase in conductive particles in BOPP and other insulating materials; when the presence of impurities in the electronic energy band is high, conductive particles are produced more easily, and as the voltage rises, the insulation resistance drops.
According to Equation (8), the key factor affecting the insulation resistance is the volumetric resistance of the MPF. The computational model of conductivity for dielectrics at high electric fields is constructed based on the Schottky and Poole–Frenkel effects. Herein, the MPF was utilized as a suitable dielectric for the DCLC, and the zinc–aluminum alloy designated to BOPP was evaporated as the electrode and pulled out through the sprayed metal layer. This electrode was in good contact with the BOPP film. The process of calculating the conductivity based on the Poole–Frenkel effect is provided in Ref. [18]. In this view, the conductivity can be stated by the following:
σ ( E , T ) = σ 0 × G ( E , T )
where σ0 represents the initial conductivity, and G(E,T) denotes the ability to characterize the density of free carriers.
G(E,T) at high electric fields can be expressed in the following form:
G ( E , T ) = 1 α 2 E ( α E 0.5 1 ) exp ( α E 0.5 γ ) 2 γ exp ( α 2 E 4 γ ) + exp γ
where α = βPF/(2kT), γ = δ/(2kT), and δ = 2.5kT.
In Equation (12), E represents the operating field strength, βPF denotes the coefficient of the Poole–Frenkel effect, k is the Boltzmann constant, and T signifies the absolute temperature. In reality, due to differences in Poole–Frenkel centers of charge, carriers, and polarization, βPF may not be calculated accurately, and thereby may vary over a range [21].
According to Equations (12) and (13), the main factors influencing the MPF conductivity are the operating field strength (E), temperature (T), and βPF.

3. Experimental Preparation

3.1. Sample and Preparation

The DCLC samples selected in this experiment include an element with a capacity of 62 ± 5% μF, as shown in Figure 4. The BOPP films were purchased from Toray Film Company (Ibarakiken, Japan). The MPFs were purchased from Toray Film Products (Zhongshan) Limited Company (Zhongshan/Guangdong, China). The DCLC samples were produced by Wuxi Power Filter Limited Company (Wuxi/Jiangsu, China). Each element was wrapped with two layers of MPF, with a diameter of 76 mm and an internal string structure. The thickness of the film was 5.8 μm, the average resistance of the metal coating was 30 Ω/□, the width of the film was 120 mm, and the margin width of the metalized film was 2.5 mm. The rated voltage of the DCLC sample was set as UNDC = 2800 V DC, and the rated operating field strength was taken as E0 = 241.38 V/μ m.
The DCLC was filled with polyurethane to prevent moisture from entering, and five test samples were used to conduct the experiments.
The main equipment used for manufacturing the DCLCs included an element-winding machine, a metal-spraying machine, and polyurethane vacuum casting equipment. The element-winding machine was produced by Changzhou Shengwei Electromechanical Company (Changzhou/Jiangsu, China), model BL-85D. The metal-spraying machine was produced by Guangzhou Guibo Automation Equipment Company (Guangzhou/Guangdong, China), model GB-PJJ04-2B. The vacuum casting equipment was produced by Suzhou Zexen Electronic Technology Company (Suzhou /Jiangsu, China), model PL-0315-RBT-ZX.

3.2. Measurement of the Insulation Resistance

An appropriate test platform, consisting of the necessary pieces of equipment and a measuring device, was set up to measure the insulation resistance. The measurement circuit of the test platform is illustrated in Figure 5. The main pieces of equipment are illustrated in Figure 6. In Figure 5 and Figure 6, C is the equivalent capacitance of the sample, RP is the insulation resistance of the sample, UDC is the DC power supply, S1 represents the charge switch, S2 is the discharge switch, R is the discharge resistance, and V signifies the high-impedance digital voltmeter. The DCLC was placed in a thermostat to guarantee the test temperature. An LCR meter was implemented to measure capacitance and the loss angle tangent (usually, the testing frequency is set to 100 Hz). The DC power supply is capable of supplying 0–10,000 V DC; the brand used was Sansion, model KZT-V-10kV. The DC measurement range of the high-impedance digital voltmeter (V) is 0–10,000 V (DC voltage measurement accuracy is ±1 0.5% F.S.), and its input impedance is 1000 MΩ; the brand used was Chuanghong, model 149-10A. The thermostat is capable of controlling the temperature from 20 °C to 150 °C (accuracy is ±1 °C); the brand used was TENDA, model TDRL-150LZE. The brand name of the LCR meter is TONGHUI, model TH2830.
In order to eliminate the effect of the DCLC surface leakage current on RP, a ground wire was utilized to bypass the surface leakage current [24,27].
The test approach refers to the measurement of insulation resistance test in JB/T 6168-2023: pulse capacitors and DC capacitors [28].
The test procedure was as follows: First, the test temperature in the thermostat was set. The DCLC sample was then placed into the thermostat for at least 12 h. The DCLC sample was charged to a specified test voltage value for 1 min, and then the power supply was cut off. The DCLC sample was left to self-discharge, the voltage was measured after a period of time, and then the insulation resistance RPC was calculated.
The calculation relation of insulation resistance (RPC) can be obtained from Equation (3) as follows [27,28]:
R P C = t C ln U t U 0
Considering the influence of input impedance (RV), the insulation resistance (RP) can be modified as follows:
R P = R P C R V R V R P C
The voltage change rate, ΔU (%), can be calculated based on the following relation:
Δ U = U 0 U t U 0 × 100 %
The initial test temperature was 20 °C, and then the test temperature was gradually raised at increments of 10 °C until it reached 90 °C.
The initial test voltage was set as 0.7 UNDC and then the test voltage was gradually increased. To this end, the voltage increment at each time was 0.1 UNDC until it reached 2.0 UNDC.

4. Experimental Results and Discussion

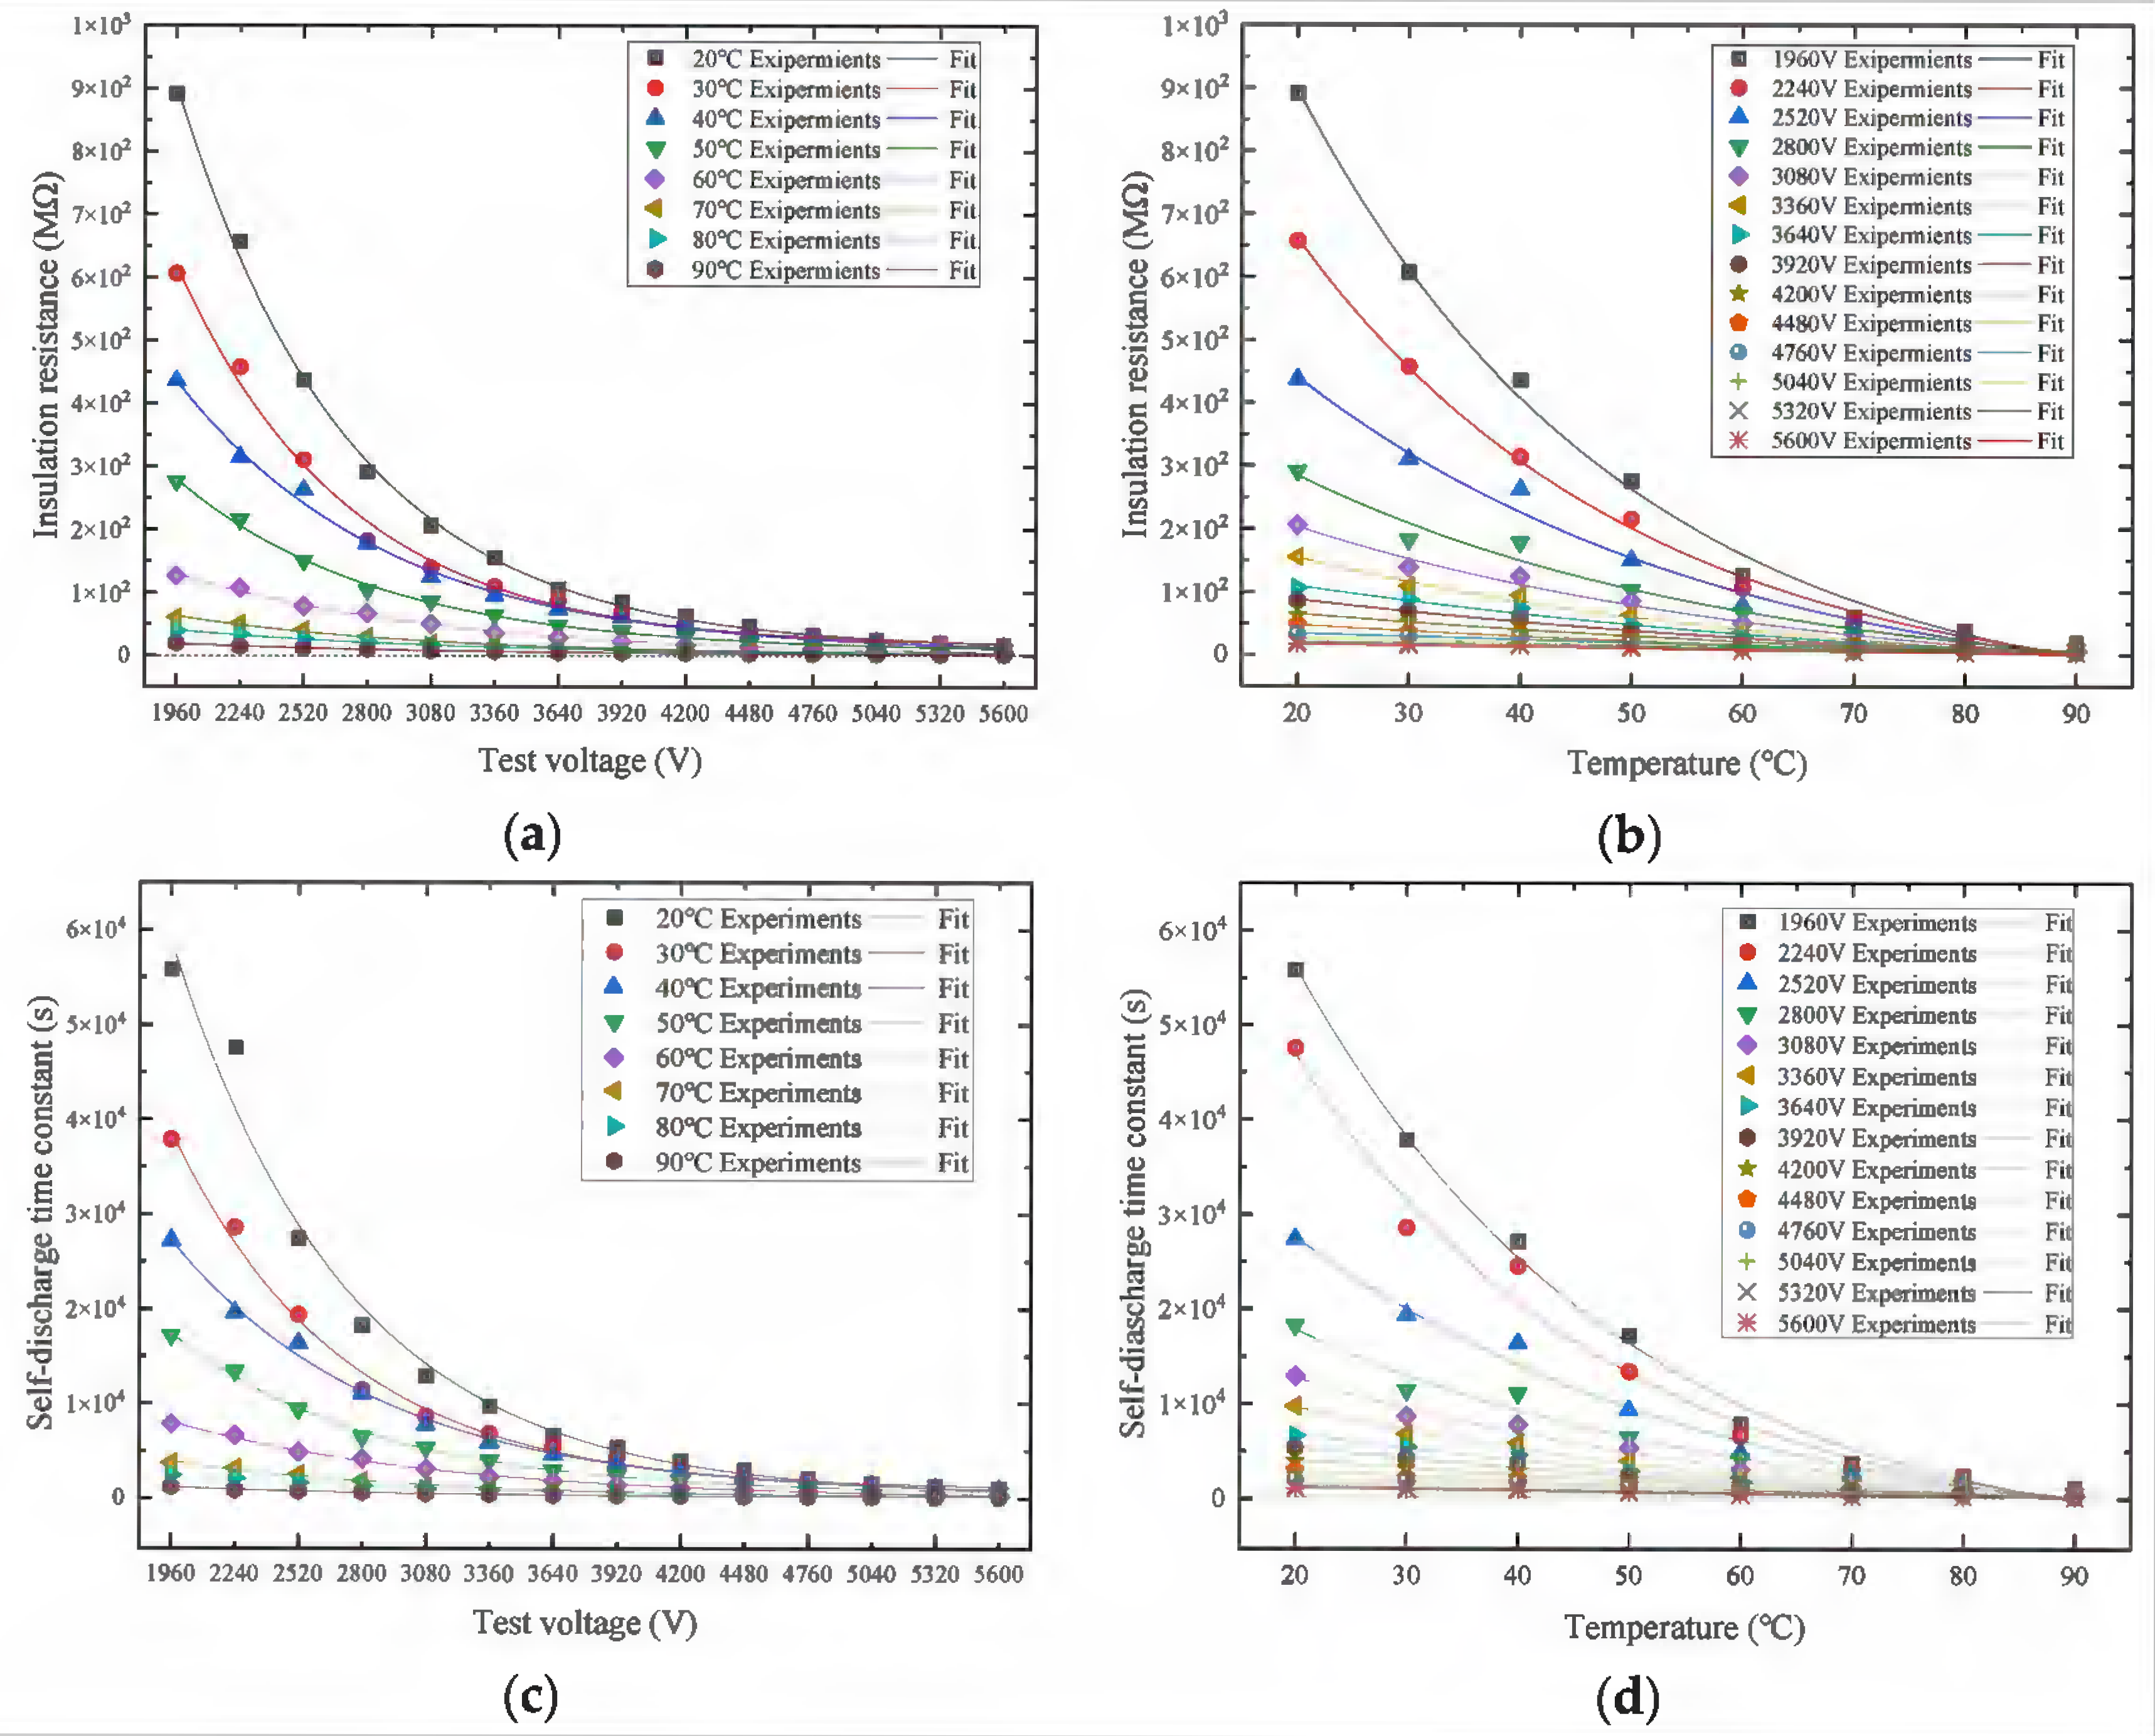
4.1. Insulation Resistance Measurement

Usually, DCLCs are capable of operating at maximum enclosure temperatures, typically selected from 45, 55, 70, or 85 °C [29]. DCLCs are used in different ambient temperatures with different ripple currents; thus, the actual hot-spot temperature of DCLCs varies greatly. This study focuses on DCLCs with a high operating field strength and a high temperature; these are used in rail transportation, and their hot-spot temperature is 85 °C. As a result, in this paper, the maximum test temperature of 90 °C was selected, and the minimum temperature of 20 °C was selected at room temperature. Therefore, the test temperature settings were 20, 30, 40, 50, 60, 70, 80, and 90 °C.
The maximum limit test voltage for the DCLC was set as 1.6 UNDC for 1 min. Considering the exploitation of the DCLC operating field strength if the ambient temperature increases or decreases, the test voltage was considered in the interval of 0.7 UNDC–2 UNDC.
At the same temperature, the DCLC’s self-discharge test voltages were measured in the presence of various voltages, and the insulation resistance and time constant of the DCLC’s self-discharge were calculated. The insulation resistance of the DCLC is scattered, so it was necessary to measure several sets of data. The relationship between the insulation resistance and the DCLC’s operating voltage at various temperatures is presented in Figure 7a. The relationship between the insulation resistance and the DCLC’s temperature at different operating voltages is shown in Figure 7b. The plots of the self-discharge time constant in terms of the DCLC’s operating voltage at various temperatures are presented in Figure 7c. The graphs of the self-discharge time constant as a function of temperature at different operating voltages are illustrated in Figure 7d. Further, the relationship between the voltage change rate and the DCLC’s operating voltage at different temperatures is demonstrated in Figure 7e. The relationships between the rate of voltage changes and temperature when subjected to various operating voltages are illustrated in Figure 7f.
The insulation resistance resulting from the activity of carriers obeys the Arrhenius term [12,15]. As can also be seen in Figure 3, the insulation resistance of the MPF is exponentially related in the b region. Consequently, the test values of insulation resistance were also curve-fitted according to the exponential form; see Figure 7a,b. Also, the test values of the self-discharge time constant were also curve-fitted according to the exponential form; see Figure 7c,d.
In Figure 7a, the fitted curves at different temperatures are in good agreement with the experimental data, with a goodness of fit (coefficient of determination) > 0.99. In Figure 7b, the fitted curves at different voltages are also in good agreement with the experimental data, with a goodness of fit (coefficient of determination) > 0.95; the goodness of fit becomes larger when the voltage decreases, and it is greater than 0.99 at 1960 V. The following are seen in Figure 7a,b:
(1) When the operating voltage is 1960 V (0.7E0 = 168.97 V/μm), the DCLC’s insulation resistance values at 20 °C, 70 °C, and 90 °C are 891.30, 60.41, and 19.4 MΩ, respectively, and the maximum value is 45.85 times the minimum value. When the operating voltage is 2800 V (E0 = 241.38 V/μm), the DCLC’s insulation resistance values at 20 °C, 70 °C, and 90 °C are 291.33 MΩ, 29.98 MΩ, and 9.93 MΩ, respectively, and the maximum value is 29.35 times the minimum value. When the operating voltage is 4480 V (1.6E0 = 386.21 V/μm), the DCLC’s insulation resistance values at temperatures of 20 °C, 70 °C, and 90 °C are 47.69 MΩ, 7.35 MΩ, and 3.54 MΩ, respectively; the maximum value is 13.46 times the minimum value, and the maximum value is 13.46 times the minimum value. When the operating voltage is 5600 V (2E0 = 482.76 V/μm), the DCLC’s insulation resistance values at temperatures of 20 °C, 70 °C, and 90 °C are 16.87 MΩ, 4.06 MΩ, and 2.14 MΩ, respectively, and the maximum value is 8.41 times the minimum value.
(2) At the same operating temperature, the insulation resistance of the DCLC decreases with the increase in the operating voltage, and the descending trend of the insulation resistance becomes slower when the operating voltage is higher than 4480 V (1.6E0 = 386.21 V/μm). This is due to the fact that when the operating voltage of the DCLC is at a high value, the conductivity is the result of dielectric leakage after eliminating defects during the self-healing process. Defects such as impurities in the dielectric film are capable of reducing the insulation resistance. During long periods of applied voltage, the DCLC’s insulation resistance slowly reduces due to the elimination of defects in the self-healing process.
(3) Under the same operating voltage, the insulation resistance of the DCLC decreases exponentially with the increase in temperature. When the temperature is higher than 70 °C, the decreasing trend of the insulation resistance becomes slow. The rise in temperature results in the growth of thermal activation. The leakage current is formed by the movement of ions or electrons in the medium, and the density, speed, charge, and externally applied electric field of charged particles affect the amount of leakage current. The temperature increases gradually, the number of ions involved in the leakage conduction gradually grows, and the leakage current gradually becomes larger; thus, the insulation resistance possesses a negative temperature coefficient.
In Figure 7c, the fitted curves at different temperatures are in good agreement with the experimental data, with a goodness of fit (coefficient of determination) > 0.98. In Figure 7d, the fitted curves at different voltages are also in good agreement with the experimental data, with a goodness of fit (coefficient of determination) > 0.95; the goodness of fit becomes larger when the voltage decreases, and it is greater than 0.99 at 1960 V. The following can be seen from Figure 7c,d:
(1) When the operating voltage is 1960 V, the DCLC’s self-discharge time constants at 20 °C, 70 °C, and 90 °C are 55,834 s, 3749 s, and 1200 s, respectively, and the maximum value is 46.53 times the minimum value. For an operating voltage equal to 2800 V, the DCLC’s self-discharge time constants for the above-mentioned temperatures are 18,251 s, 1860 s, and 613 s, respectively, and the maximum value is 29 times the minimum value. In the case of an operating voltage of 4480 V, the DCLC’s self-discharge time constants at the temperature levels mentioned above are 2988 s, 456 s, and 219 s, respectively, and the maximum value is 136 times the minimum value. For the case of an operating voltage equal to 5600 V, the DCLC’s self-discharge time constants at the above-mentioned temperatures are 1057 s, 252 s, and 132 s, respectively, and the maximum value is 7.99 times the minimum value.
(2) At the same operating temperature, the DCLC’s self-discharge time constant reduces with the growth in the operating voltage, and the decreasing trend of the self-discharge time constant becomes slower when the operating voltage becomes higher than 4480 V (1.6E0 = 386.21 V/μm).
(3) At the same operating voltage, the DCLC’s self-discharge time constant lessens exponentially with the increase in temperature, and the decreasing trend of the self-discharge time constant becomes slower when the temperature is higher than 70 °C.
The following can be seen from Figure 7e,f:
(1) In the case of an operating voltage equal to 1960 V, the rates of change in the DCLC voltage at temperatures of 20 °C, 70 °C, and 90 °C are −0.20%, −1.71%, and −5.0%, respectively. When the operating voltage is 2800 V, the voltage change rates of the DCLC at these temperatures are −0.43%, −3.31%, and −10.10%, respectively. For the case of an operating voltage of 4480 V, the DCLC’s voltage change rates at the above-mentioned temperatures are −2.15%, −12.41%, and −24.89%, respectively. In the case of an operating voltage of 5600 V, the DCLC’s voltage change rates at the temperatures mentioned above are −5.63%, −21.31%, and −37.49%, respectively.
(2) When the temperature is below 70 °C, the rate of change in the DCLC’s voltage decreases slowly as the operating voltage rises. As the temperature varies in the range of 70–90 °C, the rate of change in the DCLC’s voltage decreases sharply as the operating voltage rises.
(3) At the same operating voltage, the rate of change in the DCLC’s voltage rises with an increase in temperature.
At present, related studies are mainly focused on conductivity, conductive losses, and leakage current, while fewer investigations have been devoted to the quantification of insulation resistance. The results of Ref. [21] indicate that the equivalent insulation resistance (self-discharge time constant) was on the order of 105 s under 250 V/μm and on the order of 104 s under 450 V/μm at 20 °C. In the present investigation, the self-discharge time constant was on the order of 104 s under 241.38 V/μm at 20 °C. The self-discharge time constant for the above comparative study is 10 times higher than that obtained in this paper. However, the approaches used in these two studies are completely different; this paper is based on the industry-standard method of DC capacitors in the Chinese machinery industry [28], whereas the comparative test is based on measuring the amount of leakage current after the steady state to calculate insulation resistance. Therefore, the results differ by nearly 10 times.
The results of the investigation performed in Ref. [30] have revealed that the capacitor voltage change rate increased from 4% to 34% within 1 min when the temperature increased from 5 °C to 65 °C under 445 V/μm. Herein, the DCLC voltage change rate rose from 5.63% to 21.31% as the temperature increased from 20 °C to 70 °C under 482.76 V/μm. Although the temperature and working field strength of these two experiments are different, the results of both experiments show that the rate of change in capacitor voltage becomes larger with increasing temperature.
Although Equations (9) and (13) provide the theoretical formulas of insulation resistance and conductivity, respectively, the calculation of insulation resistance requires the resistance value. In fact, neither βPF nor conductivity can be calculated accurately [18,21]. Therefore, it is not possible to theoretically calculate the exact insulation resistance of the DCLC. The measured insulation resistance values of the DCLC, particularly the self-discharge time constant, reflect the effect of temperature and operating voltage on its performance.

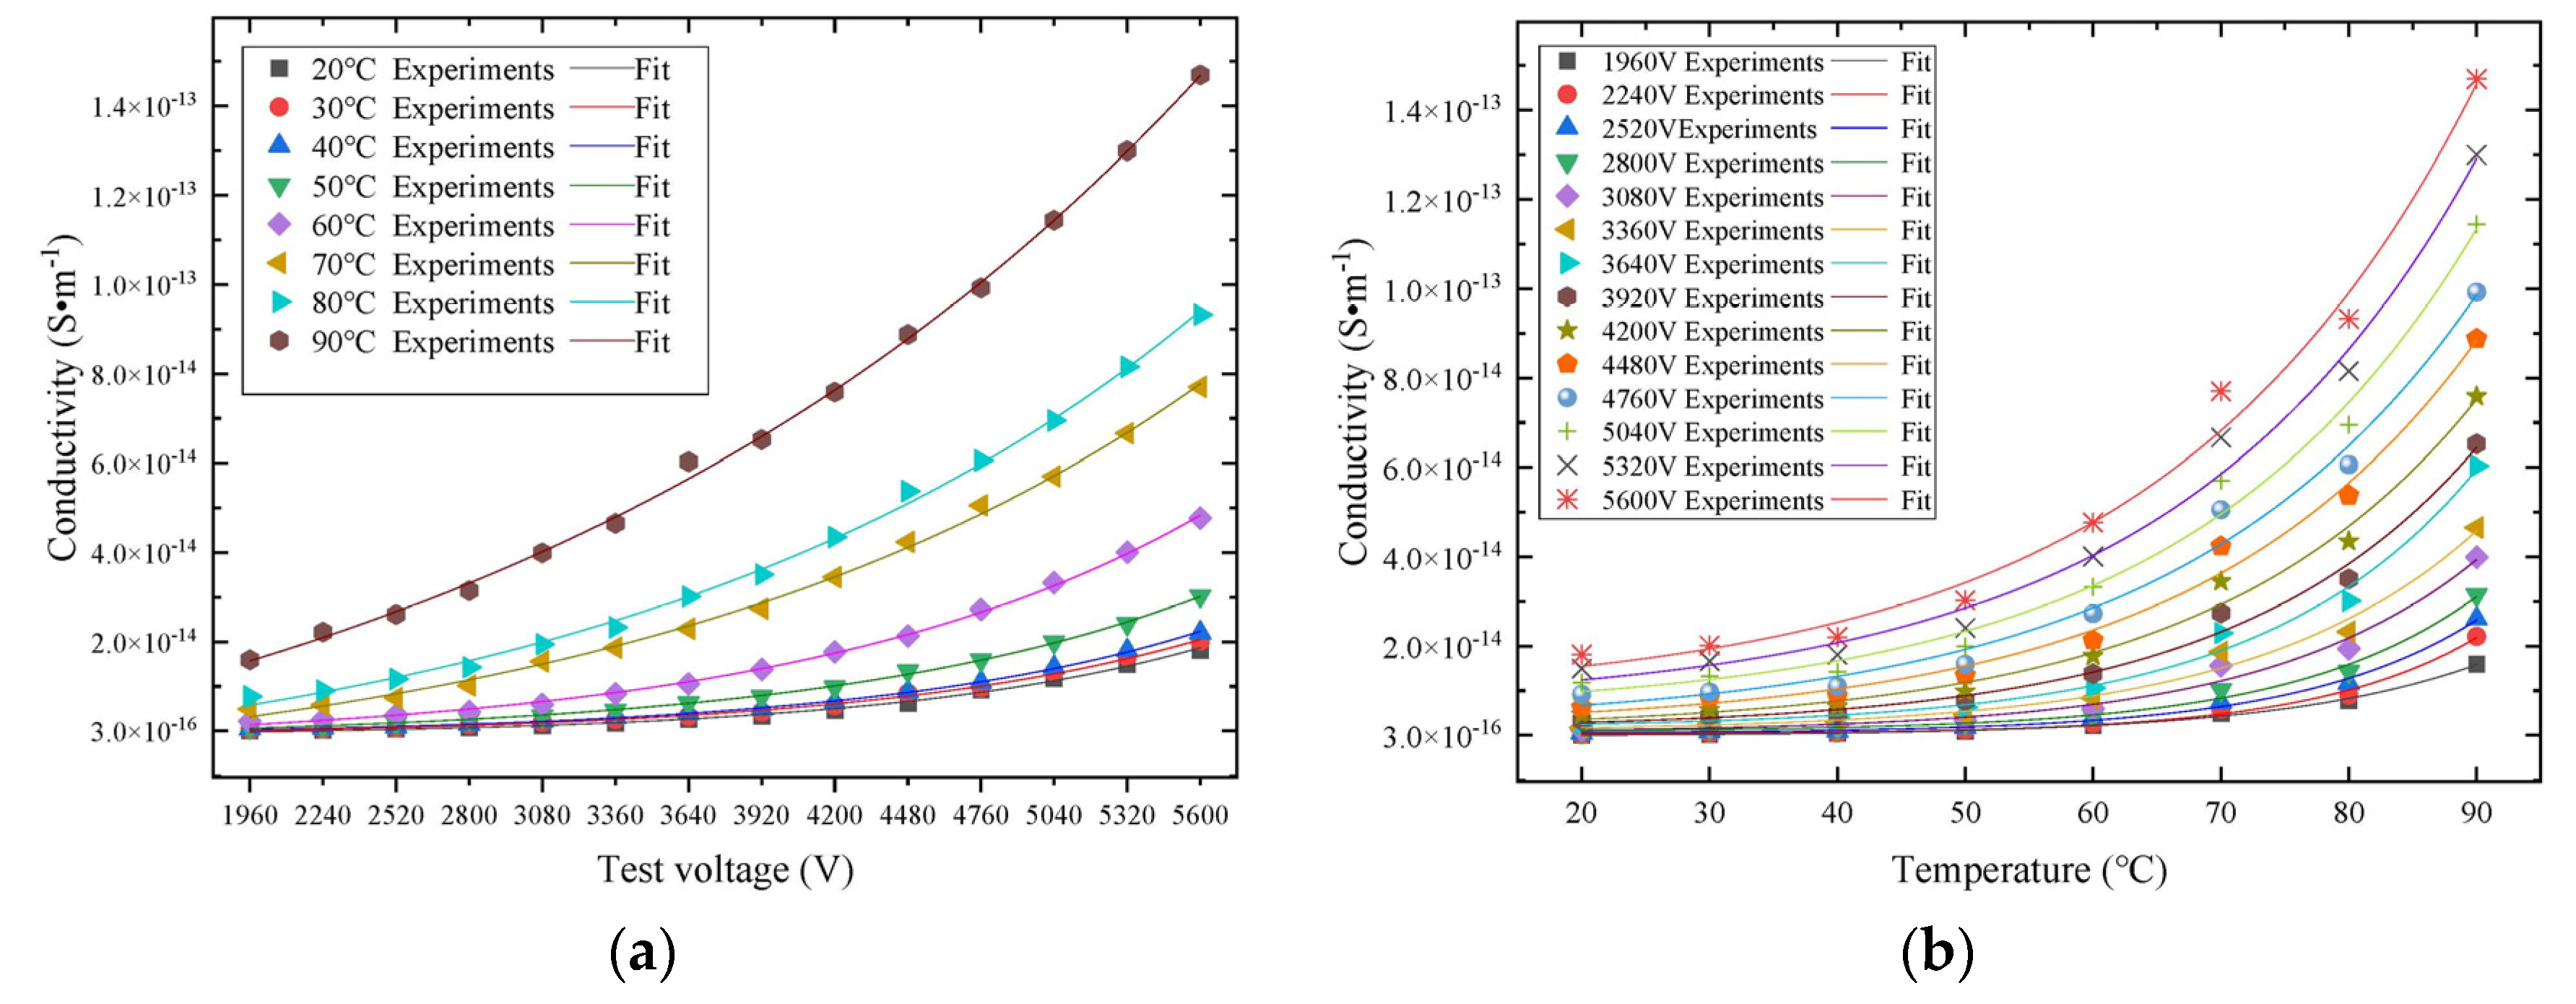
4.2. Conductivity Calculations

In the present investigation, the surface leakage current was bypassed by the ground wire, and the surface insulation resistance was assumed to be infinite; therefore, the surface conductivity can be rationally considered to be zero.
Although Equation (13) provides the theoretical formula of conductivity, in practice, βPF and conductivity cannot be accurately calculated based on Equation (13) [18,21]. Herein, the numerical calculation of conductivity was performed based on Equation (11).
The conductivity due to the carrier’s activity follows the Arrhenius term [12,15]. The conductivity can be stated by the following [26,31]:
σ V = A M e ϕ / k ( 273 + T M )
where AM represents the constant related to the MPF, ϕ represents the conductivity activation energy (the value is usually taken as 0.75~1.08 eV [11,18]), and TM denotes the temperature of the MPF. These parameters (AM and ϕ) may be closely related to the physical properties of the BOPP film and cannot be determined accurately so far [20].
The conductivity can also be stated by the following [26]:
σ V = σ 0 e α T M
where σ0 represents the conductivity to the MPF at 0 °C, α represents the temperature coefficient of the MPF (the value is usually negative), and TM denotes the temperature of the MPF.
According to Equation (11), the conductivity is evaluated in the presence of various operating field strengths and temperatures, and the electrical conductivity varies in the interval of 3.49 × 10⁻¹⁶–1.47 × 10⁻¹³ S/m. Additionally, fitting according to Equation (18) yields a fitted curve of conductance, as presented in Figure 8a,b.
The relationship between the conductivity and the operating voltage in the presence of different temperatures is illustrated in Figure 8a, while the relationship between the conductivity and the temperature at various operating voltages is demonstrated in Figure 8b.
In Figure 8a, the fitted curves at different temperatures are in good agreement with the experimental data, with a goodness of fit (coefficient of determination) >0.99. In Figure 8b, the fitted curves at different voltages are also in good agreement with the experimental data, with a goodness of fit (coefficient of determination) >0.98; the goodness of fit becomes larger when the voltage decreases, and it is greater than 0.99 at 1960 V. The following can be seen from the plotted results in Figure 8a,b:
(1) In the case of the operating voltage of 1960 V, the conductance values of the MPF of the DCLC at temperatures of 20 °C, 70 °C, and 90 °C are 3.49 × 10⁻¹⁶ S/m, 5.2 × 10⁻¹⁵ S/m, and 1.62 × 10⁻¹⁴ S/m, respectively. For the case of an operating voltage of 2800 V, the obtained conductivity levels of the MPF of the DCLC at the above-mentioned temperatures are 1.07 × 10⁻¹⁵ S/m, 1.05 × 10⁻¹⁴ S/m, and 3.18 × 10⁻¹⁴ S/m, respectively. For an operating voltage equal to 4480 V, the conductivity magnitudes of the MPF of the DCLC at the temperatures given above are 6.52 × 10⁻¹⁵ S/m, 4.27 × 10⁻¹⁴ S/m, and 8.91 × 10⁻¹⁴ S/m, respectively. For an operating voltage of 5600 V, the obtained conductivity magnitudes of the MPF of the DCLC at the above-mentioned temperatures are 1.84 × 10⁻¹⁴ S/m, 7.73 × 10⁻¹⁴ S/m, and 1.47 × 10⁻¹³ S/m, respectively.
(2) The conductivity of the MFC of the DCLC gradually rises in an exponential manner with the increase in temperature, and when the temperature is higher than 70–90 °C, the conductivity of the DCLC grows exponentially with increasing temperature. In general, the increase in temperature leads to an increase in thermal activation. An increase in temperature intensifies the charge injection into the MPF by the electrode, as well as the migration and transport of carriers inside the MPF, and the conductivity of the MPF drastically increases with the rise in temperature.
(3) The conductance of the MPF of the DCLC increases slowly with an increase in the operating voltage, and when the operating voltage and temperature become higher than 4480 V and 70 °C, the conductivity of the MPF of the DCLC increases sharply as the operating voltage grows. This is mainly attributed to the fact that the increase in the operating voltage reduces the charge injection barrier at the interface of the MPF and causes the trapped charge to gain more energy and jump from its trapped state to the conduction band.
Recent investigations have been devoted to conductivity analysis. According to Ref. [20], the obtained results revealed that the conductivity of BOPP film would be in the range of 10−18–10−14 S/m at a temperature from 270 K to 330 K. In addition, it was reported that the conductivity of BOPP film would be in the range of 10−18–10−14 S/m under an electric field of 200 V/μm. The results obtained in Ref. [22] have indicated that the conductivity of BOPP film remains in the range of 10−14–10−12 S/m under the reference conditions of 105 °C and 250 V/μm. The results obtained in Ref. [32] have revealed that the conductivity of BOPP film varied in the range of 10−16–10−12 S/m at temperatures from 25 °C to 90 °C. In this study, we obtained an electrical conductivity in the range of 3.49 × 10⁻¹⁶–1.47 × 10⁻¹³ S/m, with the electric field varying from 168.97 to 482.76 V/μm at temperatures of 20 to 90 °C. Thus, the results of this study are generally consistent with the comparative literature results.

4.3. Effect of Insulation Resistance

From Equation (9), it can be seen that the DCLC’s insulation resistance is related to the volume resistance, layer thickness, effective electrode width, and MPF electrode length.
From the analysis of the test results, the DCLC’s insulation resistance is also mainly related to the operating field strength and operating temperature.
Since the operating field strength of the DCLC relies on the material of the MPF and the evaporated metal layer [13], the insulation resistance of the DCLC is also related to the evaporated metal layer of the MPF.
Crystallinity is also one of the performance indices of BOPP. In general, the conductivity of BOPP decreases with increasing crystallinity [14]. Polypropylene film processing, such as hexane treatment [19], the parylene doping method [15], and the deashing process [33] are also able to reduce resistivity. As can be seen, there are more factors that affect the conductivity of polypropylene films. The quality level of the inherent color of the polypropylene film material is also capable of affecting its conductivity. Additionally, the quality level of the polypropylene film material itself influences its conductivity and also indirectly affects the insulation resistance level of DCLCs.
Therefore, the key factors affecting DCLC insulation resistance are the polypropylene film material and the evaporated metal layer. This crucial fact guides us in selecting the appropriate polypropylene material and evaporated plating structure in the DCLC design stage, necessitating quality control of the polypropylene materials and evaporated plating in the manufacturing stages.
In the process of DCLC usage, a decrease in the insulation resistance results in an increase in the leakage current and an increase in heat, resulting in an increase in the operating temperature; this, in turn, leads to a decrease in its new insulation capacity, and finally leads to the DCLC’s failure [34]. Therefore, in the DCLC design stage, operating temperature, operating voltage, heat generation, and other factors should be fully considered; suitable polypropylene material and evaporated plating structure should be selected; and optimal DCLC operating field strength and external dimensions should be determined.
Until now, many researchers have examined the lifetime prediction of DCLCs under various conditions such as temperature, voltage, and humidity [4,34,35,36]. However, there are no relevant studies in the literature on the examination of DCLC lifetime prediction based on insulation resistance. Most of the lifetime prediction models for DCLCs have been established based on the magnitude change in capacitance. Common models employed for assessing accelerated life aging are the Arrhenius equation, the inverse power law, and the Eyring model. The change in insulation resistance depends on the variation in temperature and voltage, and the change in insulation resistance cannot directly reflect the change in capacitance. Therefore, insulation resistance as an acceleration factor cannot be applied to existing accelerated life aging models, and it is therefore difficult to predict the lifetime of DCLCs using insulation resistance.

5. Conclusions

In the present study, the insulation resistance and conductance of a DCLC with a nominal operating voltage of 2800 V and an operating field strength (E0) of 241.3 V/μm was taken as the research object, and the factors affecting the insulation resistance and conductance of the DCLC were analyzed by performing experimental studies on insulation resistance measurements at various temperatures and operating voltages. The main obtained results can be summarized as follows:
(1)
Under the same operating temperature, the insulation resistance (self-discharge time constant) of the DCLC decreases with the growth in the operating voltage, and the decrease in the insulation resistance (self-discharge time constant) is lessened for the case of operating voltages higher than 4480 V (1.6E0 = 386.21 V/μm).
(2)
Under the same operating voltage, the insulation resistance (self-discharge time constant) of the DCLC decreases exponentially with the rise in temperature, and the decrease in the insulation resistance (self-discharge time constant) is lessened when the temperature is higher than 70 °C.
(3)
For temperatures lower than 70 °C, the rate of change in the DCLC’s voltage decreases slowly as the operating voltage increases. As the temperature varies in the interval of 70–90 °C, the rate of change in the DCLC’s voltage drastically decreases as the operating voltage increases. Additionally, under the same operating voltage, the rate of change in the DCLC’s voltage increases with the increase in temperature.
(4)
The conductivity of the MPF of the DCLC slowly increases in an exponential manner as the temperature increases, and when the temperature is higher than 70–90 °C, the conductivity of the MPF of the DCLC increases sharply with the rise in temperature.
(5)
The conductivity of the MPF of the DCLC rises slowly and exponentially with the increase in operating voltage, and when the operating voltage is higher than 4480 V and the temperature is higher than 70 °C, the conductivity of the MPF of the DCLC drastically rises with the growth in the operating voltage.
(6)
As the operating voltage increases from 1960 V (0.7E0 = 168.97 V/μm) to 5600 V (2E0 = 482.76 V/μm) and the temperature rises from 20 °C to 90 °C, the DCLC’s insulation resistance reduces from 891. MΩ to 2.14 MΩ. By raising the operating voltage from 1960 V to 5600 V and the temperature from 20 °C to 90 °C, the DCLC’s self-discharge time constant lessens from 55,834 s to 132 s. By increasing the operating voltage from 1960 V to 5600 V and the temperature from 20 °C to 90 °C, the DCLC’s conductivity increases from 3.49 × 10⁻¹⁶ S/m to 1.47 × 10⁻¹³ S/m.
The design of the insulation resistance test employed in this study was based on the evaporation of a metal layer of metalized polypropylene film. The test results show that the method adopted represents a feasible and effective approach in practical engineering and will be beneficial for analyzing and solving the insulation problem of dry DCLCs. However, the factors that affect the insulation resistance of DCLCs also comprise the amount of metal plating resistance, the metal plating materials, and the manufacturing process of the DCLCs; therefore, the influence of the insulation resistance of DCLCs on their performance and workability requires further investigations.

Author Contributions

X.S.: conceptualization, funding acquisition, methodology, writing—original draft, visualization. Y.Q.: resources, formal analysis, writing—review and editing. Y.L.: resources, supervision, writing—review and editing. C.C.: resources, supervision, data curation. S.F.: resources. All authors have read and agreed to the published version of the manuscript.

Funding

This study was supported by the Key R&D (Industry Foresight and Key Core Technologies) Projects in Jiangsu Province (grant no. BE2021038), and the science and technology program of Jiangsu Province (grant no. BM2023533).

Data Availability Statement

Data are contained within the article.

Conflicts of Interest

Authors Xiaowu Sun, Yinda Li, Chongfeng Cao, and Shenrong Feng were employed by the company Wuxi Power Filter Co., Ltd. The remaining author declares that the research was conducted in the absence of any commercial or financial relationships that could be construed as a potential conflict of interest.

References

  1. Rytöluoto, I.; Niittymäki, M.; Seri, P.; Naderiallaf, H.; Lahti, K.; Saarimäki, E.; Flyktman, T.; Paajanen, M. Biaxially oriented silica-polypropylene nanocomposites for HVDC film capacitors: Morphology-dielectric property relationships, and critical evaluation of the current progress and limitations. J. Mater. Chem. A 2022, 10, 3025–3043. [Google Scholar] [CrossRef]
  2. Sarjeant, W.J.; Zirnheld, J.; MacDougall, F.W. Capacitors. IEEE T Plasma Sci. 1998, 26, 1368–1392. [Google Scholar] [CrossRef]
  3. Rabuffi, M.; Picci, G. Status quo and future prospects for metallized polypropylene energy storage capacitors. IEEE Trans. Plasma Sci. 2002, 30, 1939–1942. [Google Scholar] [CrossRef]
  4. Makdessi, M.; Sari, A.; Venet, P. Metallized polymer film capacitors ageing law based on capacitance degradation. Microelectron. Reliab. 2014, 54, 1823–1827. [Google Scholar] [CrossRef]
  5. Lv, C.; Liu, J.; Zhang, Y.; Yin, J.; Cao, R.; Li, Y.; Liu, X. A Method to Characterize the Shrinking of Safe Operation Area of Metallized Film Capacitor Considering Electrothermal Coupling and Aging in Power Electronics Applications. IEEE Trans. Ind. Electron. 2022, 70, 1993–2002. [Google Scholar] [CrossRef]
  6. Du, B. Polymer Insulation Applied for HVDC Transmission; Springer Nature: Berlin/Heidelberg, Germany, 2020. [Google Scholar]
  7. Xing, Z.; Gu, Z.; Zhang, C.; Guo, S.; Cui, H.; Lei, Q.; Li, G. Influence of Space Charge on Dielectric Property and Breakdown Strength of Polypropylene Dielectrics under Strong Electric Field. Energies 2022, 15, 4412. [Google Scholar] [CrossRef]
  8. Cheng, L.; Li, Z.; Wang, J.; Xu, Z.; Liu, W.; Li, S. Degradation Behavior and Mechanism of Metalized Film Capacitor under Ultrahigh Field. IEEE Trans. Dielect. Electr. Insul. 2023, 30, 509–517. [Google Scholar] [CrossRef]
  9. Kurimský, J.; Rajňák, M.; Cimbala, R. Pulse induced failures in bi-axially oriented polypropylene capacitors: Experimental investigation. Ain. Shams. Eng. J. 2023, 14, 102086. [Google Scholar] [CrossRef]
  10. Umemura, T.; Akiyama, K.; Couderc, D. Morphology and Electrical Properties of Biaxially-oriented Polypropylene Films. IEEE Trans. Dielect. Electr. Insul. 1986, 4, 137–144. [Google Scholar] [CrossRef]
  11. Karanja, P.K.; Nath, R. Charge trapping and conduction in pure and iodine-doped biaxially-oriented polypropylene. IEEE Trans. Dielectr. Electr. Insul. 1994, 1, 213–223. [Google Scholar] [CrossRef]
  12. Ho, J.; Jow, T.R. High field conduction in biaxially oriented polypropylene at elevated temperature. IEEE Trans. Dielectr. Electr. Insul. 2012, 19, 990–995. [Google Scholar] [CrossRef]
  13. Li, H.; Li, Z.; Lin, F.; Liu, D.; Wang, B.; Chen, Y.; Dai, L.; Fan, S. Electrical conduction of metallized BOPP films based on revised Poole–Frenkel effect. J. Electrostat. 2013, 71, 958–962. [Google Scholar] [CrossRef]
  14. Ran, Z.; Du, B.; Xiao, M.; Li, J. Crystallization Morphology-Dependent Breakdown Strength of Polypropylene Films for Converter Valve Capacitor. IEEE Trans. Dielect. Electr. Insul. 2021, 28, 964–971. [Google Scholar] [CrossRef]
  15. Liu, H.; Du, B.X.; Xiao, M.; Ran, Z. Improved Conductivity and Breakdown Performance of Polypropylene Film by Parylene Blending for Power Capacitor. IEEE Trans. Dielect. Electr. Insul. 2022, 29, 997–1004. [Google Scholar] [CrossRef]
  16. Xiao, M.; Zhao, Y.S.; Du, B.X. Dielectric Performance of Furan-Functionalized Polypropylene Film for HVDC Capacitors. IEEE Trans. Dielect. Electr. Insul. 2023, 31, 160–167. [Google Scholar] [CrossRef]
  17. Zhang, S.; Tian, F.; Liang, J.; Cao, J.; Xing, Z. The Time, Electric Field, and Temperature Dependence of Charging and Discharging Currents in Polypropylene Films. Polymers 2023, 15, 3123. [Google Scholar] [CrossRef]
  18. Ieda, M.; Sawa, G.; Kato, S. A Consideration of Poole-Frenkel Effect on Electric Conduction in Insulators. J. Appl. Phys. 1971, 42, 3737–3740. [Google Scholar] [CrossRef]
  19. Karanja, P.; Nath, R. Electrical conduction in biaxially-oriented polypropylene. J. Electrostat. 1993, 31, 51–63. [Google Scholar] [CrossRef]
  20. Li, H.; Li, Z.; Xu, Z.; Lin, F.; Wang, B.; Li, H.; Zhang, Q.; Wang, W.; Huang, X. Electric Field and Temperature Dependence of Electrical Conductivity in Biaxially Oriented Polypropylene Films. IEEE T Plasma Sci. 2014, 42, 3585–3591. [Google Scholar] [CrossRef]
  21. Li, H.; Li, Z.; Lin, F.; Chen, Y.; Liu, D.; Wang, B. Insulation resistance of metallized polypropylene film capacitors under different electric fields. IEEE Trans. Dielect. Electr. Insul. 2013, 20, 1315–1320. [Google Scholar] [CrossRef]
  22. Michelazzi, M.; Fabiani, D. Electrical Conduction in Thin-Film Polypropylene Capacitors. Energies 2023, 16, 6631. [Google Scholar] [CrossRef]
  23. Wang, Y.; Li, H.; Wang, Z.; Lin, F. Voltage maintaining performance of metallized film capacitors based on crystallinity regulation. High Volt. Eng. 2022, 48, 3643–3650. [Google Scholar]
  24. Li, Z.; Li, H.; Yang, P.; Lin, F.; Cheng, Y.; Liu, D.; Wang, B.; Zhang, Q. Leakage characteristic of metallized polypropylene film capacitors under different electric fields. Trans. China Electrotech. Soc. 2013, 28, 274–280. [Google Scholar]
  25. Chen, Y.; Zhang, M.; Li, H.; Lin, F.; Li, Z.; Lu, F.; Liu, D. Insulation resistance characteristics of metallized film capacitor under high electric field. High Power Laser Part. Beams 2012, 24, 797–800. [Google Scholar] [CrossRef]
  26. Yan, Z.; Zhu, D. High Voltage Insulation Technology; China Electric Power Press: Beijing, China, 2007; pp. 178–182. [Google Scholar]
  27. Sun, X.; Qiao, Y.; Li, Y.; Guo, X.; Cao, C. Effects of Mechanical Stress on the Life and Insulation Performance of DC-Link Capacitors. Energies 2024, 17, 699. [Google Scholar] [CrossRef]
  28. JB/T 6168-2023; Pulse Capacitors and DC Capacitors. China Machine Press: Beijing, China, 2023.
  29. IEC 61071:2017; Capacitors for Power Electronics. IEC: London, UK, 2017.
  30. Li, H.; Chen, Y.; Lin, F.; Lv, F.; Li, Z.; Zhang, M. Study on voltage maintaining performance of metalized film capacitors under high electric fields. In Proceedings of the 2011 Annual Report Conference on Electrical Insulation and Dielectric Phenomena, Cancun, Mexico, 16–19 October 2011; pp. 699–702. [Google Scholar]
  31. Kang, S.; Kim, J. Investigation on the Insulation Resistance Characteristics of Low Voltage Cable. Energies 2020, 13, 3611. [Google Scholar] [CrossRef]
  32. Zhao, Y.S.; Xiao, M.; Du, B.X. High-temperature Breakdown Performance Improvement of Polypropylene Films Based on Furfuryl Sulfide Graft Modification. In Proceedings of the 2022 IEEE 4th International Conference on Dielectrics (ICD), Palermo, Italy, 3–7 July 2022; Volume 3, pp. 717–720. [Google Scholar]
  33. Du, B.; Zhang, J.; Xiao, M.; Liu, H.; Ran, Z. Dielectric Breakdown Performance of Deashed Polypropylene for HVDC Film Capacitors. IEEE T Dielect. Electr. Insul. 2022, 29, 2209–2217. [Google Scholar] [CrossRef]
  34. Gallay, R. Metallized film capacitor lifetime evaluation and failure mode analysis. In Proceedings of the CAS-CERN Accelerator School: Power Converters, Baden, Switzerland, 7–14 May 2014; Bailey, R., Ed.; CERN-2015-003; CERN: Geneva, Switzerland, 2014. [Google Scholar]
  35. Hu, Y.; Ye, X.; Zheng, B.; Zhao, Z.; Zhai, G. Degradation mechanisms-based reliability modeling for metallized film capacitors under temperature and voltage stresses. Microelectron. Reliab. 2022, 138, 114609. [Google Scholar] [CrossRef]
  36. Tai, Y.; Chen, P.; Jian, Y.; Fang, Q.; Xu, D.; Cheng, J. Failure mechanism and life estimate of metallized film capacitor under high temperature and humidity. Microelectron. Reliab. 2022, 137, 114755. [Google Scholar] [CrossRef]
Figure 1. Schematic representation of the equivalent circuit of the simplified DCLC.
Energies 17 01147 g001
Figure 2. Schematic diagram of the capacitor’s structure: (a) whole, (b) a section.
Energies 17 01147 g002
Figure 3. Schematic plot of the electric current in terms of the charged voltage.
Energies 17 01147 g003
Figure 4. Schematic of sample capacitor.
Energies 17 01147 g004
Figure 5. Experimental circuit of the test platform.
Energies 17 01147 g005
Figure 6. Photos of the main equipment used for the test platform: (a) DC power supply, (b) the thermostat and sample, (c) voltmeter V, (d) LCR meter.
Energies 17 01147 g006aEnergies 17 01147 g006b
Figure 7. Plots of the insulation resistance in terms of the (a) operating voltage at various temperatures and (b) temperature at various operating voltages. Plots of the self-discharge time constant in terms of the (c) operating voltage at different temperatures and (d) temperature in the presence of different operating voltage. Plots of the voltage change rate in terms of the (e) operating voltage at various temperatures and (f) temperature at various operating voltages.
Energies 17 01147 g007aEnergies 17 01147 g007b
Figure 8. Plots of the (a) electrical conductivity as a function of the operating voltages at different temperatures and (b) conductivity as a function of the temperature in the presence of various operating voltages.
Energies 17 01147 g008
Disclaimer/Publisher’s Note: The statements, opinions and data contained in all publications are solely those of the individual author(s) and contributor(s) and not of MDPI and/or the editor(s). MDPI and/or the editor(s) disclaim responsibility for any injury to people or property resulting from any ideas, methods, instructions or products referred to in the content.

