1. Introduction
The interest in the use of wind energy has increased in recent years due to the need to replace fossil fuel-based energies with sustainable renewable energies [
1]. This research is focused on measuring the performance of small wind turbines (SWTs) in low resources or remote conditions. For this purpose, a moving platform methodology is proposed to replace the use of a conventional and generally more expensive wind tunnel. Performance tests of small wind turbines are conducted to evaluate different designs in moving platforms, wind tunnels, and on-site installations (for example residential installations). The majority of the recent studies are focused on measurements performed in residential installations. Wind energy harvesting systems integrated in buildings offer a promising solution for generating renewable energy in urban areas, reducing the environmental impact of energy production, and enhancing energy independence [
2]. On the other hand, experiments in wind tunnels are typically implemented to analyze the dynamic behavior of a wind turbine in different operating conditions [
3].
In the case of residential installations, the state of the art of SWTs is summarized in [
4], which includes micro-scale wind harvesting devices such as flutter-based wind-induced vibration and vortex-induced vibration. The work presented here focuses on HAWT-type SWTs. The majority of studies of HAWTs are focused on the design and optimization of rotors and blades of turbines [
5,
6,
7,
8,
9,
10,
11,
12,
13]. Some studies [
14,
15] consider the air profile, blade allowable stress, starting time, and output power. Several studies have focused on the optimized design of the blades. Sign and Shmed [
16] developed a two-blade rotor using a special airfoil and exponential twist and taper distribution to achieve high aerodynamic performance at low wind speeds. The study of Arumugam et al. [
17] designed and simulated the rotor of a turbine under working conditions to evaluate its behavior. Variables such as chord length and torsion angle were examined in this study. A work focused on the reduction in aerodynamic noise in the blade design was presented by Volkmer et al. [
18]. Ghorani et al. [
19] proposed a work with the following objectives: maximize wind power and net mass flow, and minimize backflow based on the optimization of the geometry using multiple objectives. In [
20], the impact of roof edge shapes on wake characteristics and the power performance of a wind turbine installed on a roof in an urban setting was investigated.
SWTs are yet to achieve the development level of large WTs. Despite its potential as stated by Tumala et al. [
21], the efficiency, reliability, and cost issues of SWTs hinder its widespread use. This can be explained by factors such as the scale of the power output, high cost of testing, and technical complexity involved, which encumber the development of technically and economically feasible SWTs, especially in developed countries where they would have a stronger impact. As part of the selection process or in the development stages of an SWT, the testing of efficiency and the identification of appropriate ranges of operations is of high importance. The power coefficient (
) is a measure of the capacity of a wind turbine rotor and behaves as a non-linear function of the operating tip–speed ratio (
). The power coefficient versus the tip–speed ratio curve produces decisive information about WT performance and maintenance. The objective of this study was to provide a method to obtain the power coefficient versus tip–speed ratio curve in a simpler and faster yet accurate manner as an alternative to the use of a wind tunnel. This method can be a powerful tool in the process of SWT development or evaluation in areas of low resources or remote conditions as is generally the case for SWTs.
It has been argued that the main objectives of the wind turbine design consist of its economic viability, robustness, ease of construction, and good performance at low-to-medium speeds, along with the ability to withstand extreme climatic conditions [
22]. In order to verify that these objectives are met, testing is of fundamental importance. In general, the power coefficient versus the tip–speed ratio curves of SWTs are obtained mostly in three forms:
The moving platform seems to be the most simple and economical form of testing an SWT, at least during the initial stages of development. However, apart from being limited to relatively small-size rotors, a disadvantage of these systems is the difficulty in transporting expensive and delicate instrumentation outdoors.
Some research related to wind turbines mounted on moving platforms is about generating energy rather than actually testing SWTs. Several authors addressed this possibility despite the condition that any energy obtained must be provided by the moving platform itself so that there is no net energy harvesting. However, others argue that there are particular situations where this could be convenient [
23,
24,
25].
A recent work that reports using a moving platform for testing an SWT is authored by Song and Lubitz [
26]. In their work, data points are recorded in the steady-state operation of the SWT, and data in the acceleration phase are discarded as opposed to the method presented here.
- (b).
Wind tunnel
When available, wind tunnels of an appropriate size and capacity are a powerful choice because it is easier to control the test conditions [
27]. However, size-related limitations usually allow for testing rather small SWT prototypes [
28,
29]. Another disadvantage is that wind tunnels are not readily accessible everywhere, particularly in developing countries where these SWTs could have a higher impact. Even if available, the operational cost of wind tunnel testing can be extremely high and hence prohibitive for small companies and research groups. One way to overcome the high costs and size-related limitations is to test a scaled version of the actual WT, but this requires taking into account a number of additional aspects that arise from this approach [
30].
The problem of blockage in wind tunnels is important because it affects measured performance [
31,
32]. On the other hand, wind tunnels allow for efficient and safe deployment of sophisticated laboratory equipment; therefore, it is not unusual to evaluate the performance of WTs in combination with other aspects, such as structural integrity [
33].
An SWT case study, where an existing wind turbine prototype was equipped with a redesigned blade set, to increase its aerodynamic efficiency, was presented by Stepien et al. [
34]. The research was expanded by model validation in small-scale wind tunnel tests. Another study was presented by Khaled et al. [
3]. Their objective was to computationally demonstrate the effect of winglet length and cant angle on the performance of a Small Horizontal Axis Wind Turbine (SHAWT, which tested by Khaled et al.). The turbine was tested in a wind tunnel.
In a recent study, Eltayesh et al. [
35] performed measurements of the performance of small-scale HAWT in a wind tunnel. Their aim was to study the effect of blockage due to the wind tunnel and apply an SST
turbulence model for three and five blades. Turbulence and blockage are two effects important in wind tunnels. Castellani et al. [
36] performed measurements of vibrations in the same wind tunnel as Eltayesh et al. [
35] at the University of Perugia, Italy. In their measurements, Castellani et al. [
36] studied the experimental and numerical characterization of the aeroelastic behavior of a test-case HAWT with a 2 m rotor diameter and maximum power production of 3 kW. The wake effect of a HAWT on the performance of a downstream turbine in a wind tunnel was studied by Tang et al. [
37]. They presented wind tunnel tests on the wake characteristics of a three-blade HAWT and the wake effect on the performance of a downstream turbine. For a single turbine model, the performance was determined, and this was followed by measurement of the wind characteristics including velocities, turbulence intensities, and correlation in the wake flow field. Gerrie et al. [
38] performed 3D modeling of the performance of a VAWT. They employed Computational Fluid Dynamic (CFD) simulations and verified the results with wind tunnel experiments. Abas Umar et al. [
39] selected two different airfoils to design a small horizontal axis variable speed wind turbine blade for harvesting efficient energy in low wind speed areas.
- (c).
On-site testing
This option requires installing the SWT at the test site. The advantage is that testing is carried out under real conditions. Conversely, the disadvantage is that since the test conditions are difficult to control, it is difficult to obtain complete and consistent curves, and collecting enough information may be time-consuming.
There are international standards regarding on-site wind turbine testing: IEC 61400-12-1 (2017) [
40] pertains to the performance measurements; IEC 61400-2 (2013) [
41] pertains to the design requirements of SWTs; and AWEA Standard AWEA 9.1 (2009) [
42] specifically pertains to SWTs regarding several aspects, including performance.
In 2020, Leary et al. [
43] published research about the performance measurements of SWTs in situ. The paper presented new insights into the real-world performance of a range of open, locally manufactured small wind turbines designed to enable sustainable rural edification. The power performance of seven machines was measured in situ and compared with a wind tunnel, test site, and other in situ data to produce a set of generic power curves.
In large WTs, power curves are commonly obtained while in operation for a variety of reasons, including condition monitoring maintenance. However, operating conditions may not be sufficient in providing complete WT performance information. There is a large body of research work on the on-site generation of power performance curves. A more detailed discussion on this topic is, however, beyond the scope of this paper.
The research presented here aims to study the performance of a Small Horizontal Wind Turbine (SHWT) through performance curves of vs. and torque vs. angular velocity, in a simpler and faster yet acceptably accurate manner. The performance curves are obtained in a single test run, with the SWT mounted on a moving platform along a runway, requiring a couple of minutes at the most of data acquisition. Furthermore, our method only requires measuring a single variable, i.e., the generator output voltage. A suitable mathematical model for the system allowed for deriving the desired performance curves from this set of minimal data. The methodology was demonstrated by testing an SWT prototype developed by the authors. The prototype had a permanent magnet synchronous generator, but the method can be easily extended to any type of generator. Given its level of simplicity, accuracy, low cost, and ease of implementation, the proposed testing method has advantages that are helpful in the SWT development process.
2. Materials and Methods
The aim of this study was to obtain vs. curves for a SHAWT mounted on a towed moving platform with appropriate instrumentation. A stretch of 0.5–1 km of runway on a smooth flat terrain was used. In the test, the SWT slowly reaches steady state rpm starting from the rest position while the towing vehicle moves at a constant speed, which corresponds to the equivalent upstream wind speed. A skilled driver can perform the test for short periods of time as required by this method, and more so if the vehicle is equipped with cruise control capability. A preselected resistor bank was connected to the terminals of the generator. The value of the resistor bank was adjusted to generate a torque load on the generator that results in a convenient acceleration rate of the rotor angular velocity. It is convenient to have a very slow acceleration rate to have a quasi-static regime from the point of view of the SWT. However, this is limited by the runway length necessary to complete the test. As the wind rotor picked up speed during the acceleration stage, measurements were recorded until the rotor reached a steady-state rpm. During the acceleration phase, (, ) points were collected to construct the vs. curve using the methodology described here. For output consistency and verification purposes, the test may be repeated at different vehicle speeds and different resistor bank values. In theory, if the regime is quasi-static in nature, the vs. curve should be always the same regardless of the wind speed and resistor load, so theoretically, one run is sufficient.
The derivation of the
vs.
curves was carried out by measuring the output voltage of the generator as the single variable. The PMSG generator has three phases and a rectifier bridge, but it can be modeled as a single-phase AC generator within a wide range of operations according to Equation (1). All variables and parameters in the following formulated equations are defined in the nomenclature table. The RMS values of the current and voltage in this single-phase circuit correspond to the DC output in the actual generator. This type of modeling is used on an ample spectrum of PMSGs.
The above approximation is developed and discussed in more detail in
Section 2.2. Using Equation (1), we can isolate the angular velocity of the rotor/generator,
to obtain the following expression:
is obtained by measuring the generator output voltage with the following expression obtained by combining Equations (2) and (3):
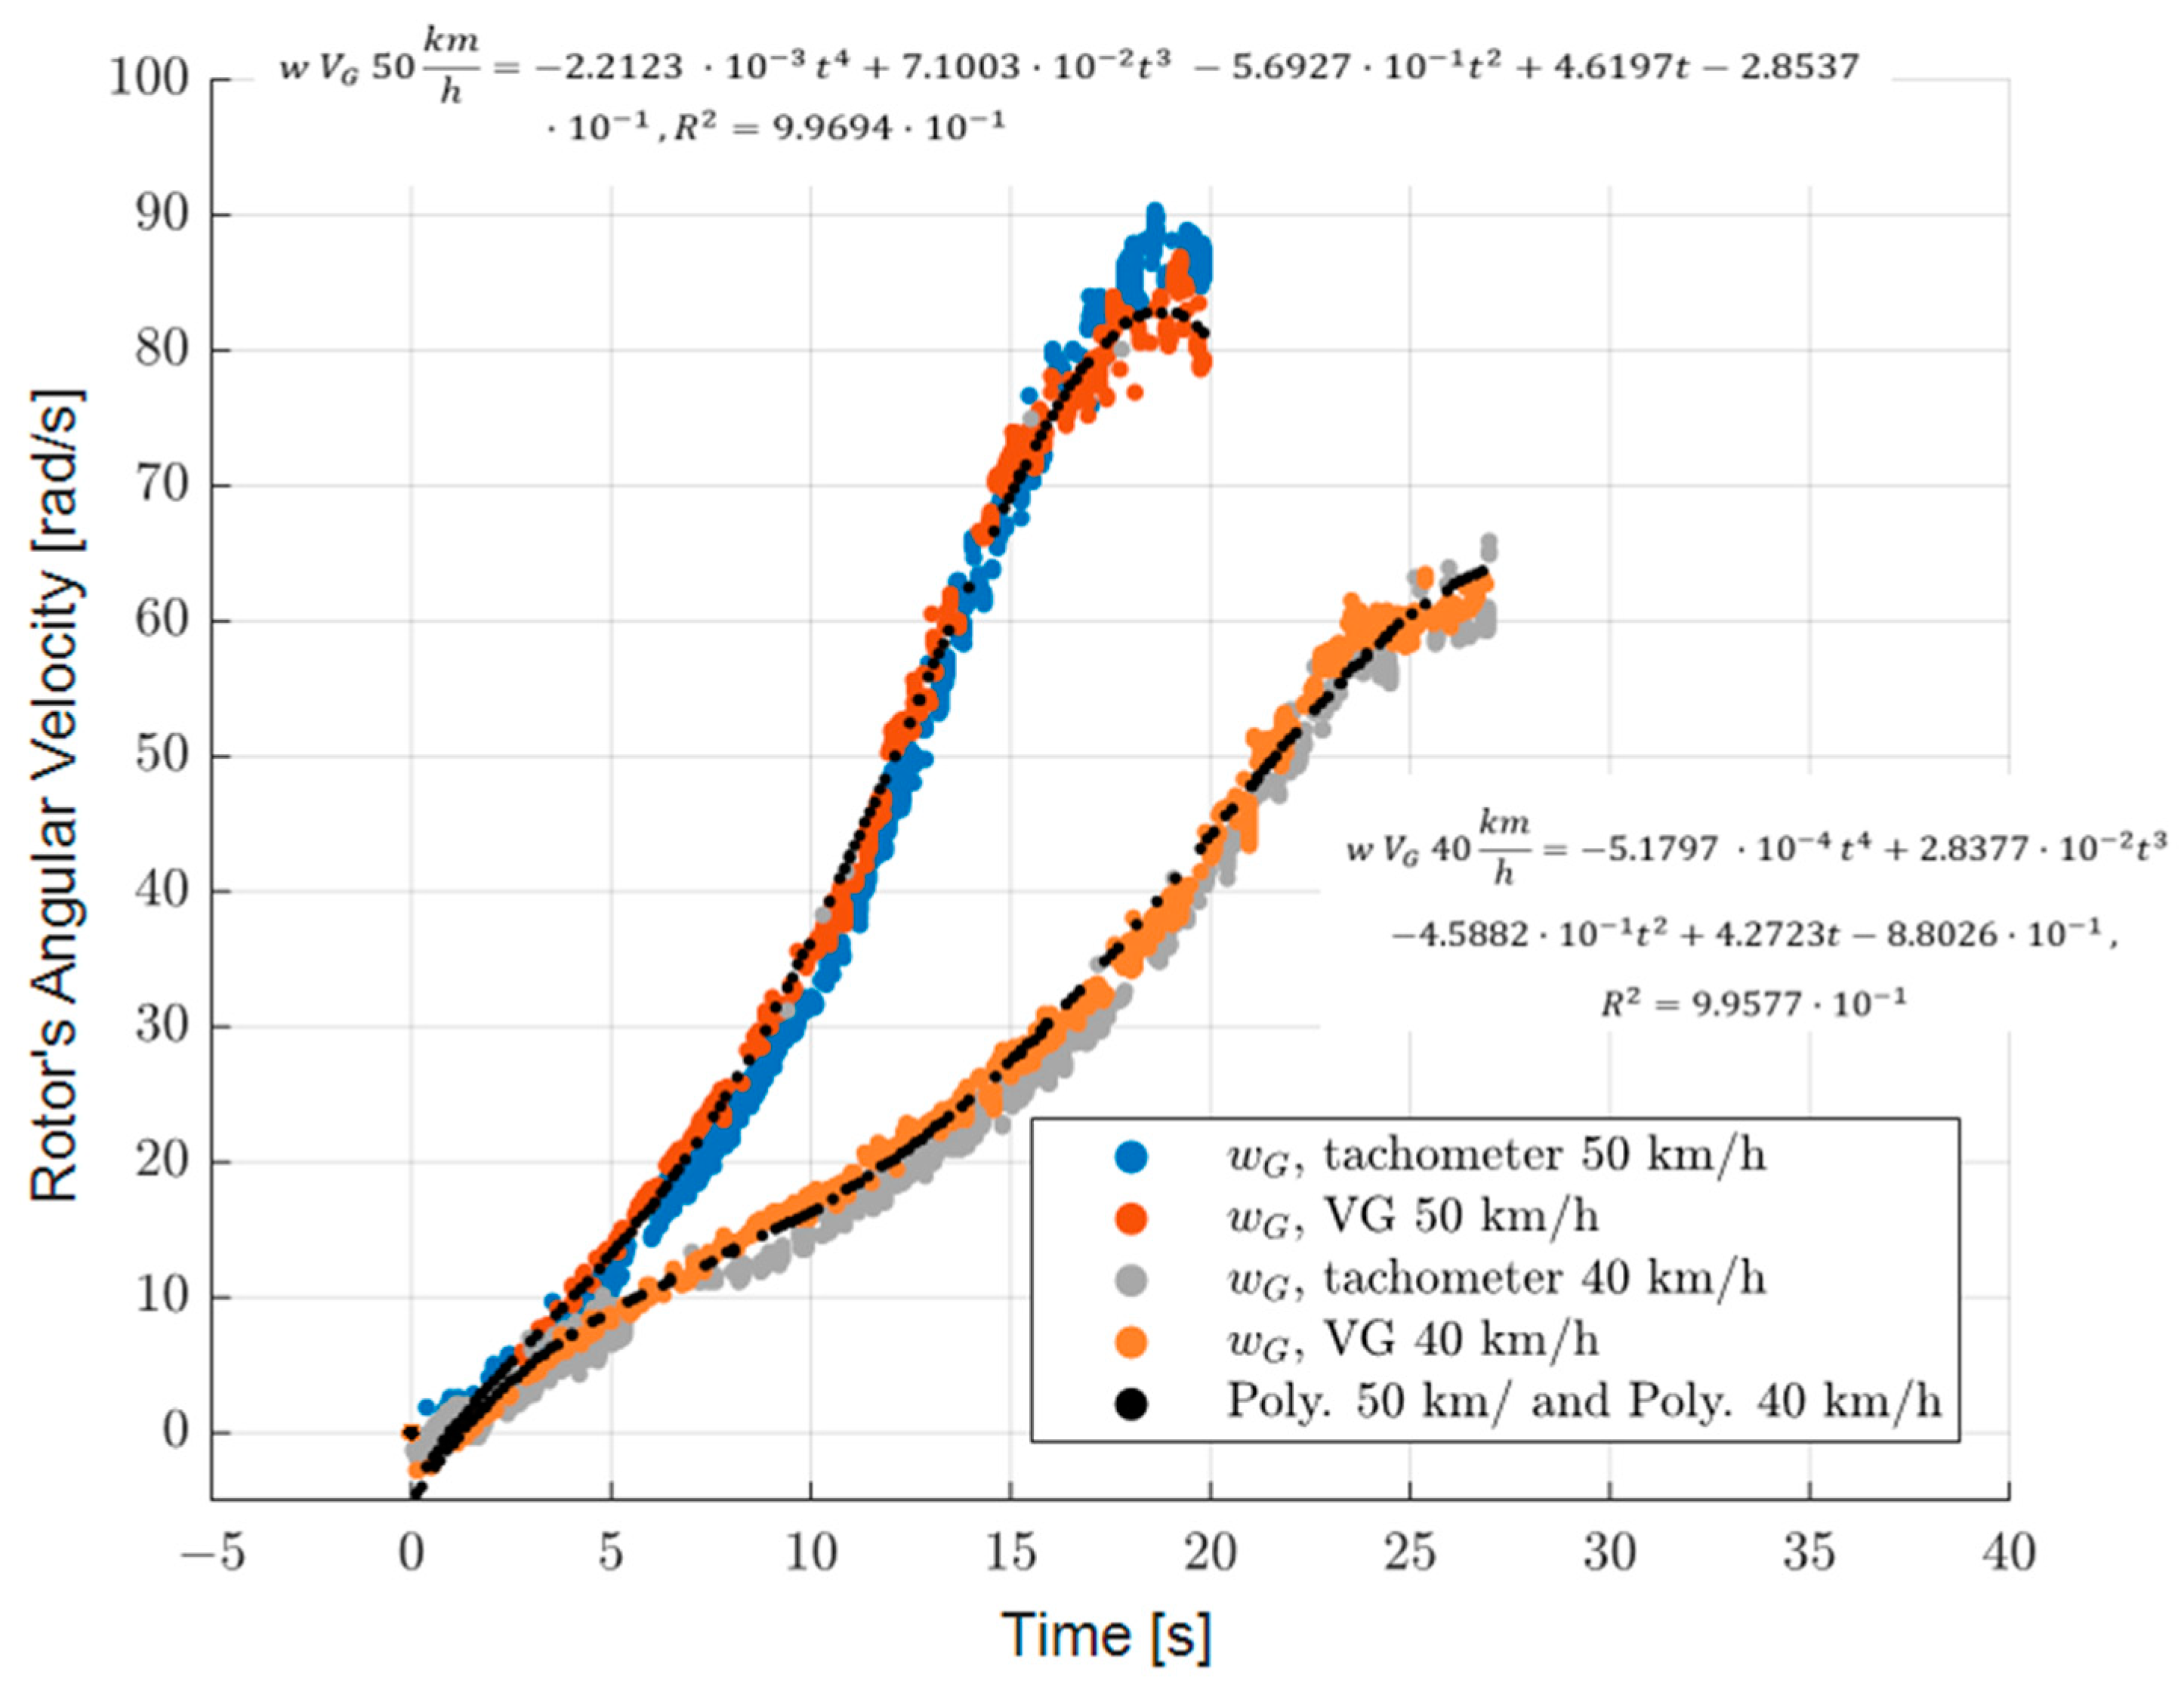
Figure 1 below shows a validation test with excellent correlation for the angular velocity of the rotor measured directly with a tachometer compared with the results obtained using Equation (4) for two sample test runs at different test conditions. The characteristic parameters of the generator model used in Equation (4) were obtained in a simple bench test carried out previously as explained in
Section 2.2.
The angular velocity of the SWT rotor/generator,
, curve obtained was approximated using a polynomial curve. For example, using a 4-degree polynomial curve fitting approximation in the case of the curve for 50 km/h, as shown in
Figure 1, gives:
The angular acceleration,
, can then be obtained by the derivation of Equation (5) since
Thus, the polynomial expression for the acceleration would be
As such, the inertia torque,
, opposed by the rotor while accelerating can be obtained using the following expression:
where
is the polar moment of inertia of the SWT rotor.
On the other hand, the power input to the generator,
, is given by the following expression:
where
is the electric phase angle between voltage and current.
Thus, the electric torque opposed by the generator can be obtained from the following expression:
The total torque,
, generated by the airflow passing through the SWT must balance the opposing torques. Then,
Figure 2 shows the contribution of the electric and inertial components to the total torque for one test run. The electric resistance load connected to the generator allows for regulating the acceleration rate and duration of the test.
The total power,
, generated by the rotor of the SWT can be computed using the following expression:
Thus, the power vs.
and the torque vs.
curves can be obtained. However, the performance of the turbine is usually normalized in terms of
and
to facilitate comparison with other turbines. Every SWT has its own characteristic
vs.
curve. Hence the following expressions are used:
In summary, with this method, a SWT mounted on a platform and moving at a constant controlled speed is released from the rest position. By measuring the generator voltage output during the slow acceleration phase of the SWT rpm, operation variables can be estimated according to Equations (1)–(13) in order to construct a vs. curve. Sampling periods from 10 to 100 Hz should suffice in the majority of cases. Different acceleration rates of the SWT can be obtained by using different moving platform speeds and different electric resistance loads. If the test is correctly conducted in a quasi-static regime, the vs. behavior should always converge to the same curve, independent of the moving platform speed and electric resistance load.
In summary,
Figure 3 represents the methodology of this research.
External factors such as lateral wind, variations in temperature, and ambient pressure do not impact the results obtained. The environmental conditions of the test site (Santiago, Chile) and other precautions allow a certain degree of control of these factors. In the summer season around 10 AM, the temperature is on average close to 20 °C, and standard atmospheric pressure can be expected. The SWT nacelle height is 3 m above the towing vehicle height and 5 m behind its tail, so the flow stream is minimally affected by the upstream presence of this vehicle. Regarding crosswinds, the natural wind speed during the summer season is expected to be negligible (close to zero) at the test hours in the morning (no breeze or gusts).
Vibrations were measured as in Castellani et al. [
36]. In this case, considering the absence of gusts and that the runway is flat and smooth (asphalted), as expected the effect of vibrations was not relevant and can be neglected. It must be remembered, nevertheless, that the methodology proposed in this study does not claim to be at the same level of quality and accuracy as a wind tunnel. The intention here is to provide an alternative method that can be applied when a wind tunnel is not available because of lower resources or geographic remoteness.
2.1. Turbine Rotor Moment of Inertia ()
The method described here requires the computation of the inertia torque,
, opposed by the rotor, as indicated in the previous section. To use Equation (8), the polar moment of inertia of the rotor
must be known. To obtain this value, the classical trifilar pendulum momentum experimental method can be used, or theoretical calculations can be made with 3D CAD modelers [
28]. Riahy and Freere (2008) [
44] suggest that considering the blades as rectangular blocks gives reasonably good results for
. In this section, we present a less-known method that also produces good results and is easy to implement because the SWT does not need to be disassembled or dismounted; it can be carried out with the wind rotor in place.
Let us begin by considering the following pendular mass,
, attached to a rotor whose,
is unknown, as shown in
Figure 4.
The linearized equation of motion of this system, assuming negligible friction, is
Notice that the natural frequency of the system,
, in
Figure 3 is
Hence, by varying the added mass (
), the natural frequency (
) varies accordingly. The natural frequency is easy to measure by letting the system oscillate and counting the elapsed time for a given number of cycles. Hence, by choosing the suitable values of
m and
r, and measuring the oscillation period, we can obtain
using the following expression:
Figure 5 shows the simulated numerical results of a disk with an eccentric point mass attached at a radius,
r. The response for different values of
being used can be easily noticed. For verification purposes, as shown in
Table 1, different values of
and
were used for the rotor being tested, and the corresponding value of
was measured. Notice that according to Equation (14), values of
will produce a better sensitivity.
The experimental measurements of the polar moment of inertia,
, for the tested prototype are outlined in
Table 1.
Table 1.
Experimental measurements for the prototype polar moment of inertia, , calculation.
Table 1.
Experimental measurements for the prototype polar moment of inertia, , calculation.
| Eccentric Mass [kg] | N Cycles | Total Time [sec] | T Period [sec] | [rad/s] | Estimated Polar Moment of Inertia, J [kg m2] |
|---|
| 0.512 | 5 | 21.360 | 4.272 | 1.471 | 1833 |
| 0.512 | 4 | 17.710 | 4.428 | 1.419 | 2009 |
| 0.512 | 4 | 17.520 | 4.380 | 1.435 | 1954 |
| 1.024 | 4 | 13.600 | 3.499 | 1.848 | 1932 |
| 1.024 | 4 | 13.510 | 3.378 | 1.860 | 1892 |
| 1.436 | 4 | 12.020 | 3.005 | 2.091 | 1789 |
| 1.436 | 4 | 12.450 | 3.113 | 2.019 | 2028 |
| | | | | | |
| | | | | Average | 1920 |
| | | | | Variance | 7733 |
| | | | | Sigma | 88 |
2.2. Characterization of an Axial Flow PMSG
The model for the Axial Flow PMSG in the prototype SWT is a key aspect of the methodology presented here. However, if the SWT has a different type of generator, as long as there is a suitable model available, the steps to obtain the
vs.
curves shown in
Figure 3 are essentially the same. PMSGs are commonly used in SWTs due to their numerous advantages, as described by Urtasun et al. (2013) [
45]. They require very little maintenance since there is no sliding/rolling contact except in the roller bearings, components which, if properly chosen, have an extremely long life and are easy to replace. In this study, experimental axial flow PMSGs were also developed in conjunction with hydrokinetic and small hydraulic Pelton turbines [
46]. A circuit model of the PMSG in the prototype is shown below.
Note that the circuit schematic shown in
Figure 6 applies to an ample range of three-phase PMSG configurations, including both axial and radial configurations. The relation between
and
to
and
is highly nonlinear.
Figure 7 shows typical waveforms for
and
obtained via numerical simulation, showing the effect of the value of
. The effect of the value of
shows an analogous behavior.
The relations between
and
to V and
in the three-phase circuit model cannot be written in a simple algebraic form, and because they are needed in the method presented here, calibration curves obtained experimentally can be used. However, a simpler and more general approach is suggested.
Figure 8 depicts a single-phase circuit that produces an excellent approximation to the three-phase circuit shown in
Figure 5. The RMS values computed from the circuit outlined in
Figure 8 correspond to the actual DC output of the generator. The equivalent circuit introduces a small deviation that is negligible at low speeds but can reach up to 5% at high speeds (1200 rpm). Such high speeds are seldom reached under normal operation of the SWT; thus, the simplicity and economy of the proposed methodology will generally outweigh this approximation error.
The actual DC output of the generator. The circuit can be referenced to by adjusting parameters according to the number of magnet poles.
Figure 9 and
Figure 10 allow for comparing the results obtained via numerical simulation for the three-phase circuit shown in
Figure 6 and the results obtained directly using Equations (1)–(4), (9), and (10).
The results of the experimental test to obtain the
parameter of the generator is shown in
Figure 11. This value corresponds to the slope of the NL (no load or open circuit) curve and, in this case,
. The phase resistance and inductance were measured with an ohmmeter and an inductance meter, respectively.
Figure 12 shows the result of applying a single-phase equivalent model to obtain the generator emf
with acceptable accuracy using Equation (17) below.
Similar approaches to the single-phase circuit approximation described in this section were proposed by a number of authors [
47,
48,
49]. One difference worth noting of the PMSG model presented here relative to other models in the literature is that the phase resistance is now taken into account as well because, in practice, in the tested prototype and many other cases, this resistance cannot be considered negligible.
3. Method Validation Results and Discussion
This section describes the application of the methodology presented here and discusses the results obtained. An SWT prototype previously designed and built was the object of testing. It was designed using TURBEM (version is 2.0) [
50], an optimization software based on the BEM theory developed by Chiang [
50,
51].
The proposed method was applied using a towed moving platform carrying the three-blade horizontal-axis turbine, PMSG, turbine tower, and electric circuitry (bank of resistors and data acquisition system). More details are provided in
Figure 13,
Table 2 and
Table 3.
Each test consisted of running with the moving platform over a smooth flat stretch of 0.5–1.0 km at a constant speed. The generator was loaded with an appropriate resistive load to achieve a slow angular acceleration rate before reaching a steady state. The voltage output was recorded during the entire acceleration stage. The acceleration stages lasted between 20 s and 1 min. The sampling period used was 10 to 100 Hz.
3.1. Experimental Setup
Testing was performed using the towed moving platform shown in
Figure 13. The method presented here only requires measuring the voltage output,
. However, for verification and validation purposes, a wind velocity sensor, wind direction sensor, tachometer, accelerometers, current sensor, and GPS receiver were added to the moving platform. The towing vehicle was equipped with cruise control to maintain a constant velocity, which was later verified by GPS recording.
The tested SWT had the following main characteristics:
Table 3.
Characteristics of the SWT generator.
Table 3.
Characteristics of the SWT generator.
| Generator (PMSG) | Characteristic |
|---|
| Type | Permanent magnet axial flow |
| 1.68 |
| Diameter [m] | 0.3 |
| Number of phases | 3 |
| Number of coils | 12 |
| Number of tuns per coil | 100 |
| Wire AWG size | AWG 18 |
| Number of magnets | 14 |
| Magnets | N35 |
| Magnet section area | 19 mm × 25 mm |
| Magnetization depth | 6 mm |
3.2. Theoretically Expected Performance
The theoretical performance curve
vs.
predicted using the TURBEM software (Version 2.0) [
48,
49] is depicted in
Figure 14. The theoretical performance provides a reference to compare the expected maximum value of the power coefficient with the maximum value obtained experimentally.
3.3. Experimental Data
For the sake of evaluating the proposed method’s robustness, the vs. TSR curve of the test SWT was obtained using different testing conditions. If the methodology is robust, the vs. obtained should be always the same, independent of the testing conditions. SWT testing was carried out for several wind speeds (i.e., moving platform velocity) and different resistor loads. The nominal wind speeds were 20 km/h, 30 km/h, 40 km/h, and 50 km/h. The resistor loads applied to the generator were 7.2 , 11.2 and no load (or open circuit). Hence, for the results presented here, a total of 12 runs were carried out. Each test was conducted on a runway, with the platform moving at the nominal speed for two minutes at the most. Each test gives an individual vs. curve that should be essentially the same if the method is to be considered robust and reliable.
For illustration purposes, raw data for a 50 km/h and 11.2
test run are shown in
Figure 15.
vs.
TSR curves were obtained for different combinations of resistor value and wind velocity as shown in
Figure 16 and
Figure 17.
The vehicle aerodynamics did not significantly influence the magnitude and uniformity of the flow stream passing through the wind turbine rotor because, for the given test conditions, the nacelle of the turbine was far enough from the vehicle. It is 3 m higher than the light truck roof and 5 m downwind.
vs. TSR curves in
Figure 16 and
Figure 17 show that essentially the same curve is obtained regardless of the test conditions, thus attesting to the robustness of the method. The results are not affected by the vehicle velocity and are hence independent of the vehicle aerodynamics.
3.4. Effect of Towing Speed Velocity (Nominal Wind Speed)
Figure 16 shows the normalized performance results obtained after processing the experimental data for a resistor load of 11.2
and different wind velocities.
As expected, the vs. curves were essentially independent of the test wind velocity. At lower wind velocities, however, a lower torque was generated and longer test times were required; therefore, in such cases, the available runway may be too short. Thus, performance curves obtained under higher wind velocities were more likely to produce more complete results but, nevertheless, high acceleration rates must be avoided to maintain a quiasi-static flow regime. Additionally, it should be noted that the effective performance ( was lower than the theoretical results according to the BEM theory, as would be expected due to underestimated losses such as friction, and tip and hub losses. The fact that curves all converge to the same value, independent of the nominal wind velocity (towing vehicle velocity), validates the methodology.
3.5. Effect of Generator Load
Figure 17 shows the normalized performance results achieved by varying the resistor loads for a constant wind speed of 50 km/h. The resistor loads were 7.2
, 11.2
and NL (no load). The resulting curves are consistent with the previous results shown in
Figure 16.
The fact that curves converge to the same value, independent of the generator load , also validates the methodology.
4. Conclusions
In this paper, a method developed for testing SWTs is presented. An SWT prototype that was designed and built as part of the authors’ line of research was used to illustrate the proposed method. Continuous testing of SWT prototypes allowed the authors to optimize this testing methodology. The SWT was mounted on a towed moving platform and, using the PMSG voltage output as the single measurement variable, a vs. curve was constructed. Tests lasting less than two minutes, conducted in a wide range of conditions, enabled us to obtain this curve since a correct vs. curve is independent of the wind speed used in the test as seen in the results and as theoretically expected.
To demonstrate the consistency and accuracy of the method, the results are presented from tests carried out at different moving platform speeds: 20 km/h, 30 km/h, 40 km/h, and 50 km/h. The load on the system was applied using a bank of electrical resistors with different values: 7.2 and an open circuit.
The results showed consistency since the vs. curves converged to the same result, independent of the moving platform speed (equivalent to wind velocity) and electrical resistive load applied on the generator.
At the core of this proposed methodology is modeling the three-phase PMSG as a single-phase PMSG. This approximation introduces negligible errors at low speeds, increasing at high speeds up to around 5% at 1200 rpm in the tested prototype. However, such a high speed of rotation can seldom be achieved because of mechanical and structural limitations in this type of SWT. Hence, the error caused by the equivalent circuit is far outweighed by the practical advantages of the proposed method.
The method presented here has the following noteworthy characteristics compared with the existing methods:
- (a).
The normalized performance curve vs. can be obtained in one test run, requiring only a few minutes of data recording.
- (b).
The normalized performance curve vs. can be obtained by measuring the generator output voltage VG vs. time as a single variable.
- (c).
It is applicable to SWTs with any type of PMSG or synchronous generator, which is arguably the most commonly used type of SWT.
- (d).
It produces consistent results under a variety of testing conditions with acceptable accuracy.
- (e).
Its implementation is simple, fast, and economical.
- (f).
vs. were obtained for different wind velocities and different generator load resistances, essentially giving the same curve results. This validates the proposed methodology since this is what is theoretically expected. vs. are expected to be independent of the wind velocity or generator load resistance.
- (g).
At low acceleration rates, from the rotor point of view, the airflow can be considered a quasi-static flow regime. The method should work even better for high inertia rotors and high generator load resistance conditions since in such cases the acceleration rate decreases; nevertheless, the results are limited by the runway length.
Future research by the authors will be focused on adapting this method to applications in the condition monitoring of SWTs. It is believed that monitoring the vs. curves of an SWT can help detect failures at its initial stages since many causes of failure affect the efficiency of the system from the very beginning.

