Abstract
In this study, we designed a prototype reactor, the multiple pipes reactor (MPR), for Hg(0) capture, which can be applied in small-scale boilers. It was tested on a laboratory scale by comparing it with a fixed-bed type, the vertical glass reactor (VGR). In total, 200 mg of CuO and CuS was applied as sorbent materials to reduce the concentration of Hg(0) from the simulated flue gas, in both VGR and MPR reactors. The mercury capture measurements were performed in the same laboratory system at 125 °C and a flow rate of 54 L/h. The contact time between the sorbents and simulated flue gas in the VGR was 0.035 s for both materials. In the case of the MPR, it was 0.44 s (CuO coating) and 0.63 s (CuS coating), depending on the coating area. The contact area inside the VGR was 5.31 cm2, contrasting with the values of 13.19 cm2 (CuO coating) and 18.84 cm2 (CuS coating) in the MPRs. The average Hg(0) capture effectiveness of CuO (granulate) and CuS (granulate) was 51% and 67% in VGR, respectively. The MPR with CuO- and CuS-coating Teflon (PTFE) pipes promoted an average Hg(0) capture effectiveness reaching 65 (by 268%) and 94% (by 158%), respectively.
1. Introduction
Mercury is a toxic, volatile metal, and one of its emission sources is the combustion of solid fuels. In past decades, many countries decided to reduce the quantity of solid fuels used in industries and energy production. The European Union and the United Kingdom already reduced the coal consumption in energy generation from 12.16 to 7.01 EJ (Exajoules) between 2011 and 2021 [1]. According to the BP statistics, the total amount of fossil fuel usage worldwide declined about 5% from 2018 to 2020 [2].
Industries, such as power and heating facilities or cement and non-iron metal production plants, use sophisticated devices, such as active carbon injection (ACI) techniques of different kinds, polymer sorbent composites [3], or a polymer sorbent catalyst GORE™ [4]. These are mercury-dedicated, active removal techniques. The various sorbents demonstrate a good mercury capture effectiveness in the laboratory or industrial facilities, including percentages of almost 100% for modified activated carbons (ACs) [5,6], 70–100% for zeolites [7,8], 89.5% for Fe2O3 when HCl is present in the flue gas [9], and close to 100% mercury capture for FeS2 [10].
Further efforts are still needed to control Hg(0) emissions, not only for industrial emissions but also from distributed, medium-sized or domestic sources. The total mercury emission from anthropogenic processes and secondary sources was approximately 2220 Mg in 2015, and approximately 55.8 Mg was from domestic, residential, and transportation sources [11].
The current geopolitical situation does not help to sustainably accelerate the energy transition in all regions of the world. There are nearly 2.3 billion people who will still use biomass until 2030 or much longer [12], and most of them live in rural regions, especially in developing countries [13]. The residents who live in the Sichuan Basin in China use agricultural waste, such as straw and woods, as an energy source to heat up their households in the winter season.
Zhang et al., 2017 [14], indicated that the black carbon released from low-combustion-efficiency stoves in rural households was 640 ± 245 Gg/y in 2014. Additionally, straw and wood contribute 42 ± 13% and 36 ± 15% of total national emissions, respectively. Also, nearly 43% of energy sources in the EU28 in 2017 (prior to Brexit) came from the combustion of solid biomass by household boilers and stoves. More than 50% of the biomass combusted was used for residential heating [15]. The combustion of fossil fuels and biomass contributes to relatively high levels of mercury emission. According to Shen et al., 2021 [16], the mercury content in agricultural waste, such as fuelwood, straws, and pellets, was 0.65–28.44 µg/kg, 3.02–12.05 µg/kg, and 5.22–8.10 µg/kg, respectively. When comparing different parts of trees, the mercury content in wood was from 0.4 to 7.3 µg/kg, and was much higher in bark and leaves—from 2.7 to 65.9 µg/kg [17].
Mercury occurs in exhaust gases in three main speciation forms, Hg(0), Hg(II), and Hgp, which is bound to fly ash. The particulate matter-bound mercury was responsible for up to 30% of mercury emissions from biomass burning [18]. In addition, a person cooking in a kitchen may have a nominal inhaled dose of PM2.5 over 666 µg/m3 during the use of low-combustion-efficiency stoves for the combustion of biomass [19]. Dziok and Penkała (2020) [20] reported that household heating boilers released nearly 99% of mercury to a stack (in power plants, even 70–85% of mercury may be bound to fly ash). The emission was coming from the combustion of hard coal and woody biomass. It is classified as coming from non-point (scattered) sources, and this emission is hard to track.
Hence, a prototype multiple-pipes reactor to reduce mercury and possibly other toxicant emissions from small-scale boilers and other non-point sources was designed.
The research presented in this article concerns only laboratory tests of the new reactor. However, already at this stage of research, we have made certain assumptions for the new solution:
- -
- The MPR size can be adjusted to current needs;
- -
- Its construction is adapted, space-friendly;
- -
- It has easy installation, recycle, and reuse capacities;
- -
- It is easily connected to small-scale boilers or installed to attach to household chimneys;
- -
- It can also be installed at the inlet or outlet of a ventilator in compact locations;
- -
- It has long-lasting, accessible maintenance;
- -
- It has a relatively low cost, etc.
The idea would be utilized to control Hg(0) and PM emissions in households in a village or specific areas of towns. The MPRs would also be used to treat indoor toxic pollutants. The concentration of PM2.5 in office buildings, for instance, in Beijing, can reach 100 µg/m3 [21]. But the concentration of PM2.5 in a kitchen may be in the range of 25 to 1526 µg/m3 [22]. The concentration of some volatile organic substances is also high in an indoor environment [23] and has to be controlled and reduced. Many toxic pollutants are usually vented out of houses through small individual ventilation equipment. Small ventilators do not have the pollutant treatment function. Regarding untreated toxicants, even if not poisoning people, they are released into the air and fall into water or soil with rainfall, causing secondary pollution.
In our study, the prototype MPR was tested in the Hg(0)-rich flue gas from lignite combustion. Hg(0) reduction measurements employed a real-time Hg(0) analysis that gives information about Hg(0) sorption efficiency of selected sorbents. The results from MPRs were compared with a fixed-bed reactor, which delivered reliable and reproduceable results [8,24,25]. Different ways of copper sorbent synthesis inside the MPR’s pipes were also presented.
2. Methodology and Materials
2.1. Mercury Capture Reactors
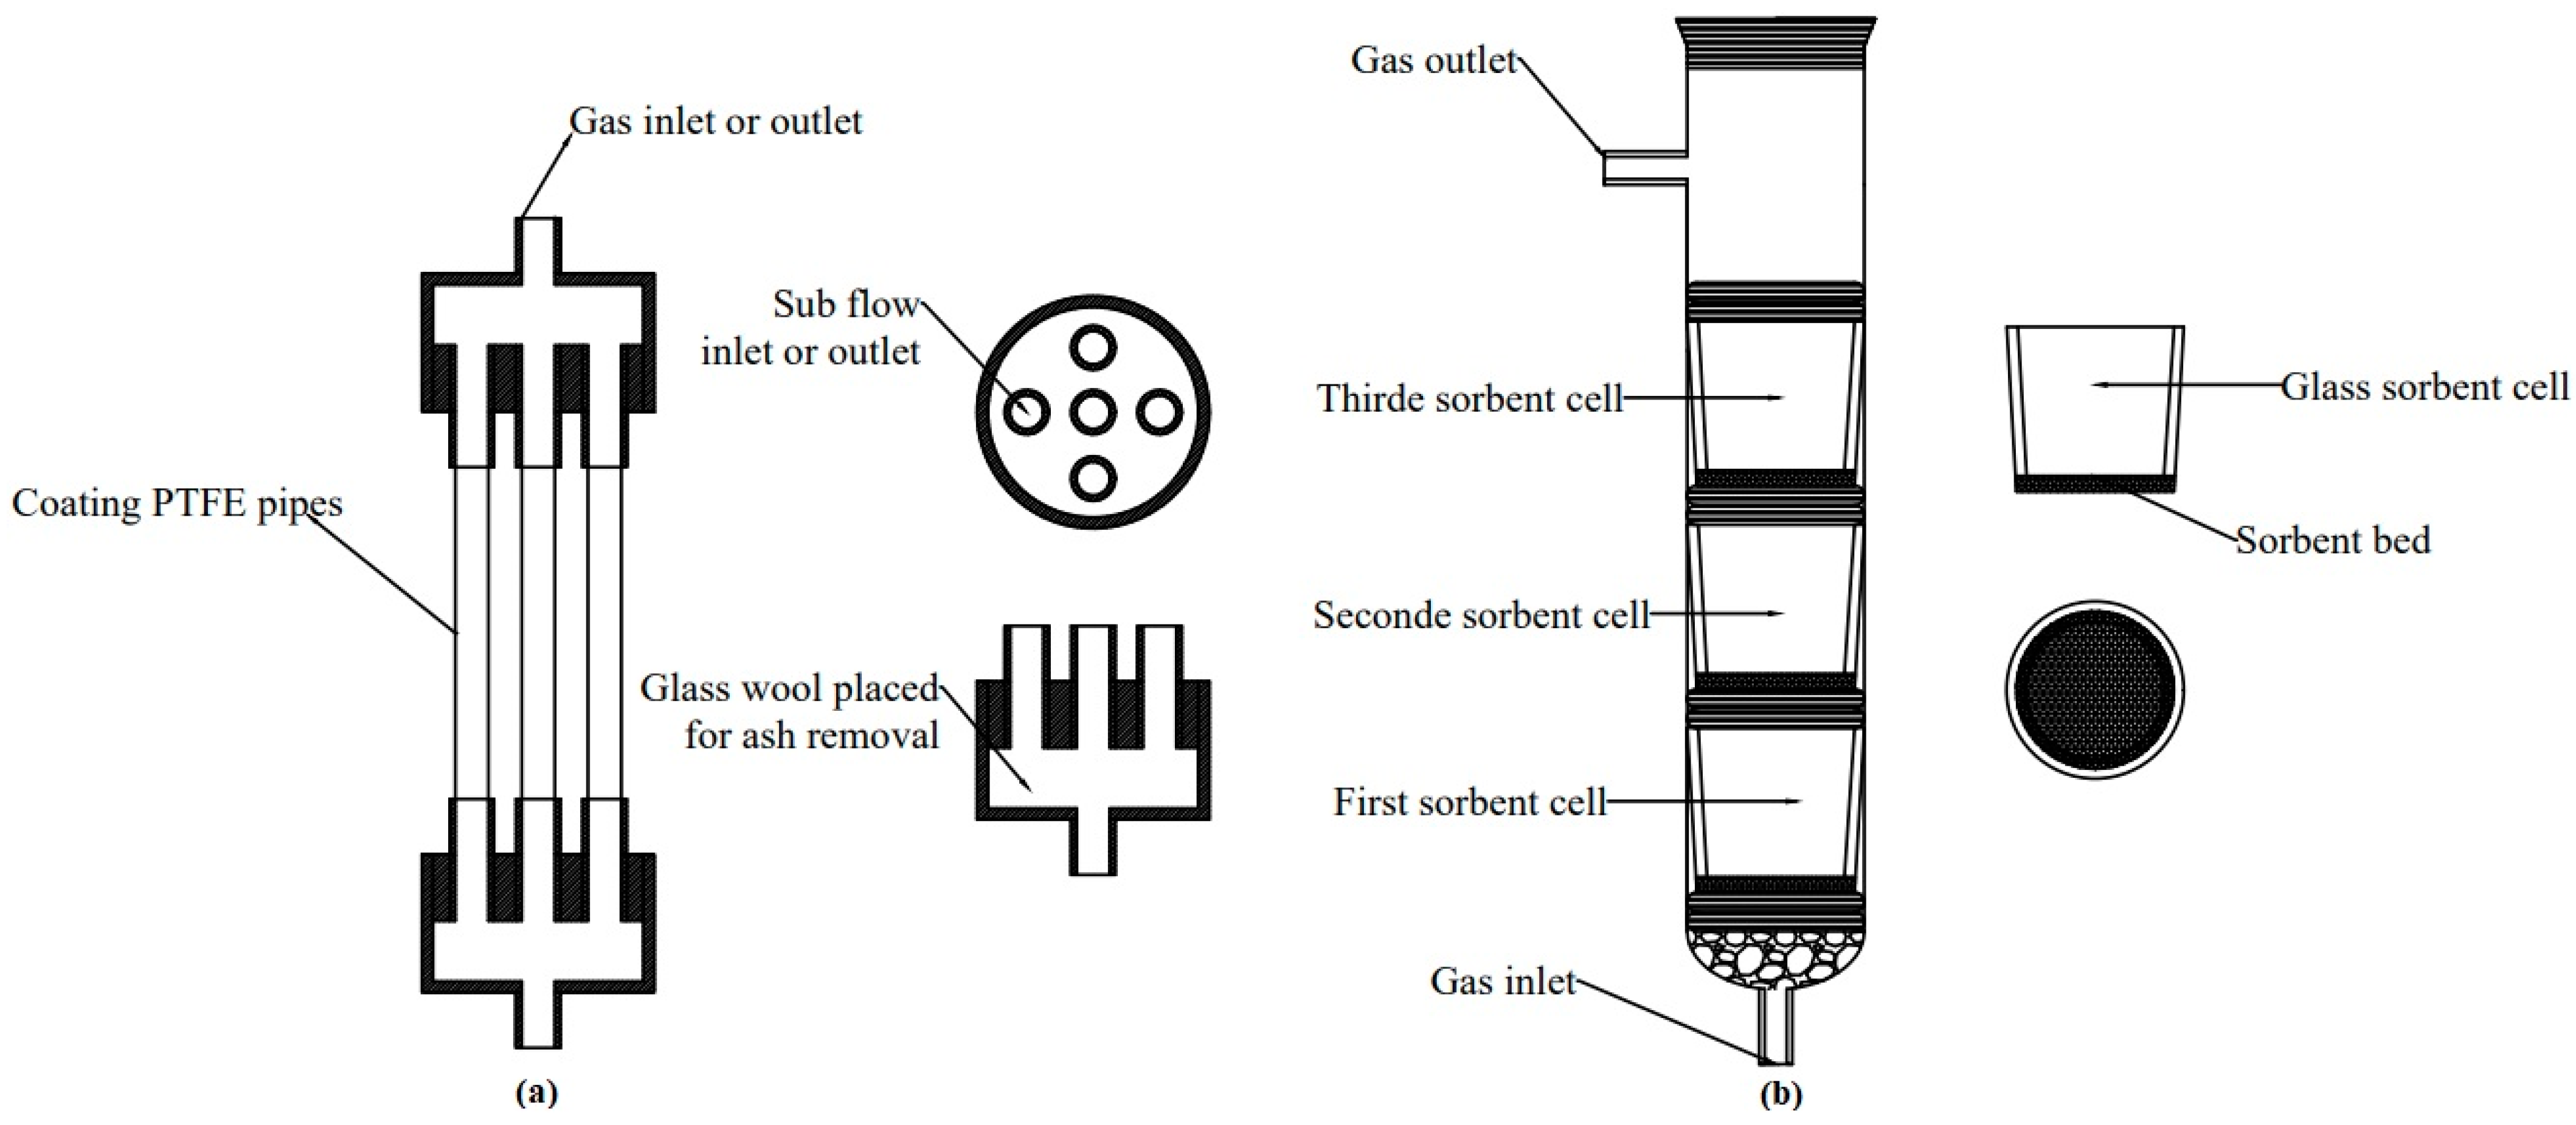
The idea of the prototype multiple-pipes reactor (MPR) was based on the Bernoulli equation, assuming steady-state flow conditions. The constant gas flow is divided into multiple sub-streams within the MPR, which consists of two cylindrical heads connected by PTFE pipes (Figure 1a). The one-hole side of each head is used as the gas outlet or inlet for the main gas stream, while the five-hole side is used to split the stream into sub-flows. In the one-pipe module MPR, unused tubes are plugged. However, the five-pipe module MPR consists of three coated pipes and two empty pipes (three-pipe MPR), which reduce the velocity of the sub-streams. Therefore, the velocity of gas passing through MPR pipes is regulated by a number of sub-streams, and the flow conditions are described by Equation (1):
where and are the inlet and outlet cross-sectional areas at the cylindrical heads, respectively, is the cross-sectional areas of the pipes, and are the inlet/outlet velocities at the cylindrical module, respectively, and is the velocity inside the reactor pipes, while N is the total number of PTFE pipes used in the MPR.
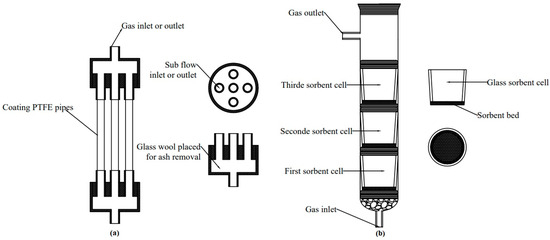
Figure 1.
The schemes of the prototype MPR (a) and the VGR (b), used in experiments.
Figure 1a shows the front view of a five-pipe module MPR and the top view of a cylindrical head. The diameter of the inlet and outlet head tubes matched that of the sub-flow tubes. The core part of the MPR module, the pipes, are made of a durable and cost-effective PTFE material, providing a large internal surface area for sorbent deposition. The sorbent is deposited as a thin layer without affecting the internal diameter of the pipes or changing the velocity of sub-flows. The glass wool can be placed inside a cylindrical module to act as a filter, removing any unexpected dust from the exhaust gas.
The vertical glass reactor (VGR) was constructed by the AGH scientists [24]. It consists of a 3.2 cm-diameter glass cylinder and a maximum of three 2.6 cm-diameter glass vessels (Figure 1b). The glass vessels serve as sorbent cells and are separated by O-rings. Non-reactive chips (quartzite or barite) are placed at the bottom of the glass cylinder to hold the first layer of O-rings and the first glass cell. The selected sorbent is placed onto a glass-sponge sinter inside each vessel. The gas flows upstream, perpendicular to the sorbent bed (Figure 1b). The simulated gas then passes through non-reactive chips and glass beds, where it comes into contact with sorbent particles or the structure of a solid sorbent. During this process, Hg(0) is adsorbed by the sorbents through physisorption/chemisorption processes, depending on the temperature of the process.
The experimental procedures applied in VGRs for conducting tests are the same as those used in MPRs. VGR has conducted Hg(0) removal tests without any interferences and provided reliable data on Hg(0) capture by sorbents in the exhaust gas [4]. Therefore, the selected sorbents were tested by VGR, and the data were used as a reference to compare the results from the experiments with MPRs. The MPR size was designed to adjust our experimental set-up (Figure 2). The details of dimensions of MPRs are presented in Table 1.
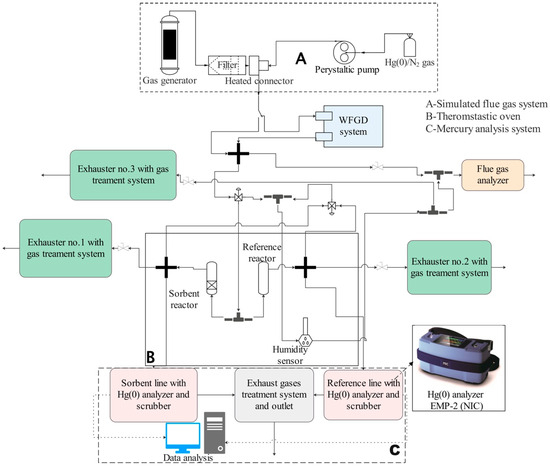
Figure 2.
The scheme of the experimental set-up (A—simulated flue gas system; B—thermostatic oven; C—mercury analysis system).

Table 1.
Experimental conditions for two kinds of tested reactors.
The selected sorbents were copper sulfide (CuS) and copper oxide (CuO), which have proven to be effective in removing mercury from both simulated gas and wastewater. The reference articles have shown that CuS and CuO are highly effective in capturing mercury [26,27,28], as well as removing other heavy metals and organic compounds [28,29,30].
CuS nanoparticles showed a decomposition rate of 60–100% for various organic compounds [31,32]. The CuO sorbents were highly effective in removing heavy metals, with a 99% removal rate for Cr(VI), 97% for Pb(II), 80% for RY-145 dye, and 86% for BV-3 dye [29]. The assumed mechanisms of metal oxide capturing of Hg(0) from flue gas are described by Equations (2)–(5) [28,33,34].
The assumed mechanisms of copper sulfide capture of Hg(0) from flue gas are described by Equations (6)–(8) [32].
2.2. A Mercury Capture Efficiency Analysis System
All experiments were performed under well-controlled parameters, with the exception of the different reactor settings (Table 1).
The concentration of Hg(0) in a gas stream was detected using CV-AAS methodology. The analysis system was redesigned from previous studies set-ups on mercury capture chemical analysis [35,36]. To test the multiple pipe reactor and selected sorbents, the system consisted of three main parts (Figure 2):
- -
- The flue gas and elemental mercury supplying system (Part A);
- -
- The laboratory-scale thermostatic system for testing materials (Part B);
- -
- The elemental mercury analysis system (Part C).
Part A: The laboratory-scale gas generator (Section 2.3) produces a simulated flue gas to test materials and reactors. The flue gas is cleaned of fly ash using a heated laboratory-scale titanium filter. Elemental mercury is supplied from a 10 L Tedlar bag containing a mixture of Hg(0) in N2. The concentration of Hg in the bag is approximately 45 µg/m3. A peristaltic pump delivers a mixture of gases to the thermostatic tee connector behind the titanium filter, where it is mixed with the cleaned simulated flue gas. The concentration of Hg(0) can be precisely regulated.
Part B: The thermostatic oven temperature is set at 125 °C for the entire series of experiments to prevent moisture and mercury condensation inside the pipelines. The gas mixture is divided into two streams, reference and sorbent lines, upon transfer into the thermostatic oven. The MPRs are horizontally placed inside the thermostatic oven. The sorbent line consists of a reactor with coated PTFE pipes, while the reference line consists of a reactor with the number of non-coated pipes (Figure 2). In the multiple pipe set-ups, always five PTFE pipes of the same size are used (Figure 1a). For instance, in the three-pipe MPR, two pipes are empty and three are covered with a sorbent layer. The control VGRs are vertically placed inside the thermostatic oven. The reference VGR contains the same number of glass vessels as the one with sorbent beds.
Part C: Two gas streams pass separately through a scrubber and a mercury analyzer. The scrubber system, WLE-8 (NIC), contains 10% KOH solution in two vessels and has a final cooling cell. It removes acidic gases and reduces the temperature, condensing moisture from the simulated flue gas before it reaches the EMP-2 (NIC) elemental mercury AAS gas analyzer.
Additional equipment: The PTFE pipes with 6/4 mm outer/inner diameters are used to connect individual elements and reactors. Teflon tubes, if outside the thermostatic oven, must be wrapped with heating tapes to prevent flue gas condensation and mercury adsorption. A laboratory-scale wet flue gas desulfurization (WFGD) system can be applied on a bypass of the main gas stream just behind the heated tee connector. CaCO3 slurry is used in the WFGD system to reduce SO2 from the simulated flue gas. The experimental set-up has three exhaust fans connected to its sides.
The procedure for testing the MPR and VGR involves the following steps:
- A.
- Preparation and cleaning of the experimental system and reactors at a temperature of approximately 150 °C for about 1.5 h. This step removes most of the mercury residue inside the pipelines and reactors, and ensures that the readings from the mercury analyzers are close to or below 0.4 µg/m3 and stable;
- B.
- Loading of Hg(0) into the system. The introduction of Hg(0) into the system takes approximately 20–30 min, during which the mercury concentration is adjusted and stabilized;
- C.
- Activation of the fuel loader for 40–60 min to generate the simulated flue gas, which is mixed with Hg(0); An optional procedure, (C-1), may be performed, in which the laboratory-scale WFGD system is run for 20–30 min to remove SO2 from the simulated flue gas. The purpose of this test is to measure the impact of SO2 on sorbents;
- D.
- The fuel loader is turned off and only a Hg(0)/N2 mixture is loaded into the system for 20–30 min;
- E.
- The final observation of the system response and sorbent activity after Hg(0) is switched off and the temperature is lowered for 30–60 min.
2.3. A Mobile Laboratory Flue Gas Generator and Gas Analysis
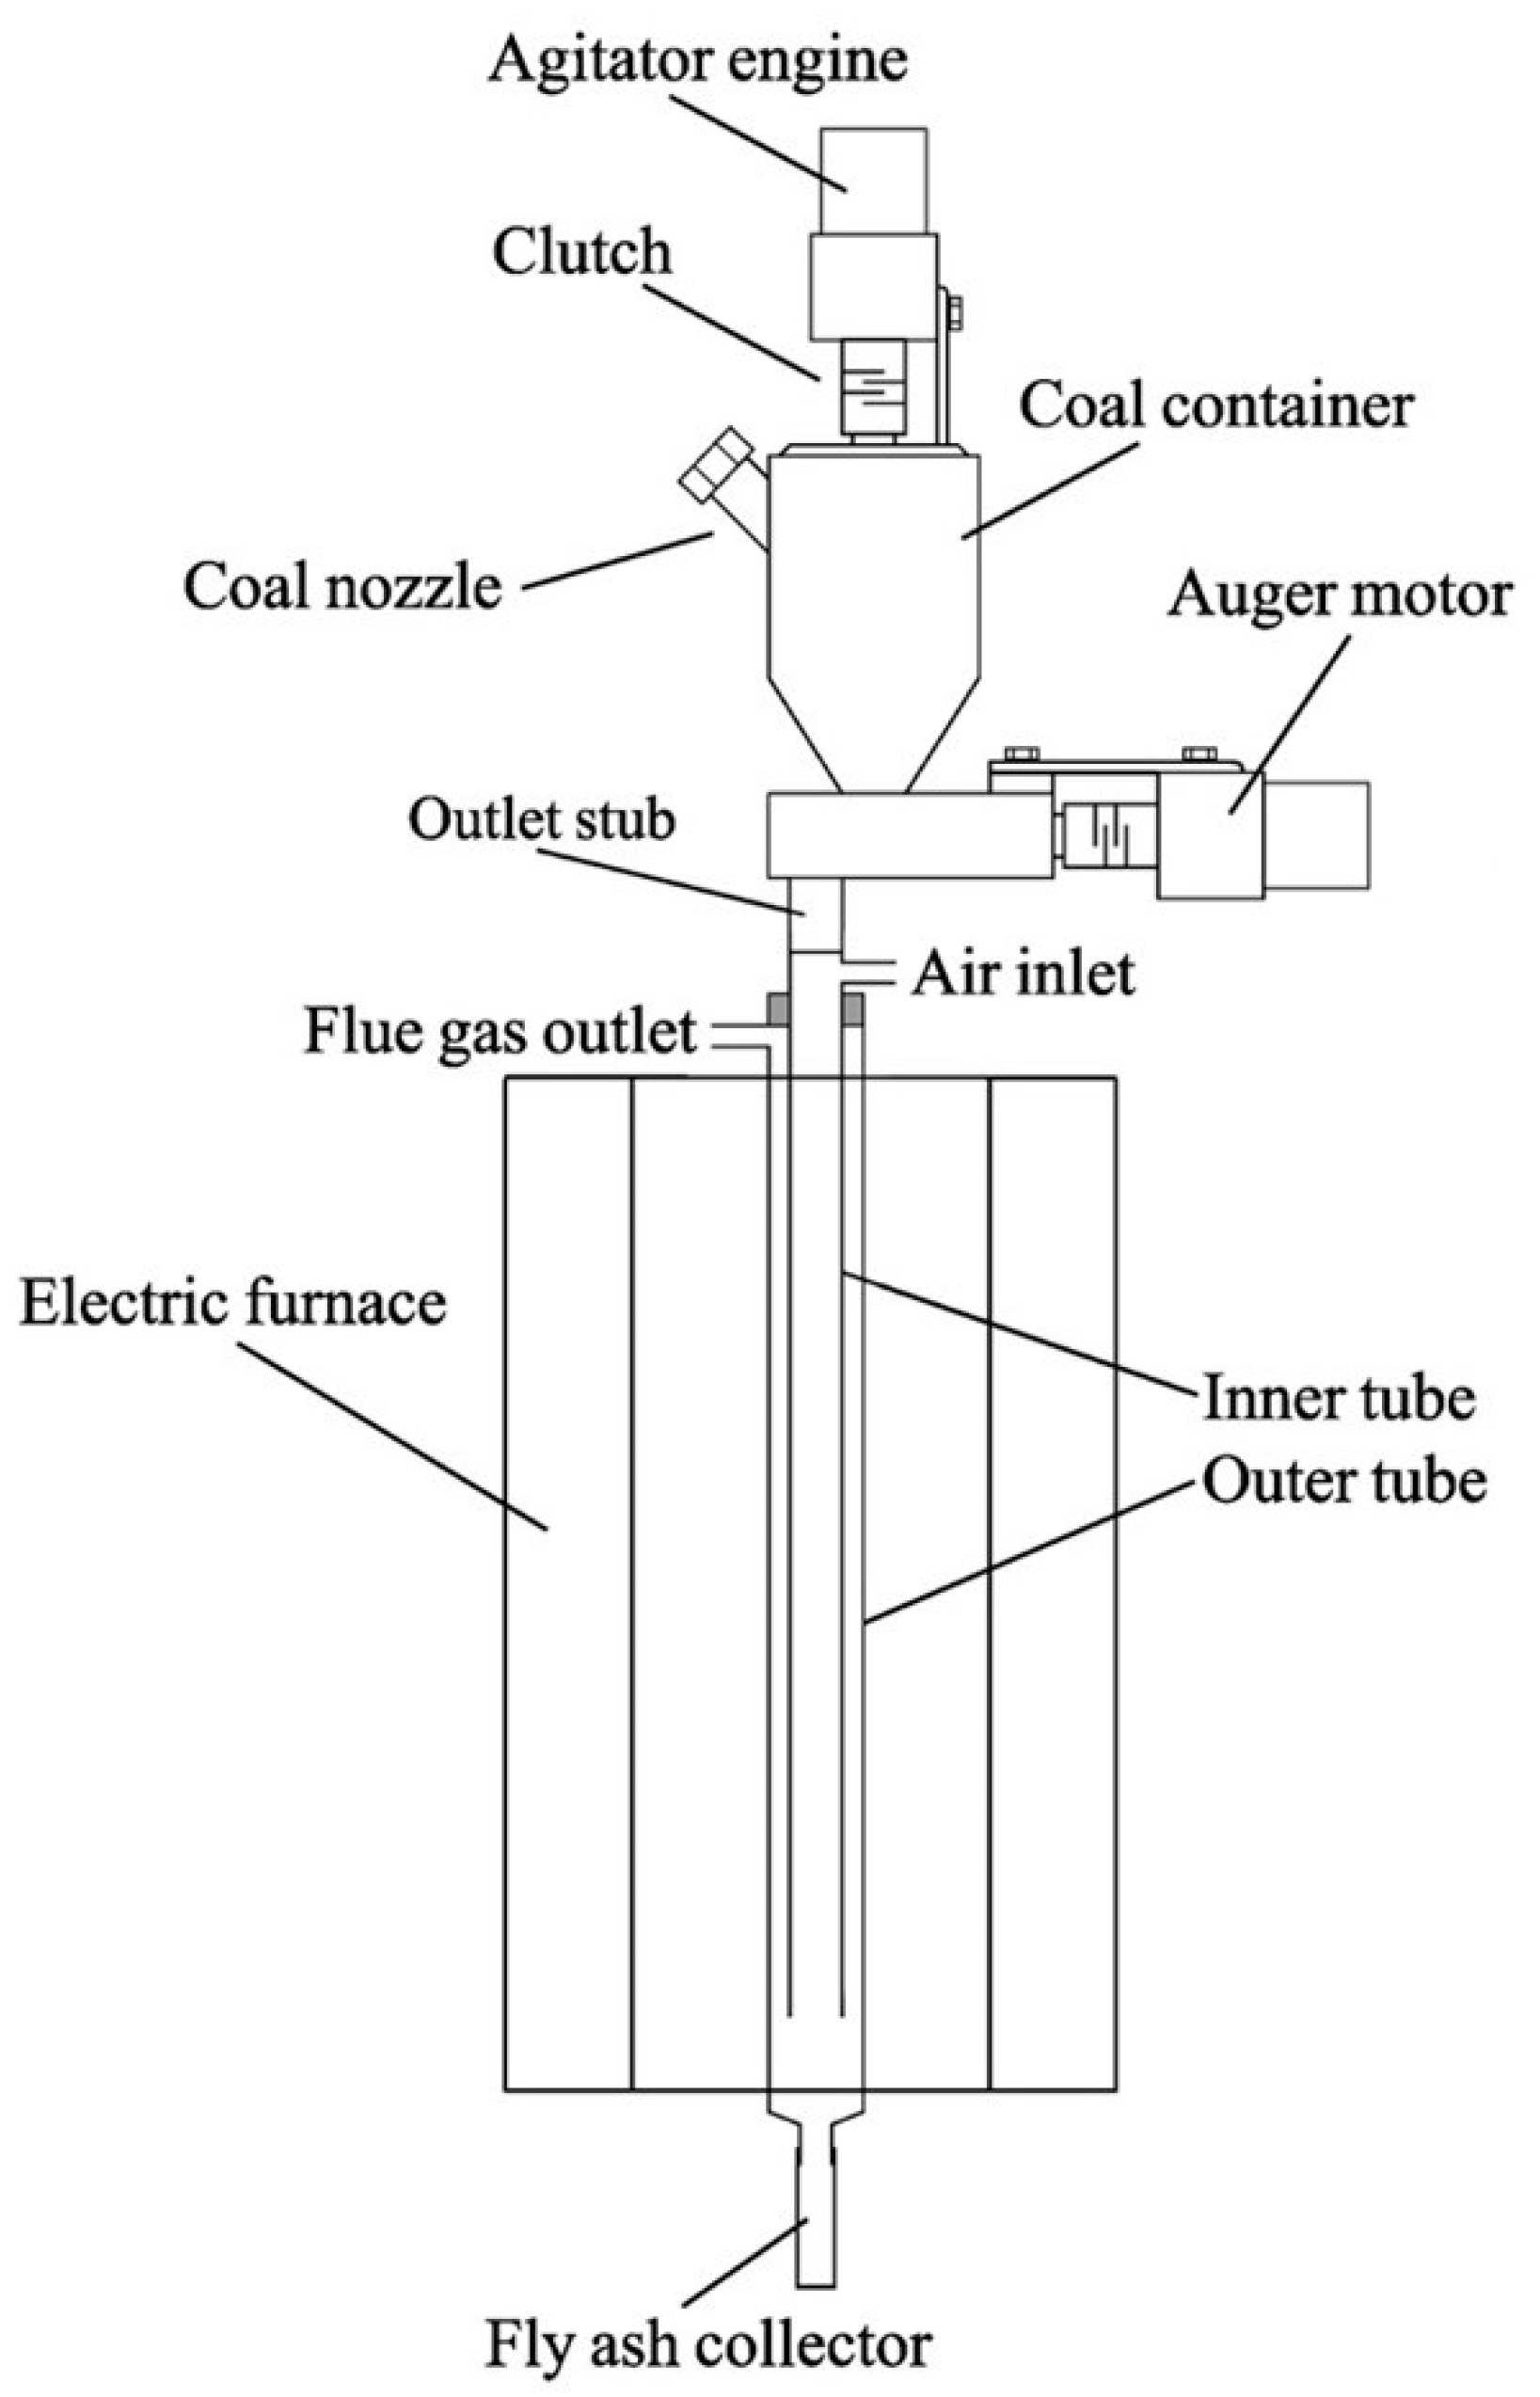
The system mentioned above relied heavily on a mobile self-constructed laboratory flue gas generator. The generator, shown in Figure 3, facilitates research on the purification of flue gases produced by the combustion of solid fuels. The compact size and flow regulation via a detector and/or exhaust fan (usually around 1 dm3/min) are its primary advantages. The generator burns only a small amount of coal, approximately 15 g/h of bituminous coal, to achieve a λ of around 1.2. This aligns with the recommendations of green analytics, as the analytical system uses 100% of the flue gases and no excess flue gases are produced.

Figure 3.
The scheme of the mobile laboratory flue gas generator.
While the generator is running, an agitator prevents a void in the bottom of the coal hopper. Coal can be added through the spigot on the container. The coal is then transported by a screw to the outlet stub pipe and falls into the internal quartz tube of the combustion chamber. The combustion chamber is designed with a nozzle located in the upper part of the inner quartz tube to allow the air required for burning the coal to enter. The coal falls down the chamber and it is burnt, with larger particles collected in the receiver and smaller ones lifted up in the outer tube. This design allows for a smaller combustion chamber compared to typical systems.
The optimal temperature inside the combustion chamber during the generator’s operation is 900 °C, but it can be regulated. The generator can be powered by both bituminous and lignite coal, but it is necessary to use coal with a grain size between 0.05 and 0.2 mm for proper operation. Research has shown that this flue gas generator is a reliable and useful device.
Krzywanski et al. (2013) [37] found that an excess of O2 supply results in simulated gas from lignite containing lower concentrations of CH4 and hydrocarbons [38], in contrast to biomass pyrolysis gas the composition of which was statistically presented for modeling purposes in [39].
The concentration and composition of flue gas are determined using the Testo 350 (Testo) flue gas analyzer. The experimental set-up has three exhaust fans connected to its sides. One of their duties is to balance the total flow rate of the entire system, when the Testo 350 system is turned on or off.
Table 2 presents the main components and concentrations of the simulated gas produced by the laboratory flue gas generator. There are two separate measurements of flue gas emissions from bituminous and lignite coal generation. The flue gas resulting from bituminous coal is similar to the flue gas produced from the combustion of a 5–15% biomass blend in power plants before the removal of SO2 and NOx (raw flue gas). Krzywanski et al. (2013) [37] presented the flue gas composition resulting from the combustion of blended fuel (lignite and biomass). The concentration of CO ranged from 1000 to 5000 ppm, CO2 ranged from 16.2–17.2%, NO ranged from 200–550 ppm, and SO2 ranged from 130–210 ppm (after desulphurization). As the biomass blending increased, the concentration of SO2 and NOx decreased from almost 200 ppm to 100 ppm and from 350 ppm to 150 ppm, respectively [40].
Table 2.
Mean concentrations of the main simulated flue gas components from bituminous and lignite.
The simulated gas had a flow rate of 108 L/h, which was generated by two mercury analyzer pumps (2 × 24 L/h) and two exhaust fans (2 × 30 L/h). The flow was then divided into two 54 L/h streams that passed through reference and sorbent reactors. The fuel loading during this series of experiments was approximately 21 g/h, using commercial lignite. The gas generator temperature was set to 890 °C.
2.4. Synthesis of Sorbents
In our laboratory, we synthesized granulate form and CuS/CuO thin layer coatings. We precipitated CuSO4 solution with Na2S or KOH solutions. All chemicals used were of pure or ultrapure grades. The conductivity of the deionized water (DW) was 0.07 μS/cm.
2.4.1. Granulate Form Sorbent Synthesis for VGR Experimental Tests
The process for synthesizing CuO sorbents is described below:
- (1)
- In total, 15.7 g of CuSO4·5H2O was dissolved in 150 mL of DW, and 11 g of KOH was dissolved in 100 mL of DW;
- (2)
- The CuSO4 solution was stirred at 250–300 rpm and heated to around 60 °C. Then, the KOH solution was added, drop by drop, and stirred for another 2 h until the reaction was completed;
- (3)
- The product was filtered, rinsed with DW, and dried at room temperature;
- (4)
- After the drying process, the synthesized sorbent was ground into small granules (1–3 mm), heated in an oven at 110 °C for 90 min to remove moisture, and stored in a desiccator.
The preparation of the CuS granulate sorbent followed these steps:
- (1)
- In total, 15.7 g of CuSO4·5H2O was dissolved in 150 mL of DW, and 16 g of Na2S·9H2O was dissolved in 100 mL of DW;
- (2)
- The CuSO4 solution was stirred at 250–300 rpm and heated it up to around 60 °C. Then, it was titrated with Na2S solution drop by drop and stirred for 2 h until the reaction was completed;
- (3)
- The product was filtered and rinsed with DW;
- (4)
- The solid residue was dried at room temperature;
- (5)
- The product was ground quickly to break larger particles into small granules (1–3 mm), heated it in an oven at 110 °C for 90 min to remove moisture, and stored in a desiccator.
2.4.2. Synthesis of Thin Layer Coatings Inside Pipes
Two methodologies (A and B) were used to synthesize the coating sorbents (CuS or CuO) inside PTFE pipes. The difference between Methodologies A and B was the sulfur source of the synthesized CuS and the type of phases in which the reaction was performed.
Methodology A produced the CuS sorbent coating using the following procedures:
- (1)
- 15.7 g of CuSO4·5H2O was dissolved in 150 mL of DW, and 16.0 g of Na2S·9H2O was dissolved in 100 mL of DW;
- (2)
- Using two syringes, the CuSO4 and Na2S solutions were transferred into the selected pipes at room temperature;
- (3)
- CuSO4 and Na2S solutions were mixed inside each pipe several times;
- (4)
- The prepared pipes were dried at room temperature and then rinsed gently with DW;
- (5)
- The prepared pipes were placed horizontally in the oven at over 110 °C to remove moisture and stored in a desiccator.
To obtain the CuO coating on PTFE pipes, Na2S·9H2O was substituted with 11.0 g of KOH, and the above procedures were repeated.
In Methodology B, CuS was used to coat the pipes by reacting CuSO4 solution with H2S gas instead of Na2S solution using the following procedures:
- (1)
- The PTFE pipes were immersed in a CuSO4 solution in flat glassware (e.g., Petri dish);
- (2)
- A total of 3.0 g of FeS was placed in an Erlenmeyer flask;
- (3)
- The Erlenmeyer flask was poured with 200 mL of 10% solution of H2SO4 to produce H2S gas. The gas was transferred to a Tedlar bag using a peristaltic pump;
- (4)
- H2S gas was directed into the PTFE pipes, where it reacted with CuSO4 solution;
- (5)
- The coated pipes were removed from the Petri dish and placed them in an oven heated to 110 °C to remove moisture;
- (6)
- All the pipes were rinsed with DW, dried again at 110 °C, and stored in a desiccator.
The differences between A and B were the drying time and residues inside the pipe. In Methodology A, CuS completely precipitated inside the pipes, and the coated pipes were dried at room temperature or at a low oven temperature setting (30–50 °C). Otherwise, CuS particles would blow off from the pipe surface with water vapor. During the rinsing process, DW was gently pumped into the coated pipes to remove the residues (Na+ and SO42− ions).
Methodology B led to a shorter drying time and stronger attachment of CuS to the internal surface of the PTFE pipes. There was no risk of blowing off from the pipes at high temperatures (over 100 °C). The residue (SO42− ions) could be efficiently removed by fast-pumping DW into the coated pipes.
3. Results
In these experiments, we used two reactors, VGR and MPR. The redesigned Hg(0) capture analysis system was used to test the selected sorbents and analyze their efficiency in Hg(0) removal. Table 1 shows details on the reactors.
3.1. The Contact Area and Contact Time between the Simulated Gas and the CuO or CuS Sorbents in VGRs and MPRs
Table 1 shows the main experimental conditions. For the VGR setting, 200 mg of either granulated CuS or CuO was placed at the bottom of the glassy bed, covering the entire area. The surface area of the sorbent bed, , and the velocity of the simulated gas, , passing through the sorbent bed can be calculated by Equations (9) and (10):
where is the radius of the sorbent bed, while Q is the total flow rate in either the reference or sorbent reactor. The radius of the VGR cell is 1.3 cm. In the series of experiments, the flow rate was set at 54 L/h for both the reference and sorbent reactors (Table 1). The surface area of the sorbent bed, , was 5.31 cm2, and the velocity of the simulated gas passing through the sorbent was 0.028 m/s. Therefore, the contact time between simulated gas and the selected sorbent in VGR can be calculated by Equation (11):
where is the thickness of the selected sorbent layer. The thickness of the sorbent layer is adjusted to a limited extent based on the vessel height and the amount and form of the selected sorbent. In this case, was 1 mm for both 200 mg of CuS and CuO, resulting in a relatively short contact time of 0.035 s.
Equation (1) relates the velocity of simulated gas, , passing through selected PTFE pipes to the type of MPR module. Two modules of the MPR were used in these experiments: a one-pipe module and a five-pipe module. The internal radius of the selected PTFE pipe was 2 mm. Therefore, the cross-sectional area, , of the selected pipe can be calculated using Equation (12):
where is the internal radius of the selected pipes. The of the selected PTFE pipe was 0.126 cm2. Therefore, the velocity inside can be calculated using Equation (13):
Therefore, the velocity of the simulated gas passing through the selected pipes in the one-pipe module MPR was 1.190 m/s, while the velocity of the simulated gas passing through each selected pipe in the five-pipe module MPR was 0.239 m/s. The contact time between the simulated gas and the selected sorbents in the MPR can be calculated using Equation (14):
where n is the number of coated PTFE pipes applied in the selected MPR module, and is the length of the selected sorbent coating along the PTFE pipe. The regulation of the sorbent coating area is limited due to the sorbent synthesis process. In the MPR experiments, the CuS and CuO coatings were 5 cm and 3.5 cm in length, respectively. As a result, the contact time in the one-pipe module MPR with the CuS or CuO coating was 0.04 s and 0.03 s, respectively.
The total coating area is correlated with the internal surface of the selected pipe. The coating area, , of the selected sorbent inside the PTFE pipe can be calculated using Equation (15):
The area coated with CuS and CuO inside the PTFE pipes was 6.28 cm2 and 4.39 cm2, respectively. Thus, in the five-pipe module MPR with three coated pipes (three-pipe MPR), the total contact area of CuS and CuO was 18.84 cm2 and 13.19 cm2, respectively.
The MPR construction allows for regulation of the contact time between the simulated gas and coating sorbent by adding more coated pipes into an MPR module. The five-pipe module MPR was used to pass the simulated flue gas, with either three CuS or CuO coated pipes. This resulted in a t(MPR) of 0.63 s and 0.44 s, respectively. Table 3 presents details of the contact time and contact area in VGRs and MPRs.
Table 3.
The contact time and contact area in different reactors’ constructions.
3.2. Laboratory Tests of the VGR and the MPR in the Simulated Flue Gas
During the tests (Stages B to D with the presence of Hg(0)), the simulated flue gas flow rate inside the reactor was 54 L/h for 100 min. Table 4 shows the average λ and mean concentration of the primary gas components in the simulated flue gas used for these tests.
Table 4.
Mean concentrations of the main simulated flue gas components, with WFGD switched on/off.
To ensure reliable results, we tested the MPR against the VGR under the conditions presented in Table 1. The regulated mercury concentration for this experiment was 30.0 ± 6.2 µg/m3. A total of 200 mg of sorbent was used both in the VGR and in the five-pipe module MPR with three coated pipes (three-pipe MPR). Table 5 shows the Hg(0) removal on CuO and CuS at different stages of the experiment in both the VGR and MPRs. The effectiveness of Hg(0) capture, , at different stages can be calculated using Equation (16).
where is the experiment start time, is the end time (t2 − t1 generally represents the time between Hg(0) loading in and removing from the system), and and are the Hg(0) concentrations in the reference and sorbent reactors at the specified time.
Table 5.
The effectiveness of Hg(0) capture [%] of specified sorbents in different reactors and at different stages.
The Hg(0) capture capacity () is the amount of Hg(0) captured by a specific mass of sorbent in a short term experiment. This value indicates the sorbent’s performance and effectiveness in capturing Hg(0) during first hours of interaction with a flue gas. It can be calculated using Equation (17):
where is the mass of selected sorbent, and Q is the total flow rate of simulated gas in the reactor.
In addition, there are two different Equations (18) and (19), which are used to calculate the mass of Hg(0) passthrough rate () and the mass of Hg(0) passthrough per mass of sorbent in a specified time range .
In the VGR set-up, 200 mg of CuO or CuS granules had a mean Hg(0) capture efficiency of 51% and 67%, respectively. The maximum Hg(0) capture efficiency was 62.2% for CuO (B: Hg(0) loading stage) and 85% for CuS (C: Hg(0)/simulated flue gas loading stage). The Hg(0) capture efficiency tended to decline with increasing the testing time in both CuO and CuS granules. It is important to note that small amounts of sorbent granules were used in the VGR were used, resulting in a thin bed.
In the one-pipe MPR set-up, the pipe covered with CuO or CuS removed an average of 24.4% and 59.4% of Hg(0) throughout the experiments, respectively. When the MPR set-up was changed from a one-pipe module to a five-pipes module with three coated pipes (three-pipe MPR), the average Hg(0) removal efficiency increased to 65.23% (by 268%) and 93.93% (by 158%), when using CuO and CuS, respectively. This indicates that the MPR set-up promotes Hg(0) capture efficiency. The five-pipe module MPR with three CuO or CuS coating pipes (200 mg of sorbent) captured 15.74 and 22.09 µg/mg of Hg(0), respectively. In the VGR experiment, it was 20.27 and 30.36 µg/mg, respectively (Table 5). The Hg(0) capture capacity depends not only on the reactor design and sorbent properties, but also on the quantity of sorbent, experiment duration, and Hg(0) mean concentration in each experiment. The mean concentration of Hg(0) varies between experiments.
The MPR construction provides a better gas–sorbent contact time and surface area to capture Hg(0) compared VGR. Despite a smaller capture capacity, the five-pipe module MPR divides the flue gas stream into five sub-streams, reducing the velocity. This is an advantage when a simulated gas or an actual flue gas consists of a high concentration of Hg(0), as the MPR is more efficient over a prolonged period of time.
Table 6 and Figure 4 show the rate of Hg(0) passing through [µg/g∙min] and the mass of Hg(0) passing through [µg] selected sorbents during entire experiments. In the initial Stage C (20–40 min), Hg(0) is loaded into the reactors without breaking through the sorbents. Subsequently, the breakthrough parameters rapidly increase in VGR and the one-pipe module MPR with CuO or CuS sorbents between 50 and 90 min. The mass of Hg(0) passing through the five-pipe module MPR with three CuO or CuS coated pipes increased slowly and was more stable up to the end (80–100 min) of the experiment (Figure 4). Initially, the mass of Hg(0) passing through the five-pipe module MPR with three CuO or CuS coated pipes was 51.8 µg/g∙min and 1.5 µg/g∙min, respectively. By the end of the experiments, it was 103 µg/g∙min and 47 µg/g∙min, respectively. In contrast, the amount of Hg(0) that passed through the CuO and CuS beds in the VGR was much higher, at 377.8 µg/g∙min and 305.8 µg/g∙min, respectively (Table 6).
Table 6.
The mean Hg(0) passthrough rate in selected sorbents, and within each 20 min of experiments.
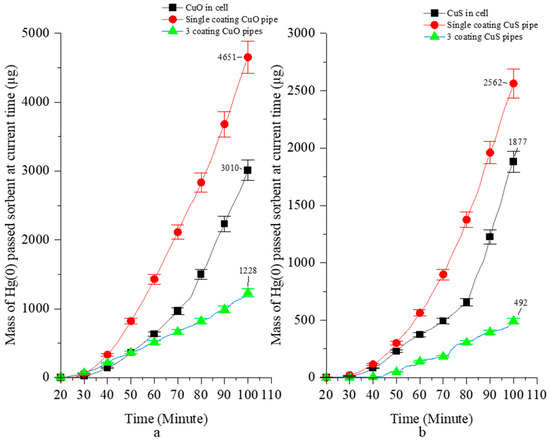
Figure 4.
The current time of total mass of Hg(0) passed through the CuO (a) and CuS (b).
After 100 min, the amount of uncaptured Hg(0) was 3010 µg in VGR, and 4651 µg (one-pipe MPR) or 1228 µg (three-pipe MPR) in the MPR setting with CuO sorbent. In the VGR with the CuS sorbent, the amount of uncaptured Hg(0) was 1877 µg. In the MPR, it was 2562 µg (one-pipe MPR) or 492 µg (three-pipe MPR) (Figure 4).
During the experiments, the Hg(0) removal was affected by the presence of SO2 in the simulated gas when the CuO sorbent was used in both VGR and MPR. The Hg(0) capture efficiency in MPRs increased from 24.8% to 45.4% (one-pipe MPR) and from 77.3% to 78.2% (three-pipe MPR), respectively, when the WFGD system was activated. CuO is an excellent sorbent for capturing both mercury and SO2 [41,42]. These two pollutants compete with each other to adsorb onto the surface of CuO. The presence of 2000 ppm of SO2 in the simulated flue gas decreased the efficiency of Hg(0) removal from 90% (in the simulated gas without SO2) to 50% [41]. This is because SO2 reacted with surface oxygen, hindering Hg(0) oxidation [43]. Additionally, SO2 reacted with the active sites on the surface of the CuO sorbent, forming thermally stable CuSO4, which blocked Hg(0) adsorption [42,44]. The assumed chemical reaction between SO2 and CuO was described by Equation (20) [44].
In contrast, when CuS coating pipes were applied without WFGD, the capture rate of Hg(0) was stable from Stage B to Stage D. The efficiency of Hg(0) capture did not significantly change and was around 90%. Similar results were obtained by other research teams, indicating that the high concentration of SO2 in simulated flue gas did not significantly affect CuS during Hg(0) removal [10,32].
The sorbents’ morphologies were detected using field emission-scanning electron microscopy (FE-SEM). The SEM images (Figure 5a,b) display the CuO and CuS particles collected from the pipes’ coating. These images show the sub-microsphere morphology of CuO and CuS grains with visible and rich pore structures. The morphology of CuO (Figure 5a) is similar to that of CuS (Figure 5b). The Hg(0) capture efficiencies of the CuO sorbent were lower than those of the CuS sorbent in the experiments. This may be also due to KOH crystals remaining on the CuO surface in a thin layer form (Figure 5a), which blocks the sorbent and its active sites. The EDS results indicate that K atoms were deposited onto the CuO grains (Table 7), possibly due to incomplete rinsing after CuO synthesis.
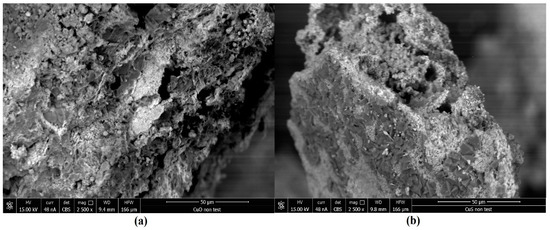
Figure 5.
SEM images of CuO (a) and CuS (b), magnification 2500 times.
Table 7.
The SEM statistic results of CuO and CuS.
3.3. Comparison of the Coating Methodologies A and B by Using MPR
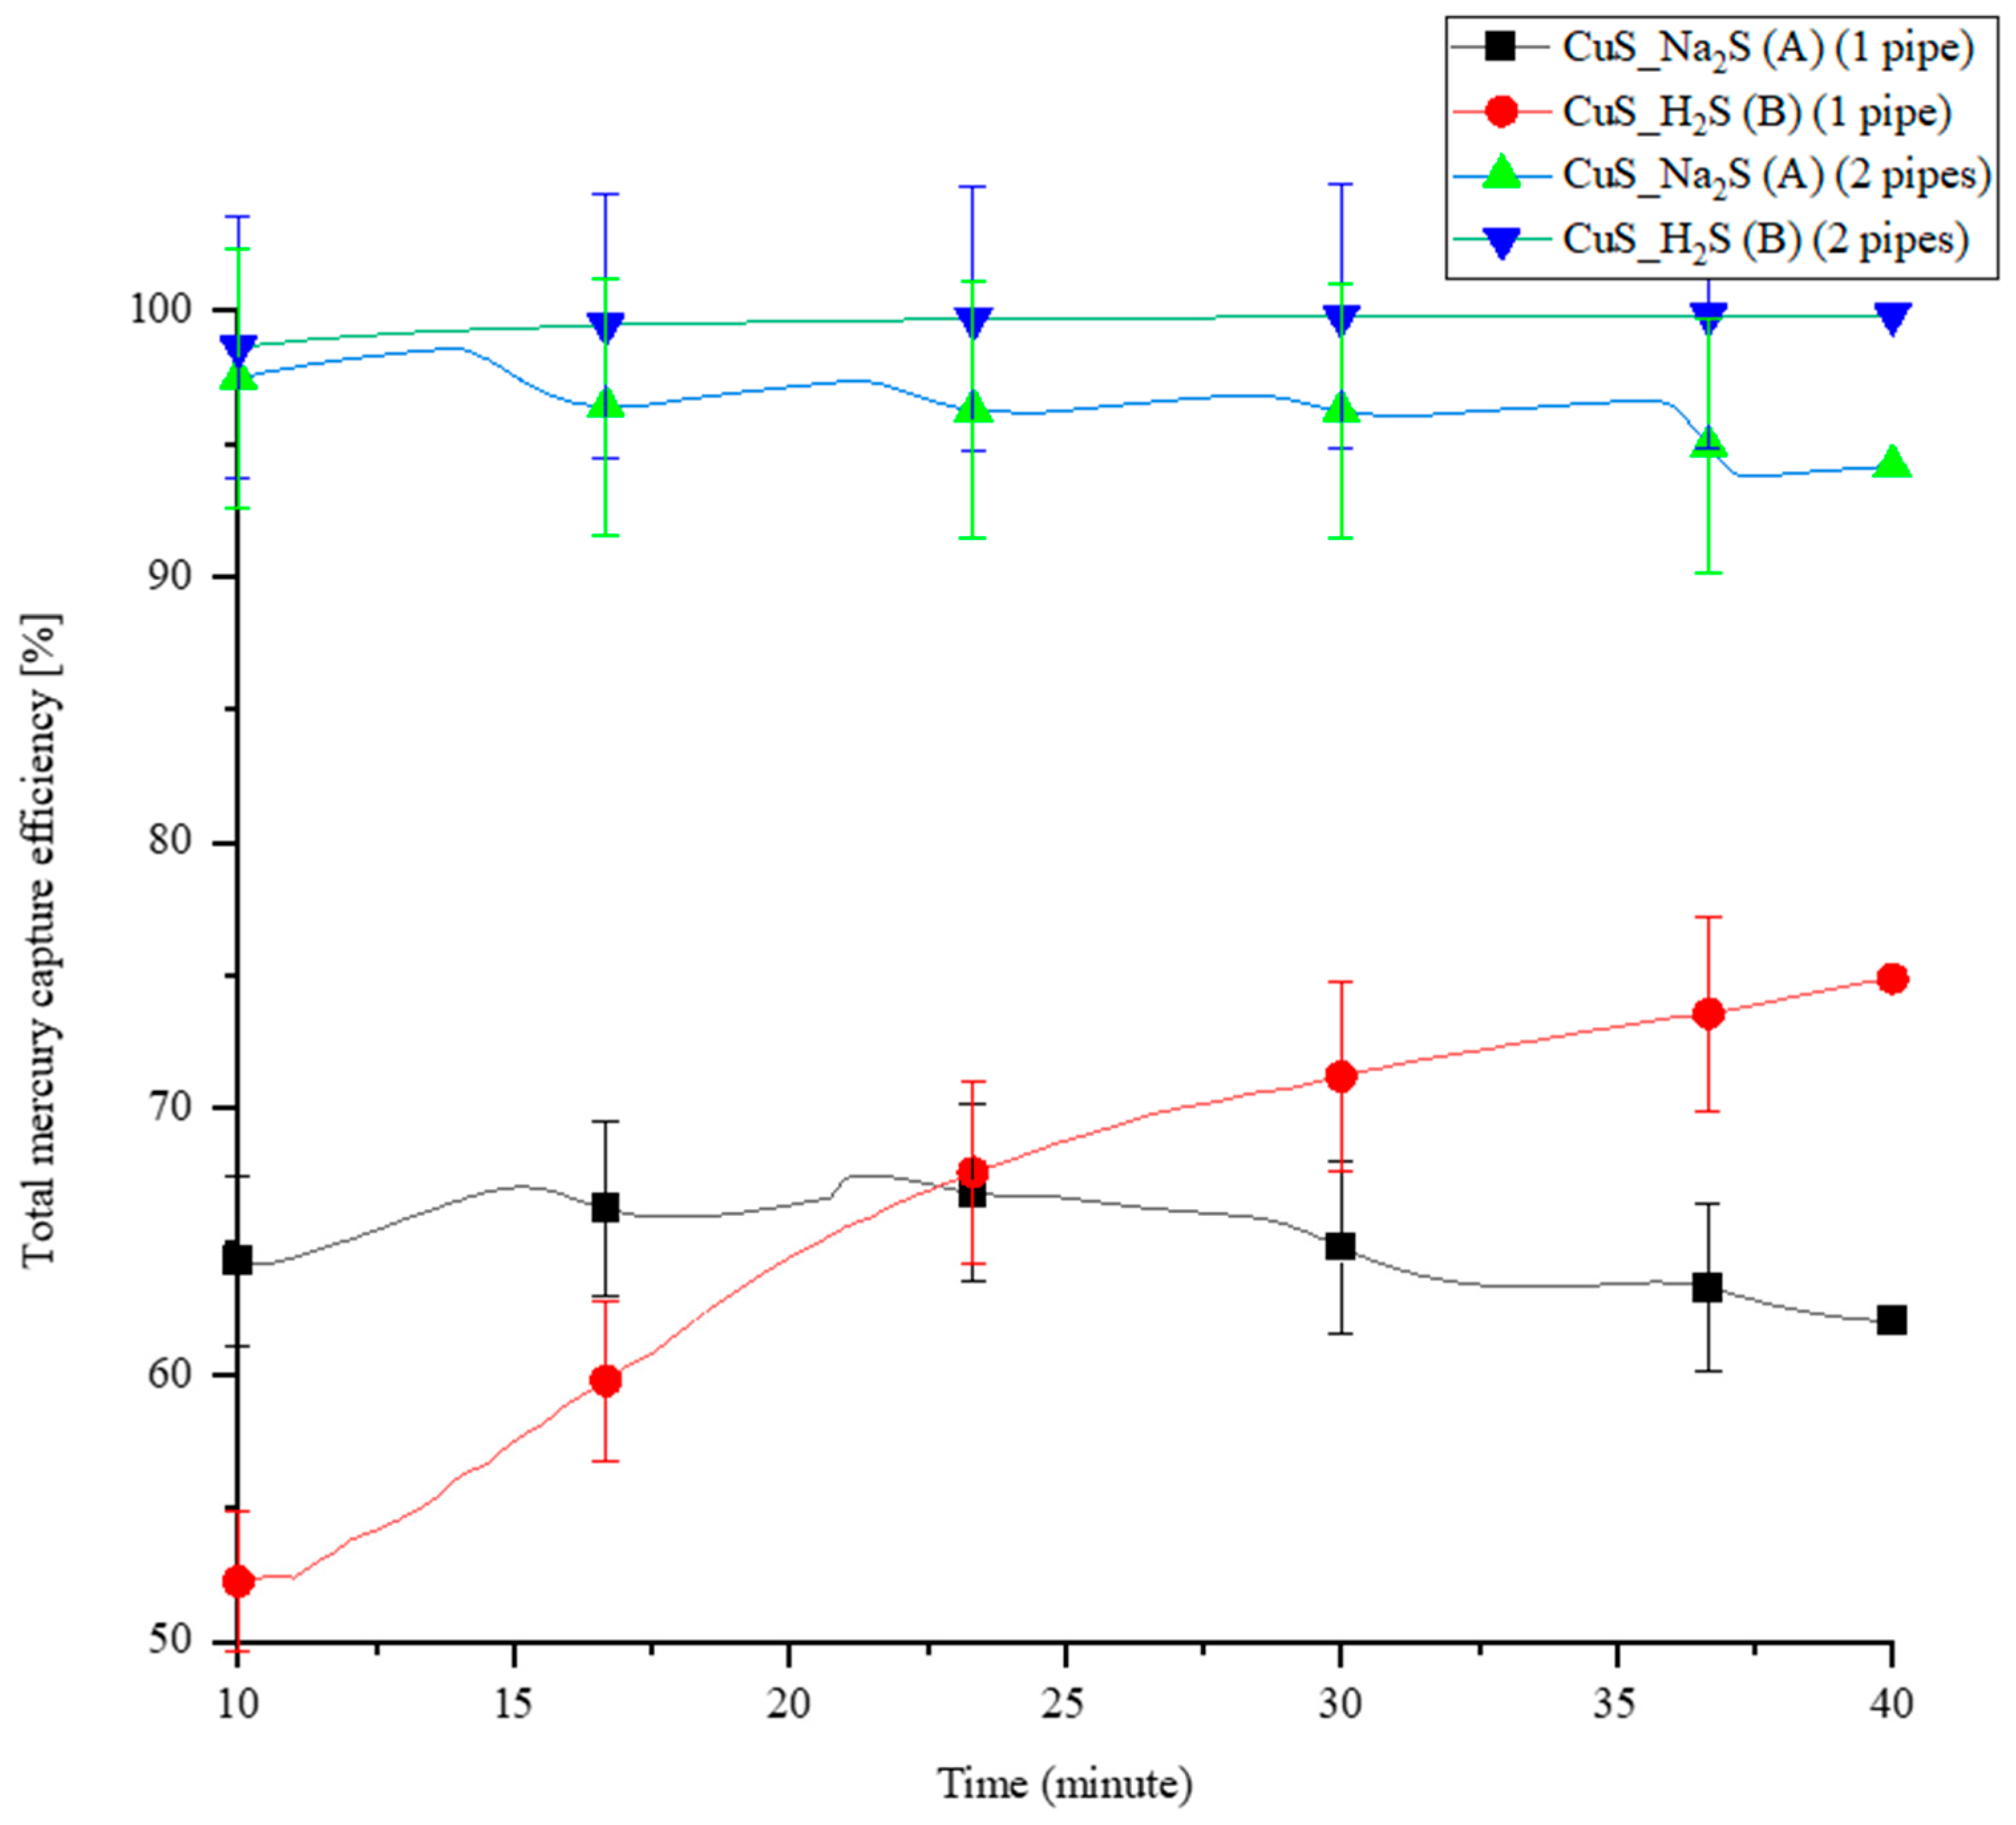
Two different methodologies were used to synthesize the CuS sorbent inside the PTFE pipes, as presented in Section 2.4.2: Methodologies A and B. A comparison experiment was conducted between the two methodologies in a five-pipe module MPR, with one coated pipe and two coated pipes. The total Hg(0) capture efficiency is shown in Figure 6. Initially, the captured efficiency of the one pipe coated with CuS_Na2S (Methodology A) is stable and higher than the pipe coated with CuS_H2S (Methodology B), but it flips after 23 min.
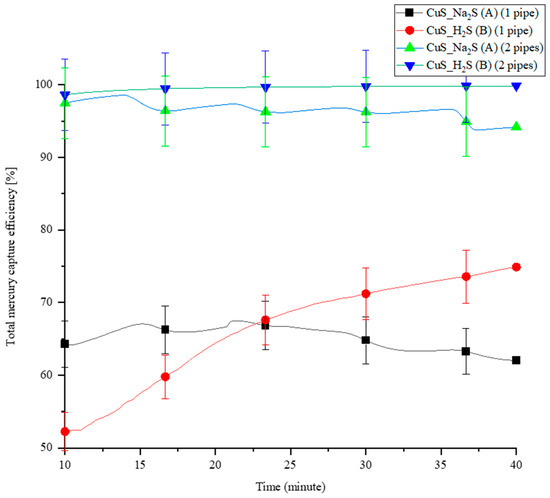
Figure 6.
The total Hg(0) capture efficiency of synthetized CuS for CuS_Na2S (A) and CuS_H2S (B) coating methodologies.
On the other hand, the capture efficiency of Hg(0) in the two-CuS-coating pipe configurations is similar and very high. In a continuous experiment, the total Hg(0) capture efficiency of CuS_Na2S-coated pipes gradually decreases, as is also observed in the one-pipe configuration. The total Hg(0) capture efficiency of CuS_H2S-coated pipes remains unchanged in a 40-min experiment. Generally, the Hg(0) capture results are up to 17% better in the case of CuS_H2S synthesis. However, when considering the statistics, the results are comparable for both configurations (as shown by the statistical bars in Figure 6). The results in the system with only one tube are less stable, possibly due to the fact that the production of layers is not entirely repeatable. In the system with two tubes, the amount of sorbent is sufficient to remove almost 100% of Hg(0). Method B may have resulted in a thinner CuS coating inside the pipe compared to Method A. A thick layer of coated sorbent can impact the velocity of sub-flows passing through PTFE pipes.
4. Conclusions
Two types of reactors were used in these experiments: the vertical glass reactor (VGR) and the prototype multiple pipe reactor (MPR). The VGR fixed-bed reactor is a reliable tool for conducting reference tests. However, the Hg(0) capture efficiency of the VGR is only moderate if the sorbent mass is not relatively high (Table 3 and Table 5).
The simulated flue gas stream in MPRs can be divided into a maximum of five sub-flows. The number of pipes chosen determines the velocity of the simulated gas passing through each reactor pipe. The velocities of the simulated gas in the one-pipe module MPR (1.19 m/s) and the five-pipe module MPR (0.239 m/s) were much higher than in the VGR (0.028 m/s). However, the long coating section ensured a high Hg(0) capture efficiency even at high velocities of flue gases. The contact time for the CuO coating in the one-pipe module MPR was 0.03 s, while for the CuS coating it was 0.04 s. These values were similar to the contact time of 0.035 s in the VGR when 200 mg of sorbent was used. A five-pipe module MPR with three coating pipes (three-pipe MPR) offers a coating area three times larger and a significantly longer contact time, which is expected to enhance the oxidation and surficial capture of Hg(0). The sorbent cell area in the VGR was 5.31 cm2, which is smaller than the 13.19 cm2 area of the three CuO-coated pipes and the 18.84 cm2 area of the three CuS-coated pipes in the MPRs. Adding more coated pipes to the MPR not only reduces the gas velocity but also increases the contact time between the coating sorbent and simulated gas (Equations (9)–(15)). Additionally, CuO and CuS sorbents exhibit a higher Hg(0) capture capability when used in the MPR compared to the VGR setting. This was experimentally confirmed using 200 mg of CuO and CuS sorbent in both the VGR and the three-pipe MPRs (Section 3.2).
The sorbent coating on the PTFE pipes is replaceable. After use, the PTFE pipes and cylindrical modules can be cleaned with acids to remove the coating and any residual mercury. The waste is recycled to prevent mercury contamination. The PTFE pipes can be coated again using the same methodology.
Currently, the MPRs are made of durable, lightweight, and cost-effective PTFE. Coating the selected sorbents onto the PTFE surface is challenging, and the coating procedures are still being developed (Section 3.3). Other materials, such as titanium, stainless steel, or alloy steel, may be considered for producing MPRs. The electroplating process can be used to coat copper compounds onto the internal surface of metal tubes, followed by oxidation or other chemical treatments of a copper-origin layer. Titanium is both lightweight and chemically resistant, and it does not form mercury amalgams, but it is expensive.
Based on the results of our experiments (Table 3, Table 5 and Table 6), the prototype reactor (MPR) effectively achieved its goal of capturing Hg(0). In the next steps, the computational fluid dynamics (CFD) software (Autodesk CFD 2024.0.1) would be used to simulate gas flow in resized reactors under different gas velocity conditions. This information will be useful for households or small institutions of various kinds. The diameter of a new MPR design can be adjusted to fit the pipeline in a specific location. This is where the exhaust gas is emitted to the atmosphere via the coated pipes.
MPRs can also be used to treat poison vapors, such as those found in paints or pigments inside households or workshops. Toxic pollutants are often vented out of houses or small workshops through individual ventilation equipment that does not have a pollutant treatment function. This results in untreated toxic substances being released into the air and falling into the water or soil with rainfall, causing secondary pollution. After prolonged use, the PTFE pipes with coating would be collected, cleaned, and recycled by the company that synthesizes the sorbent or sells the MPRs. As a result, their price will be reasonable.
In a further study, we will modify the prototype reactor by increasing the number of holes on the cylindrical heads and increasing the diameter of the inlet or outlet to suit the particular chimney. We will also consider changing the materials used to make the MPRs and test these reactors in the respective households.
Author Contributions
Conceptualization, Y.D. and M.M.; methodology, Y.D., M.M. and J.G.; validation, Y.D.; formal analysis, Y.D.; investigation, Y.D. and K.S.-S.; resources, Y.D., M.M. and J.G.; writing—original draft preparation, Y.D.; writing—review and editing, Y.D., M.M., J.G. and K.S.-S.; visualization, Y.D. and J.G.; supervision, M.M.; project administration, M.M.; funding acquisition, M.M., K.S.-S. and J.G. All authors have read and agreed to the published version of the manuscript.
Funding
The work was supported by the AGH University of Krakow Grant No. 16.16.210.476 B02.
Data Availability Statement
Data are contained within the article.
Acknowledgments
We acknowledge Katarzyna Berent from the AGH University of Krakow Academic Centre for Materials and Nanotechnology for SEM/EDS imaging and analysis.
Conflicts of Interest
The authors declare no conflicts of interest.
References
- BP. BP Statistical Review of World Energy 2022, 71st ed.; British Petroleum Co.: London, UK, 2022; pp. 1–60. Available online: https://www.bp.com/content/dam/bp/business-sites/en/global/corporate/pdfs/energy-economics/statistical-review/bp-stats-review-2022-full-report.pdf (accessed on 30 January 2024).
- BP Energy Outlook. Statistical Review of World Energy globally consistent data on world energy markets and authoritative publications in the field of energy. BP Energy Outlook 2021, 70, 8–20. [Google Scholar]
- Ryfa, A.; Żmuda, R.; Mandrela, S.; Białecki, R.; Adamczyk, W.; Nowak, M.; Lelek, Ł.; Bandoła, D.; Pichura, M.; Płonka, J.; et al. Experimental and numerical investigation of mercury removal from flue gas by sorbent polymer composite. Fuel 2023, 333, 126470. [Google Scholar] [CrossRef]
- Knotts, J.; Guenioui, K. A Complete Mercury Control System. Available online: https://www.gore.com/sites/default/files/2017-07/IEEE-article-July-2017.pdf (accessed on 17 November 2022).
- Trobajo, J.R.; Antuña-Nieto, C.; Rodríguez, E.; García, R.; López-Antón, M.A.; Martínez-Tarazona, M.R. Carbon-based sorbents impregnated with iron oxides for removing mercury in energy generation processes. Energy 2018, 159, 648–655. [Google Scholar] [CrossRef]
- Zhou, Q.; Duan, Y.F.; Zhao, S.L.; Zhu, C.; She, M.; Zhang, J.; Wang, S.Q. Modeling and experimental studies of in-duct mercury capture by activated carbon injection in an entrained flow reactor. Fuel Process. Technol. 2015, 140, 304–311. [Google Scholar] [CrossRef]
- Qi, H.; Xu, W.; Wang, J.; Tong, L.; Zhu, T. Hg0removal from flue gas over different zeolites modified by FeCl3. J. Environ. Sci. 2015, 28, 110–117. [Google Scholar] [CrossRef]
- Wdowin, M.; Macherzyński, M.; Panek, R.; Górecki, J.; Franus, W. Investigation of the sorption of mercury vapour from exhaust gas by an Ag-X zeolite. Clay Miner. 2015, 50, 31–40. [Google Scholar] [CrossRef]
- Yang, Y.; Liu, J.; Wang, Z.; Liu, F. Heterogeneous reaction kinetics of mercury oxidation by HCl over Fe2O3 surface. Fuel Process. Technol. 2017, 159, 266–271. [Google Scholar] [CrossRef]
- Li, H.; Zhu, W.; Yang, J.; Zhang, M.; Zhao, J.; Qu, W. Sulfur abundant S/FeS2 for efficient removal of mercury from coal-fired power plants. Fuel 2018, 232, 476–484. [Google Scholar] [CrossRef]
- UNEP. Global mercury assessment 2018. In Global Mercury Assessment 2018: Sources, Emissions, Releases and Environmental Transport, November; UNEP: Geneva, Switzerland, 2018; pp. 1–60. [Google Scholar] [CrossRef]
- James, B.S.; Shetty, R.S.; Kamath, A.; Shetty, A. Household cooking fuel use and its health effects among rural women in southern India-A cross-sectional study. PLoS ONE 2020, 15, e0231757. [Google Scholar] [CrossRef]
- Ravindra, K.; Kaur-Sidhu, M.; Mor, S.; John, S. Trend in household energy consumption pattern in India: A case study on the influence of socio-cultural factors for the choice of clean fuel use. J. Clean. Prod. 2019, 213, 1024–1034. [Google Scholar] [CrossRef]
- Zhang, W.; Lu, Z.; Xu, Y.; Wang, C.; Gu, Y.; Xu, H.; Streets, D.G. Black carbon emissions from biomass and coal in rural China. Atmos. Environ. 2017, 176, 158–170. [Google Scholar] [CrossRef]
- Jaworek, A.; Sobczyk, A.T.; Marchewicz, A.; Krupa, A.; Czech, T. Particulate matter emission control from small residential boilers after biomass combustion. A review. Renew. Sustain. Energy Rev. 2021, 137, 110446. [Google Scholar] [CrossRef]
- Shen, H.; Luo, Z.; Xiong, R.; Liu, X.; Zhang, L.; Li, Y.; Du, W.; Chen, Y.; Cheng, H.; Shen, G.; et al. A critical review of pollutant emission factors from fuel combustion in home stoves. Environ. Int. 2021, 157, 106841. [Google Scholar] [CrossRef] [PubMed]
- Dziok, T.; Kołodziejska, E.K.; Kołodziejska, E.L. Mercury content in woody biomass and its removal in the torrefaction process. Biomass Bioenergy 2020, 143, 105832. [Google Scholar] [CrossRef]
- De Simone, F.; Artaxo, P.; Bencardino, M.; Cinnirella, S.; Carbone, F.; D’amore, F.; Dommergue, A.; Feng XBin Gencarelli, C.N.; Hedgecock, I.M.; Landis, M.S.; et al. Particulate-phase mercury emissions from biomass burning and impact on resulting deposition: A modelling assessment EPA Public Access. Atmos. Chem. Phys. 2017, 17, 1881–1899. [Google Scholar] [CrossRef] [PubMed]
- Sood, A.; Assad, N.A.; Barnes, P.J.; Churg, A.; Gordon, S.B.; Harrod, K.S.; Irshad, H.; Kurmi, O.P.; Martin, W.J.; Meek, P.; et al. ERS/ATS workshop report on respiratory health effects of household air pollution. Eur. Respir. J. 2018, 51, 1700698. [Google Scholar] [CrossRef]
- Dziok, T.; Penkała, K. The possibility of reducing emissions from households by using coal briquettes. Polityka Energetyczna 2020, 23, 55–70. [Google Scholar] [CrossRef]
- Ruan, T.; Rim, D. Indoor air pollution in office buildings in mega-cities: Effects of filtration efficiency and outdoor air ventilation rates. Sustain. Cities Soc. 2019, 49, 101609. [Google Scholar] [CrossRef]
- González-Martín, J.; Kraakman, N.J.R.; Pérez, C.; Lebrero, R.; Muñoz, R. A state–of–the-art review on indoor air pollution and strategies for indoor air pollution control. Chemosphere 2021, 262, 128376. [Google Scholar] [CrossRef]
- Singh, D.; Kumar, A.; Kumar, K.; Singh, B.; Mina, U.; Singh, B.B.; Jain, V.K. Statistical modeling of O3, NOx, CO, PM2.5, VOCs and noise levels in commercial complex and associated health risk assessment in an academic institution. Sci. Total Environ. 2016, 572, 586–594. [Google Scholar] [CrossRef]
- Macherzyński, M. Redukcja Emisji Rtęci do Środowiska—Wybrane Problemy w Świetle Badań Laboratoryjnych i przemysłowych; Wydawnictwa AGH: Kraków, Poland, 2018. [Google Scholar]
- Wdowin, M.; MacHerzyński, M.; Panek, R.; Wałȩka, M.; Górecki, J. Analysis of selected mineral and waste sorbents for the capture of elemental mercury from exhaust gases. Mineralogia 2020, 51, 17–35. [Google Scholar] [CrossRef]
- Xu, J.; Zhang, A.; Zhou, Z.; Wang, C.; Deng, L.; Liu, L.; Xia, H.; Xu, M. Elemental Mercury Removal from Flue Gas over Silver-Loaded CuS-Wrapped Fe3O4 Sorbent. Energy Fuels 2021, 35, 13975–13983. [Google Scholar] [CrossRef]
- Yang, Z.; Li, H.; Qu, W.; Zhang, M.; Feng, Y.; Zhao, J.; Yang, J.; Shih, K. Role of Sulfur Trioxide (SO3) in Gas-Phase Elemental Mercury Immobilization by Mineral Sulfide [Research-article]. Environ. Sci. Technol. 2019, 53, 3250–3257. [Google Scholar] [CrossRef] [PubMed]
- Zhang, Q.; Mei, J.; Sun, P.; Zhao, H.; Guo, Y.; Yang, S. Mechanism of Elemental Mercury Oxidation over Copper-Based Oxide Catalysts: Kinetics and Transient Reaction Studies. Ind. Eng. Chem. Res. 2020, 59, 61–70. [Google Scholar] [CrossRef]
- Sharma, M.; Poddar, M.; Gupta, Y.; Nigam, S.; Avasthi, D.K.; Adelung, R.; Abolhassani, R.; Fiutowski, J.; Joshi, M.; Mishra, Y.K. Solar light assisted degradation of dyes and adsorption of heavy metal ions from water by CuO–ZnO tetrapodal hybrid nanocomposite. Mater. Today Chem. 2020, 17, 100336. [Google Scholar] [CrossRef]
- Mao, W.; Zhang, L.; Wang, T.; Bai, Y.; Guan, Y. Fabrication of highly efficient Bi2WO6/CuS composite for visible-light photocatalytic removal of organic pollutants and Cr(VI) from wastewater. Front. Environ. Sci. Eng. 2021, 15, 52. [Google Scholar] [CrossRef]
- Isac, L.; Cazan, C.; Andronic, L.; Enesca, A. CuS-Based Nanostructures as Catalysts for Organic Pollutants Photodegradation. Catalysts 2022, 12, 1135. [Google Scholar] [CrossRef]
- Liu, W.; Xu, H.; Liao, Y.; Quan, Z.; Li, S.; Zhao, S.; Qu, Z.; Yan, N. Recyclable CuS sorbent with large mercury adsorption capacity in the presence of SO2 from non-ferrous metal smelting flue gas. Fuel 2019, 235, 847–854. [Google Scholar] [CrossRef]
- Jia, L.; Fan, B.G.; Yao, Y.X.; Han, F.; Huo, R.P.; Zhao, C.W.; Jin, Y. Study on the Elemental Mercury Adsorption Characteristics and Mechanism of Iron-Based Modified Biochar Materials. Energy Fuels 2018, 32, 12554–12566. [Google Scholar] [CrossRef]
- Yang, W.; Adewuyi, Y.G.; Hussain, A.; Liu, Y. Recent developments on gas–solid heterogeneous oxidation removal of elemental mercury from flue gas. Environ. Chem. Lett. 2019, 17, 19–47. [Google Scholar] [CrossRef]
- Gorecki, J.; Macherzynski, M.; Chmielowiec, J.; Borovec, K.; Wałeka, M.; Deng, Y.; Sarbinowski, J.; Pasciak, G. The Methods and Stands for Testing Fixed Sorbent and Sorbent Polymer Composite Materials for the Removal of Mercury from Flue Gases. Energies 2022, 15, 8891. [Google Scholar] [CrossRef]
- Macherzyński, M.; Deng, Y.; Górecki, J. Wykorzystanie technik spektroskopowych w laboratoryjnych testach kontroli oczyszczania gazów procesowych. In Nauka i Przemysł: Metody Spektroskopowe w Praktyce: Nowe Wyzwania i Możliwości: Praca Zbiorowa; Wydawnictwo UMCS: Lublin, Poland, 2021; pp. 390–394. ISBN 978-83-227-9504-0. [Google Scholar]
- Krzywanski, J.; Rajczyk, R.; Bednarek, M.; Wesolowska, M.; Nowak, W. Gas emissions from a large scale circulating fluidized bed boilers burning lignite and biomass. Fuel Process. Technol. 2013, 116, 27–34. [Google Scholar] [CrossRef]
- Glushkov, D.O.; Nyashina, G.S.; Anand, R.; Strizhak, P.A. Composition of gas produced from the direct combustion and pyrolysis of biomass. Process Saf. Environ. Prot. 2021, 156, 43–56. [Google Scholar] [CrossRef]
- Zheng, S.; Liu, H.; He, Y.; Yang, Y.; Sui, R.; Lu, Q. Combustion of biomass pyrolysis gas: Roles of radiation reabsorption and water content. Renew. Energy 2023, 205, 864–872. [Google Scholar] [CrossRef]
- Zhakupov, D.; Kulmukanova, L.; Sarbassov, Y.; Shah, D. Flue gas analysis for biomass and coal co-firing in fluidized bed: Process simulation and validation. Int. J. Coal Sci. Technol. 2022, 9, 59. [Google Scholar] [CrossRef]
- Li, G.; Shen, B.; Li, Y.; Zhao, B.; Wang, F.; He, C.; Wang, Y.; Zhang, M. Removal of element mercury by medicine residue derived biochars in presence of various gas compositions. J. Hazard. Mater. 2015, 298, 162–169. [Google Scholar] [CrossRef]
- He, Z.; Xie, Y.; Wang, Y.; Xu, J.; Hu, J. Removal of Mercury from Coal-Fired Flue Gas and Its Sulfur Tolerance Characteristics by Mn, Ce Modified γ-Al2O3Catalyst. J. Chem. 2020, 2020, 8702745. [Google Scholar] [CrossRef]
- Xie, Y.; Li, C.; Zhao, L.; Zhang, J.; Zeng, G.; Zhang, X.; Zhang, W.; Tao, S. Experimental study on Hg0 removal from flue gas over columnar MnOx-CeO2/activated coke. Appl. Surf. Sci. 2015, 333, 59–67. [Google Scholar] [CrossRef]
- Deng, Y.; Macherzyński, M. Mercury capture in process gases and its mechanisms in different industries: Theoretical and practical aspects, including the influence of sulfur compounds on mercury removal. Chem. Process Eng. New Front. 2023, 44, e5. [Google Scholar] [CrossRef]


Disclaimer/Publisher’s Note: The statements, opinions and data contained in all publications are solely those of the individual author(s) and contributor(s) and not of MDPI and/or the editor(s). MDPI and/or the editor(s) disclaim responsibility for any injury to people or property resulting from any ideas, methods, instructions or products referred to in the content. |
© 2024 by the authors. Licensee MDPI, Basel, Switzerland. This article is an open access article distributed under the terms and conditions of the Creative Commons Attribution (CC BY) license (https://creativecommons.org/licenses/by/4.0/).