Article

Research on Flutter Characterization of Flexible Blade Response under Typhoon Operating Conditions

1
College of Mechanical and Electrical Engineering, Inner Mongolia Agricultural University, Hohhot 010018, China
2
College of Energy and Traffic Engineering, Inner Mongolia Agricultural University, Hohhot 010018, China
3
State Key Laboratory for Alternate Electrical Power System with Renewable Energy Sources, North China Electric Power University, Beijing 102206, China
*
Author to whom correspondence should be addressed.
Energies 2024, 17(5), 1254; https://doi.org/10.3390/en17051254
Submission received: 23 January 2024 / Revised: 29 February 2024 / Accepted: 1 March 2024 / Published: 6 March 2024
(This article belongs to the Special Issue Advances in Fluid Dynamics and Wind Power Systems)

Abstract

:
Wind turbine blades, being flexible, are susceptible to damage during typhoons. Studying the aeroelastic response of these blades in typhoon conditions is crucial for providing a theoretical foundation for their optimization and design. This research focuses on the NREL 5 MW flexible blade, employing the B-L stall model for dynamic inflow and geometrically exact beam theory to develop an aeroelastic model capable of predicting the blade’s flutter limit. Through quantitative analysis, we assess the stability of the wind turbine’s flexible blade under typhoon conditions and examine the blade tip’s transient response. The findings indicate that the model’s flutter speed is 21.5 rpm, marked by a significant increase in tip deflection’s mean square error of over 80% and a coupling of flapwise and torsional modes at 4.81 Hz. The blade tip’s transient response under typhoon conditions does not satisfy the flutter criterion, thus preventing instability. Under typhoon conditions, the deflection in the flapwise, edgewise, and twist directions of the blade shows an increase of 12.1%, 10.5%, and 119.2%, respectively, compared to standard operating conditions.

1. Introduction

Wind energy represents a significant sector within the renewable energy landscape, boasting vast global reserves [1]. The advancement of wind power technology over recent years has increasingly complemented traditional thermal power generation. The “Global Wind Energy Report 2023” indicates that the global increase in wind power capacity reached 77.6 GW in 2022, a 9% rise from the previous year. Notably, China’s onshore and offshore capacities are among the highest globally. The coastal regions of China are endowed with abundant wind energy resources, presenting a substantial opportunity for the wind power market [2,3]. However, these regions are frequently subjected to extreme weather events, including typhoons, posing considerable challenges to the wind energy industry.
Typhoons, characterized by ultra-high wind speeds, rapid directional changes, and intense turbulence, can cause various forms of damage to wind turbines [4,5,6]. In response to the 2019 typhoon’s destructive impact, the International Electrotechnical Commission (IEC) updated the “IEC 61400-1-2019” standard [7] to enhance typhoon-related descriptions and safety guidelines. This revision addresses the safety risks previously unaccounted for in the original version of the standard [8]. The low stiffness of flexible blades in wind turbines, especially those of larger scale, accentuates the bending-torsion coupling effect, making the discrepancy between the critical flutter speed and the turbine’s rated speed closer [9,10,11,12]. Accurate prediction of the critical flutter speed and thorough analysis of flutter characteristics are thus essential for ensuring turbine resilience. Research into flutter characteristics has been extensive; for instance, Hansen [13] used the HAWCStab software 1.0.0 to predict a flutter speed of 24 rpm for the NREL 5 MW blade.
Similarly, Jundong Huang [14] and colleagues applied the supercell method and momentum vane theory for structural and aerodynamic modeling of the NREL 5 MW, identifying torsional instability during flutter. Liping Dai’s work [15], leveraging momentum foliation theory and geometrically exact beam theory, found flutter wind speeds of 57 m/s and 87 m/s during braking and operation, respectively. Using an aeroelastic model consisting of an unsteady BEM model and a Euler–Bernoulli beam model, Shakya’s study determined an instability speed of 19.1 rpm [16]. These investigations highlight the importance of accurately determining the critical flutter speed to prevent destabilization of wind turbines’ flexible blades during shutdown.
In addition, in terms of the impact of typhoons on the overall performance of wind turbines, Ran Han [17] studied the dynamic response of 2 MW and 6 MW wind turbines at different yaw angles based on the blade element momentum theory and multi-body dynamics. The results show that the tip deflection reaches its maximum when the yaw angle is between 30° and 120°, and this conclusion is universal. H. Wang [18] modeled the NREL 5 MW model based on BEM theory and multi-body dynamics theory to analyze the multi-wind vibration of the whole machine, in which the blade showed a high-order vibration form. Di Tang [19] studied the wind load criticality of a 1.5 MW wind turbine based on unsteady aerodynamic loads in different directions in the typhoon-affected area and found that E wind (the whole pair of wind turbine planes are clockwise 90°) is more likely to cause the blade tip oscillation vortex shedding to form a high oscillation amplitude. Zhiguo Li [20] combined the blade element momentum theory, hybrid beam theory, finite unit method, modified Newmark-β method, and Lanczos decoupling technique for the turbulence dynamics characterization of a NREL 5 MW wind turbine. The results show that turbulence pulsation under the influence of the blade flapwise deflection amplitude is always larger. Ye Kehua [21] Kaimal wind spectrum for the premise of the incoming flow conditions of the NREL 1.5 MW wind turbine using the Lagrange dynamics method for modeling analysis. The results show that the blade tip deflection frequency is mainly concentrated in the flatwise vibration frequency near the blade tip, so it can be seen that the dynamic response of the blade tip is to determine the importance of the characteristics of the working conditions of the typhoon.
This study examines the aeroelastic flutter limit characteristics of large wind turbine flexible blades, mainly their behavior during typhoon conditions, an area that requires further investigation. We specifically explore the potential for flutter-induced damage to the NREL 5 MW flexible blade model during a typhoon and conduct a quantitative analysis of blade tip displacement under such conditions. The OpenFAST 3.2.1 [22] software simulates the unsteady aerodynamic forces [23] and large nonlinear deformations affecting the blade [24], facilitating the determination of the flutter limit through time-series analysis of the aeroelastic response in uncontrolled wind turbine conditions. This flutter limit is analyzed in frequency [25,26] and time domains [27], assessing compliance with the “IEC 61400-1-2019” revised standards for typhoon conditions. The findings aim to contribute valuable insights for enhancing wind turbine blade designs against typhoon-induced vibrations, focusing on the transient response and amplitude increase of blade tip displacement during typhoon downtime states.

2. Research Objects and Models

2.1. Wind Turbine Rotor Model of a Wind Turbine

This study focuses on the United States National Renewable Energy Laboratory’s (NREL) 5 MW fixed offshore wind turbine as its primary research subject [28]. A simulation model for the turbine’s flexible blades was developed based on parameters provided by NREL. The key parameters are detailed in Table 1. The wind turbine’s initial shutdown position is depicted in Figure 1, indicating that the rotor’s direction of rotation is counterclockwise. Blade B1 is oriented vertically, situated in the upper half of the rotor’s plane. Blades B2 and B3 are positioned on the rotor plane’s lower right and lower left halves, each separated by an angle of 120°.
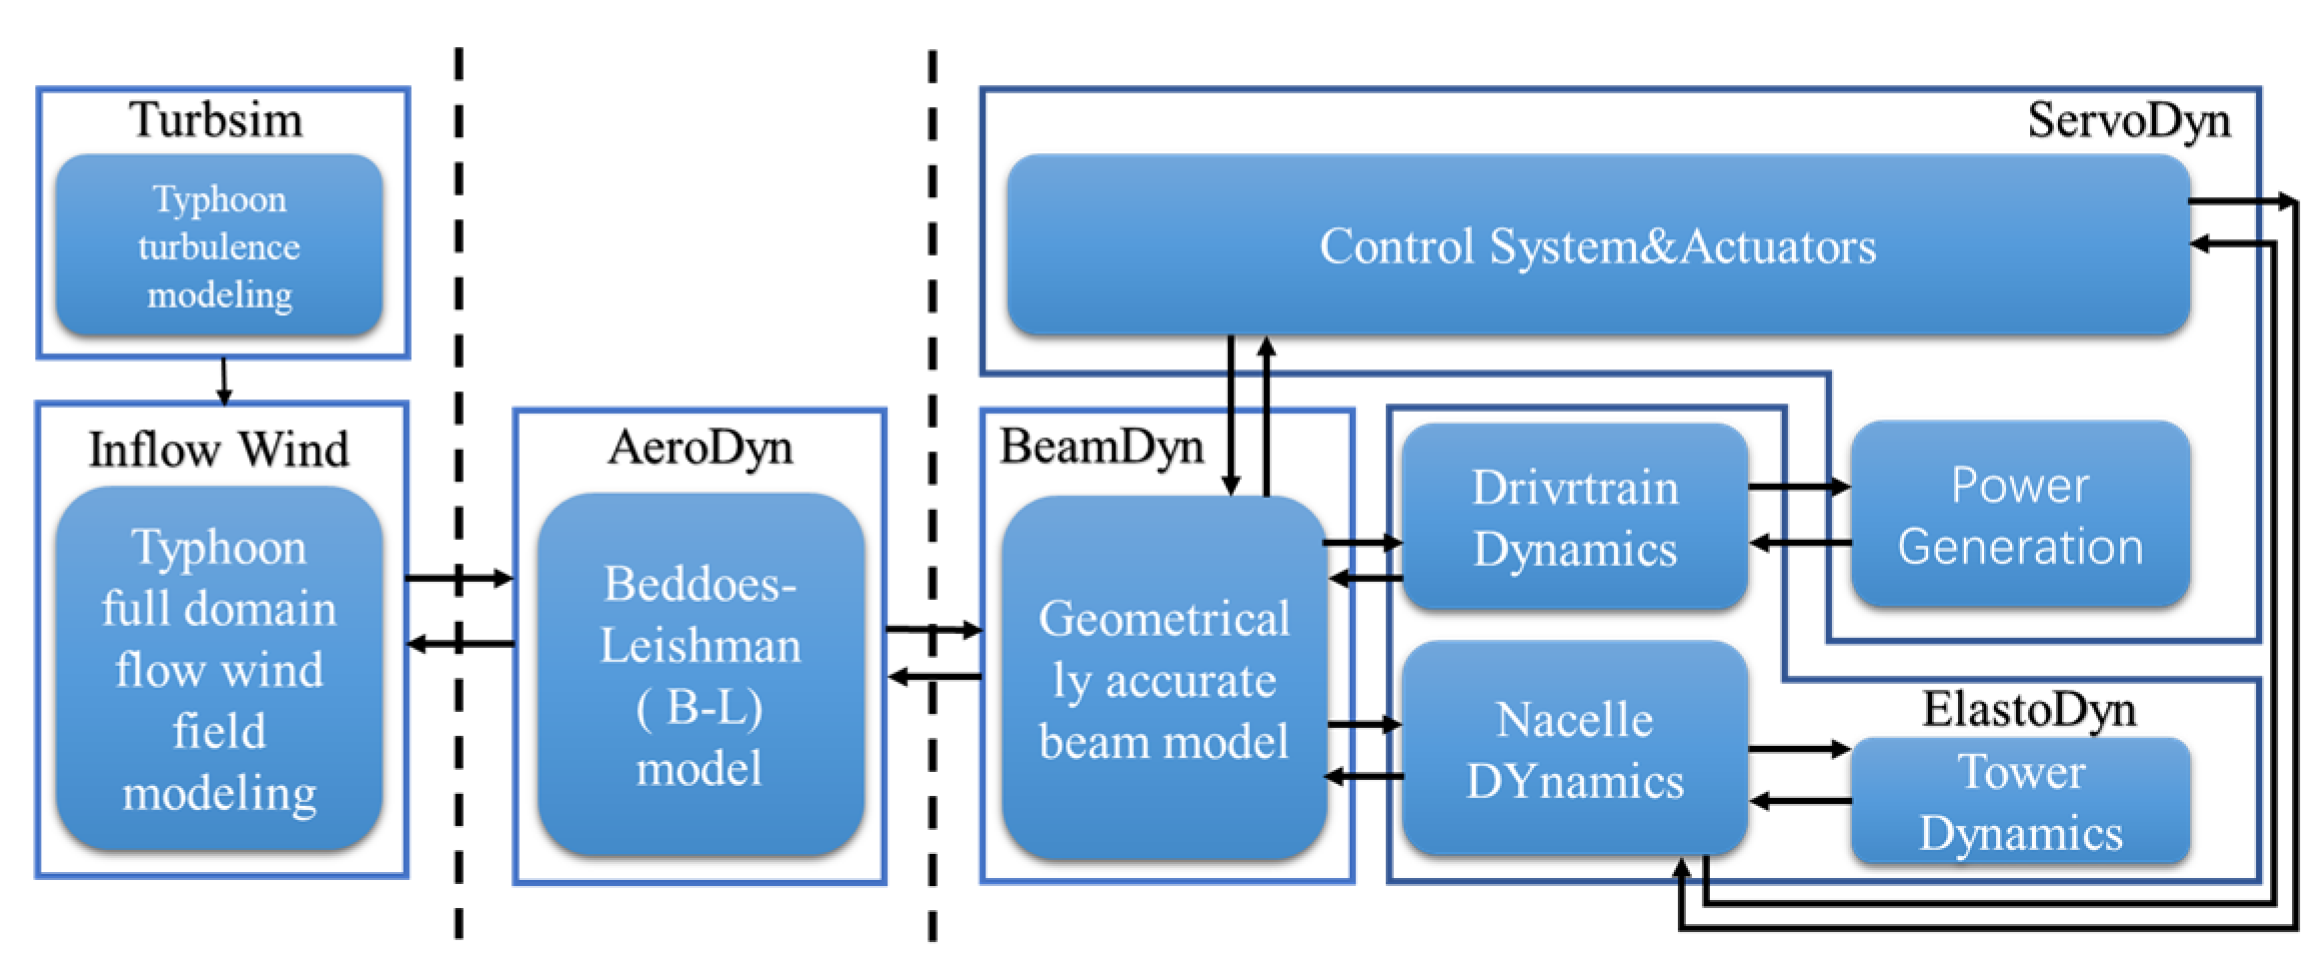
Figure 2 illustrates the comprehensive flow-wind field model. The simulation platform utilizes OpenFAST software to construct a time-sequential turbulent wind field tailored to tropical cyclone parameters outlined in “IEC 61400-1-2019”, employing TurbSim with a hub-height wind speed of 57 m/s and turbulence intensity of 0.18, based on the Von Karman wind spectrum. This simulated wind field is integrated into the AeroDyn aerodynamic computation module via the Inflow Wind module, where dynamic stall forces are calculated using the Beddoes-Leishman (B-L) model in conjunction with the BeamDyn module, enabling the analysis of the blade tip’s aeroelastic response in flexible blades. The ServoDyn module oversees the simulation across various operational phases, including runaway, rated, and typhoon conditions, to guarantee accurate model performance. As shown in Figure 3.

2.2. Aeroelastic Model

The dynamic stall Beddoes–Lesihman (B-L) model [29] can provide a good description of the emotional lift coefficients of the blade, etc., based on the consideration of the adhesive and separated flows. The dynamic stall B-L model is a semi-empirical model based on the airfoil’s following response, and this model expresses the unsteady lift coefficient and drag coefficient of the airfoil by the approximation of non-stationary aerodynamic dynamics through Theodorsen’s theory and the analysis of separation flow combined with Kirchhoff’s flow theory.
It can be derived from the angle of attack at 3/4 of the airfoil chord direction instead of the downwash airflow velocity, according to Theodorsen theory.
y ˙ i + 1 T u b i y i = 1 T u b i A i ω 3 / 4 ω 3 / 4 = h ˙ + α U + c 2 α ˙ α 3 / 4 = ω 3 / 4 / U
where b i is the exponential constant of the time lag function, A i is the coefficient constants of the time lag function; h ˙ is the acceleration of the airfoil bump motion; α is the angle of attack; α ˙ is the rate of change of the angle of attack; y i ( 0 ) = 0 ; T u = c / 2 U ; c is the chord length; and U is the incoming wind speed. The aerodynamic state variables x 1 and x 2 can be obtained by organizing the above equation, as shown in Equation (2).
x ˙ 1 + T u 1 b 1 + c U ˙ / 2 U 2 x 1 = b 1 A 1 T u 1 α 3 / 4 x ˙ 2 + T u 1 b 2 + c U ˙ / 2 U 2 x 2 = b 2 A 2 T u 1 α 3 / 4
The effective angle of attack α E and the unsteady lift coefficient C L P of the attached flow are obtained from the aerodynamic state variables x 1 , x 2 as shown in Equation (3).
α E = α 3 / 4 1 A 1 A 2 + x 1 + x 2 C L P = 2 π α E α 0 + π T u α ˙
The relationship between the separation point and the static lift coefficient of the airfoil can be obtained through the Kirchhoff flow theory as follows:
C L s t = C L , a 1 + f s t ( α ) 2 2 ( α α 0 )
where C L , a is the slope of the linear part of the static lift coefficient curve, and function f s t ( α ) is the function of the separation point of the trailing edge of the airfoil, as shown in Figure 4.
When the angle of attack exceeds the fully separated angle of attack range, the relationship between the static lift coefficient and the fully separated flow lift coefficient is organized as follows:
C L f s ( α ) = C L s t C L , a ( α α 0 ) f s t 1 f s t
The state variable x 3 represents the hysteresis relationship between pressure and lift, and the hysteresis relationship between the dynamic and quasi-static separation points is represented by x 4 as in Equation (6):
x ˙ 3 + T p 1 x 3 = T p 1 C L , α α E α 0 + π T u α ˙ x ˙ 4 + T f 1 x 4 = T f 1 f st α f
where the quasi-static angle of attack a α f and the quasi-static separation point c f s t ( a f ) are as follows, respectively:
α f = x 3 / C L , α + α 0
f s t ( α f ) = 2 C L s t ( α f ) C L , d ( α f α 0 ) 1 2
The non-constant aerodynamic coefficient based on the above equation is as follows:
C L dyn = C L , α α E α 0 x 4 + C L fs α E 1 x 4 + π T u α ˙ C M dyn = C M st α E + C L dyn a st x 4 a st f st α E π 2 T u α ˙
where C L d y is the aerodynamic lift coefficient and C M d y is the aerodynamic drag coefficient.

2.3. Structural Model

In the structural model for calculating large deformations of flexible blades, the geometrically accurate beam model can better capture the nonlinear deformations of flexible blades of large wind turbines than the Bernoulli–Euler model [24], with geometrically accurate beams controlling the equations of motion as follows:
h ˙ F = f
g ˙ + u ˙ h M + ( x 0 + u ) T F = m
where h is the linear momentum; g is the angular momentum; F is the cross-sectional force of the beam; M is the cross-sectional moment of the beam; u is the linear deflection of a point on the reference line; x 0 is the position vector of a point along the beam’s reference line; f is the distributed force exerted on the beam structure; m is the distributed moment exerted on the beam structure; F is the derivative concerning the beam’s axial deflection; and h ˙ is the derivative concerning time.
According to the constitutive equations, the relationship between momentum velocity and momentum, strain, and section force can be expressed as follows:
h g = M v ω
F M = C ε κ
where M is the 6 × 6 cross-sectional mass matrix; C is the 6 × 6 cross-sectional stiffness matrix; ε is the one-dimensional strain; k is the one-dimensional curvature; and ω is the angular velocity vector defined by the rotation tensor.
One-dimensional strain ε and curvature k are defined as follows:
ε κ = x 0 + u ( R R 0 ) l 1 k
where k is the section curvature vector, R 0 is the initial rotation tensor, and l 1 is the unit vector along the beam axis.

3. Comparative Analysis of the Transient Response of Blade Tip

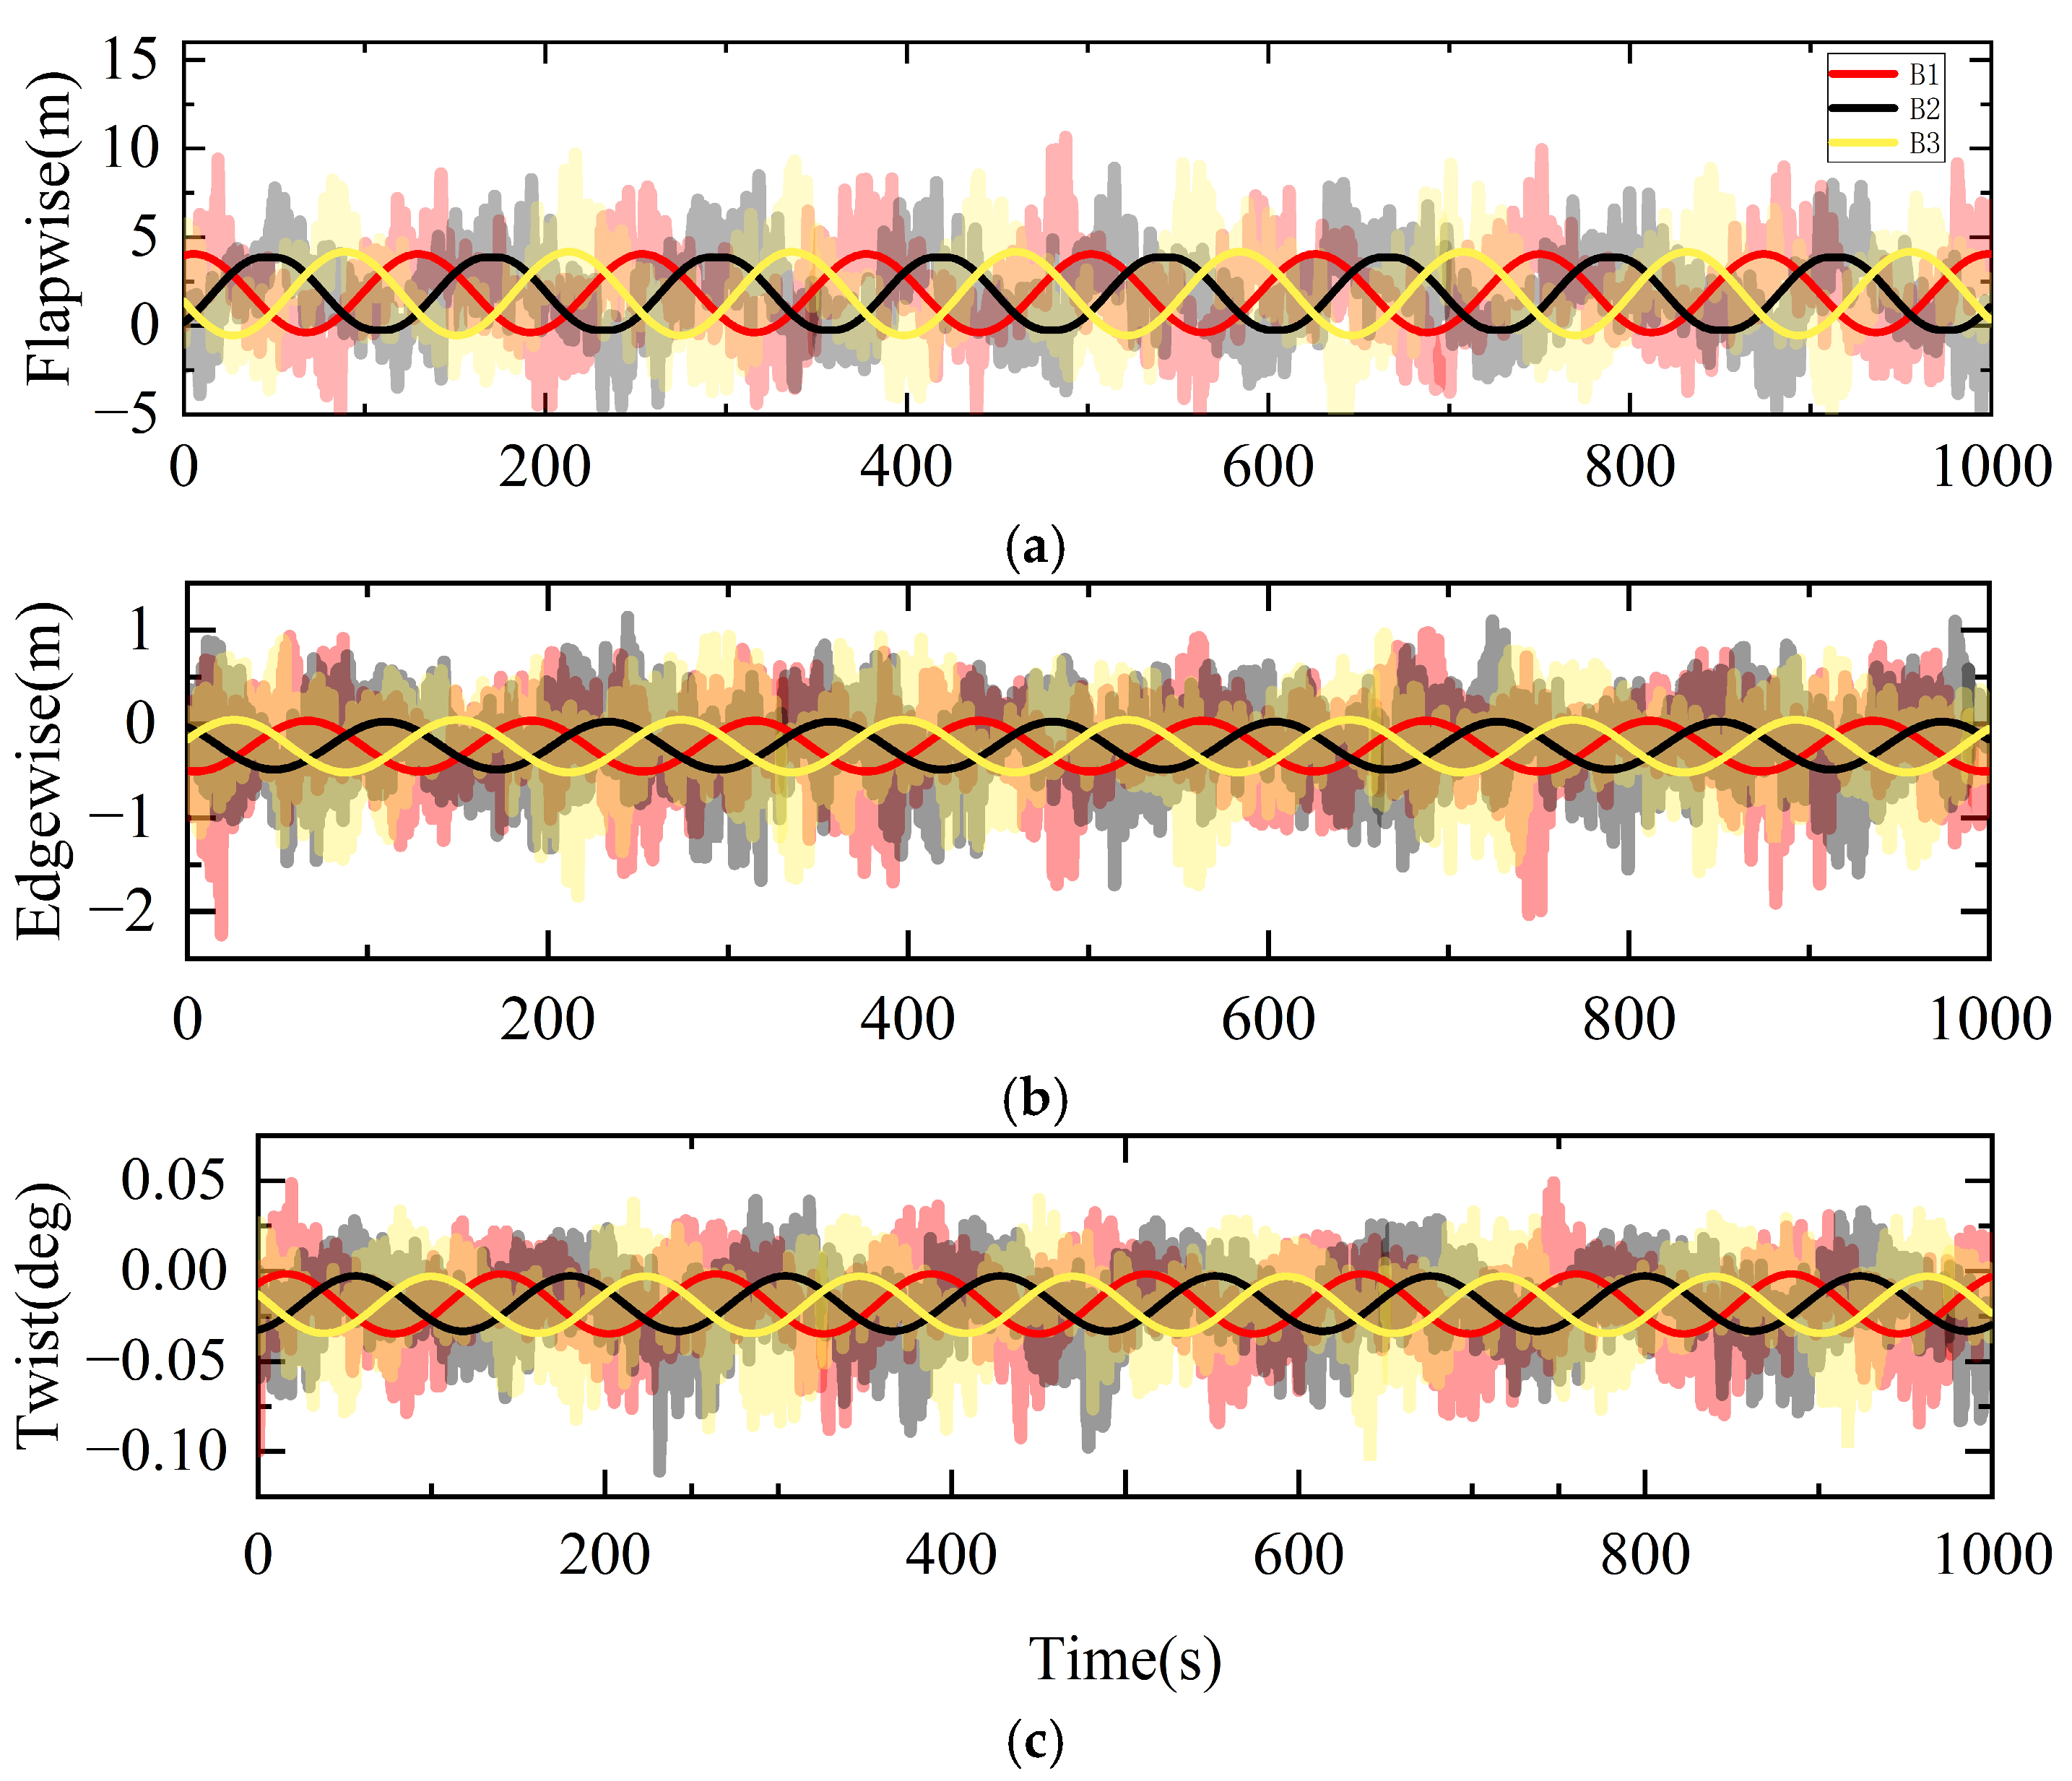
Figure 5 illustrates the displacement vibration patterns of the three-blade tips across various degrees of freedom, including flapwise, edgewise, and twist, over time. The data points in the results have been nonlinearly fitted with curves (indicated by dark-colored lines in Figure 5) to enhance the visualization of the curve trend. Figure 5a displays the flapwise displacement, Figure 5b shows the edgewise displacement, and Figure 5c presents the twist displacement of the blades. It is evident that under the influence of a turbulent wind field at 1000 s, the transient response of the blade tips exhibits a periodic function characterized by a consistent amplitude and phase angle, with a phase shift of 120°.
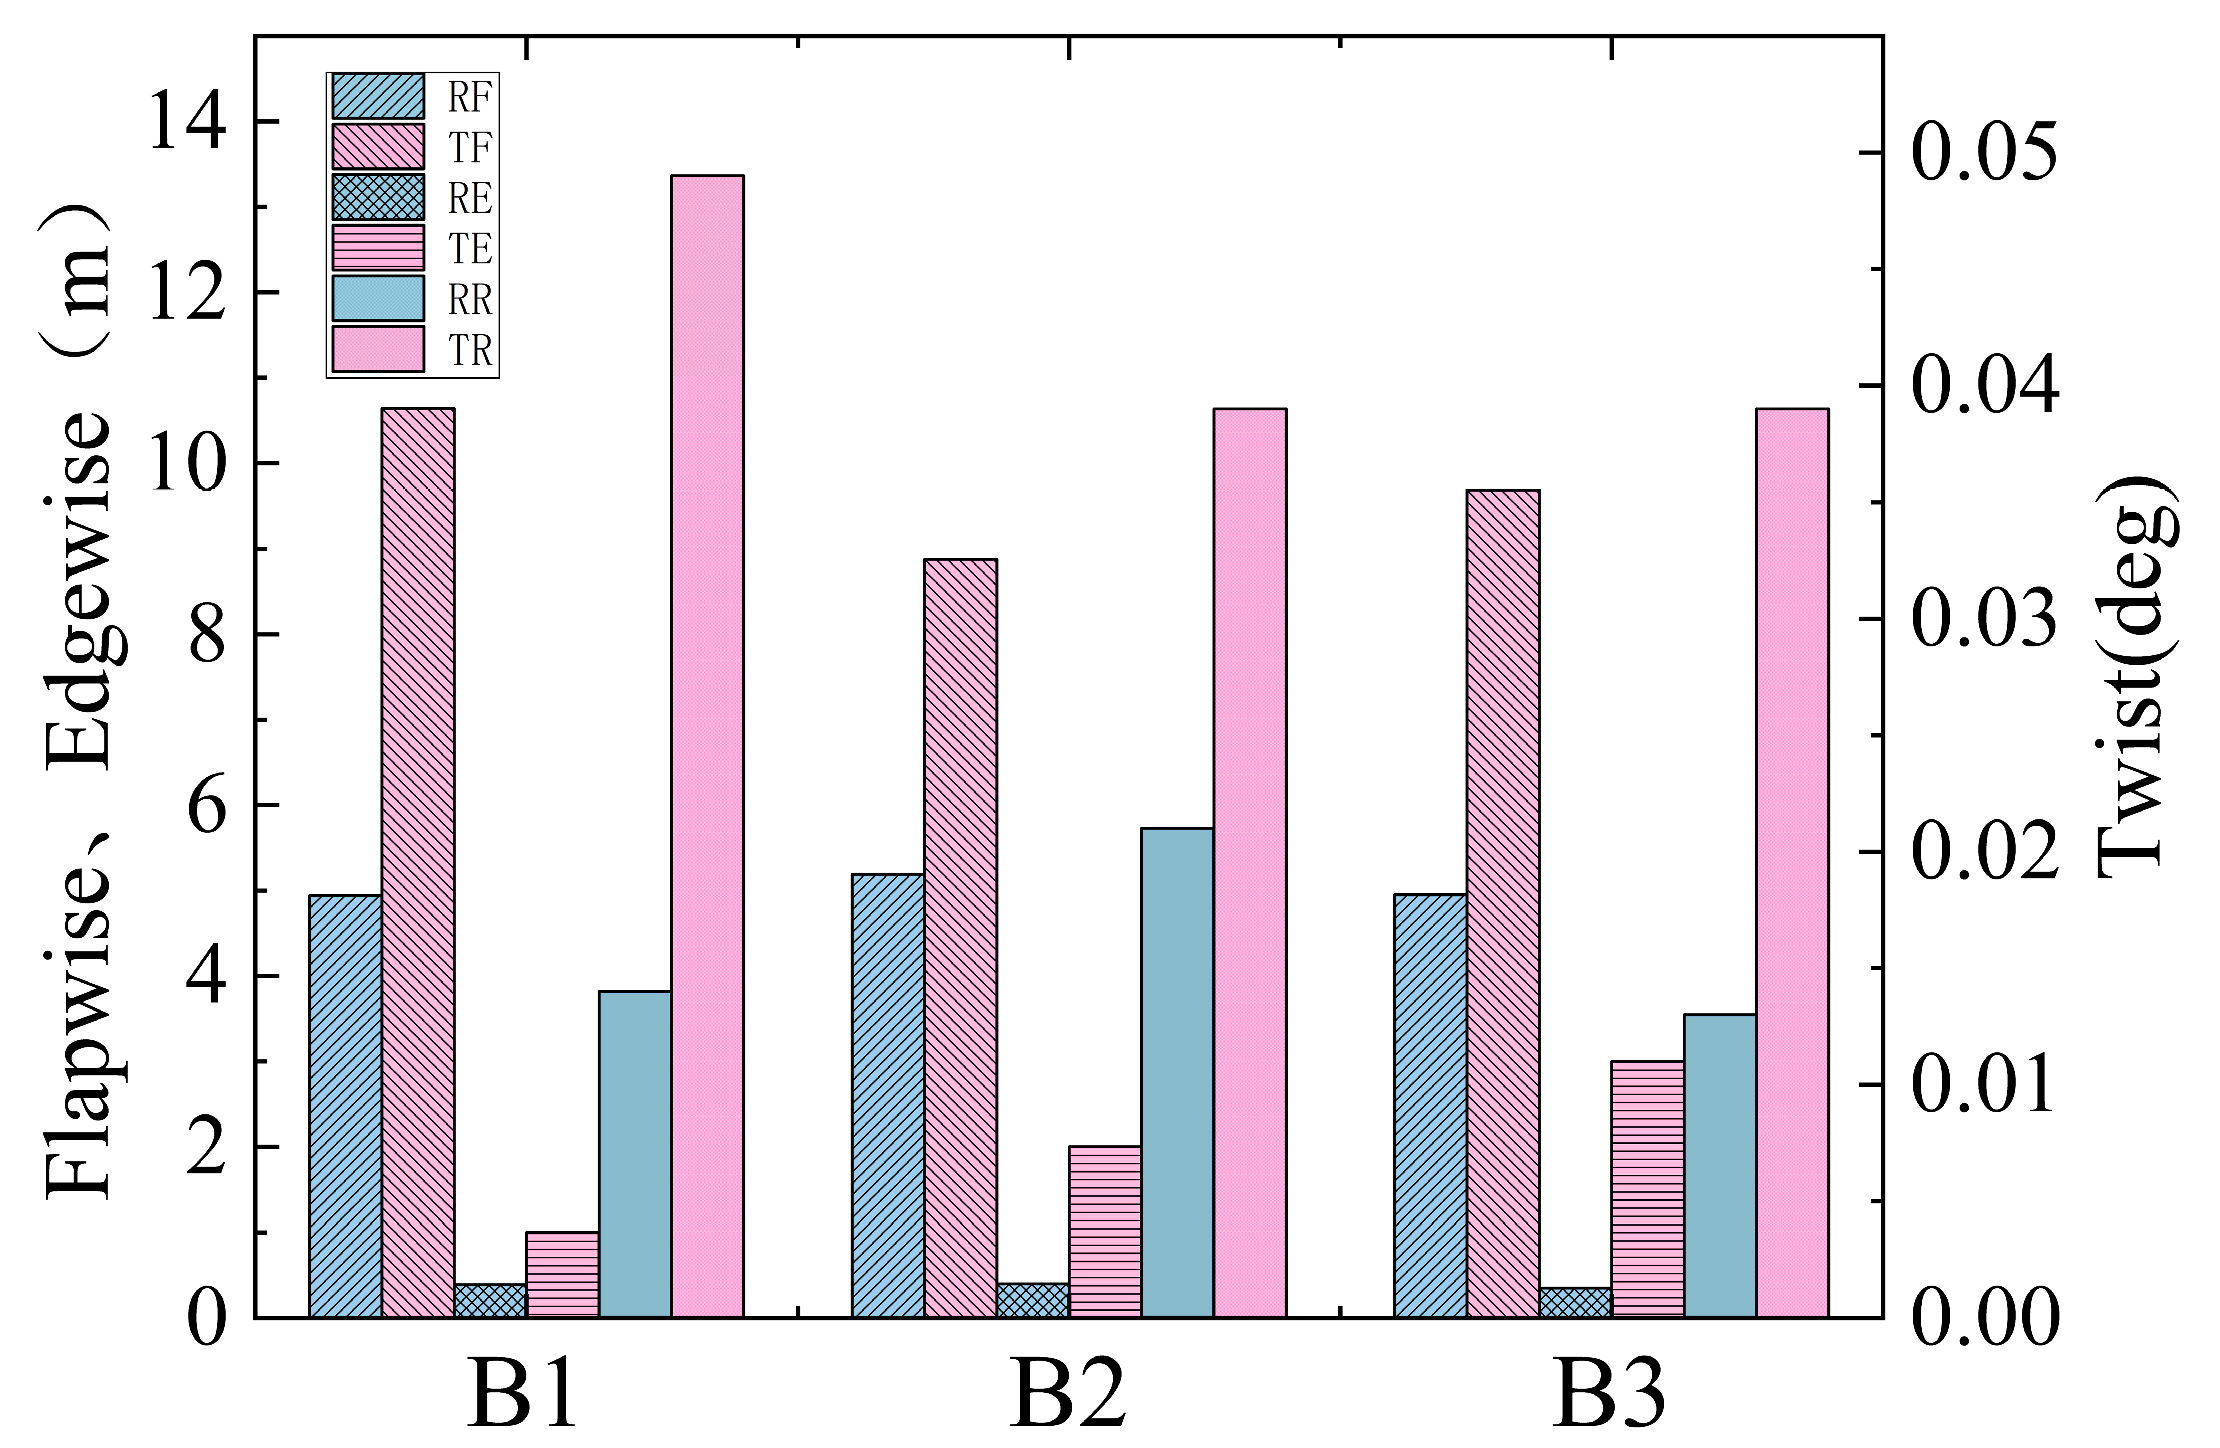
In order to further study the blade aeroelastic response during typhoon conditions, the rated condition tip aeroelastic transient response better reflects the tip deformation characteristics than the quasi-static test of the IEC standard, so the rated condition turbulent wind field is constructed for comparative analysis, as shown in Figure 6.
Under rated conditions, blade B2 exhibits the most significant flapwise deflection (RF), marginally surpassing the other blades. This trend continues with the edgewise deflection (RE) and twist angular deflection (RR) of blade B2, making it the most deformed among the three. Despite being in the downwind position during typhoon conditions, blade B2’s flapwise (TF), edgewise (TE), and twist (TR) deflections significantly exceed those observed under rated conditions. Blade B1 demonstrates the highest flapwise deflection (TF) under typhoon conditions, while blade B2 maintains the most excellent twist deflection (RF). Blade B3, on the other hand, experiences the most considerable edgewise deflection (TE) during such conditions, as illustrated in Figure 6.
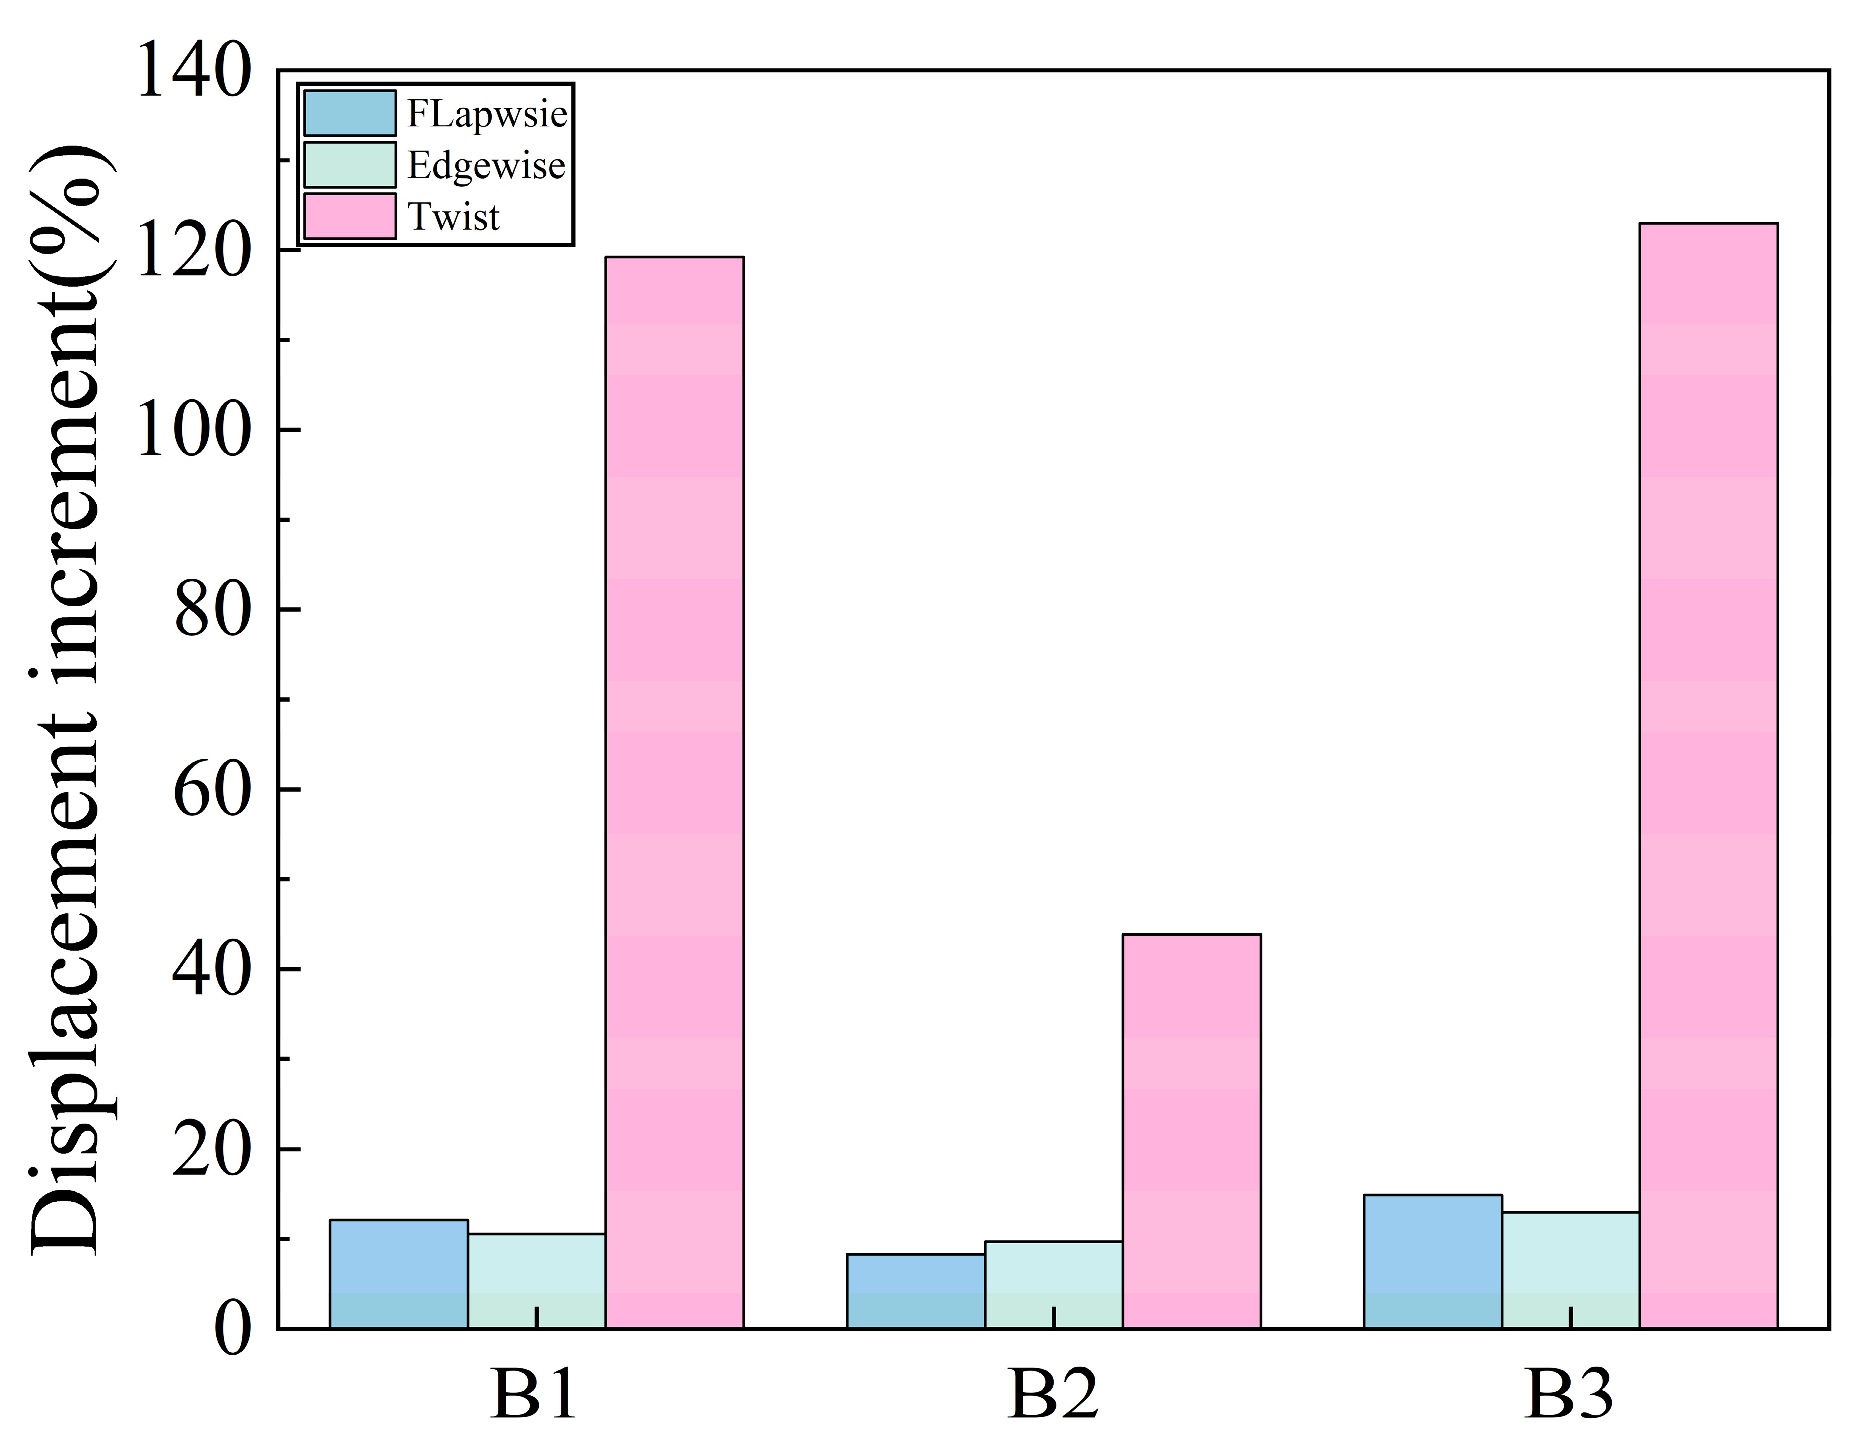
Figure 7 depicts the incremental mean square deviation in displacement under shutdown versus rated conditions. For the shutdown condition, Blade B1’s displacement exceeds the rated condition by 12.1%, 10.5%, and 119.2% for flapwise, edgewise, and twist, respectively. Blade B2 shows the slightest increase in mean square error across all displacements, with 8.3%, 9.7%, and 43.8% for flapwise, edgewise, and twist, respectively. Conversely, Blade B3 exhibits the most significant changes in displacement for flapwise, edgewise, and twist, with mean square error increases of 14.9%, 13.0%, and 123.0%, respectively. Consequently, to enhance typhoon resistance and mitigate the risk of fatigue or direct fracture, optimization of the blade’s flapwise, edgewise, and twist stiffness should be guided by the deformation patterns observed in Blade B3.

4. Results and Discussion

4.1. Time-Domain Analysis of Aeroelastic Stability Boundaries

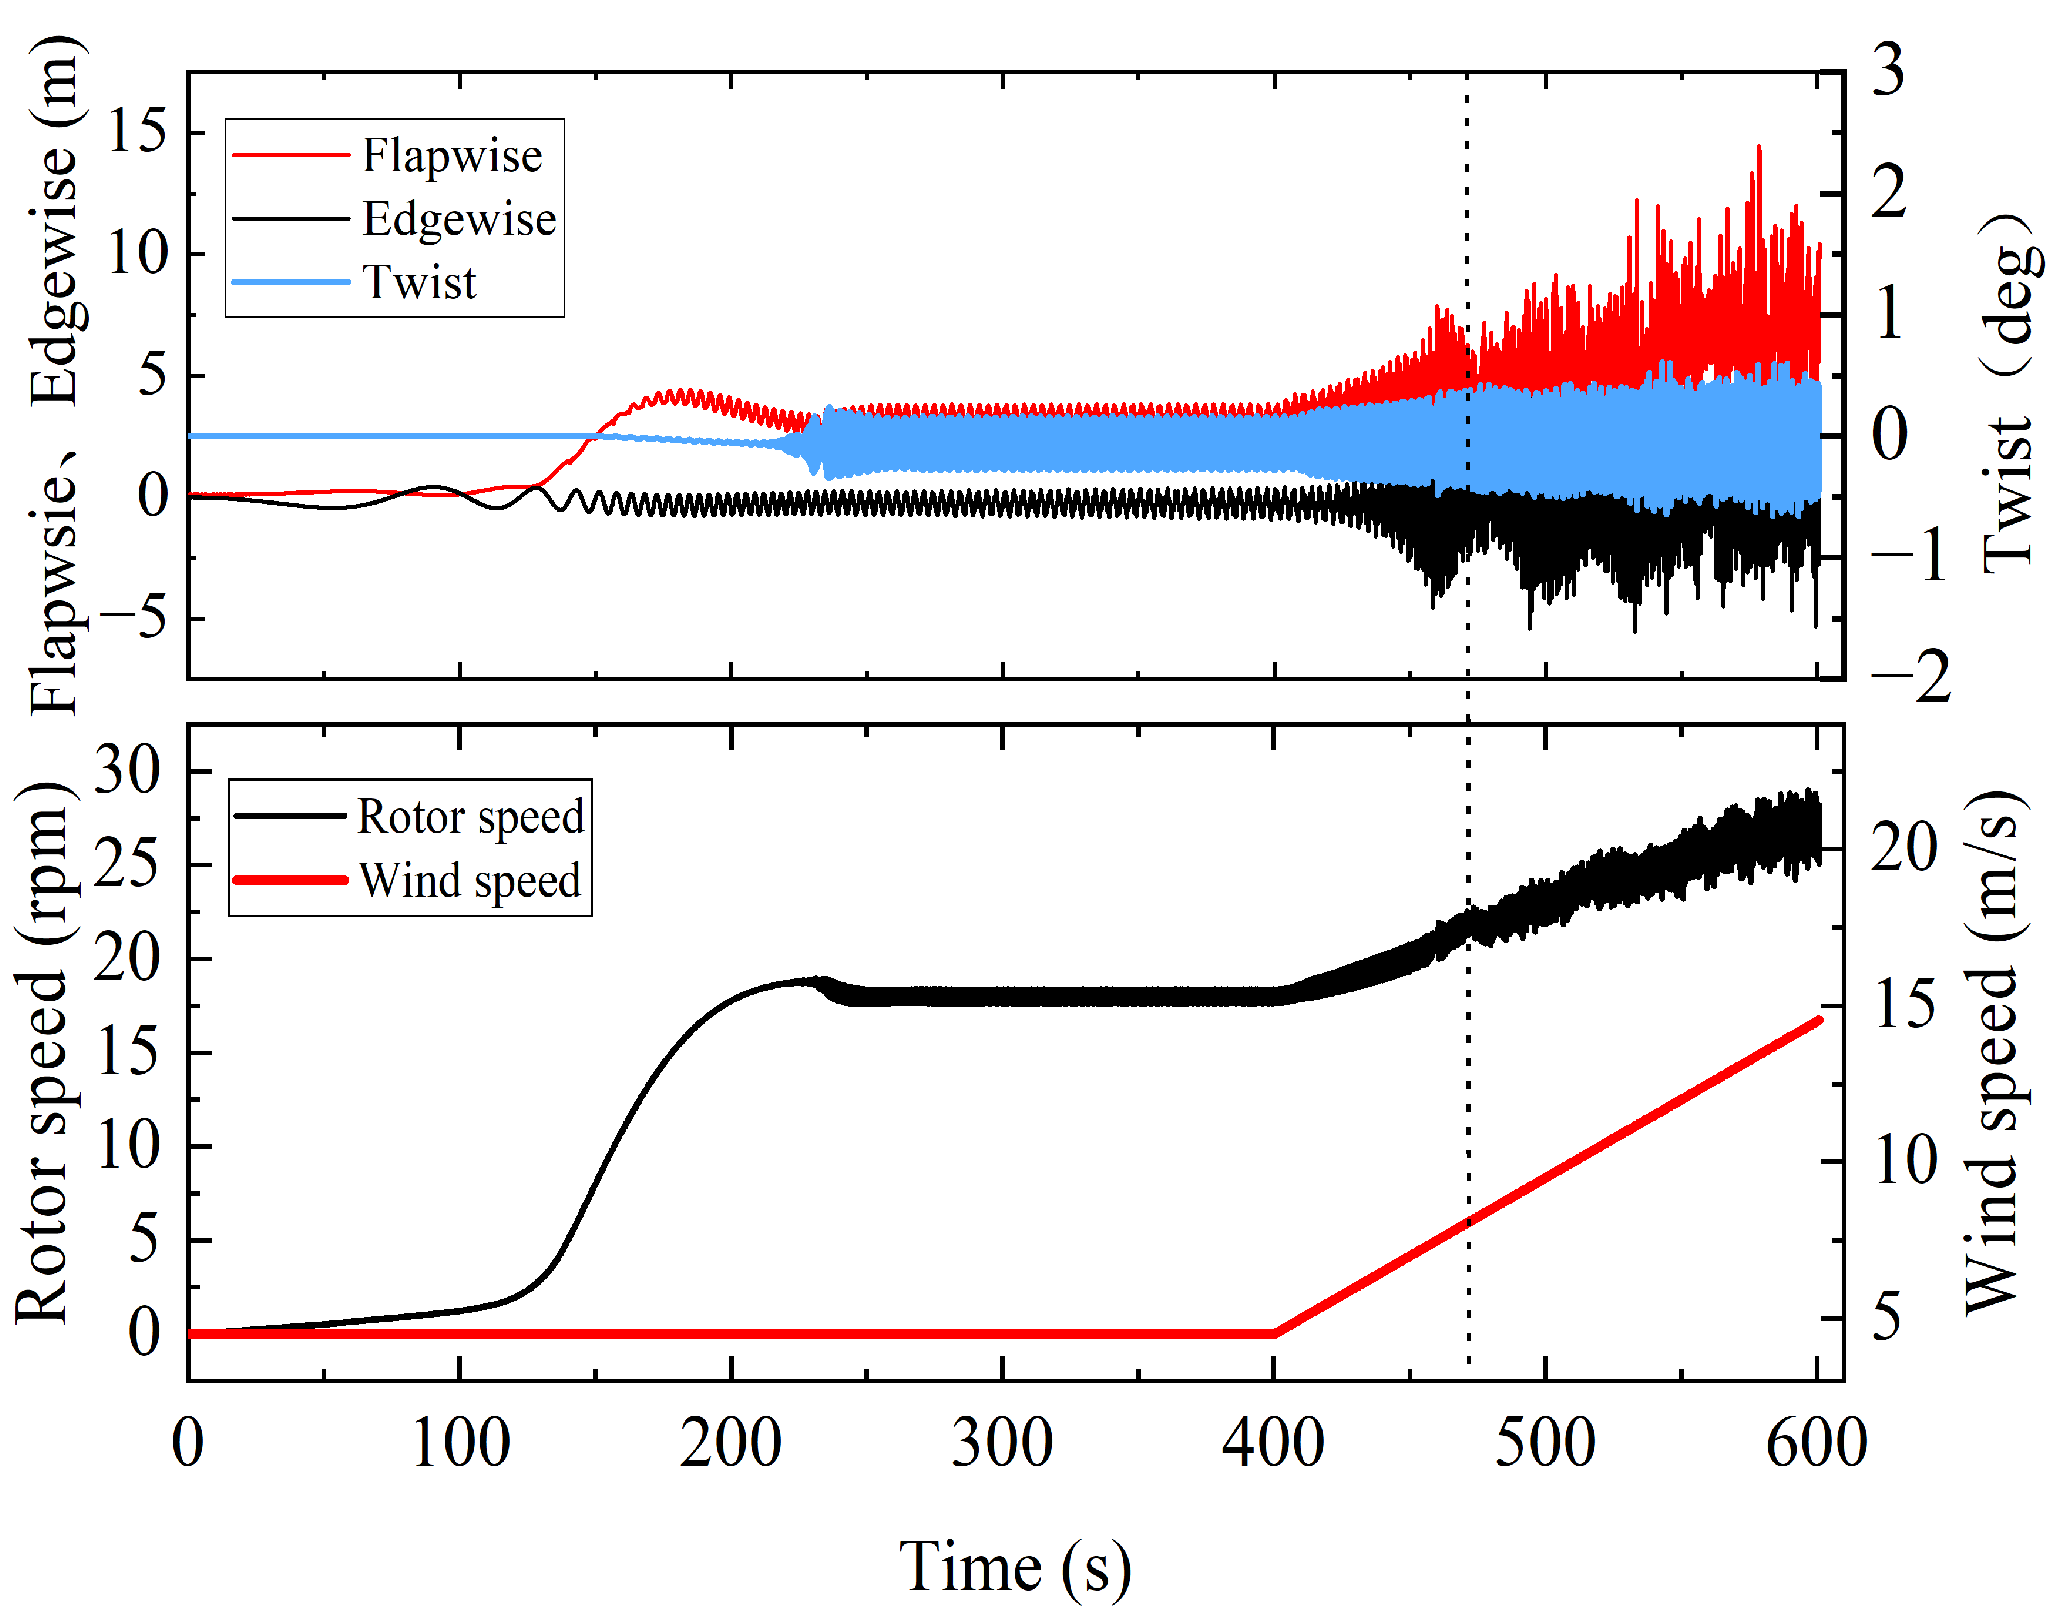
In the case of nonlinear large deformation of the wind turbine blade, the runaway analysis of the wind turbine [30] shows that the wind turbine is stationary when the control module is lifted, the aerodynamic module and the structural module are solved, the wind turbine rotational speed is initially set to 0, and the pitch angle is 0 so that the blade is in the state of attached flow. The phenomenon of aerodynamic elastic destabilization will occur when the blade speed is close to the critical speed. The wind speed is set to grow linearly; the wind speed is 4.5 m/s in the first 400 s; after 400 s, the wind speed increases uniformly with a linear growth slope of 0.05 m/s; and finally, the wind speed stops at 15 m/s. The changes in the wind turbine’s rotational speed and the wind speed versus time are shown in Figure 8. The blade converts the wind energy into rotating mechanical energy, and the rotational speed of the wind turbine increases gradually from 0 during the first 400 s and then stabilizes at 18.06 rpm. The wind turbine’s rotational speed increases gradually from 0 during the first 400 s and then stabilizes at 18.06 rpm. After 400 s, the wind speed gradually increases, leading to a corresponding increase in the mechanical energy and rotation speed of the wind turbine. Simultaneously, the deflection of the wind turbine blade tips also increases. In 473 s, the wind turbine’s rotational speed appears to fall, and the tip deflection suddenly increases; this is due to the wind turbine’s rotational mechanical energy being converted to the kinetic energy of the blade’s intense oscillation, which also means the occurrence of instability [31]. At this time, the wind turbine’s rotational speed is 21.5 rpm, and literature [32] is closer to the subsequent irregular increase in rotational speed increases continuing to increase, and the tip deflection is similarly to irregular amplitude increases continuing to increase.
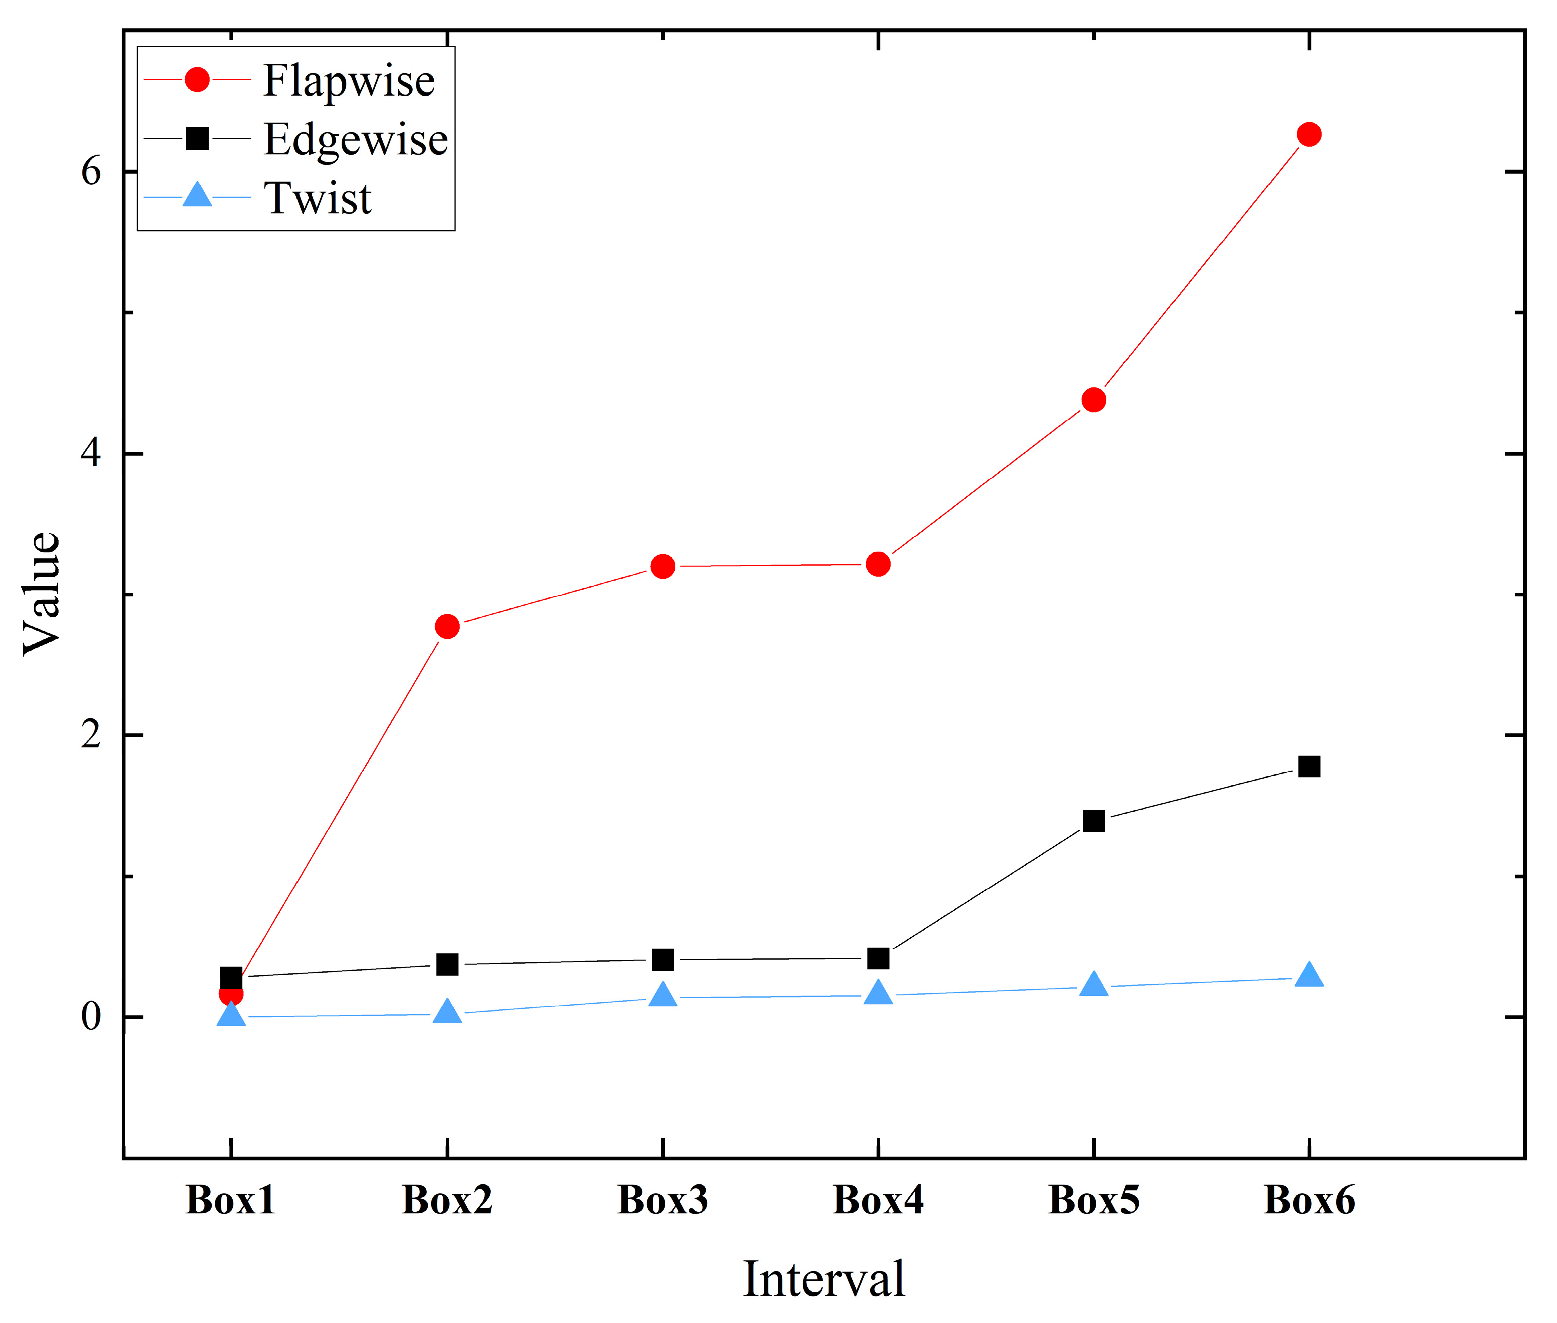
The process is divided into 100-s intervals, and the mean square error of deflection in different directions [33] is used as the analysis index, as shown in Figure 9. The mean square deviation of the flapwise deflection changes the most in the 1st~2nd interval and the 4th~6th interval, respectively. The change in the 1st~2nd interval reflects that the blade tip is in an aeroelastic stable state from the static to the wind turbine affected by the wind speed, and the mean square deviation increases by 15.56 times at this stage. The mean square deviation changes in the 4th~6th interval reflects the transition process of the blade tip deflection from a stable to an unstable state. In the fourth interval, the blade is still in aeroelastic stability. The instability occurs in the fifth interval, and the sixth interval is the state after the instability. The mean square error of the sixth interval is higher than 94% of the fourth interval. Edgewise deflection has the same trend as torsional, angular, and flapwise deflections. The mean square deviation of the edgewise deflection in the sixth interval is higher than that in the fourth interval by 326%, and the mean square deviation of the torsional angular deflection in the sixth interval is higher than that in the fourth interval by 82.7%. In general, the occurrence of instability in the deflection of performance increased by more than 80%.
The time-domain diagram before instability is shown in Figure 10a. The blade tip flapwise deflection, edgewise vibration, and torsional angle deflection have the same vibration period and almost no phase difference. With the increase in time, the torsional angle deflection starts to show periodic fluctuations with a much finer period after destabilization, as shown in Figure 10b. The flapwise and torsion have a 90° phase difference, and the edgewise has a 180° phase difference, where the low-frequency component of the flapwise is the same as the edgewise, and the high-frequency component is the same as the torsion [34].

4.2. Aeroelastic Stability Boundary Frequency Domain Analysis

The Bmodes [35] module in OpenFAST is used to pre-process the flexible blades of the NREL 5 MW wind turbine [36]. The first six-order modal characteristic frequencies at rest are obtained considering the centroid offset, as shown in Table 2. Compared with the official data of NREL, the deviation of the first three modes is less than 5%, and the results are credible.
The instability of the blade is reflected in the frequency domain as a multi-modal coupling phenomenon, as shown in Figure 11. Figure 11a shows that in the frequency range of the first six modes, there are four spectral peaks at 1.10 Hz, 2.71 Hz, 3.56 Hz, and 4.81 Hz, respectively, among which the spectral peak at 1.10 Hz is the most significant. The frequency here is the first-order edgewise mode frequency. The edgewise mode energy is the highest, and the flapwise and torsion vibrate at the same frequency through the aerodynamic coupling. At 2.71 Hz, the coupling of the first-order mode is not identified, but the dominant mode of the same mode is still the edgewise mode, as shown in Figure 11b. Figure 11c shows that the coupling of the flapwise and flapwise vibration modes at 3.56 Hz is still not the coupling frequency of a particular mode. However, the rotation speed of the impeller is 21.5 rpm, and the rotation frequency of the impeller is 3.58 Hz, so the instability of the impeller rotation causes modal coupling here. It can be seen that the frequency dominated by the flapwise vibration mode in Figure 11a,b is due to the influence of the impeller rotation. Furthermore, the last peak is shown in Figure 11d. At 4.81 Hz, it is expressed as the frequency of the coupling of the flapwise mode, and the torsional mode dominated by the flapwise mode. At this time, the frequency is the unique frequency of instability. That is, the instability frequency of the wind turbine is 4.81 Hz.

4.3. Aeroelastic Stability Analysis of Blades under Typhoon Conditions

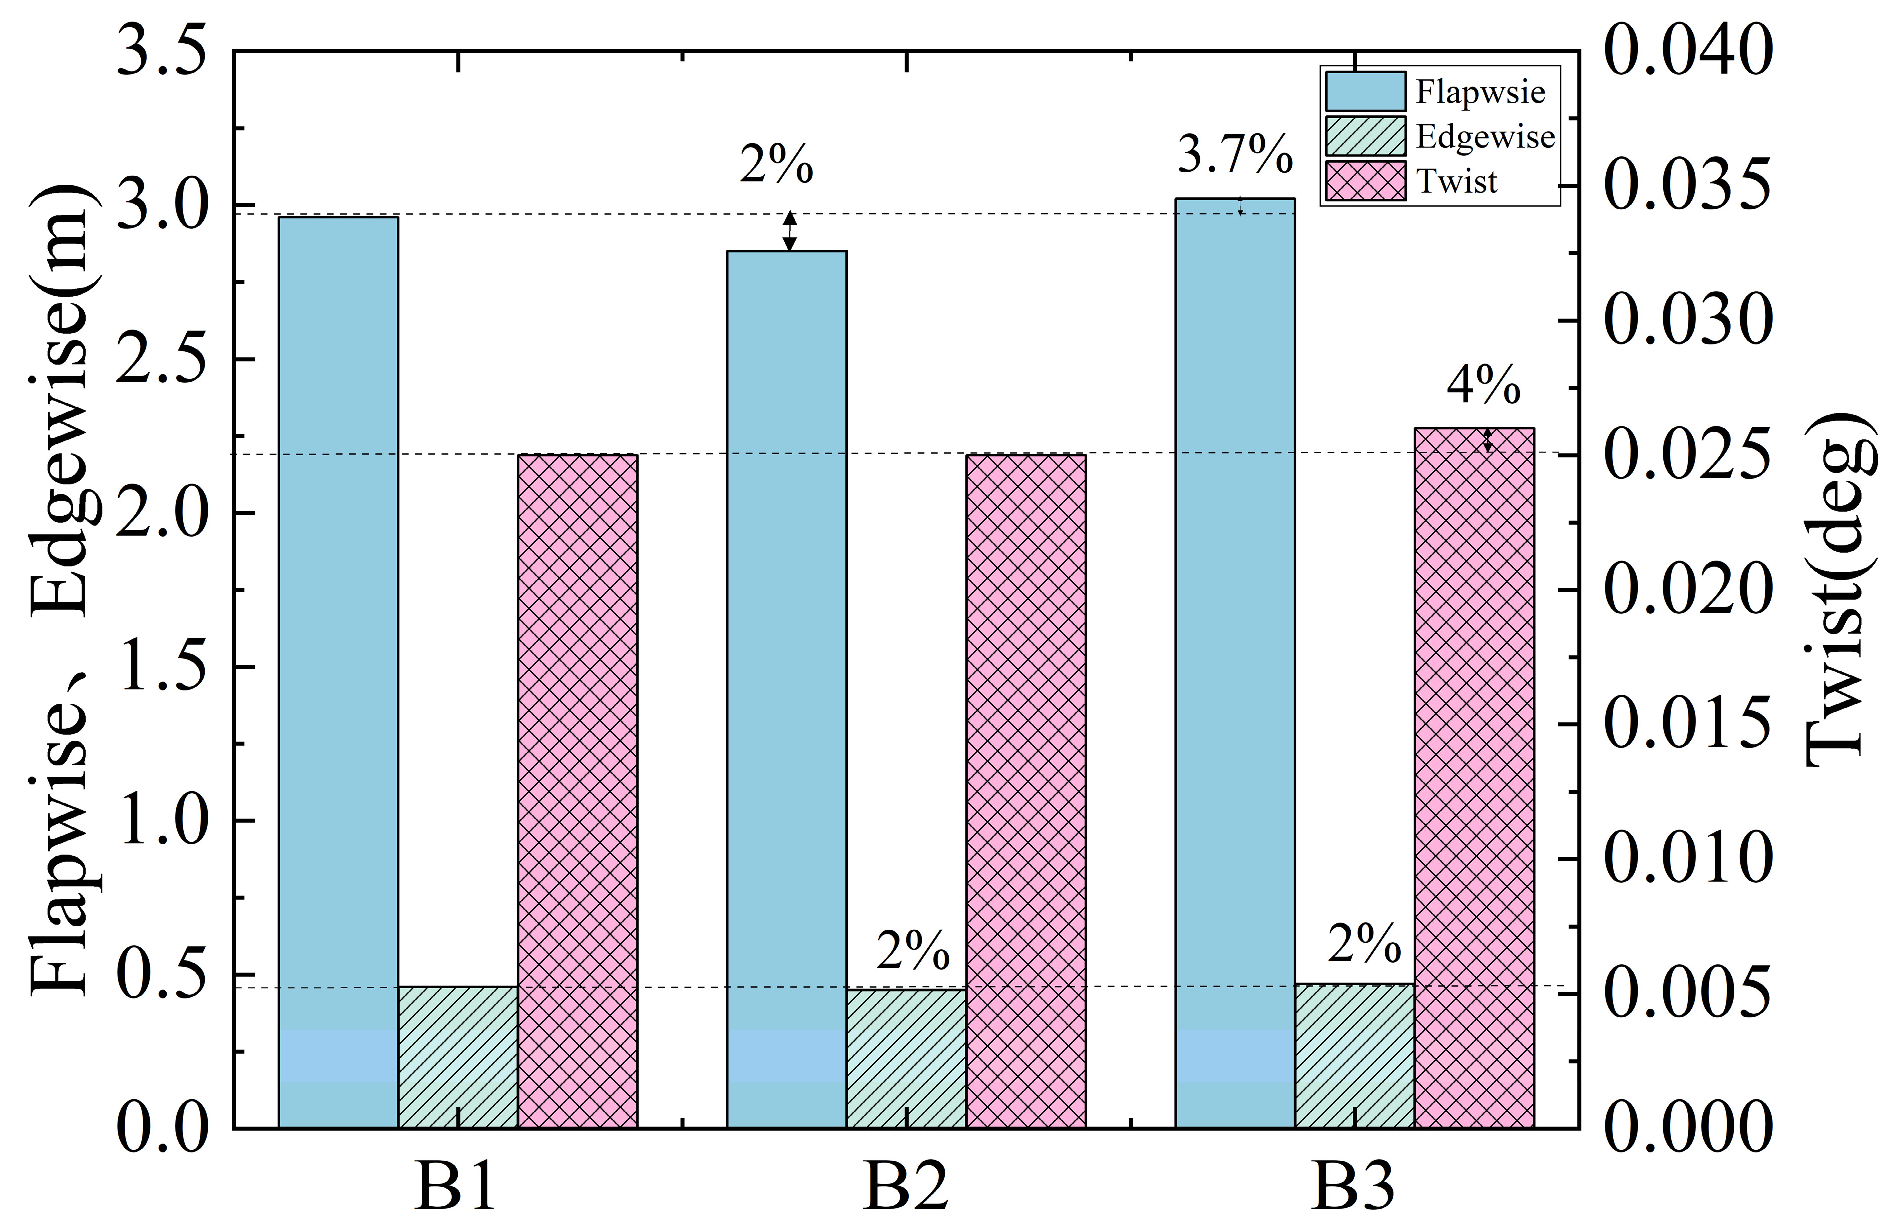
The blade is in the down-pitch state when the typhoon is transiting, i.e., the leading edge of the blade is facing the positive wind direction. The transient response of the wind turbine is analyzed for the typhoon condition, comparing the root mean square of the vibration deflection of the blade tip in the whole process. As shown in Figure 12, the flapwiseing direction of blade B1 is higher than that of blade B2 by 2% and that of blade B3 by 3%, and the torsion direction is the same as that of blade B2, which is lower than that of blade B3 by 4%. In the flapwiseing direction, the deflection of blade B1 is higher than 2% of blade B2 and 2% of blade B3; thus, it can be judged that the three blades are in a similar vibration state.
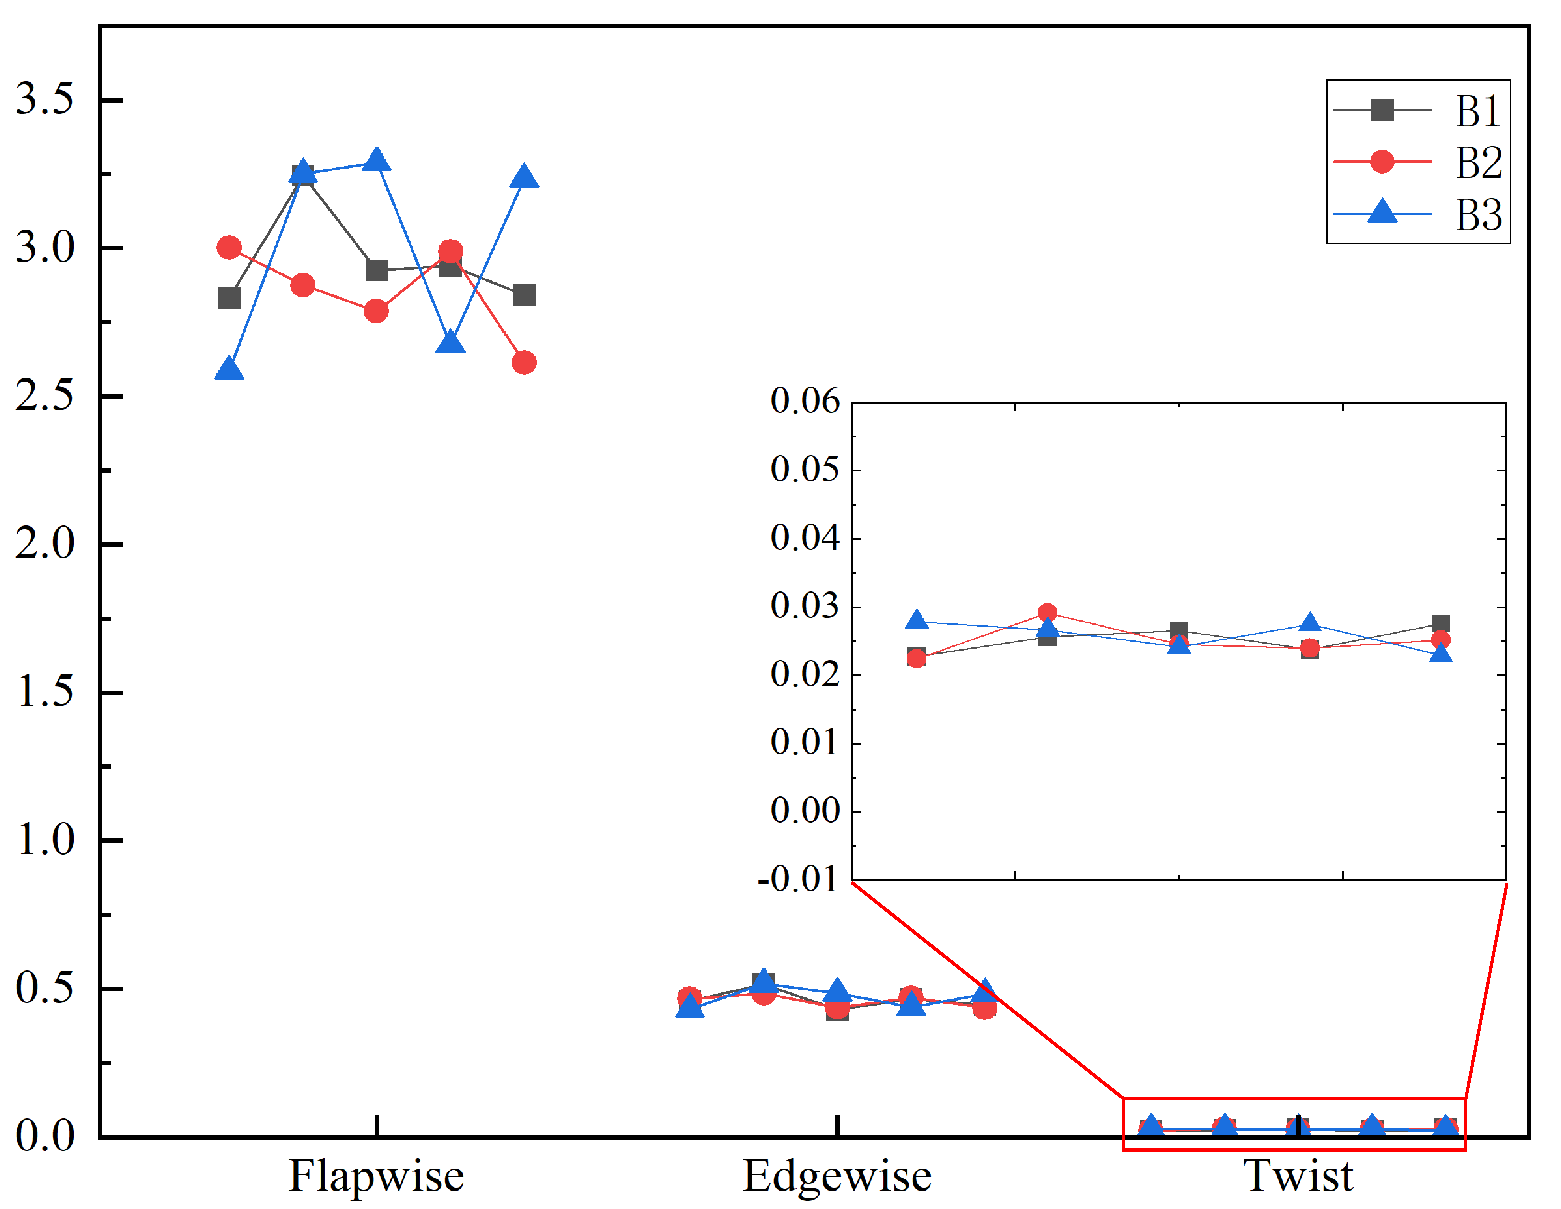
Further on the typhoon conditions time domain decomposition analysis because the three blades are in the same kind of vibration state, so any one blade did not occur instability phenomenon, then did not occur, take the B1 blade typhoon conditions when the time domain data to every 200 s for an interval decomposition, divided into five small intervals, take the three blade tip of each interval of three degrees of freedom to calculate the deflection of the mean square heel as shown in Figure 13.
Comparing the time-domain diagram of the blade tip’s flapwise, edgewise, and torsional angular deflection, as shown in Figure 14, the frequency of the base deflection in the three directions of the blade tip is the same, and the flapwise deflection and the torsional angular deflection have a particular phase difference. The edgewise deflection has a phase difference of about 90° with the flapwise and torsional angular deflection. Compared with the time-domain characteristics of the aeroelastic instability boundary, there is no aeroelastic instability boundary in the simulation process of the three blades in the typhoon condition. The flapwise and torsional angular deflection has a phase difference of about 90°, and the edgewise has a phase difference of 180°.
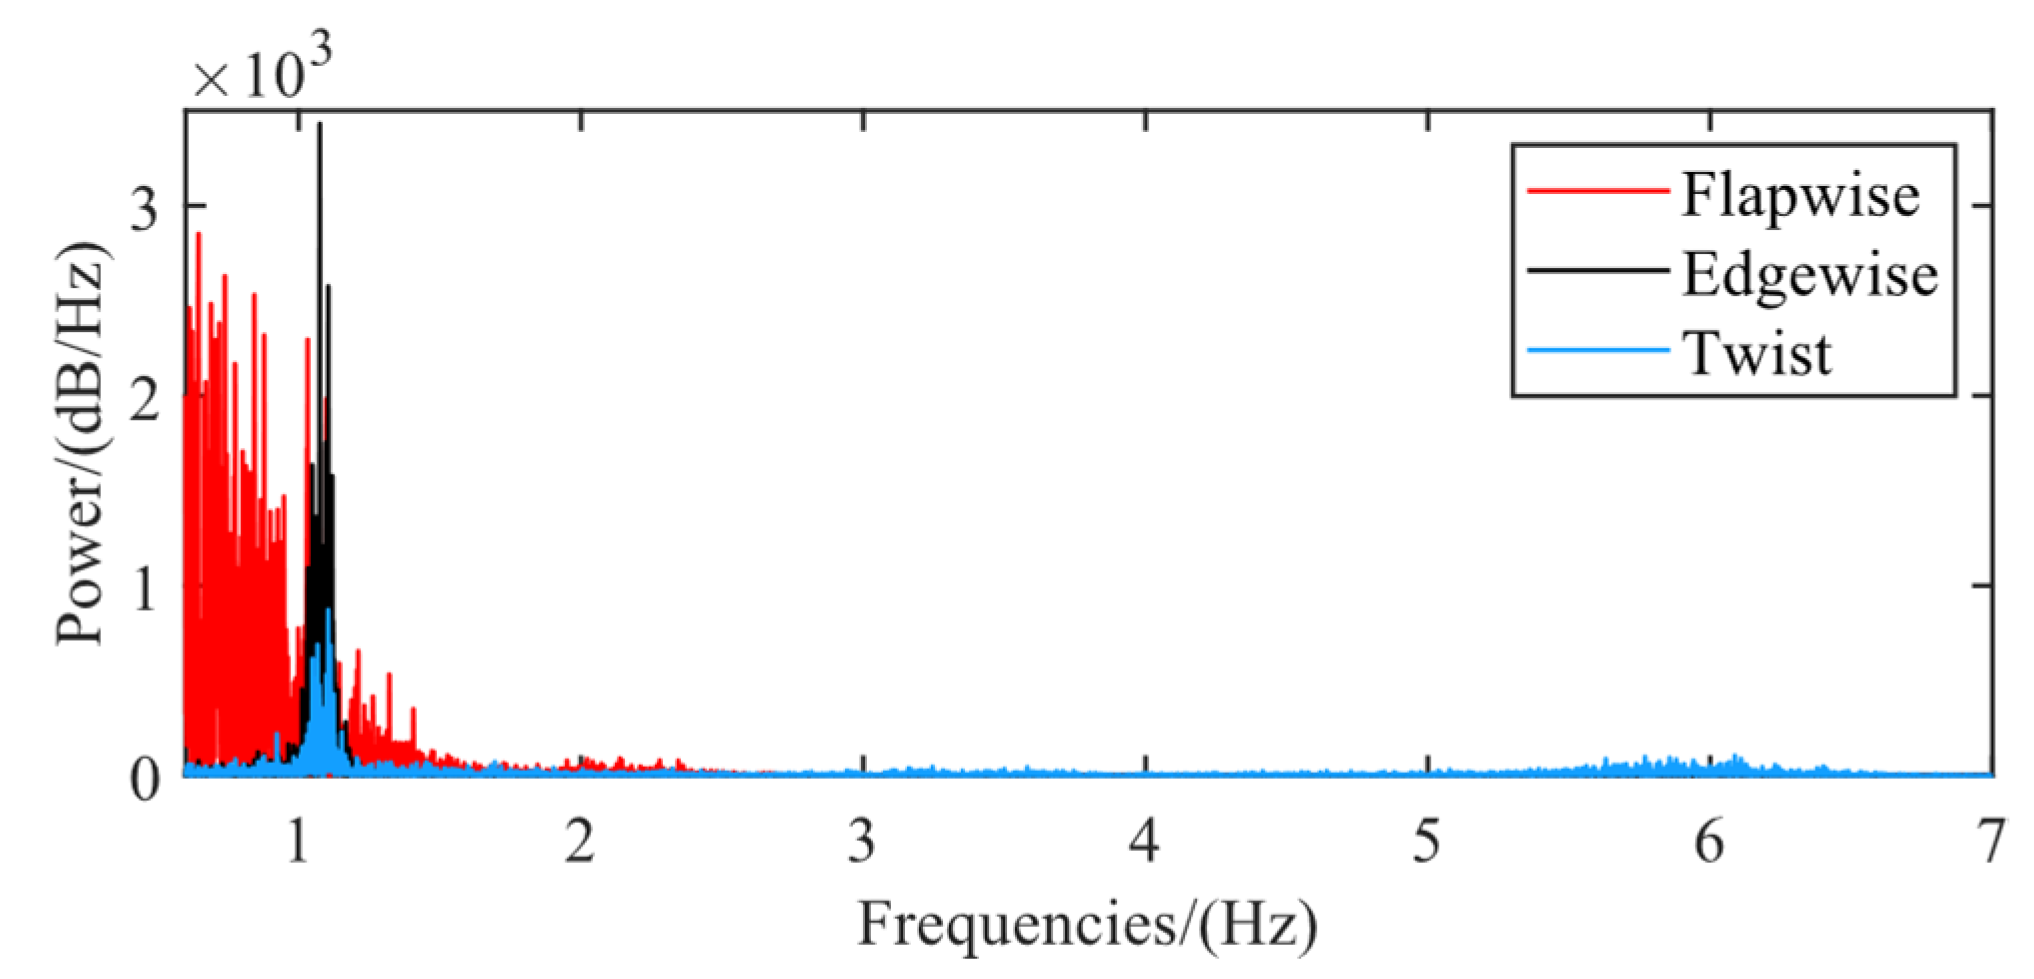
The frequency domain analysis of the typhoon condition is shown in Figure 15. There are many wave peaks in the flapwise direction deflection power spectrum. The central location of the spectral peaks is reflected in the low-frequency band of 0.7 Hz. There is also a certain width of the frequency band near 1.99 Hz, and relative to the energy spectral peaks of the previous frequency band, the energy spectral peaks of the band are significantly reduced, and the energy is in a decreasing trend with the frequency increase. The edgewise deflection power spectrum has a very high spectral peak in a narrow frequency band near 1.11 Hz, and the torsional angular deflection power spectrum has a frequency distribution with a similar bandwidth to that of the edgewise deflection spectrogram at the exact location, with a much lower peak than the edgewise deflection spectral peak. In addition, there is a frequency band with a specific bandwidth near the frequency of 5.8 Hz, and the energy of this frequency band is lower than the peak of the spectrum of the previous frequency band.
Comparing the frequency analysis of the critical state of instability, the two frequency bands of the power spectrum of the flapwise deflection correspond to the intrinsic frequencies of the first two orders of modes of the flapwise deflection and have apparent demarcation, which indicates that the intrinsic frequency of the modes of the flapwise deflection under the condition of this wind field is not fused into the frequency of instability [37]. The high degree of overlap between the flapwise deflection and torsional angular deflection except for the 1.11 Hz also reflects that at this time, the torsional angular deflection of the generation is caused by the influence of the edgewise deflection and has not been linked with the flapwise deflection. In summary, the wind turbine did not experience aeroelastic instability during the typhoon conditions.

5. Conclusions

For the offshore NREL 5 MW wind turbine typhoon transit situation, the blade vibration state of the blade aeroelastic stability analysis, the process of considering the nonlinear geometry of the exact beam, and the the B-L dynamic stall theory of the coupling analysis lead to the following conclusions:
The analysis of the blade tip’s transient response, when comparing rated operating conditions with those during a typhoon, reveals that deformation in the lower left half-plane of the wind turbine experiences the most significant increase in displacement mean square error across flapwise, edgewise, and twist directions, showing increases of 14.9%, 13.0%, and 123.0% compared to rated conditions, respectively. In contrast, the blade located in the lower right half-plane demonstrates the smallest increase in mean square error for flapwise, edgewise, and twist angular displacements under typhoon influence, with increases of 8.3%, 9.7%, and 43.8% overrated conditions, respectively. Consequently, to enhance typhoon resistance and minimize the risk of fatigue fracture or outright failure, optimizing the flap stiffness, edgewise stiffness, and twist stiffness based on the observed deformations, mainly those akin to blade B3’s behavior, is crucial.
The assessment of the aeroelastic stability boundary for a 5 MW wind turbine’s flexible blade, utilizing a combination of time domain and frequency domain analyses, indicates that the key indicators of blade instability include an instability rotational speed of 21.5 rpm and a nonlinear large deformation of the blade tip, which increases by at least 80% during unstable conditions compared to stable periods. Additionally, flapwise and torsional angular displacements exhibit a 90° phase difference in the time domain. Frequency domain analysis identifies the instability frequency at 4.81 Hz, highlighting the explicit coupling between flapwise and torsional modes. This analysis reveals that increased rotor rotational speed significantly influences the coupling between flapwise and edgewise modes during instability.
Under the typhoon wind conditions outlined in “IEC 61400-1-2019”, the aeroelastic stability of wind turbine blades was assessed. By integrating time domain and frequency domain analyses with blade displacement measurements under rated operating conditions, it was determined that the maximum increase in mean square error of the tip displacement of flexible blades during typhoon conditions ranges between 10% and 32%, not exceeding 80%. The phase difference between flapwise (bending) and twist angular displacements remains below 90°, indicating no mutual excitation state. The power spectrum predominantly features the torsional vibration mode influenced by oscillation, with no evident coupling between flapwise and torsional vibration modes. Consequently, the wind turbine is unlikely to experience aeroelastic instability under typhoon conditions.
As per our findings, flutter might not be the predominant factor causing blade damage in wind turbines during typhoons. Therefore, when devising wind turbine designs to withstand typhoon conditions, our focus should be directed toward enhancing the deformation control of the blades, particularly in the lower left half of the blade rotation plane. With this in mind, we plan to delve deeper into research concerning blade stiffness, quality, and other relevant factors.

Author Contributions

Investigation, X.F., Z.G. and M.Z.; writing—original draft, H.L.; writing—review and editing, Q.H. and D.T. All authors have read and agreed to the published version of the manuscript.

Funding

This study was financially supported by the National Natural Science Foundation of China (Project No. 51766017) and the Natural Science Foundation of Inner Mongolia Autonomous Region of China (2022MS05050).

Data Availability Statement

The data presented in this study are available at the request of the corresponding author. The data are not publicly available due to the content of confidential information/trade secrets in them.

Conflicts of Interest

The authors declare no conflict of interest.

References

  1. Hou, P.; Hu, W.; Soltani, M.; Chen, C.; Zhang, B.; Chen, Z. Offshore wind farm layout design considering optimized power dispatch strategy. IEEE Trans. Sustain. Energy 2016, 8, 638–647. [Google Scholar] [CrossRef]
  2. Alex. “Global Wind Report 2023”. Global Wind Energy Council (Blog). Available online: https://gwec.net/globalwindreport2023/ (accessed on 14 February 2023).
  3. Yao, G.; Yang, H.M.; Zhou, L.D.; Li, D.D.; Li, C.B.; Wang, J. Development status and key technologies of large-capacity offshore wind turbines. Autom. Electr. Power Syst. 2021, 45, 33–47. [Google Scholar]
  4. Chen, X.; Xu, J.Z. Structural Failure Analysis of Wind Turbines Impacted by Super Typhoon Usagi. Eng. Fail. Anal. 2016, 60, 391–404. [Google Scholar] [CrossRef]
  5. Jingquan, W.; Zhengqing, C. Analysis of risks and measures on the blade damage of offshore wind turbine during strong typhoons—Enlightenment from Red Bay wind farm. Eng. Sci. 2010, 12, 32–34. [Google Scholar]
  6. Chou, J.-S.; Chiu, C.-K.; Huang, I.-K.; Chi, K.-N. Failure analysis of wind turbine blade under critical wind loads. Eng. Fail. Anal. 2013, 27, 99–118. [Google Scholar] [CrossRef]
  7. IEC 61400-1-2019; Wind Energy Generation Systems—Part 1: Design Requirements. International Electrotechnical Commision: Geneva, Switzerland, 2019.
  8. Li, J.; Li, Z.; Jiang, Y.; Tang, Y. Typhoon Resistance Analysis of Offshore Wind Turbines: A Review. Atmosphere 2022, 13, 451. [Google Scholar] [CrossRef]
  9. Liu, J.Z.; Ma, L.F.; Wang, Q.H.; Fang, F.; Zhu, Y. Offshore wind power supports China’s energy transition. Strateg. Study Chin. Acad. Eng. 2021, 23, 149–159. [Google Scholar]
  10. Chen, Y.; Wu, D.; Yu, Y.; Gao, W. Do cyclone impacts really matter for the long-term performance of an offshore wind turbine? Renew. Energy 2021, 178, 184–201. [Google Scholar] [CrossRef]
  11. Mishnaevsky, L.; Branner, K.; Petersen, H.N.; Beauson, J.; McGugan, M.; Sørensen, B.F. Materials for Wind Turbine Blades: An Overview. Materials 2017, 10, 1285. [Google Scholar] [CrossRef] [PubMed]
  12. Kelley, C.L.; Paquette, J. Investigation of flutter for large, highly flexible wind turbine blades. J. Phys. Conf. Ser. 2020, 1618, 052078. [Google Scholar] [CrossRef]
  13. Hansen, M.H. Aeroelastic Stability Analysis of Wind Turbines Using an Eigenvalue Approach. Wind Energy 2004, 7, 133–143. [Google Scholar] [CrossRef]
  14. Jundong, H.; Hongjian, X.; Deyuan, L.; Kunxiang, G. Nonlinear aeroelastic modal analysis of large wind turbine flexible blades. J. Mech. Eng. 2020, 56, 180–187. [Google Scholar] [CrossRef]
  15. Dai, L.; Bai, X.; Wang, X.; Ye, S. Predictive analysis of large wind turbine blade flutter boundaries. J. Eng. Thermophys. 2022, 43, 2357–2362. [Google Scholar]
  16. Shakya, P.; Sunny, M.R.; Maiti, D.K. Nonlinear Flutter Analysis of a Bend-Twist Coupled Composite Wind Turbine Blade in Time Domain. Compos. Struct. 2022, 284, 115216. [Google Scholar] [CrossRef]
  17. Han, R.; Wang, L.; Wang, T.; Gao, Z.; Wu, J. Study of Dynamic Response Characteristics of the Wind Turbine Based on Measured Power Spectrum in the Eyewall Region of Typhoons. Appl. Sci. 2019, 9, 2392. [Google Scholar] [CrossRef]
  18. Wang, H.; Ke, S.T.; Wang, T.G.; Zhu, S.Y. Typhoon-induced vibration response and the working mechanism of large wind turbine considering multi-stage effects. Renew. Energy 2020, 153, 740–758. [Google Scholar] [CrossRef]
  19. Tang, D.; Xu, M.; Mao, J.; Zhu, H. Unsteady Performances of a Parked Large-Scale Wind Turbine in the Typhoon Activity Zones. Renew. Energy 2020, 149, 617–630. [Google Scholar] [CrossRef]
  20. Li, Z.; Gao, Z.; Zhang, L.; Wang, J. Dynamic characterization of megawatt-class wind turbine under extreme wind conditions. Chin. J. Electr. Eng. 2024. accepted. [Google Scholar]
  21. Ye, K.; Chun, L.; Qinwei, D.; Zhou, Y. Structural dynamic response of large wind turbine under multi-body dynamics simulation. J. Sol. Energy 2018, 5, 1459–1466. [Google Scholar]
  22. Jonkman, B.; Mudafort, R.M.; Platt, A.; Branlard, E.; Sprague, M.; Vijayakumar, G.; Buhl, M.; Ross, H.; Bortolotti, P.; Ananthan, S.; et al. OpenFAST/Openfast: OpenFAST v3.2.1. Available online: https://zenodo.org/records/6949650 (accessed on 1 August 2022).
  23. Jonkman, J.M.; Hayman, G.J.; Jonkman, B.J.; Damiani, R.R.; Murray, R.E. AeroDyn V15 User’s Guide and Theory Manual; Renewable Energy: Masdar City, Abu Dhabi, 2015. [Google Scholar]
  24. Wang, Q.; Sprague, M.A.; Jonkman, J.; Johnson, N.; Jonkman, B. BeamDyn: A High-fidelity Wind Turbine Blade Solver in the FAST Modular Framework. Wind Energy 2017, 20, 1439–1462. [Google Scholar] [CrossRef]
  25. Vatne, S.R. Aeroelastic Instability and Flutter for a 10 MW Wind Turbine. Bachelor’s Thesis, Institut for Energi- og Procesteknik, Trondheim, Norway, 2011. [Google Scholar]
  26. Lobitz, D.W. Aeroelastic stability predictions for a MW-sized blade. Wind Energy 2004, 7, 211–224. [Google Scholar] [CrossRef]
  27. Chen, B.; Hua, X.G.; Zhang, Z.; Basu, B.; Nielsen, S.R. Monitoring of wind turbine blades for flutter instability. Struct. Monit. Maint. 2017, 4, 115–131. [Google Scholar]
  28. Jonkman, J.; Butterfield, S.; Musial, W.; Scott, G. Definition of a 5-MW Reference Wind Turbine for Offshore System Development (No. NREL/TP-500-38060); National Renewable Energy: Golden, CO, USA, 2009.
  29. Branlard, E.; Jonkman, B.; Pirrung, G.R.; Dixon, K.; Jonkman, J. Dynamic Inflow and Unsteady Aerodynamics Models for Modal and Stability Analyses in OpenFAST. J. Phys. Conf. Ser. 2022, 2265, 032044. [Google Scholar] [CrossRef]
  30. Hayat, K.; De Lecea, A.G.M.; Moriones, C.D.; Ha, S.K. Flutter Performance of Bend–Twist Coupled Large-Scale Wind Turbine Blades. J. Sound Vib. 2016, 370, 149–162. [Google Scholar] [CrossRef]
  31. Li, B.; Tian, D.; Wu, X.; Meng, H.; Su, Y. Flutter analysis and parameter sensitivity of ultra-large wind turbine blades. J. Sol. Energy 2023, 16, 295–301. [Google Scholar]
  32. Shakya, P.; Sunny, M.R.; Maiti, D.K. A parametric study of flutter behavior of a composite wind turbine blade with bend-twist coupling. Compos. Struct. 2019, 207, 764–775. [Google Scholar] [CrossRef]
  33. Lu, M.-M.; Ke, S.-T.; Wu, H.-X.; Gao, M.-E.; Tian, W.-X.; Wang, H. A Novel Forecasting Method of Flutter Critical Wind Speed for the 15 MW Wind Turbine Blade Based on Aeroelastic Wind Tunnel Test. J. Wind. Eng. Ind. Aerodyn. 2022, 230, 105195. [Google Scholar] [CrossRef]
  34. Holierhoek, J.G. Aeroelastic Stability Models. In Handbook of Wind Energy Aerodynamics; Springer: Berlin/Heidelberg, Germany, 2020; pp. 1–45. [Google Scholar]
  35. Bir, G. User’s Guide to BModes (Software for Computing Rotating Beam-Cupled Modes); Renewable Energy: Masdar City, Abu Dhabi, 2005. [Google Scholar]
  36. Resor, B.R. Definition of a 5MW/61.5 m Wind Turbine Blade Reference Model; No. SAND2013-2569; Sandia National Lab. (SNL-NM): Albuquerque, NM, USA, 2013.
  37. Yin, F.-F.; Chen, J.-J.; Chen, X.-J.; Xu, Y.-Q.; Shen, X.; Du, C.-H. Nonlinear aeroelastic stability of wind turbine airfoil structures under nonuniform incoming flow conditions. J. Sol. Energy 2023, 5, 442–448. [Google Scholar]
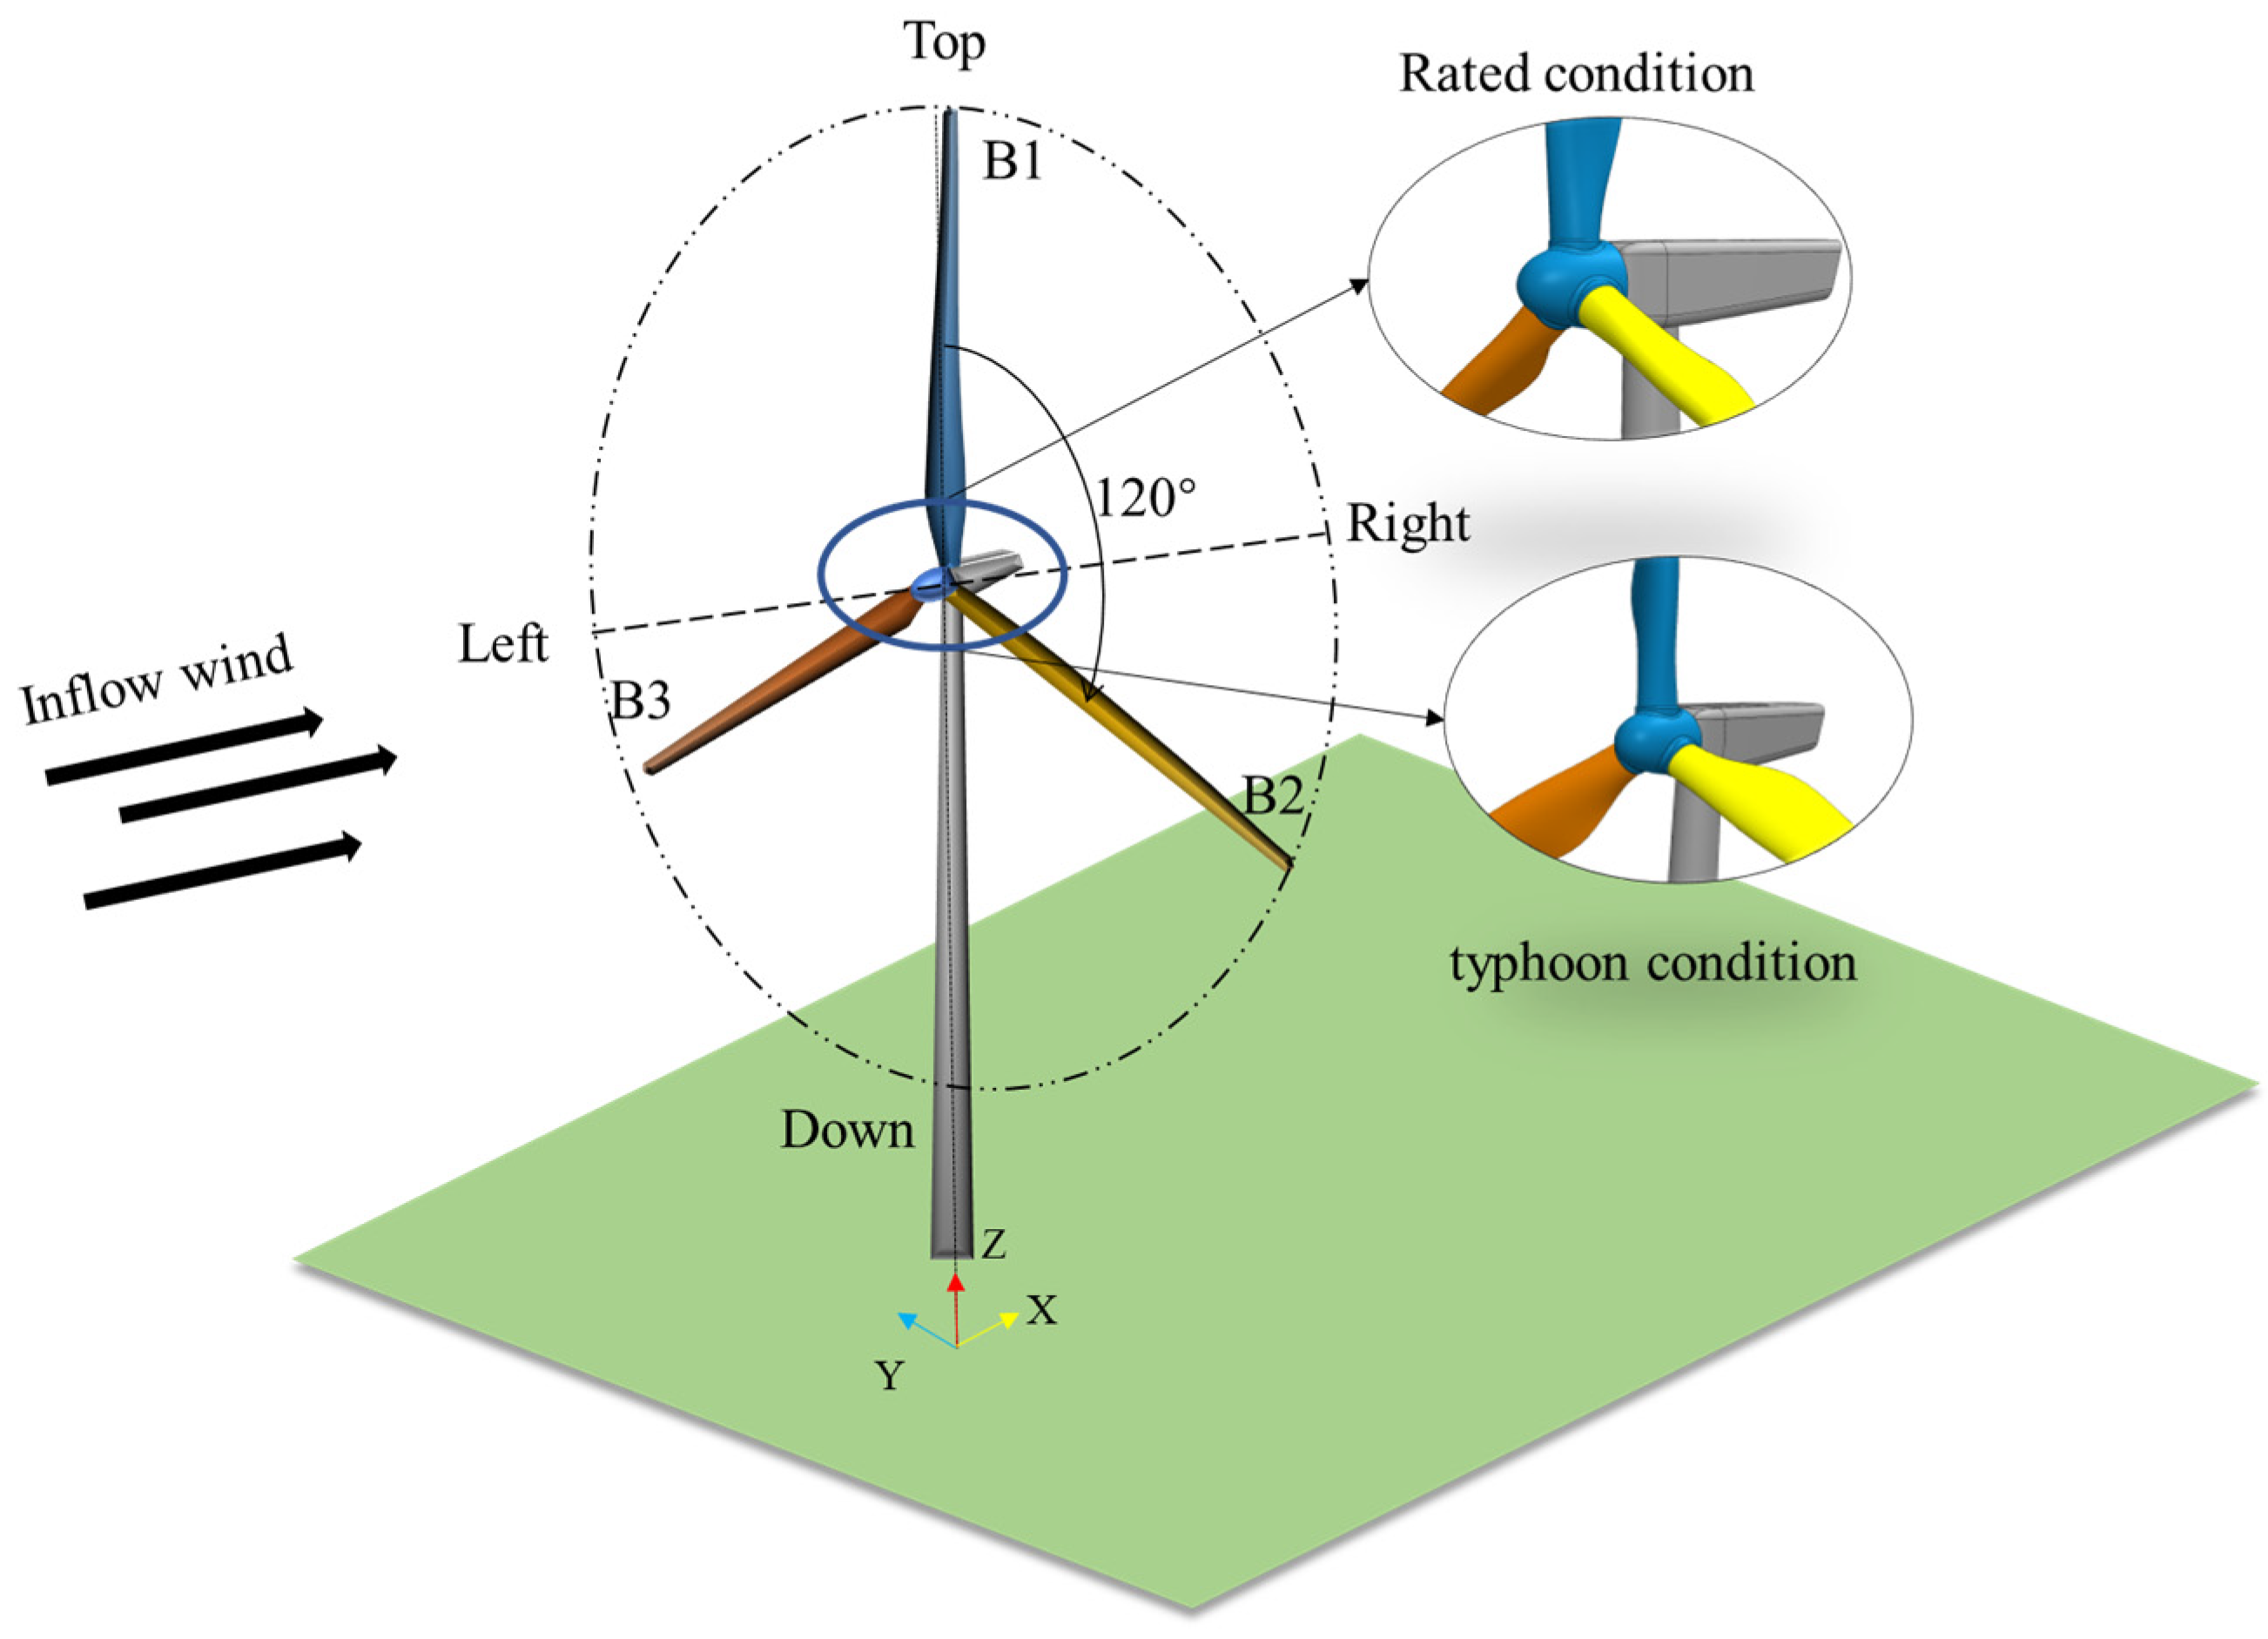
Figure 1. Initial position of wind turbine shutdown. B1—blades located at the top of the plane of rotation and perpendicular to the floor; B2—blades located in the lower half plane to the right of the plane of rotation; B3—blades located in the lower left half of the plane of rotation.
Energies 17 01254 g001
Figure 2. Typhoon full-domain flow wind field modeling.
Energies 17 01254 g002
Figure 3. OpenFAST simulation module construction.
Energies 17 01254 g003
Figure 4. Separation point location.
Energies 17 01254 g004
Figure 5. Blade tip deflection under three-blade typhoon conditions. (a) Flapwise direction; (b) Edgewise direction; (c) Twist direction.
Energies 17 01254 g005
Figure 6. Comparison of the maximum deflection of the blade tip for different working conditions.
Energies 17 01254 g006
Figure 7. Stopping—rated operating condition deflection means square error increment.
Energies 17 01254 g007
Figure 8. Rotor speed and three-degree-of-freedom deflection. (The dotted line shows the moment of flutter).
Energies 17 01254 g008
Figure 9. Mean square deviation of deflection in the time series interval of runaway analysis.
Energies 17 01254 g009
Figure 10. Time-domain diagram of blade deflection before and after instability. (a) Before flutter occurs; (b) After flutter occurs.
Energies 17 01254 g010
Figure 11. Frequency modal coupling of instability state. (a) The first spectral peak; (b) The second spectral peak; (c) The third spectral peak; (d) The fourth spectral peak.
Energies 17 01254 g011
Figure 12. Root mean square of time series interval.
Energies 17 01254 g012
Figure 13. Root mean square of deflection of blade tip in the whole process.
Energies 17 01254 g013
Figure 14. Time-domain diagram of blade tip vibration deflection.
Energies 17 01254 g014
Figure 15. Blade tip flapwise power spectrum.
Energies 17 01254 g015
Table 1. Main parameters of the NREL 5 MW wind turbine.
Parameter/UnitNumerical Value/Description
Rating/(MW)5
Rotor Orientation, ConfigurationUpwind, 3 Blades
Rotor, Hub Diameter/(m)126, 3
Hub Height/(m)90
Cut-In, Rated, Cut-Out Wind Speed/(m·s−1)3, 11.4, 25
Cut-In, Rated Rotor Speed/(m·s−1)6.9 rpm, 12.1 rpm
Rated Tip Speed/(m·s−1)80
Overhang, Shaft Tilt, Precone/(deg)5 m, 2.5°
Static Tip Clearance/(m)13.16
Rotor Mass/(kg)110,000
Nacelle Mass/(kg)240,000
Tower Mass/(kg)347,460
Table 2. Comparison of blade eigenfrequencies.
ModalityNRELOpenFASTDeviation
1st Flapwsise0.667 Hz0.669 Hz0.2%
1st Edgewise1.079 Hz1.110 Hz2.8%
2nd Flapwsise1.922 Hz1.996 Hz3.8%
2nd Edgewise-4.096 Hz-
3rd Flapwsise-4.624 Hz-
1st Twist-5.815 Hz-
Disclaimer/Publisher’s Note: The statements, opinions and data contained in all publications are solely those of the individual author(s) and contributor(s) and not of MDPI and/or the editor(s). MDPI and/or the editor(s) disclaim responsibility for any injury to people or property resulting from any ideas, methods, instructions or products referred to in the content.