

CO2 Storage Site Analysis, Screening, and Resource Estimation for Cenozoic Offshore Reservoirs in the Central Gulf of Mexico

 and
and
Abstract
1. Introduction
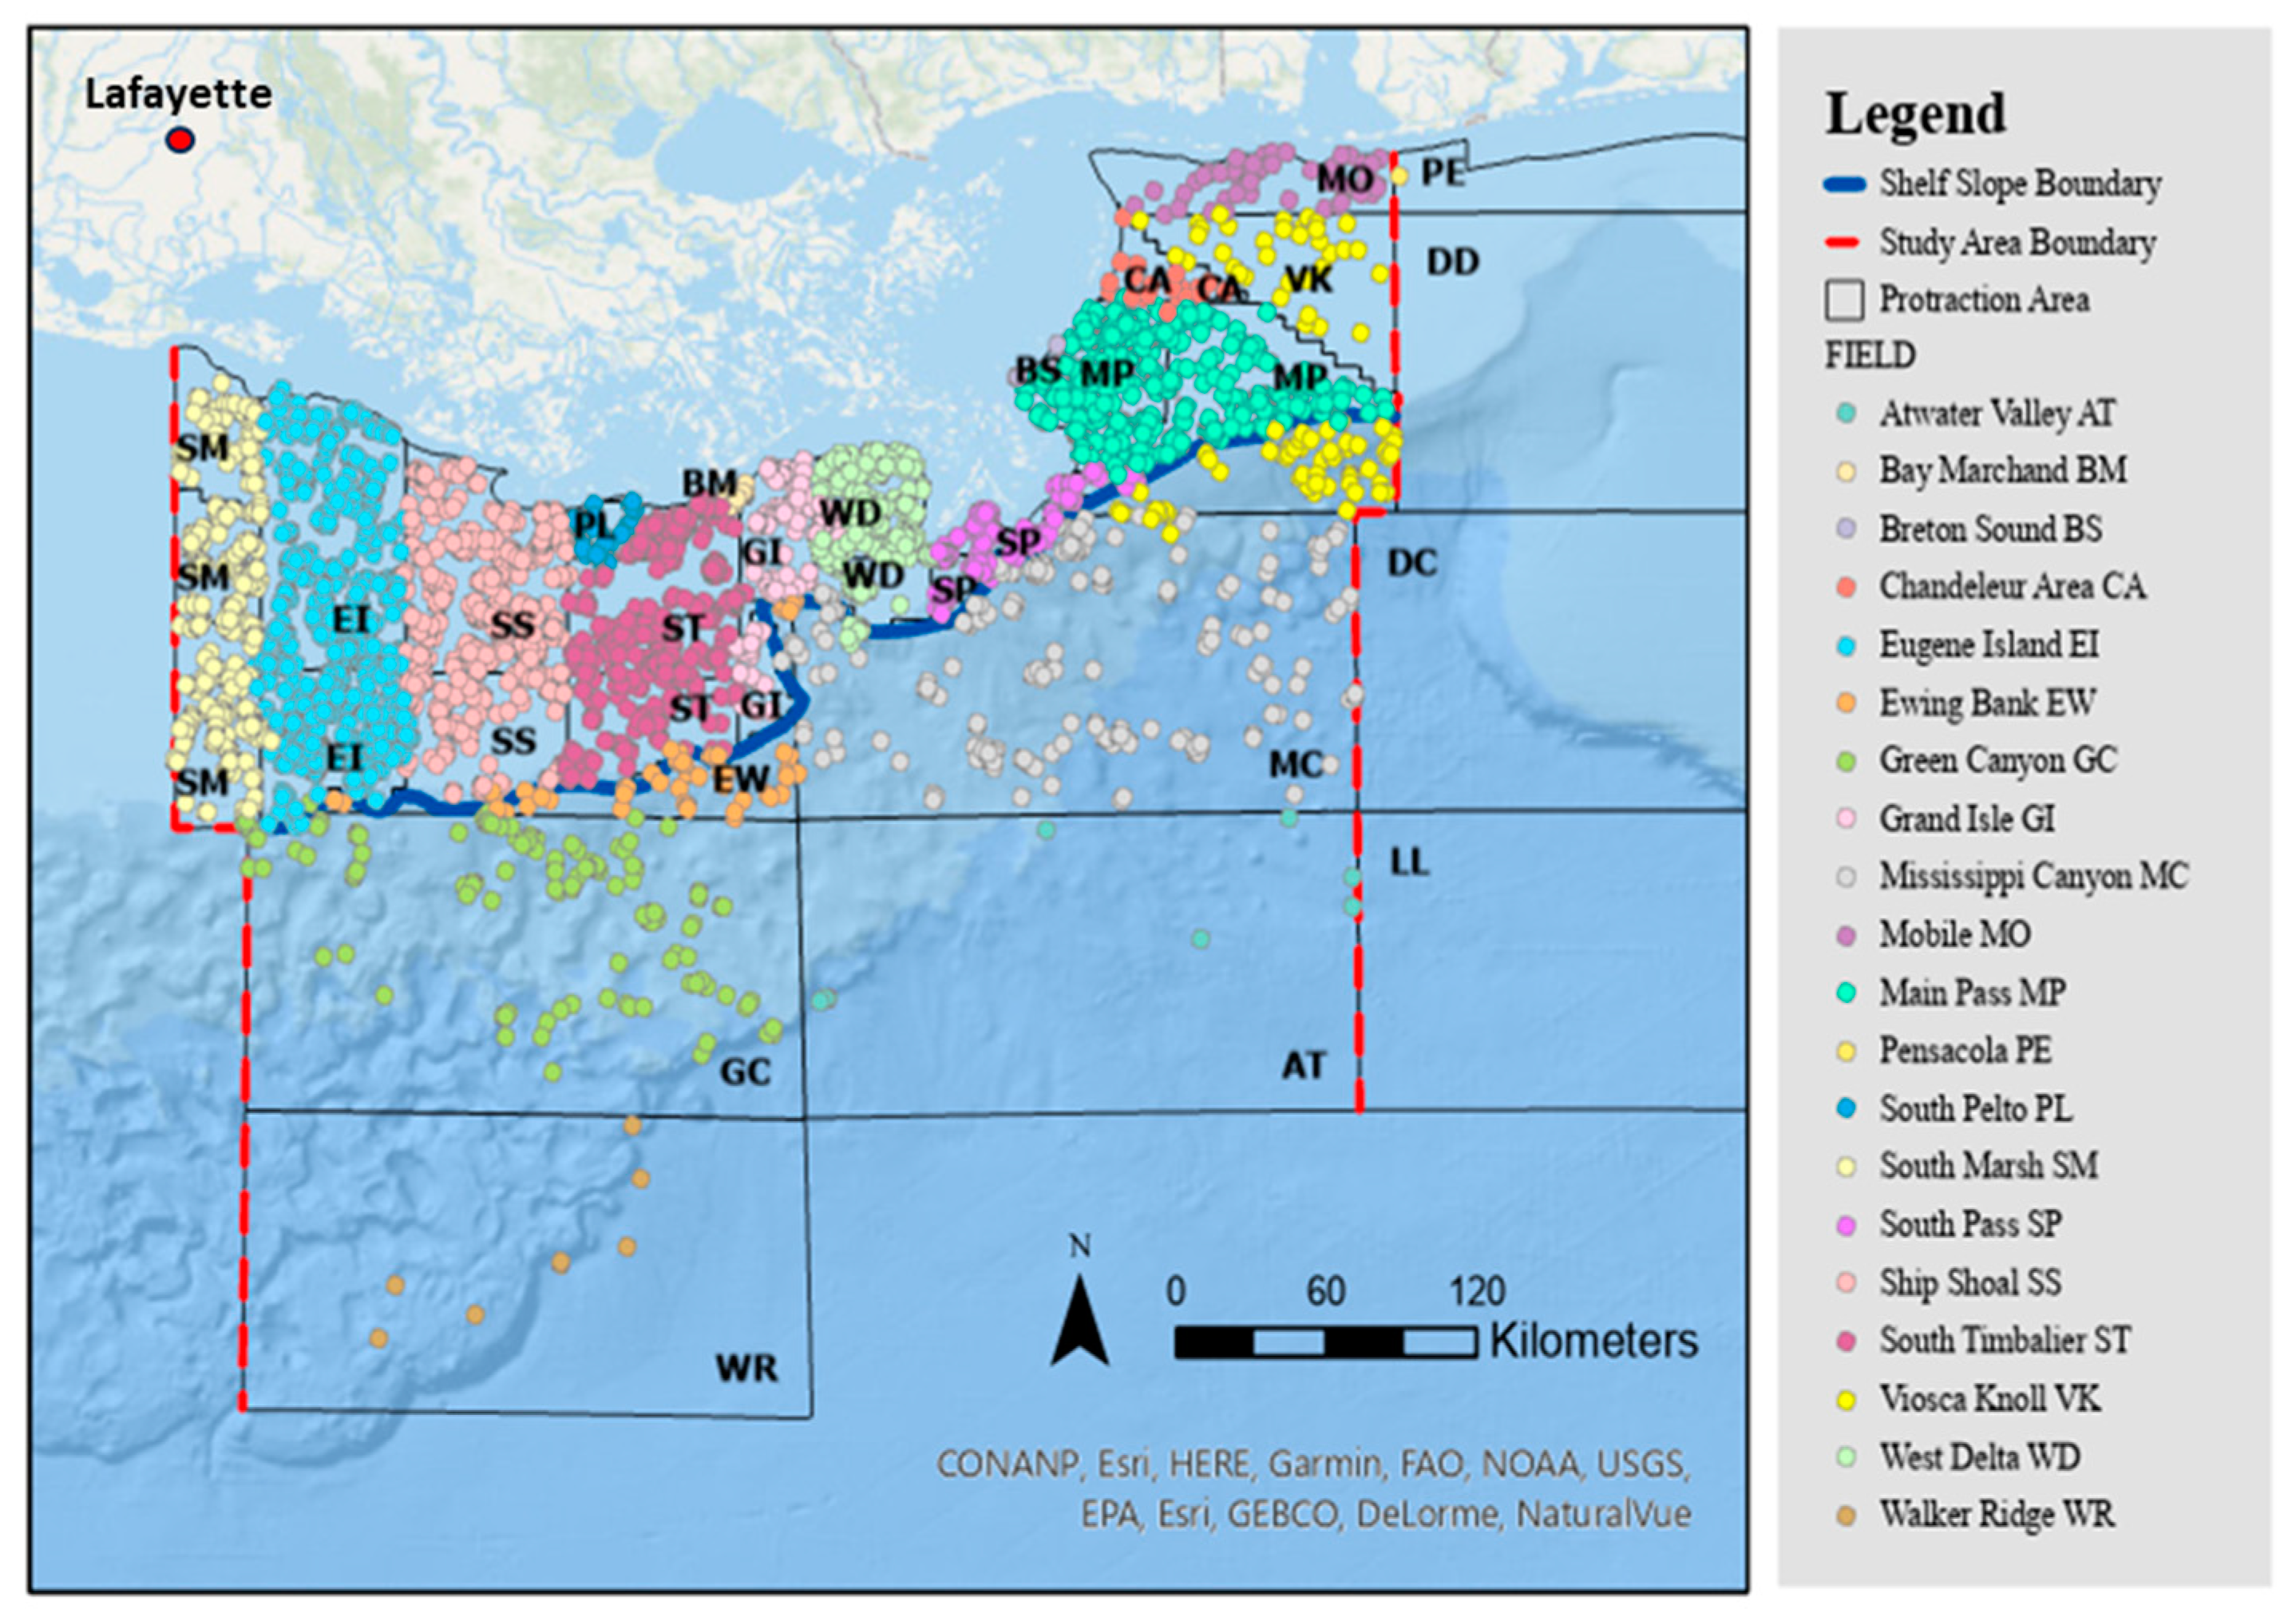
2. Study Area
3. Methodology
3.1. Dataset
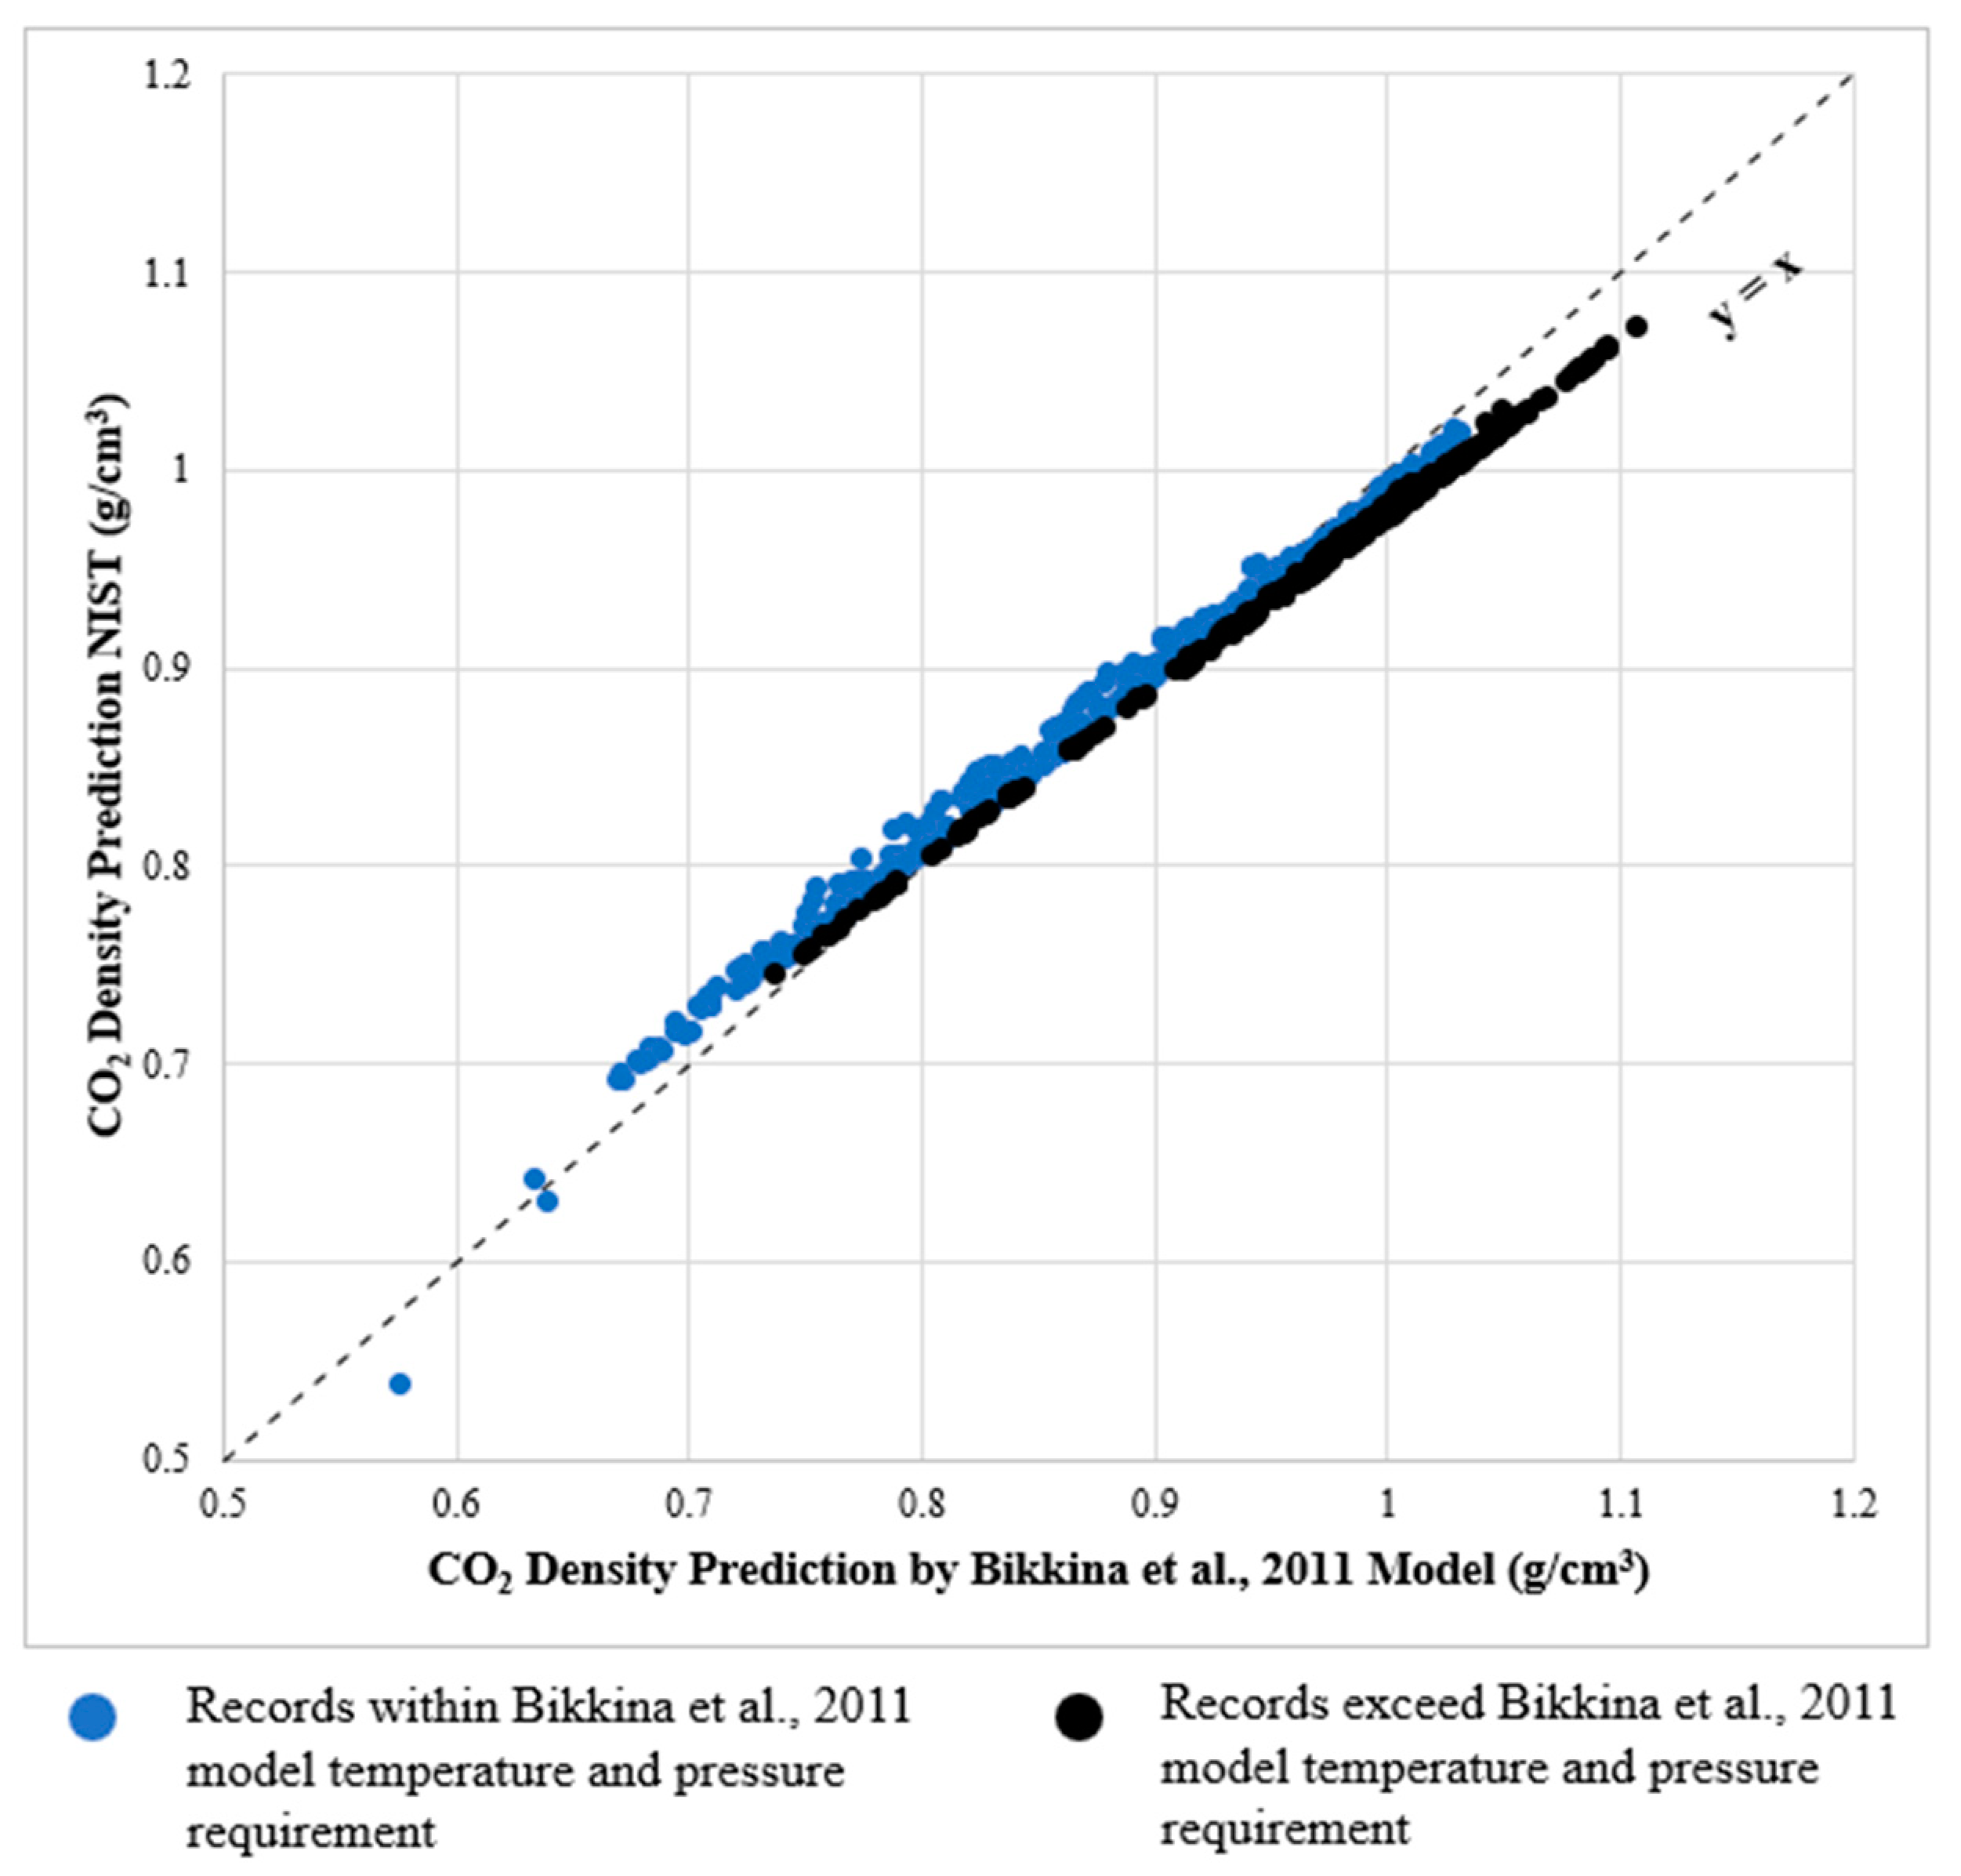
3.2. CO2 Density Estimation
3.3. CO2 Storage Sites Screening Criteria
3.4. CO2 Storage Estimation Methods
4. Results and Discussion
4.1. Key Screening Criteria Comparison between Shelf and Upper Slope
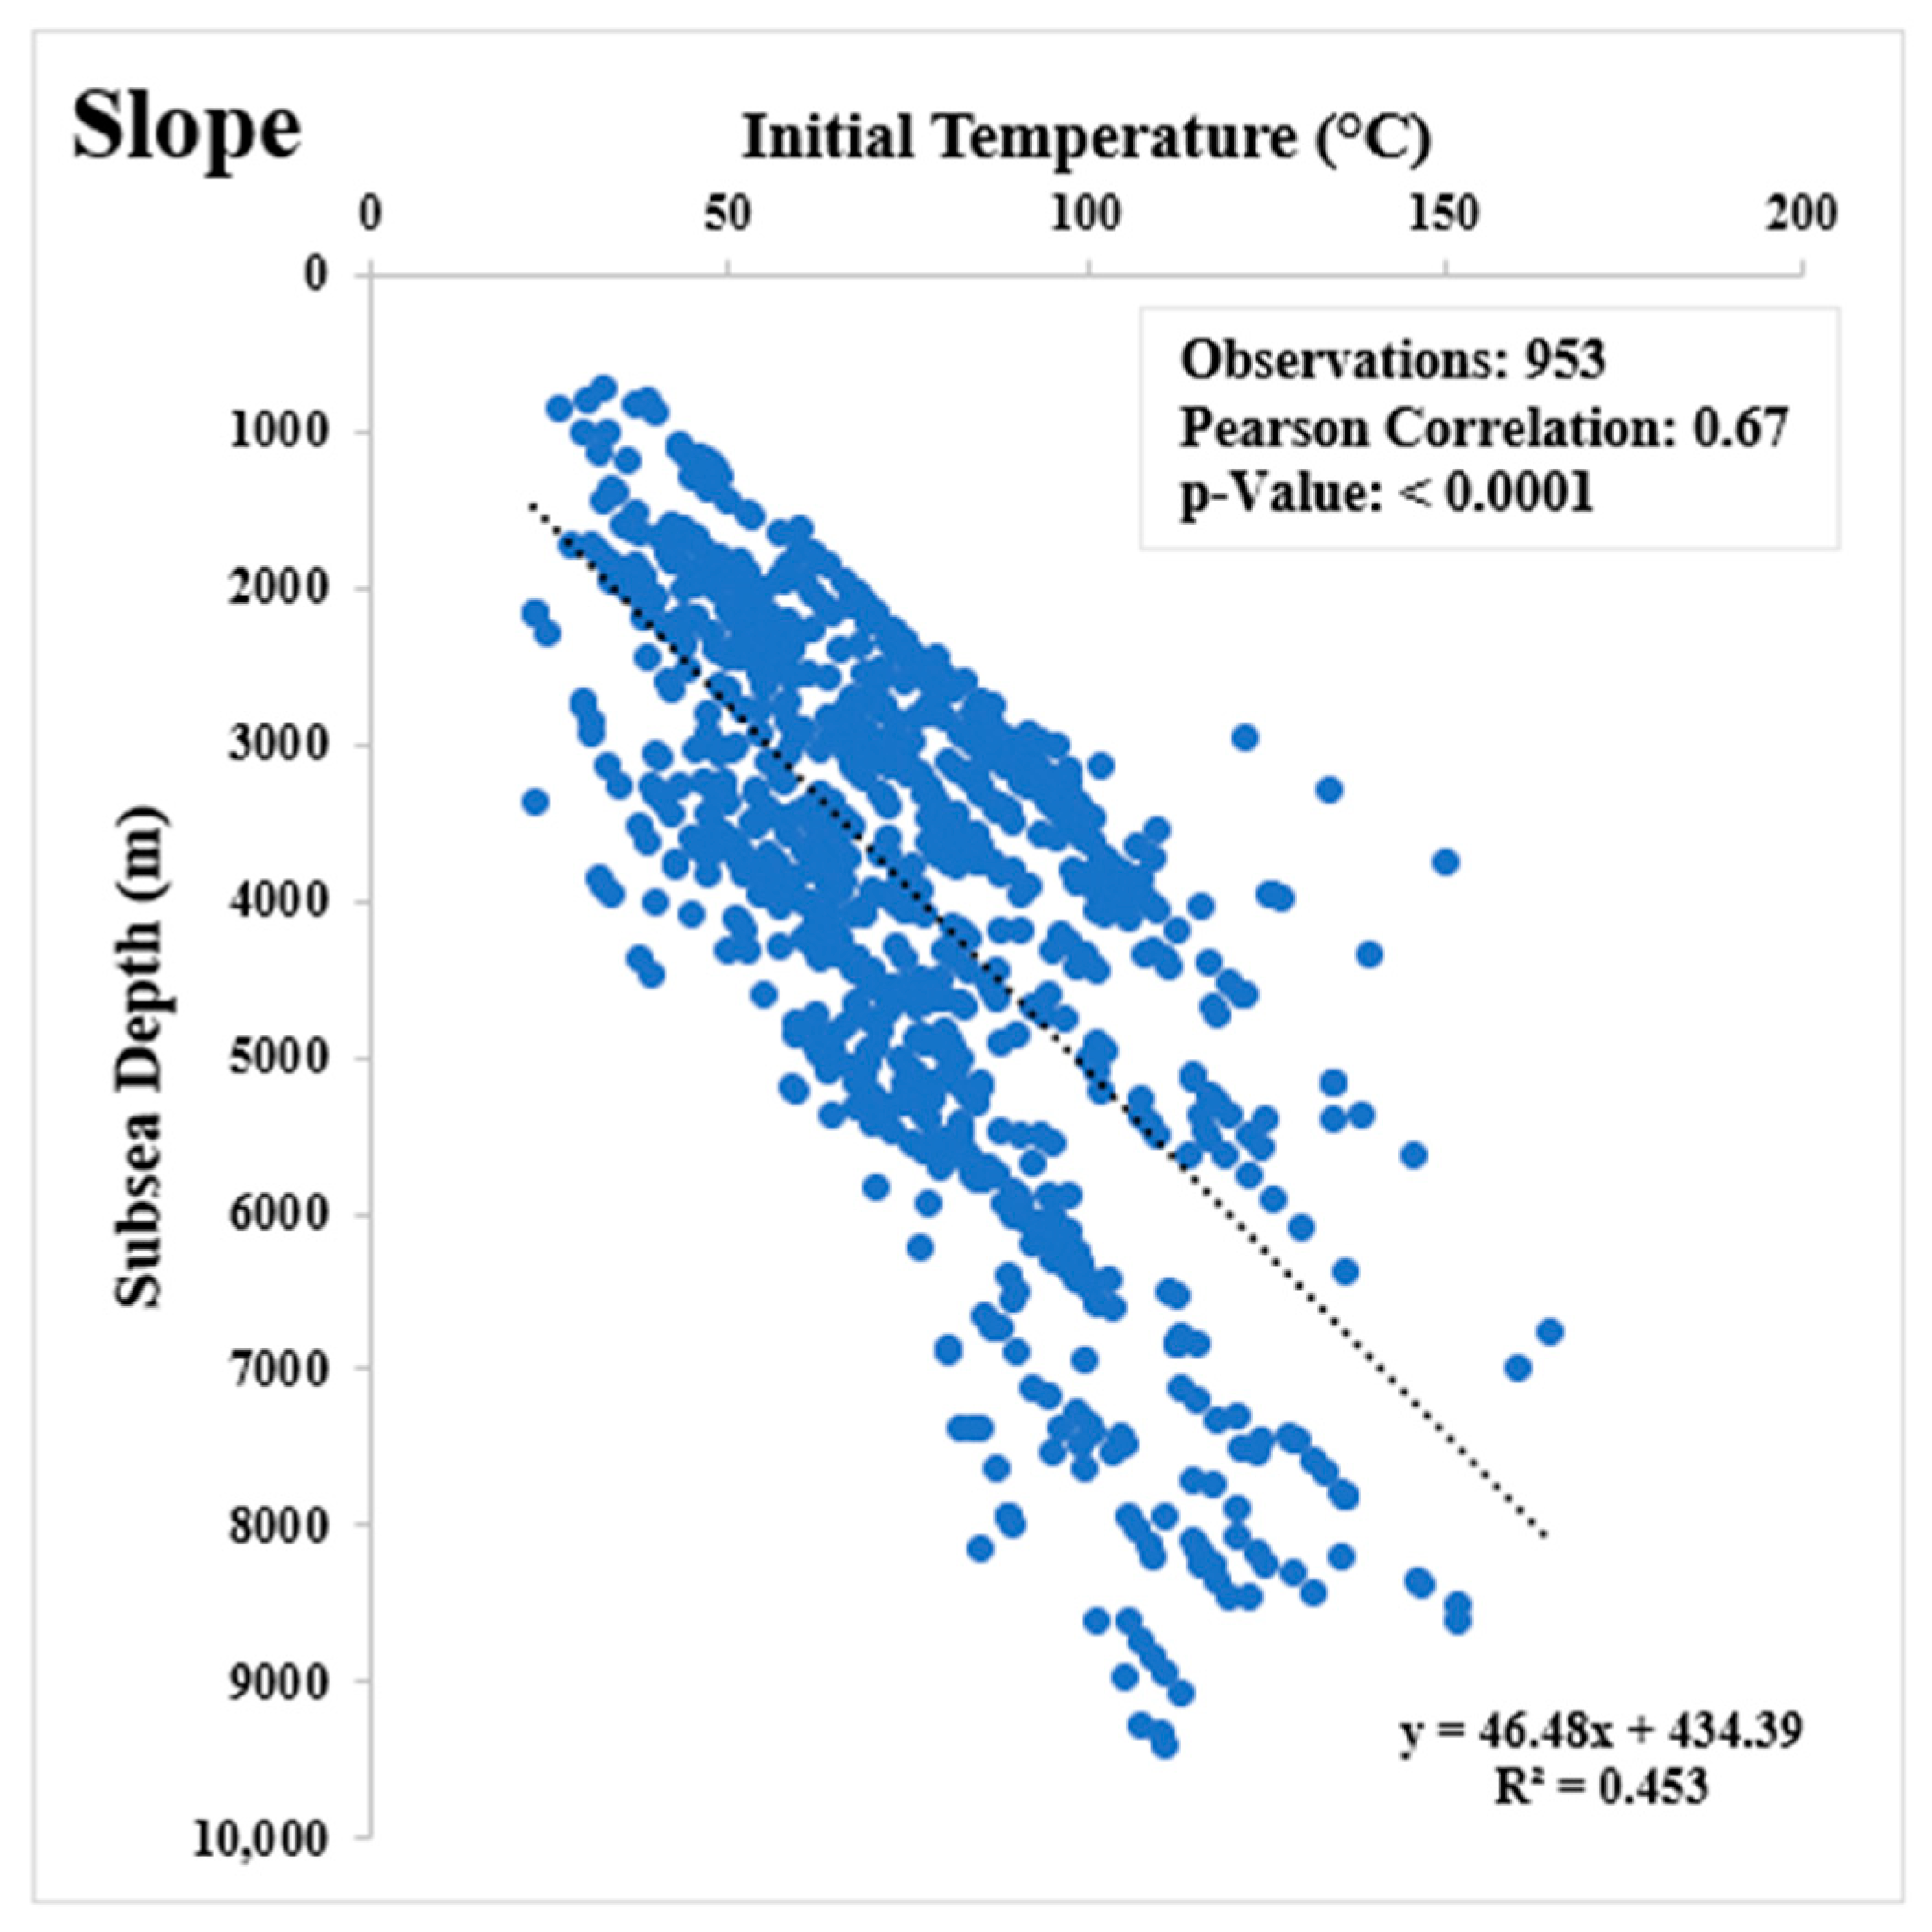
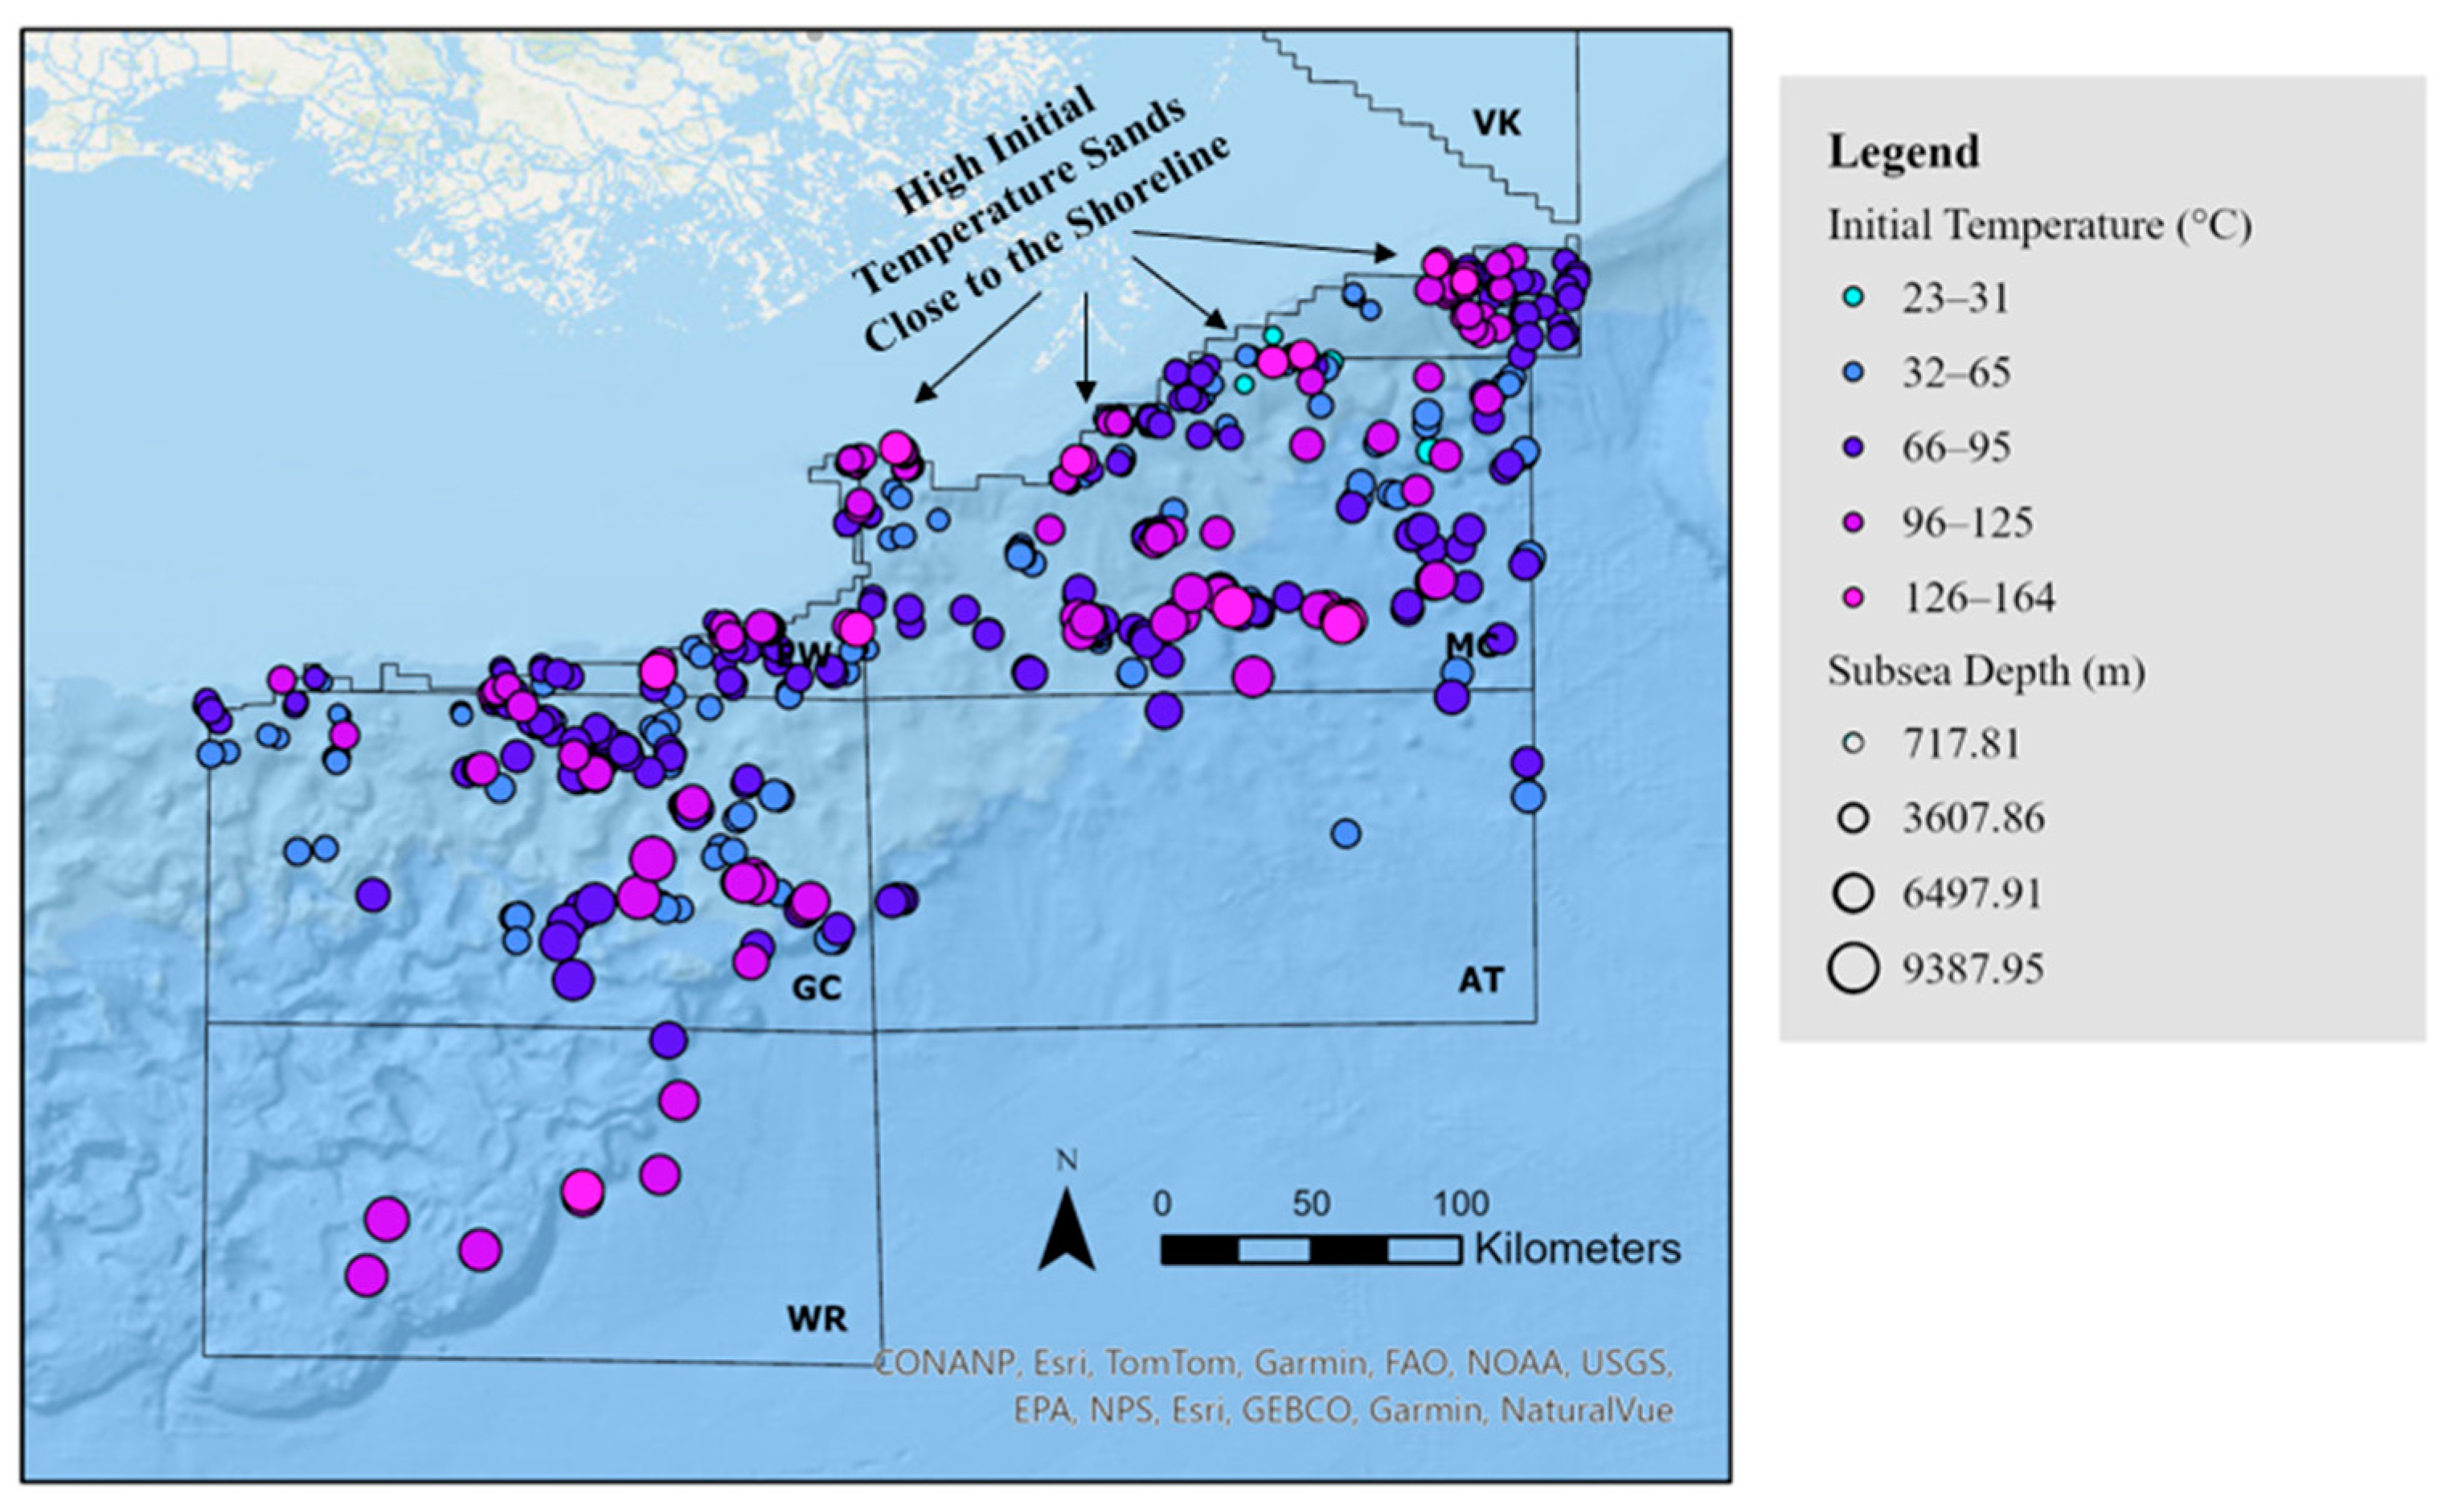
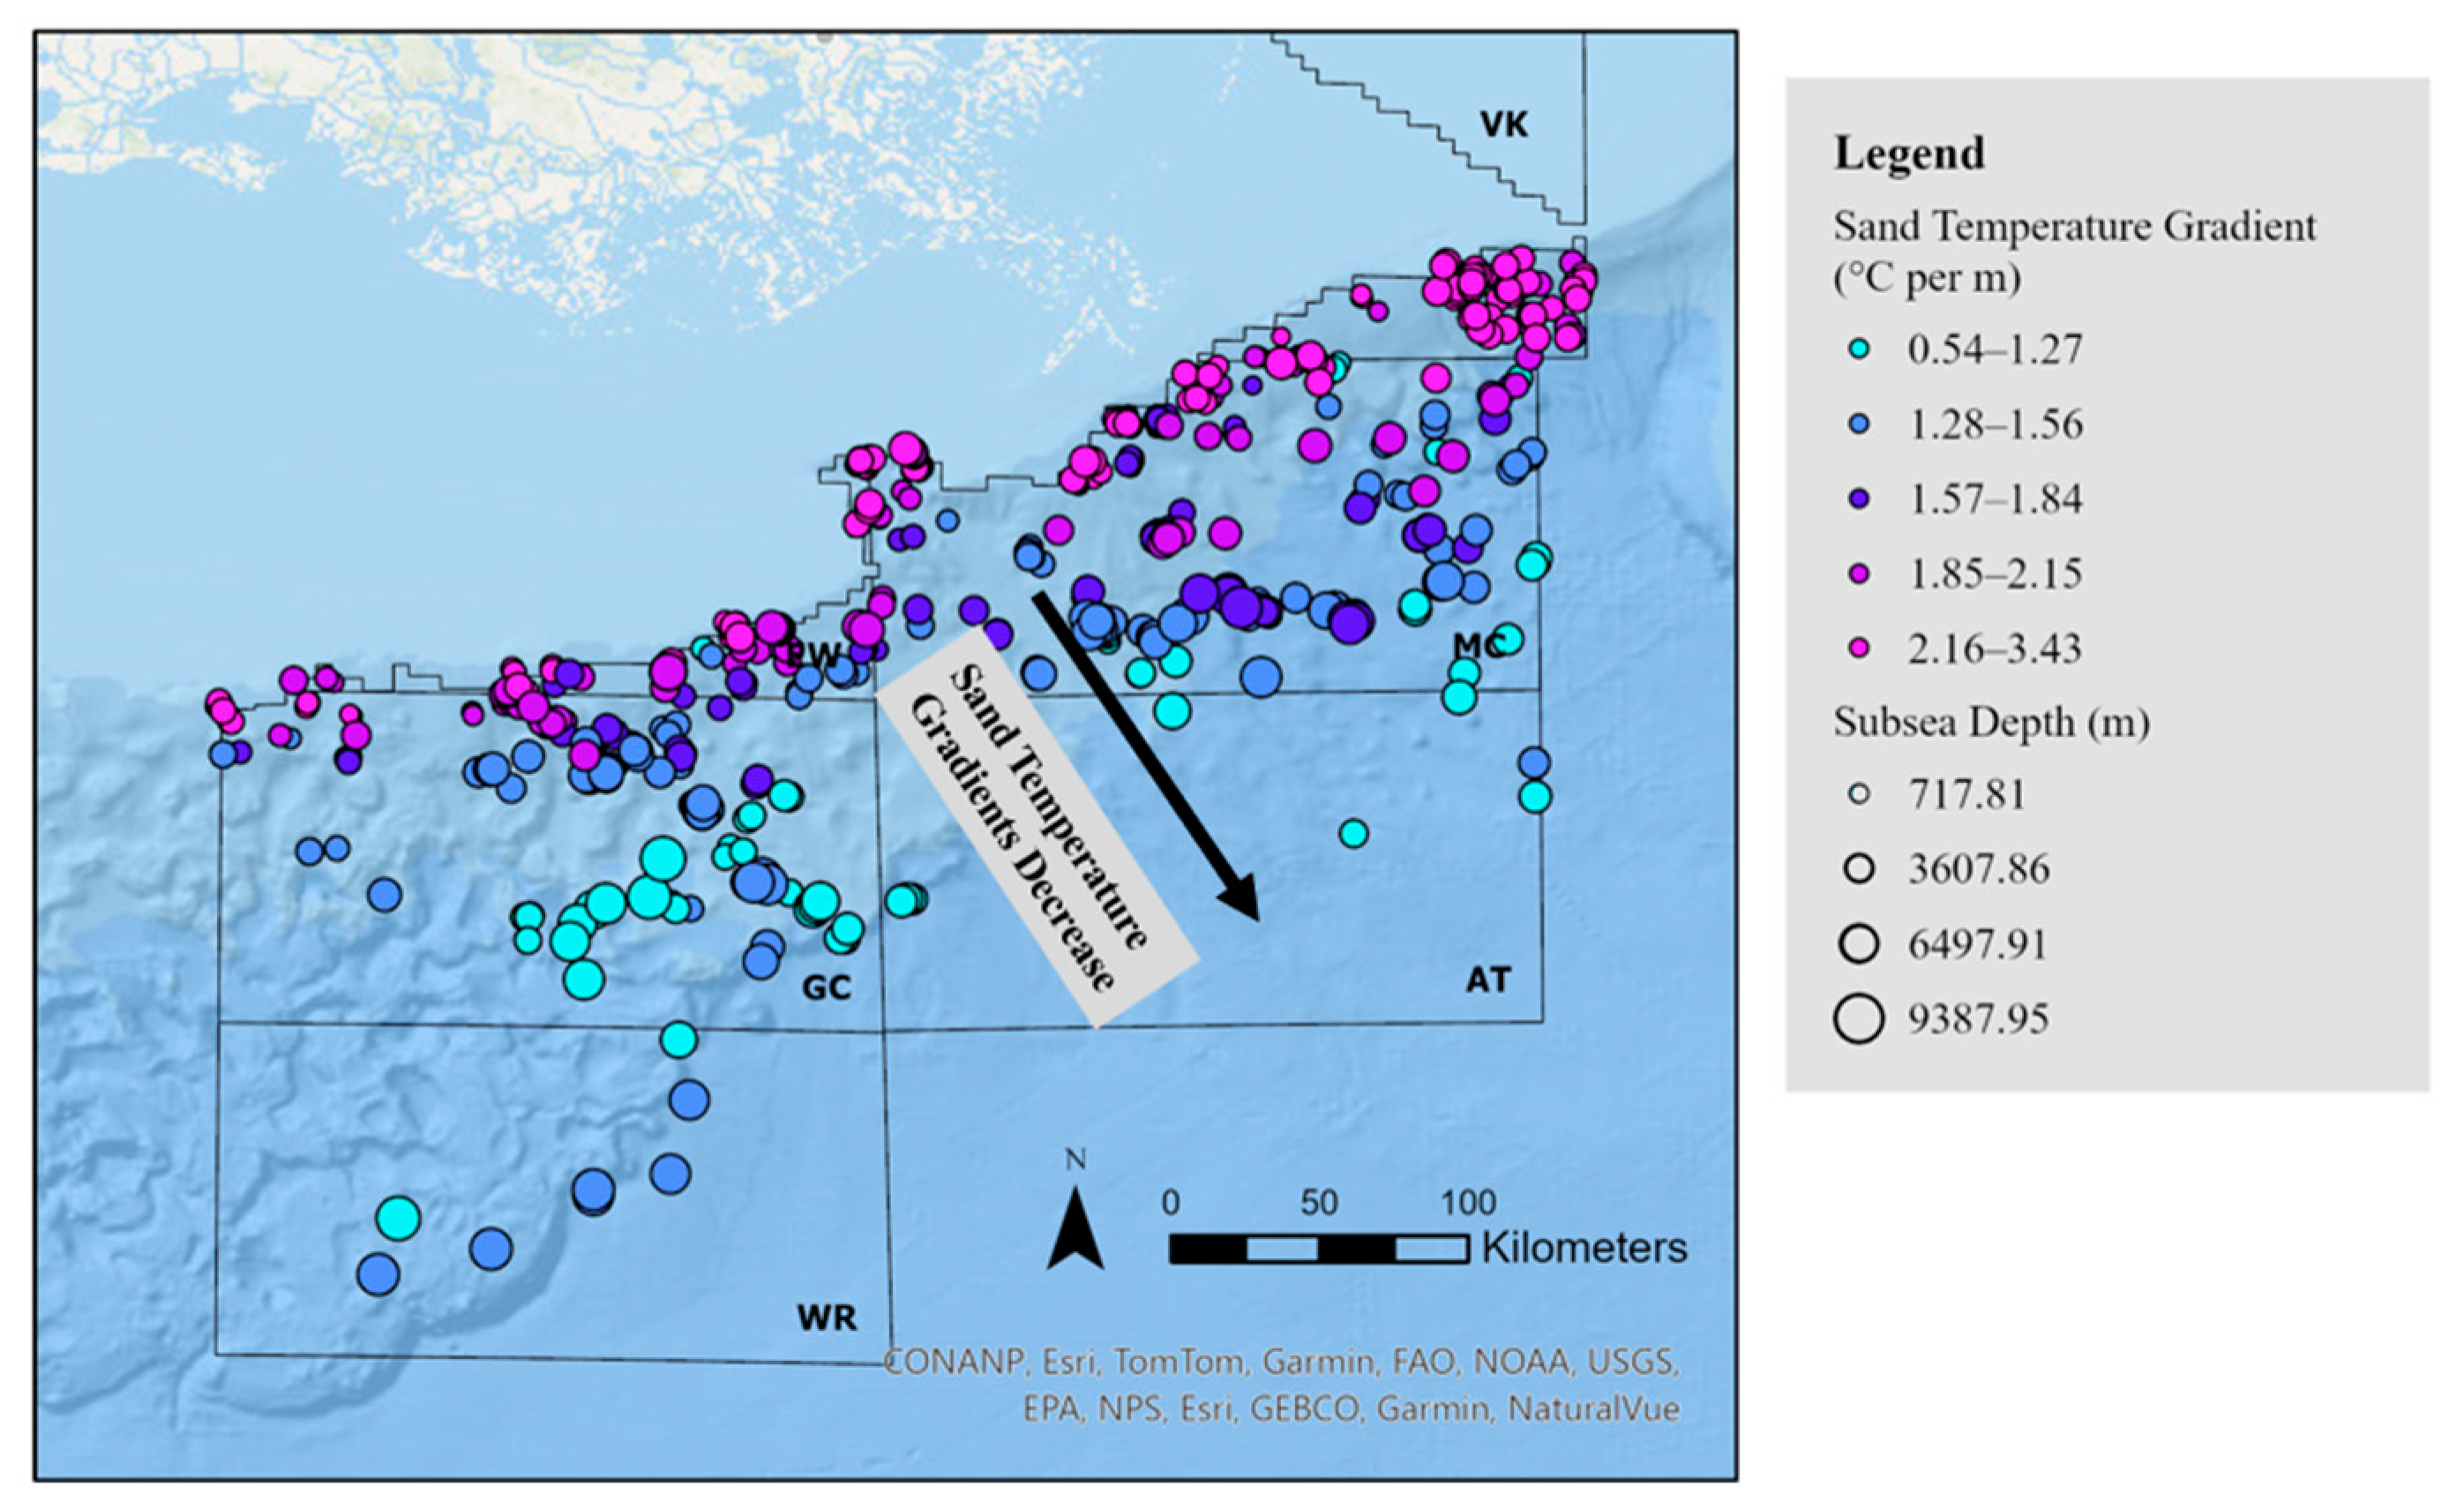
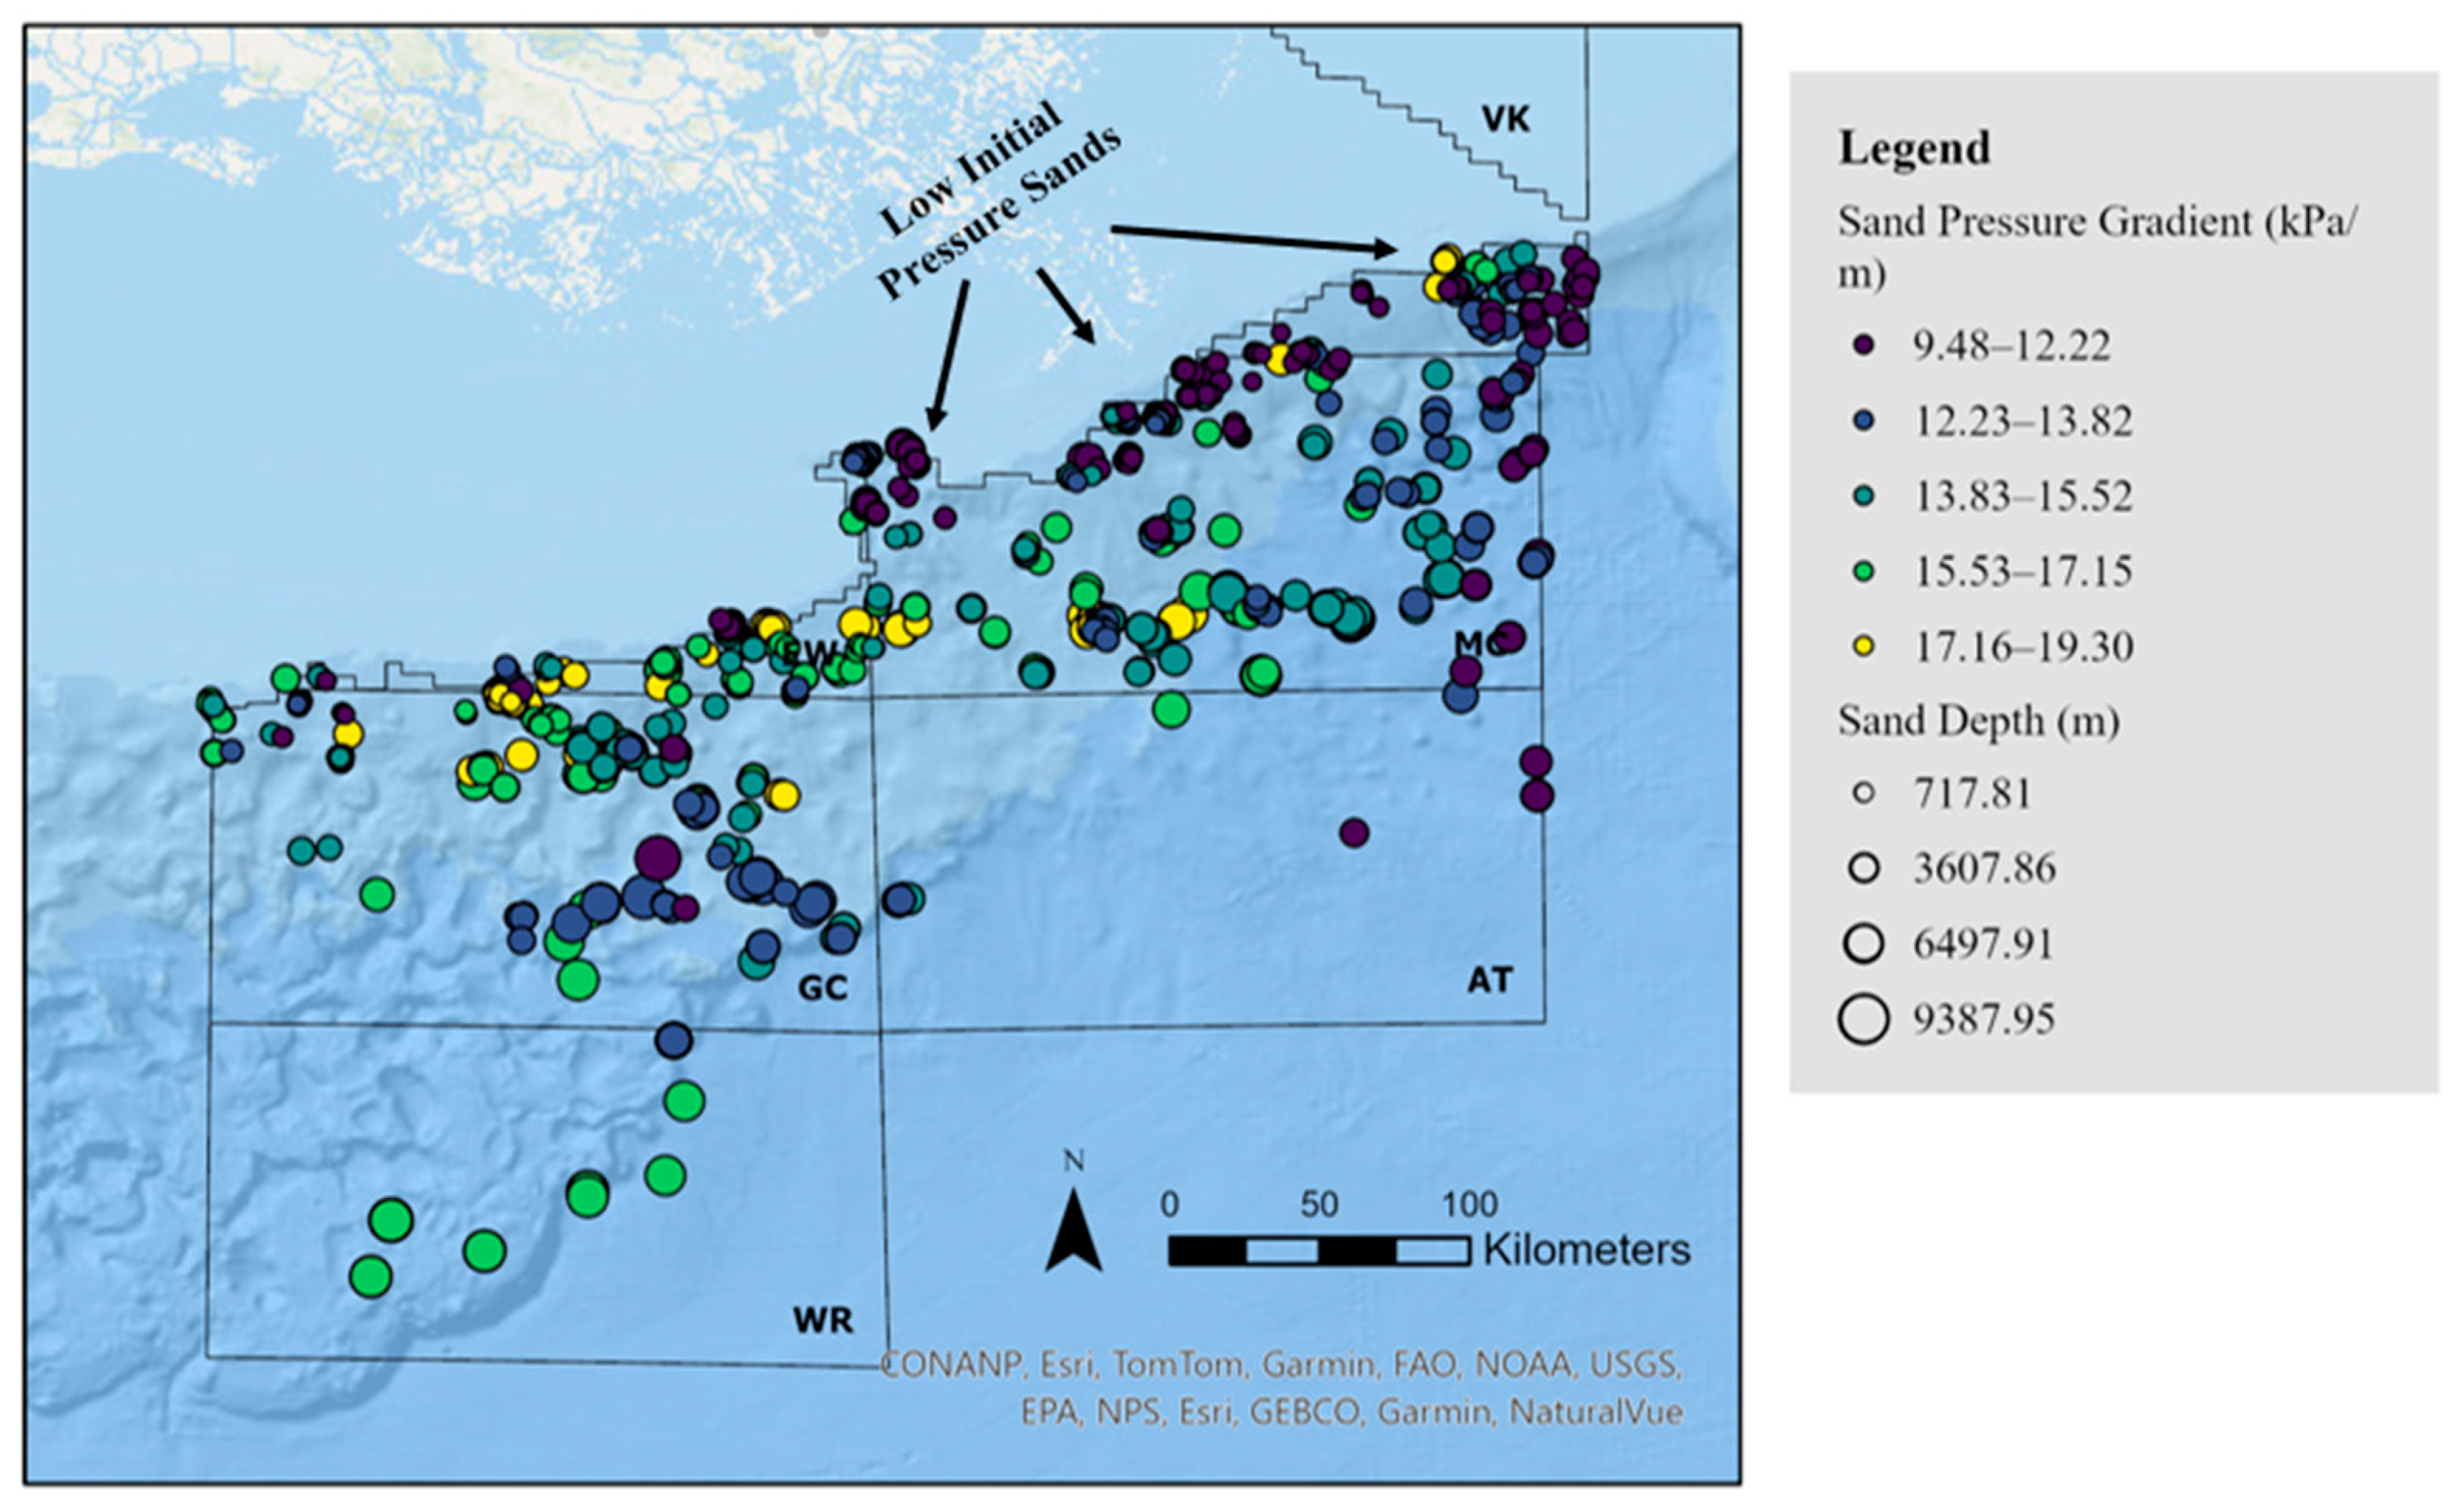
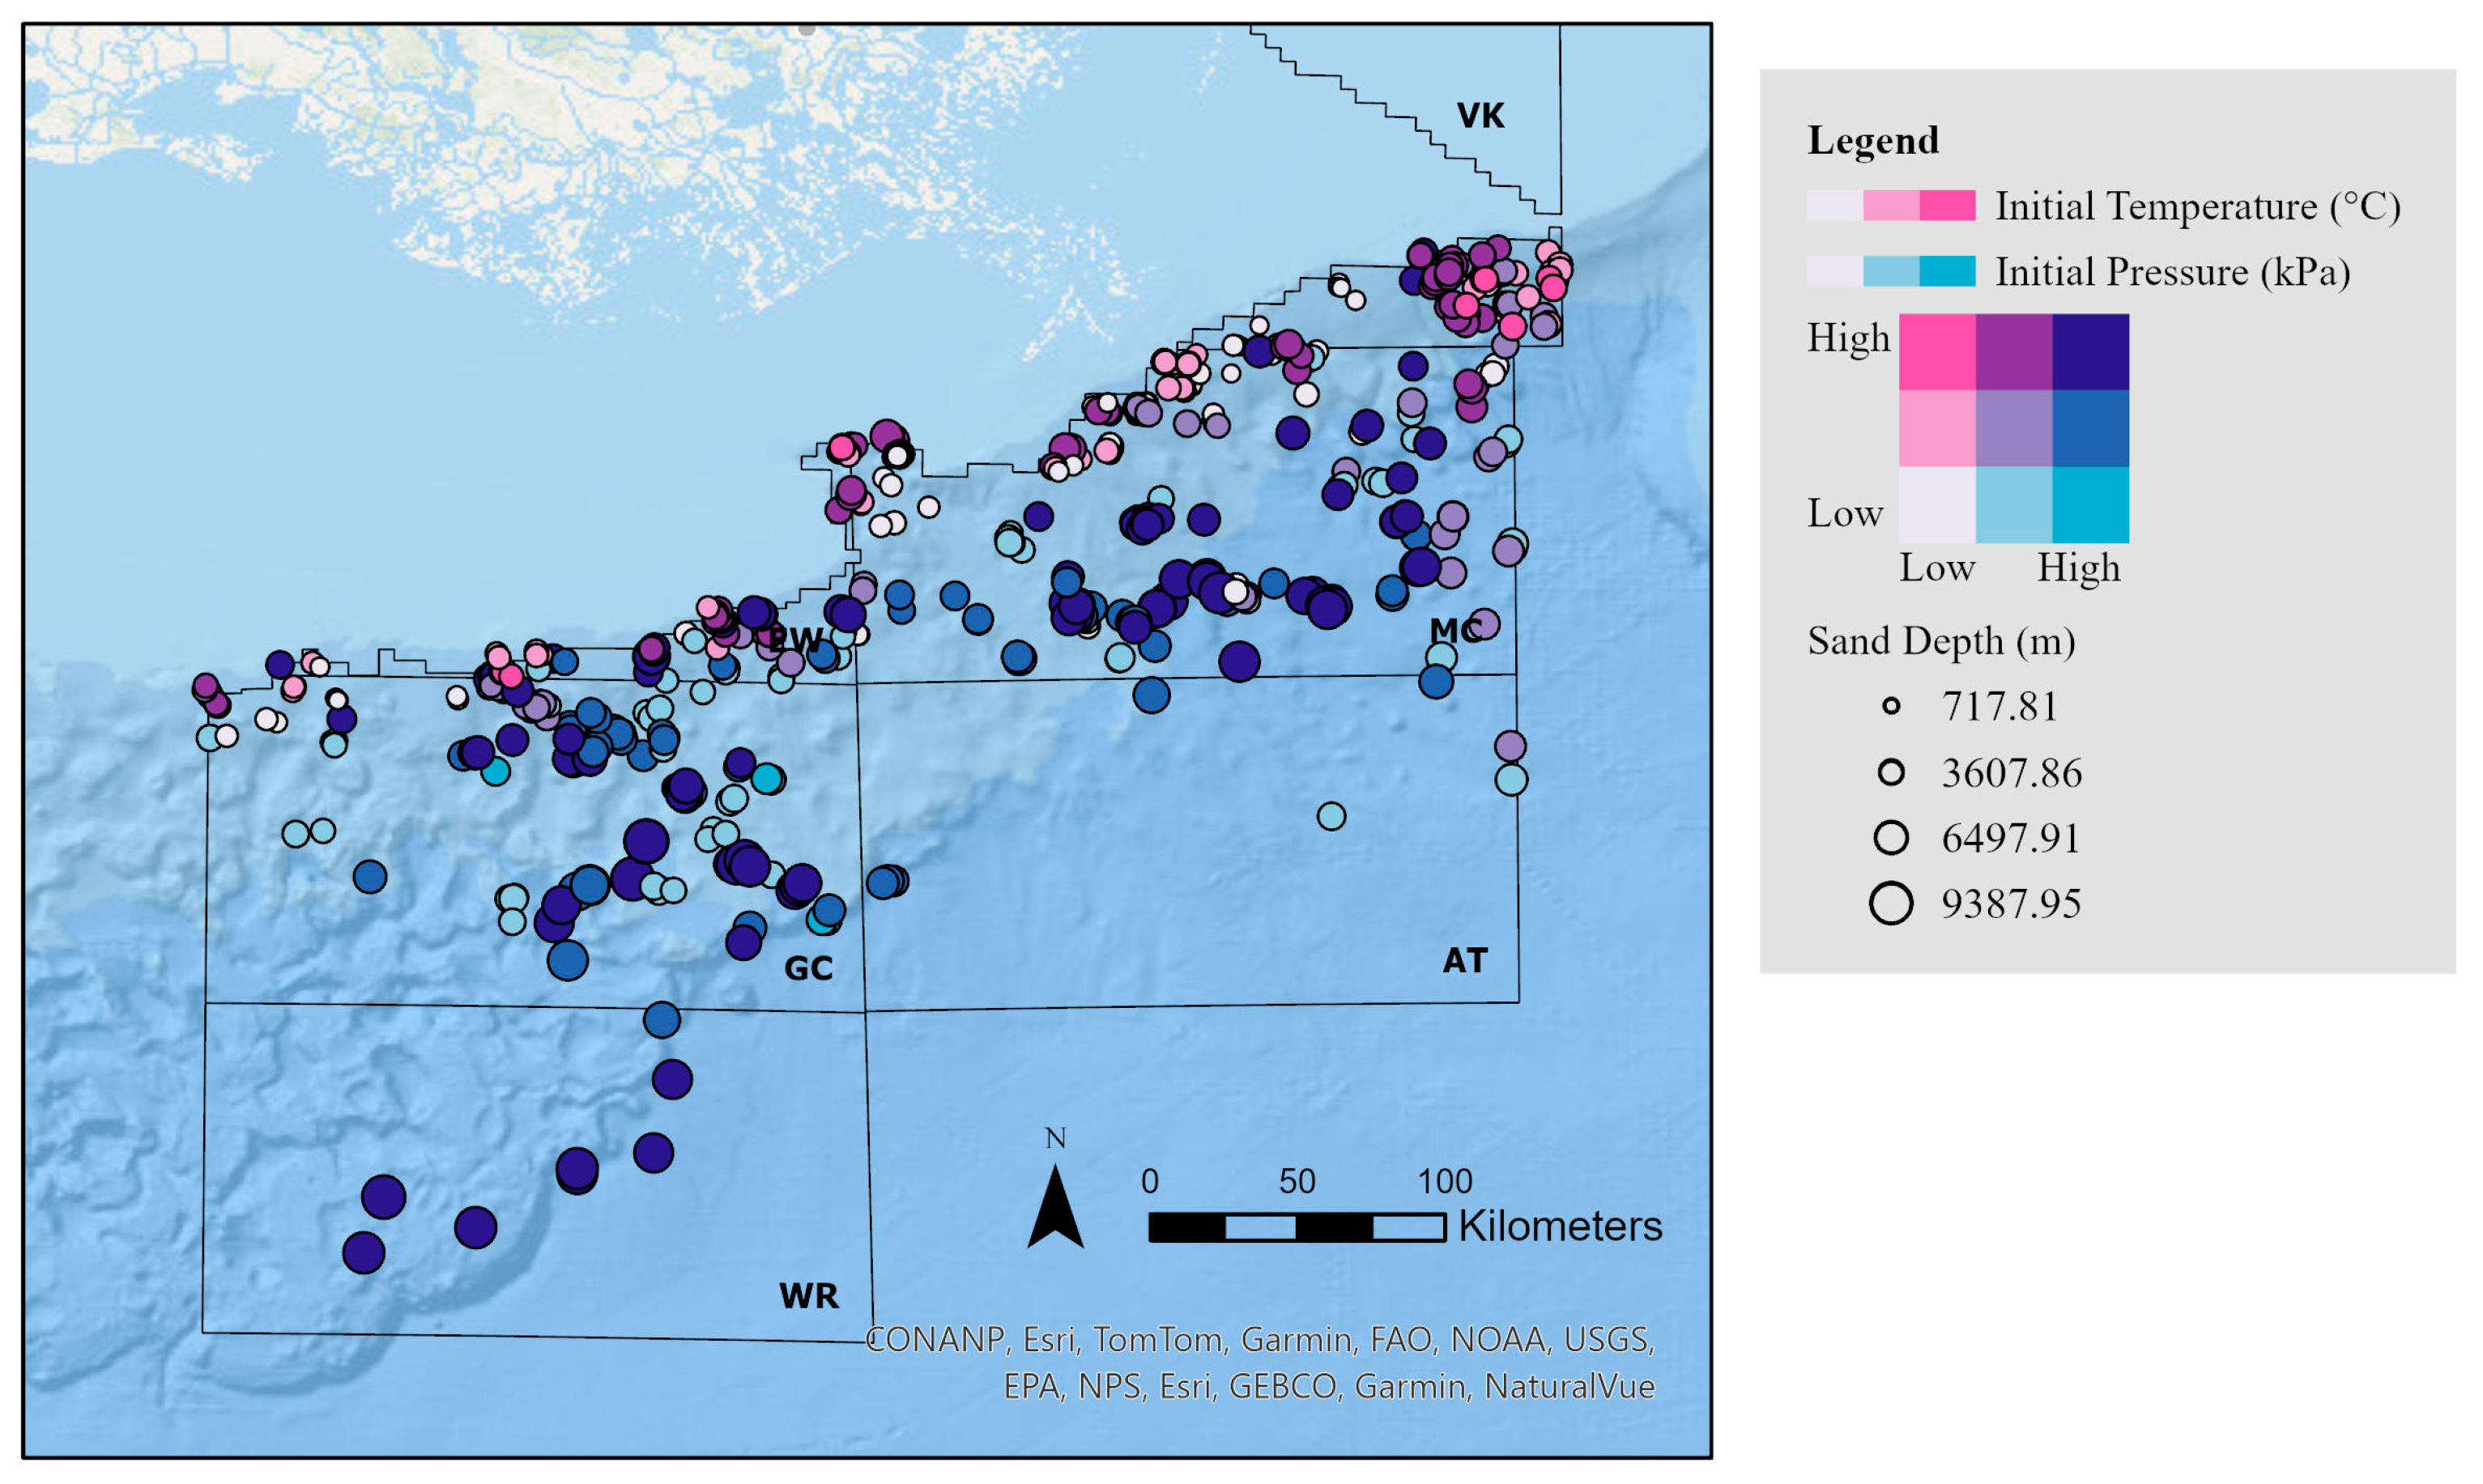
4.1.1. Reservoir Temperature and Pressure
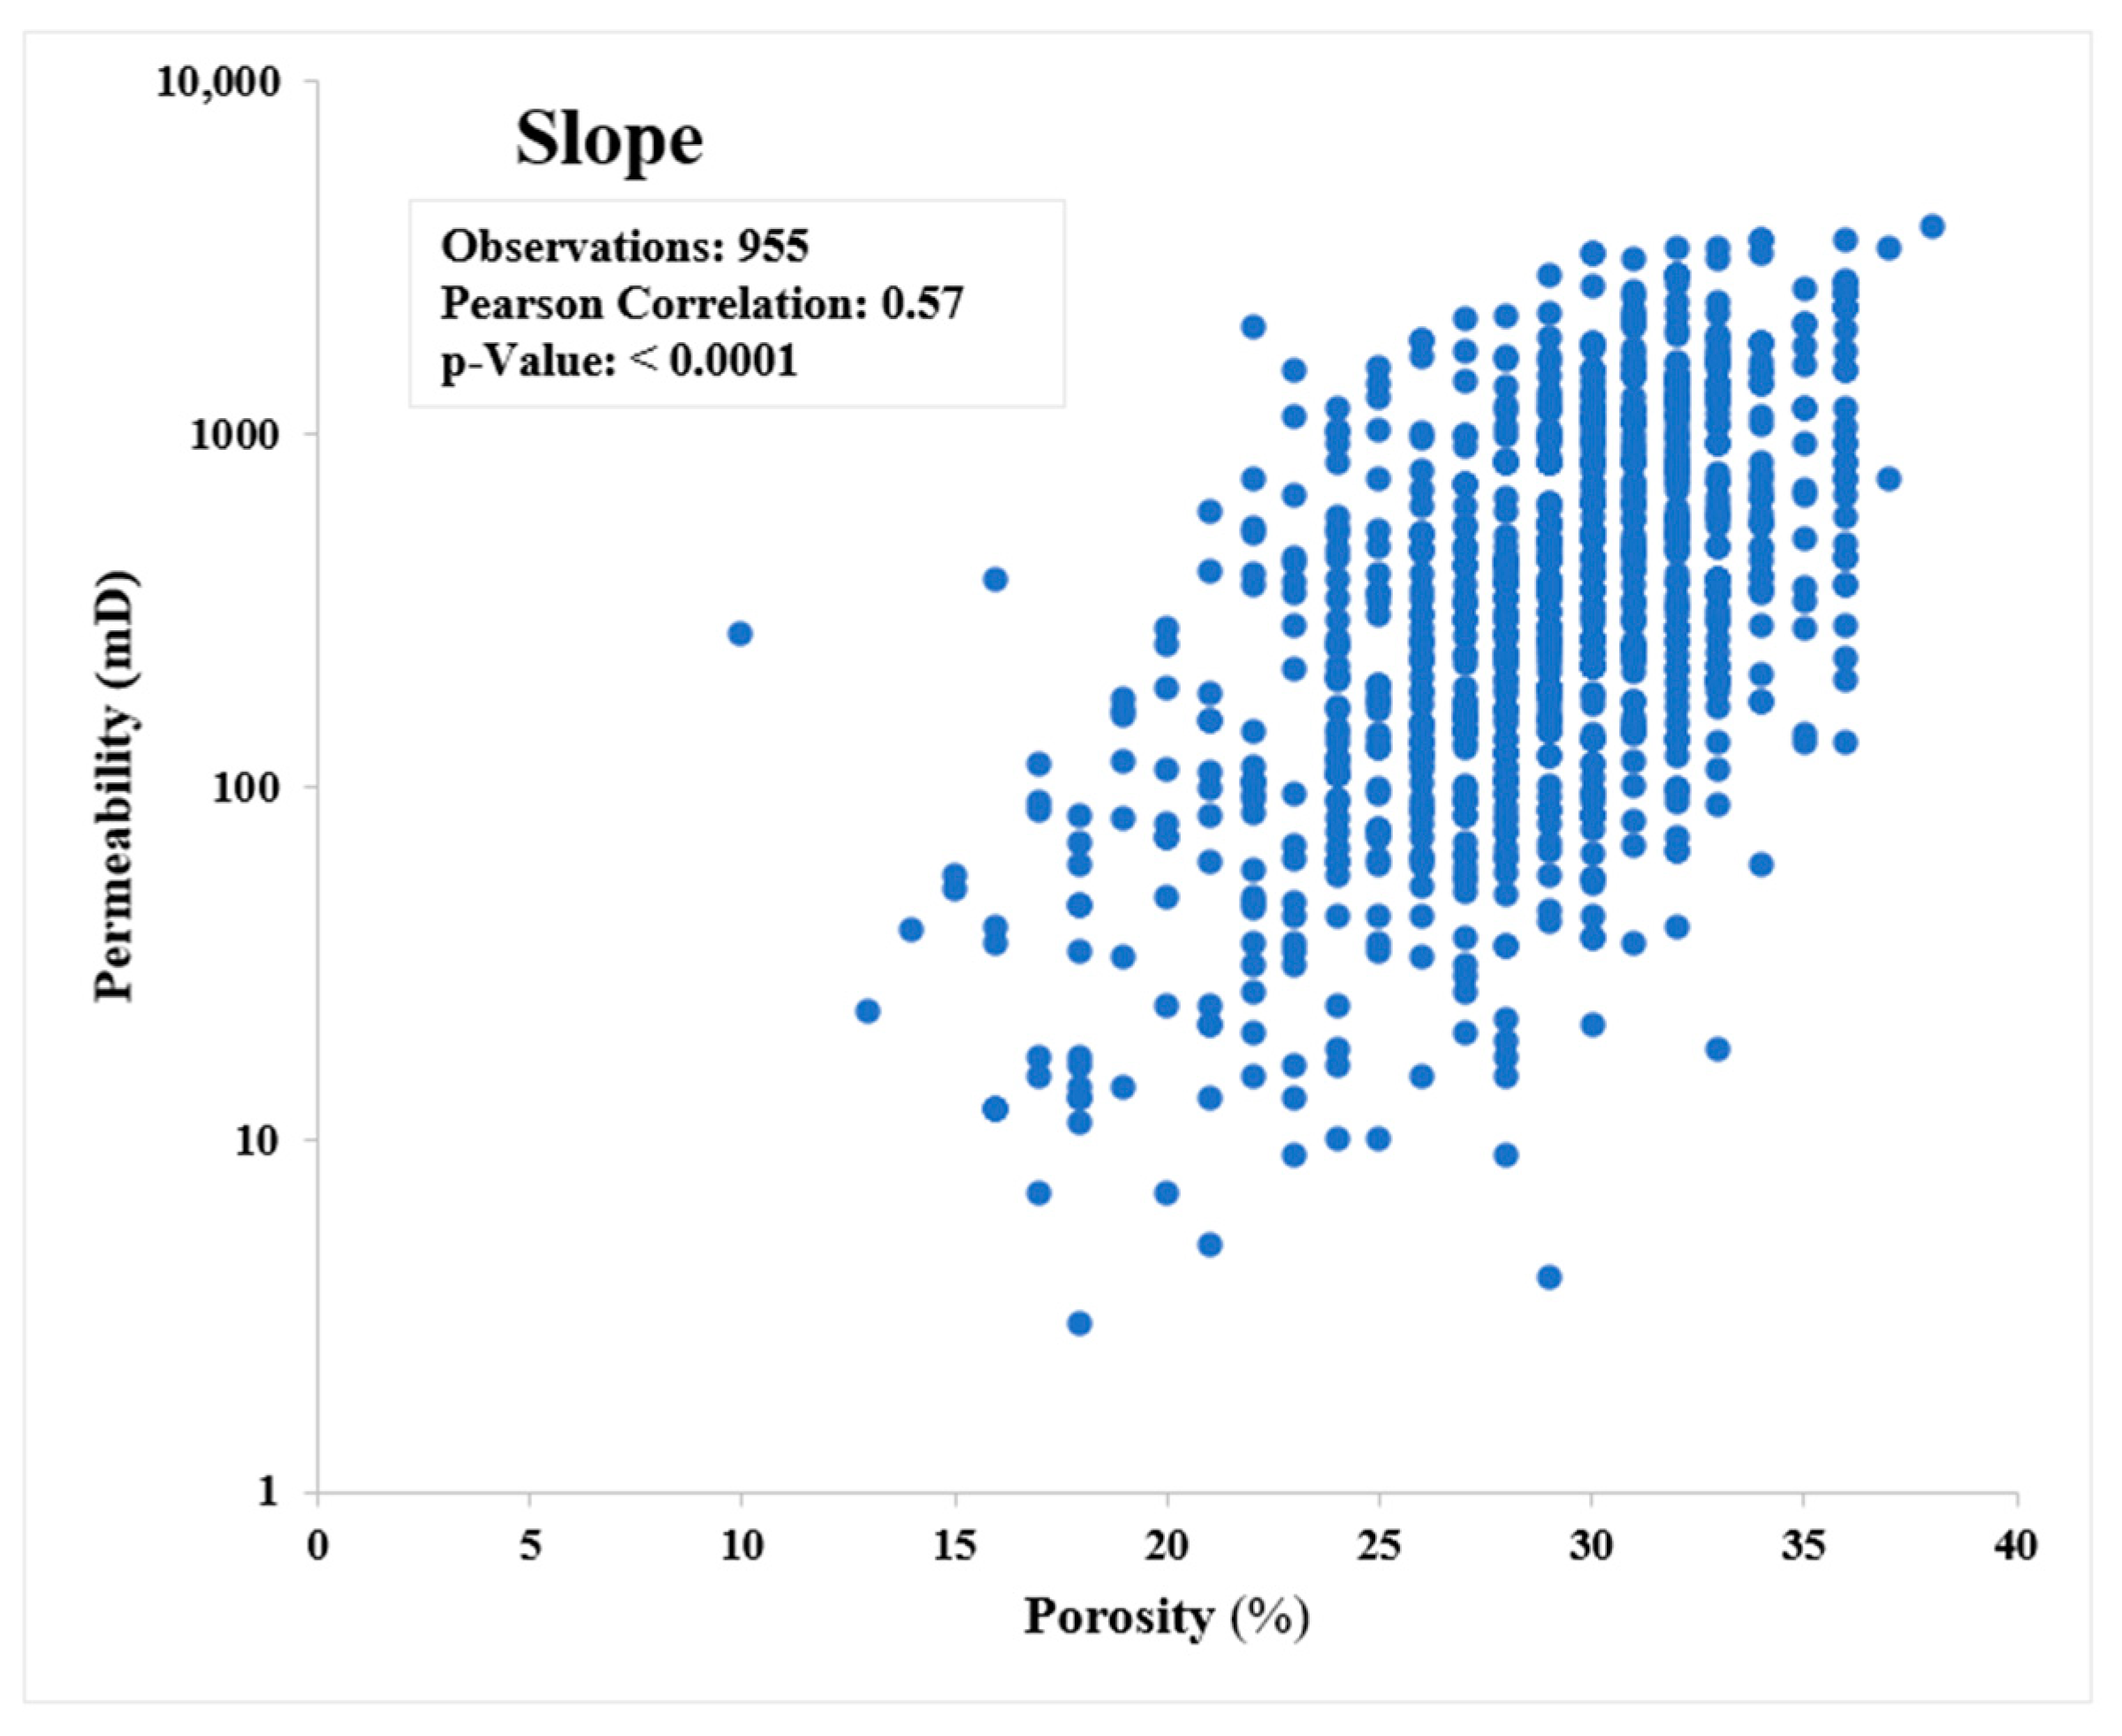
4.1.2. Reservoir Porosity and Permeability
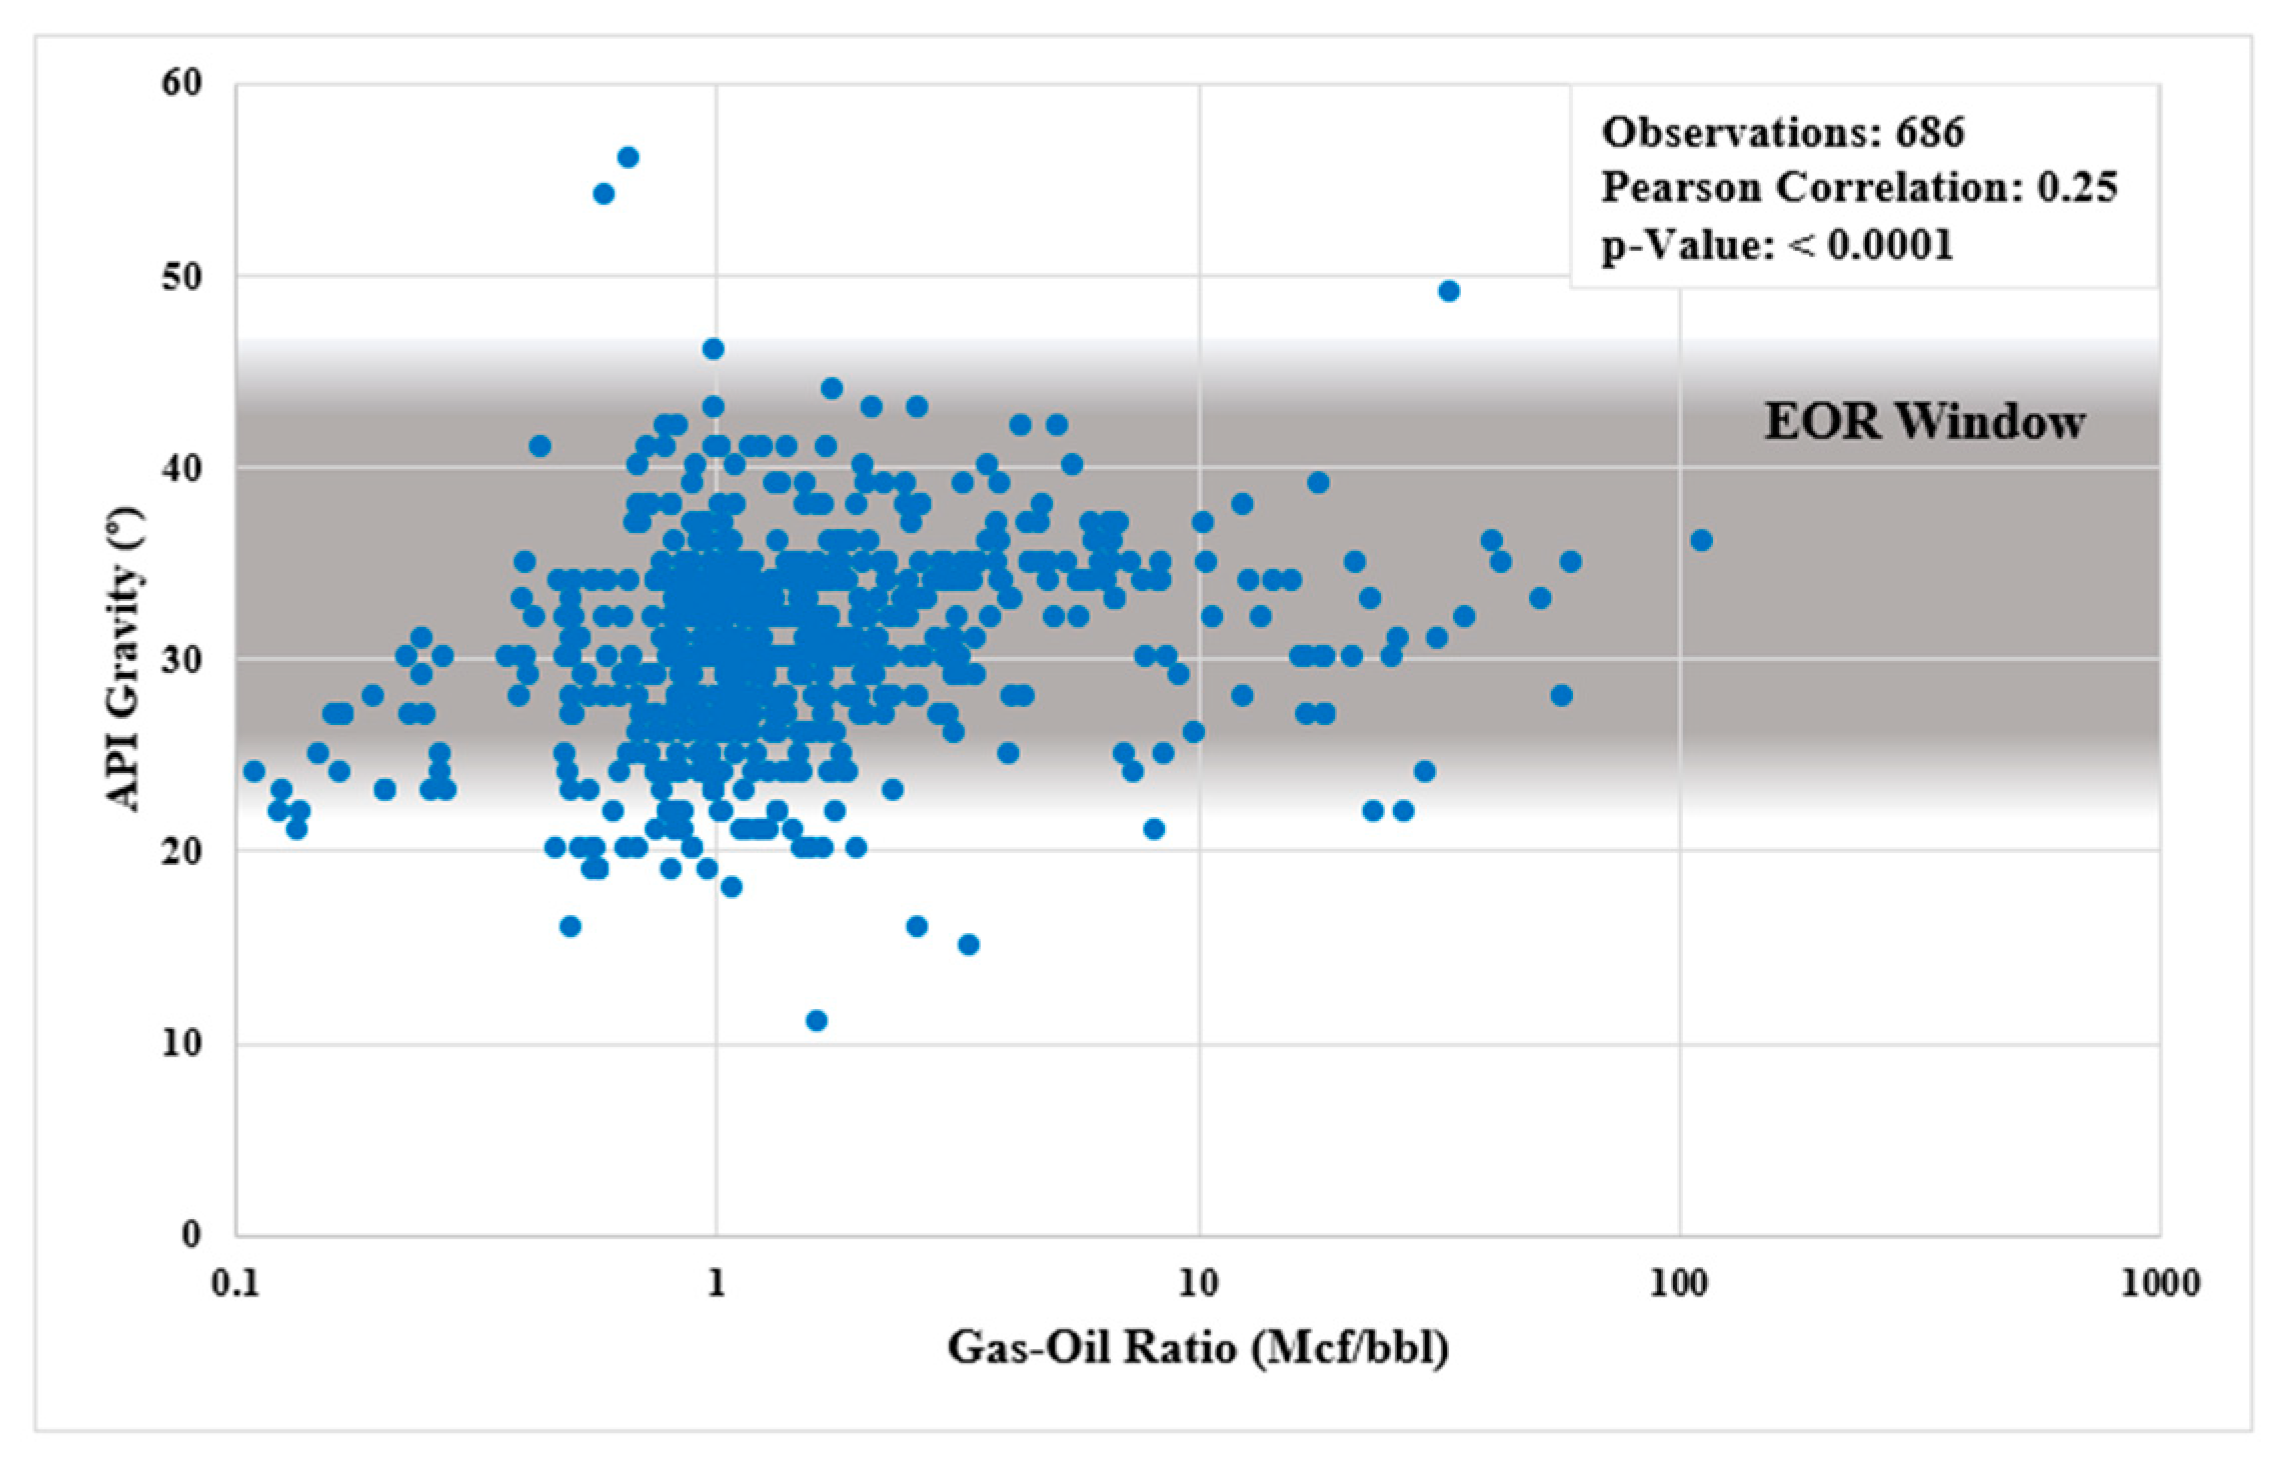
4.1.3. Gas–Oil Ratio and API Oil Gravity
4.2. Screening Criteria
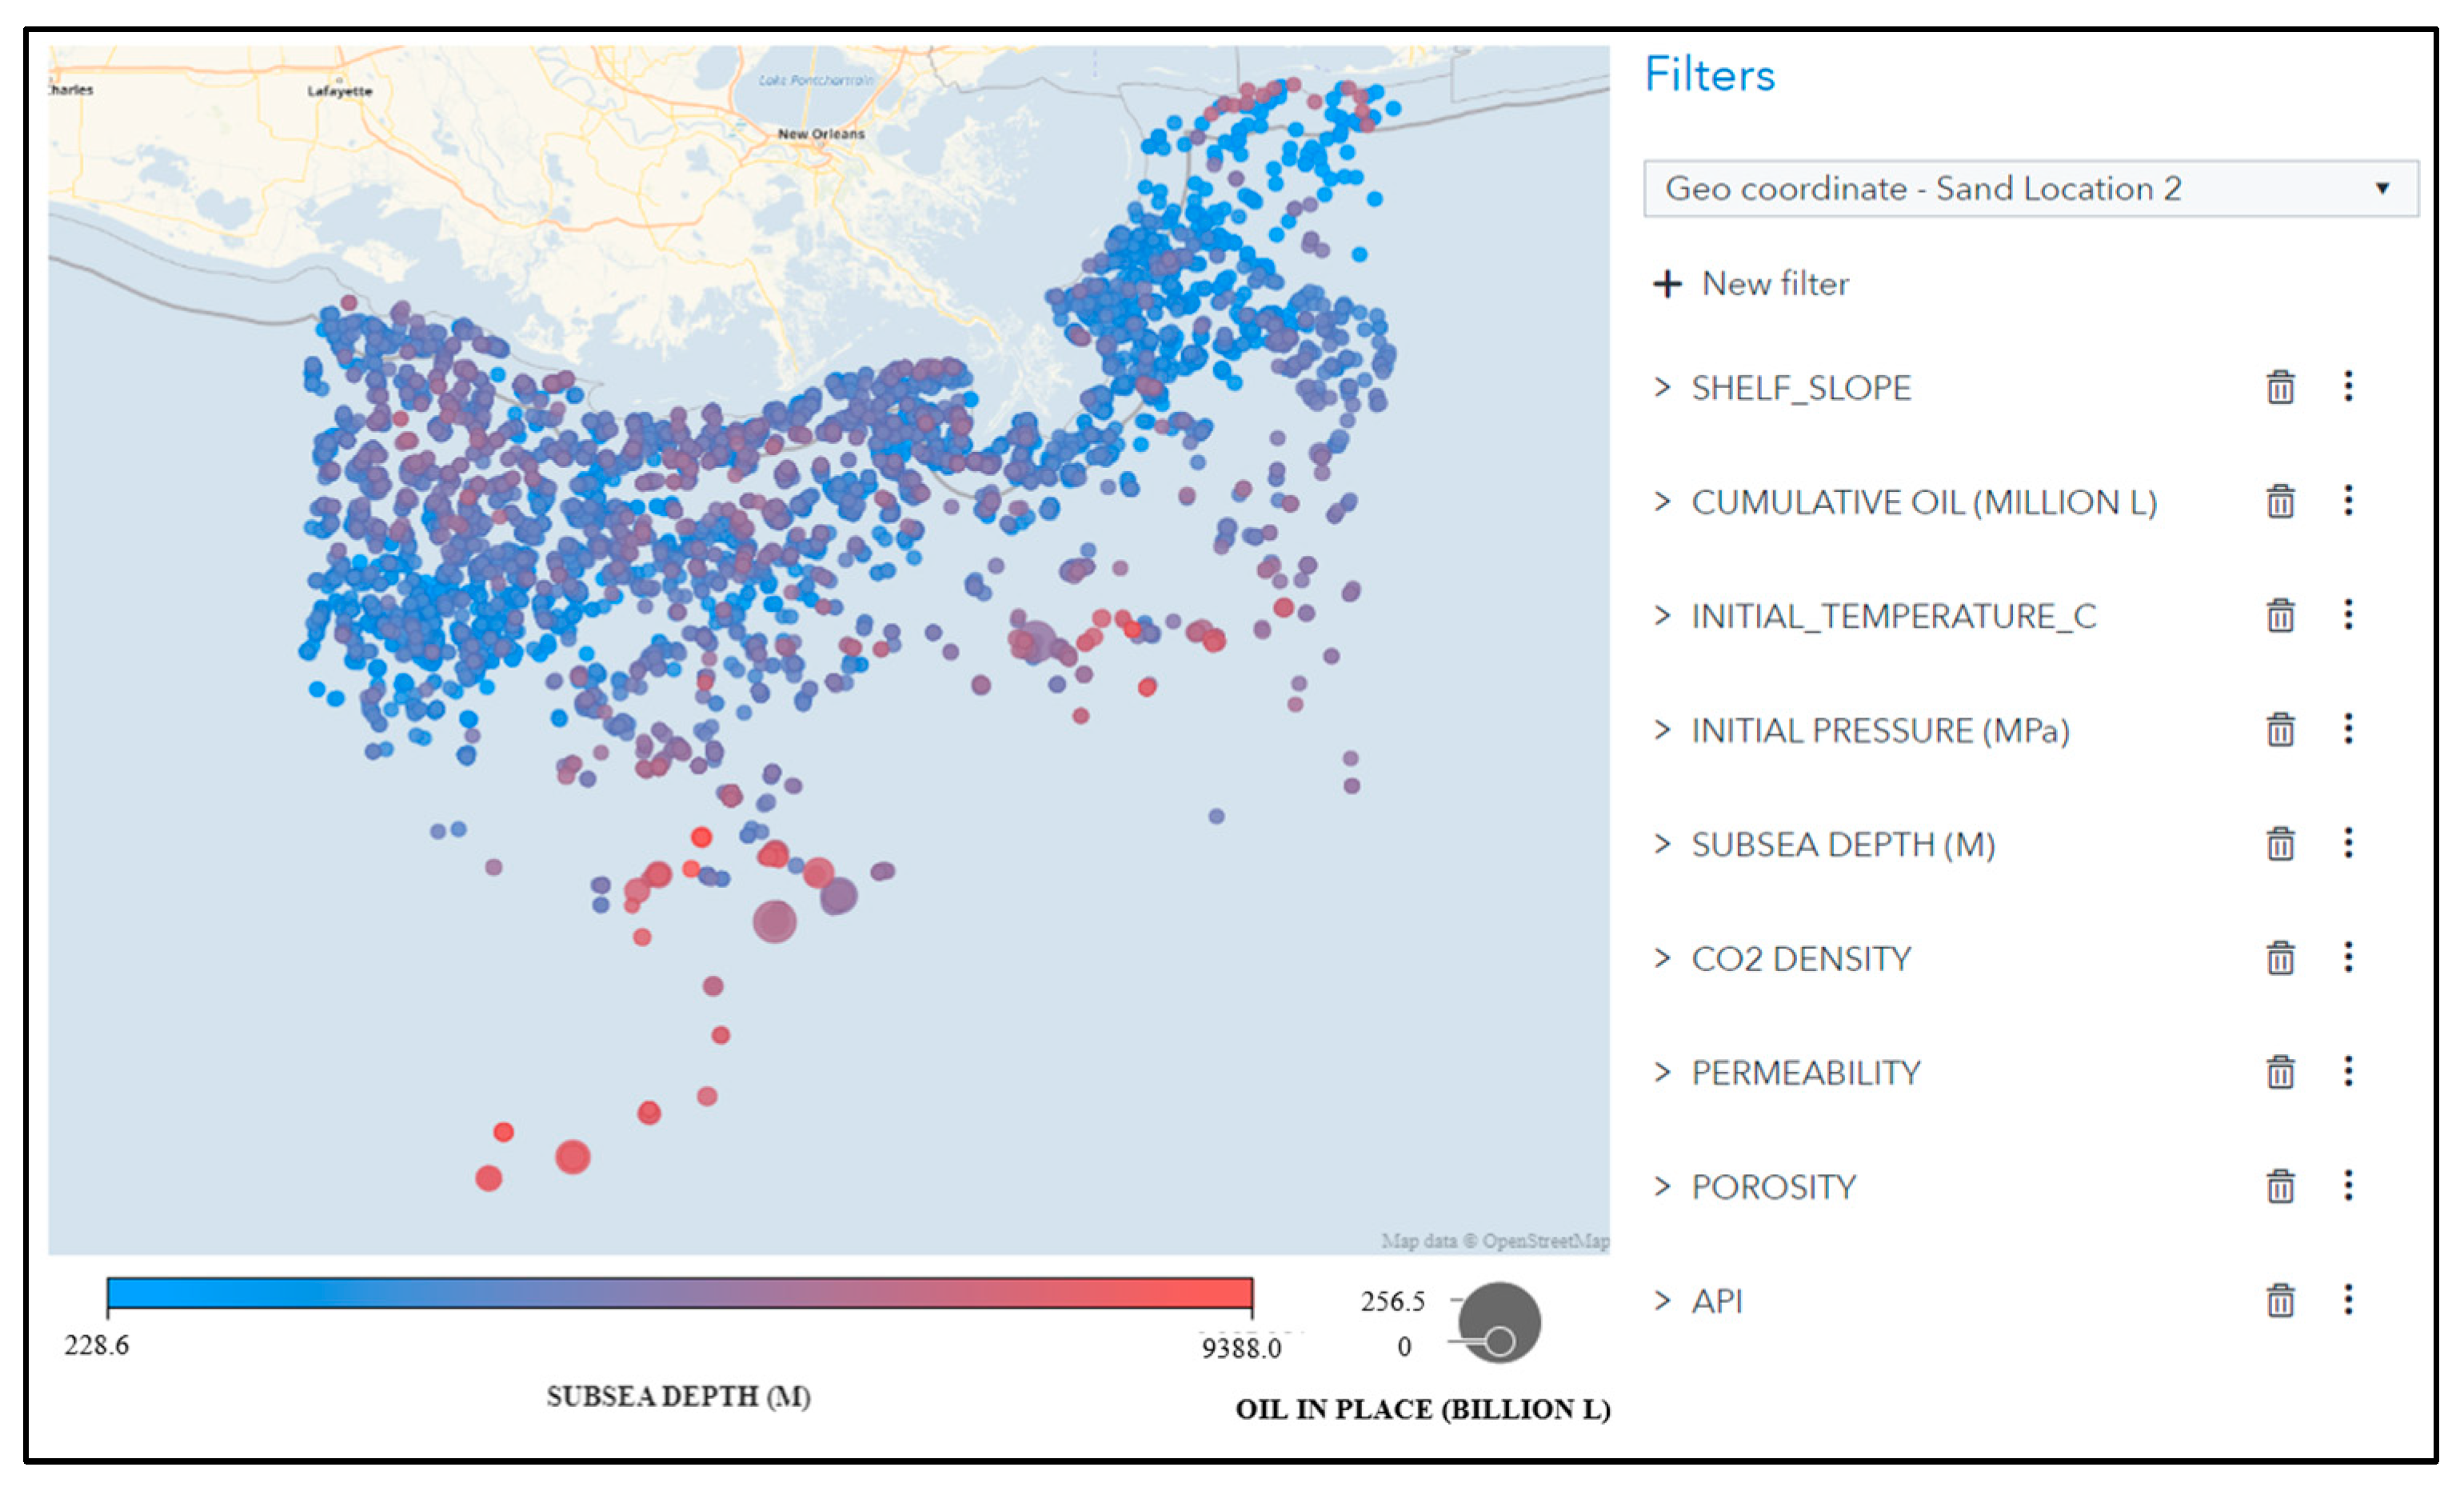
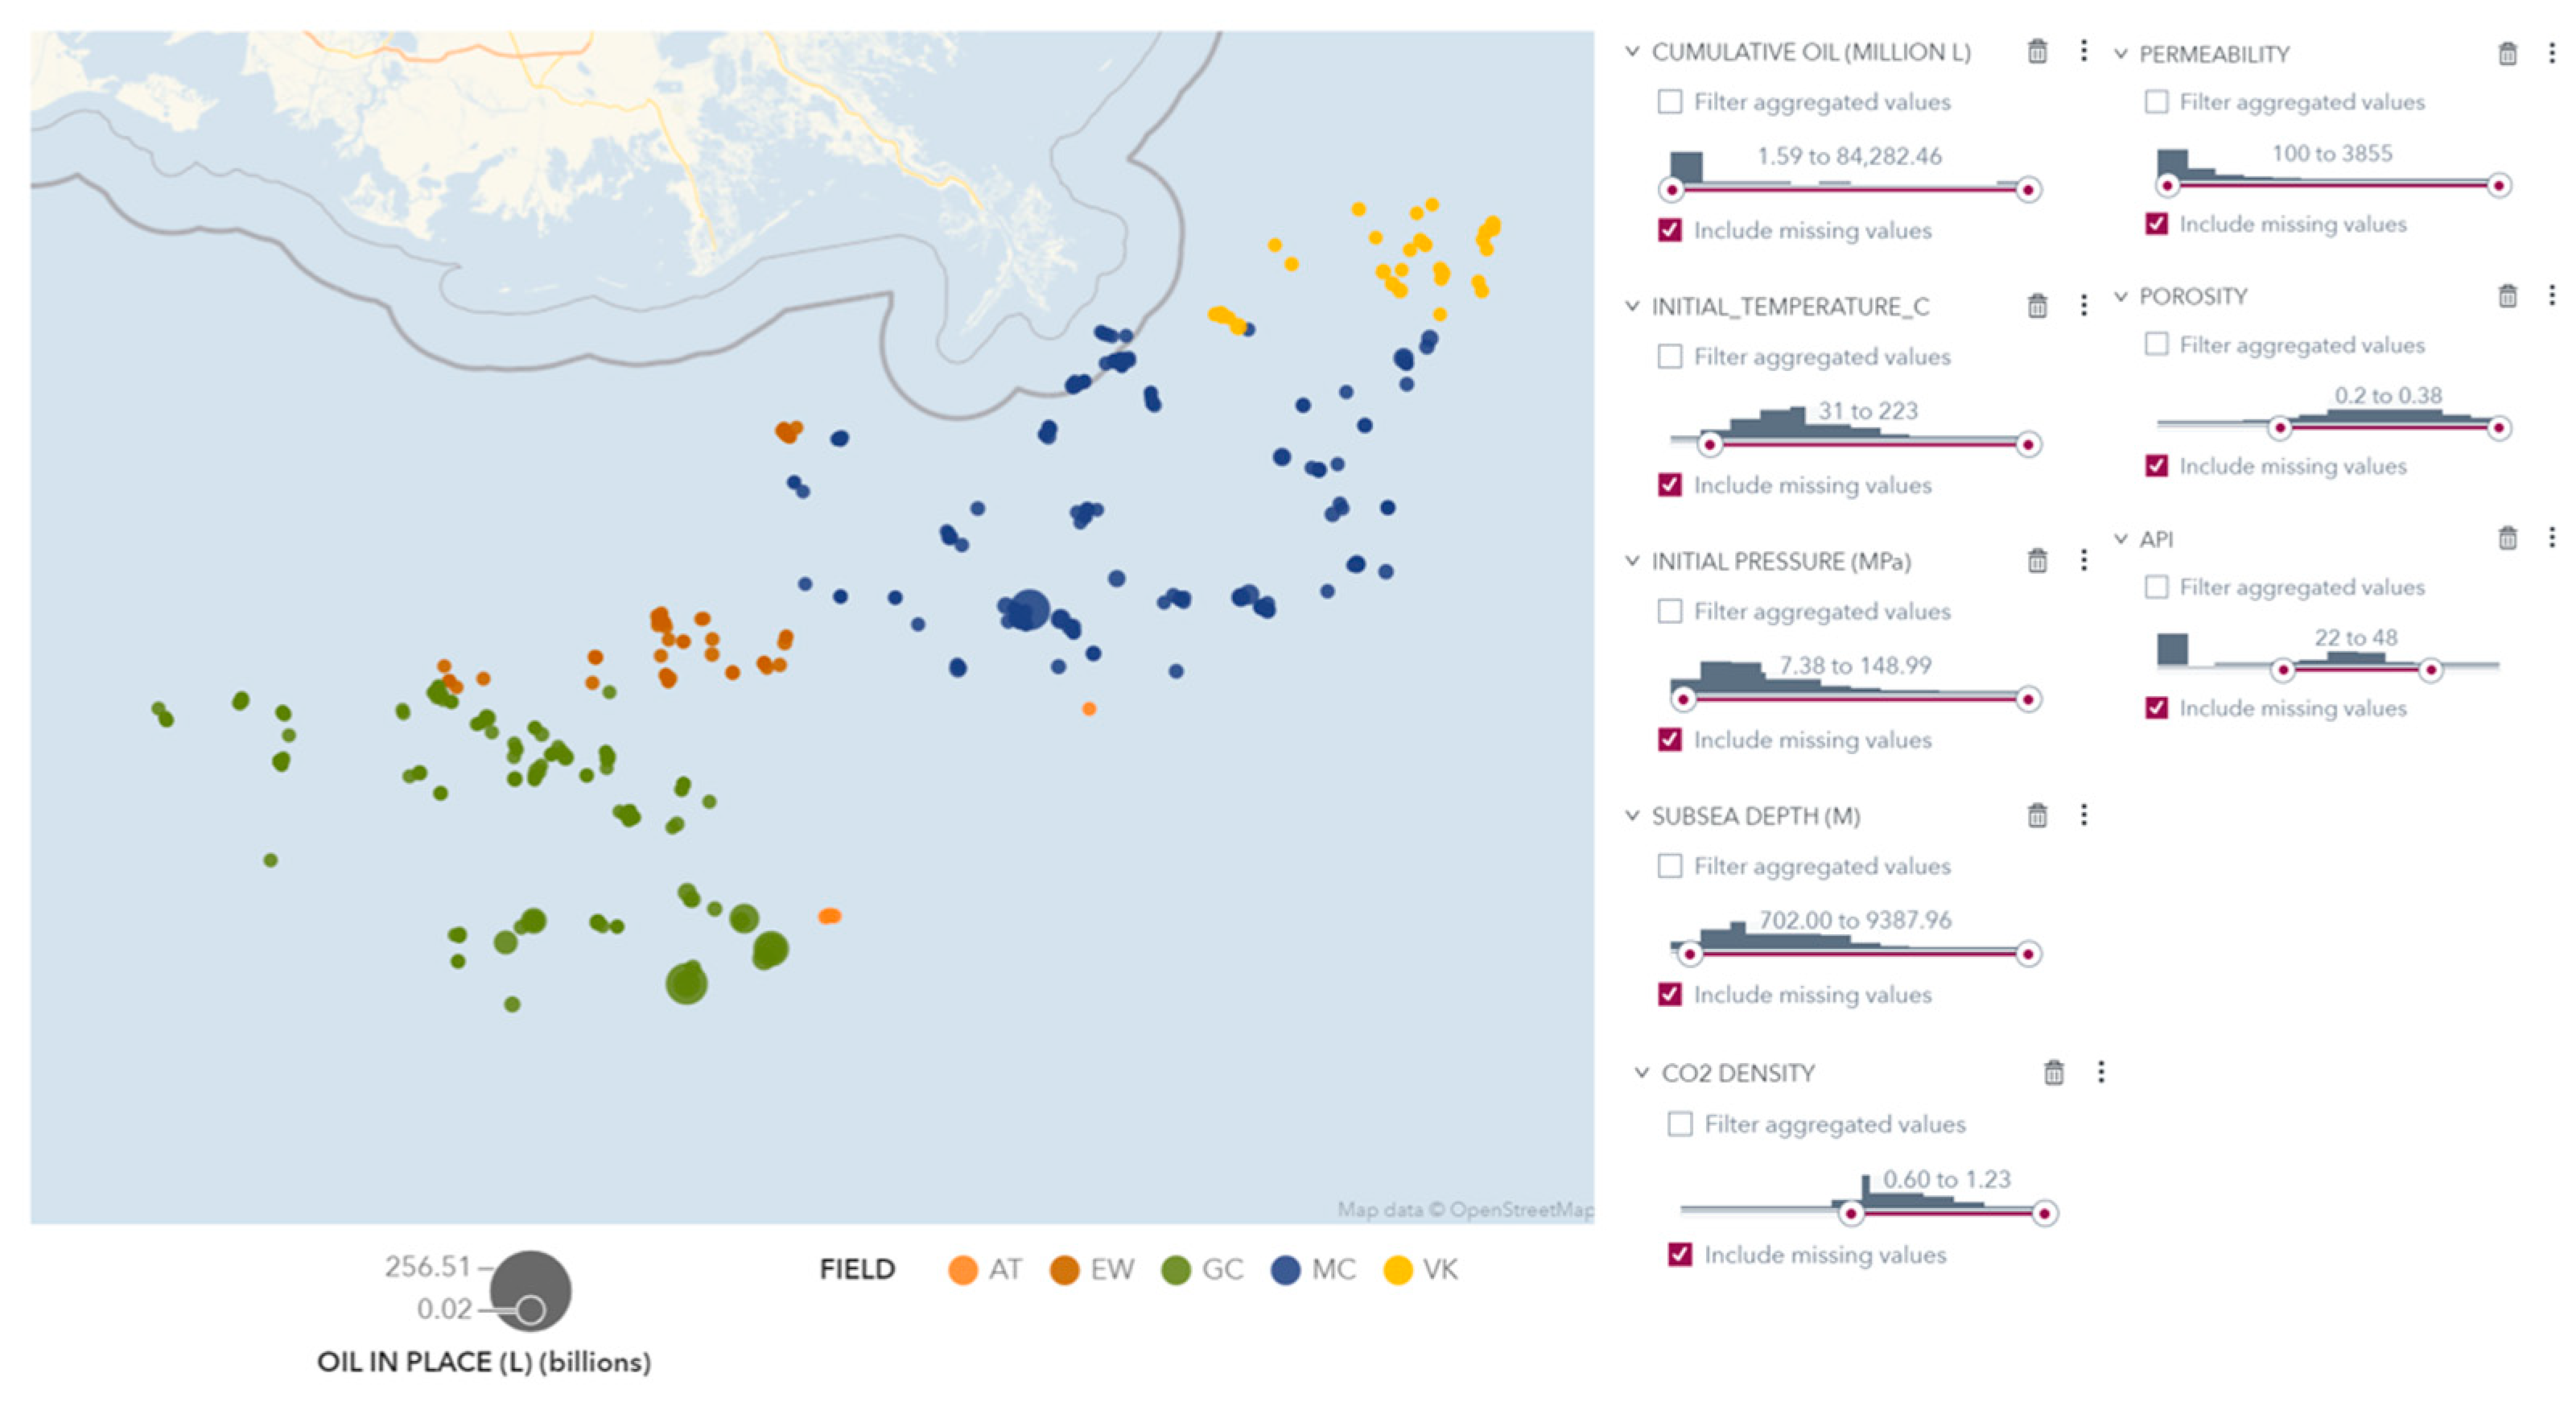
4.3. CO2 Storage Site Screening Platform
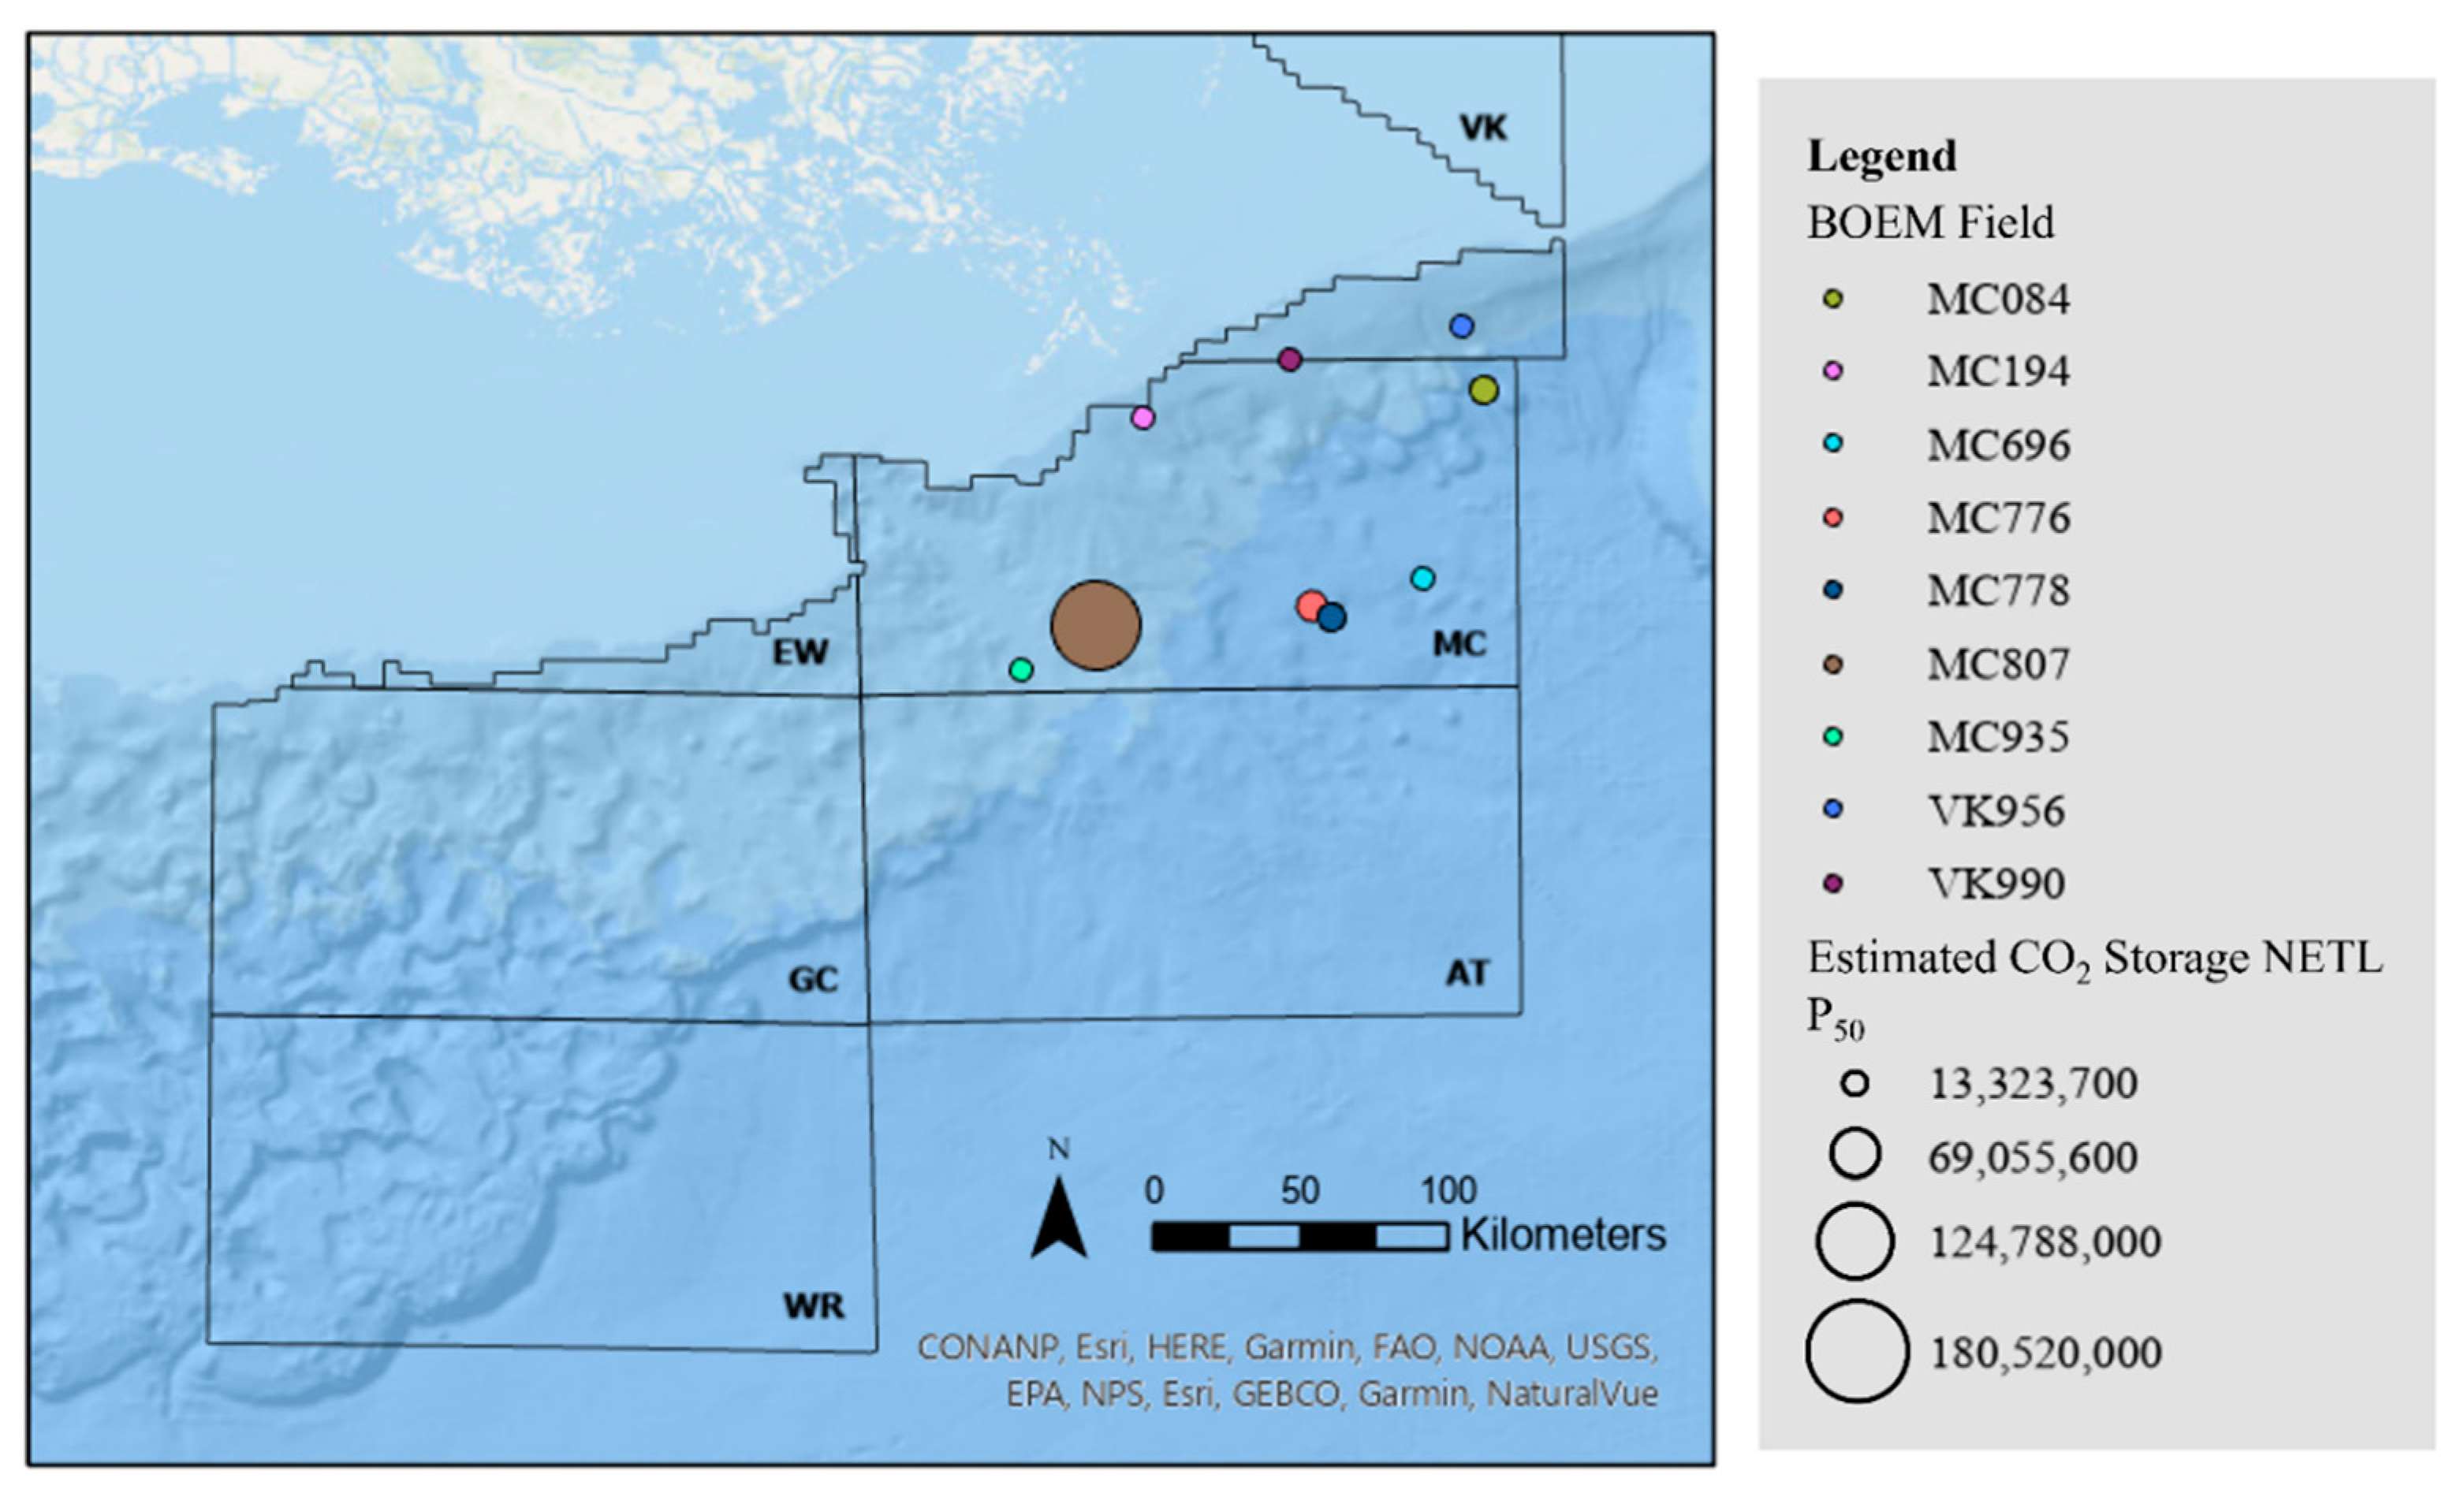
4.4. CO2 Storage Estimation
5. Conclusions
Author Contributions
Funding
Data Availability Statement
Conflicts of Interest
References
- Nemeth, K.; Sams-Gray, K.; Berry, P.; Ripepi, N.; Pashin, J.; Knapp, J.; Hills, D.; Riestenberg, D. Southeast Offshore Storage Resource Assessment (SOSRA)(Final Technical Report); Southern States Energy Board: Peachtree Corners, GA, USA; Virginia Polytechnic Inst. and State Univ.(Virginia Tech): Blacksburg, VA, USA; Oklahoma State Univ.: Stillwater, OK, USA; Geological Survey of Alabama: Tuscaloosa, AL, USA; Advanced Resources International: Knoxville, TN, USA, 2019. [Google Scholar]
- Galloway, W.E. Depositional Evolution of the Gulf of Mexico Sedimentary Basin. In Sedimentary Basins of the World 5; Elsevier: Amsterdam, The Netherlands, 2008; pp. 505–549. [Google Scholar]
- Pashin, J.C.; Jin, G.; Hills, D.J. Mesozoic structure and petroleum systems in the DeSoto Canyon salt basin in the mobile, Pensacola, Destin Dome, and Viosca Knoll areas of the MAFLA shelf. In Proceedings of the 35th Annual Gulf Coast Section SEPM (GCSSEPM) Foundation Bob F. Perkins Research Conference, Houston, TX, USA, 4–6 December 2016; pp. 315–340. [Google Scholar]
- Bouroullec, R.; Weimer, P.; Serrano, O. Petroleum geology of the Mississippi Canyon, Atwater Valley, western DeSoto Canyon, and western Lloyd Ridge protraction areas, northern slope Gulf of Mexico: Traps, reservoirs, and tectono-stratigraphic evolution. AAPG Bull. 2017, 101, 1073–1108. [Google Scholar] [CrossRef]
- Meng, J.; Pashin, J.C.; Nygaard, R.; Chandra, A. Analysis of the stress field in the DeSoto canyon Salt Basin for ensuring safe offshore carbon storage. Int. J. Greenh. Gas Control 2018, 79, 279–288. [Google Scholar] [CrossRef]
- Meng, J.; Pashin, J.C.; Chandra, A.; Xue, L.; Sholanke, S.; Spears, J. Structural framework and fault analysis in the east-central Gulf of Mexico shelf: Implications for offshore CO2 storage. J. Struct. Geol. 2020, 134, 104020. [Google Scholar] [CrossRef]
- Hills, D.J.; Pashin, J.C. Preliminary Assessment of Offshore Transport and Storage of CO2: Southeastern Regional Carbon Sequestration Partnership Final Report; Southern States Energy Board: Peachtree Corners, GA, USA, 2010; Volume 11. [Google Scholar]
- Chandra, A. Geological Characterization and CO2 Storage Potential of Cretaceous Sandstone in the DeSoto Canyon Salt Basin of the MAFLA Shelf. Master’s Thesis, Oklahoma State University, Stillwater, OK, USA, 2018. [Google Scholar]
- Tallin, A.G.; Cowan, K.M.; MacEachern, D.P.; Roes, V.; Schnitker, S. A Fitness for Purpose Assessment of the Use of a Modified Expandable Casing Patch as Barrier Against H2S Exposure. AADE-05-NTCE-21. In Proceedings of the Paper Presented to the American Association of Drilling Engineers 2005 National Technical Conference and Exhibition, Houston, TX, USA, 5–7 April 2005. [Google Scholar]
- Wilson, A. Waterflooding Proves Useful in Deepwater Gulf of Mexico Overpressured Turbidites. J. Pet. Technol. 2014, 66, 113–115. Available online: https://jpt.spe.org/waterflooding-proves-useful-deepwater-gulf-mexico-overpressured-turbidites (accessed on 12 June 2023). [CrossRef]
- Priest, T. Shell Oil’s Deepwater Mission to Mars; University of Iowa Press: Iowa City, IA, USA, 2019; p. 108. [Google Scholar]
- Bhattacherjee, R.; Botchway, K.O.; Hu, X.; Pashin, J.; Chakraborty, G.; Bikkina, P. Evaluating CO2 Storage Potential of Offshore Reservoirs and Saline Formations in Central Gulf of Mexico by Employing Data-Driven Models with SAS® Viya; Western Users of SAS Software: San Francisco, CA, USA, 2022. [Google Scholar]
- Aminu, M.D.; Nabavi, S.A.; Rochelle, C.A.; Manovic, V. A review of developments in carbon dioxide storage. Appl. Energy 2017, 208, 1389–1419. [Google Scholar] [CrossRef]
- Raza, A.; Rezaee, R.; Bing, C.H.; Gholami, R.; Hamid, M.A.; Nagarajan, R. Carbon dioxide storage in subsurface geologic medium: A review on capillary trapping mechanism. Egypt. J. Pet. 2016, 25, 367–373. [Google Scholar] [CrossRef]
- Smith, S.A.; Sorensen, J.A.; Steadman, E.N.; Harju, J.A.; Fischer, D.W. Estimates of CO2 storage capacity in selected oil fields of the northern Great Plains region of North America. AAPG Stud. Geol. 2009, 59, 87–97. [Google Scholar]
- Goodman, A.; Hakala, A.; Bromhal, G.; Deel, D.; Rodosta, T.; Frailey, S.; Small, M.; Allen, D.; Romanov, V.; Fazio, J.; et al. US DOE methodology for the development of geologic storage potential for carbon dioxide at the national and regional scale. Int. J. Greenh. Gas Control 2011, 5, 952–965. [Google Scholar] [CrossRef]
- Bikkina, P.K.; Shoham, O.; Uppaluri, R. Equilibrated interfacial tension data of the CO2-water system at high pressures and moderate temperatures. J. Chem. Eng. Data 2011, 56, 3725–3733. [Google Scholar] [CrossRef]
- Frailey, S.; Koperna, G.; Tucker, O. The CO2 Storage Resources Management System (SRMS): Toward a Common Approach to Classifying, Categorizing, and Quantifying Storage Resources. In Proceedings of the 14th Greenhouse Gas Control Technologies Conference Melbourne, Rochester, NY, USA, 21–26 October 2018; pp. 21–26. [Google Scholar]
- Diegel, F.A.; Karlo, J.F.; Schuster, D.C.; Shoup, R.C.; Tauvers, P.R. Cenozoic structural evolution and tectonostratigraphic framework of the northern Gulf Coast continental margin. AAPG Mem. 1995, 65, 109–151. [Google Scholar]
- Rowan, M.G.; Jackson MP, A.; Trudgill, B.D. Salt-related fault families and fault welds in the northern Gulf of Mexico. AAPG Bull. 1999, 83, 1454–1484. [Google Scholar]
- Hudec, M.R.; Jackson, M.P.A.; Shultz-Ela, D.D. The paradox of minibasin subsidence into salt: Clues to the evolution of crustal basins. Geol. Soc. Am. Bull. 2009, 121, 201–221. [Google Scholar] [CrossRef]
- Bouroullec, R.; Weimer, P. Geometry and kinematics of Neogene allochthonous salt systems in the Mississippi Canyon, Atwater Valley, western Lloyd Ridge, and western DeSoto Canyon protraction areas, northern, deep-water Gulf of Mexico. AAPG Bull. 2017, 101, 1003–1034. [Google Scholar] [CrossRef]
- Sholanke, S. Structural Framework Analysis in the Mississippi Canyon Protraction Area, Central Gulf of Mexico: Implications for CO2 Sequestration. Master’s Thesis, Oklahoma State University, Stillwater, OK, USA, 2020; p. 98. [Google Scholar]
- Godec, M.; Jalali, J.; Koperna, G.; Hill, G.; Oudinot, A.; Pashin, J.; Riestenberg, D.; Wernette, B. Parametric Study to Assess Technical Prospect Feasibility for Offshore CO2 Storage; White Paper, U.S. Department of Energy contract DE-FE0031557; Southern States Energy Board: Peachtree Corners, GA, USA, 2020; p. 47. [Google Scholar]
- Mahaffie, M.J. Reservoir Classification for Turbidite Intervals at the Mars Discovery, Mississippi Canyon 807, Gulf of Mexico. In Submarine Fans and Turbidite Systems: Sequence Stratigraphy, Reservoir Architecture, and Production Characteristics-Gulf of Mexico and International, Proceedings of the 15th Annual Gulf Coast SEPM Research Conference, Houston, TX, USA, 4–7 December 1994; Weimer, P., Bouma, A.H., Perkins, B.F., Eds.; Society for Sedimentary Geology: Tulsa, OK, USA, 1994; pp. 233–244. [Google Scholar]
- Meckel, L.; Ugueto, G.; Lynch, H.; Cumming, E.; Hewett, B.; Bocage, E.; Winker, C.; O’Neill, B. Genetic Stratigraphy, Stratigraphic Architecture, and Reservoir Stacking Patterns of the Upper Miocene—Lower Pliocene Greater Mars–Ursa Intraslope Basin, Mississippi Canyon, Gulf of Mexico. In Sequence Stratigraphic Models for Exploration and Production: Evolving Methodology, Emerging Models, and Application Histories: 22nd Annual Gulf Coast Research Conference; Society for Sedimentary Geology: Tulsa, OK, USA, 2002; pp. 113–147. [Google Scholar]
- Ewing, T.E.; Galloway, W.E. Evolution of the Northern Gulf of Mexico Sedimentary Basin. In Sedimentary Basins of United States and Canada, 2nd ed.; Miall, A.D., Ed.; Elsevier: Amsterdam, The Netherlands, 2019; pp. 627–694. [Google Scholar]
- Span, R.; Wagner, W. A new equation of state for carbon dioxide covering the fluid region from the triple-point temperature to 1100 K at pressures up to 800 MPa. J. Phys. Chem. Ref. Data 1996, 25, 1509–1596. [Google Scholar] [CrossRef]
- Lemmon, E.; Eric, W.; Ian, H.; Huber, M.L.; Mclinden, M.O. NIST Standard Reference Database 23: Reference Fluid Thermodynamic and Transport Properties-REFPROP, Version 10.0; National Institute of Standards and Technology: Gaithersburg, MD, USA, 2018. [Google Scholar]
- Raza, A.; Rezaee, R.; Gholami, R.; Bing, C.H.; Nagarajan, R.; Hamid, M.A. A screening criterion for selection of suitable CO2 storage sites. J. Nat. Gas Sci. Eng. 2016, 28, 317–327. [Google Scholar] [CrossRef]
- Ehrenberg, S.N.; Nadeau, P.H.; Steen, Ø. A mega scale view of reservoir quality in producing sandstones from the offshore Gulf of Mexico. Am. Assoc. Pet. Geol. Bull. 2008, 92, 145–164. [Google Scholar]
- Pashin, J.C.; Spears, J.; Ademilola, J. Sedimentation, structure, and reservoir properties in prospective offshore geologic carbon sinks, Gulf of Mexico, International Association of Sedimentologists. In Proceedings of the 21st International Sedimentological Congress Abstract Book, Beijing, China, 22–26 August 2022; p. 2083. [Google Scholar]
- Black, J.R.; Carroll, S.A.; Haese, R.R. Rates of mineral dissolution under CO2 storage conditions. Chem. Geol. 2015, 399, 134–144. [Google Scholar] [CrossRef]
- Ketzer, J.M.; Iglesias, R.; Einloft, S. Reducing Greenhouse Gas Emissions with CO2 Capture and Geological Storage. In Handbook of Climate Change Mitigation and Adaptation; Chen, W.Y., Suzuki, T., Lackner, M., Eds.; Springer: Cham, Switzerland, 2017; pp. 2197–2237. [Google Scholar] [CrossRef]
- Kimbrel, E.H.; Herring, A.L.; Armstrong, R.T.; Lunati, I.; Bay, B.K.; Wildenschild, D. Experimental characterization of nonwetting phase trapping and implications for geologic CO2 sequestration. Int. J. Greenh. Gas Control 2015, 42, 1–15. [Google Scholar] [CrossRef]
- Metz, B.; Davidson, O.; De Coninck, H.; Loos, M.; Meyer, L. IPCC Special Report on Carbon Dioxide Capture and Storage; Cambridge University Press: Cambridge, UK, 2005. [Google Scholar]
- Pentland, C.H. Measurements of non-wetting phase trapping in porous media. Energy Procedia 2011, 1, 3173–3180. [Google Scholar]
- Qi, D.; Su, K. Risk Assessment of CO2 Geological Storage and the Calculation of Storage Capacity. In Proceedings of the 2009 Asia-Pacific Power and Energy Engineering Conference, Wuhan, China, 27–31 March 2009; IEEE: Piscataway, NJ, USA, 2009; pp. 1–4. [Google Scholar]
- Ambrose, W.; Lakshminarasimhan, S.; Holtz, M.; Núñez-López, V.; Hovorka, S.D.; Duncan, I. Geologic factors controlling CO2 storage capacity and permanence: Case studies based on experience with heterogeneity in oil and gas reservoirs applied to CO2 storage. Environ. Geol. 2008, 54, 1619–1633. [Google Scholar] [CrossRef]
- Solomon, S. Carbon dioxide storage: Geological security and environmental issues–Case study on the Sleipner gas field in Norway. Bellona Rep. 2007, 128, 27–31. [Google Scholar]
- Watson, M.N.; Gibson-Poole, C.M. Reservoir selection for optimised geological injection and storage of carbon dioxide: A combined geochemical and stratigraphic perspective. In Proceedings of the Fourth Annual Conference on Carbon Capture and Storage, Alexandria, Egypt, 2–5 May 2005; National Energy Technology Laboratory, US Department of Energy: Alexandria, Egypt, 2005; pp. 2–5. [Google Scholar]
- Ghaderi, S.M.; Keith, D.W.; Leonenko, Y. Feasibility of injecting large volumes of CO2 into aquifers. Energy Procedia 2009, 1, 3113–3120. [Google Scholar] [CrossRef]
- Jalil, M.; Masoudi, R.; Darman, N.B.; Othman, M. Study of the CO2 injection, storage, and sequestration in depleted M4 carbonate gas condensate reservoir, Malaysia. In Proceedings of the Carbon Management Technology Conference, Orlando, FL, USA, 7–9 February 2012; OnePetro: Richardson, TX, USA, 2012. [Google Scholar]
- Bachu, S. Evaluation of CO2 sequestration capacity in oil and gas reservoirs in the Western Canada Sedimentary Basin. Alta. Geol. Surv. Alta. Energy Util. Board March 2004, 114, 1–77. [Google Scholar]
- Bachu, S. Screening and Ranking of Hydrocarbon Reservoirs for CO2 Storage in the Alberta Basin, Canada. In US Department of Energy–National Energy Technology Laboratory, National Conference on Carbon Sequestration; Citeseer: Princeton, NJ, USA, 2001; Volume 67. [Google Scholar]
- Bandara, U.C.; Tartakovsky, A.M.; Palmer, B.J. Pore-scale study of capillary trapping mechanism during CO2 injection in geological formations. Int. J. Greenh. Gas Control 2011, 5, 1566–1577. [Google Scholar] [CrossRef]
- Chalbaud, C.; Robin, M.; Lombard, J.-M.; Bertin, H.; Egermann, P. Brine/CO2 interfacial properties and effects on CO2 storage in deep saline aquifers. Oil Gas Sci. Technol. Rev. De L’institut Français Du Pétrole 2010, 65, 541–555. [Google Scholar]
- Wildenschild, D.; Armstrong, R.T.; Herring, A.L.; Young, I.M.; Carey, J.W. Exploring capillary trapping efficiency as a function of interfacial tension, viscosity, and flow rate. Energy Procedia 2011, 4, 4945–4952. [Google Scholar] [CrossRef]
- Lu, C.; Han, W.S.; Lee, S.-Y.; McPherson, B.J.; Lichtner, P.C. Effects of density and mutual solubility of a CO2–brine system on CO2 storage in geological formations:“Warm” vs.“cold” formations. Adv. Water Resour. 2009, 32, 1685–1702. [Google Scholar] [CrossRef]
- Chevalier, G.; Diamond, L.W.; Leu, W. Potential for deep geological sequestration of CO2 in Switzerland: A first appraisal. Swiss J. Geosci. 2010, 103, 427–455. [Google Scholar] [CrossRef]
- Olden, P.; Pickup, G.; Jin, M.; Mackay, E.; Hamilton, S.; Somerville, J.; Todd, A. Use of rock mechanics laboratory data in geomechanical modelling to increase confidence in CO2 geological storage. Int. J. Greenh. Gas Control 2012, 11, 304–315. [Google Scholar] [CrossRef]
- Raza, A.; Rezaee, R.; Gholami, R.; Rasouli, V.; Bing, C.H.; Nagarajan, R.; Hamid, M.A. Injectivity and quantification of capillary trapping for CO2 storage: A review of influencing parameters. J. Nat. Gas Sci. Eng. 2015, 26, 510–517. [Google Scholar] [CrossRef]
- Ramírez, A.; Hagedoorn, S.; Kramers, L.; Wildenborg, T.; Hendriks, C. Screening CO2 storage options in the Netherlands. Int. J. Greenh. Gas Control 2010, 4, 367–380. [Google Scholar] [CrossRef]
- Hardage, B.A.; Muarray, P.E.; Remington, R.; De Angelo, M.; Sava, D.; Roberts, H.H.; Shedd, W.; Hunt, J., Jr. Multicomponent seismic technology assessment of fluid-gas expulsion geology and gas-hydrate systems. Am. Assoc. Pet. Geol. Mem. 2009, 89, 247–265. [Google Scholar]
- Godec, M.; Jalali, J.; Koperna, G.; Hill, G.; Oudinot, A.; Pashin, J.; Riestenberg, D.; Wallace, M.; Wernette, B. Characterization of Offshore Storage Resource Potential in the Central Planning Area of the Gulf of Mexico; Milestone Report, U.S. Department of Energy contract DE-FE0031557; Southern States Energy Board: Peachtree Corners, GA, USA, 2020; p. 96. [Google Scholar]
- Bhattacherjee, R.; Botchway, K.; Pashin, J.C.; Chakraborty, G.; Bikkina, P. Machine learning-based prediction of CO2 fugacity coefficients: Application to estimation of CO2 solubility in aqueous brines as a function of pressure, temperature, and salinity. Int. J. Greenh. Gas Control 2023, 128, 103971. [Google Scholar] [CrossRef]
- Soong, Y.; Goodman, A.; McCarthy-Jones, J.; Baltrus, J. Experimental and simulation studies on mineral trapping of CO2 with brine. Energy Convers. Manag. 2004, 45, 1845–1859. [Google Scholar] [CrossRef]
- Xue, W.; Wang, Y.; Chen, Z.; Liu, H. An integrated model with stable numerical methods for fractured underground gas storage. J. Clean. Prod. 2023, 393, 136268. [Google Scholar] [CrossRef]
- Meyer, J.P. Summary of Carbon Dioxide Enhanced Oil Recovery (CO2 EOR) Injection Well Technology; American Petroleum Institute: Washington, DC, USA, 2007; Available online: https://www.api.org/~/media/files/ehs/climate-change/summary-carbon-dioxide-enhanced-oil-recovery-well-tech.pdf (accessed on 12 June 2023).


| Region | Field Status | Fields | Sands |
|---|---|---|---|
| Shelf | Active | 207 | 4940 |
| Depleted | 302 | 1597 | |
| Total | 509 | 6537 | |
| Slope | Active | 114 | 838 |
| Depleted | 50 | 118 | |
| Total | 163 | 956 | |
| Grand Total | 672 | 7493 | |
| Protraction Areas | Status | Fields | Sands |
|---|---|---|---|
| Atwater Valley AT | Active | 2 | 9 |
| Depleted | 4 | 5 | |
| Ewing Bank EW | Active | 13 | 138 |
| Depleted | 5 | 10 | |
| Green Canyon | Active | 34 | 253 |
| Depleted | 13 | 31 | |
| Mississippi Canyon MC | Active | 44 | 340 |
| Depleted | 19 | 53 | |
| Viosca Knoll VK | Active | 14 | 76 |
| Depleted | 9 | 19 | |
| Walker Ridge WR | Active | 7 | 22 |
| Grand Total | 164 | 956 | |
| Shelf | Slope | |
|---|---|---|
| Sand Counts | 6537 | 956 |
| Average Subsea Depth (feet) | 8971.12 (2734.40 m) | 13,100.97 (3993.18 m) |
| Average Thickness (feet) | 21.75 (6.63 m) | 38.29 (11.67 m) |
| Average Area (acres) | 581.29 (2.35 km2) | 901.33 (3.65 km2) |
| Average Temperature (°F) | 183.49 (84.16 °C) | 169.17 (76.21 °C) |
| Average Pressure (psi) | 5056.42 (34.86 mPa) | 8599.45 (40.68 mPa) |
| Average Porosity | 0.28 | 0.29 |
| Average Permeability (mD) | 391.03 | 589.56 |
| Average Water Saturation | 0.28 | 0.25 |
| Average Original Barrel of Oil Equivalent (BOE) (bbl) | 3,895,682.04 (619.36 million L) | 14,682,604.78 (2334.35 million L) |
| Parameters | Positive Indicators | Indication Aspect |
|---|---|---|
| Subsea Depth | ≥2304 feet (702 m) | Storage Capacity |
| Porosity | ≥20% | Storage Capacity Capillary Trapping |
| Permeability | ≥100 mD | Injectivity |
| Initial Reservoir Temperature | >CO2 critical temperature (304.13 K, 31.0 °C, 87.8 °F) | Storage Efficiency |
| Pressure | >CO2 critical pressure (7.3773 MPa, 72.8 atm, 1070 psi, 73.8 bar) | Storage Efficiency |
| Pressure–Depth Quotients | <15.5 KPa/m (0.68 psi/ft) | Injectivity |
| API Gravity | 22°–48° feasible (medium-light crude oil); 30°–40° considered optimal (light crude oil) [59] | Injectivity |
| Cumulative Production | ≥10,000 barrels (1.59 million L) | Storage Potential |
| Rock Type | Quartz-rich sandstone, typically poorly consolidated | Capillary Trapping |
| CO2 Density | >0.6 g/cc | Storage Capacity |
| Screening Criteria | Satisfied Sands | Filtered Sands |
|---|---|---|
| Cumulative Oil (≥1.59 million L, 10,000 bbl) | 744 | 212 |
| Initial Temperature (≥31.1 °C, 87.98 °F) | 942 | 14 |
| Initial Pressure (≥7.3773 MPa, 1070 psi) | 956 | 0 |
| Subsea Depth (≥702 m, 2304 feet) | 956 | 0 |
| CO2 Density (>0.6 g/cc) | 955 | 1 |
| Permeability (≥100 mD) | 770 | 186 |
| Porosity (≥20%) | 919 | 37 |
| Oil API Gravity (22°–48°, API units) | 648 | 308 |
| All Conditions | 445 | 511 |
| BOEM Field | NETL Method—Low (P10), Eoil/Gas = 15% (Megatons) | NETL Method—Medium (P50), Eoil/Gas = 25% (Megatons) | NETL Method—High (P90), Eoil/Gas = 40% (Megatons) | Volumetric Method Storage Resource (Megatons) |
|---|---|---|---|---|
| MC807 | 108 | 181 | 289 | 1052 |
| GC743 | 64 | 107 | 171 | 543 |
| GC826 | 59 | 98 | 158 | 451 |
| GC640 | 53 | 88 | 141 | 456 |
| GC654 | 29 | 48 | 77 | 221 |
| MC776 | 22 | 37 | 59 | 206 |
| MC778 | 17 | 28 | 45 | 154 |
| MC084 | 17 | 28 | 44 | 151 |
| GC562 | 13 | 21 | 34 | 117 |
| MC696 | 10 | 17 | 27 | 90 |
| BOEM Field | NETL Method—Low (P10), Eoil/Gas = 15% (Megatons) | NETL Method—Medium (P50), Eoil/Gas = 25% (Megatons) | NETL Method—High (P90), Eoil/Gas = 40% (Megatons) | Volumetric Method Storage Resource (Megatons) |
|---|---|---|---|---|
| MC807 | 108 | 181 | 289 | 1052 |
| MC776 | 22 | 37 | 59 | 206 |
| MC778 | 17 | 28 | 45 | 154 |
| MC084 | 17 | 28 | 44 | 151 |
| MC696 | 10 | 17 | 27 | 90 |
| MC194 | 10 | 16 | 25 | 112 |
| VK956 | 10 | 16 | 25 | 142 |
| MC935 | 8 | 14 | 22 | 71 |
| VK990 | 8 | 13 | 21 | 80 |
| MC383 | 8 | 13 | 20 | 75 |
| BOEM Field | Count of Sands | NETL Medium Storage Resource (P50) (Megatons) | Total Area (km2) | Average Area (km2) | Average Reservoir Thickness (m) | Average Subsea Depth (m) |
|---|---|---|---|---|---|---|
| MC807 | 26 | 181 | 325.59 | 17.34 | 16.47 | 5144 |
| MC776 | 4 | 37 | 25.07 | 8.69 | 34.71 | 6047 |
| MC778 | 7 | 28 | 48.30 | 9.55 | 17.74 | 6822 |
| MC084 | 6 | 28 | 51.88 | 11.99 | 19.85 | 4028 |
| MC696 | 4 | 17 | 24.89 | 8.62 | 15.06 | 7003 |
| MC194 | 8 | 16 | 65.29 | 11.31 | 6.81 | 2622 |
| VK956 | 4 | 16 | 85.03 | 29.47 | 7.80 | 3783 |
| MC935 | 3 | 14 | 18.29 | 8.44 | 22.53 | 5272 |
| VK990 | 8 | 13 | 36.75 | 6.35 | 7.69 | 2331 |
| MC383 | 2 | 13 | 22.74 | 15.76 | 11.58 | 3812 |
| BOEM Field | Average Initial Reservoir Pressure (MPa) | Average Initial Reservoir Temperature (°C) | Average Permeability (mD) | Average Porosity | Average Water Saturation | Total OOIP (Billion L) | Total ROIP (Billion L) |
|---|---|---|---|---|---|---|---|
| MC807 | 80.71 | 76.28 | 491.12 | 0.29 | 0.20 | 148.25 | 7.20 |
| MC776 | 92.39 | 92.64 | 1062.50 | 0.27 | 0.16 | 54.80 | 1.45 |
| MC778 | 107.90 | 115.39 | 653.71 | 0.23 | 0.15 | 68.63 | 2.01 |
| MC084 | 50.42 | 75.65 | 511.00 | 0.27 | 0.20 | 114.38 | 11.60 |
| MC696 | 104.79 | 111.25 | 902.25 | 0.25 | 0.18 | 706.68 | 67.82 |
| MC194 | 32.71 | 59.93 | 497.13 | 0.32 | 0.29 | 52.67 | 1.39 |
| VK956 | 49.16 | 99.44 | 688.25 | 0.29 | 0.19 | 124.71 | 6.62 |
| MC935 | 86.03 | 73.33 | 441.67 | 0.27 | 0.22 | 58.16 | 0.01 |
| VK990 | 31.36 | 56.74 | 422.38 | 0.31 | 0.29 | 49.27 | 0.91 |
| MC383 | 54.77 | 63.06 | 2266.00 | 0.34 | 0.18 | 49.64 | 2.03 |
| BOEM Field | Count of Sands | NETL Medium (P50) Storage Resource per Unit Area (Megatons/km2) | Total Area (km2) | Average Area (km2) | Average Reservoir Thickness (m) | Average Subsea Depth (m) |
|---|---|---|---|---|---|---|
| MC776 | 4 | 1.48 | 25.07 | 6.27 | 34.71 | 6047 |
| MC029 | 1 | 1.32 | 0.45 | 0.45 | 28.91 | 2932 |
| MC899 | 3 | 0.93 | 9.91 | 3.30 | 22.86 | 4951 |
| MC698 | 1 | 0.90 | 3.53 | 3.52 | 20.64 | 4886 |
| MC935 | 3 | 0.77 | 18.30 | 6.10 | 22.53 | 5272 |
| MC696 | 4 | 0.68 | 24.89 | 6.22 | 15.08 | 7002 |
| MC800 | 1 | 0.63 | 0.70 | 0.70 | 17.81 | 4833 |
| MC682 | 1 | 0.61 | 12.86 | 12.86 | 26.05 | 7520 |
| MC778 | 7 | 0.59 | 48.30 | 6.90 | 17.74 | 6821 |
| MC807 | 26 | 0.55 | 325.59 | 12.52 | 16.47 | 5144 |
| BOEM Field | Reservoir Pressure (MPa) | Reservoir Temperature (°C) | Permeability (mD) | Porosity | Water Saturation | Total OOIP (Billion L) | Total ROIP (Billion L) |
|---|---|---|---|---|---|---|---|
| MC776 | 92.39 | 92.64 | 1062.50 | 0.27 | 0.16 | 932 | 45 |
| MC029 | 86.03 | 73.33 | 441.67 | 0.27 | 0.22 | 15 | 0.3 |
| MC899 | 104.79 | 111.25 | 902.25 | 0.25 | 0.18 | 228 | 20 |
| MC698 | 107.90 | 115.40 | 653.71 | 0.23 | 0.15 | 86 | 8 |
| MC935 | 80.71 | 76.28 | 491.12 | 0.29 | 0.20 | 345 | 9 |
| MC696 | 54.77 | 63.06 | 2266.00 | 0.34 | 0.18 | 432 | 13 |
| MC800 | 50.42 | 75.65 | 511.00 | 0.27 | 0.20 | 11 | 0.3 |
| MC682 | 28.53 | 55.83 | 891.50 | 0.30 | 0.20 | 195 | 8 |
| MC778 | 54.53 | 70.00 | 1009.88 | 0.30 | 0.20 | 719 | 73 |
| MC807 | 57.34 | 61.67 | 392.71 | 0.30 | 0.28 | 4445 | 427 |
Disclaimer/Publisher’s Note: The statements, opinions and data contained in all publications are solely those of the individual author(s) and contributor(s) and not of MDPI and/or the editor(s). MDPI and/or the editor(s) disclaim responsibility for any injury to people or property resulting from any ideas, methods, instructions or products referred to in the content. |
© 2024 by the authors. Licensee MDPI, Basel, Switzerland. This article is an open access article distributed under the terms and conditions of the Creative Commons Attribution (CC BY) license (https://creativecommons.org/licenses/by/4.0/).
Share and Cite
Hu, X.; Bhattacherjee, R.; Botchway, K.; Pashin, J.C.; Chakraborty, G.; Bikkina, P. CO2 Storage Site Analysis, Screening, and Resource Estimation for Cenozoic Offshore Reservoirs in the Central Gulf of Mexico. Energies 2024, 17, 1349. https://doi.org/10.3390/en17061349
Hu X, Bhattacherjee R, Botchway K, Pashin JC, Chakraborty G, Bikkina P. CO2 Storage Site Analysis, Screening, and Resource Estimation for Cenozoic Offshore Reservoirs in the Central Gulf of Mexico. Energies. 2024; 17(6):1349. https://doi.org/10.3390/en17061349
Chicago/Turabian StyleHu, Xitong, Rupom Bhattacherjee, Kodjo Botchway, Jack C. Pashin, Goutam Chakraborty, and Prem Bikkina. 2024. "CO2 Storage Site Analysis, Screening, and Resource Estimation for Cenozoic Offshore Reservoirs in the Central Gulf of Mexico" Energies 17, no. 6: 1349. https://doi.org/10.3390/en17061349
APA StyleHu, X., Bhattacherjee, R., Botchway, K., Pashin, J. C., Chakraborty, G., & Bikkina, P. (2024). CO2 Storage Site Analysis, Screening, and Resource Estimation for Cenozoic Offshore Reservoirs in the Central Gulf of Mexico. Energies, 17(6), 1349. https://doi.org/10.3390/en17061349