Article

New Aspects of the Pulse Combustion Process

by
Marian Gieras
and
Adrian Marek Trzeciak
*,†
Faculty of Power and Aeronautical Engineering, Warsaw University of Technology, 00-661 Warsaw, Poland
*
Author to whom correspondence should be addressed.
These authors contributed equally to this work.
Energies 2024, 17(6), 1427; https://doi.org/10.3390/en17061427
Submission received: 15 January 2024 / Revised: 22 February 2024 / Accepted: 12 March 2024 / Published: 15 March 2024
(This article belongs to the Special Issue Experiments and Simulations of Combustion Process II)

Abstract

:
Pulse combustion is an attractive yet still little-known form of combustion that can be successfully used in many industrial applications. Experimental studies show that the course of the combustion process in the valveless pulse combustion chamber is conditioned by the process of creating a well-mixed fuel–air mixture inside the chamber. In the paper, numerical calculations were carried out for selected operating conditions of the pulse chamber and compared with experimental results. This allowed for a better understanding and interpretation of the course of the pulsating combustion process itself. The role and importance of the rate of changes in the volume of the combustible mixture zone in the process of improving the efficiency of the combustion process were determined, and the reasons for changes in the pulsation frequency of the combustion process were also explained.

1. Introduction

The combustion of fuels is still the main energy source for domestic hot water, home heating, transport and electricity production [1,2]. Intensive civilization development forces an increase in the energy demand [1]. It is also known that the combustion of fuels generates not only heat but also pollutants such as nitrogen oxides, unburnt hydrocarbons and carbon monoxide. The main product of the combustion of hydrocarbons is carbon dioxide, which is considered a greenhouse gas [3]. In the era of attempts to reduce these emissions, newer and better methods of combustion are being developed, on an industrial [4,5] as well as a smaller scale, e.g., in transport [3,6,7,8]. Regardless of this, emission reduction can be achieved by burning “new” ecological fuels [9]. All these treatments increase the combustion chamber complexity, and, thus, the price. In this context, it is worth paying attention to the conclusions presented in recently published publications [10,11], which show that chambers with pulsed combustion can emit fewer harmful combustion products than “traditional” combustion chambers. At the same time, due to the simplicity of the design, they are easy and cheap to manufacture. For this reason, pulse engines are still being tested for the propulsion of unmanned flying objects and manned ones [12]. A re-analysis of the efficiency of the thrust intensifiers for devices generating a pulsating outflow of gases from the outlet nozzle was also carried out [13]. Pulse combustion chambers are also used in heating boilers [14] and devices for fogging and/or spraying plant protection products [15,16]. The possibility of using the flue gas stream from the pulsating combustion chamber for impact drying [17,18] and the production of powders [19] also seems very attractive. A particularly interesting concept seems to be the drying of sewage sludge to produce powdered fuel for the pulse combustion chamber [20]. Despite many advantages, pulse combustion chambers suffer from high vibrations as well as annoying noise. However, nowadays, industrial producers of pulsating combustion devices are able to reduce them both to an acceptable level [14].
Works from the early stage of development of pulse engines are widely known [21,22,23,24,25,26,27]. Despite their considerable scale, during their implementation, it was not possible to explain all the phenomena responsible for periodic self-repeating combustion inside a specially shaped flow channel. The reason for this state of affairs could be both the level of complexity of the studied phenomenon, as well as the insufficient technological level of the then measuring equipment. In recent years, the dynamic development of measurement and imaging technologies has made it possible to carry out experiments that were previously difficult to perform [28,29,30,31,32]. Due to the great difficulty and complexity of the experimental studies of pulsating combustion chambers, numerical studies may be of invaluable help. In the publication [33], the authors proposed the use of a neural network to build a model of a pulsating combustion chamber. This model omits a detailed description of the phenomena occurring in the combustion chamber. To estimate the performance of the pulsating combustion chamber, a network of possible connections between the quantities characterizing the operation of the chamber was built. This model can be a good auxiliary tool for the design of pulsating combustion chambers. However, it does not explain the phenomena occurring in the chamber.
More and more, developed modern commercial CFD codes based on universal equations and models of turbulence, heat transfer and combustion, according to the authors of this article, if properly used, can significantly support the study of pulsating combustion. In particular, researchers use calculation packages to assess the parameters of the process taking place inside the combustion chamber, e.g., flame structure [34], mixture composition [35], emission of pollutants [11,36] or the evaporation of fuel droplets inside the combustion chamber [37].
Despite a relatively large number of detailed studies, the analysed literature does not provide a clear answer as to how the course of the combustion process affects the operation of the pulsating combustion chamber. According to the authors of this article, it is particularly important to know the organization of the combustion process inside the chamber, as is the case with piston or turbine engines. In the cited literature review, it was approximated for one valve pulsating combustion chamber [28,29,30]. However, in these works, the authors do not control the operation of the tested engine in any way. It is also not known whether the configuration in which the organization of the process inside the combustion chamber is discussed is optimal in terms of efficiency.
Based on the review of the literature, the authors of this publication assume that it is possible to influence the operation of the pulsating combustion chamber. By changing the flow rate and the method of fuel supply, the operation of the pulsating combustion chamber should, to some extent, adapt to the new conditions [31,38]. At the same time, it is necessary to examine how the organization of the process inside the combustion chamber changes. Testing of multiple fuel delivery configurations should be combined with a simultaneous assessment of combustion efficiency. This will enable the determination of the conditions that are conducive to the effective operation of the pulsating combustion chamber. It is worth noting that in the case of combustion chambers of turbine and piston engines, performance improvement is achieved by shaping the flow field and organizing internal processes appropriately, in particular, by mixing fuel and air. A similar effect should be expected in the case of a pulsating combustion chamber. In addition, in a device with periodically recurring combustion with a specific frequency, a sufficiently quick preparation of a homogeneous combustible mixture seems to be of key importance. A similar approach was not noticed in any of the cited publications.

2. Research Stand and Measurement System

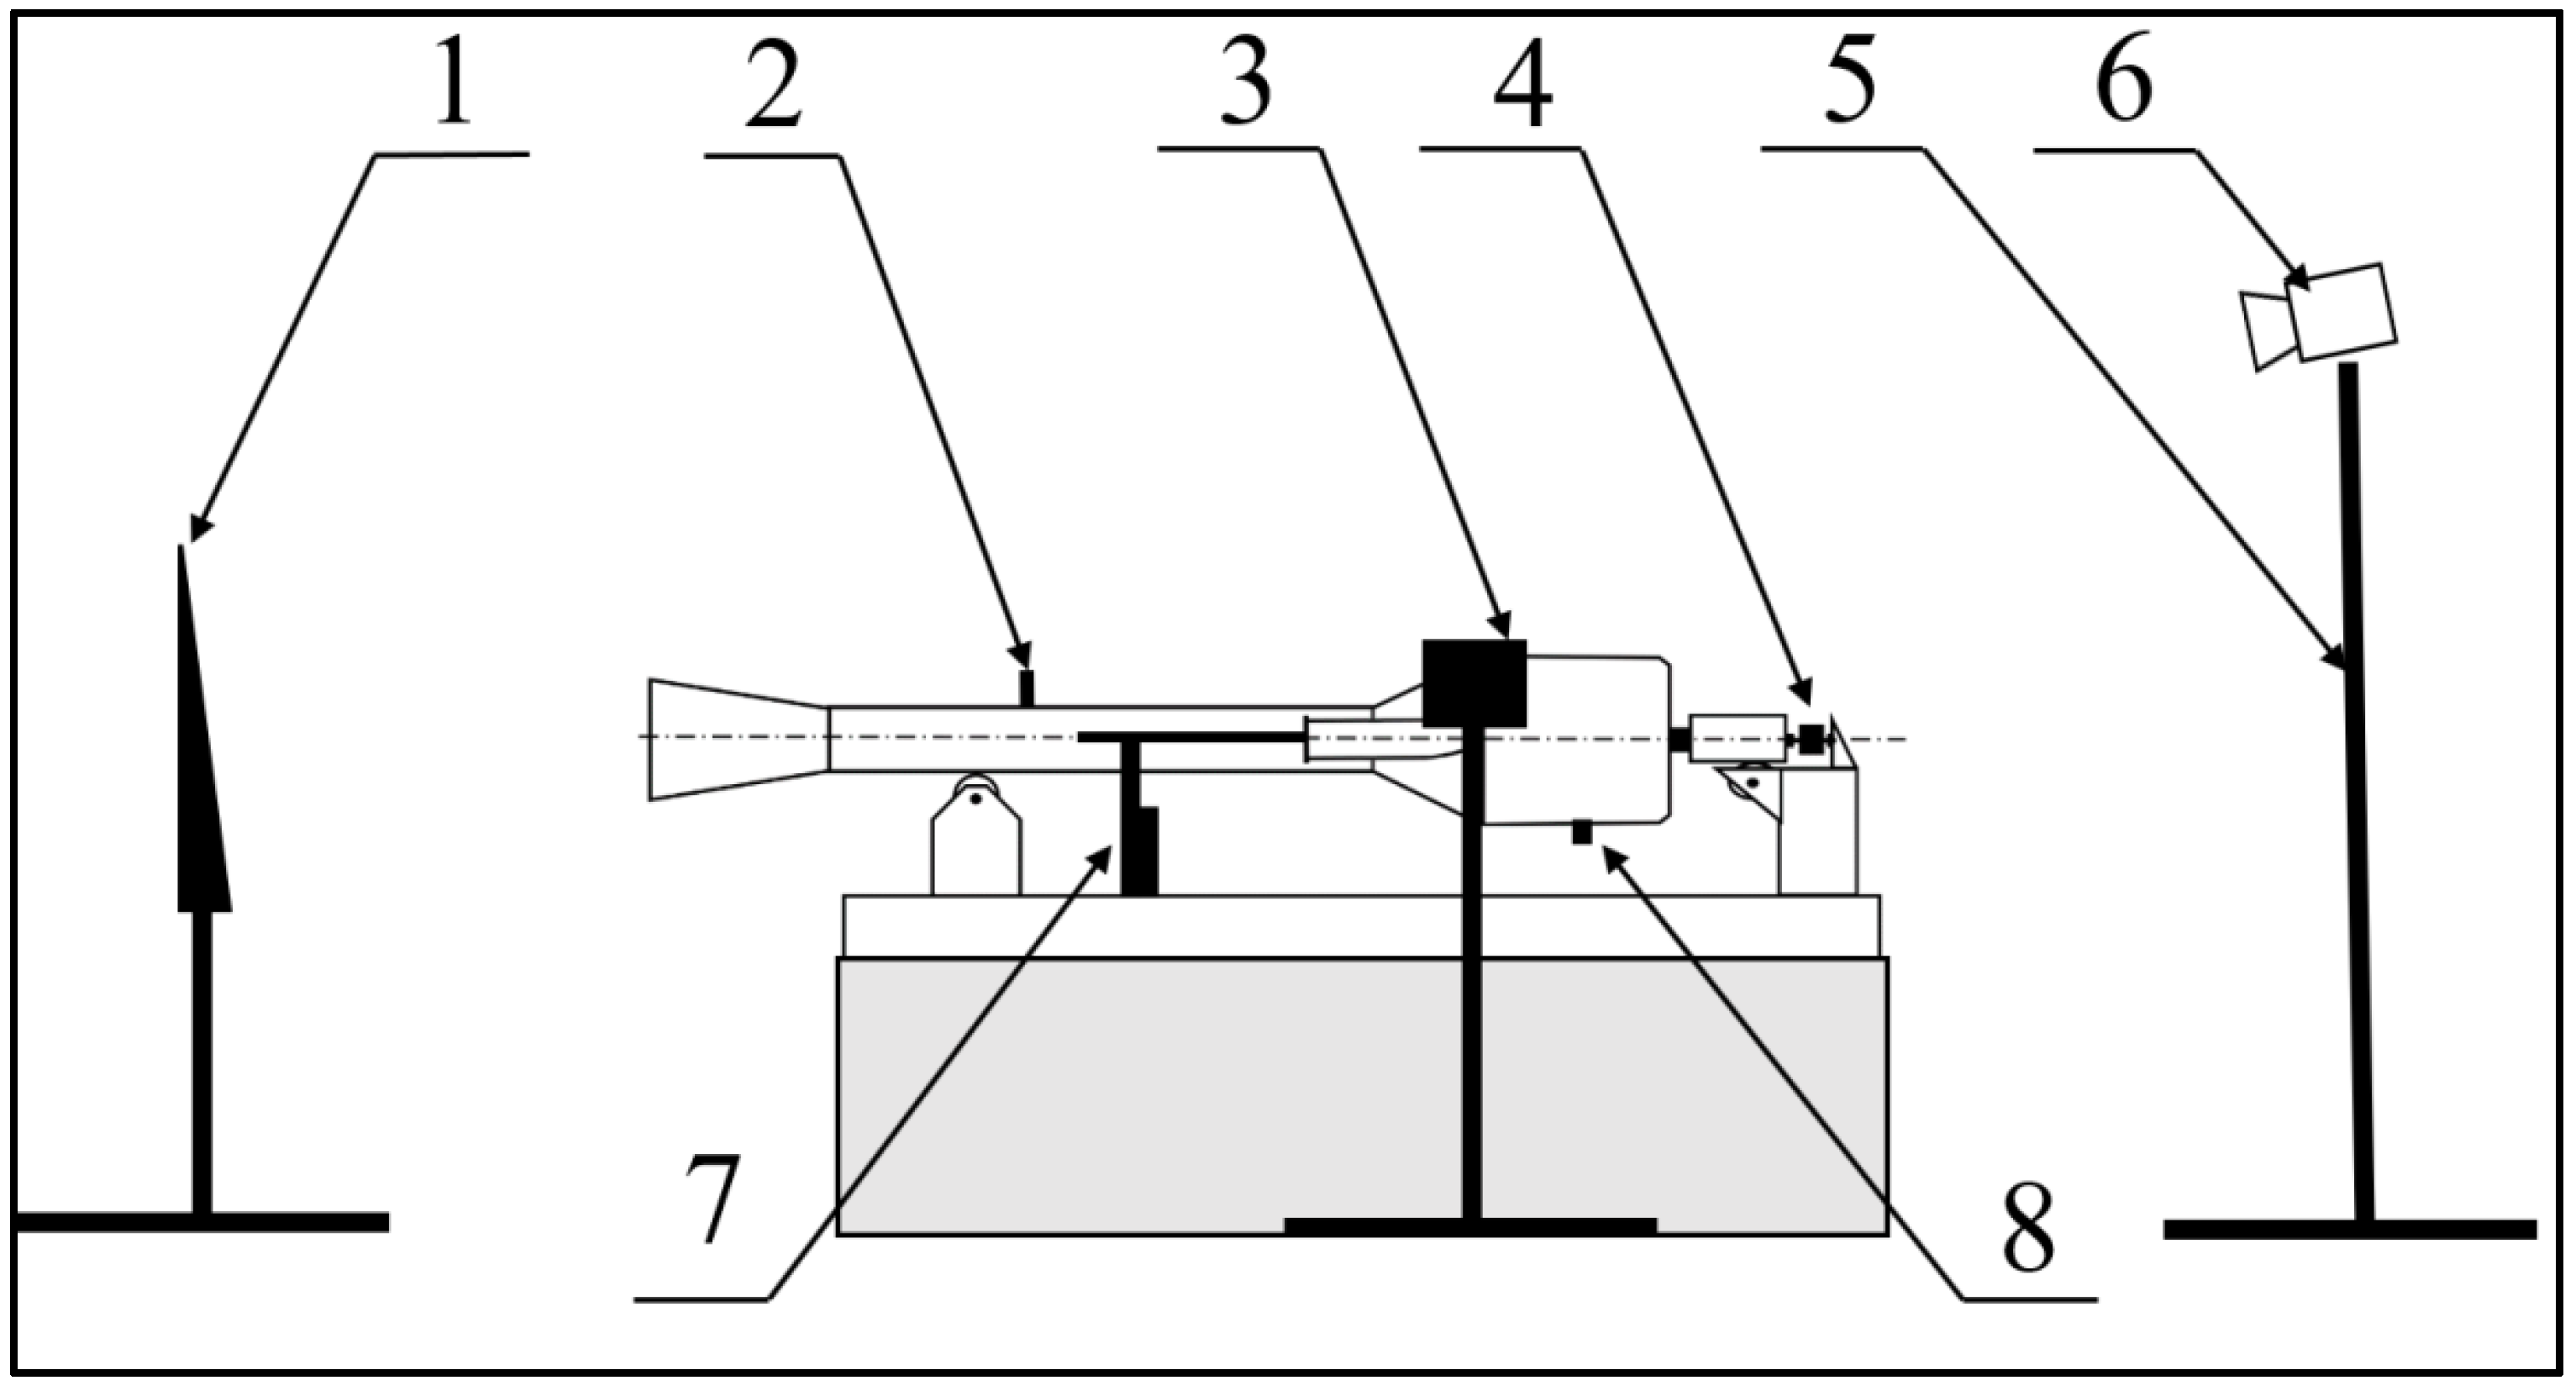
Studies on pulsed combustion processes were carried out for the geometry of a thermojet pulsed engine [31,39,40,41,42,43]. The choice of a structure of this type was largely due to its symmetry to two planes. Thanks to this, it is easier to describe the flow of the medium inside the chamber qualitatively. The mutual symmetrical arrangement of the inlets in relation to the outlet pipe facilitates the control of places where vortices may form inside the chamber, and, thus, combustion zones may occur. A general view of the engine being tested is shown in Figure 1. A gas-dynamic valve configuration was chosen because in contrast to valved ones, the operating frequency is not affected artificially by additional elements. Due to that fact, it can be assumed that the test is subject to a completely natural and undisturbed process of self-repeating pulsed combustion, and the parameters of it depend mainly on the type of fuel and how it is sprayed, as well as the geometry of the object being tested. The general scheme of the measuring stand is shown in Figure 2. The following measurements were carried out:
  • Instantaneous pressure in the combustion chamber using the Kistler piezoelectric sensor 601a cooperating with the 5015 conditioning system with a declared accuracy of 1%;
  • Average exhaust gas temperature with a sheathed thermocouple sensor, type K, manufactured by “Czaki thermoproduct”, cooperating with the TED-37 conditioning system of the same manufacturer. The whole system has a declared accuracy of 0.2%;
  • Thrust using a miniature CL 21msrs strain gauge force transducer with the use of a CL 101 analogue dedicated amplifier with a declared accuracy of 0.5%;
  • Fuel flow using a rotameter with a reading error of 0.15 g/s maximum;
  • Exhaust gas composition using an exhaust gas analyser with a measurement error not exceeding 5% of the measured value.
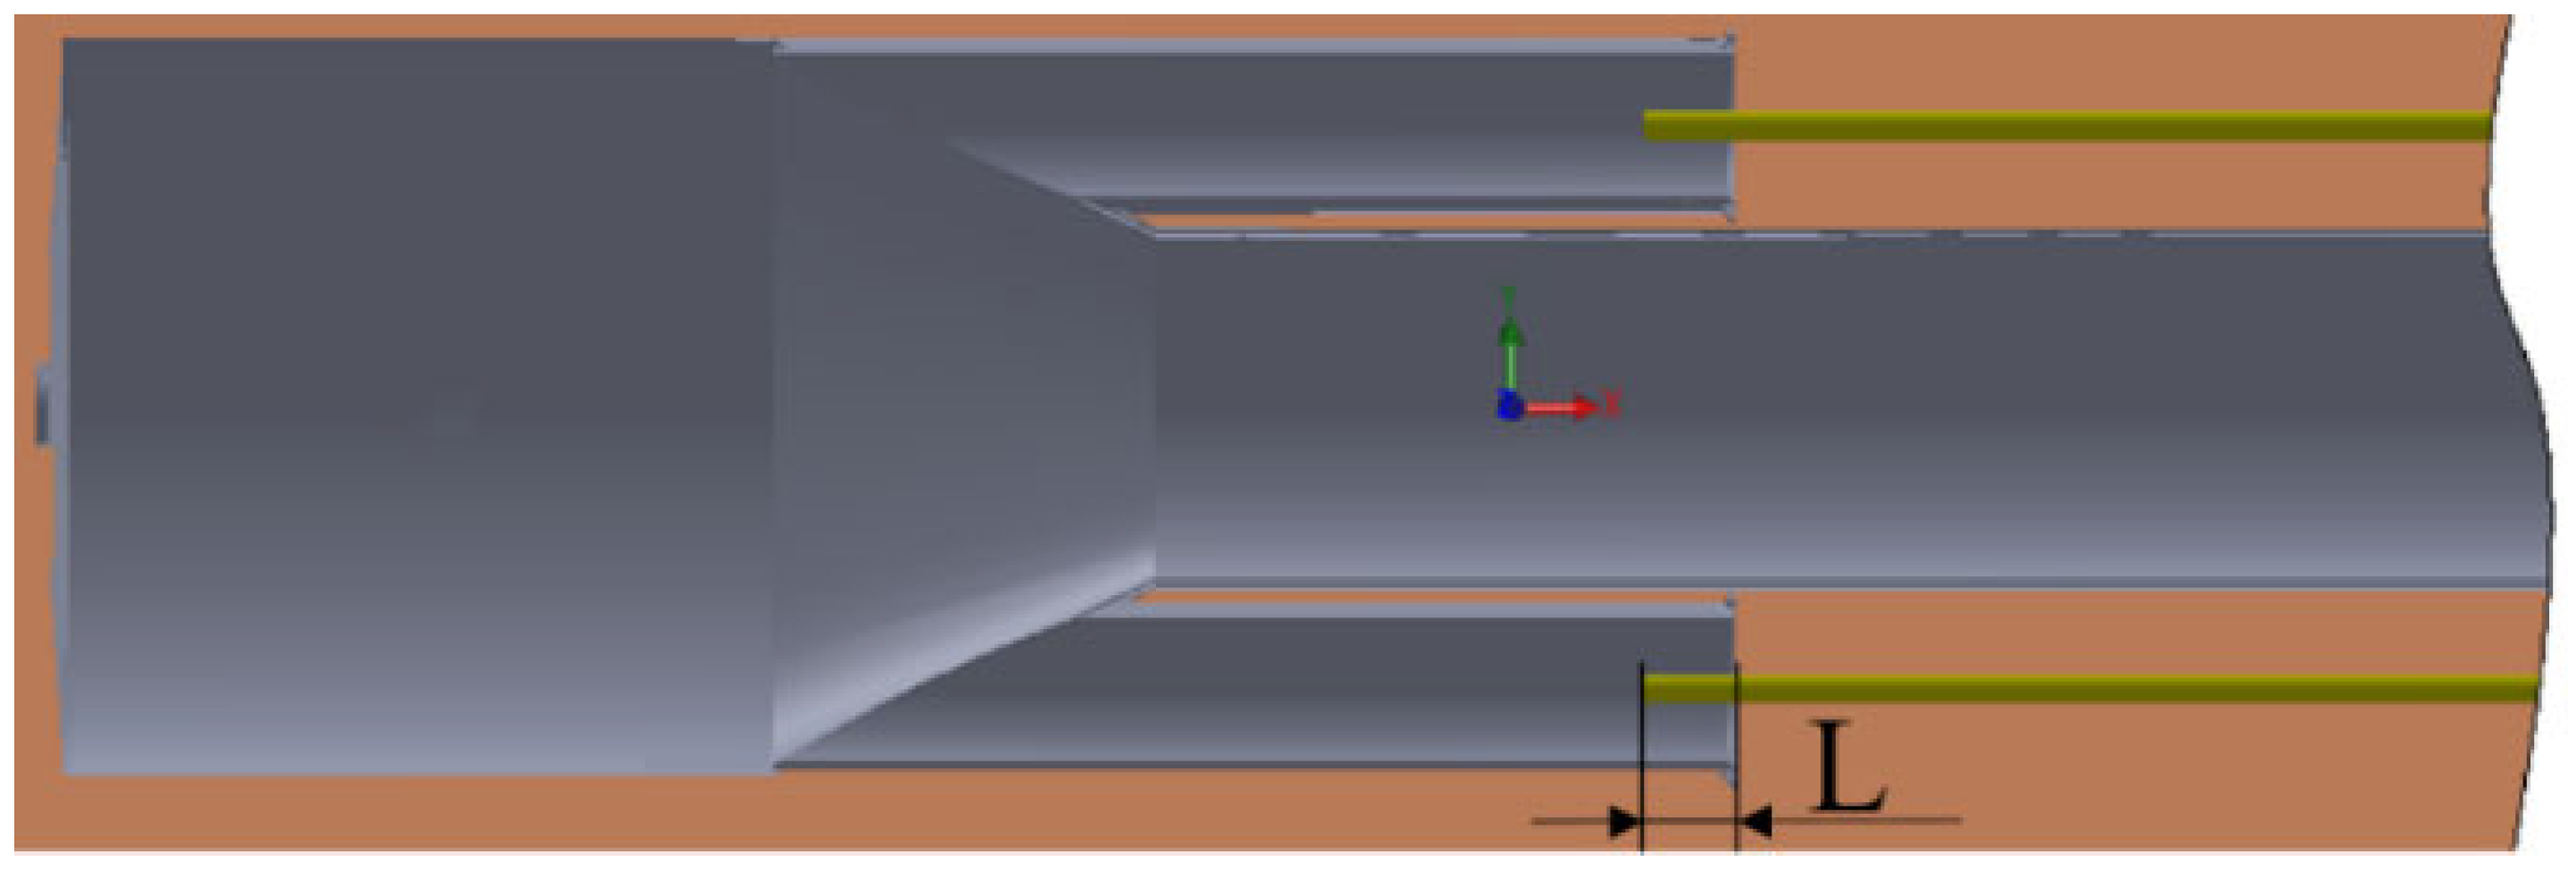
During the tests, the process was visualized using a high-speed video camera (1000 fps, 0.001 s—exposure time) and a thermal imaging camera. In addition, the research stand ensures a smooth and precise change in the position of the injectors inside the inlet pipes and the combustion chamber. The position of the injector was determined by the distance of its face from the edge of the inlet pipe and marked as “L” (Figure 3).
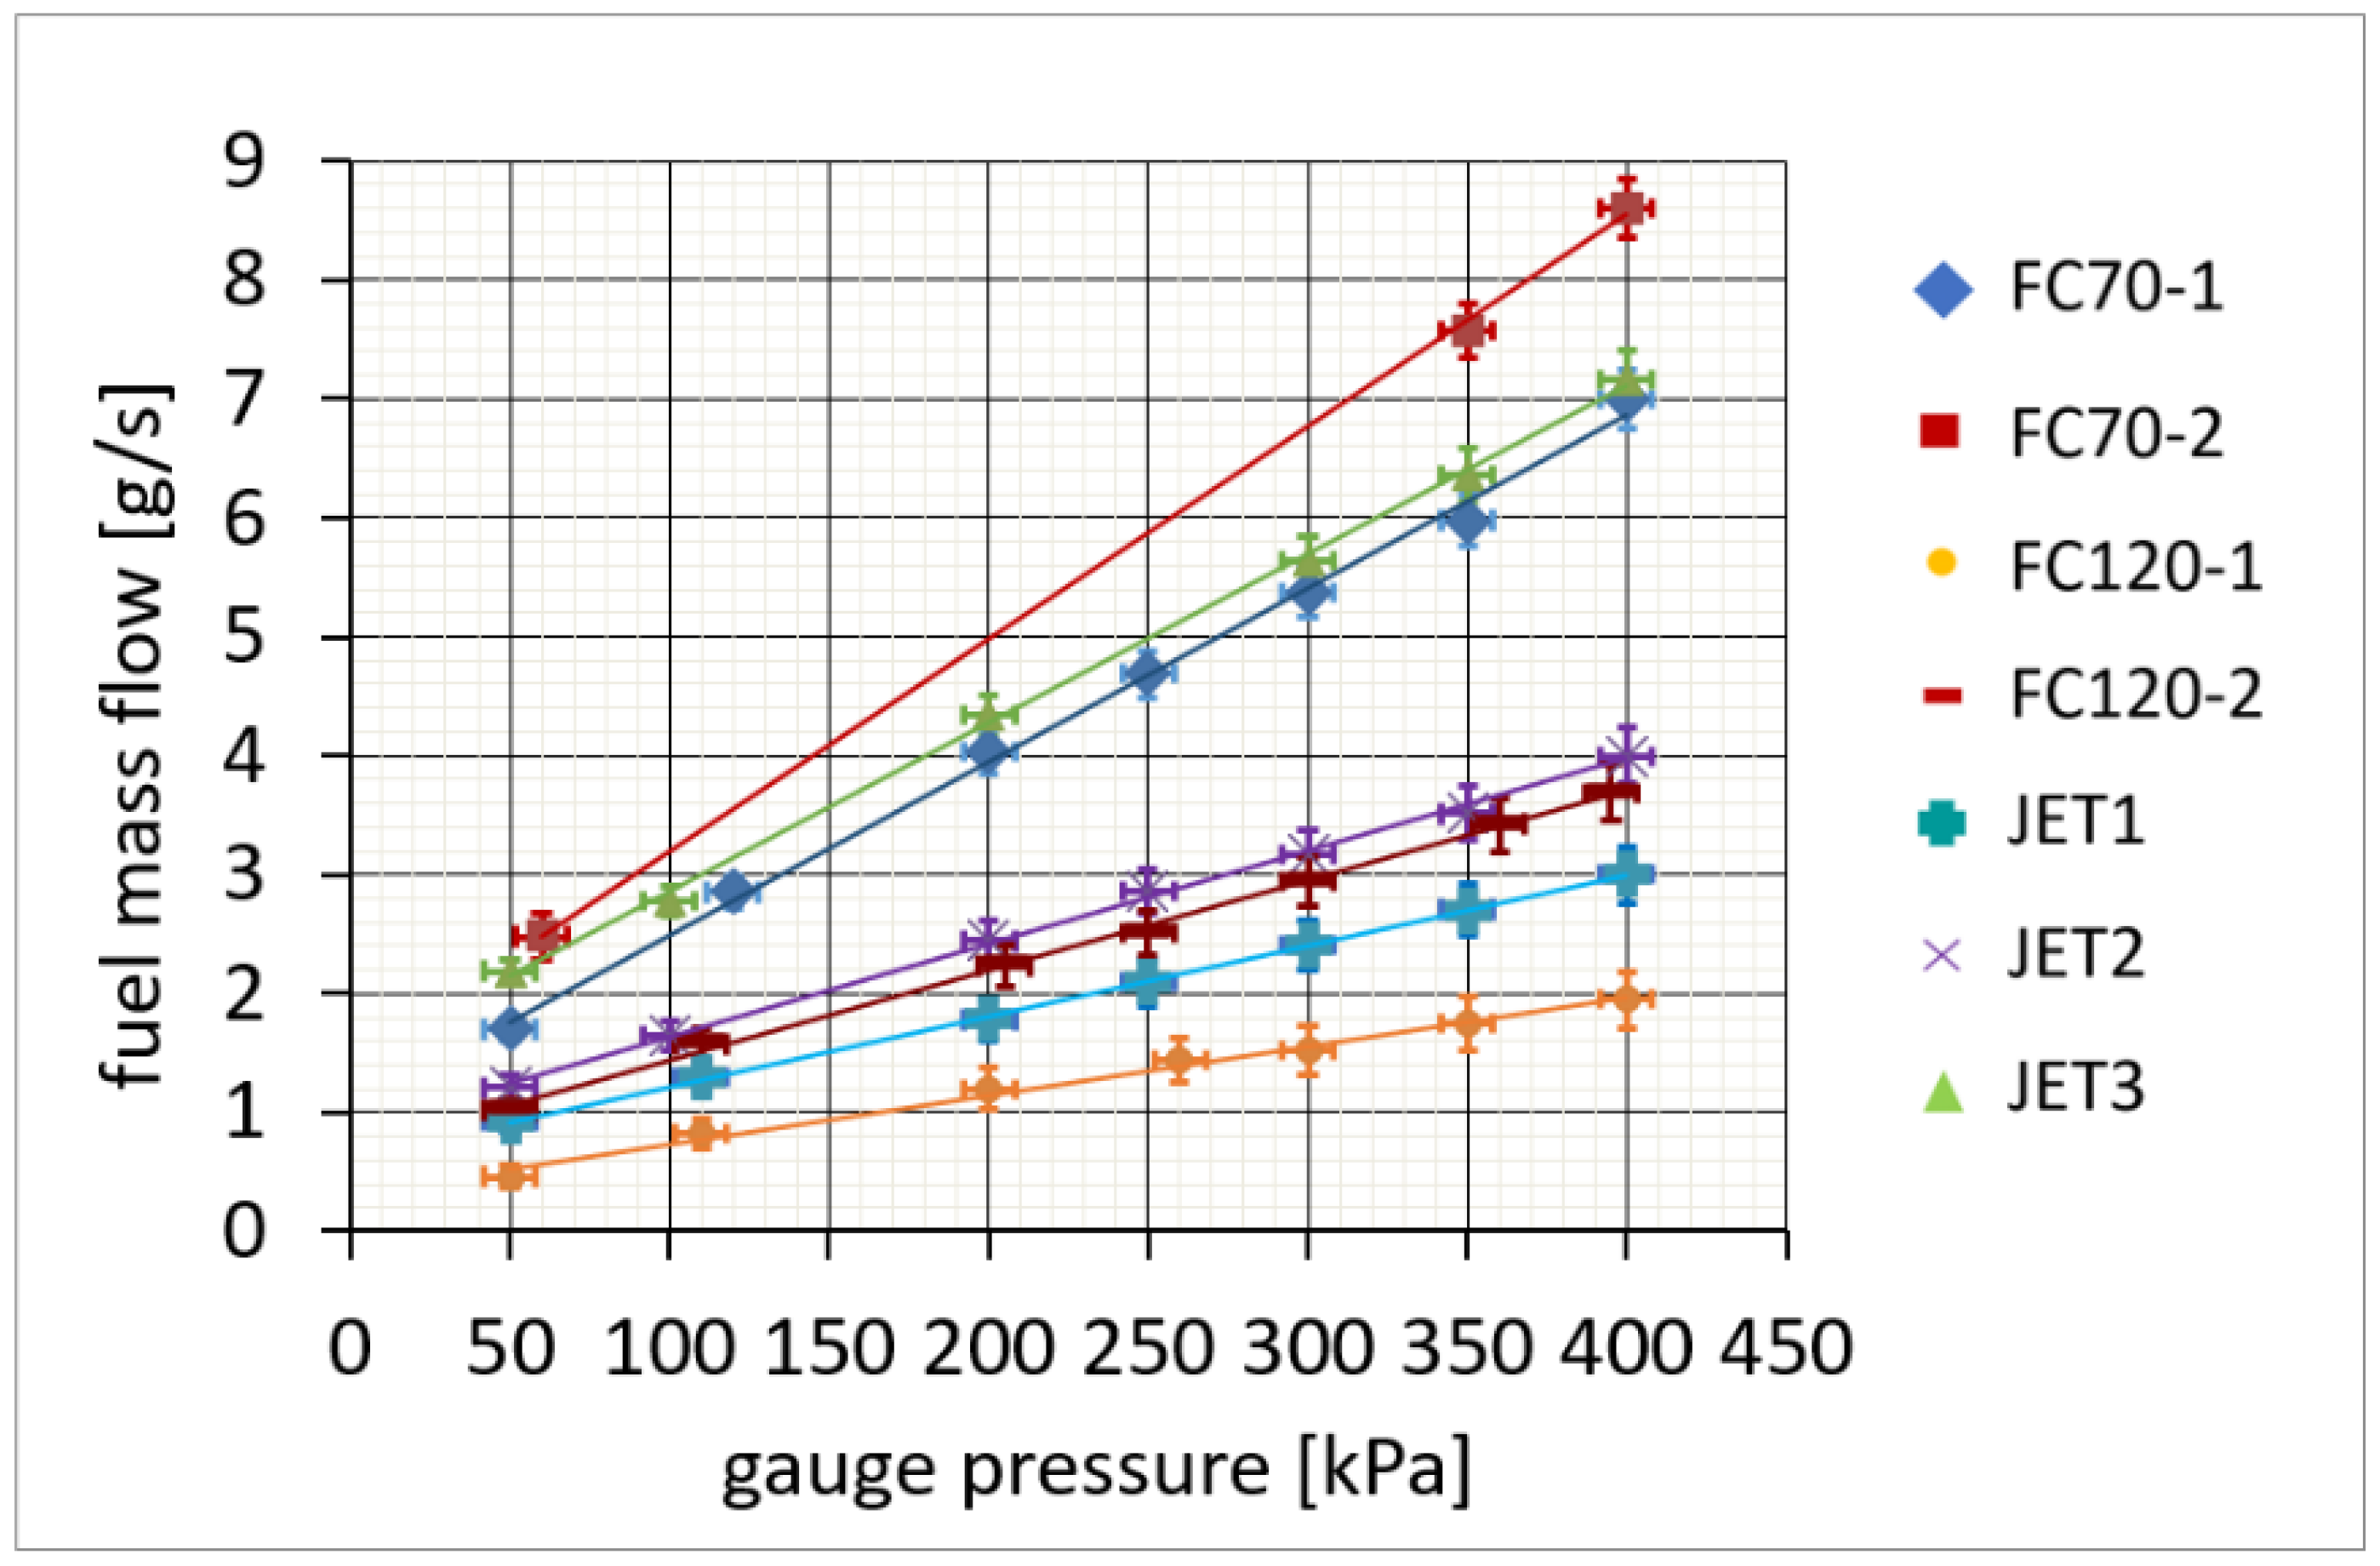
In the course of work, fuel was supplied to the engine through the injectors whose characteristics are shown in Figure 4:
  • Jets with cross-sectional diameters of 1.35 mm, 1.55 mm and 2 mm for JET1, JET2 and JET3, respectively;
  • Full cone swirls with a spray angle of 70°—FC70-1 and FC70-2;
  • Full cone swirls with a spray angle of 120°—FC120-1 and FC120-2.
These injectors were placed in various places in the combustion chamber (at different depths L) with the outlet directed both along the longitudinal axis of the engine and perpendicular to it.

3. Research Results

In [31], it was suggested that the essential condition for efficient pulse combustion is to ensure intensive and dynamic mixing of fuel with air. Such mixing is favored by the presence of intense micro-scale turbulence. Taking this line of reasoning further, it can be concluded that lower operating frequencies will, to some extent, favor higher efficiencies, due to the longer time available to create a well-mixed fuel–air mixture. This conclusion is confirmed by the data presented in Figure 5. The figure shows a general trend of a decrease in the value of the efficiency factor and, at the same time, an increase in the pulsation frequency with an increase in the dose (it was assumed that the efficiency factor η is the ratio of pressure amplitude to the dose, and the dose is the ratio of fuel mass flow rate to frequency, i.e., the mass of fuel per cycle [31]).
Regardless of the type and application of the chamber, two basic acoustic models of pulsating combustion chambers can be found in the analysed literature:
  • The occurrence of one-fourth of the standing wave along the length of the entire engine [23];
  • The Helmhotz resonator [44].
According to both theories, the pulsating combustion chamber is able to work optimally only at one frequency of pulses—the so-called resonant frequency. This frequency depends on the model used and is written as follows:
  f 1 4 = c 4 · L e n g
  f H = c 2 π S w l V k s · L w l
where
  • f 1 / 4 is the frequency assuming ¼ standing wave along the length of the entire engine;
  • f H is the operating frequency of the Helmholtz resonator;
  • c is the speed of sound;
  • L e n g is the engine length;
  • S w l is the inlet–outlet cross-sectional area;
  • L w l is the length of the inlet–outlet pipe;
  • V k s is the combustion chamber volume.
The common feature of both theories is the fact that the frequency of pulsations is a linear function of the speed of sound. In both cases, the frequency is directly proportional to the speed of sound. On the other hand, the speed of sound increases with the increase in the average temperature in the engine sections. Therefore, in the case of supplying a combustion chamber of constant dimensions with a fixed dose of fuel, the increase in frequency should be caused only by the increase in temperature. In the case of a constant dose, this is only possible if the efficiency of the combustion process is increased. This conclusion is not confirmed by the results of the tests presented in Figure 5. Analysing these results, it can be concluded that in the case of a constant dose, the increase in efficiency is accompanied by a decrease in frequency in most of the obtained results; for example, for a dose of qv ≈ 10 mg/cycle, an increase in the efficiency factor in the range from 0.43 to 0.97 corresponds to a frequency drop in the range from 109 Hz to 96 Hz, respectively.
According to the authors of the publication [30], the analytical assessment of the operating frequency of the pulsating combustion chamber may be very inaccurate. This is mainly due to the fact that high-temperature gradients appear inside the exhaust duct of this device. In consequence, estimating a single average temperature of the working medium is the main source of errors. As a result, the same combustion chamber, depending on the author of the publication, may be included as a “representative” of various acoustic models. In conclusion, it can be assumed that the use of popular acoustic relationships for estimating the frequency of operation for a pulsed engine is not adequate for the actual principle of its operation and the pulsating combustion chamber should not be treated strictly as an acoustic device.

4. Numerical Research

According to the authors, the pulsating operation of the combustion chamber is the result of repetitive thermal explosions that occur inside the chamber. Therefore, it seems logical that it is the explosion parameters that should largely determine the frequency of the repetition of work cycles. In order to obtain additional information about the course of this process, numerical simulations were carried out. The simulated device was identical to the one from the experiment and publication [31]. The results of numerical simulations were confronted with the results of experimental research. Due to the significant computational cost and long calculation time, simulations were carried out only for selected, according to the authors, key configurations of the tested combustion chamber settings:
(a)
For JET2 and JET3 swirl injectors placed at L = 125 mm;
(b)
For the FC120-1 injector at an angle of 90° to the longitudinal axis of the engine, on L = 255 mm where
m ˙ f u e l = 1 g / s
m ˙ f u e l = 1.2 g / s ;
(c)
For FC70-1, FC70-2 injectors located at L = 260 mm.
The main purpose of the comparative analysis of the results obtained for the above-mentioned configurations is primarily to better determine the impact of fuel injection parameters on the efficiency factor.
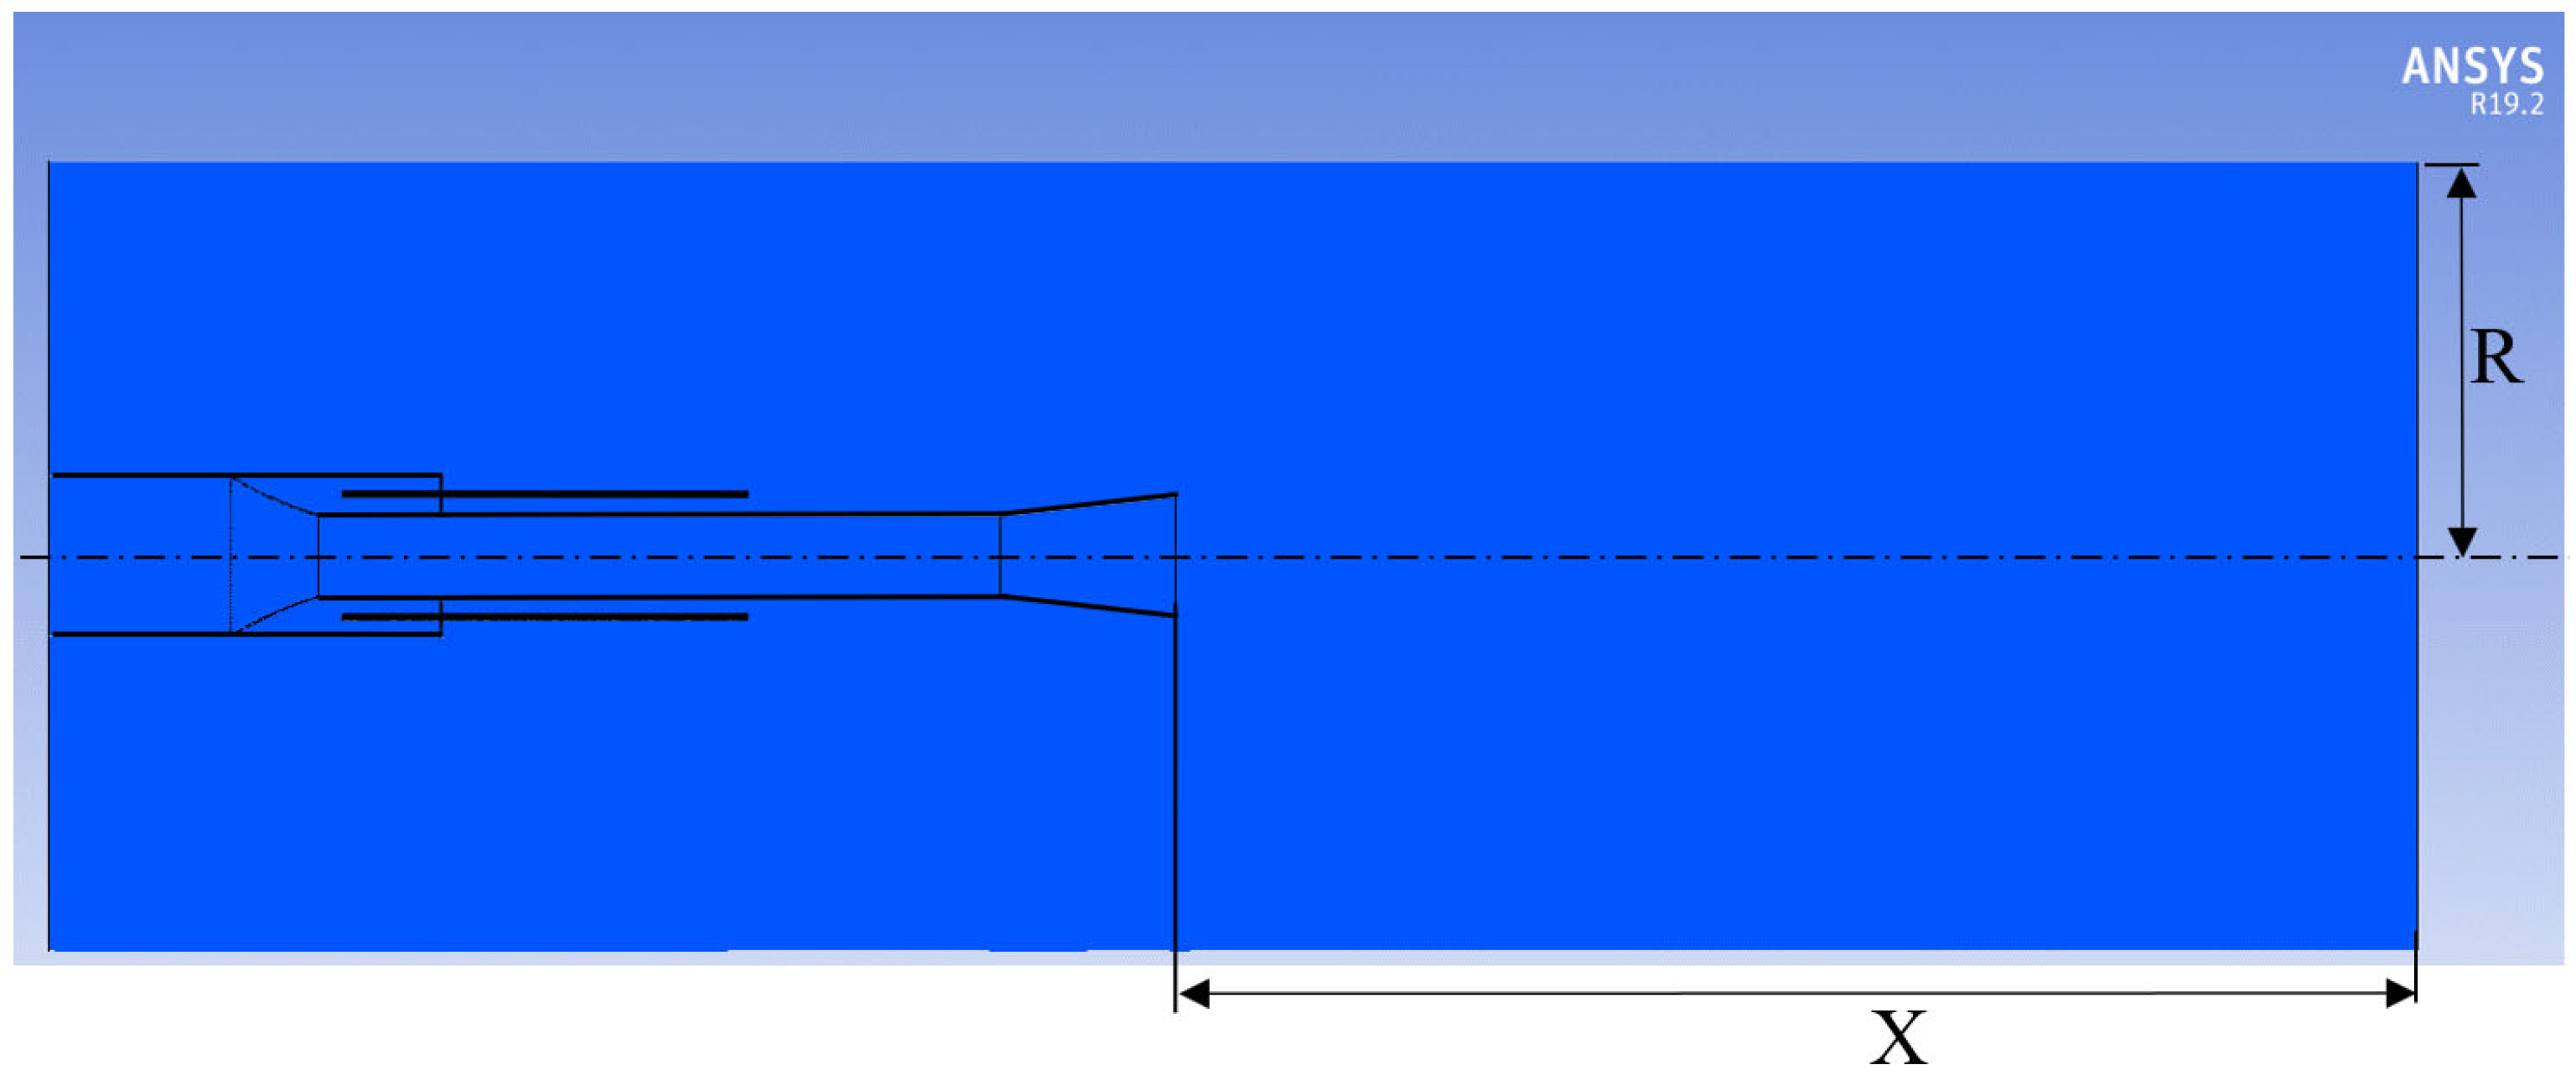
Numerical studies were carried out in the “Ansys Fluent 19.2” environment. Finally, the computational domain had the shape of a cylinder with the following dimensions (Figure 6):
  • X = 1600 mm, which is 10 maximum diameters of the outlet diffuser;
  • R = 500 mm, which is 5 radii of the combustion chamber.
The computational domain, regardless of the fuel supply configuration, is divided into approximately 4,800,000 finite volumes. The “poly–hexcore” mesh was also made in the Fluent environment. Despite a significant increase in the number of mesh elements, it was decided to simulate the full computational domain. This was due to two reasons:
  • The dynamic nature of the stochastic phenomena occurring in the combustion chamber makes the actual flow through it asymmetric. In such cases, the use of symmetry may lead to erroneous results or even to the lack of pulsation; although during the experimental tests, the chamber worked in a given configuration.
  • In the vicinity of the planes, the mesh is filled with pentagonal elements. The transitions from these elements to hexagonal elements are a source of low-quality volume, which can distort the flow field inside the tested combustor. In addition, control over the size and quality of these elements is very limited. The use of the plane of symmetry passing through the centre of the combustion chamber forces the use of these elements in places that are particularly important from the point of view of calculations.
In the vast majority of the analysed publications [34,37,45,46], the authors decided on the k-ε turbulence model. The choice is motivated by the fact that it is a well-proven model, constituting a compromise between the demand for computing power and the results achieved. In [32], the authors decided to use the “k-ω SST” turbulence model. The choice is justified by the fact that, according to the description [47], the group of k-ω turbulence models should be used when strong vortex structures, pressure gradients and flow separation are expected in the flow. In addition, in the equations of the “k-ω SST” model, correction terms limiting the overproduction of turbulence kinetic energy in the areas of strong pressure gradients were introduced. Taking into account the dynamic nature of combustion phenomena and the rapid changes in the flow direction in the pulsating combustion chamber, the authors of the current paper chose the k-ω SST model.
For the sake of a pulsation frequency of 100 Hz, the fuel oxidation process takes place in very rapidly changing conditions. In this case, it can be assumed that the entire combustion process is determined primarily by the speed and quality of mixing fuel and air. In such conditions, a relatively good “combustion model” seems to be the “Eddy dissipation” model, in which the combustion rate is determined by the mixing rate. In this model, a chemical reaction with the release of heat takes place if there is a fuel and an oxidant in the area and there is turbulence ((k⁄ε) > 0). The occurrence of the reaction is conditioned by exceeding the activation energy [47]. The disadvantage of this model is the inability to use the complex mechanisms of chain reactions. This simplification does not seem to have much influence on the solution in the case of a pulsating combustion chamber.
When discussing the combustion model, it should be borne in mind that for turbulence models of the URANS type, used with relatively sparse computational grids, it is not possible to observe the flame development. For the discussed models, the program assumes that a chemical reaction takes place in a given computational cell if the appropriate conditions are met. In the case of the combustion reaction, the conversion of the energy contained in the fuel into heat is additionally taken into account. Therefore, by running simulations with these settings, it is possible to observe the movement of an exothermic chemical reaction, rather than a very thin and undulating flame front.
The boundary conditions of the relevant computational domain are shown in Figure 7. In all simulations, it was assumed that the combustion chamber walls were adiabatic. For fuel injectors, a mass flow inlet boundary condition was applied. This assumption is justified by the fact that the processes inside the chamber are relatively short and only 4–15 engine cycles are simulated. This also allows you to significantly speed up calculations. Nonetheless, one simulation takes from 7 to 14 days when performed on a machine with a 32-core processor with a 3.5 GHz speed and 128 GB of RAM.
For each calculation, a time step of 25 µs was set. For all spatial discretization schemes, a second-order upwind method was used, except for the gradient—where least squares cell-based method was applied.
A mesh independence study was conducted for the FC70-2 injector placed at L = 260 mm because the highest thrust and pressure amplitudes in the combustion chamber were achieved in this configuration. For this purpose, the mesh size was increased to approximately 7,200,000 elements. This change did not significantly affect the values of pressure in the combustion chamber, thrust and temperature. However, a decrease in the value of the y+ parameter was achieved, and the computation time almost doubled (see Table 1).
Due to the significant extension of the calculation time and the insignificant change in the calculated engine operating parameters, it was decided to continue the calculations with a mesh with a smaller number of elements. This approach is also supported by the fact that the obtained values of the basic operating parameters of the chamber are similar to those obtained during the tests, despite the higher value of the CFL number. This will be justified later in this paper.
The simulation results were verified with the experiment both in terms of quantity and quality. The data selected for comparison is the most reliable and crucial for engine operation. From the authors’ point of view, the data included were as follows:
  • Amplitude of pressure pulsation inside the combustion chamber;
  • Pulsation frequency;
  • Thrust.
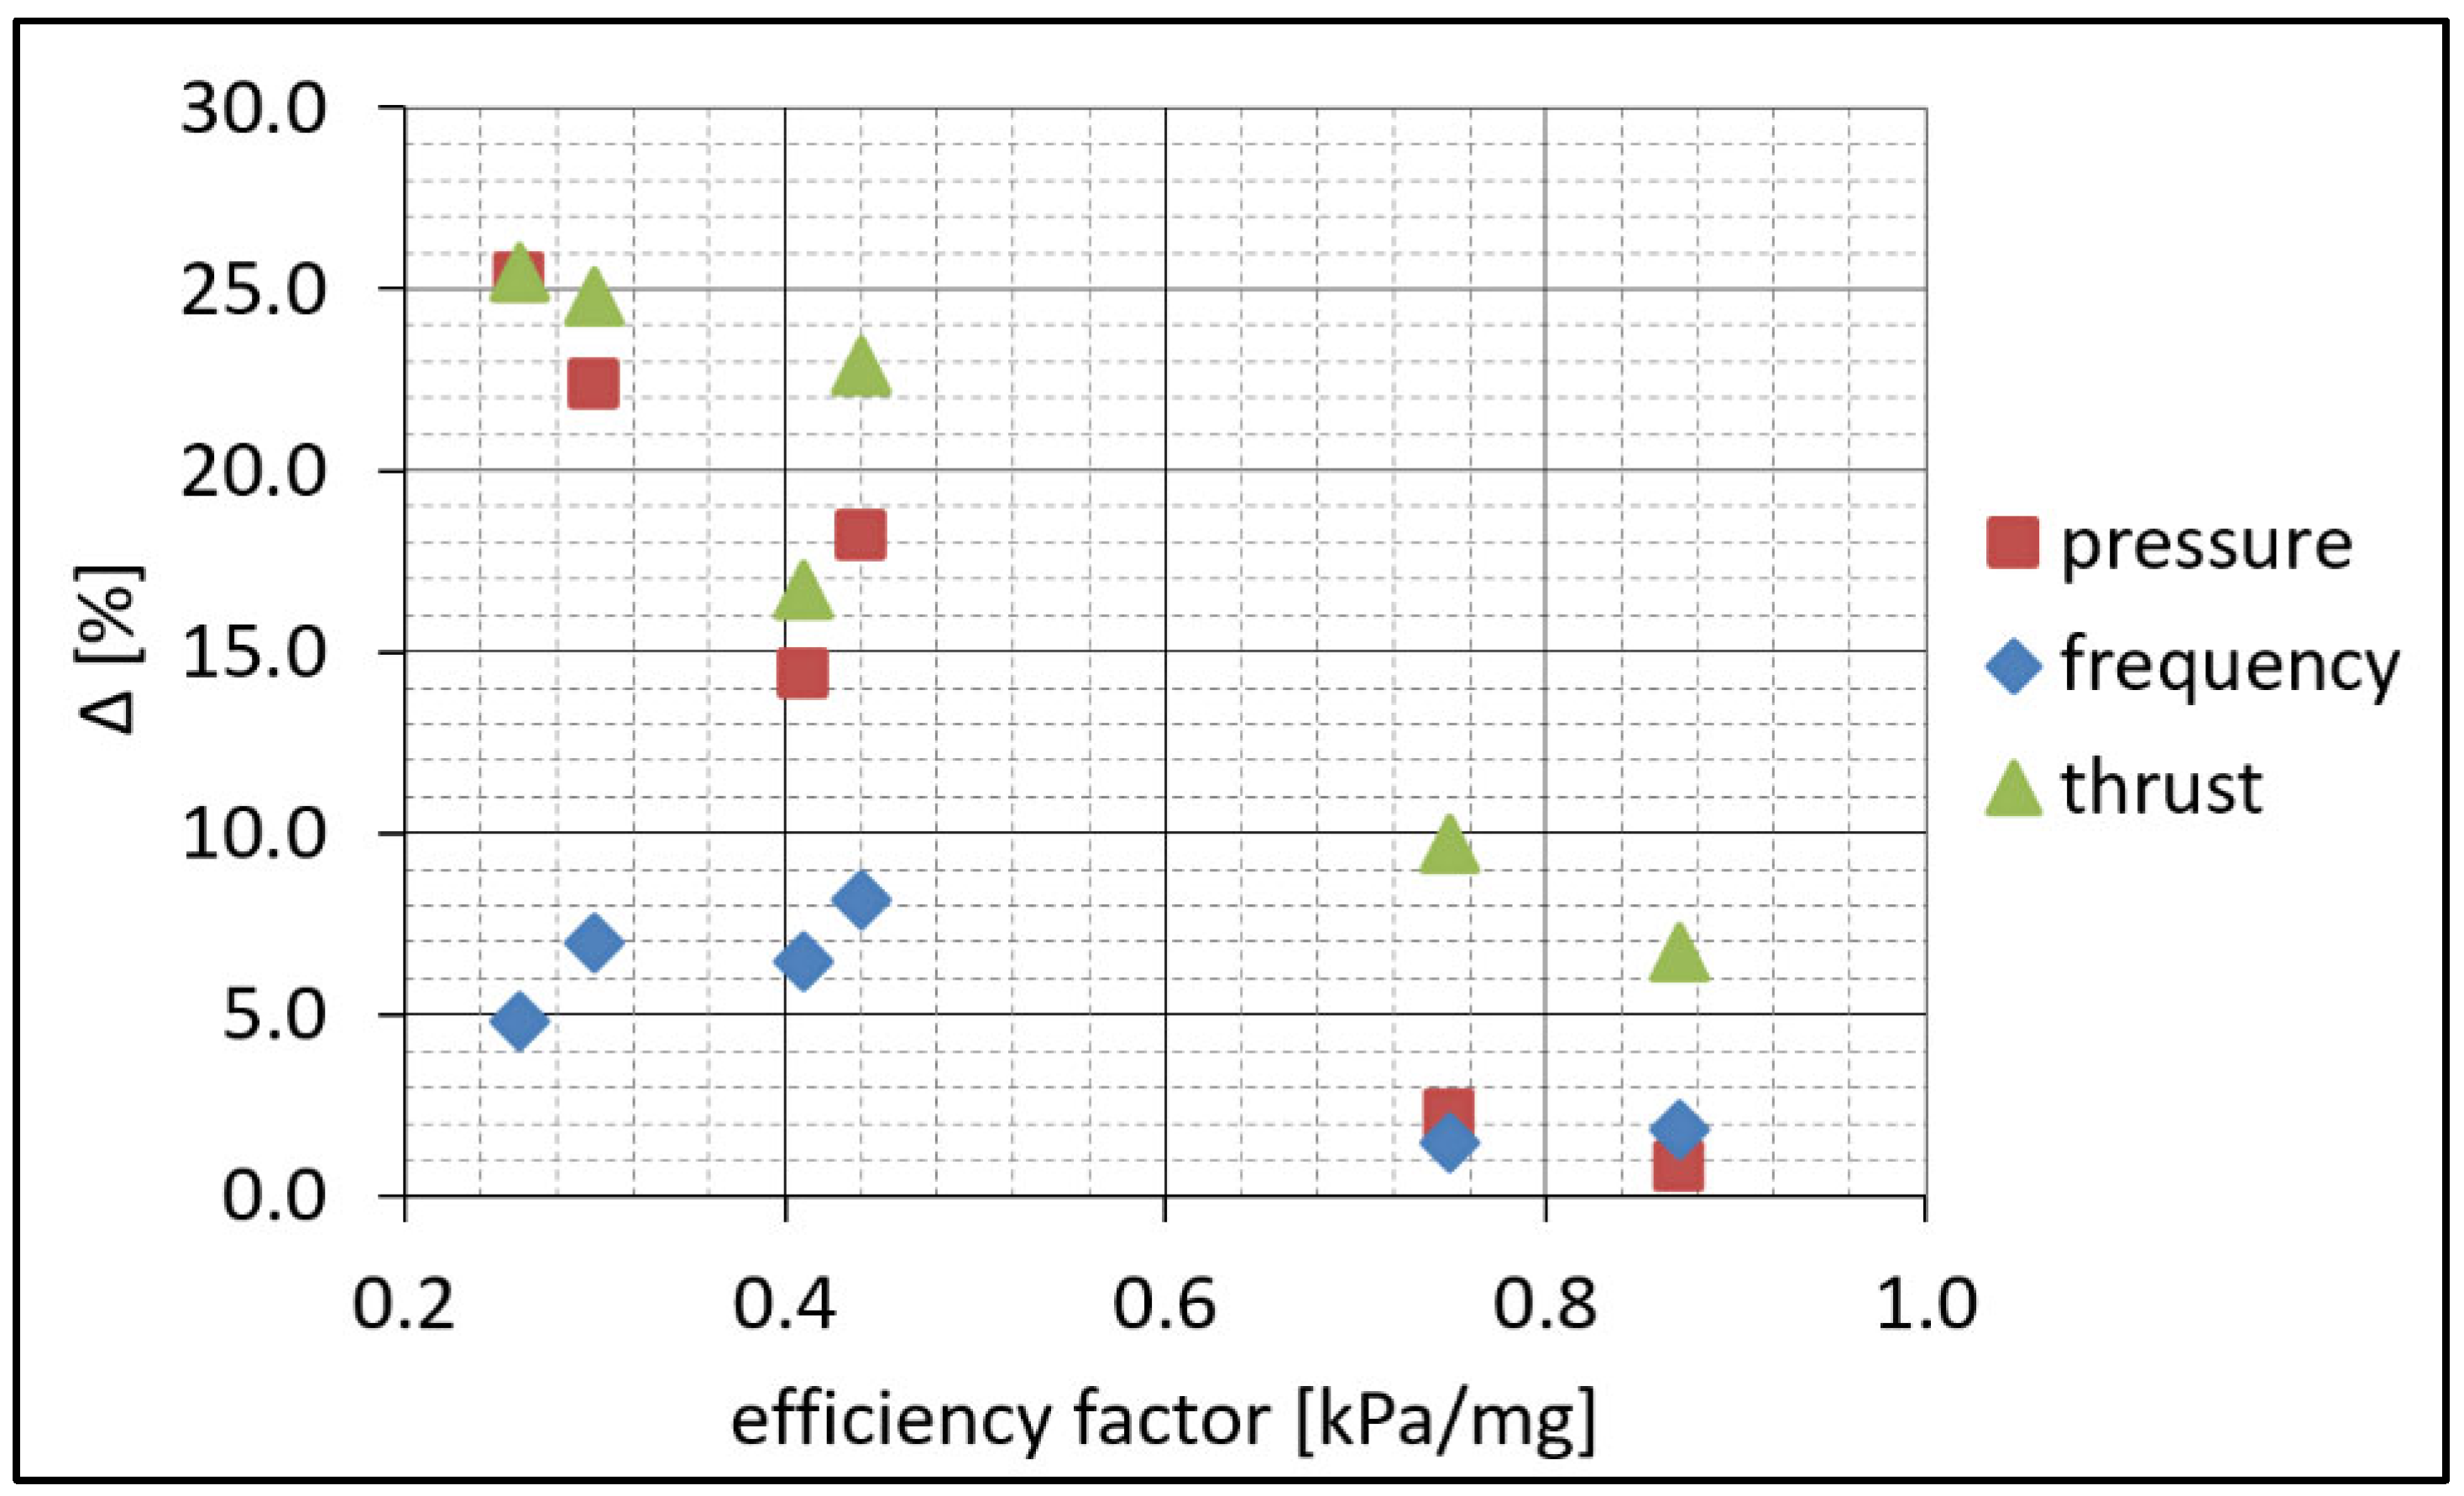
A summary of the percentage deviations of the simulation results from the experimental result (∆) is shown in Figure 8. Recognition of which values apply to individual injectors can be made after reading the appropriate efficiency coefficients from Figure 5. The detailed description of each configuration can be found in [31]. It can be seen that with the increase in the efficiency factor, these deviations decrease, regardless of the type of injector. This may indicate that the real processes, with the increase in the efficiency factor, become closer to the ideal ones, which makes them more consistent with the assumed numerical model.
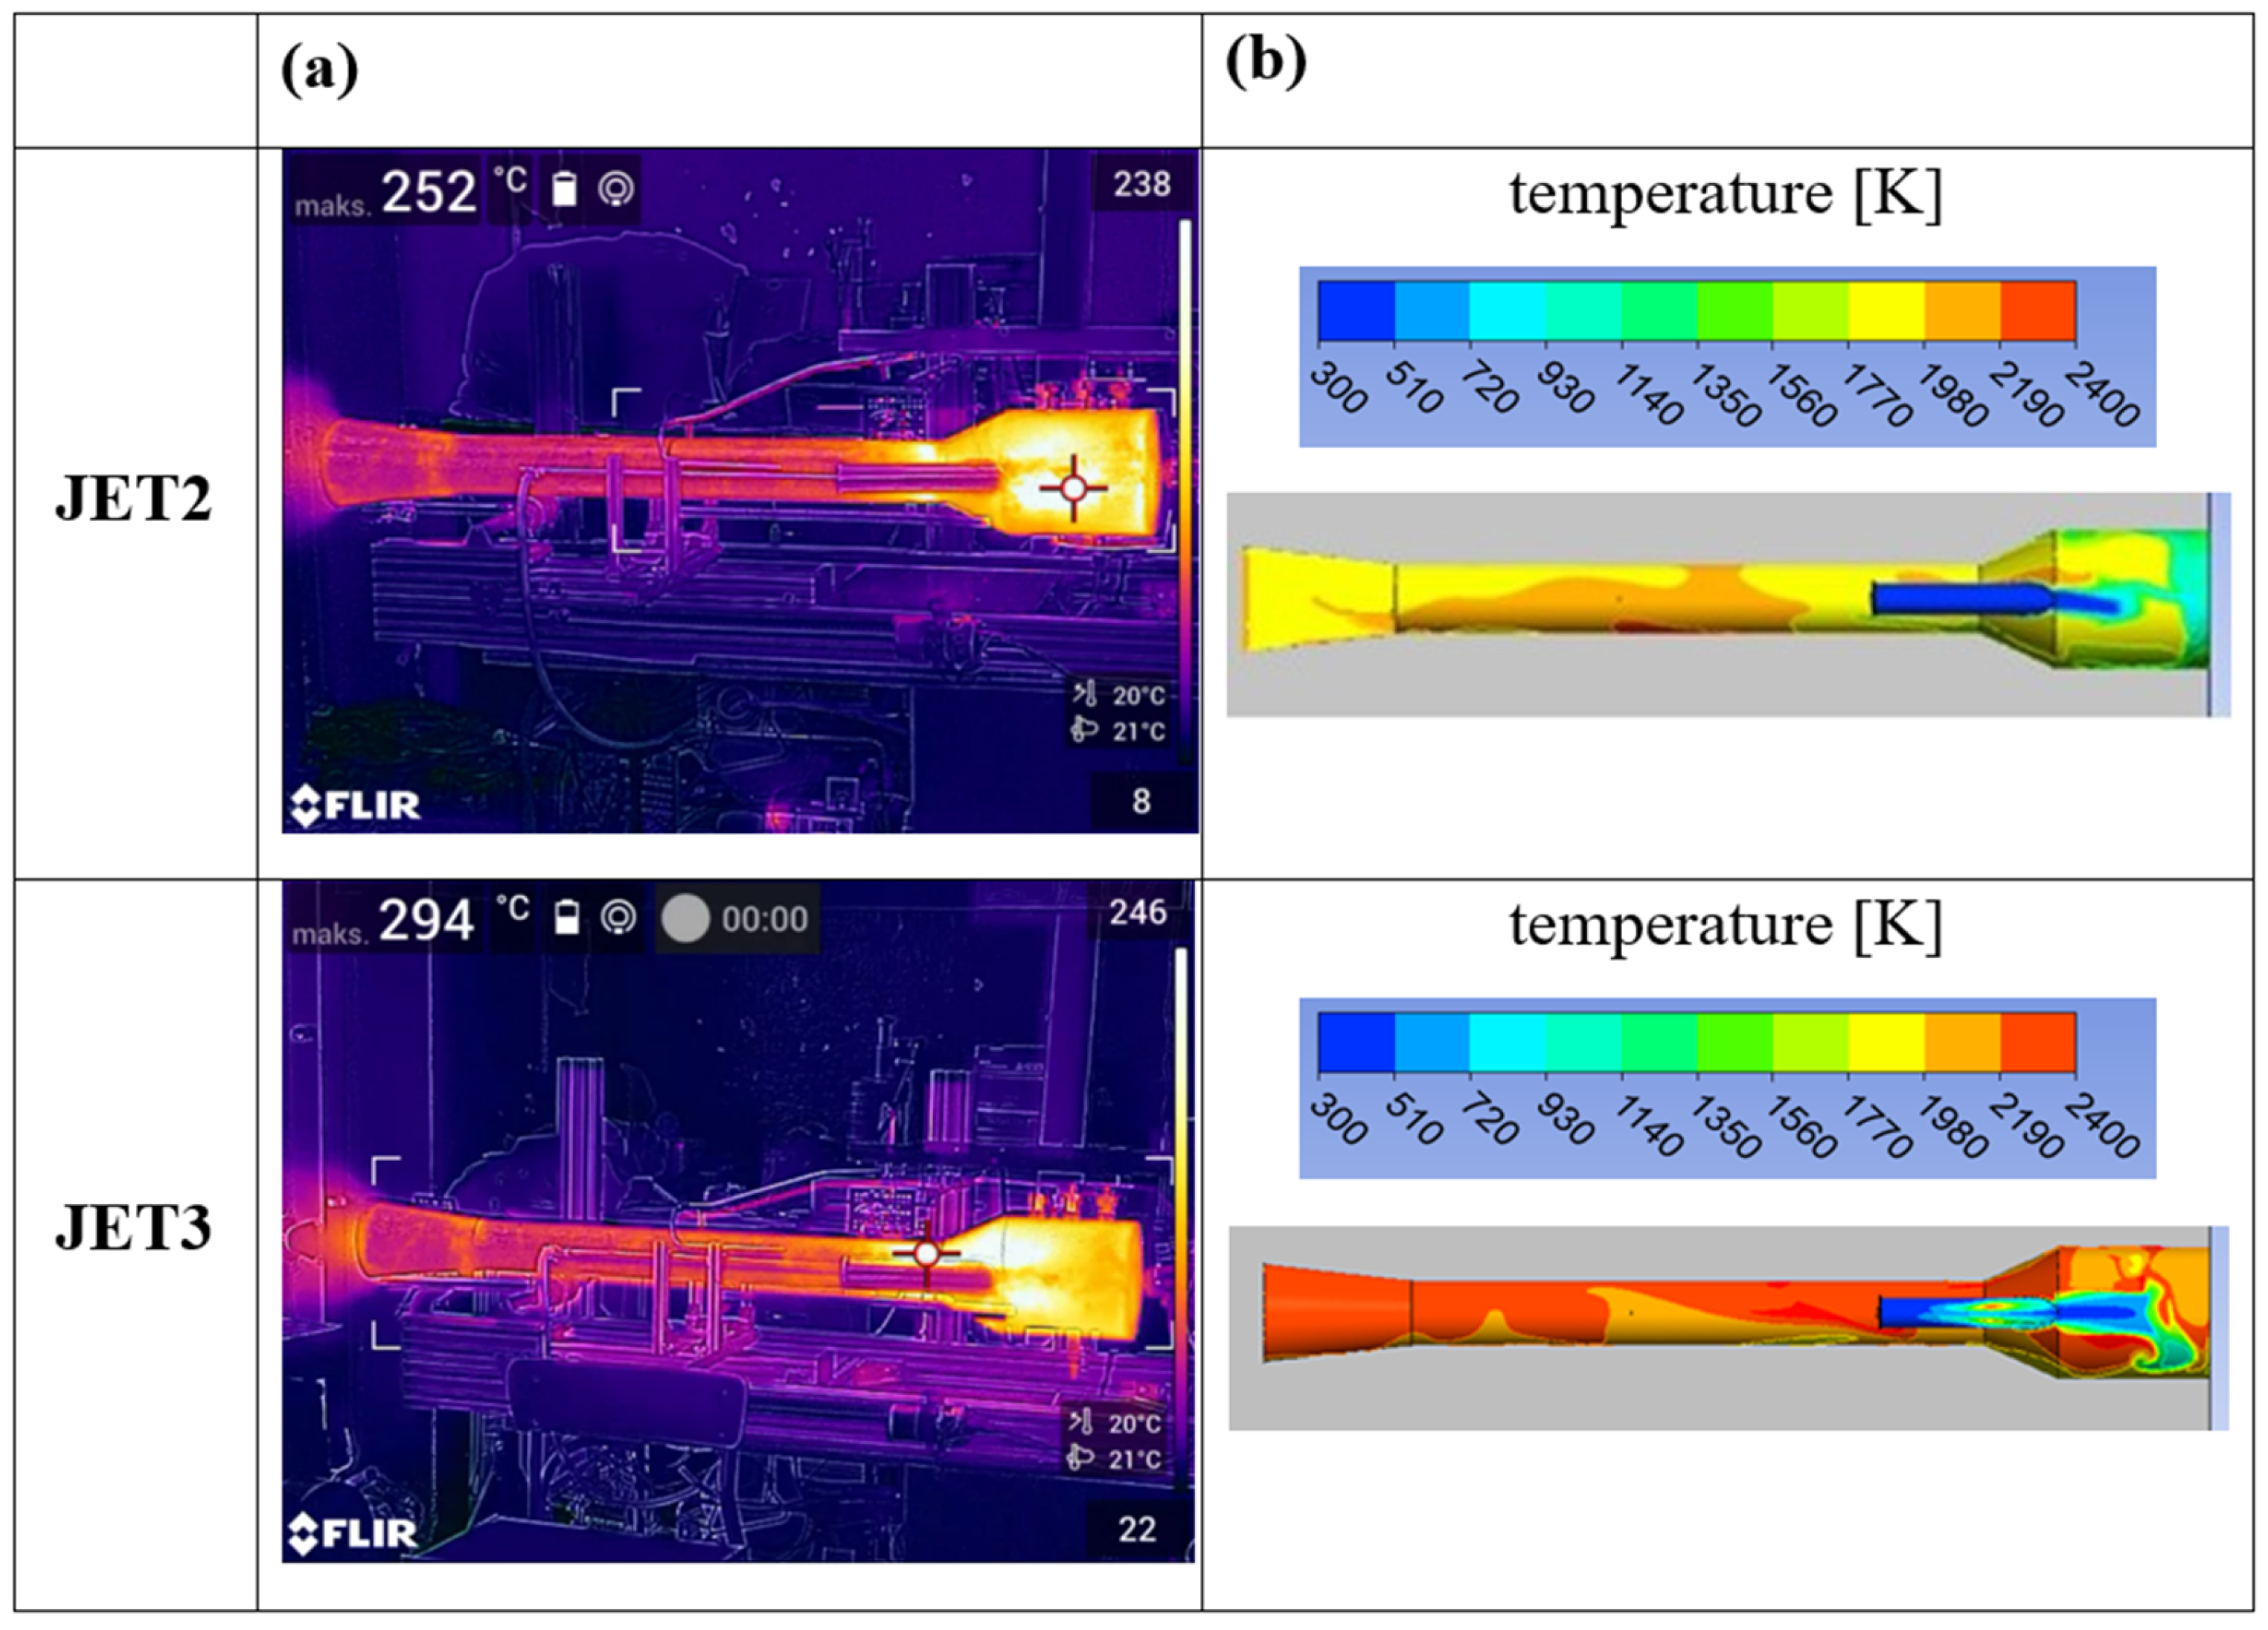
An example of a qualitative comparison of the heating profiles of the chamber walls obtained by means of a numerical simulation with a real thermogram is shown in Figure 9. Comparing the distribution of temperature fields on the walls of the combustion chamber and air inlet, it can be easily seen that they are similar. Based on a quantitative and qualitative comparison, it may be stated that simulation results are accurate enough to allow conclusions about the shape of the process taking place inside the combustion chamber.
The results of numerical experiments were analysed in the context of the time evolution of the combustion zone in terms of shape, size and intensity of turbulence. The area in the combustion chamber, where the ratio of the fuel mass to the mass of the oxidant and possible combustion products is within the flammability limits, was assumed as the combustion zone. According to [48], under normal conditions, the excess air factor λ at the flammability limits of propane gas is 0.4–1.96. This range changes with the change in substrate temperature [9,48,49]. In the case of increasing the flammability limits under the influence of increased temperature, the heat and pressure effect of the reaction is negligible [50]. Therefore, in the conducted analysis, it was decided to assume that the main combustion zones are formed only in places where the excess air factor is within the limits quoted for normal conditions. All quantitative results presented below are average values from several fixed work cycles of the tested pulsating combustion chamber. Unless stated otherwise, the relative parameters presented in the charts have been normalized in relation to the maximum value of a given quantity among all simulated configurations.
The performed numerical calculations confirm the statement that effective combustion occurs in zones where small-scale turbulence dominates (Figure 10).
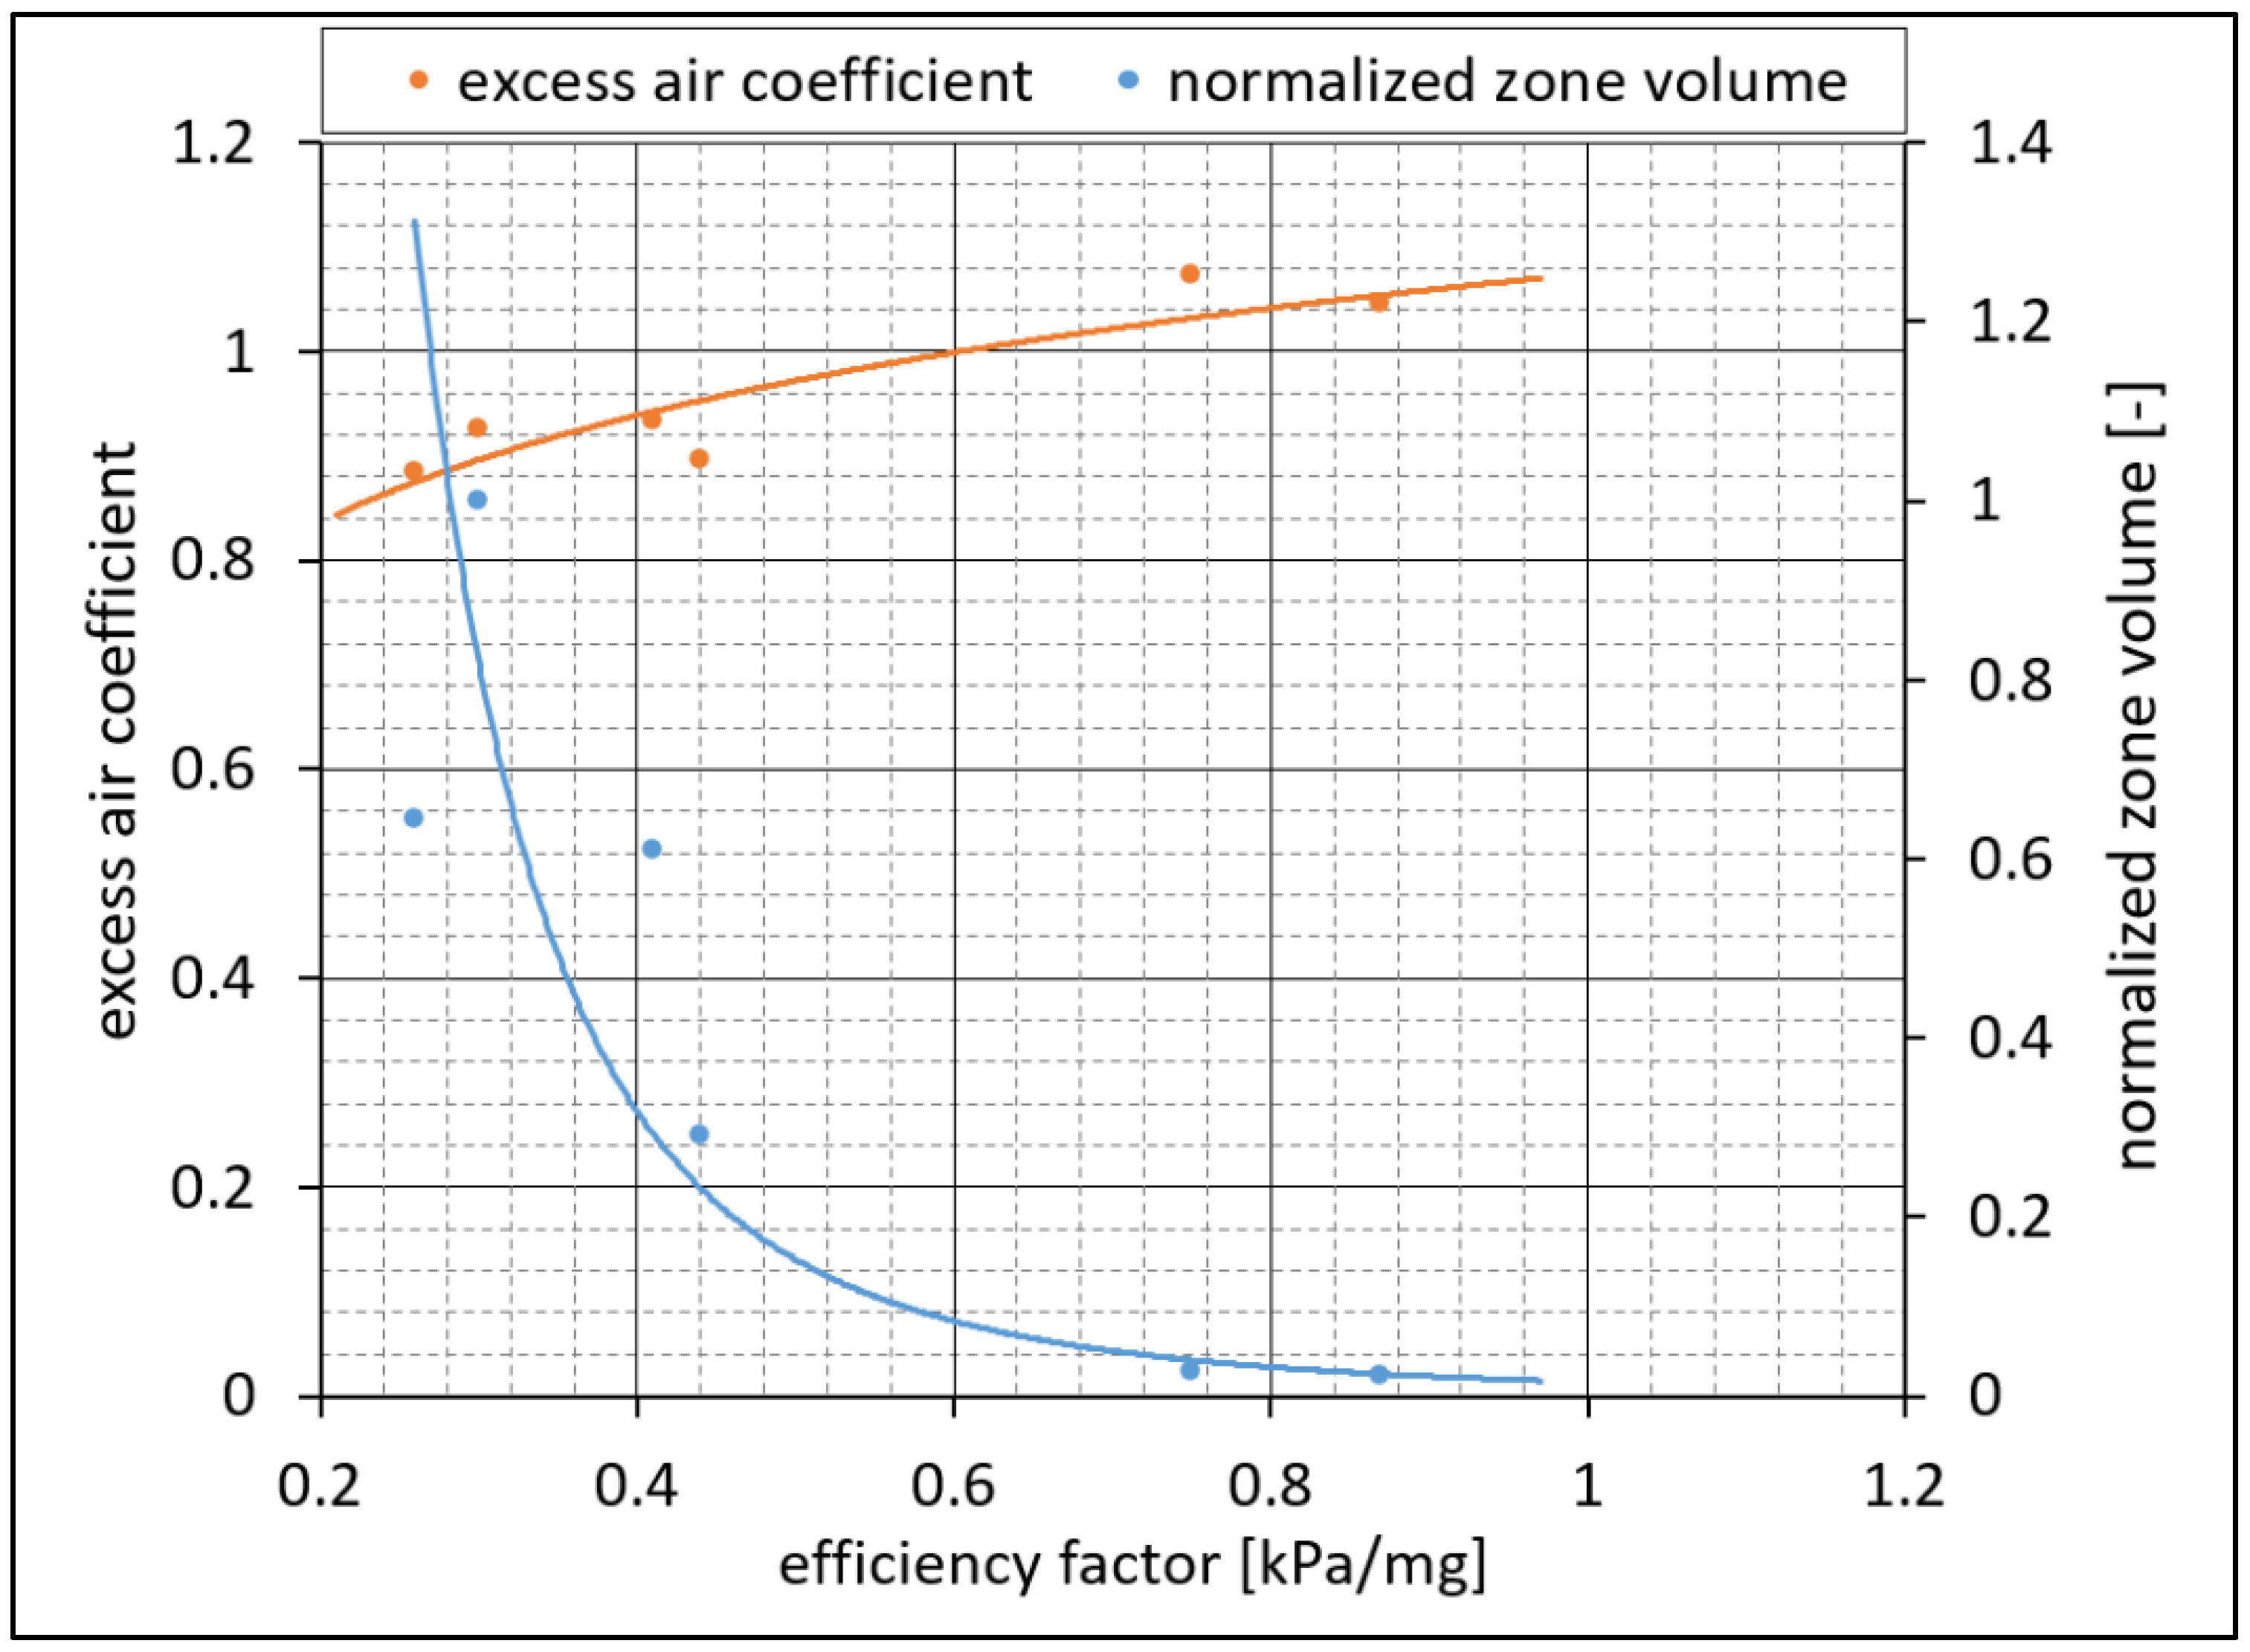
Figure 11 shows changes in the relative average volume of the combustion zone and the excess air factor as a function of the efficiency factor. It is worth noting that the excess air factor in the combustion zone does not change significantly, and the combustible mixture has an approximately stoichiometric composition. The highest efficiency factor values were obtained for slightly depleted combustion zones. It should be added that the volume of the combustion zone is understood as the volume of the area inside the combustion chamber, in which the fuel concentration is within the flammability limits.
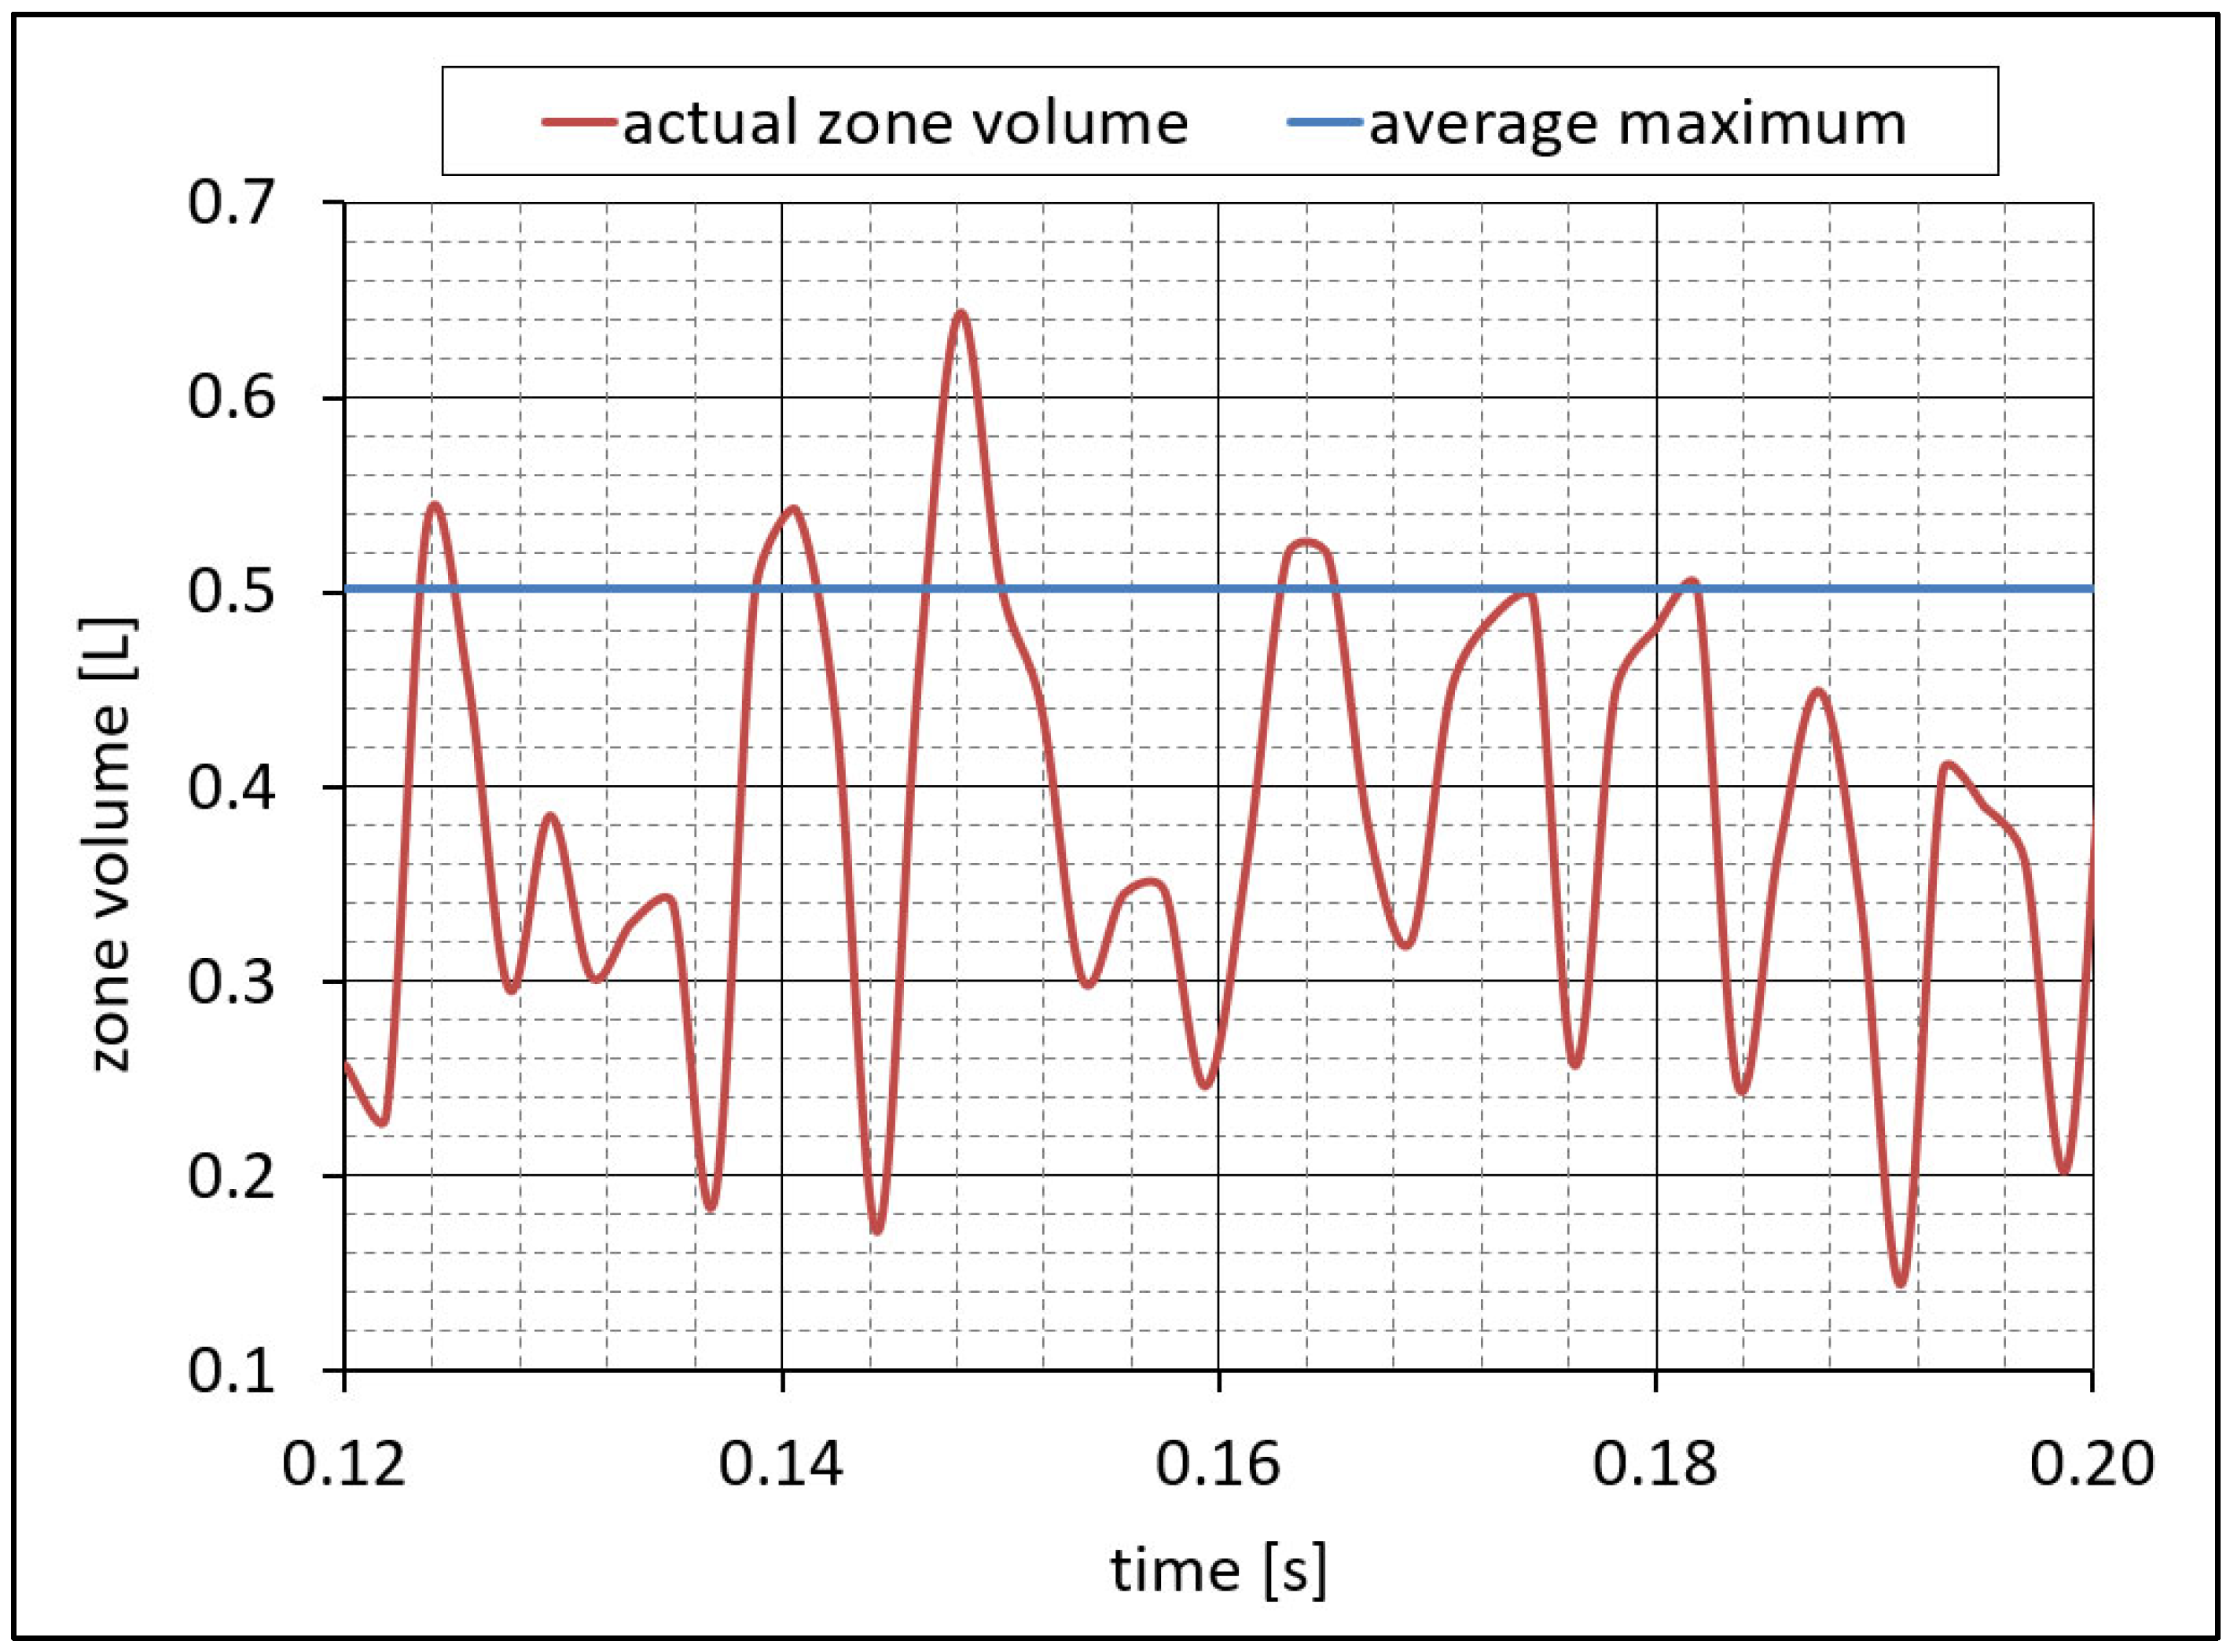
The average maximum size of the combustion zone is considered to be the arithmetic mean of the maximum values of the size of the combustion zone for each cycle (Figure 12).
Unlike continuous combustion devices, in a pulse engine, combustion occurs cyclically, and, therefore, the composition and size of the combustion zone also change cyclically. In most of the numerically tested fuel supply configurations, certain amounts of the combustible mixture remained in the combustion chamber throughout the entire work cycle (Figure 12). The considerations presented earlier show that the high dynamics of changes in the parameters of the combustion zone will be conducive to the efficient operation of the chamber. A dynamic zone is to be understood as a zone whose size changes rapidly relative to its average size. Its dynamics were estimated by the authors of this publication by the rate of change in the volume of the combustion zone. In order to be able to compare the dynamics of the combustion zones of various sizes, the results of the dV/dt derivative were normalized by the average volume of the analysed combustion zone Va. The resulting coefficient can be called the “dynamic coefficient of the change in the volume of the combustion zone” and written by the formula
d V ¯ d t = d V d t V a   1 s
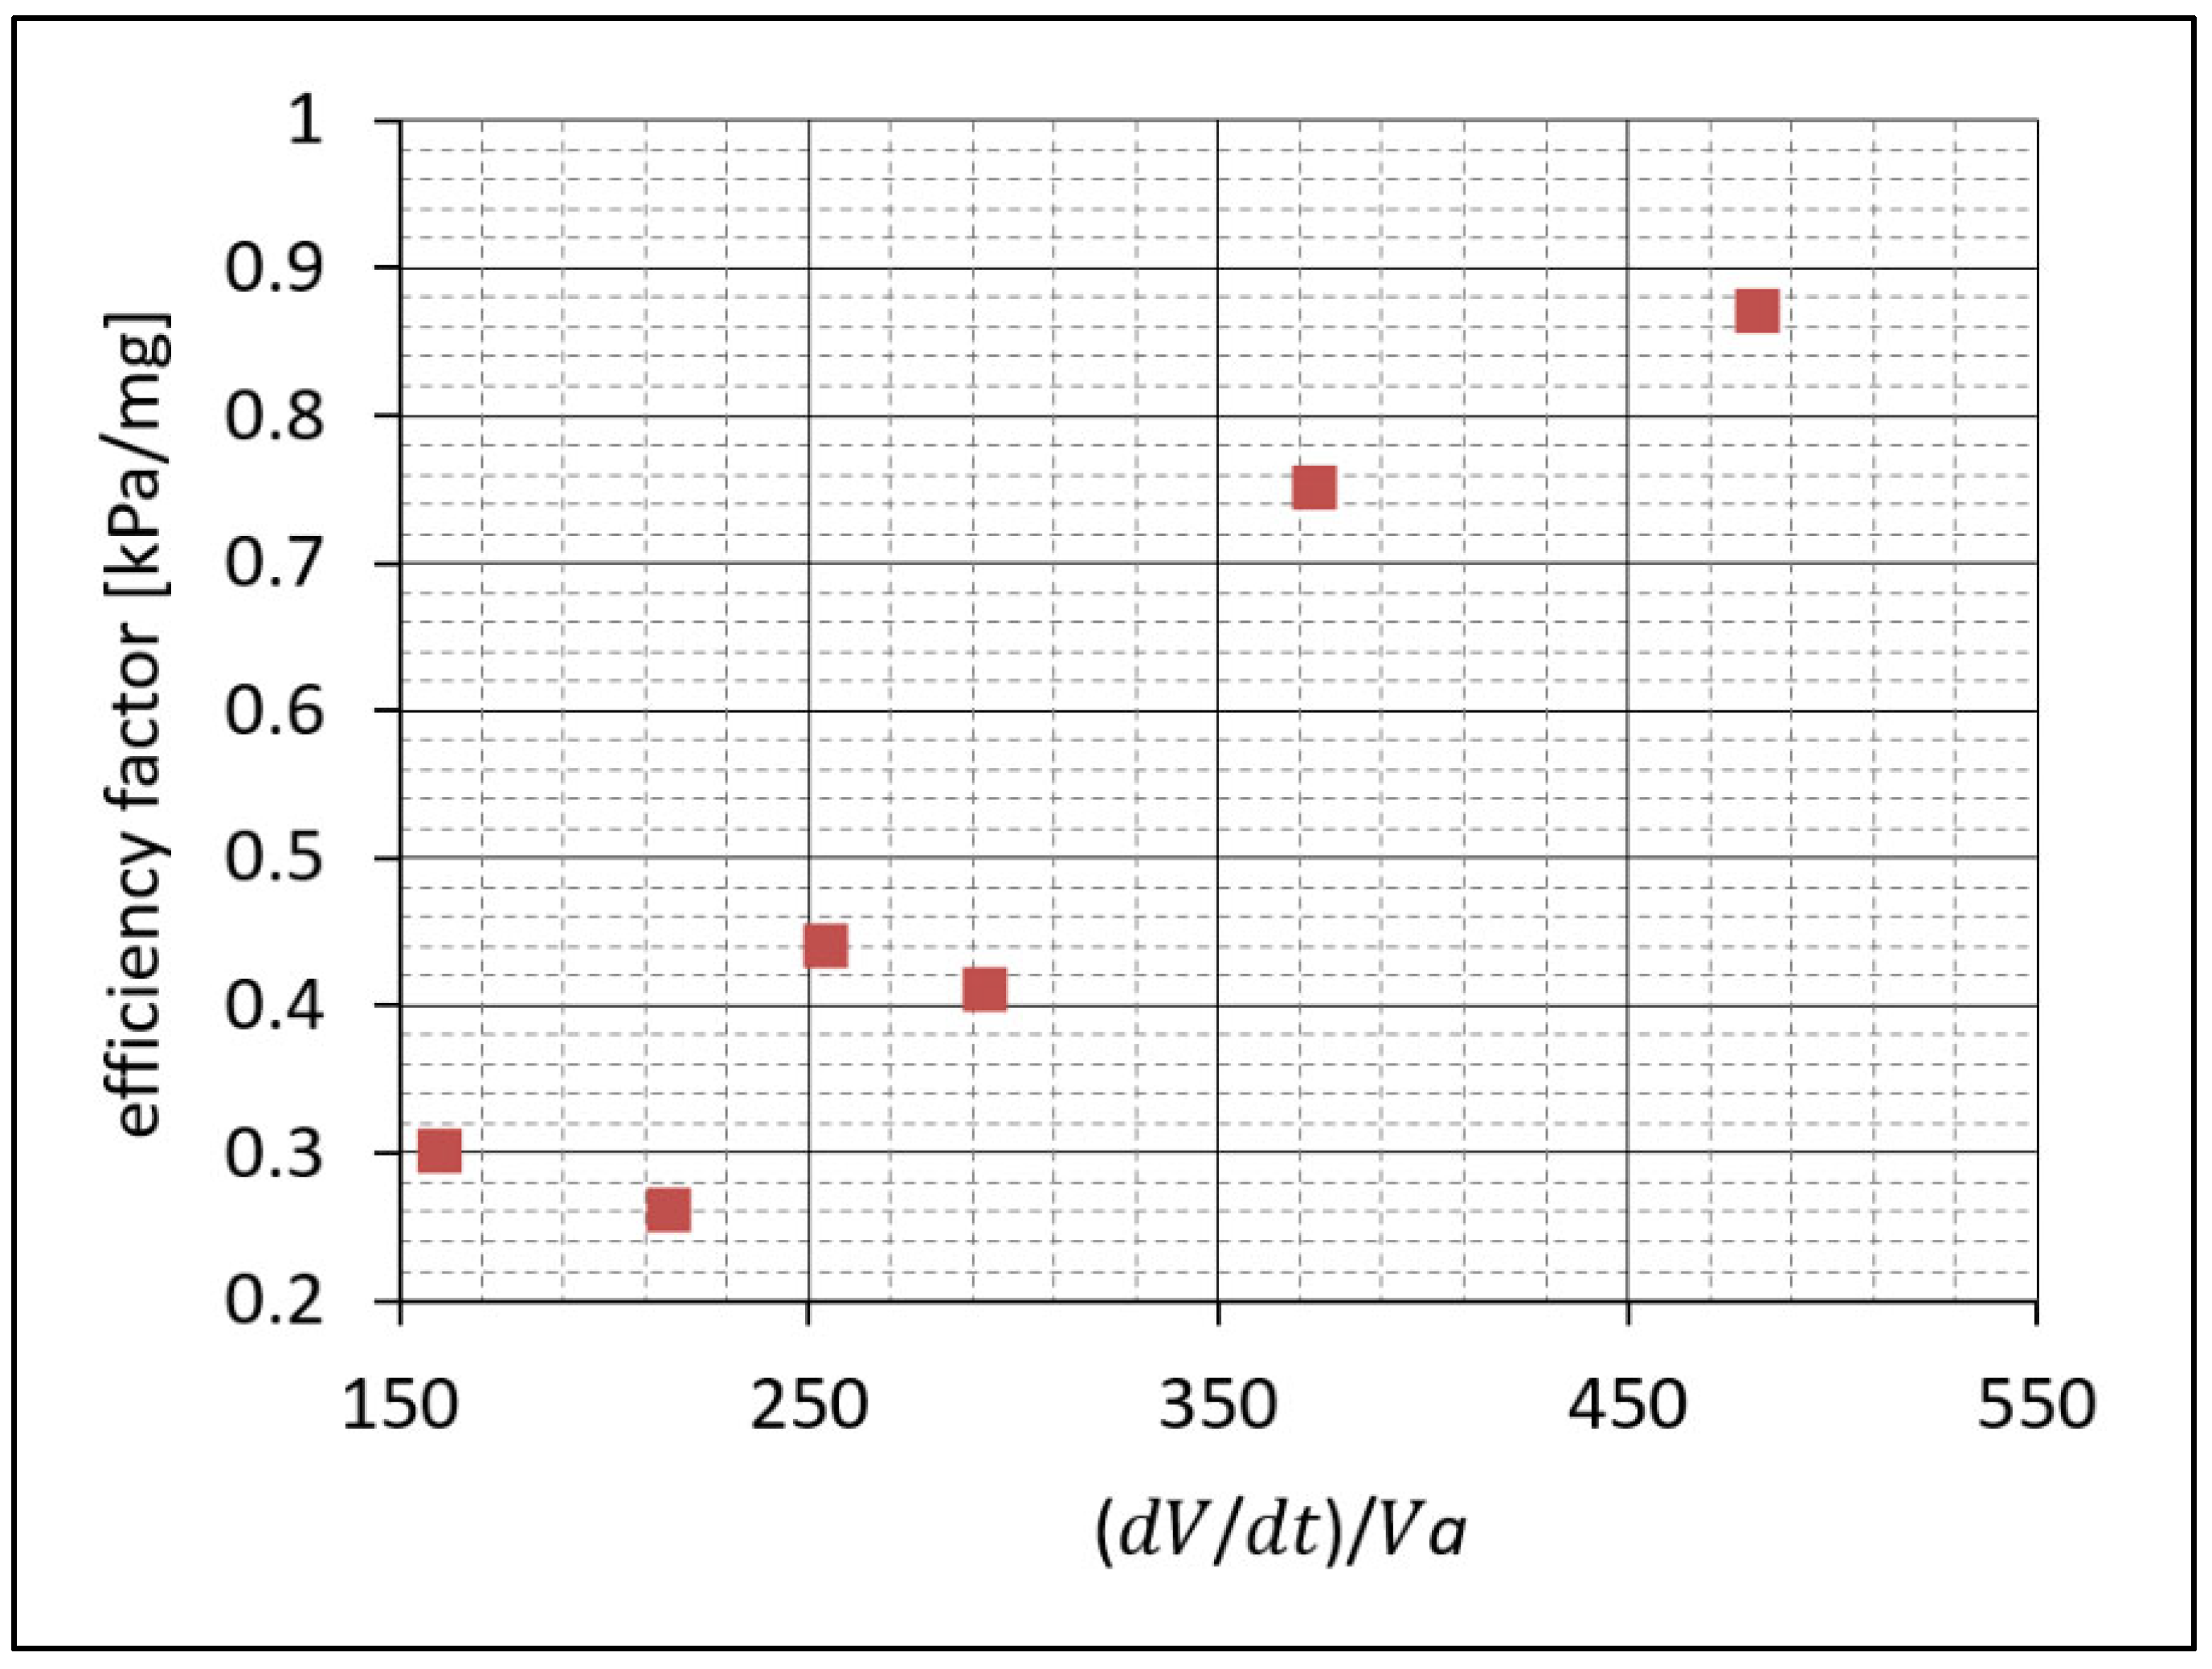
The results of numerical calculations presented in Figure 13 show that the increase in the dynamics coefficient of the change in the volume of the combustion zone in the pulsating combustion chamber causes an increase in the efficiency factor of the combustion process.
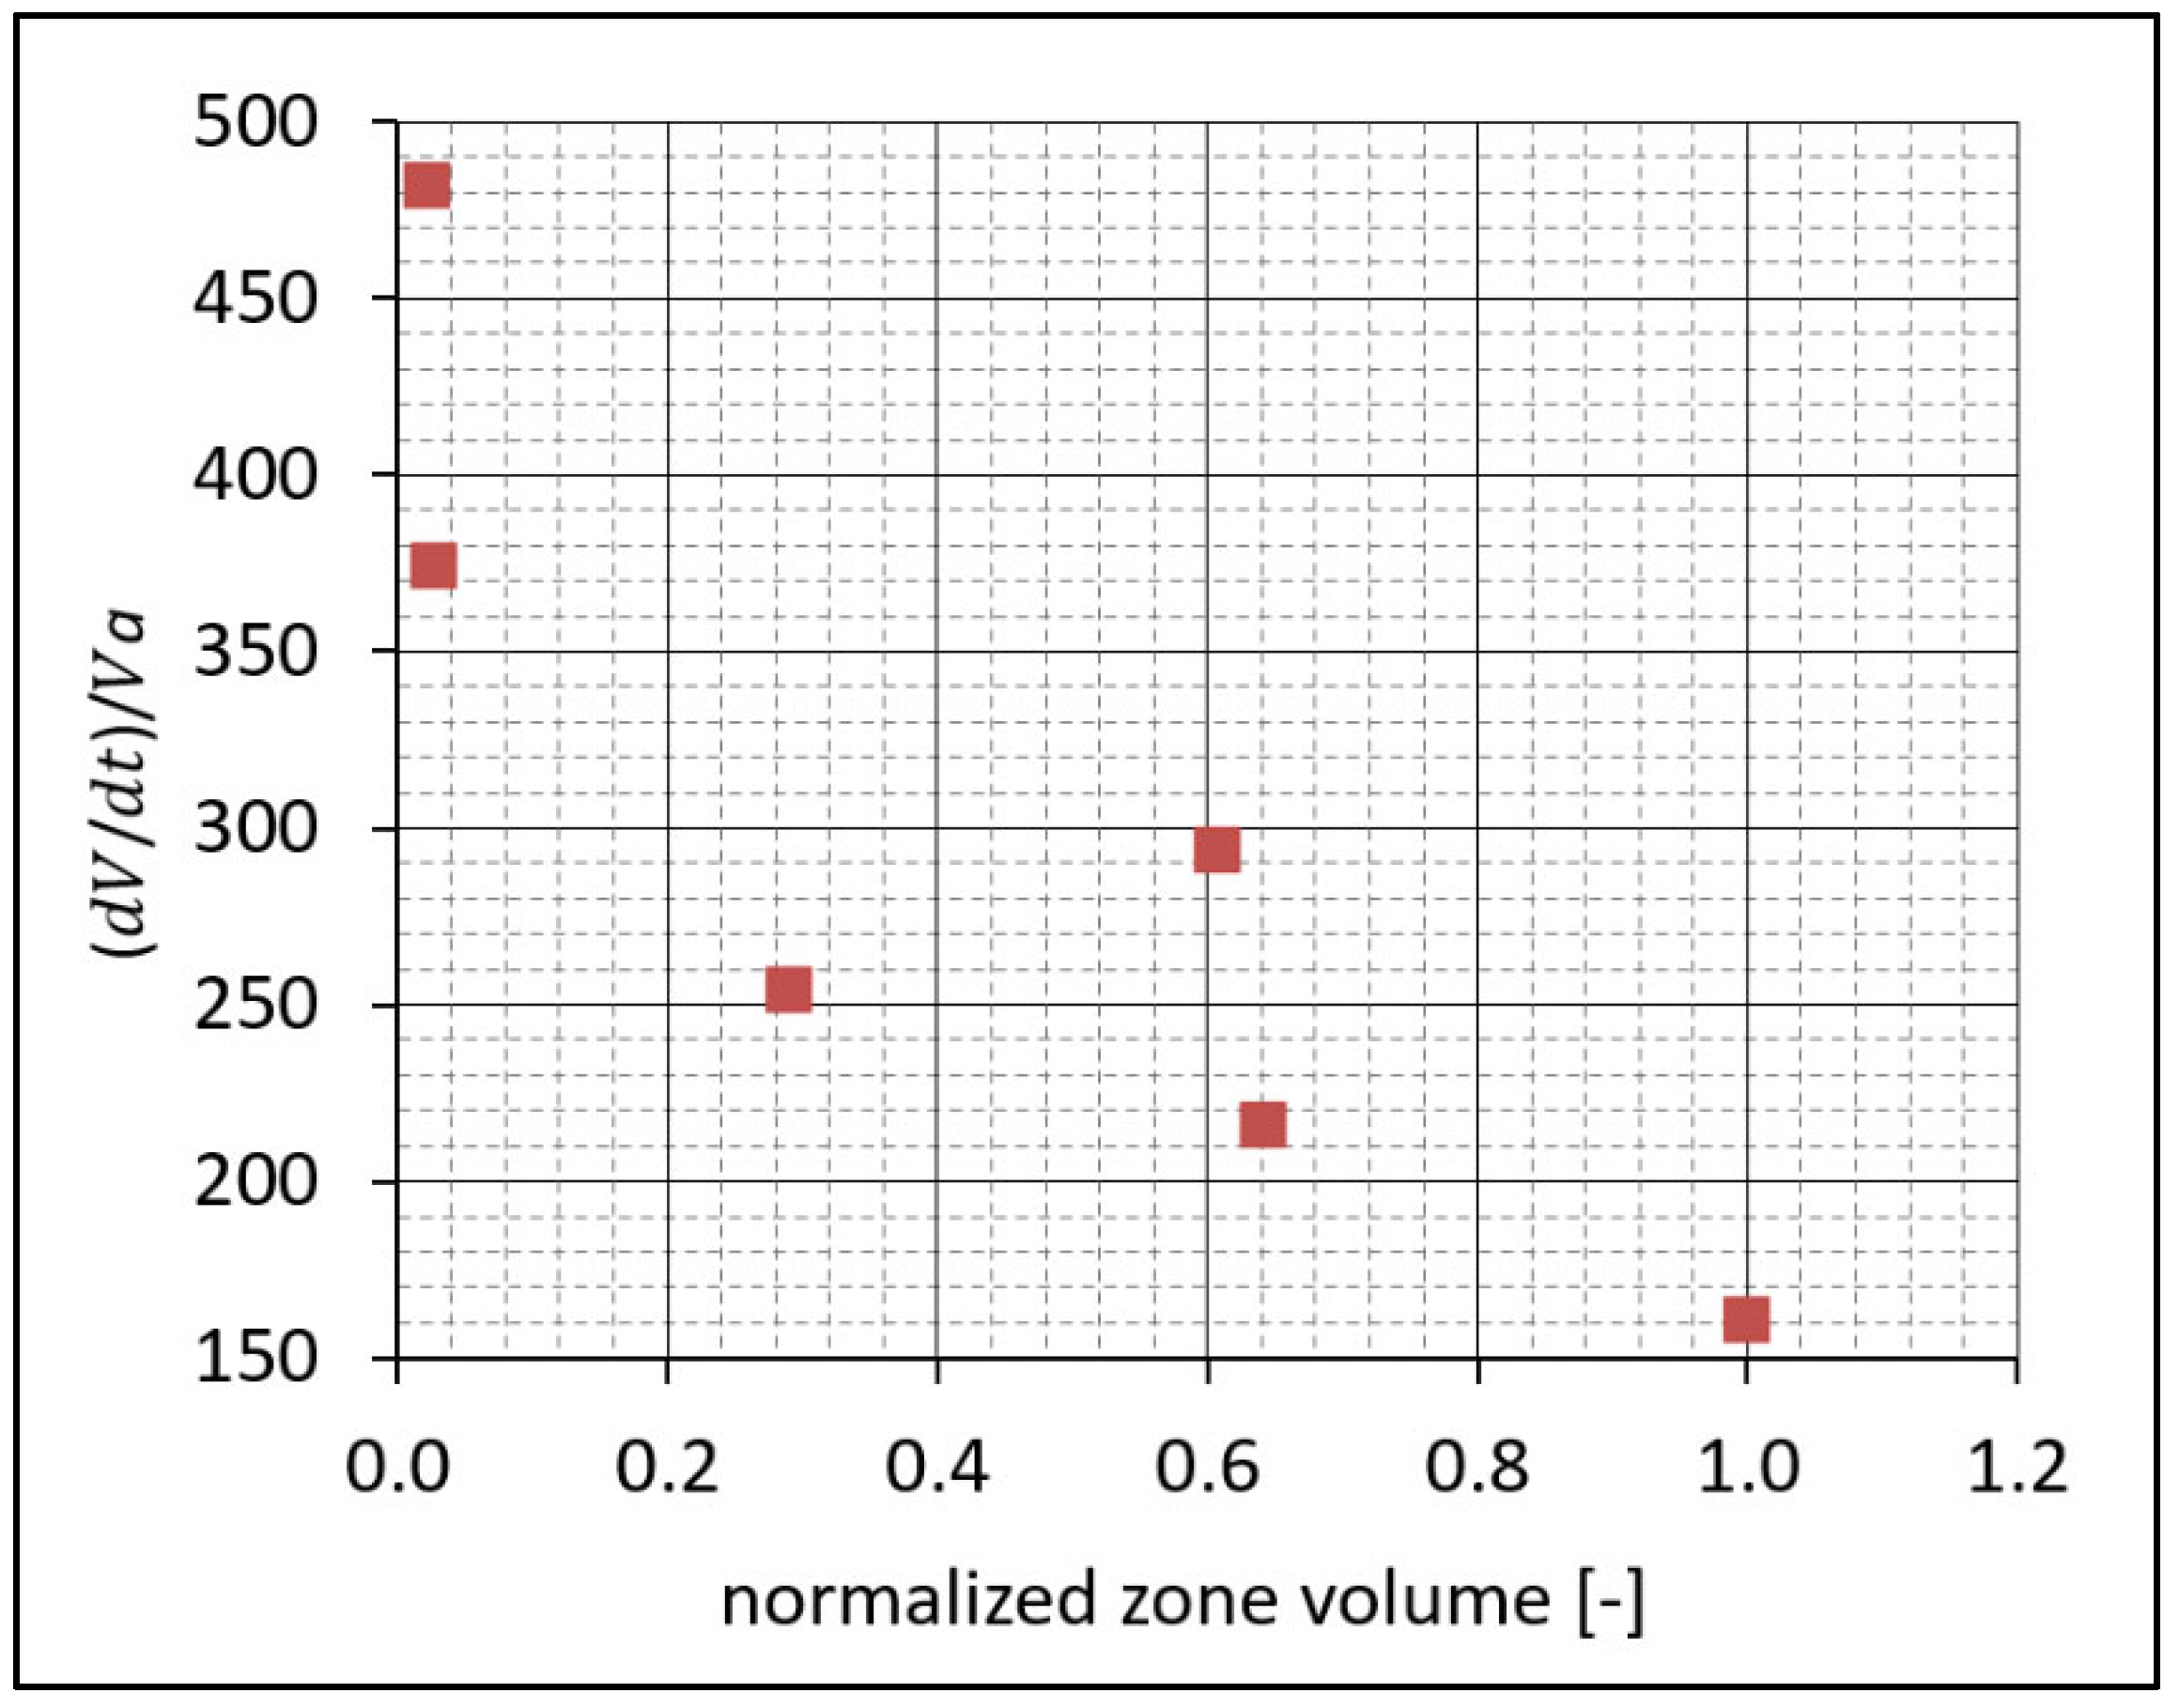
Based on the results of the calculations presented in Figure 14, it can also be concluded that the relative dynamics of the change in the volume of the combustion zone decreases with the increase in the volume of the combustion zone, which at the same time contributes to the decrease in the value of the efficiency factor.
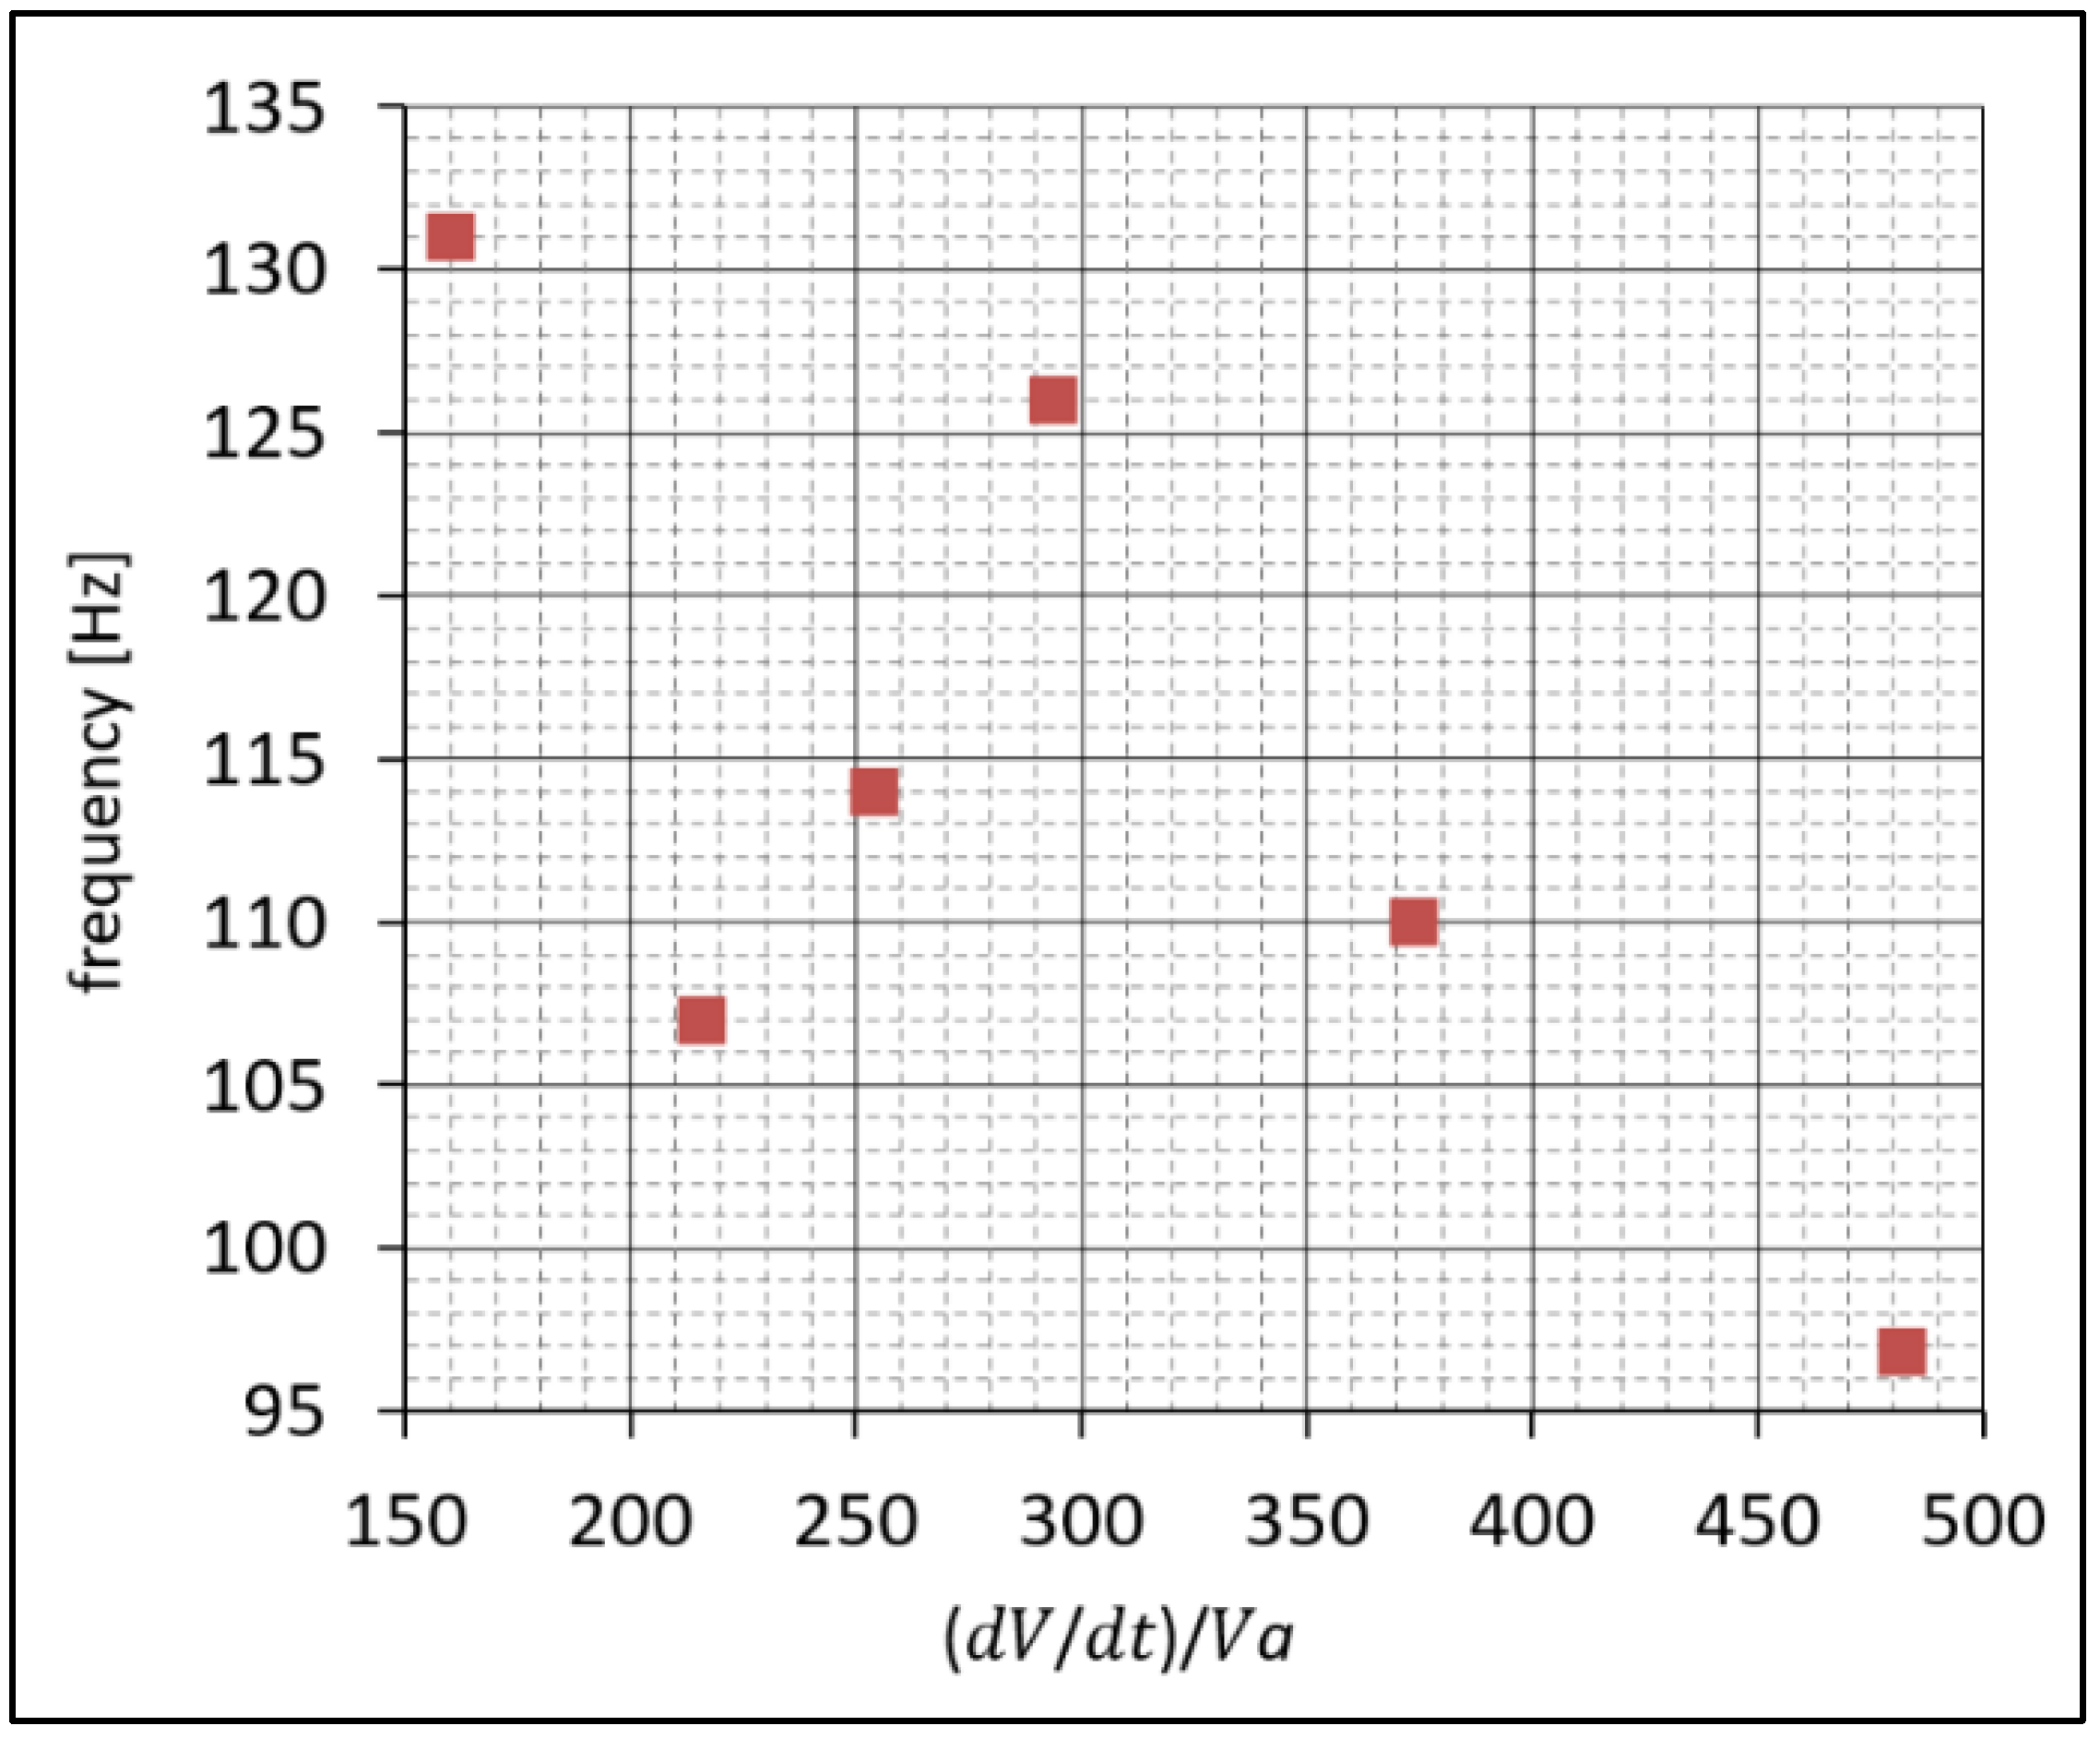
As a consequence of the increase in the relative dynamics of the change in the volume of the combustion zone, the pulsation frequency may decrease (Figure 15).
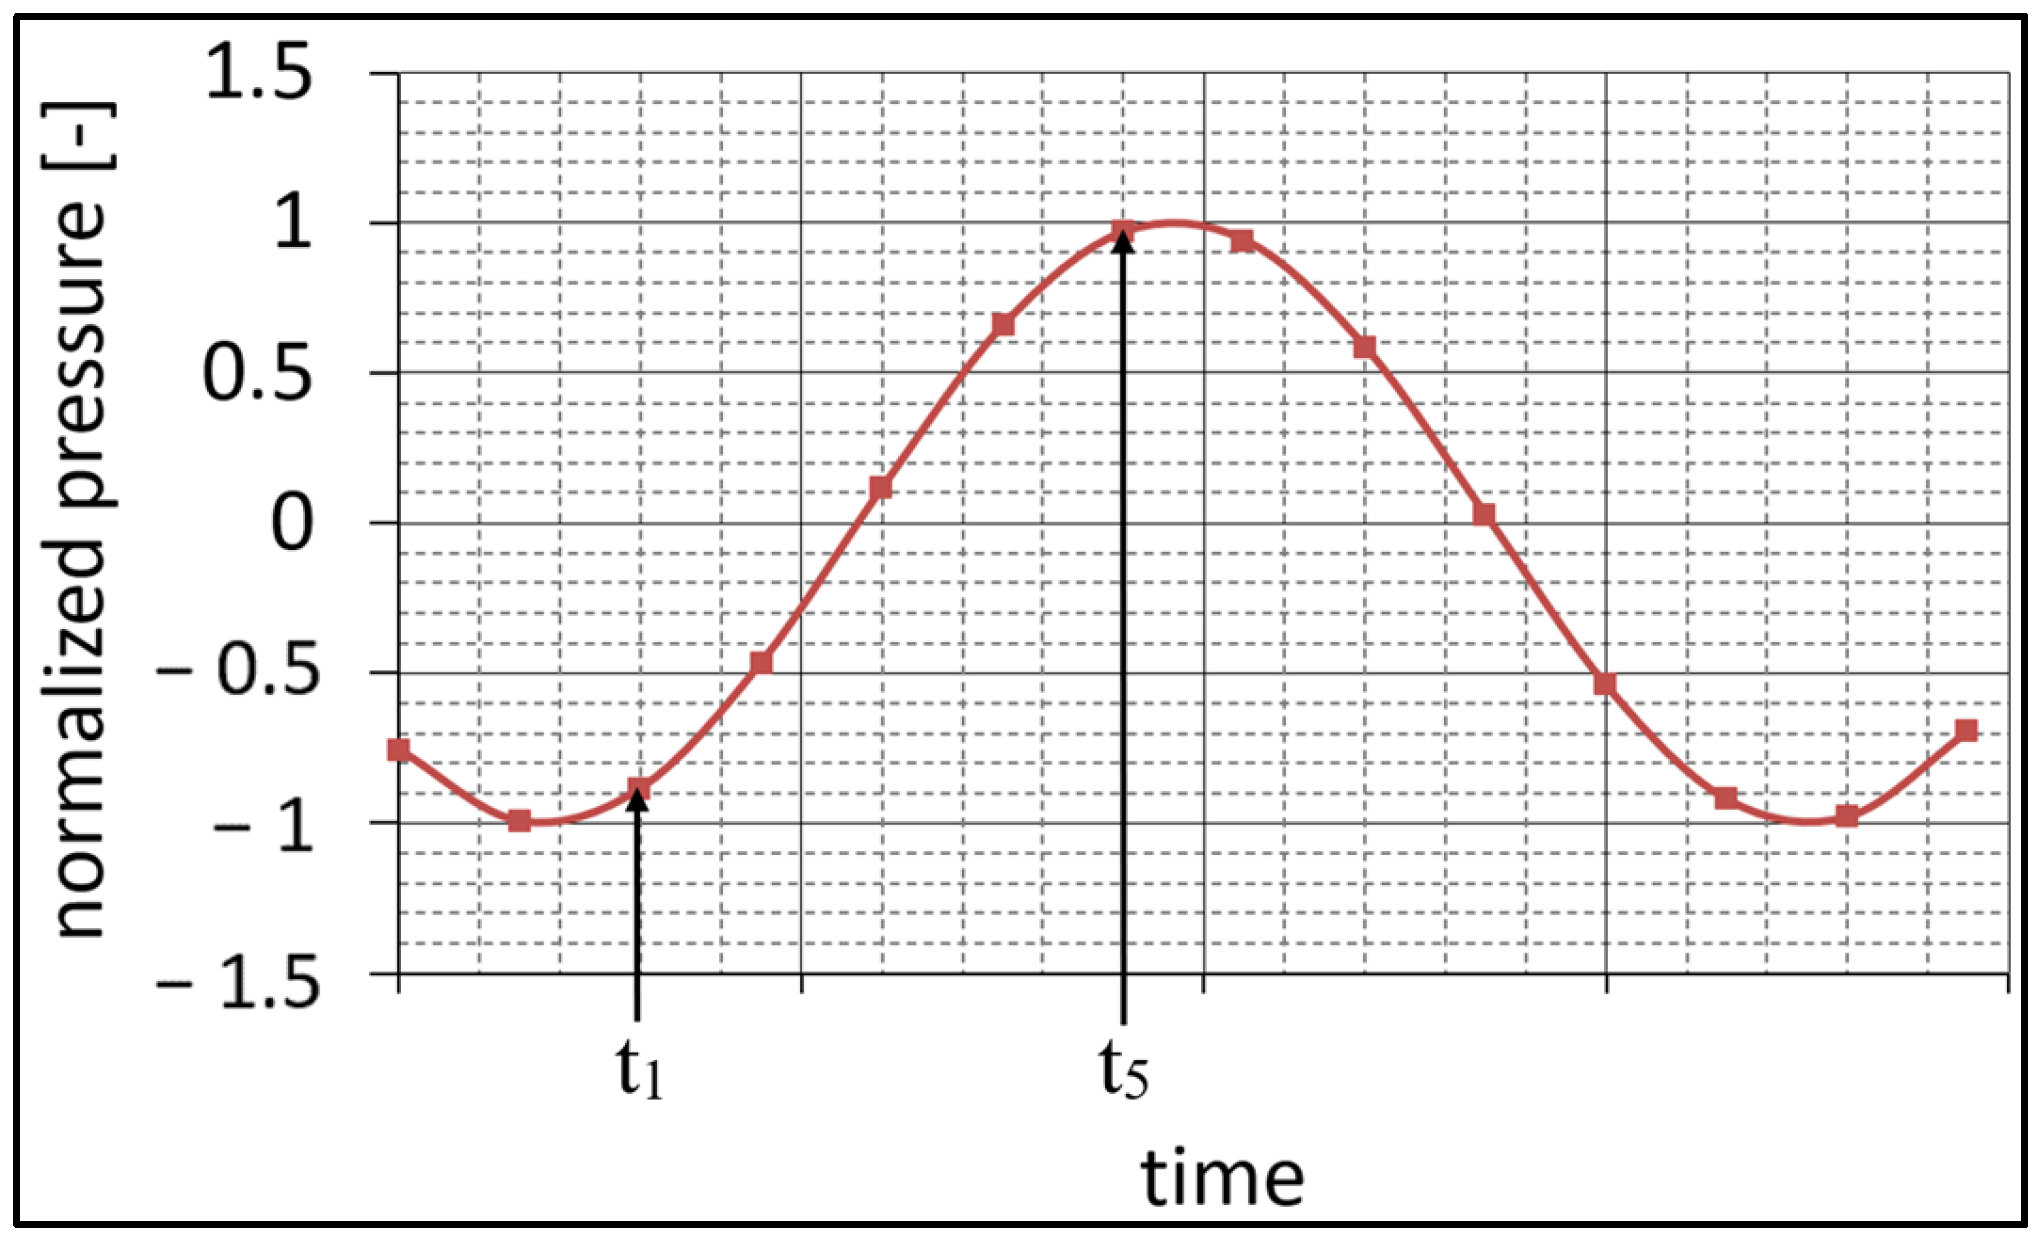
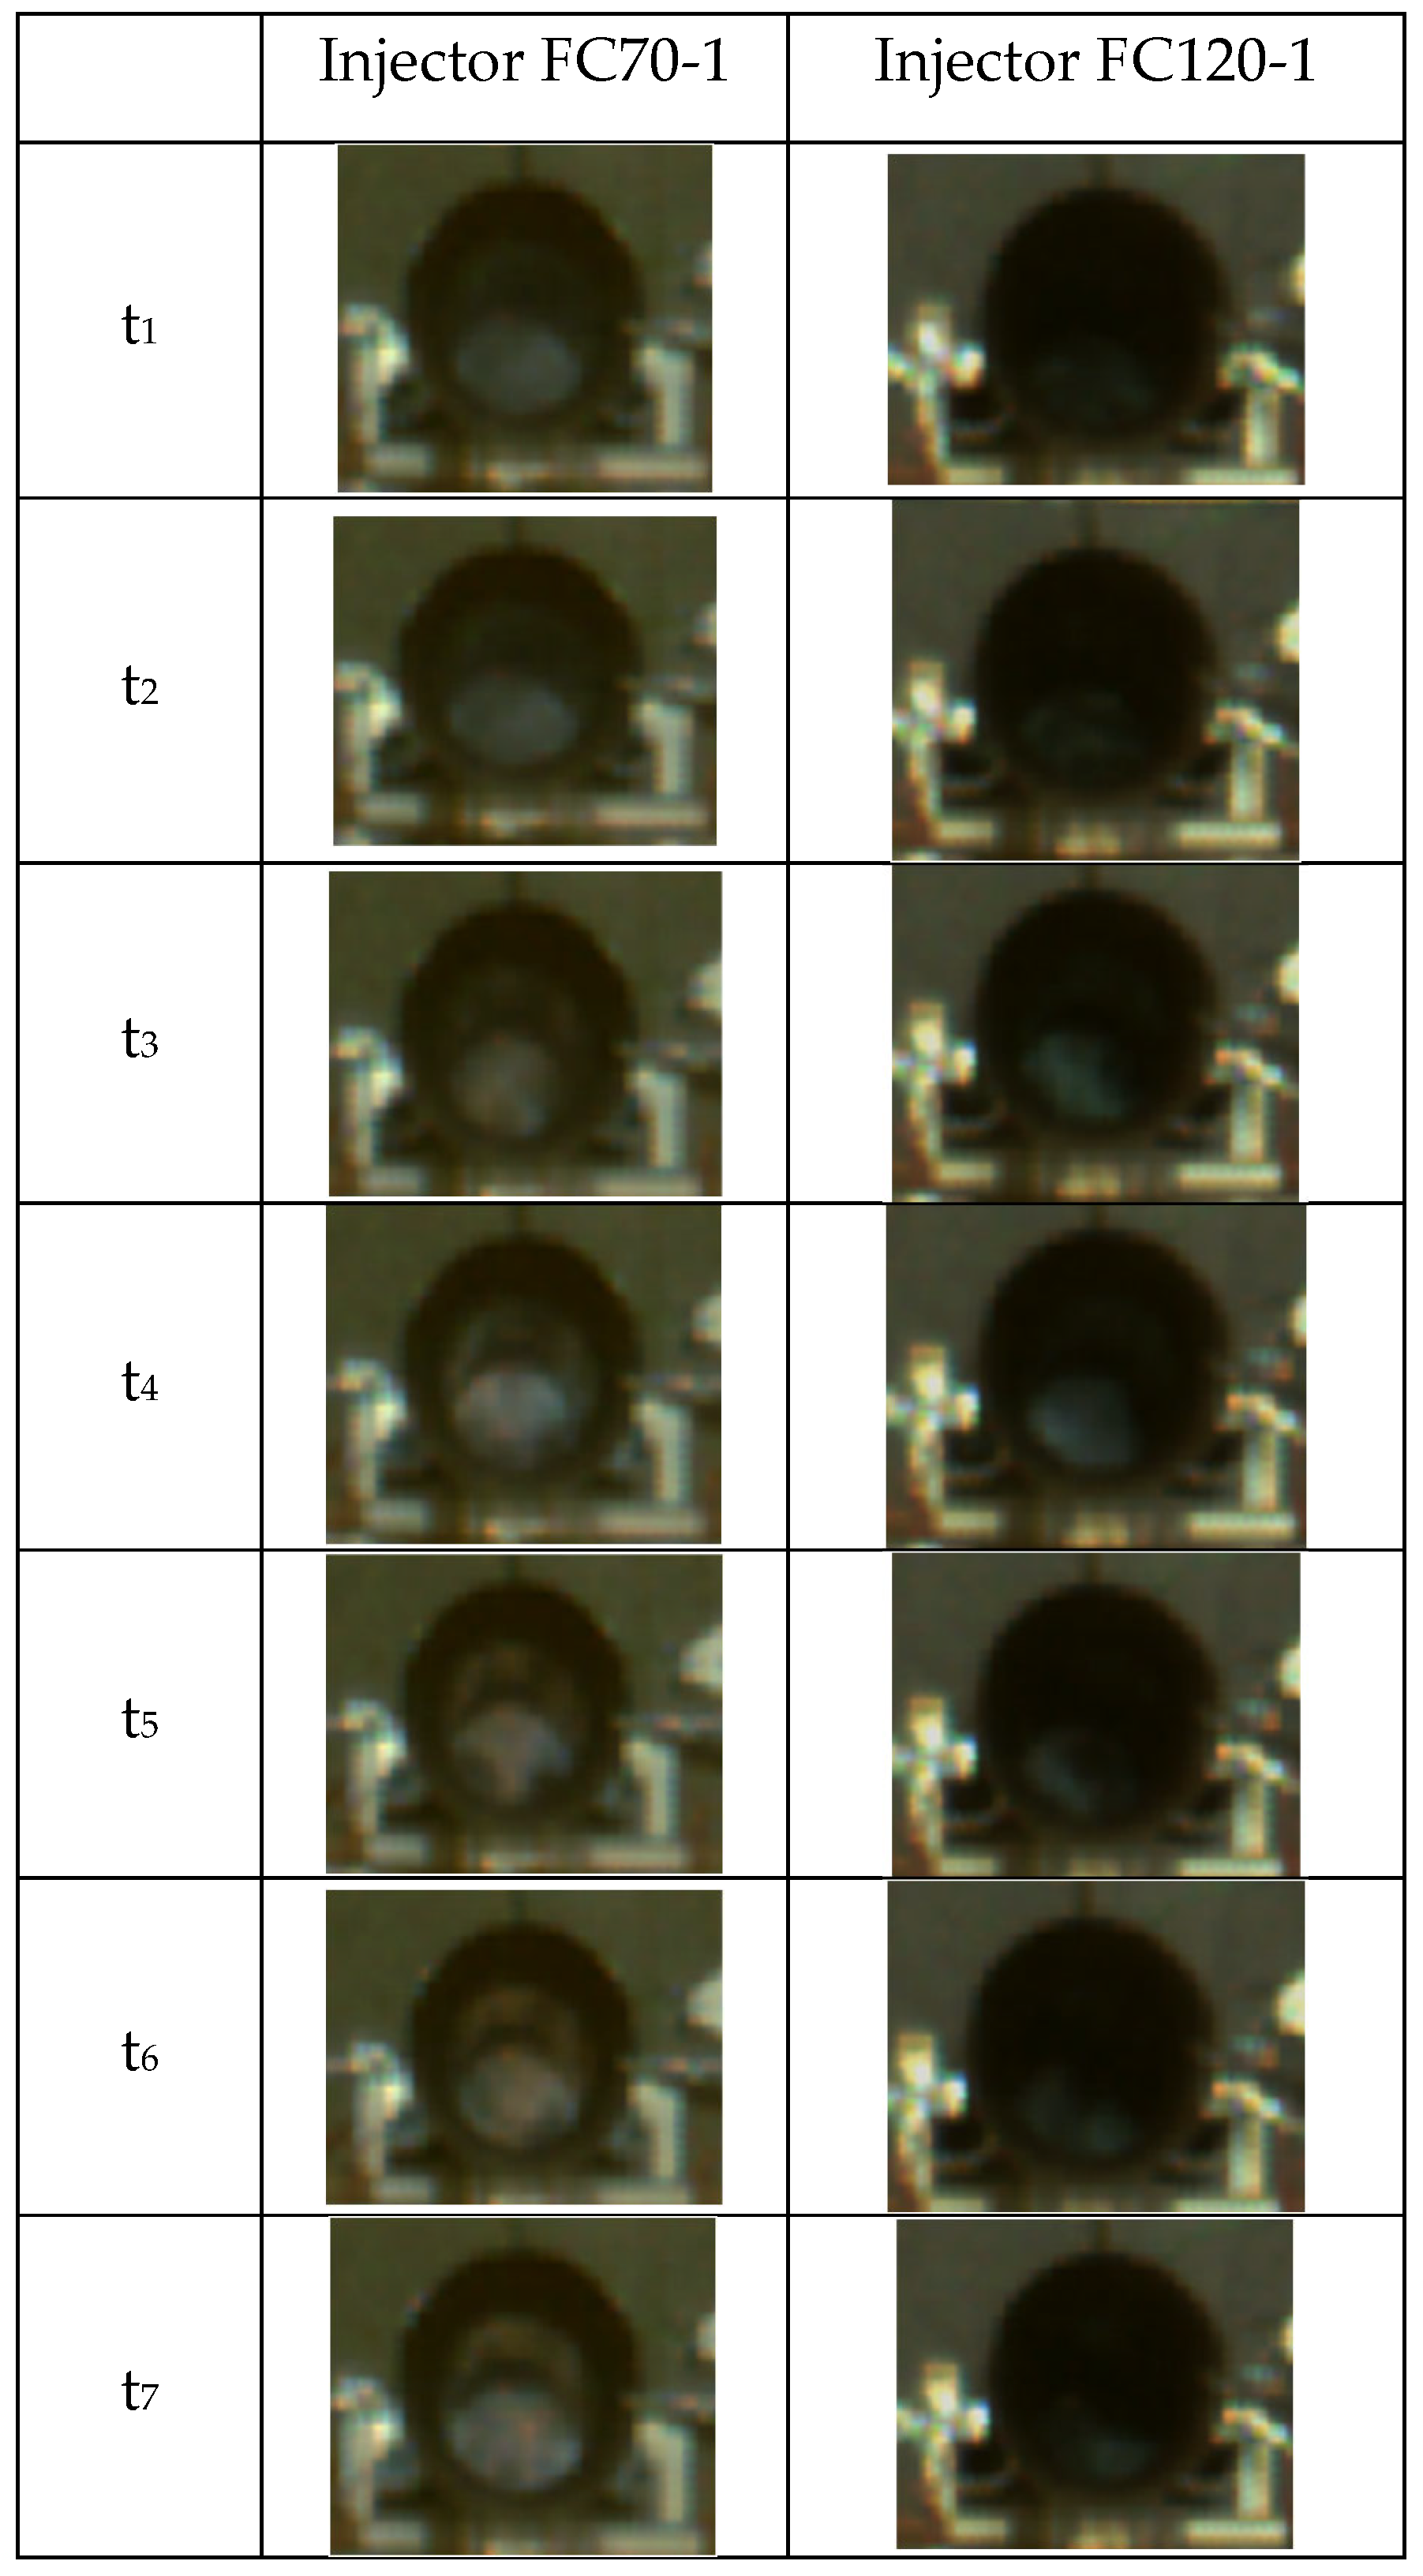
The question arises as to why the relative increase in the rate of the changes in the volume of the combustion zone does not cause an increase in the pulsation frequency, despite the simultaneous increase in the chamber’s efficiency. To explain this, a qualitative analysis of the changes in the shape of the combustion zone during the work cycle of the tested chamber should be performed. Comparing the course of the work cycle for the extreme values of the efficiency factor for the FC70-1 injector (η = 0.26) and the FC120-1 injector (η = 0.87) (Figure 16), it can be seen that in the case of the FC70-1 injector throughout the entire work cycle, the combustible mixture is present in the combustion chamber, while in the case of the FC120-1 injector, there are times when the combustible mixture is almost completely burnt out inside the combustion chamber. Referring the time moments of individual screenshots to the course of pressure to illustrate changes in the size of the combustion zone in relation to the pressure in the combustion chamber is shown in Figure 17. It can be seen that the highest degree of combustion for the combustible mixture occurs just before reaching the maximum pressure in the chamber. The effect of uneven burnout of the mixture for the two compared injectors can also be observed in the recordings from a high-speed camera (Figure 18). It can, therefore, be concluded that in the case of small, well-mixed areas of the combustible mixture with a large relative increase in the rate of change in the volume of the combustion zone, almost the entire volume of the combustion zone undergoes rapid explosive combustion. The preparation of another such zone and its ignition requires appropriate time, which results in a decrease in the pulsation frequency. However, in the case of larger combustion zones with a small relative increase in the rate of change in the combustion zone volume, only a part of the initial volume of the combustion zone undergoes explosive combustion. The remaining part can burn slowly inside the chamber and partly be “thrown” outside the cross-sections of the combustion chamber together with the exhaust gases. As a result, such a course of the pulsating combustion process may cause a decrease in the efficiency factor and an increase in the frequency of pulsations, as a result of earlier ignition (from the constantly burning mixture) of a new portion of the combustible mixture that has not yet been fully produced.
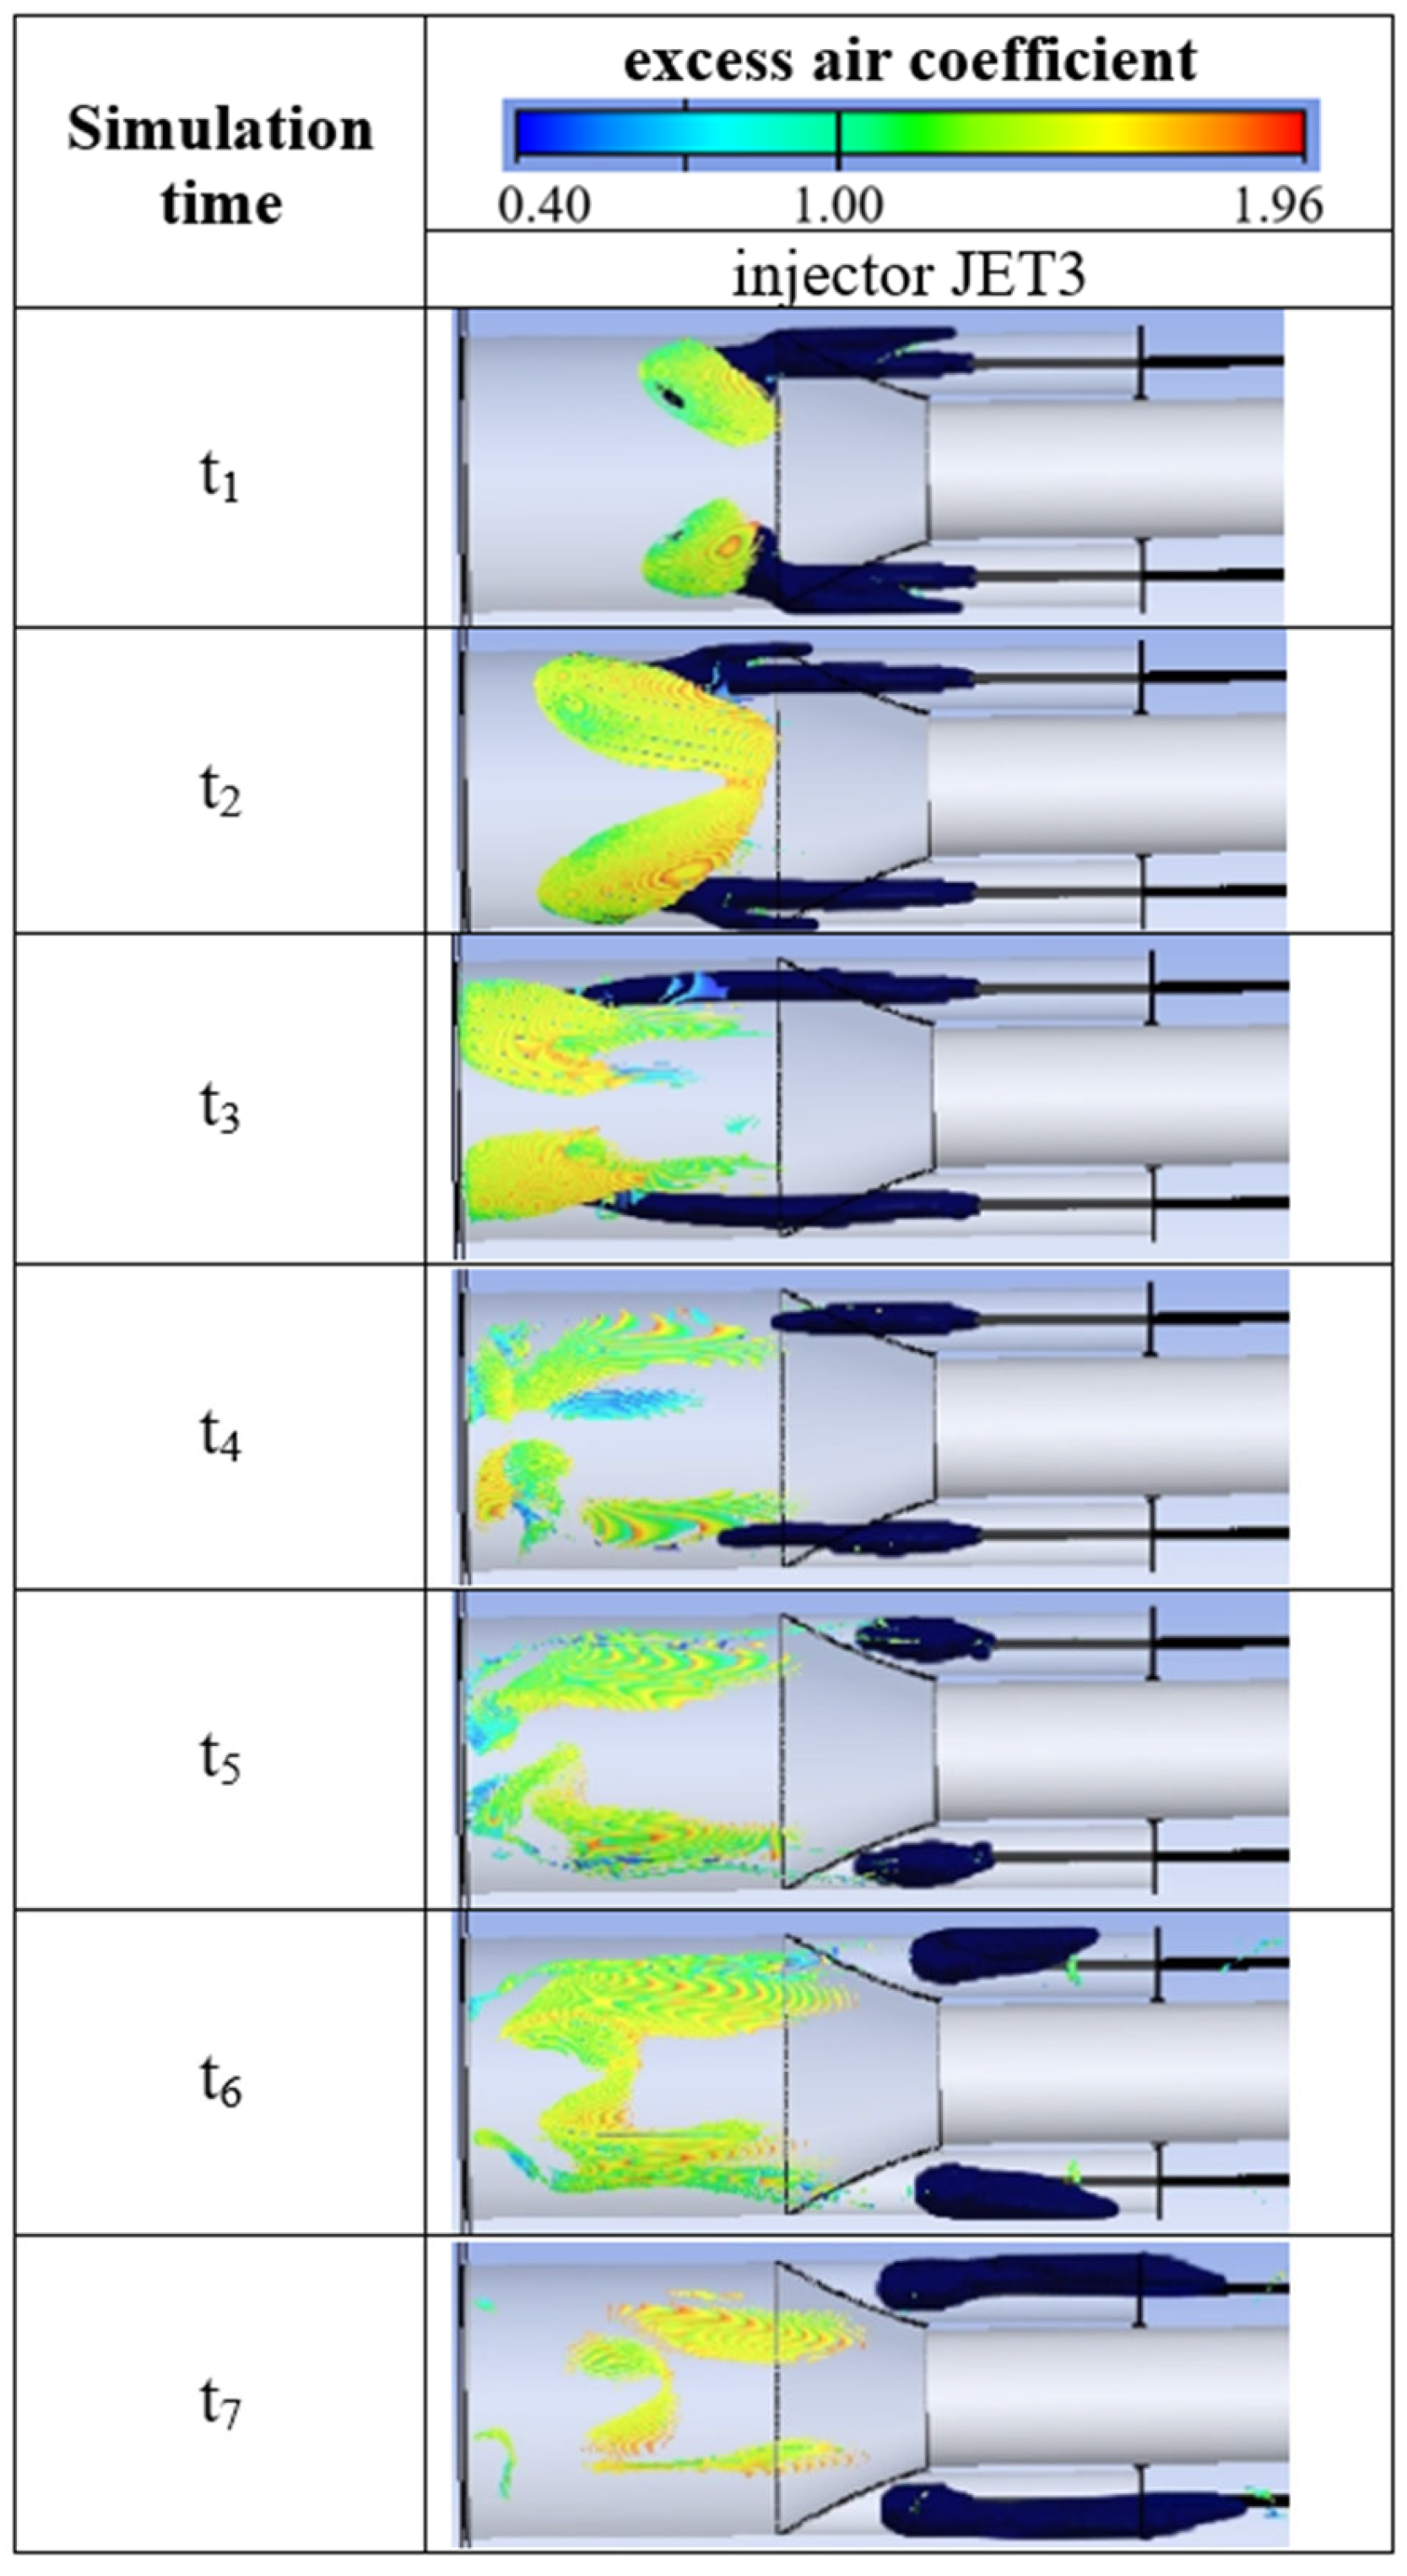
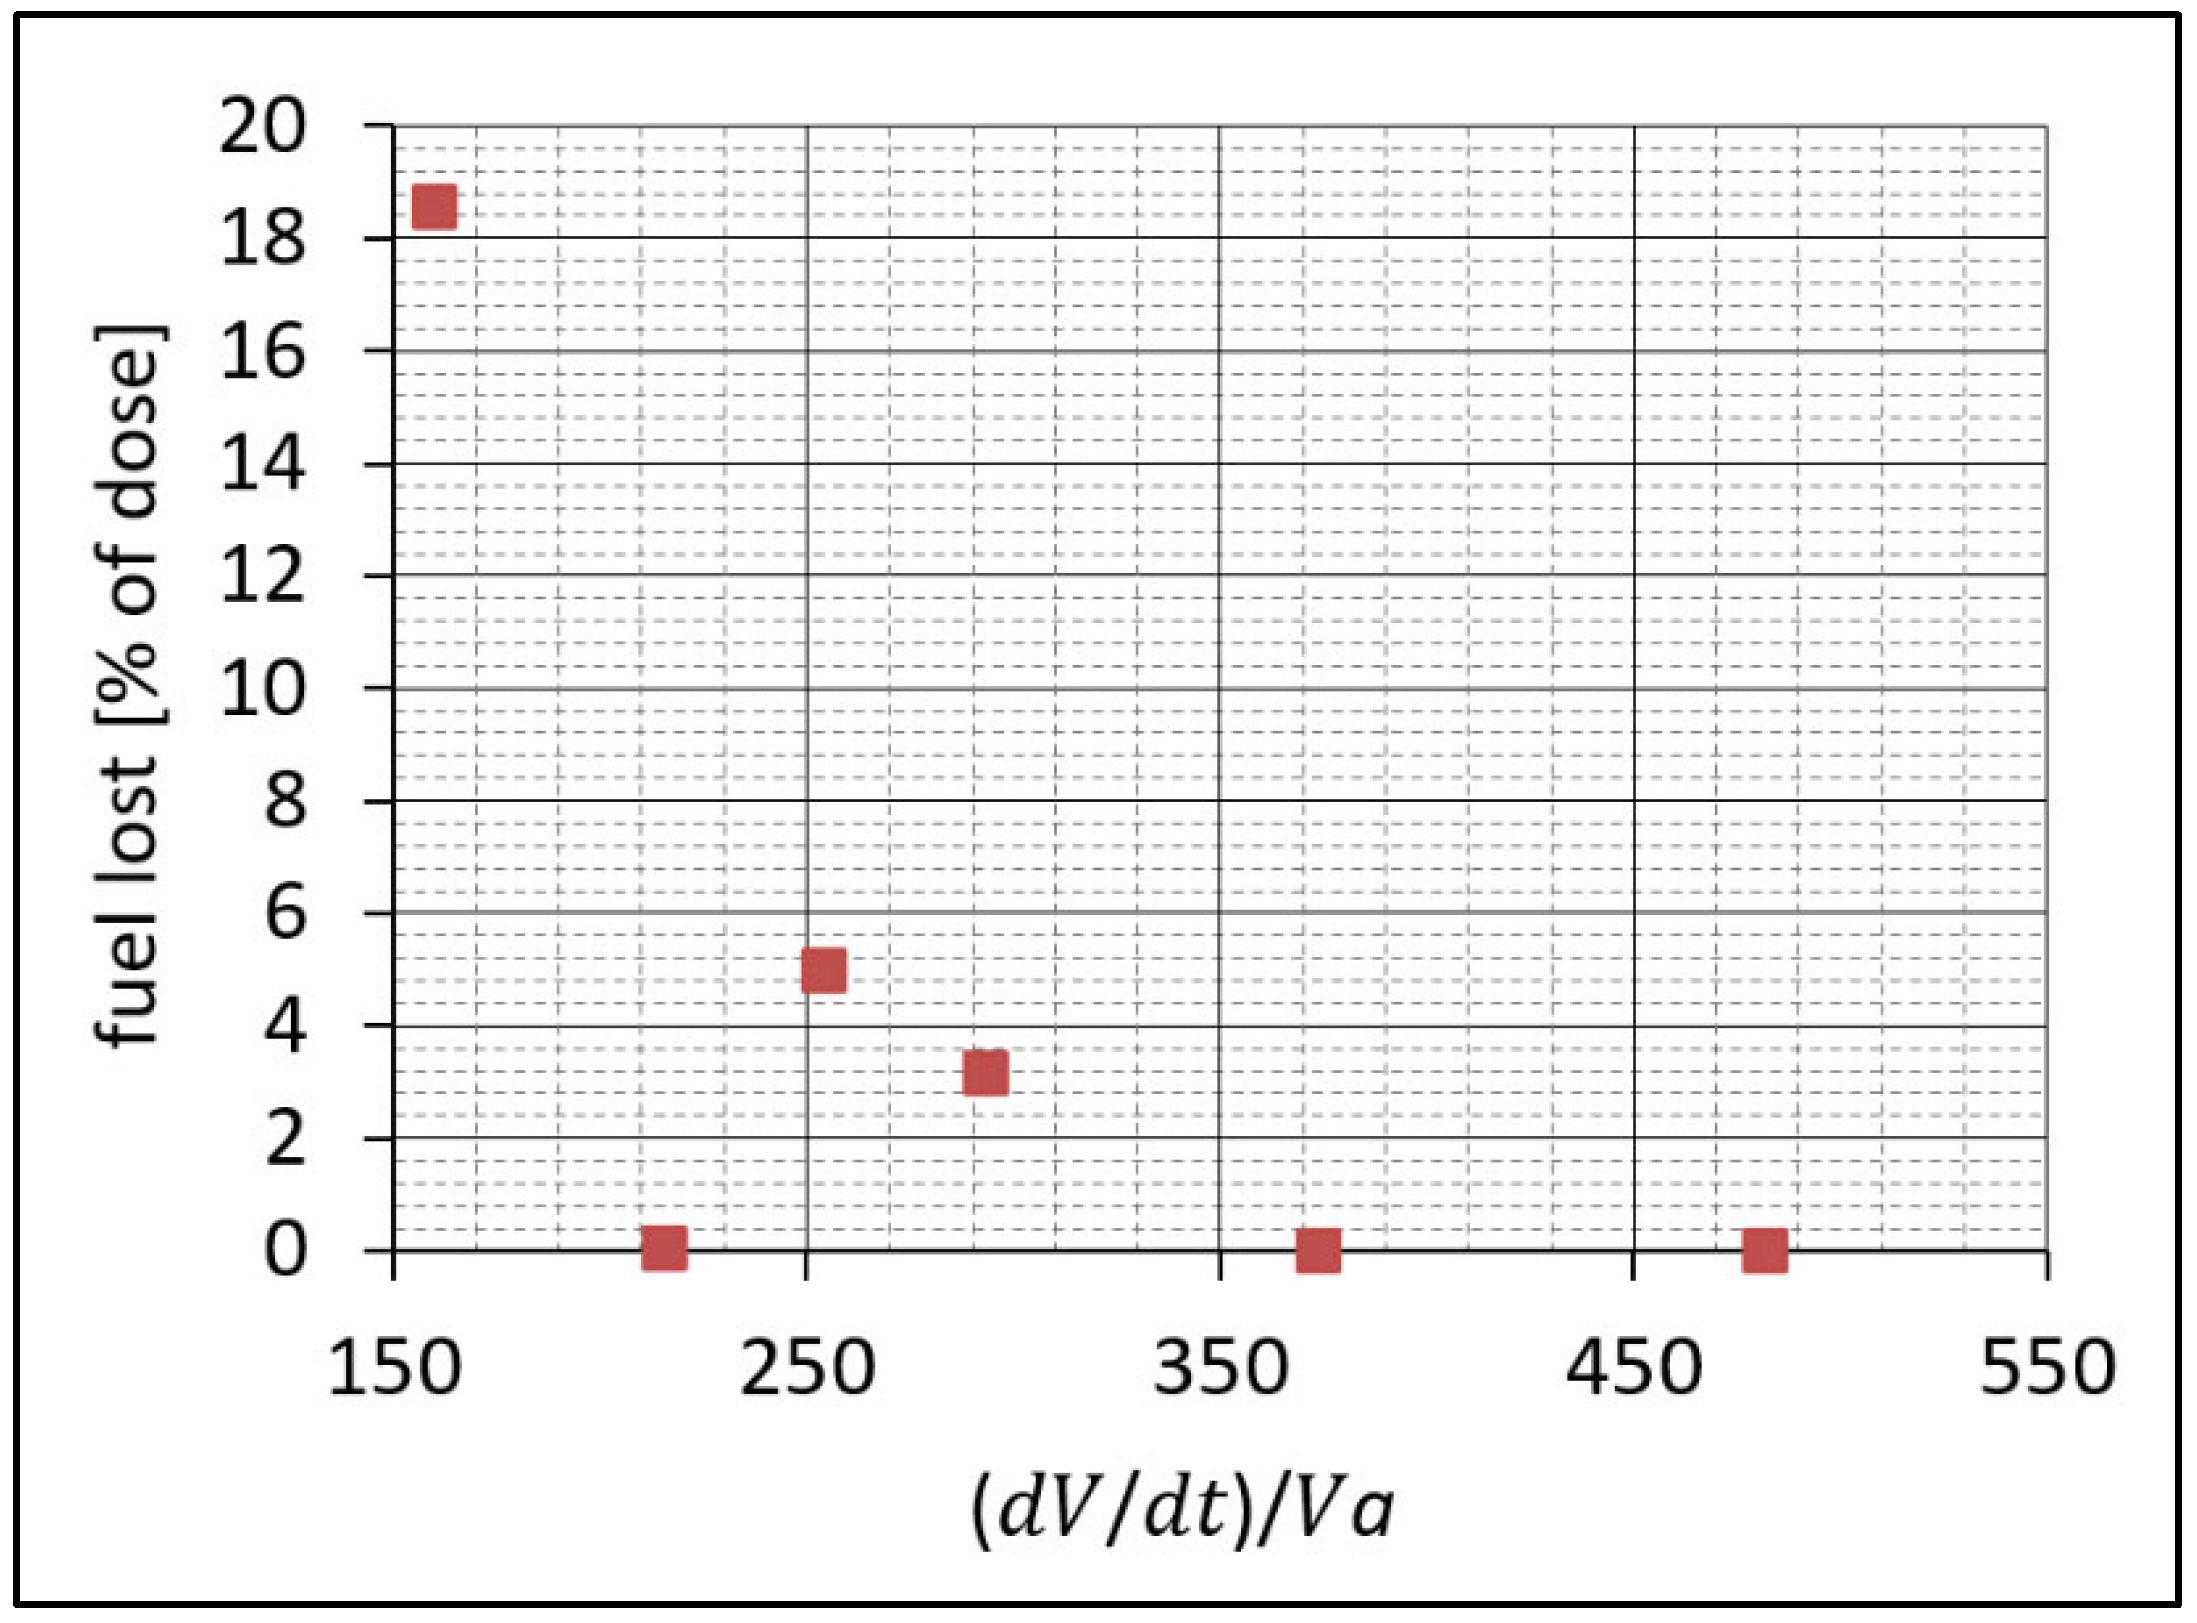
The combustion model used in the numerical tests made it possible to estimate the amount of fuel leaving the engine cross-sections. Numerical experiments have shown that the amount of fuel not involved in combustion depends, to a large extent, on the setting of the injectors (Table 2). The most fuel was lost when the jet injectors were set to L = 125 mm (Figure 19). Placing the FC70-1 injector inside the chamber (at L = 260 mm) minimized these losses almost completely. However, a significant increase in the flow through the use of the FC70-2 injector resulted in the “over-rich” mixture inside the chamber, of which about 5% of the dose left the chamber without taking part in combustion. In the case of the high efficiency factor achieved for the FC120-1 injector, no fuel was observed outside the cross-sections of the combustion chamber.
It is worth noting that with the increase in the dynamics coefficient of the combustion zone volume change in the pulsating combustion chamber, the amount of fuel “ejected” outside the combustion chamber cross-sections decreases (Figure 20). Therefore, it is a process that favours the greater efficiency of the pulse chamber, which is consistent with the results presented in Figure 13.
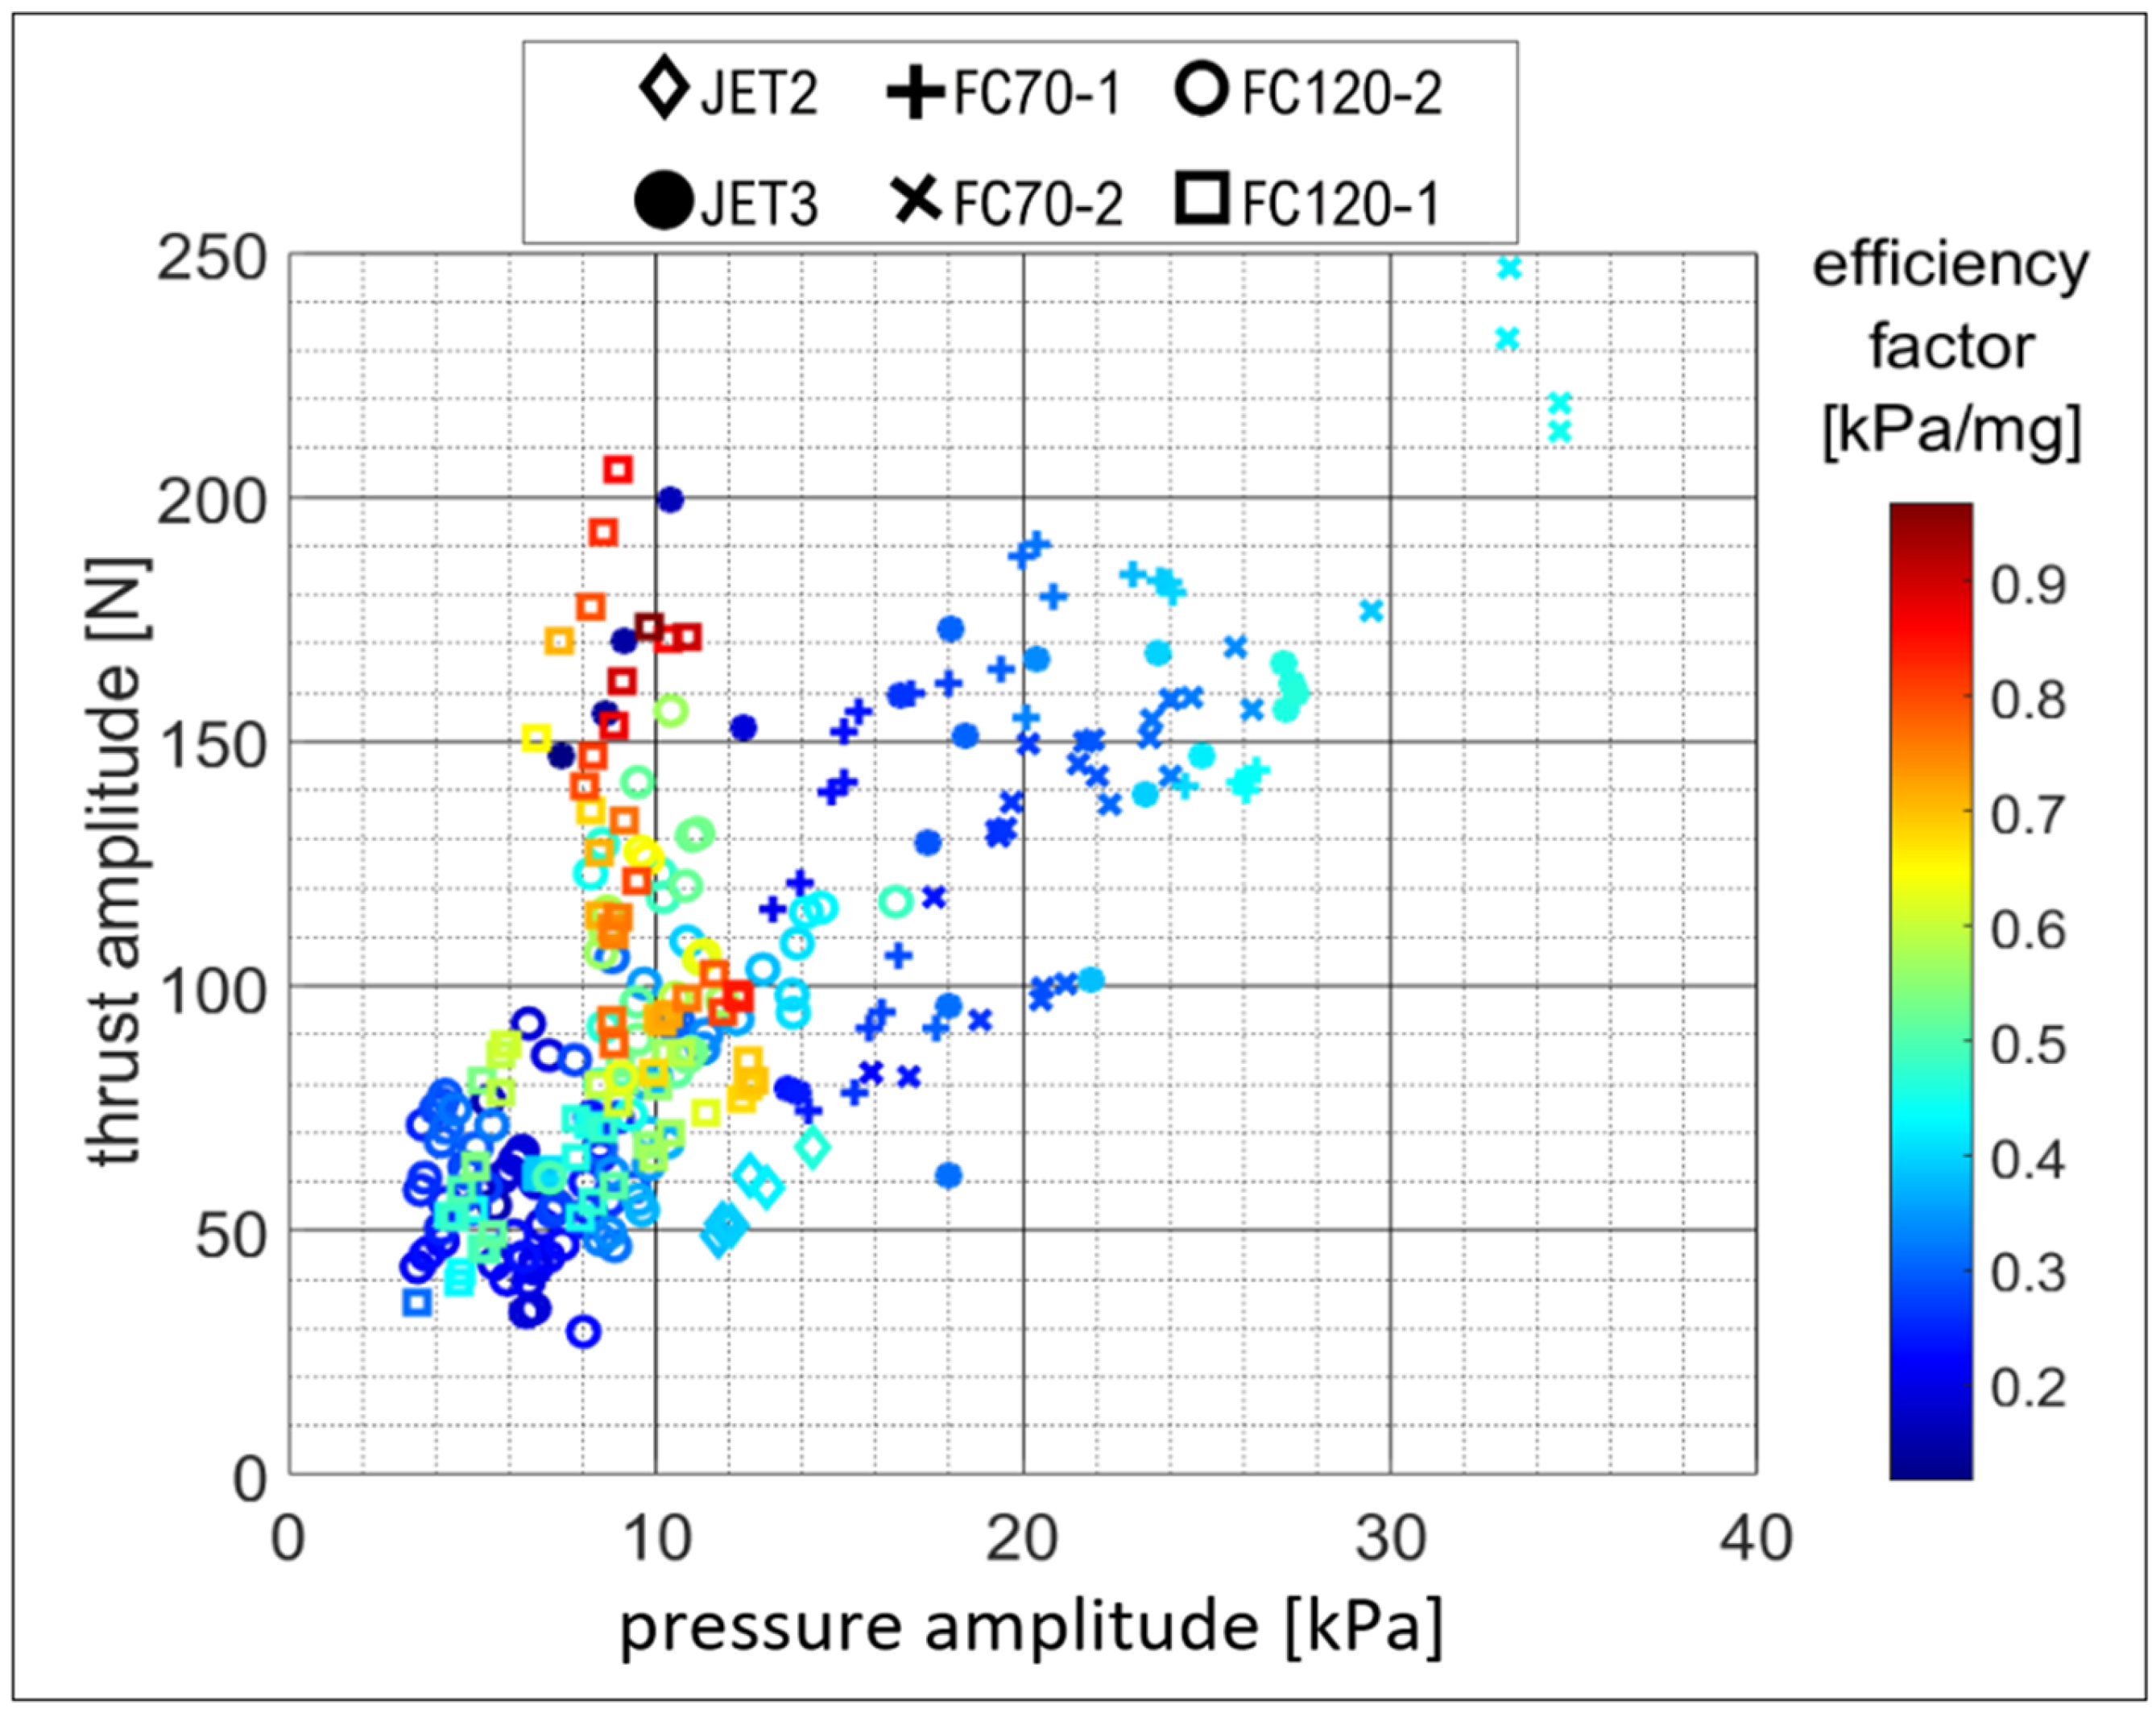
The conducted tests and analyses show that the pulsating combustion chamber operation can be significantly influenced in a wide range. In conducted tests, this was achieved by switching the type of the injector, the size of its output and adjusting its position. The decisive factor for the parameters of the pulsating chamber operation, such as the pressure amplitude, thrust amplitude, combustion efficiency factor and pulsation frequency, is the location, size and dynamics of creating a well-mixed combustible mixture area inside the combustion chamber, in which the explosive combustion process is carried out. In this context, pulsed combustion is understood as a continuity of repeated ventilated thermal explosions [51,52,53], whose parameters for a given chamber geometry are mainly conditioned by the parameters of the combustible mixture zone. Interesting results obtained during the tests showing the dependence of the thrust amplitude on the pressure pulsation amplitude in the combustion chamber and the combustion efficiency factor are shown in Figure 21. It can be seen that the dependence of the thrust amplitude on the pressure pulsation amplitude is not unambiguous. It is especially worth noting that it is possible to increase the thrust amplitude even several times at a constant pressure pulsation amplitude by increasing the combustion efficiency factor achieved by reducing the fuel dose, and according to Figure 7 and Figure 15, this is also associated with a decrease in frequency. Based on the analyses of the results obtained from both experimental and numerical research, it is clear that treating the pulsating combustion chamber strictly as a classic acoustic device with the pulsation frequency, determined mainly by the geometrical parameters of the pulsating chamber, is not justified.

5. Conclusions

Numerical simulations of the combustion process in the pulsating combustion chamber not only confirmed the results of the experimental research, but also allowed for a better understanding and interpretation of the course of the pulsating combustion process itself. In particular, it is important to determine the role and importance of the dynamics coefficient of the combustion zone volume change in the pulsating combustion chamber in the process of improving the efficiency of the energy conversion process contained in the fuel, and to explain the causes of changes in the pulsation frequency of the combustion process.
It has been shown that the most important parameters of the pulsating combustion chamber operation, such as pressure amplitude, thrust amplitude, combustion efficiency factor, as well as the pulsation frequency, can be changed in a relatively wide range by changing the position, size and dynamics of creating an area of well-mixed combustible mixture inside the combustion chamber, where explosive combustion develops. In creating such areas, the parameters of the fuel supplied—the method, place and amount of fuel supplied—play a fundamental role. Obtaining high efficiencies of pulsating combustion chambers is not conditioned by the achievement of the so-called resonance. Therefore, the pulsating combustion chamber cannot be treated as a classic acoustic device with the pulsation frequency determined mainly by the geometrical parameters of the pulsating chamber. The pulse combustion process should be understood as a continuity of repeated ventilated thermal explosions whose parameters for a given chamber geometry are largely determined by the parameters of the created combustible mixture. This makes it possible to effectively control the intensity and quality of the pulsating combustion process.
The multitude of theories on the phenomenon of pulsation only proves that this issue still requires in-depth research, in which, for a deeper understanding of this process, the influence of the geometrical parameters of the combustion chamber should also be taken into account.

Author Contributions

M.G.: writing—review and editing, conceptualization and methodology; A.M.T.: writing—original draft, investigation and formal analysis. All authors have read and agreed to the published version of the manuscript.

Funding

The APC was funded by Warsaw University of Technology—Institute of Heat Engineering.

Data Availability Statement

Data are contained within the article.

Conflicts of Interest

The authors declare no conflict of interest.

References

  1. Klimstra, J. Smart Power Generation, 3rd ed.; Avain: Helsinki, Finland, 2011. [Google Scholar]
  2. Peters, N. Turbulent Combustion; Cambridge University Press: Cambridge, UK, 2009. [Google Scholar]
  3. Karczewski, M.; Chojnowski, J.; Szamrej, G. A Review of Low-CO2 Emission Fuels for a Dual-Fuel RCCI Engine. Energies 2021, 14, 5067. [Google Scholar] [CrossRef]
  4. Singh, R.I.; Kumar, R. Current status and experimental investigation of oxy-fired fluidized bed. Renew. Sustain. Energy Rev. 2016, 61, 398–420. [Google Scholar] [CrossRef]
  5. Kuiken, K. Gas-and Dual-Fuel Engines: For Ship Propulsion, Power Plants and Cogeneration; Book I, Principles; Target Global Energy Training, Nederland: Onnen, IA, USA, 2016. [Google Scholar]
  6. Karczewski, M.; Szamrej, G.; Chojnowski, J. Experimental Assessment of the Impact of Replacing Diesel Fuel with CNG on the Concentration of Harmful Substances in Exhaust Gases in a Dual Fuel Diesel Engine. Energies 2022, 15, 4563. [Google Scholar] [CrossRef]
  7. Kyprianidis, K.G.; Nalianda, D.; Dahlquist, E. A NOx Emissions Correlation for Modern RQL Combustors. Energy Proced. 2015, 75, 2323–2330. [Google Scholar] [CrossRef]
  8. Laranci, P.; Zampilli, M.; D’Amico, M.; Bartocci, P.; Bidini, G.; Fantozzi, F. Geometry optimization of a commercial annular RQL combustor of a micro gas turbine for use with natural gas and vegetal oils. Energy Procced. 2017, 126, 875–882. [Google Scholar] [CrossRef]
  9. Kowalewicz, A. Podstawy Procesów Spalania; WNT: Warszawa, Poland, 2000. [Google Scholar]
  10. Zbicinski, I.; Kudra, T.; Liu, X. Pulse Combustion Drying, Modern Drying Technology; Wiley-VCH Verlag GmbH & Co. KGaA: Weinheim, Germany, 2014. [Google Scholar]
  11. Anand, V.; Gutmark, E. A review of pollutants emissions in various pressure gain combustors. Int. J. Spray Combust. 2019, 11. [Google Scholar] [CrossRef]
  12. Available online: https://wave-engine.com/ (accessed on 2 February 2023).
  13. Choutapalli, I.M.; Krothapalli, A.; Alkislar, M.B. Pulsed-Jet Ejector Thrust Augumentor Characteristics. J. Propuls. Power 2012, 28, 293–306. [Google Scholar] [CrossRef]
  14. Available online: http://auerpolska.com/kociol-pulsacyjny-pulsator-20-kw (accessed on 15 June 2022).
  15. Available online: https://vespaddd.com.pl/produkty/sprzet-zamglawiacze-zamglawiacze-spalinowe/zamglawiacz-igeba-tf-35 (accessed on 15 June 2022).
  16. Available online: https://zamglawiacze.com/8-zamglawiacze (accessed on 15 June 2022).
  17. Kudra, T. Pulse-combustion drying: Status and potentials. Dry. Technol. 2008, 26, 1409–1420. [Google Scholar] [CrossRef]
  18. Kudra, T.; Benali, M.; Zbicinski, I. Pulse Combustion Drying: Aerodynamics, Heat Transfer, and Drying Kinetics. Dry. Technol. 2003, 21, 629–655. [Google Scholar] [CrossRef]
  19. Available online: https://www.pulsedry.com/ (accessed on 2 February 2023).
  20. Meng, X.; De Jong, W.; Kudra, T. A state-of-the-art review of pulse combustion: Principles, modeling, applications and R&D issues. Renew. Sustain. Energy Rev. 2016, 55, 73–114. [Google Scholar]
  21. Reynst, F.H. Pulsating Combustion; Pergamon Press: Oxford, MI, USA, 1961. [Google Scholar]
  22. Wójcicki, S. Możliwości rozwojowe silników pulsacyjnych. Technol. Lotnicza 1957, 6, 160–165. [Google Scholar]
  23. Wójcicki, S. Silniki Pulsacyjne, Strumieniowe, Rakietowe, Wydaw; Ministerstwa Obrony Narodowej: Warszawa, Poland, 1962. [Google Scholar]
  24. Tharratt, C.E. The Propulsive Duct. Aircr. Eng. Aerosp. Technol. 1966, 38, 23–25. [Google Scholar] [CrossRef]
  25. Tharratt, C.E. The Propulsive Duct. Aircr. Eng. Aerosp. Technol. 1965, 37, 327–337. [Google Scholar] [CrossRef]
  26. Tharratt, C.E. The Propulsive Duct. Aircr. Eng. Aerosp. Technol. 1965, 37, 359–371. [Google Scholar] [CrossRef]
  27. Lockwood, R.M. Hiller Pulse Reactor Lift Engine; Report No. ARD 308; Hiller Aircraft Company: Firebaugh, CA, USA, 1963. [Google Scholar]
  28. Anand, V.; Jodele, J.; Prise, E. Dynamic Features of Internal and External Flowfields of Pulsejet Engines. AIAA J. 2020, 58, 4204–4211. [Google Scholar] [CrossRef]
  29. Anand, V.; Jodele, J.; Knight, E.; Prisell, E.; Lyrsell, O.; Gutmark, E. Dependence of Pressure, Combustion and Frequency Characteristics on Valved Pulsejet Combustor Geometries. Flow Turbul. Combust. 2017, 100, 829–848. [Google Scholar] [CrossRef]
  30. Anand, V.; Jodele, J.; Shaw, V.; Russel, A.; Prisell, E.; Lyrsell, O.; Gutmark, E. Visualization of Valved Pulsejet Combustors and Evidence of Compression Ignition. Flow Turbul. Combust. 2021, 106, 901–924. [Google Scholar] [CrossRef]
  31. Gieras, M.; Trzeciak, A. A new approach to the phenomenon of pulsed combustion. Exp. Therm. Fluid Sci. 2023, 144, 110845. [Google Scholar] [CrossRef]
  32. Paxson, D.E.; Zheng, F.; Kuznetsov, A.V.; Roberts, W.L. Comparison Between Numerically Simulated and Experimentally Measured Flowfield Quantities behind a Pulsejet. In Proceedings of the 44th Joint Propulsion Conference and Exhibit, Hartford, CT, USA, 21–23 July 2008. Paper NASA/TM-2008-215432. [Google Scholar]
  33. Zbiciński, I.; Smucerowicz, I.; Strumiłło, C.; Kasznia, J.; Stawczyk, J.; Murlikiewicz, K. Optimization and Neural Modelling of Pulse Combustors for Drying Applications. Dry. Technol. 1999, 17, 610–631. [Google Scholar] [CrossRef]
  34. Zhonghua, W.; Mujumdar, A.S. Pulse combustion characteristics of various gaseous fuels. Energ. Fuel. 2008, 22, 915–924. [Google Scholar] [CrossRef]
  35. Yao, X.; Ming, Z.; Tiezhu, G.; Peng, D.; Yudong, H. Simulation on Operational Characteristics of a Valveless Self-excited Pulse Combustor of the Helmholtz-type. In Proceedings of the 2014 International Conference on Mechatronics, Control and Electronic Engineering, Shenyang, China, 29–31 August 2014; pp. 319–322. [Google Scholar] [CrossRef]
  36. Yungster, S.; Paxson, D.E.; Perkins, H.D. Effect of Fuel Injection and Mixing Characteristics on Pulse-Combustor Performance at High-Pressure. In Proceedings of the 50th AIAA/ASME/SAE/ASEE Joint Propulsion Conference, Cleveland, OH, USA, 28–30 July 2014. Paper AIAA 2014-3728. [Google Scholar]
  37. Nekoufar, K. Spray Modeling in Pulse Jet Engine and Surveying the Distribution and Fuel-Air Mixture in Combustion. Adv. Environ. Biol. 2013, 7, 2241–2250. [Google Scholar]
  38. Barr, P.; Keller, J.; Bramlette, T.; Westbrook, C.; Dec, J. Pulse combustor modeling demonstration of the importance of characteristic times (associated with acoustics, fluid mixing, chemical kinetics). Combust. Flame 1990, 82, 252–269. [Google Scholar] [CrossRef]
  39. Available online: http://www.pulse-jets.com/valveless/ (accessed on 15 November 2022).
  40. Available online: http://plans-for-everything.com/hen_pulse_jet_plans.html (accessed on 15 June 2022).
  41. Available online: http://plans-for-everything.com/downloads/pulse_jets/PJE%20OgorelecValveless.pdf (accessed on 15 June 2022).
  42. Available online: https://www.youtube.com/watch?v=DLcK6q1KiQM (accessed on 15 June 2022).
  43. Available online: http://aardvark.co.nz/pjet/ (accessed on 15 June 2022).
  44. Temple, K.A. Thermal and Internal Acoustic Model of a Helmholtz Type Pulse Combustion Furnace. Ph.D Thesis, ProQuest Dissertations Publishing, Purdue University, West Lafayette, IN, USA, 1996. [Google Scholar]
  45. Geng, T.; Schoen, M.A.; Kuznetsov, A.V.; Roberts, W.L. Combined numerical and experimental investigation of a 15-cm valveless pulsejet. Flow Turbul. Combust. 2007, 78, 17–33. [Google Scholar] [CrossRef]
  46. Zheng, F. Computational Investigation of High Speed Pulsejets. Ph.D. Thesis, North Carolina State University, Raleigh, NC, USA, 2009. [Google Scholar]
  47. Ansys Inc. ANSYS Fluent Theory Guide; Ansys Inc.: Canonsburg, PA, USA, 2013. [Google Scholar]
  48. Kordylewski, W.; Bulewicz, E.; Dyjakon, A.; Słupek, S.; Miller, R.; Wanik, A. Spalanie i Paliwa: Praca Zbiorowa; Oficyna Wydawnicza Politechniki Wrocławskiej: Wrocław, Poland, 2001. [Google Scholar]
  49. Szkarowski, A. Spalanie Gazów: Teoria, Praktyka, Ekologia; WNT: Warszawa, Poland, 2014. [Google Scholar]
  50. Gieras, M.; Klemens, R.; Rarata, G.; Wolański, P. Determination of explosion parameters of methane-air mixtures in the chamber of 40 dm3 at normal and elevated temperature. J. Loss Prevent. Proc. 2006, 19, 263–270. [Google Scholar] [CrossRef]
  51. Sustek, J.; Janovsky, B. Comparison of empirical and semi-empirical equations for vented gas explosion with experimental data. J. Loss Prevent. Proc. 2013, 26, 1549–1557. [Google Scholar] [CrossRef]
  52. Mokhtar, K.M.; Kasmani, R.M.; Hassan, C.R.C.; Hamid, M.D.; Emami, S.D.; Nor, M.I.M. Reliability and applicability of empirical equations in predicting the reduced explosion pressure of vented gas explosions. J. Loss Prevent. Proc. 2020, 63, 104023. [Google Scholar] [CrossRef]
  53. Rui, S.; Wang, Q.; Chen, F.; Li, Q.; Guo, J.; Wang, J.; Wang, C. Effect of vent area on the vented methane-air deflagrations in a 1 m3 rectangular vessel with and without obstacles. J. Loss Prevent. Proc. 2022, 74, 104642. [Google Scholar] [CrossRef]
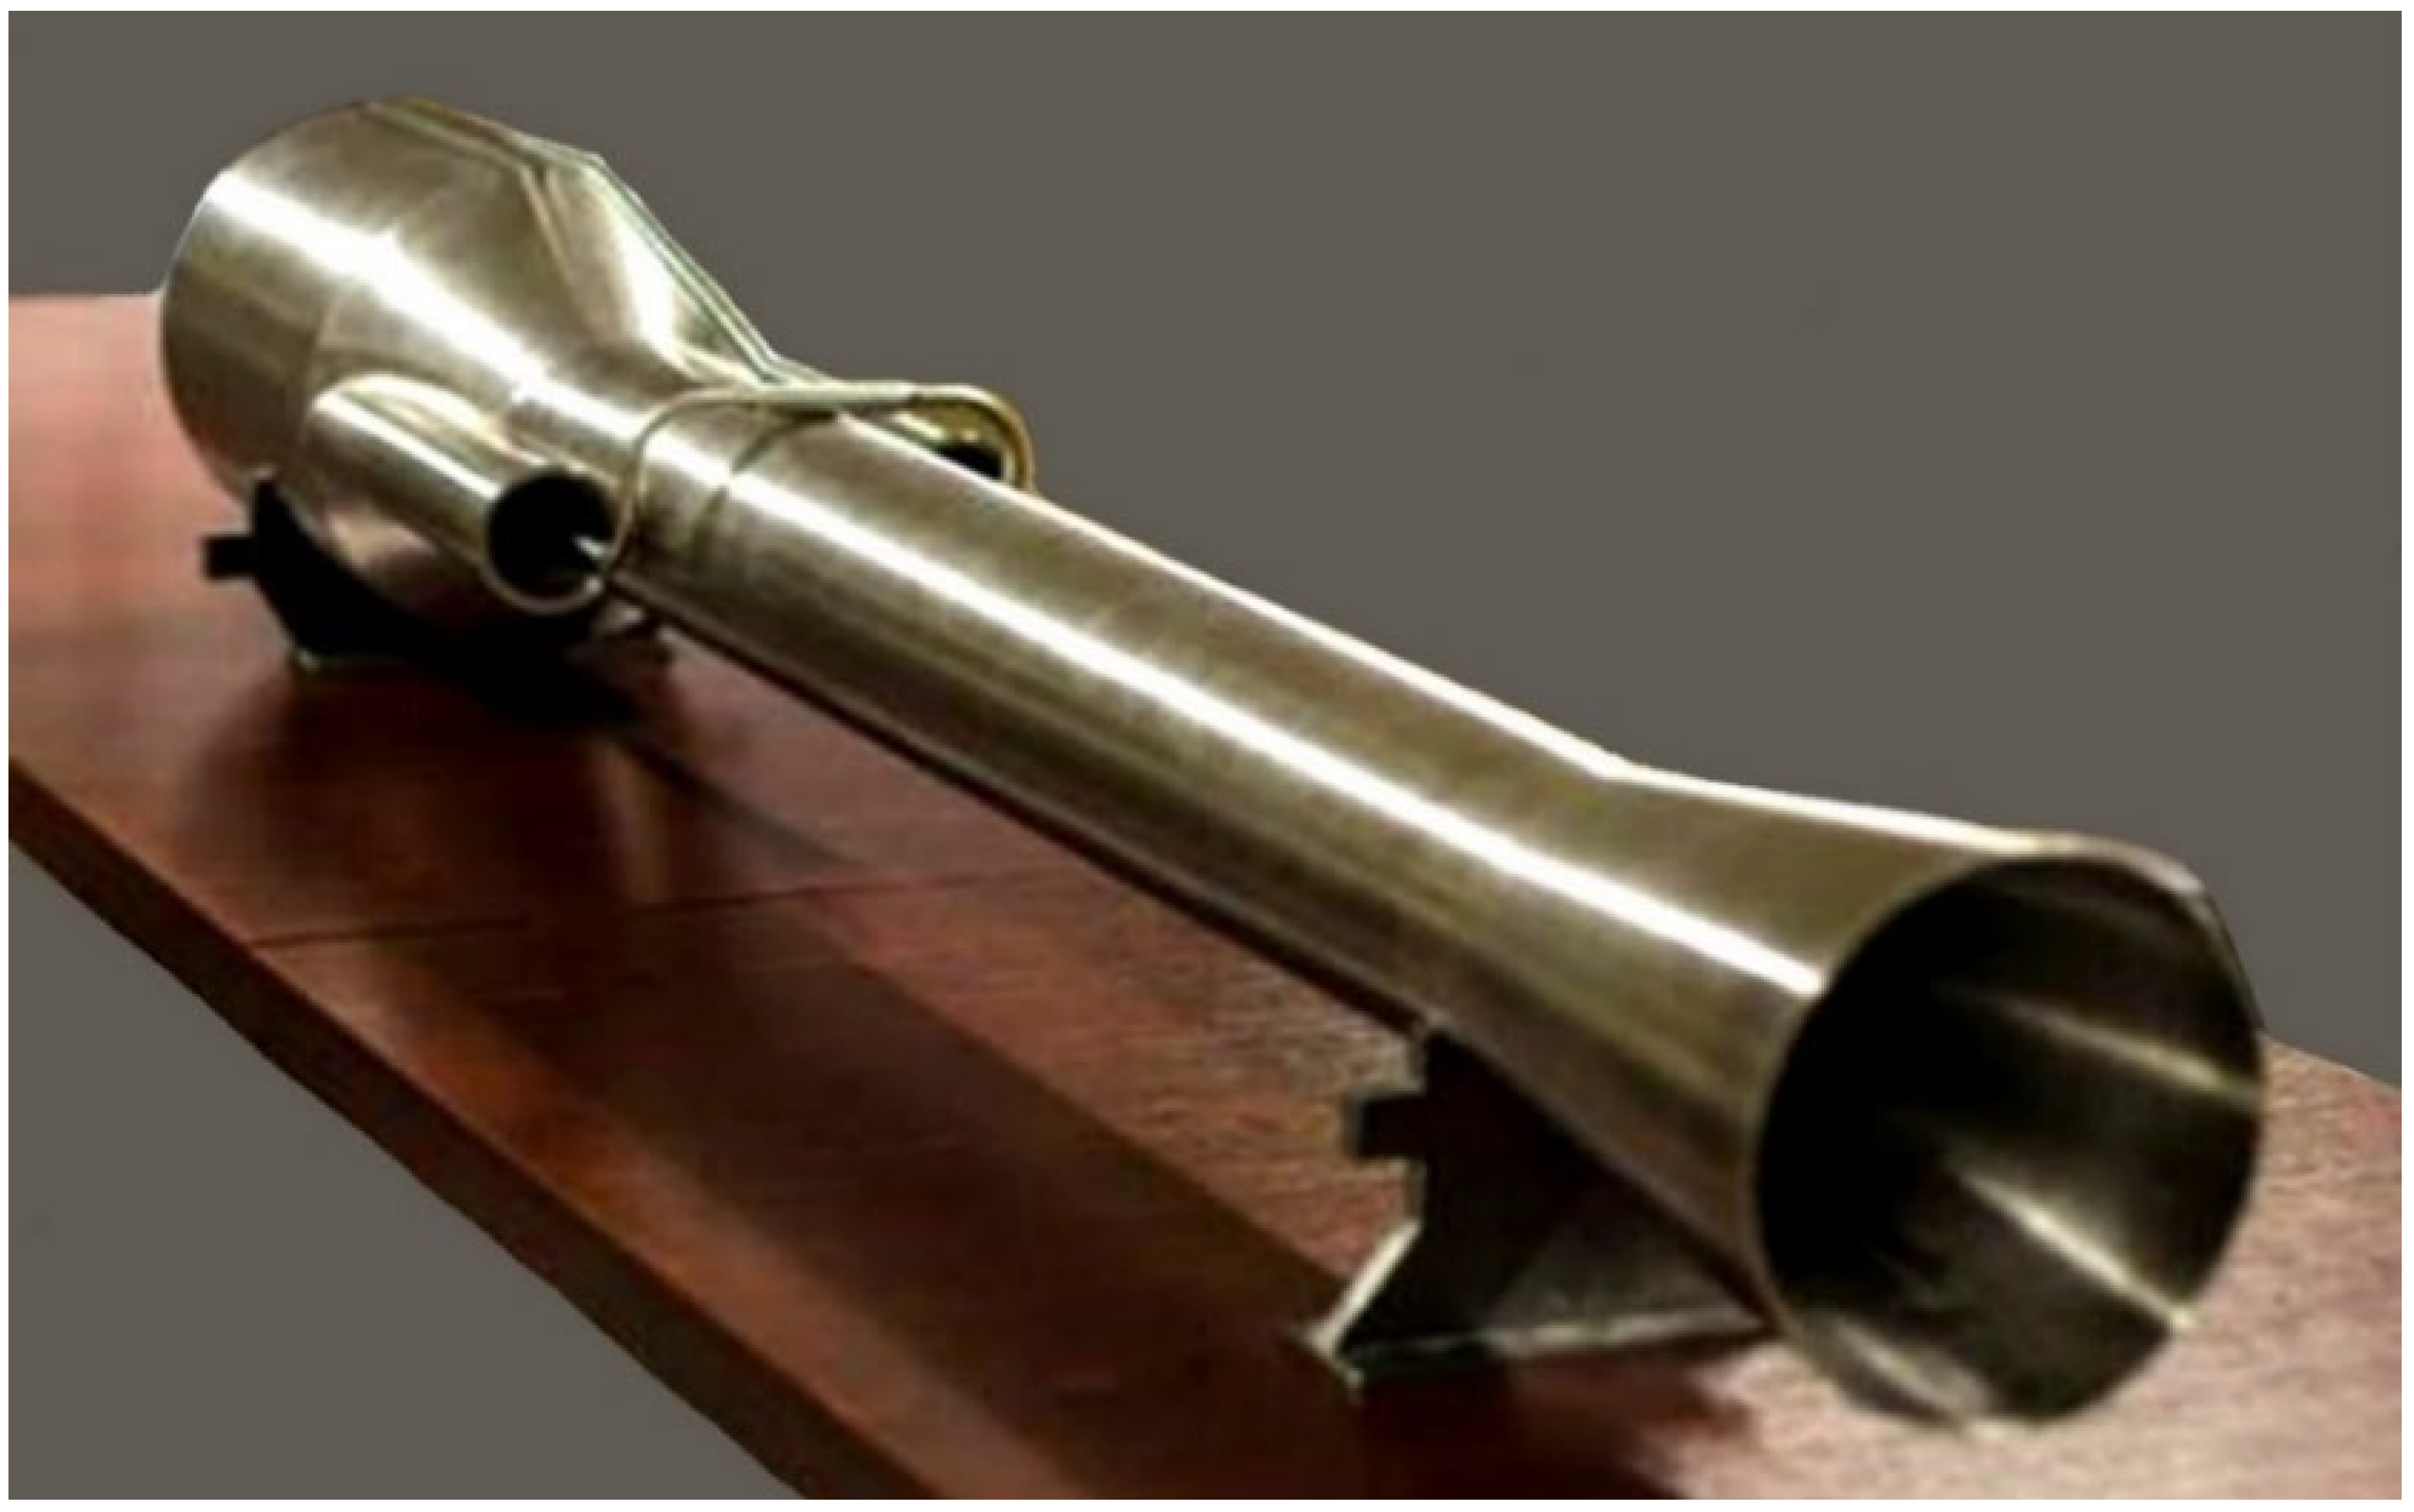
Figure 1. Tested pulse engine. The total length of the engine is 1.4 m. Diameter of the combustion chamber is 0.2 m.
Energies 17 01427 g001
Figure 2. Scheme of the research stand: 1—flat mirror, 2—EGT measurement connector, 3—thermal imaging camera, 4—strain gauge beam, 5—fire-acoustic bulkhead, 6—high-speed camera, 7—injector positioning mechanism and 8—pressure measurement connector in the combustion chamber.
Energies 17 01427 g002
Figure 3. Definition of the “L” parameter.
Energies 17 01427 g003
Figure 4. Mass flow characteristics of the injectors utilized for testing the pule engine [31].
Energies 17 01427 g004
Figure 5. The graph showing the change in the efficiency factor as a function of dose and pulsation frequency.
Energies 17 01427 g005
Figure 6. Cross-section of the computational domain used for numerical research.
Energies 17 01427 g006
Figure 7. Boundary conditions applied for the computational domain.
Energies 17 01427 g007
Figure 8. Percentage deviations of the simulation results Δ from the result of the experiment, depending on the efficiency factor.
Energies 17 01427 g008
Figure 9. Combustion chamber wall temperature profiles obtained from experimental tests (a) and numerical simulation (b) for JET2 and JET3 injectors.
Energies 17 01427 g009
Figure 10. Numerical calculations showing the change in the relative kinetic energy of turbulence k and the relative turbulence frequency of vortices as a function of the efficiency factor.
Energies 17 01427 g010
Figure 11. Numerical calculations showing the changes in the relative average volume of the combustion zone and the excess air factor as a function of the efficiency factor.
Energies 17 01427 g011
Figure 12. Changes in the volume of the combustion zone in relation to the average value for the JET3 injector, calculated numerically.
Energies 17 01427 g012
Figure 13. The results of numerical calculations showing the dependence of the efficiency factor on the dynamic coefficient of changes in the volume of the combustion zone.
Energies 17 01427 g013
Figure 14. The results of numerical calculations showing the dependence of the dynamics coefficient of the combustion zone volume change on its average volume.
Energies 17 01427 g014
Figure 15. The results of numerical calculations showing the dependence of the pulsation frequency on the coefficient of change in the dynamics of the combustion zone.
Energies 17 01427 g015
Figure 16. Numerical simulation of the process of filling the combustion chamber fuelled by FC70-1 and FC120-1 injectors, navy blue colour representing the isosurface, where the molar fraction of propane is equal to 1.
Energies 17 01427 g016
Figure 17. An example of a normalized course of pressure changes in the combustion chamber with marked moments of time corresponding to the screenshots in Figure 16.
Energies 17 01427 g017
Figure 18. The sequence of images from a high-speed camera showing flame development FC70-1 and FC120-1 injectors; t1 < t7.
Energies 17 01427 g018
Figure 19. Numerical simulations of the process of filling the combustion chamber powered by the JET3 injector at L = 125 mm, navy blue colour representing the isosurface, where the molar fraction of propane is equal to 1.
Energies 17 01427 g019
Figure 20. The results of the numerical simulation showing the dependence of the relative amount of fuel lost on the dynamics coefficient of the change in the volume of the combustion zone.
Energies 17 01427 g020
Figure 21. Experimental results showing the dependence of the thrust amplitude on the amplitude of pressure pulsation in the combustion chamber and the efficiency factor.
Energies 17 01427 g021
Table 1. Exemplary results of mesh independence study.
Mesh 1
4,800,000 Elements
Mesh 2
7,200,000 Elements
Maximum y+366245
Maximum domain CFL2.21.4
Time per iteration [s]15.528.7
Combustion chamber pressure amplitude [kPa]40.139.6
Table 2. List of fuel losses depending on the type and location of the injector.
InjectorPositionDose
[mg/Cycle]
Efficiency Factor
[kPa/mg]
Fuel Losses
[mg/Cycle]
Fuel Losses
[% of Dose]
JET2L = 125 mm300.41 0.96 3.2
JET3L = 125 mm570.301118.5
FC70-1L = 260 mm650.26 5.6 · 10 3 0.009
FC70-2L = 260 mm780.443.95.0
Disclaimer/Publisher’s Note: The statements, opinions and data contained in all publications are solely those of the individual author(s) and contributor(s) and not of MDPI and/or the editor(s). MDPI and/or the editor(s) disclaim responsibility for any injury to people or property resulting from any ideas, methods, instructions or products referred to in the content.