1. Progress in the Study of Pore Characteristics and Gas Content in Shale Gas Reservoirs
Shale gas, as a significant unconventional natural gas resource, has garnered widespread attention in the global energy sector [
1,
2]. The investigation of shallow shale porosity characteristics and the study of factors controlling gas content hold paramount importance in the realms of modern geology and energy development [
3]. Firstly, as a clean and efficient unconventional natural gas resource, shale gas occupies an indispensable position within the global energy mix [
4]. An in-depth exploration of the porosity traits of shallow shale can aid scientists and engineers in better understanding the gas storage mechanisms and flow properties of shale gas reservoirs. This understanding is crucial for evaluating the potential of shale gas resources, optimizing extraction methods, and enhancing gas recovery efficiency [
5]. This manuscript not only elucidates the scientific significance of studying shallow shale porosity and gas content control factors but also emphasizes the role of shale gas in advancing a sustainable and efficient global energy landscape.
The primary storage spaces for shale gas are located within the micro- to nanoscale pores of shale, rendering in-depth analysis of its microscopic pore structure particularly crucial. The characterization techniques for shale porosity can be broadly categorized into two main types: those based on physical experimental measurements and those relying on high-resolution imaging observations [
6]. In physical experimental measurement techniques, depending on the pore size, methods primarily include low-temperature nitrogen adsorption, low-temperature carbon dioxide adsorption, high-pressure mercury intrusion, and nuclear magnetic resonance (NMR) technologies [
7]. Each technique targets pores within different size ranges; for example, low-temperature gas adsorption is suitable for detecting mesopores and micropores [
8], while high-pressure mercury intrusion is more apt for characterizing macropores [
9]. Although these methods have their strengths, limitations exist, such as the potential for high-pressure mercury intrusion to damage samples [
10], whereas low-temperature gas adsorption can avoid sample destruction, thereby increasing sample usability [
11]. On the other hand, high-resolution imaging techniques employ various microscopic imaging technologies, such as optical microscopy and scanning electron microscopy (SEM), to directly observe the micro-features of shale pores [
12,
13,
14]. These technologies provide intuitive images of pore structures but, due to the extremely small size of shale pores, require very high imaging resolutions [
15,
16]. Common experimental methods include isothermal adsorption experiments and high-pressure methane adsorption experiments. These experiments can determine the adsorption capacity of methane in shale under different conditions (such as varying temperatures and pressures) [
17,
18].
To predict and calculate the gas content of shale gas, researchers have developed experimental methods for determining gas content more accurately. These models and methods are designed to combine the pore characteristics of shale and the adsorption behavior of methane to provide more precise estimates of gas content. As early as 1915, Gibbs proposed the Gibbs adsorption equation based on classical thermodynamics, applicable to all interfaces [
19]. In 1918, Langmuir introduced the classic monolayer adsorption model theory, which later became the Langmuir model [
20]. In 1930, Mikhail I. Temkin proposed the original Temkin model [
21], and in 1938, S. Brunauer, P.H. Emmett, and E. Teller derived the multilayer adsorption model equation based on monolayer adsorption, the BET (Brunauer–Emmett–Teller) model [
22]. In the exploration of gas adsorption mechanisms, various theoretical models have been widely used to deepen the understanding of the adsorption process. These models include but are not limited to the Langmuir, Freundlich, and Temkin adsorption models, which provide a foundation for revealing the adsorption characteristics of gases such as methane on catalyst surfaces and within shale pores [
23,
24,
25]. With the advancement of research, the phenomenon of adsorption under high-pressure conditions has prompted scholars to compare and revise traditional models, thereby proposing improved theories such as Toth–Langmuir and multicomponent adsorption [
26]. Furthermore, in response to the complex behavior of methane adsorption, more advanced models such as Sips, Freundlich–Langmuir, and Redlich–Peterson have been developed to achieve the accurate fitting of adsorption data [
27]. Recently, the proposal of micropore filling theory and the development of multiscale models based on the Sips model have provided new perspectives for the study of gas transport and adsorption mechanisms in microporous structures [
28,
29]. Especially considering the complexity of conditions such as multilayer adsorption, supercritical adsorption, and exceptionally high pressure in shale gas, the BET adsorption model has been modified to enhance its relevance and accuracy in practical applications [
30,
31]. The advancements in these theories have not only propelled a deeper understanding of adsorption science but also provided solid theoretical support for the exploitation and application of shale gas.
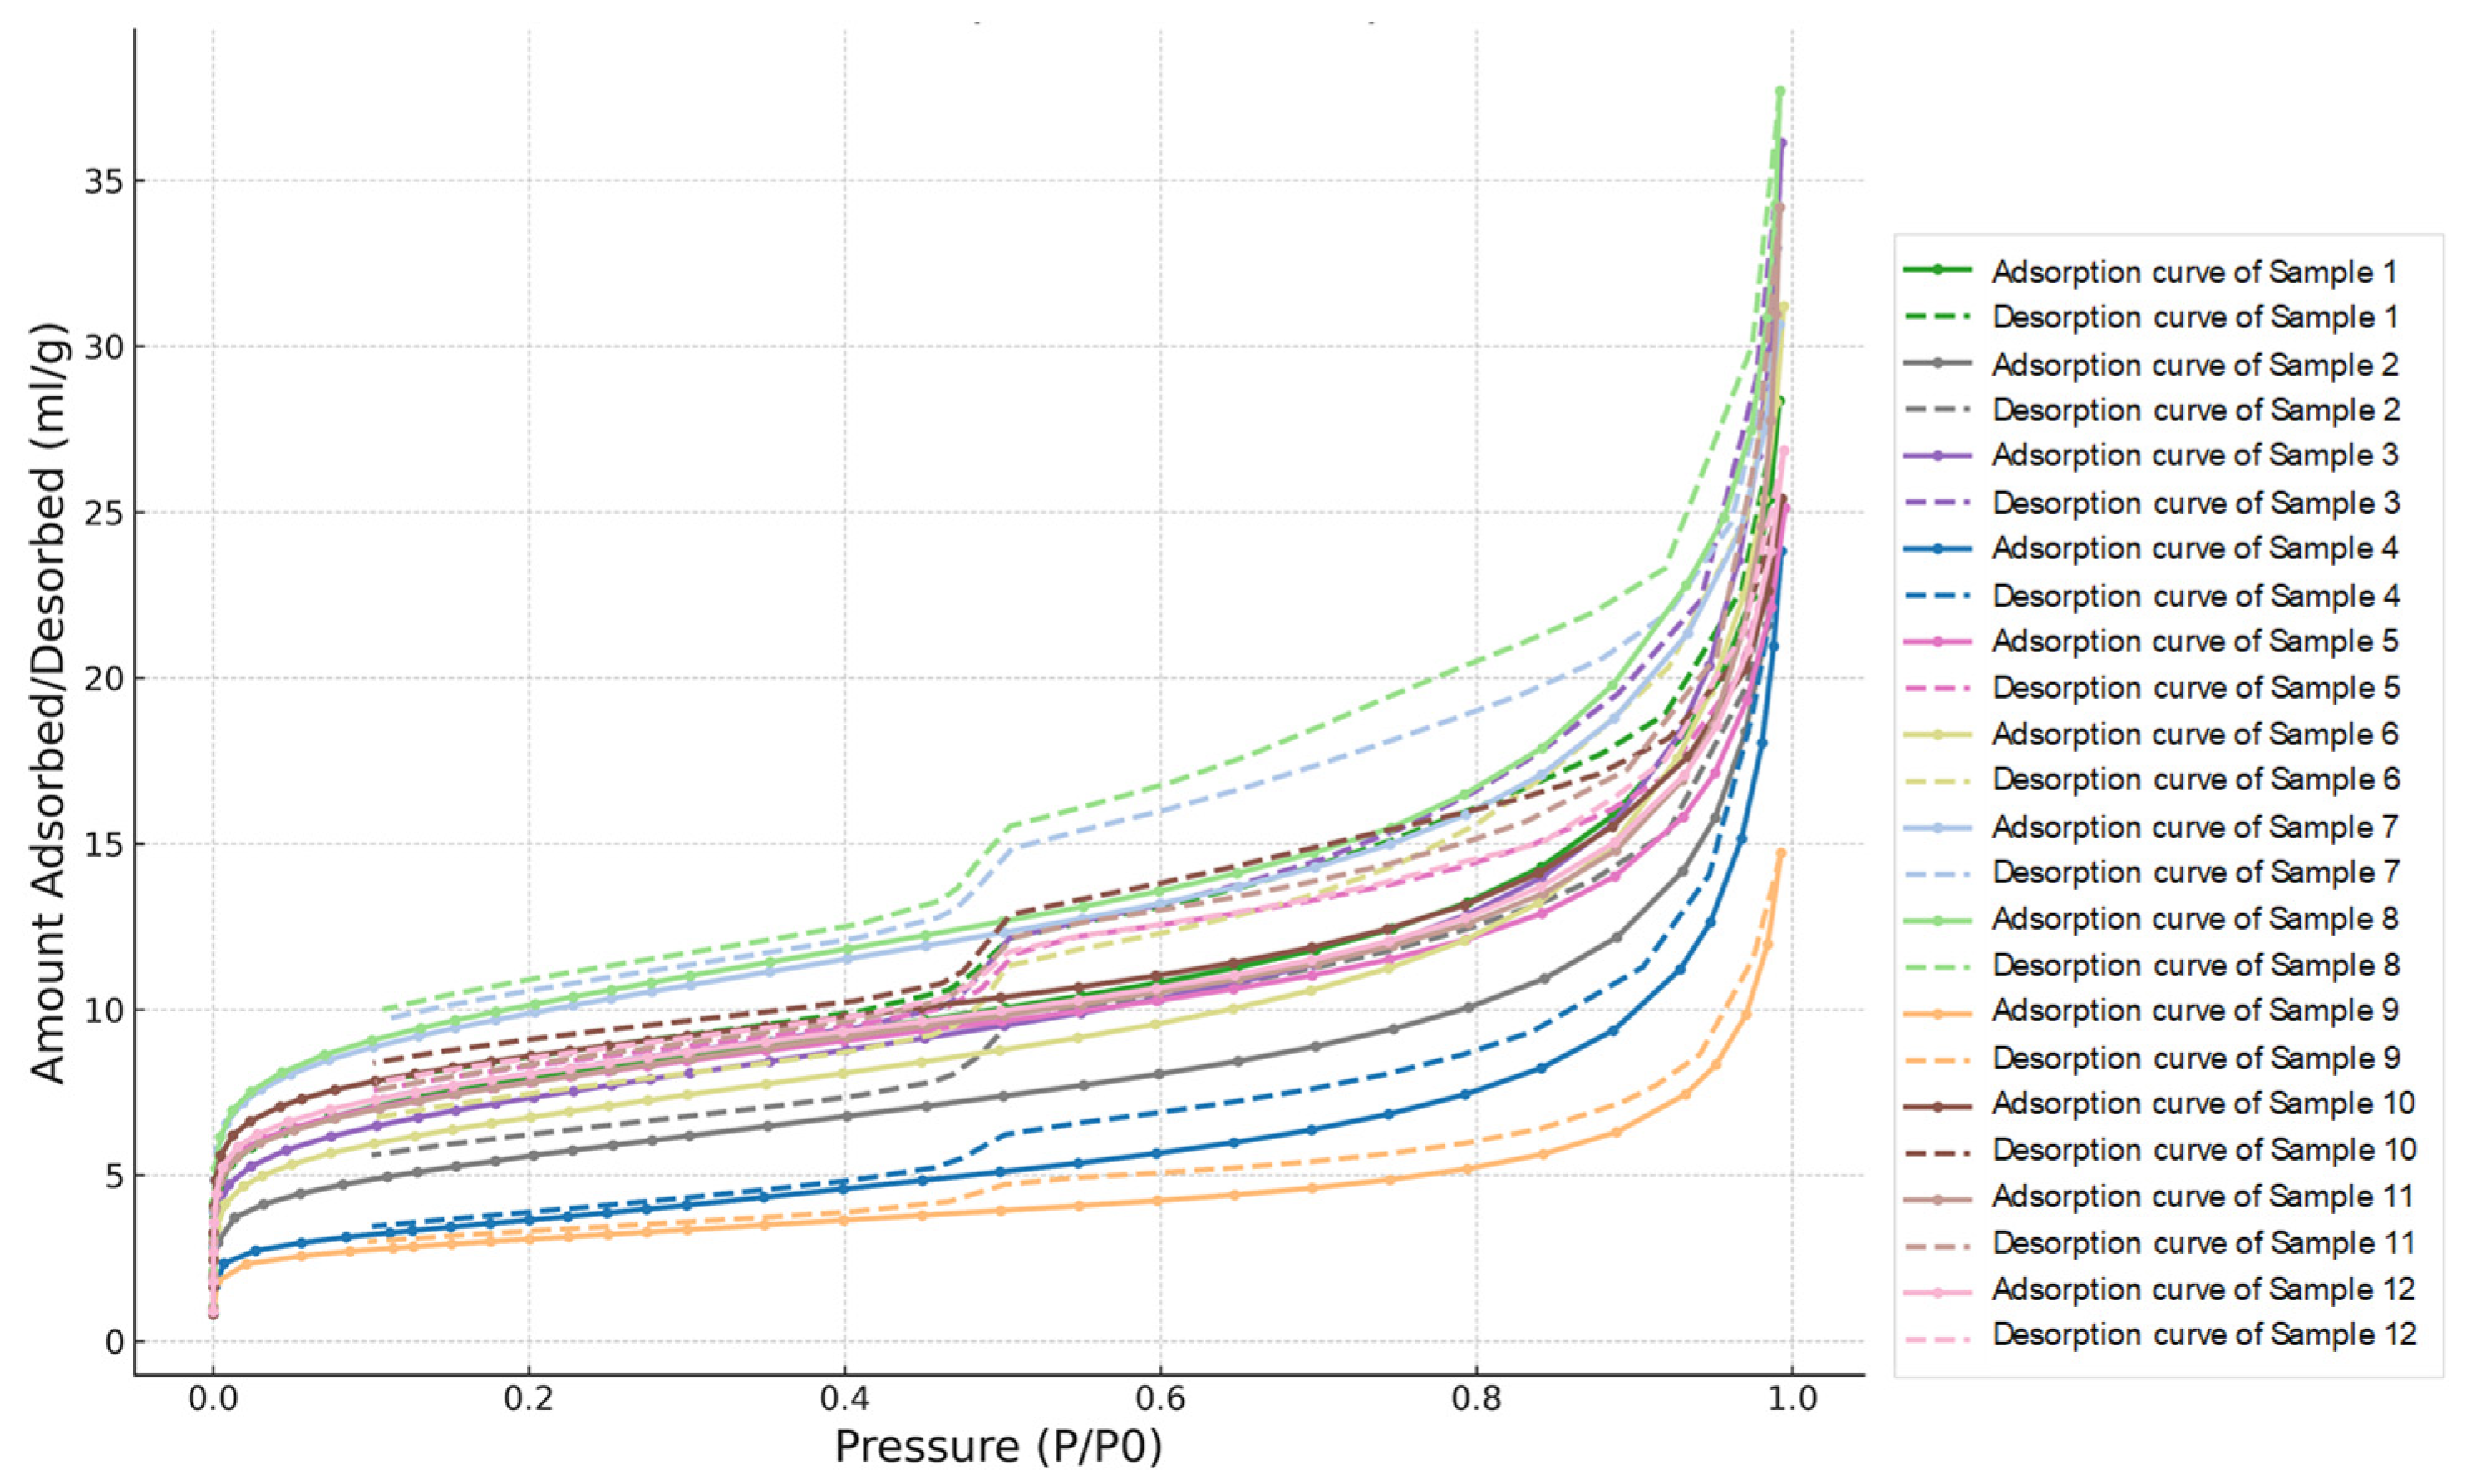
This study plans to first conduct mineral analysis; scanning electron microscopy; specific surface area and pore size analysis; low-temperature nitrogen adsorption; and methane isotherm adsorption experiments on samples collected from the research area. Following the analysis of empirical data to clarify the microstructural pore characteristics and properties of shallow marine shale gas, different adsorption mechanisms and models will be employed to fit the methane adsorption capacity. This will also consider the impact of marine shale pore structure features, total organic carbon (TOC) content, and clay mineral content on shale adsorption capacity. By establishing the correlation of these parameters with experimental parameters such as maximum adsorption capacity through nonlinear regression fitting, this study aims to refine the gas content calculation model, enhance the precision of model computations, and provide support for accurate reserve estimation.
3. Analysis of Factors Affecting Shale Gas Content
This study aims to analyze the factors influencing shale gas content by examining the correlations between various parameters, including the micropore characteristics (specific surface area (SSA) and total pore volumes (TPVs)) geochemistry (TOC), mineralogy (quartz and clay content as determined by XRD analysis), and methane adsorption (VL, PL, and ρads) across different layers of shale within the study area. The objective is to identify the primary controlling factors of methane adsorption properties in shale and, consequently, unveil the determinants of shale gas content.
3.1. The Influence of Micropore Characteristics on Gas Content
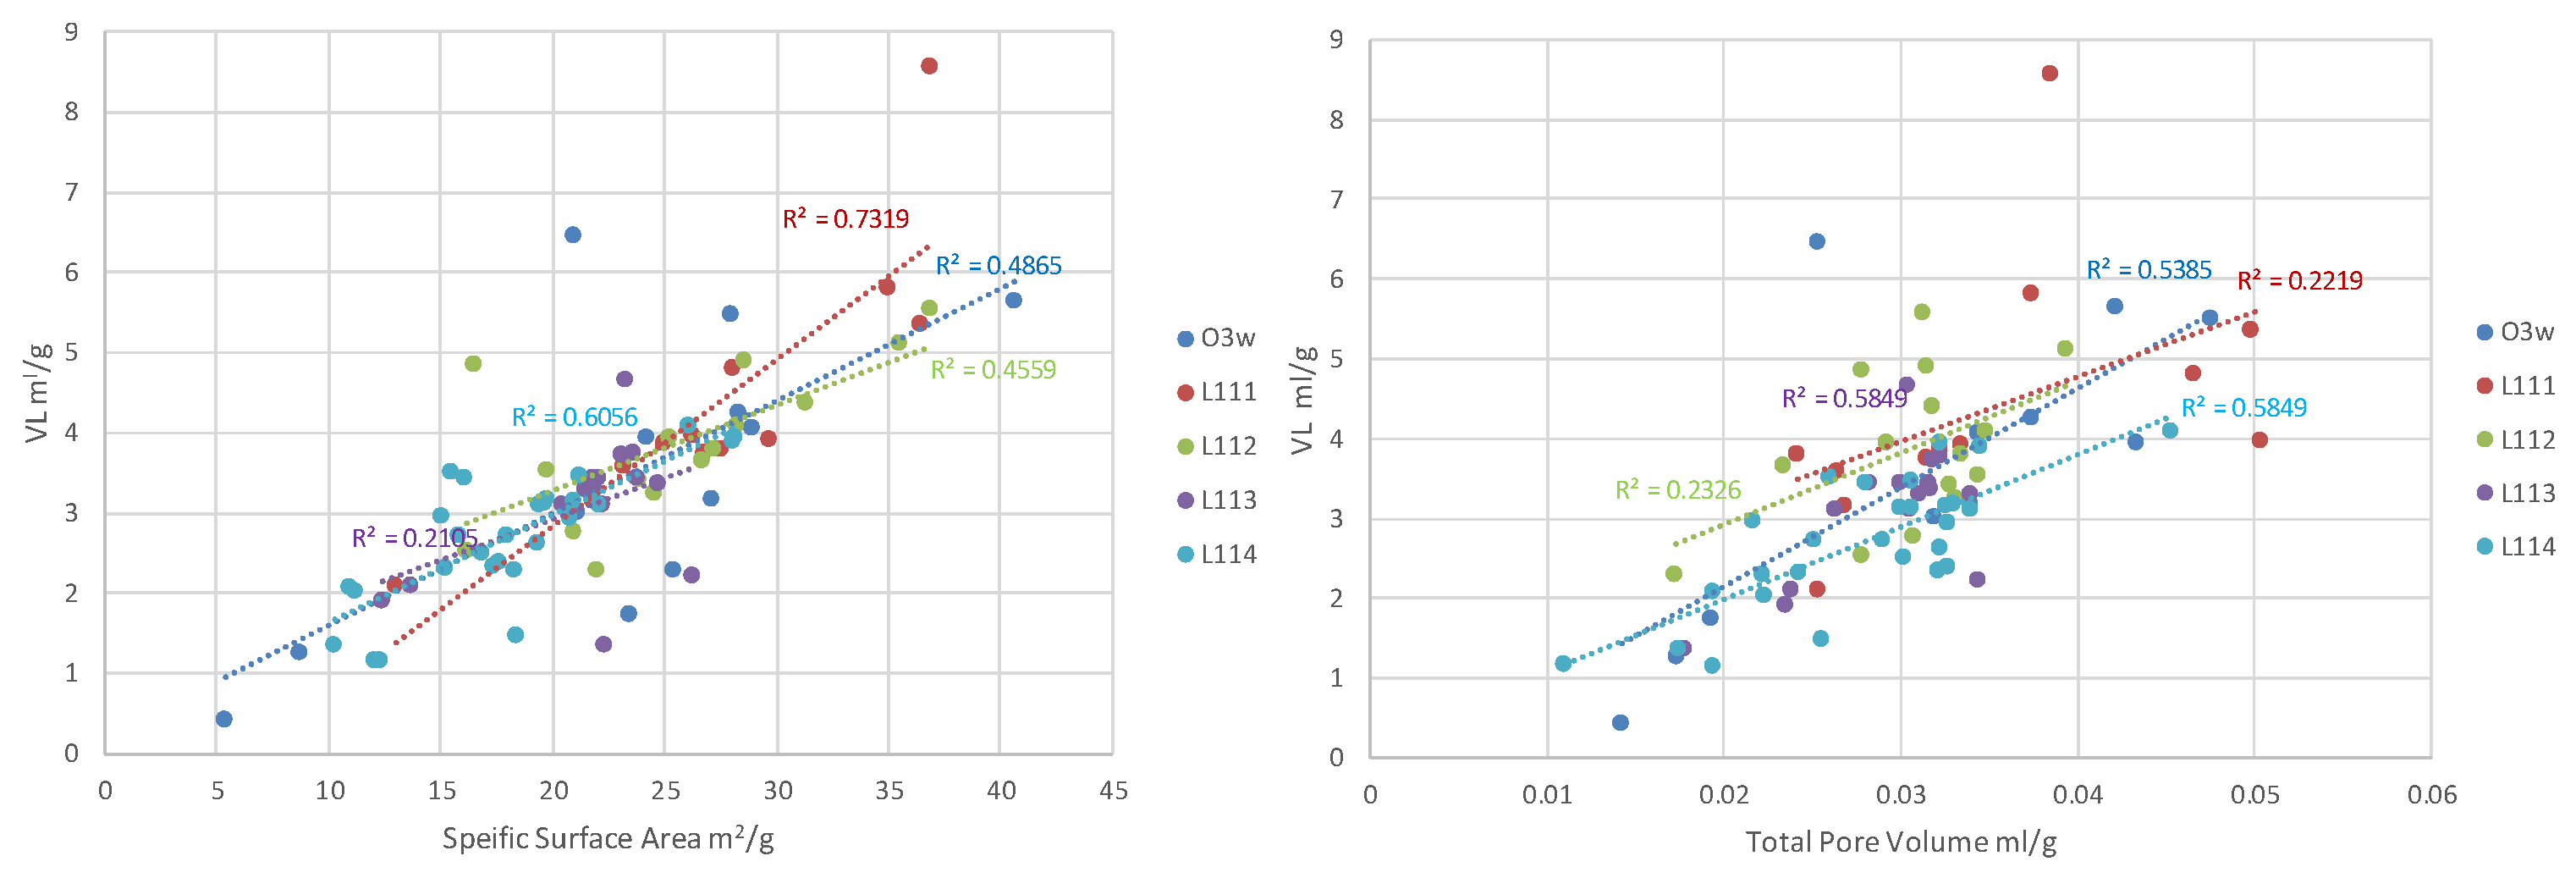
As shown in
Figure 8, an analysis of the correlation between specific surface area and total pore volume with Langmuir volume (
VL) in various layers of the Longmaxi and Wufeng Formations reveals a strong linear relationship. With increasing SSA and TPV values,
VL also demonstrates an increasing trend, suggesting a potential association between greater specific surface area and higher unit mass adsorption. Among these layers, as shown in
Table 1, the layer with the strongest correlation between SSA and
VL is the Q3w layer, with a Pearson R value of 0.856 and an R-squared value of 0.732. For TPV and
VL, the layer with the strongest correlation is the L111 layer, with a Pearson R value of 0.850 and an R-squared value of 0.722.
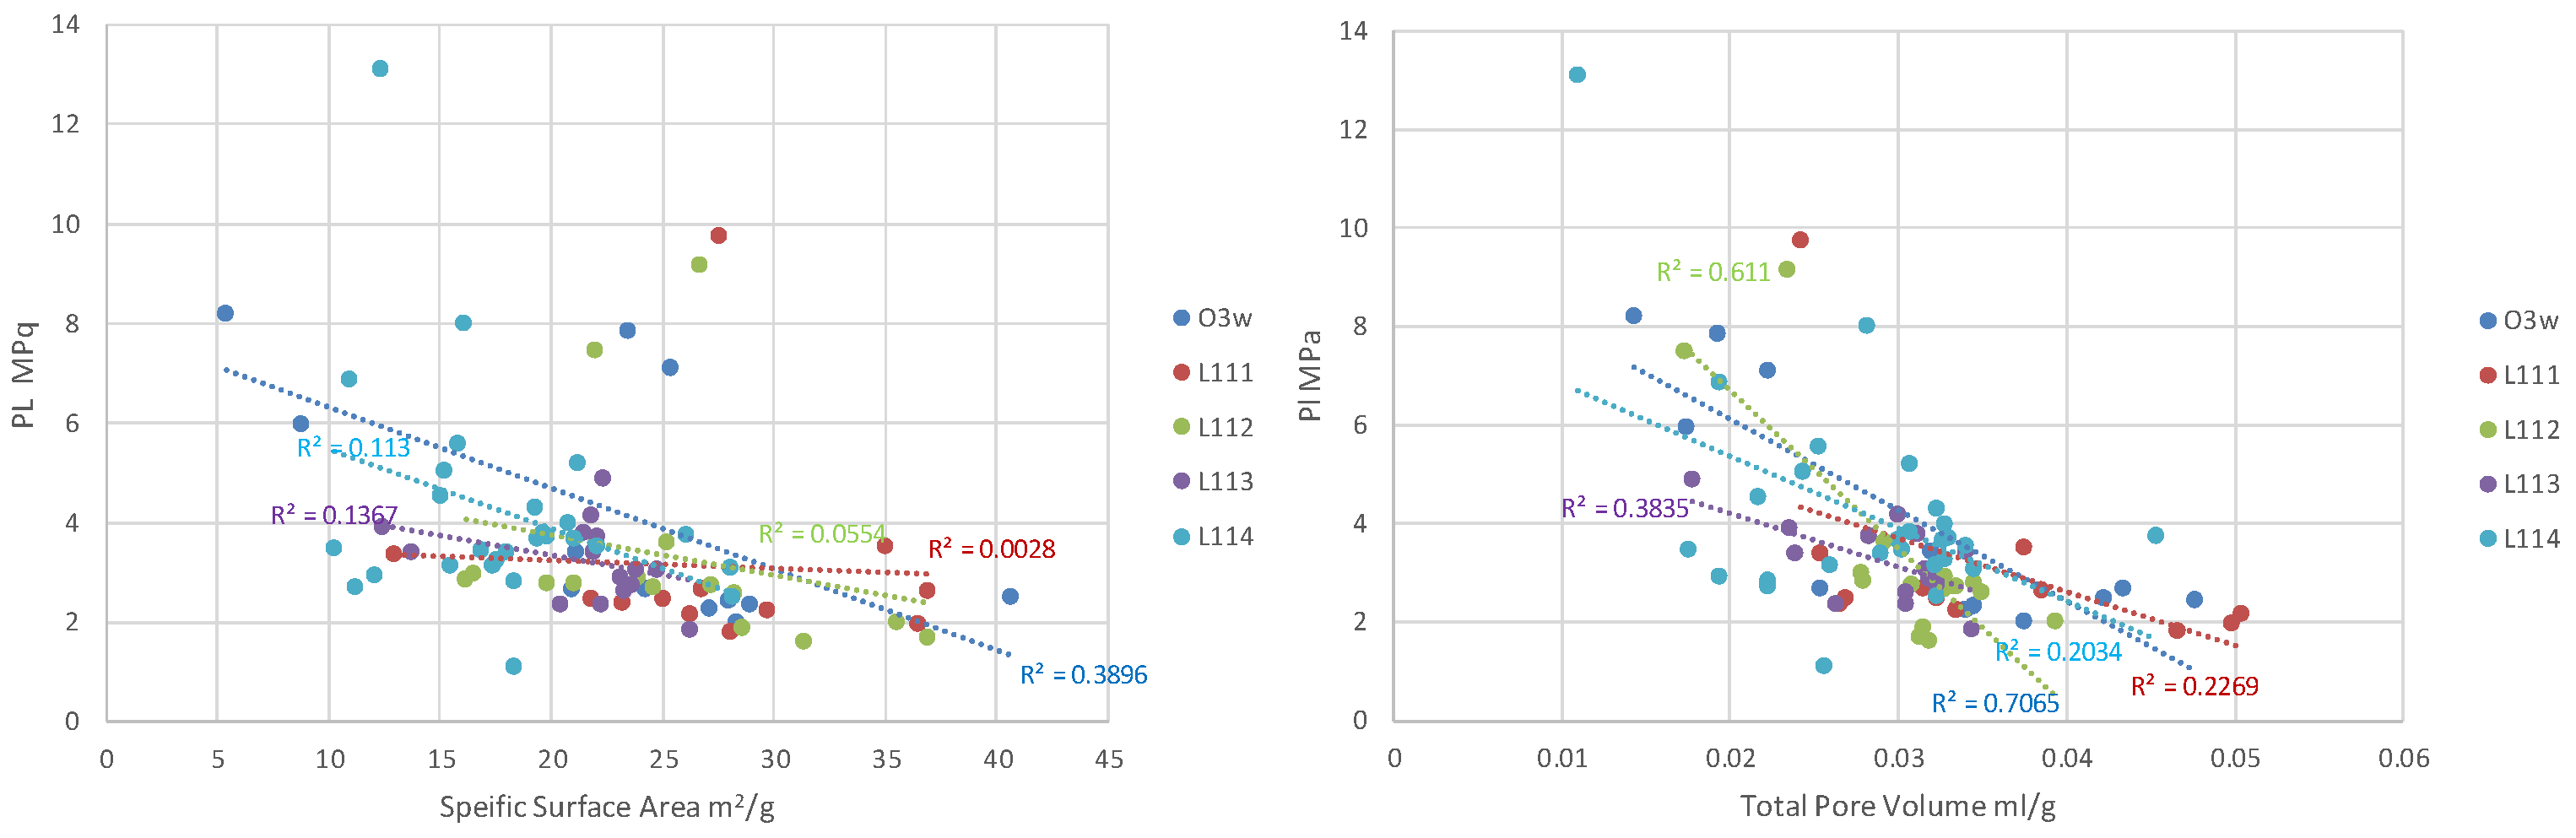
As shown in
Figure 9, an analysis of the correlation between specific surface area, total pore volume, and Langmuir pressure (
PL) in various layers of the Longmaxi and Wufeng Formations reveals interesting findings. It can be observed that the SSA and TPV values exhibit some degree of correlation with
VL in certain layers, but overall, they show a negative correlation. As indicated in
Table 2, the layer with the strongest correlation between TPV and
PL is the L114 layer, with a Pearson R value of 0.841 and an R-squared (R
2) value of −0.707. The layer with the strongest correlation between SSA and
PL is the L111 layer, with a Pearson R value of −0.605 and an R
2 value of 0.366. However, in most layers, the compatibility between SSA and TPV with
VL and
PL is relatively poor.
3.2. The Impact of Mineral Composition on Gas Content
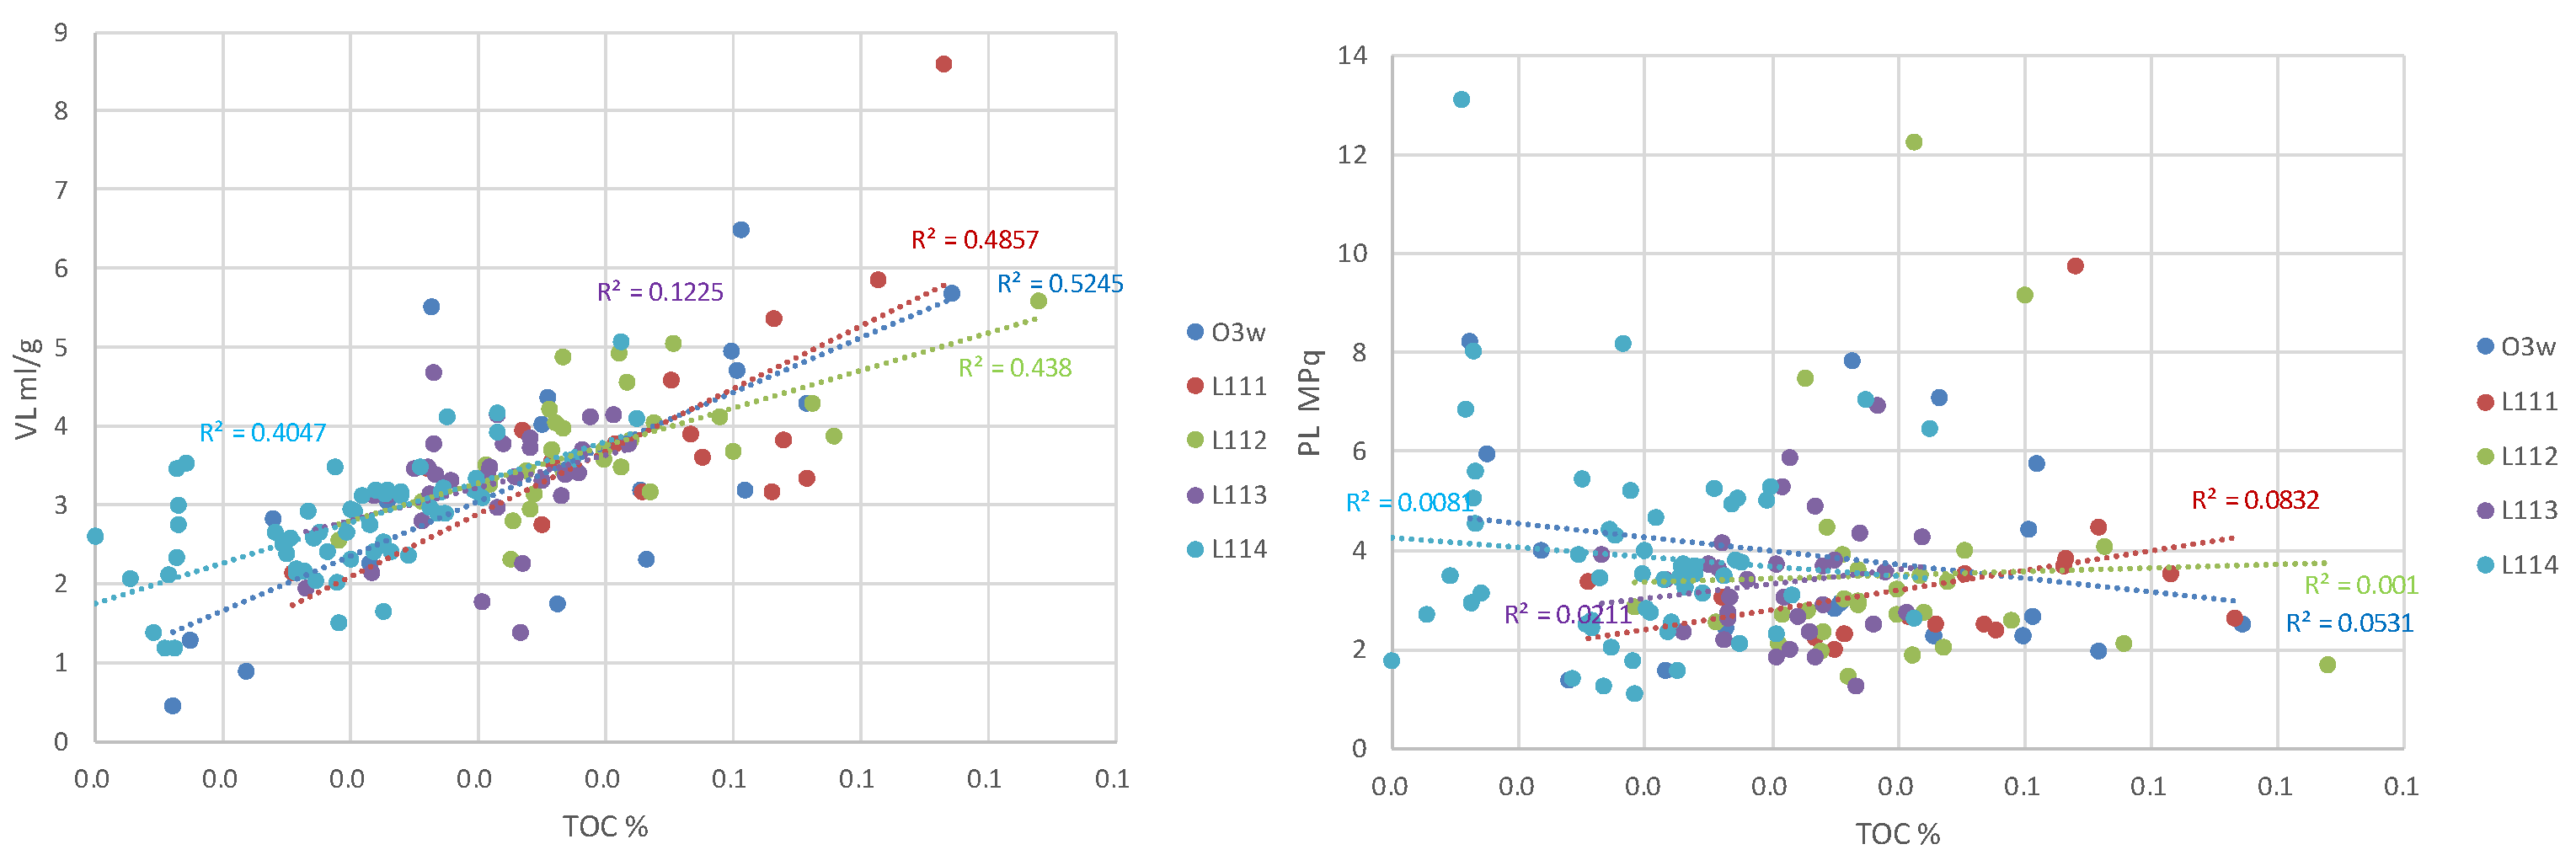
As shown in
Figure 10, an analysis of the correlation between total organic carbon (
TOC) and Langmuir volume (
VL), as well as Langmuir pressure (
PL), in various layers of the Longmaxi and Wufeng Formations reveals significant insights. It can be observed that the
TOC values exhibit a certain degree of linear correlation with
VL in all layers, and as
TOC values increase, there is a corresponding increase in
VL. As indicated in
Table 3, the average R-squared (R
2) value for the correlation between
TOC and
VL across all layers is around 0.4.
However, the correlation between the TOC values and the PL values in all layers is notably weak, with most layers having an R2 value of less than 0.03.
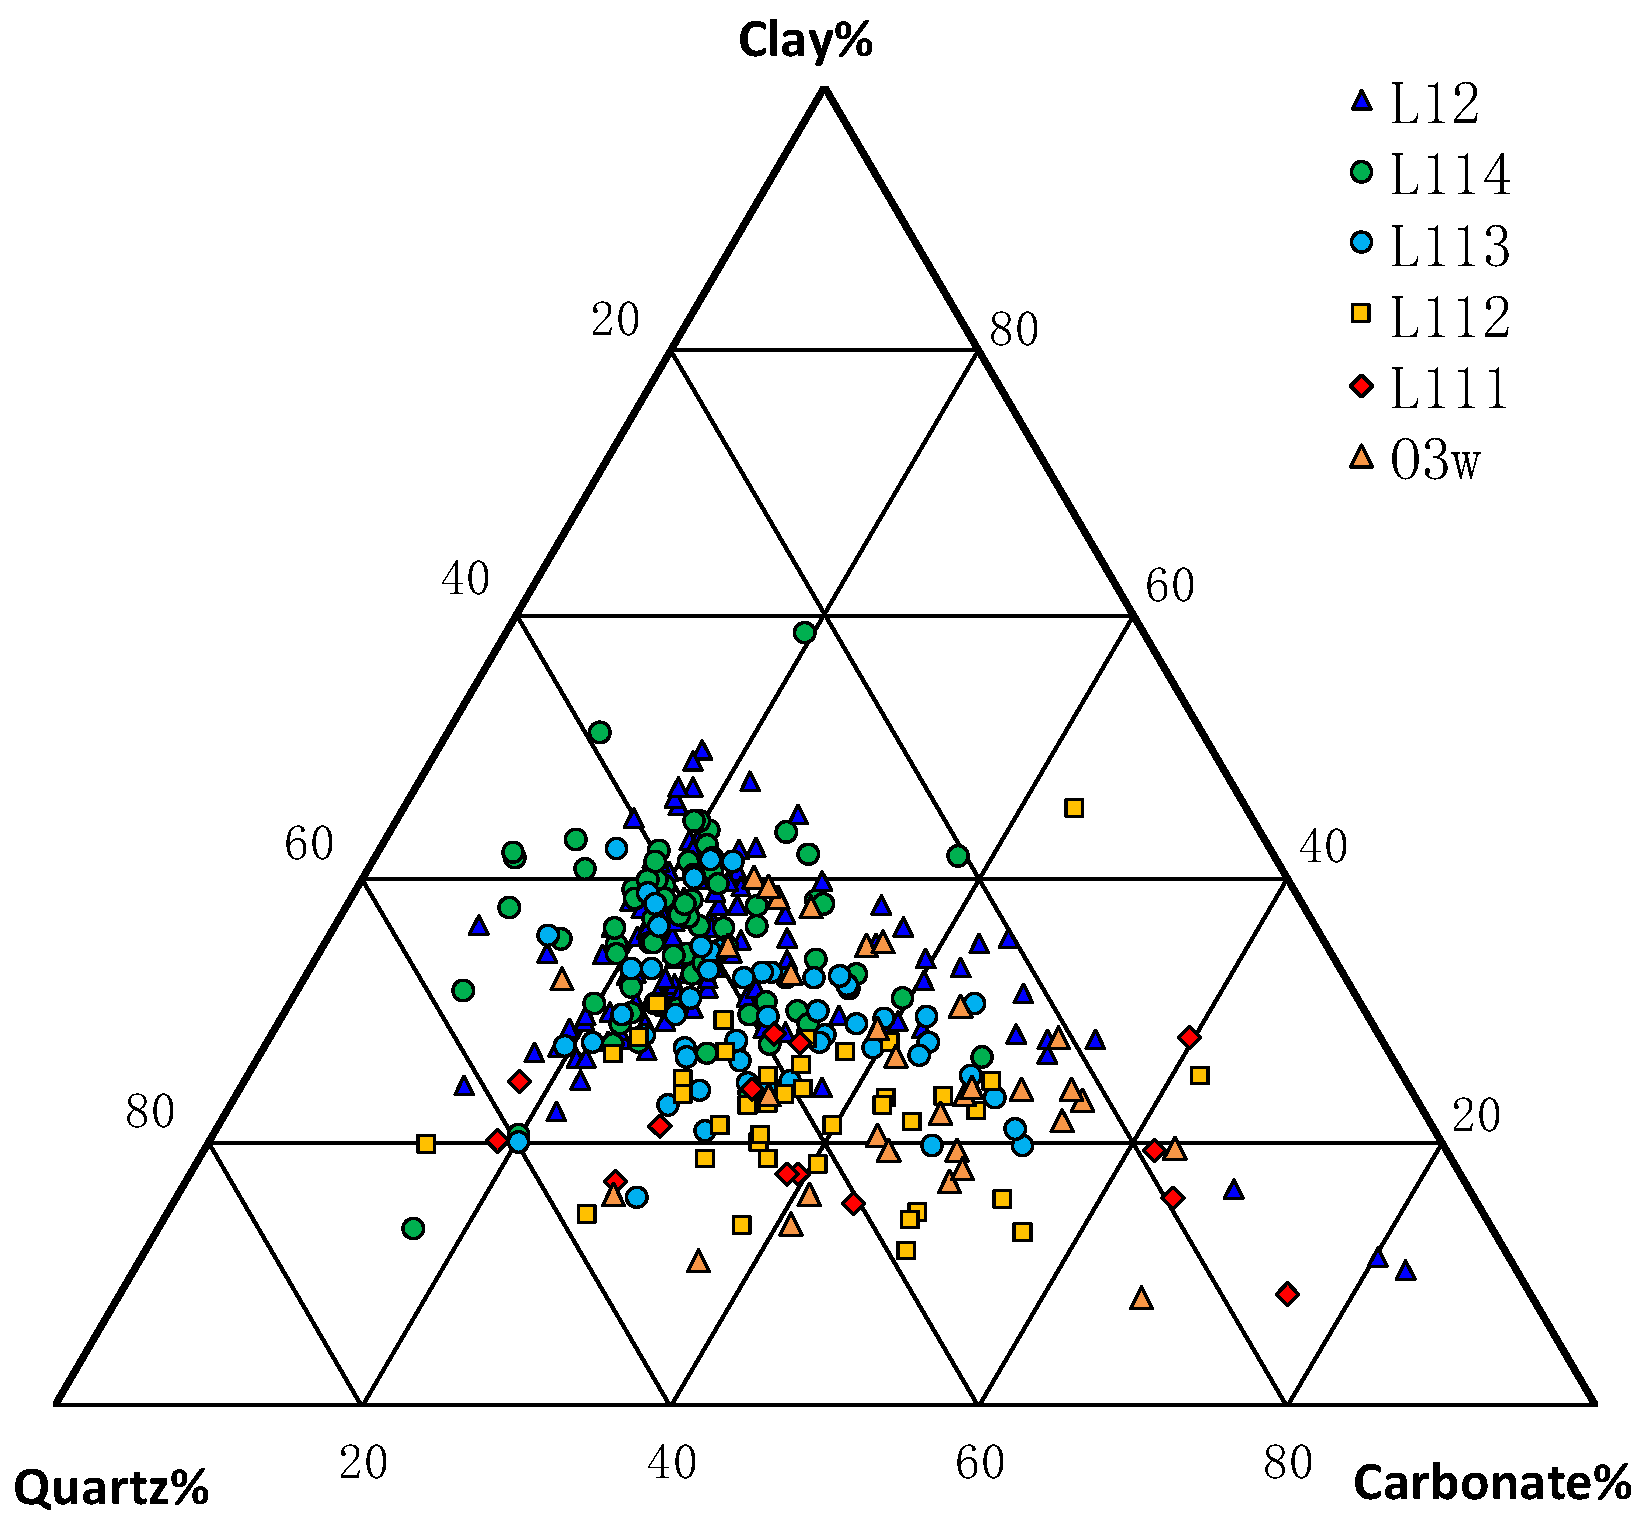
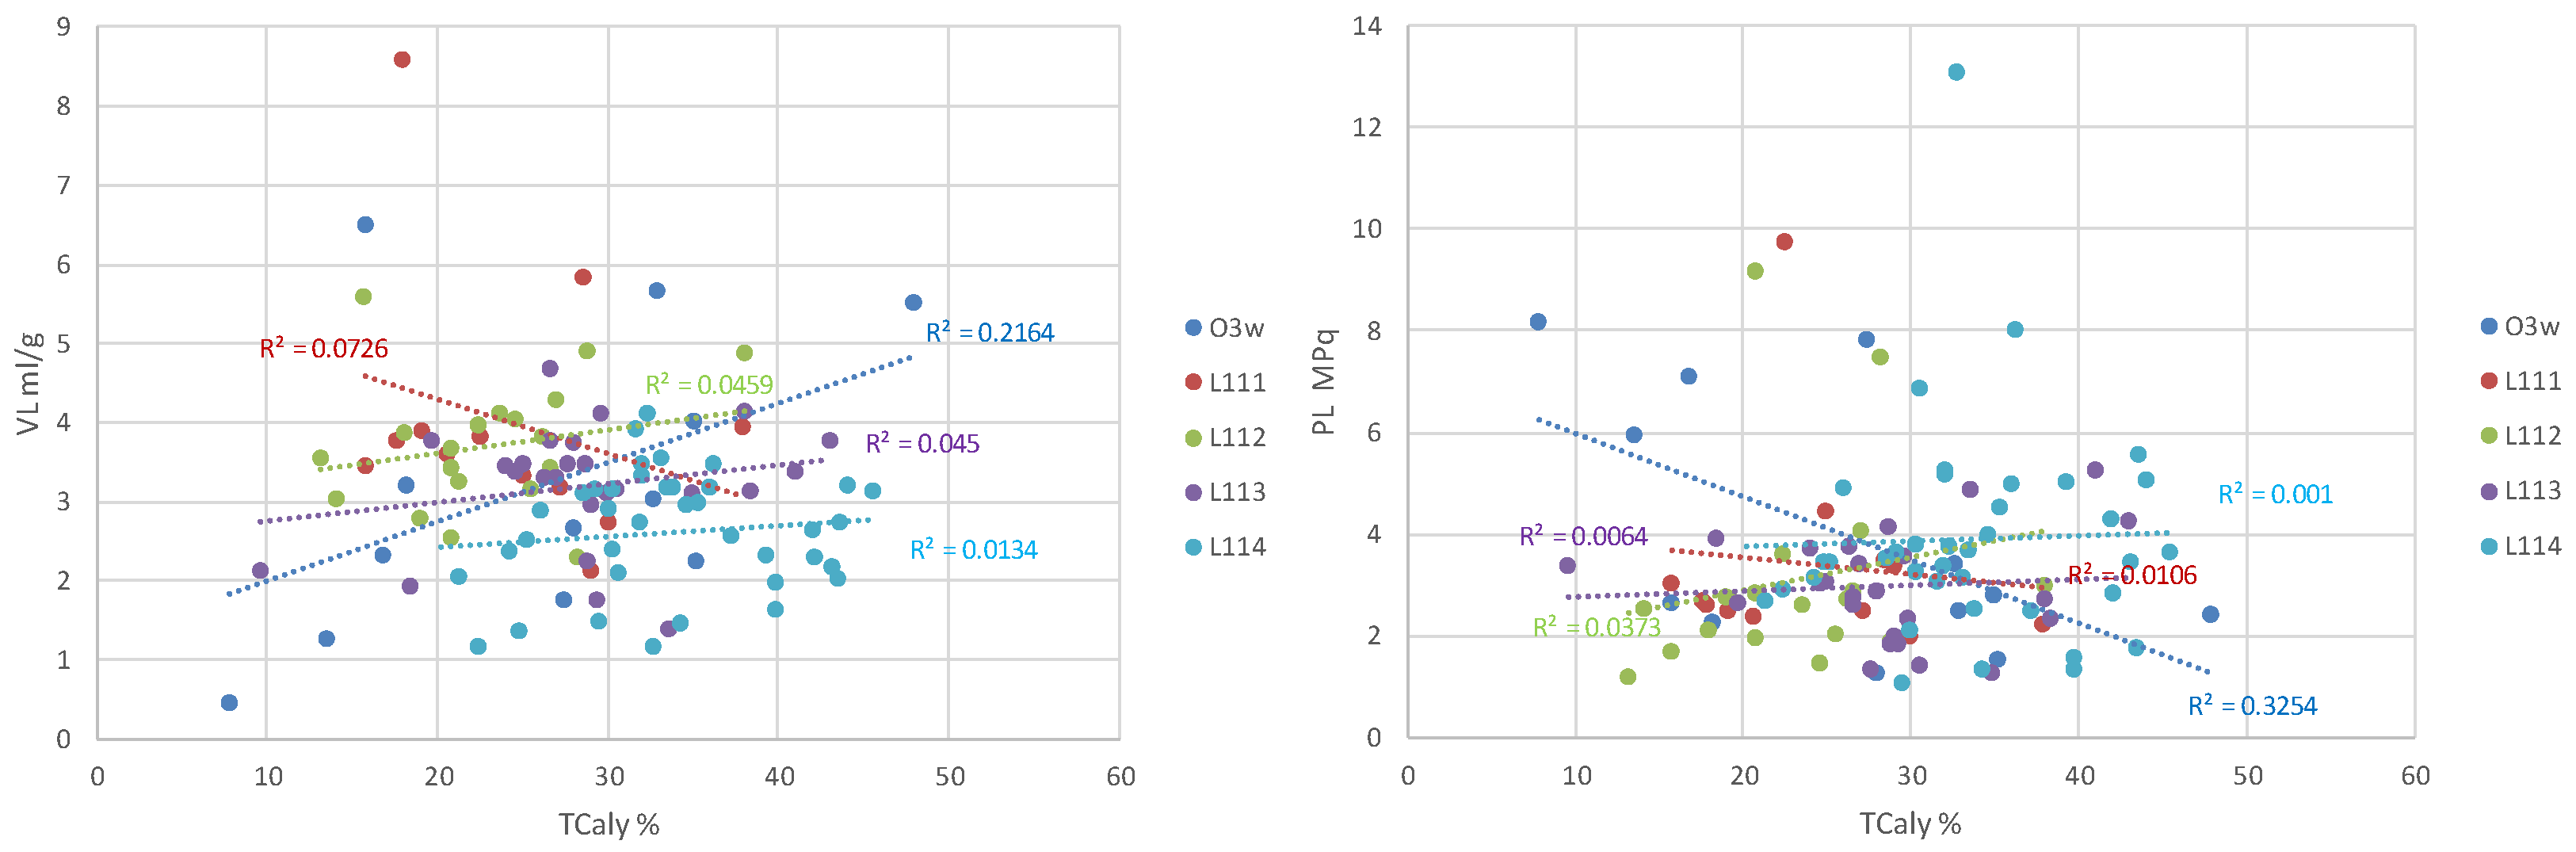
As shown in
Figure 11 and
Figure 12 and
Table 4 and
Table 5, the analysis of the correlation between quartz mineral content, clay mineral content, and Langmuir volume (
VL), as well as Langmuir pressure (
PL), in various layers of the Longmaxi and Wufeng Formations revealed that there is no significant correlation between mineral content and
VL or
PL in most layers.
3.3. The Gas Content Prediction Model
Previous studies have attempted to augment the parameters V
L and P
L with related parameters such as kerogen and clay content, comparing them to the sha and le isotherms [
37,
38,
39]. Previous studies have attempted to augment the parameters
VL,
PL, and
ρads with related parameters such as kerogen and clay content, comparing them to the shale isotherms [
40]. Additionally, there are doubts about whether clay minerals, kerogen, and other substances extracted from specific samples truly represent the inorganic or organic components of shale.
In this study, we conducted a data analysis of shale micropore characteristics (SSA and
TPV), geochemistry (
TOC), mineralogy (XRD analysis of quartz and clay content), and methane adsorption (
VL;
PL) data from 218 samples collected from 31 wells in the study area. This analysis aimed to elucidate the complex relationship between shale gas content and various attribute parameters. Through the correlation analysis of these parameters at different layers, we found that the three parameters
VL,
PL, and
ρads of the Langmuir equation (Equation (2)) exhibited the highest correlation with TOC content, SSA, and TPV values. Consequently, we proposed a component-based model that involves weighting the equivalent unit content of organic matter (
TOC) and pore size distribution (SSA and
TPV) to estimate excess adsorption isotherm content (Equation (3)).
In this model, VLorg, PLorg, and ρadsorg are the three characteristic parameters of the adsorption isotherm for unit organic matter methane (1% TOC), while VLPTV, PLPTV, and ρadsTPV are the corresponding parameters for unit pore volume (mL/g), and VLSSA, PLSSA, and ρadsSSA are the corresponding parameters for unit specific surface area (m2/g).
During the measurement of adsorption isotherms, each sample typically includes 10 to 14 data points (pressure, p, and excess adsorption, Vex). In this study, there are a total of 53 shale samples with complete data, resulting in a total of 720 data points. These nine unknown parameters can be determined through the nonlinear fitting of the 720 p-Vex data points. The initial values for each parameter are set within the experimentally obtained minimum and maximum ranges.
Table 6 presents the optimal fitting results, with R
2 ranging up to 0.98. Using Equation (2) and the best-fit parameters, predictions were made for the 720 data points. The predicted values exhibit a strong linear correlation with the experimental results, with an R
2 of 0.968. The average error and standard deviation of the error are 0.0017 and 0.0048 mL/g, respectively (as shown in
Figure 13a). The error is distributed within a range of −0.12 mL/g to 0.15 mL/g for 95% of the data (as seen in
Figure 13b). Therefore, this model based on shale composition and pore structure characteristics is fully suitable for engineering applications and meets production requirements.


